1. Introduction
As the aviation and aerospace photoelectric payloads’ imaging distance extends and the resolution increases, challenges arise. Under constraints involving volume, weight, and other factors, the aperture and focal length of the payload’s optical system cannot be increased infinitely. In electronics, high-resolution images correspond to a higher pixel count. The detector must arrange a denser pixel distribution per unit area, imposing very stringent demands on the design and manufacture of the detector, and the transmission capability of the data link [
1]. Research focusing on obtaining higher-resolution images at the current level of optoelectronic technology has intensified [
2,
3,
4,
5,
6].
In the field of aerospace and aviation, super-resolution imaging typically involves the photoelectric load acquiring low-resolution image information of a single frame or a sequence of multiple frames for a scene. Algorithms are then employed to reconstruct high-resolution images. For image detail accuracy, multi-frame super-resolution algorithms have found widespread use [
7,
8,
9].
Multi-frame super-resolution imaging encompasses two vital steps. The first involves the procurement of low-resolution images containing high-frequency aliasing information. Primary technical paths include micro-scanning and sub-pixel stitching. The former employs a micro-motion mechanism, moving the optical-system-formed image on the detector at a 1/N pixel pitch, to capture several low-resolution images containing high-frequency aliasing information.
A rapid micro-scanning imaging device was developed by Fortin and Chevrette [
10]. Comprising three main sections—the micro-scanning head, the controller, and the power amplifier—the system enables four operation modes. These modes are fixed position, 2 × 2, 3 × 3, and 4 × 4 micro-scan. In the case of a given staring array imager, the resolution is doubled.
Utilization of a piezoelectric nanopositioner for micro-displacements was demonstrated by Wiltse and Miller [
11]. This approach provides substantial enhancements in minimum resolvable temperature/minimum resolvable contrast curves, allowing resolution beyond the sensor’s native Nyquist frequency. Increases in target range discrimination of approximately 18% are attributed to four-point micro-scanning.
An infrared micro-scanning lens was designed by Zhang et al. [
12] for constructing an infrared micro-scanning optical system. The entire field of view (FOV)’s displacement uniformity and ideal image quality on the image plane are ensured by this system. Optimal results were achieved with 2 × 2 magnification.
However, the micro-scanning method, requiring a micro-motion mechanism for aliased image acquisition, poses high demands on volume, power consumption, processing, and displacement accuracy. Therefore, its application range may be subject to some limitations.
Sub-pixel stitching technology, another approach, employs sub-pixel-level detector stitching to enhance the imaging system’s resolution. Initially applied on the French SPOT-5 satellite [
13], this technique enabled an imaging resolution of up to 2.5 m. The method entails placing two linear array detectors in dislocation (0.5-pixel displacement) on the optical system’s image plane. With the optical system’s resolution designed as 5 m, an increase to 2.5 m is achieved. The Swiss Leica Company and the German Aerospace Center’s joint development of the ADS40 aerial surveying and mapping camera also utilized detector splicing to achieve super-resolution in the imaging system [
14].
Tang et al. [
15] introduced a mosaic technique that is grounded in the geometric structure of TDI CCD sensors and the object space projection plane. The sensors are projected into the object space indirectly, along and across the target trajectory’s direction. This method has been applied in the daily processing systems of ZY-1 02C and ZY-3 satellites, yielding positive results. However, the application of sub-pixel stitching is primarily limited to line detector systems.
The second step in the process involves a high-resolution image reconstruction algorithm that uses a multi-frame image sequence. Typically, multi-frame reconstruction algorithms are categorized into the frequency domain method [
16,
17], non-uniform interpolation method [
18,
19], iterative back-projection method [
20], convex set projection method [
21,
22], and probability analysis method [
23,
24]. Although these methods can achieve enhanced super-resolution results, high-performance algorithms often require significant computing resources. Consequently, they are unsuitable for aerospace and aviation platforms with high real-time demands and limited computing capabilities.
In this research, a 2D scanning galvanometer is planned to be utilized for aliasing information acquisition, along with a non-radial kernel function to merge multi-frame images and achieve super-resolution images. Initially, the mathematical relationship among the swing angle of the two-dimensional mirror, the image point’s displacement on the image plane, and the exposure time is defined. Then, constraints are given for the super-resolution imaging of the photoelectric system with two-dimensional swinging. A super-resolution algorithm processing flow, based on prior displacement information, is then established. Following this, low-resolution image information is registered, fused, and reconstructed, and the multi-frame sequence depth’s influence on the imaging effect is examined. Finally, the algorithm is tested in the laboratory, daytime, nighttime, and real-application scenarios. Experimental evidence indicates that the algorithm enhances image resolution and performs well in the aerial camera when applied.
2. Acquisition of Micro-Displacement
The degradation in aerial camera imaging quality is mainly attributed to image motion. To address this issue, commonly used methods encompass optical, mechanical, electronic, and image compensation techniques. Yet, most optical systems presently employ a 2D scanning galvanometer for image motion compensation.
In this study, the 2D scanning galvanometer is leveraged to carry out image motion compensation, imposing sub-pixel micro-displacement on the sensor to capture multiple frames of low-resolution image sequences with aliasing information. First, an imaging model of the optical system incorporating a 2D scanning galvanometer is created, and the mathematical relationships among the 2D scanning galvanometer oscillating vector, target moving vector, and micro-displacement vector are defined. Subsequently, the 2D scanning galvanometer’s usage in the system is detailed, and its trajectory model is established.
2.1. The Imaging System Model
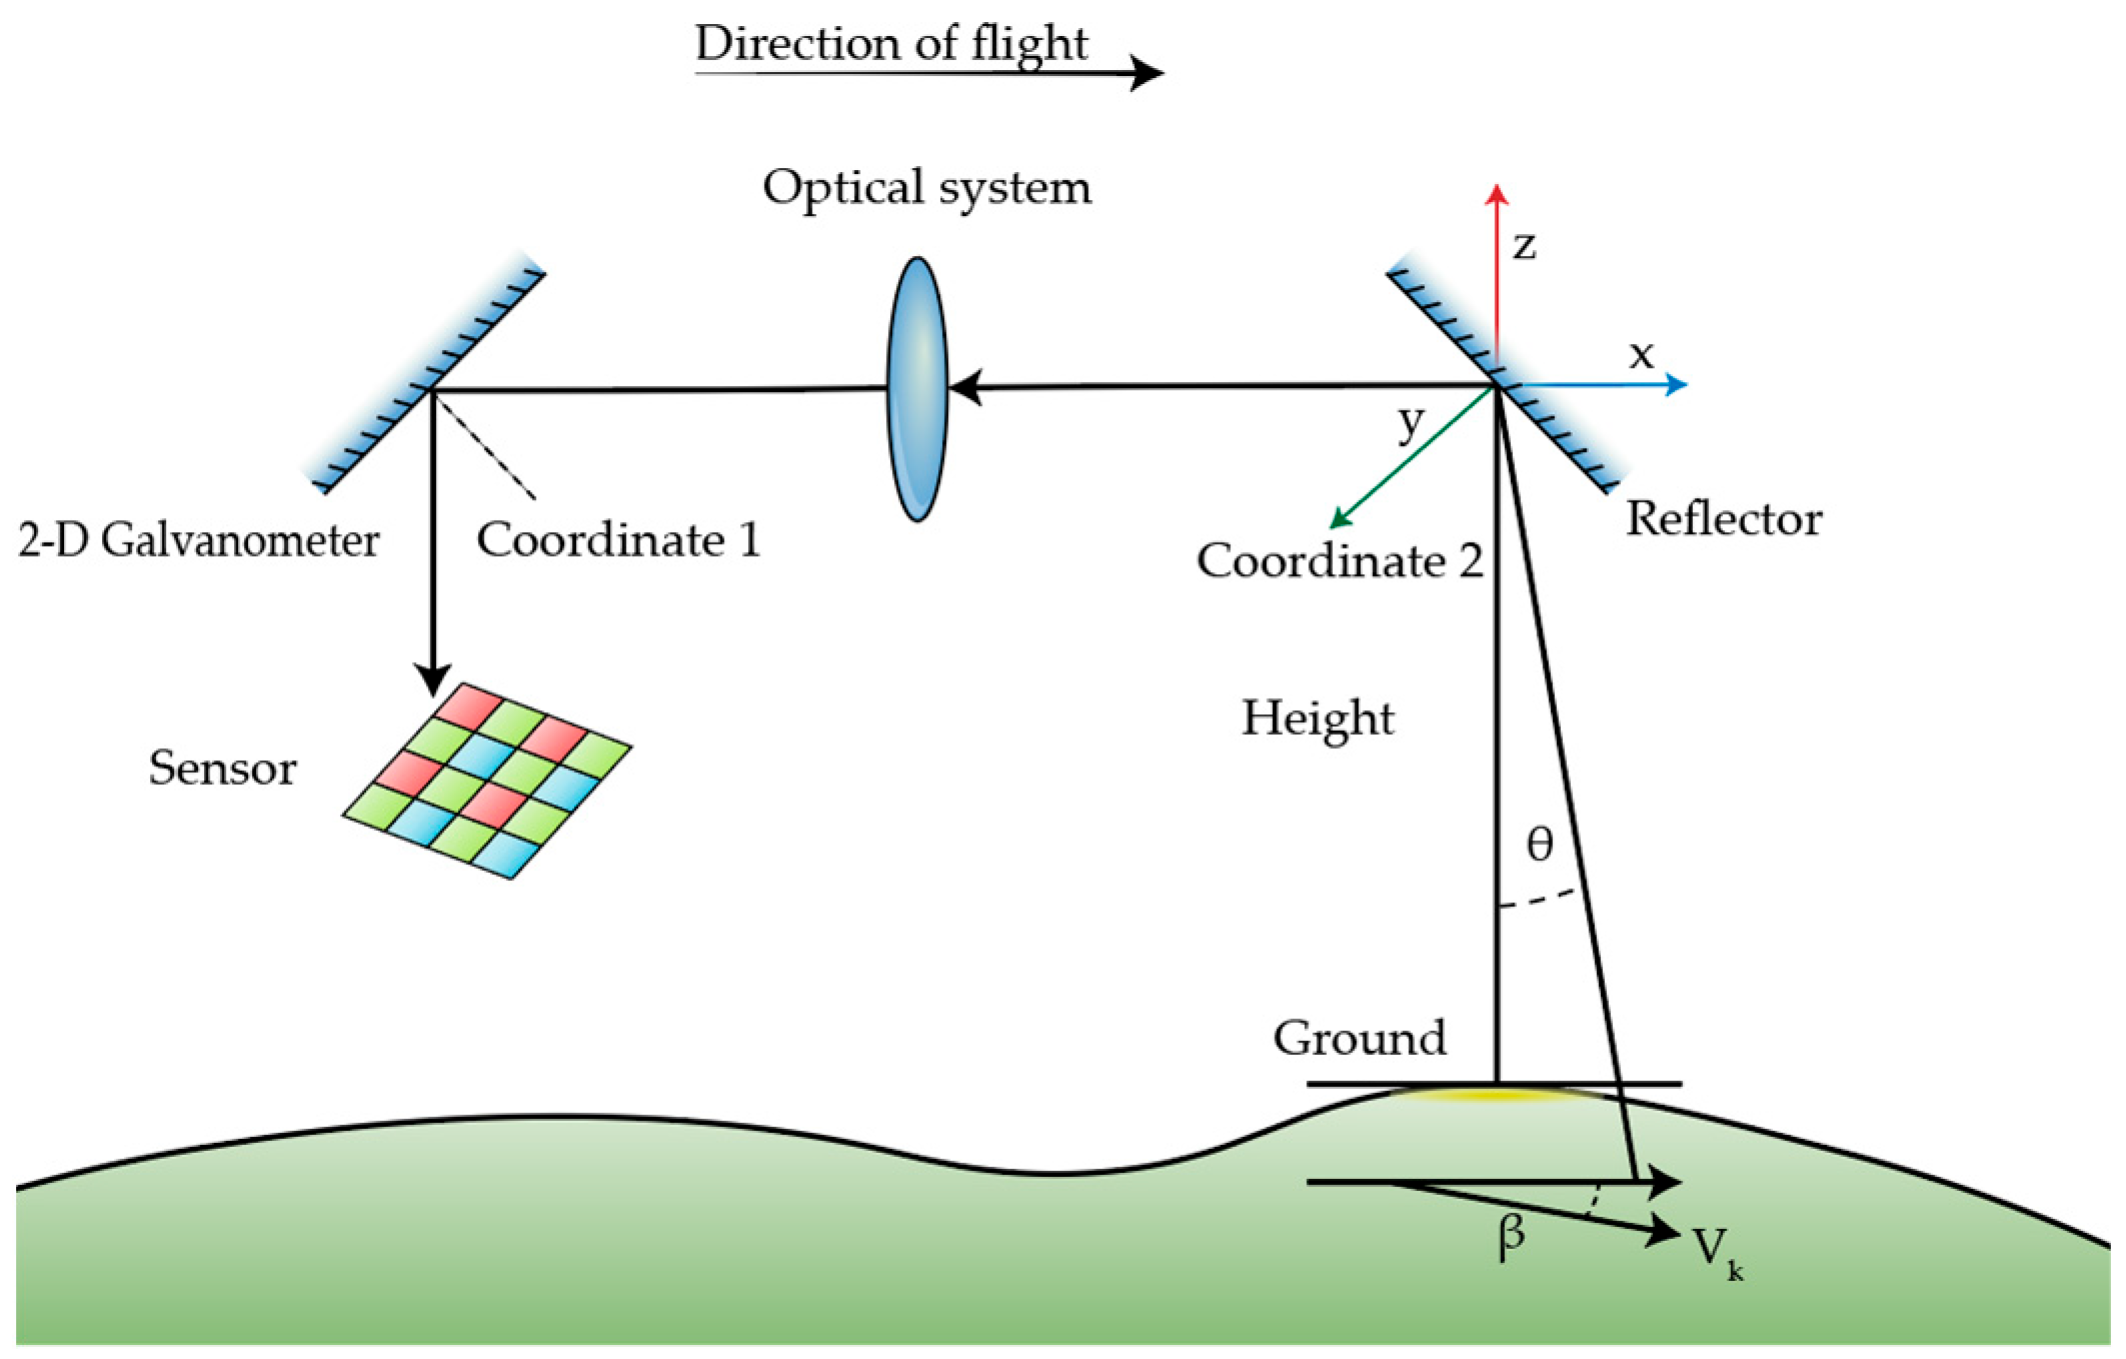
The active changes in the aerial camera’s optical axis are primarily associated with two factors: alterations in aircraft attitude and the active swinging of the camera movement mechanism. The aircraft’s ground-target relative moving speed is translated into the image-plane coordinate system with the aircraft track coordinate system, body coordinate system, fixed mirror, optical system, and two-dimensional pendulum mirror. Based on the light transmission relationship, a mathematical model is established between the target moving speed and the moving speed of the point on the image plane. The fundamental optical structure of an aerial camera is illustrated in
Figure 1.
The transformation in the homogeneous coordinate change involves multiple coordinate systems, namely, the ground coordinate system, the fixed-mirror coordinate system, the 2D scanning galvanometer coordinate system, and the image-plane coordinate system. The track angle of attack, sideslip angle, and roll angle are represented by α, β, and γ, respectively. Likewise, the camera’s sweep angle, depression angle, and push-broom angle are designated by φ, , and η, respectively. The transformation of the speed of the image point in the image-plane coordinate system is accomplished through a sequence from the track coordinate system, via the aircraft coordinate system, to the image-plane coordinate system.
In
Figure 1, the camera’s sweep angle is assumed to be
θ, with the focal length being represented by
f; the flight height, by
H; and the track speed, by
ν. The coordinate system’s center point is defined as the intersection point between the central axis of the lens and the fixed mirror. Under the track coordinate system, the sideslip angle’s impact on the image motion vector on the image plane is formulated as
where
T1 and
T2 are the vector forms of the reflection law and their expressions is
where
C1 and
C2 are identified as the normal vectors of the 2D scanning galvanometer and the mirror, respectively; their expressions are as follows:
In Equations (2) and (3), the 4 × 4 identity matrix is represented by
I, and the refraction transformation matrix of the lens in Equation (1) is denoted by
K, as follows:
Similarly, the influence of the flight path angle of attack (
α) on the image motion vector is as follows:
Following the sequence of sideslip angle, attack angle, and roll angle, the image motion vector (
) caused by the target on the detector target surface can be derived as follows:
An assumption is made that the camera rotates at constant speed around the x-axis, with the rotation speed being
ω. The swing speed on the image plane is then formulated as follows:
The vector can be written as
This leads to the synthesis of the vector and the image motion velocity vector of the entire system as follows:
On this foundation, the aliasing required for super-resolution is attainable by adding the micro-displacement vector, and the final vector needed for super-resolution is
where
represents the superimposed micro-displacement vector in single-step compensation. Its value might be one-half pixel, one-third pixel, or other step sizes to gather aliasing information. This can be chosen based on the required sequence depth and moving path parameters.
2.2. Two-Dimensional Scanning Galvanometer Movement Mode
In the staring imaging mode, the two-dimensional oscillating mirror is operated multiple times within a restricted range to obtain aliasing information. Using the image sequence depth of 4 as an example,
Figure 2 illustrates the change in the optical-axis pointing angle brought by the 2D scanning galvanometer during the imaging process.
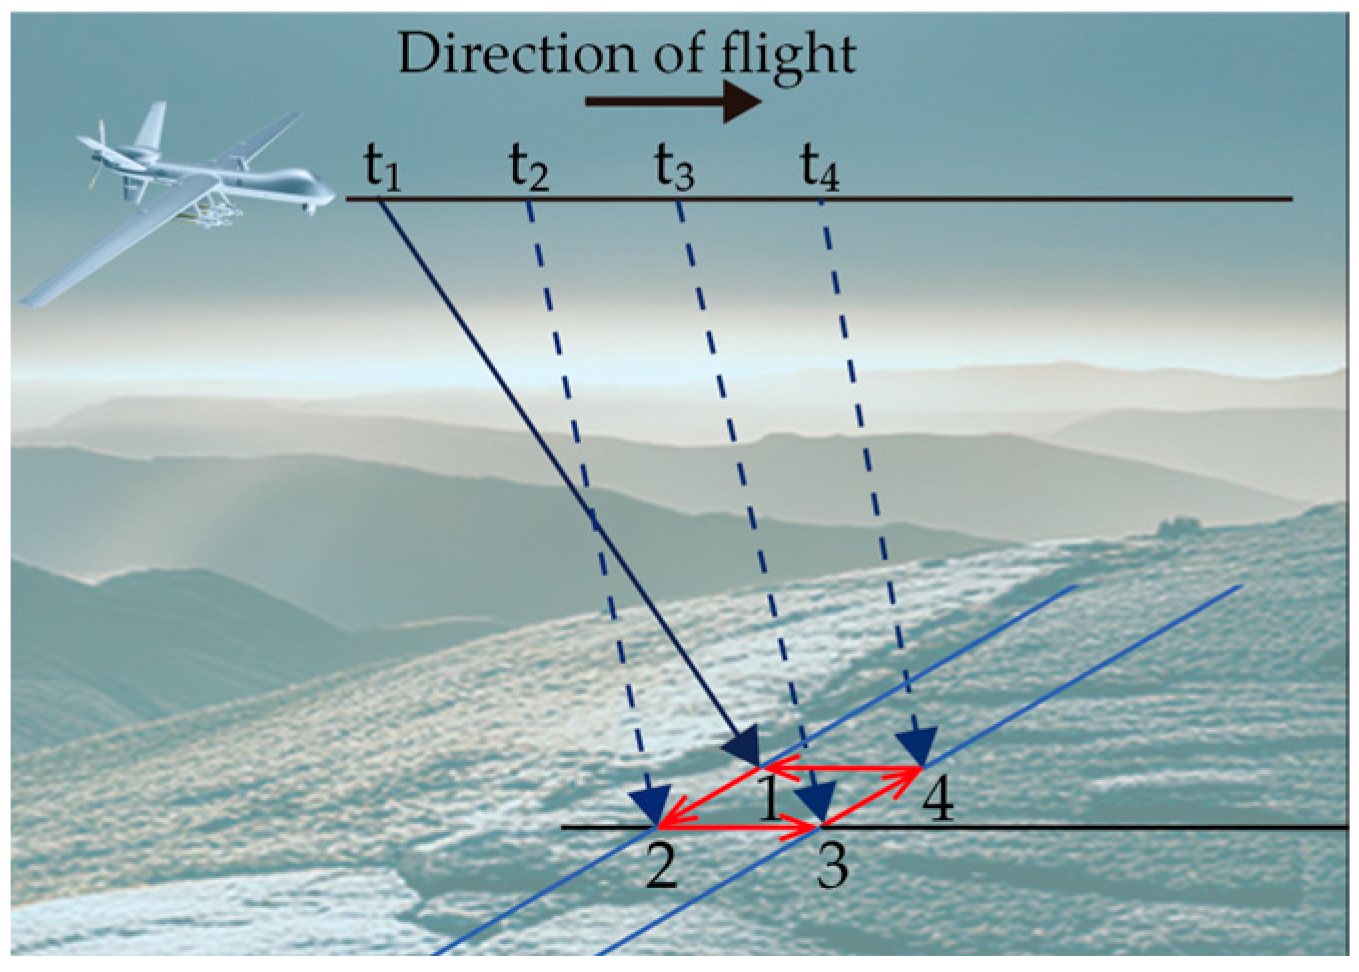
An assumption is further made that the aircraft flies at a constant speed.
Figure 3 illustrates sequential moments (t
1, t
2, t
3, and t
4) where the center of the boresight points to specific locations (points 1, 2, 3, and 4). The angle of the optical-axis pointing in the four imaging changes is minimal. In the cross-sectional view of the direction, the displacement of the center of the visual axis between moments t
1 and t
4, and between t
2 and t
3 is
. Similarly, the displacement in the side view of the direction between moments t
1 and t
2, and between t
3 and t
4 is
.
These changes in pointing ultimately influence the position of the image point on the image plane. During the imaging process with a sequence depth of 4, the trajectory of the image point on the detector’s image plane is depicted in
Figure 4.
From moments t
1 to t
4 of the staring imaging process, to capture the aliasing information of the ground target, the swing mirror not only compensates for the image motion caused by velocity and swing but also adds forward and backward micro-displacements at t
1 and t
3. Additionally, micro-displacements are added in the swing direction at t
2 and t
4. The red area represents the position on the image plane corresponding to the center of the boresight. As illustrated in
Figure 4, the camera acquires the first image at the initial position. When forming the second image, the image point corresponding to the center of the visual axis is shifted to the right by 1/2 pixel from its previous position due to the micro-displacement added by the swing mirror. The process then proceeds to acquire the third image, shifting 1/2 pixel to the rear side, and moving the fourth image to the front by 1/2 pixel in a similar fashion.
In summary, the pendulum mirror’s swing angle must take into account two effects: compensation for image motion and superimposed micro-displacement to capture aliasing information. The swing path of the pendulum mirror and the micro-displacement step size can vary. The micro-displacement step size might be planned directly according to 1/3 or 1/4 pixel, but the depth of the imaging sequence changes in response. The longer the imaging sequence, the greater the compensation required for image motion by the pendulum mirror. The design of the step size and path must align with the specific system, aiming to gather sufficient aliasing information.
3. Super-Resolution Algorithm Process and Principle
In this chapter, the processing flow of the super-resolution algorithm is presented. Given the optical–mechanical structure characteristics of the aerial visible-light camera, aliased images are achieved with the regular swing of the two-dimensional pendulum mirror. The sequences are subsequently registered, and an anisotropic kernel function is employed for super-resolution reconstruction. This method is similar to the work carried out by Wronski et al. [
22], where the data processing includes alignment and anisotropic regression kernel construction. However, in this paper, the micro-displacement relationship between sequence images is defined, greatly enhancing the algorithm’s computing speed and robustness.
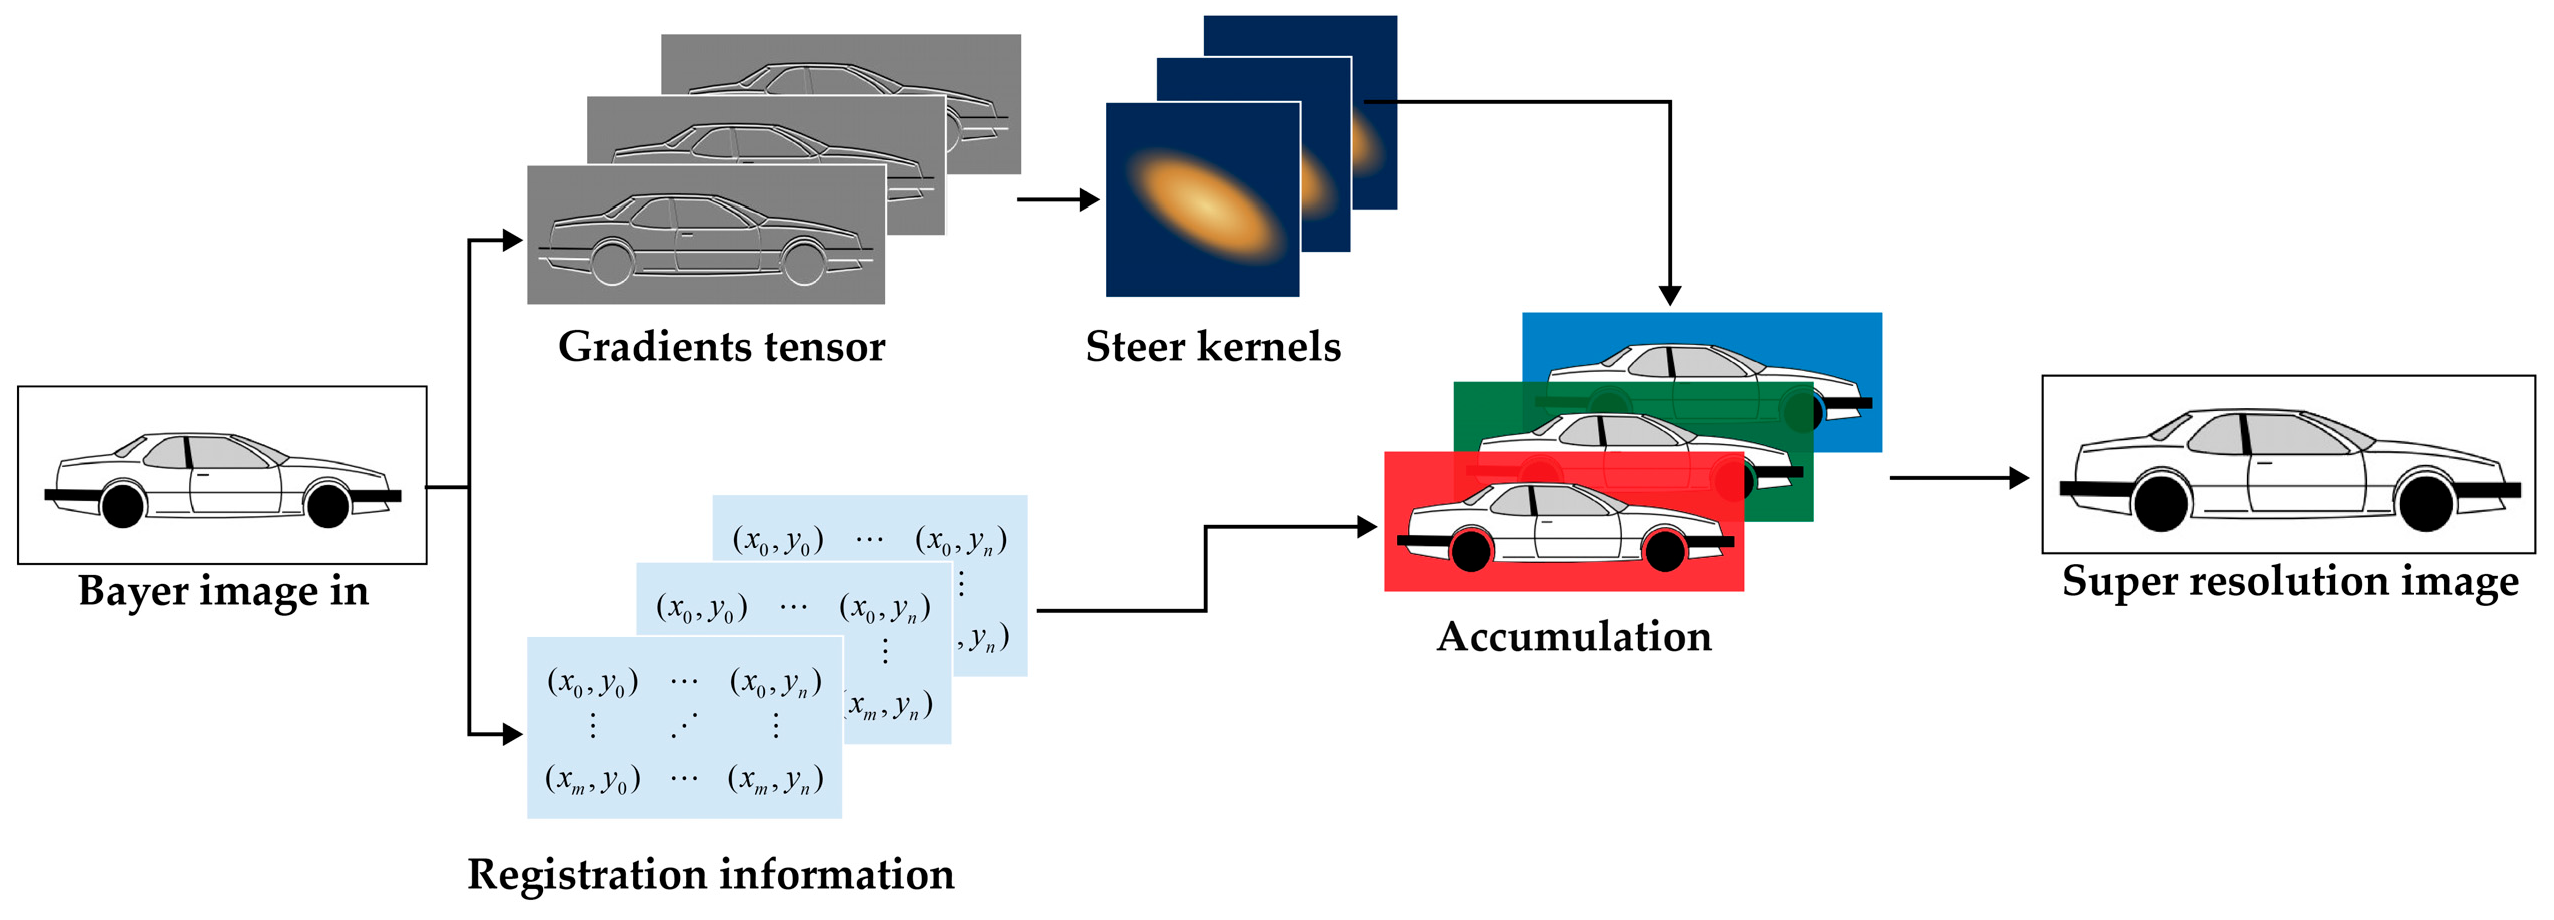
Initially, the original image sequence that has been acquired is registered according to the reference frame. The micro-displacement vector matrix for each frame in the image sequence relative to the base frame is ascertained. The exact positional relationship of the images within the known sequence enables the exclusion of mis-registered regions and objects, thereby enhancing registration accuracy.
Subsequently, the local gradient information of the image is calculated. The shape of the kernel function is then adjusted based on the local gradient tensor matrix. The anisotropic kernel function alters the shape in accordance with changes at the image’s edge, with different weights being allocated to various positions to preserve the details of the reconstructed image.
Finally, these images are weighted and accumulated to produce a super-resolution image. The complete process is visually represented in
Figure 5.
3.1. Image Sequence Alignment Based on Controllable Displacement
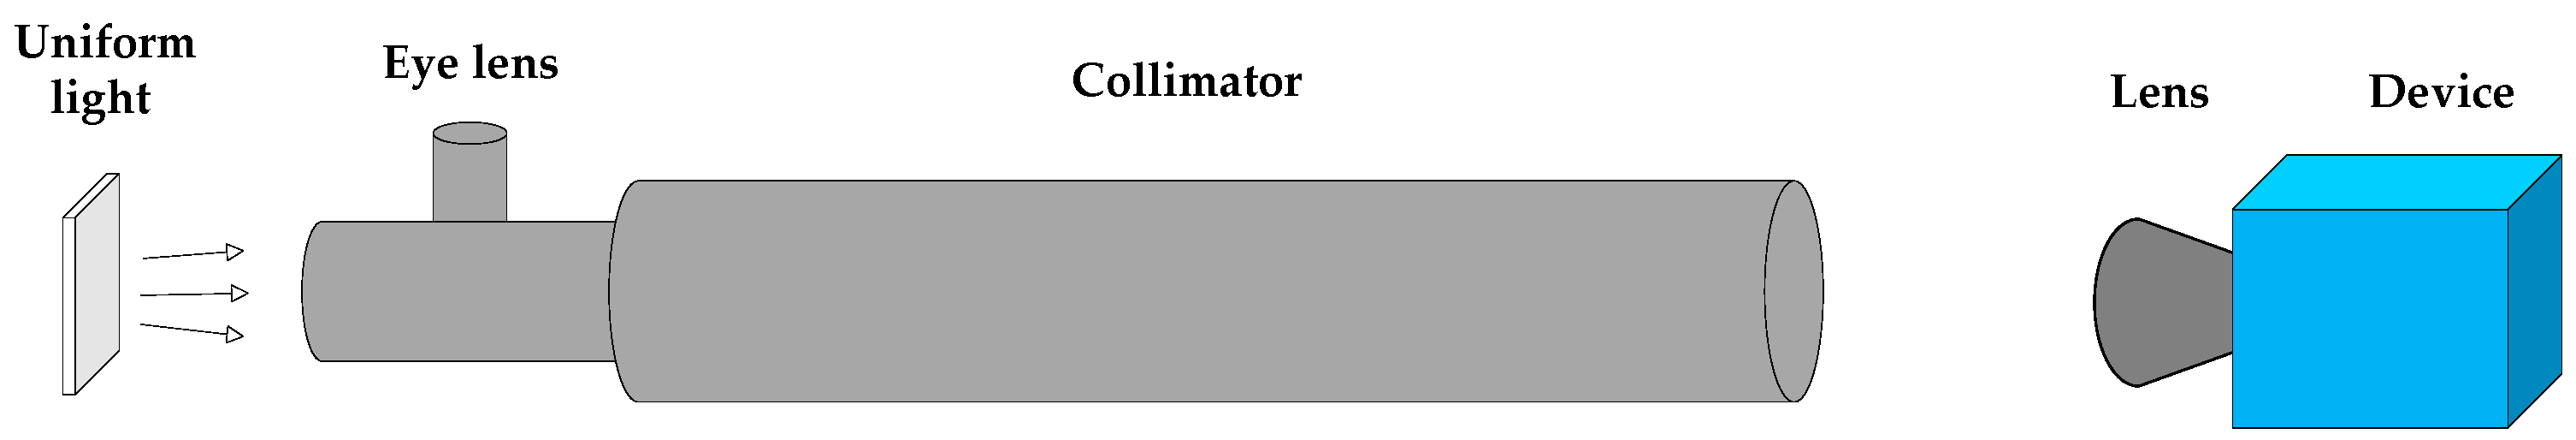
The problem of image registration forms the foundation for ensuring the accuracy of image super-resolution. In the image processing flow described in this paper, alignment must first be performed on the image obtained through micro-displacement before it can be input into the image algorithm sequence. Generally, the first image in the sequence is selected as the reference frame, and subsequent images are aligned with this frame. This principle is depicted in
Figure 6.
In the alignment of an image sequence with an aliasing relationship to the same reference frame, the camera samples the same position in space N times. Due to the presence of micro-displacement, different sampling positions on the detector’s target surface are achieved. Consequently, the color information of the three RGB spectral segments at the same spatial position can be obtained, allowing for the direct generation of color images [
25].
The characteristics of aerial imaging include a relatively long imaging distance and minimal sudden or rapid target position changes within the FOV. These characteristics align with the fundamental assumption of the L-K optical flow method [
26]. To attain sub-pixel-level registration accuracy, the pyramid method is utilized using multiple iterations. The control over registration accuracy is mainly executed by selecting pyramid layers and the search range of the registration module. Considering the moving distance of the image plane caused by single-step micro-displacement, there is no need to search the registration area extensively. A constrained search range significantly enhances both registration accuracy and computational efficiency. If the calculated displacement vector of the current frame is less than or equal to the current single-step micro-displacement distance, the data are retained. Otherwise, the pixels in that area are discarded, enhancing registration robustness and minimizing the effects of misregistration on image quality, and it is as follows:
where
and
symbolize the displacement triggered by the single-step movement of the micro-motion mechanism on the detector’s target surface.
3.2. Super-Resolution Reconstruction Based on Anisotropic Gaussian Kernel
Kernel regression is an approach for fitting a nonlinear model, fundamentally employing the kernel function as a weight function to create a regression model. Unlike the traditional isotropic kernel function, in image applications, there is a desire for the kernel shape to correlate with the image’s edge information. The kernel function’s shape at various positions is adjusted in accordance with the current point’s intensity information, the surrounding point image intensity information, and other factors. This ensures that the edge information in the image after the regression operation is more pronounced, effectively enhancing image authenticity and the signal-to-noise ratio, as well as realizing anisotropy in the edge area [
27,
28]. The adaptive kernel regression method consists of two basic steps, where the first step is an initial estimate of the image gradients, which is made using some kind of gradient estimator. The second step is to use this estimate to measure the main directions of local gradients in the image. In the second step, this orientation information is used to adaptively “steer” the local kernel, resulting in elongated, elliptical contours spread along the directions of the local edge structure. A steering matrix is defined as follows:
This matrix is a symmetric covariance matrix of local pixel gray-level differences. By appropriately choosing
and
, the algorithm can control the direction of the kernel function and the denoising effect. The local edge structure is related to the gradient covariance. Assuming a Gaussian kernel for the kernel function, the mathematical form of the steering matrix is as follows:
where
Ci is the local covariance matrix of a kernel function, which can be expressed by Equation (16) and is obtained with the singular-value decomposition (SVD) of the covariance matrix based on the local gradient.
where
denotes the function of the rotation matrix,
represents the function of the stretching matrix, and
is the radius amplitude of the ellipse; their definitions are shown in Equations (17) and (18). By using these three factors, a kernel function constructed from local gradients can control the weight of the kernel function at the image’s edge. It provides greater weight to the tangential direction of the edge, thereby enhancing the clarity of the target contour information.
5. Conclusions
A super-resolution algorithm has been formulated for aeronautical optoelectronic systems equipped with a 2D scanning galvanometer. Initially, within a standard aerial optical system with a two-dimensional swing mirror, a mathematical model was established between the target displacement and image point on the image plane. The swing path was designed, and the swing vector was analyzed.
Subsequently, based on aerial ground imaging characteristics, a super-resolution algorithm was designed, employing a multi-layer pyramid optical flow method to register sequential images with known micro-displacement, thereby substantially improving registration accuracy and robustness.
An anisotropic kernel function was generated using the gradient tensor matrix, and this kernel function was employed to perform super-resolution reconstruction of the image. This approach significantly preserves image edge details and augments system resolution.
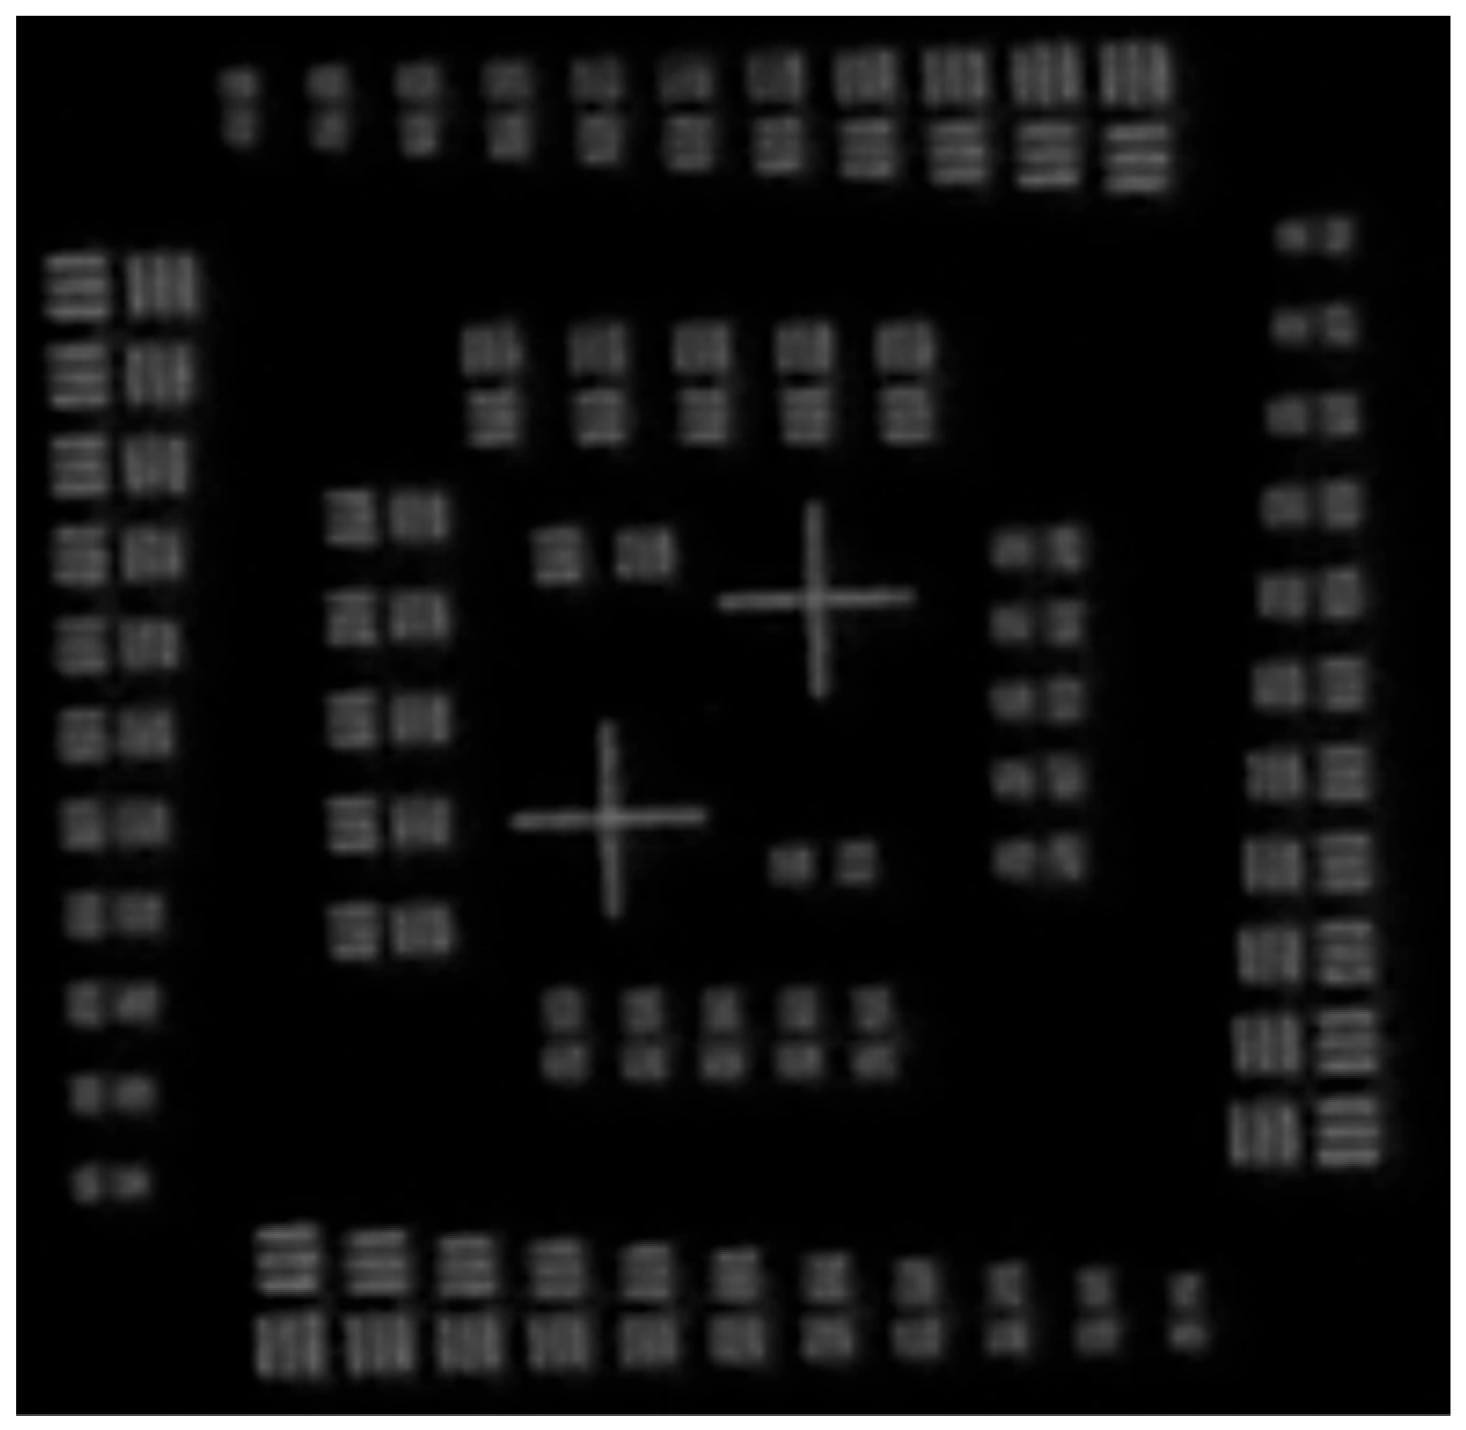
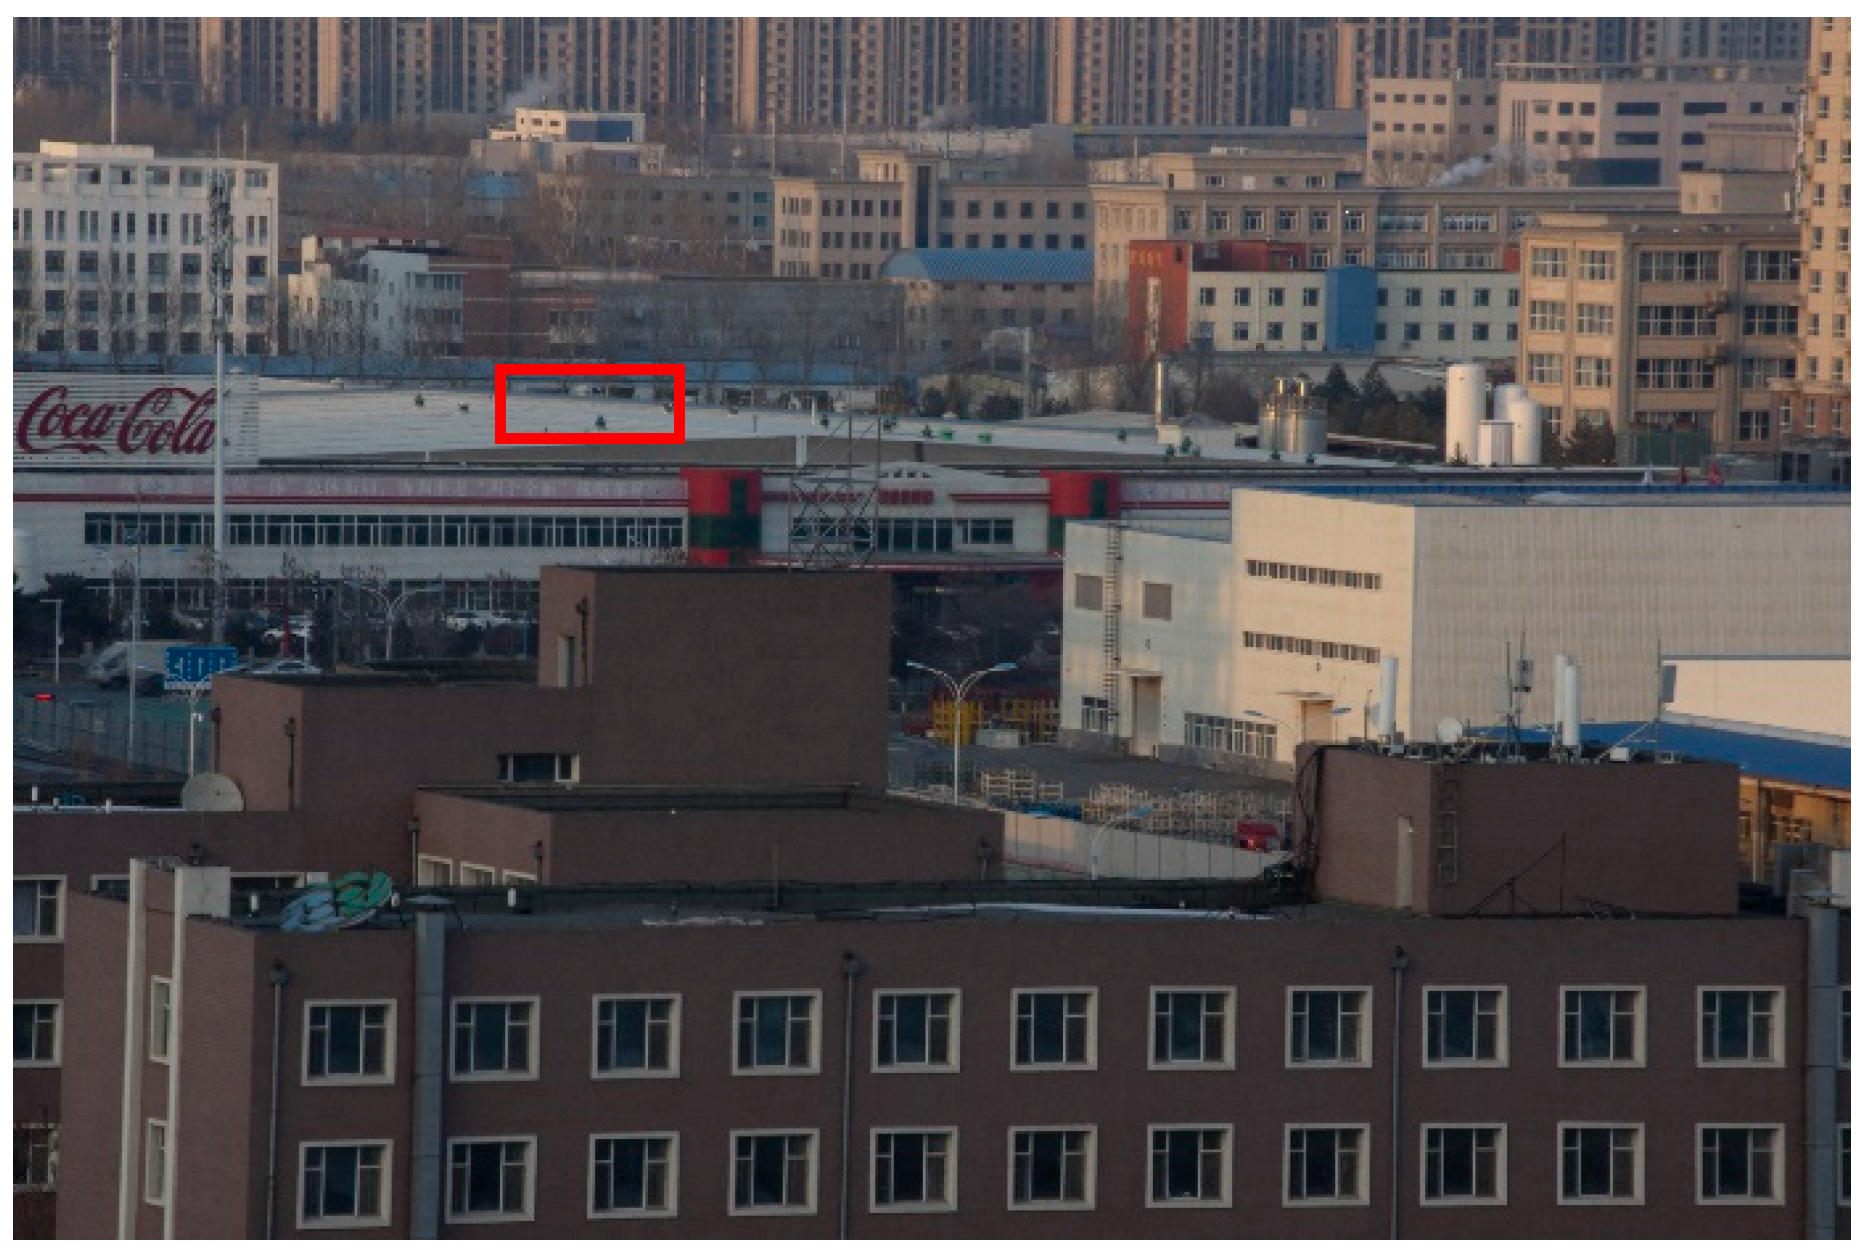
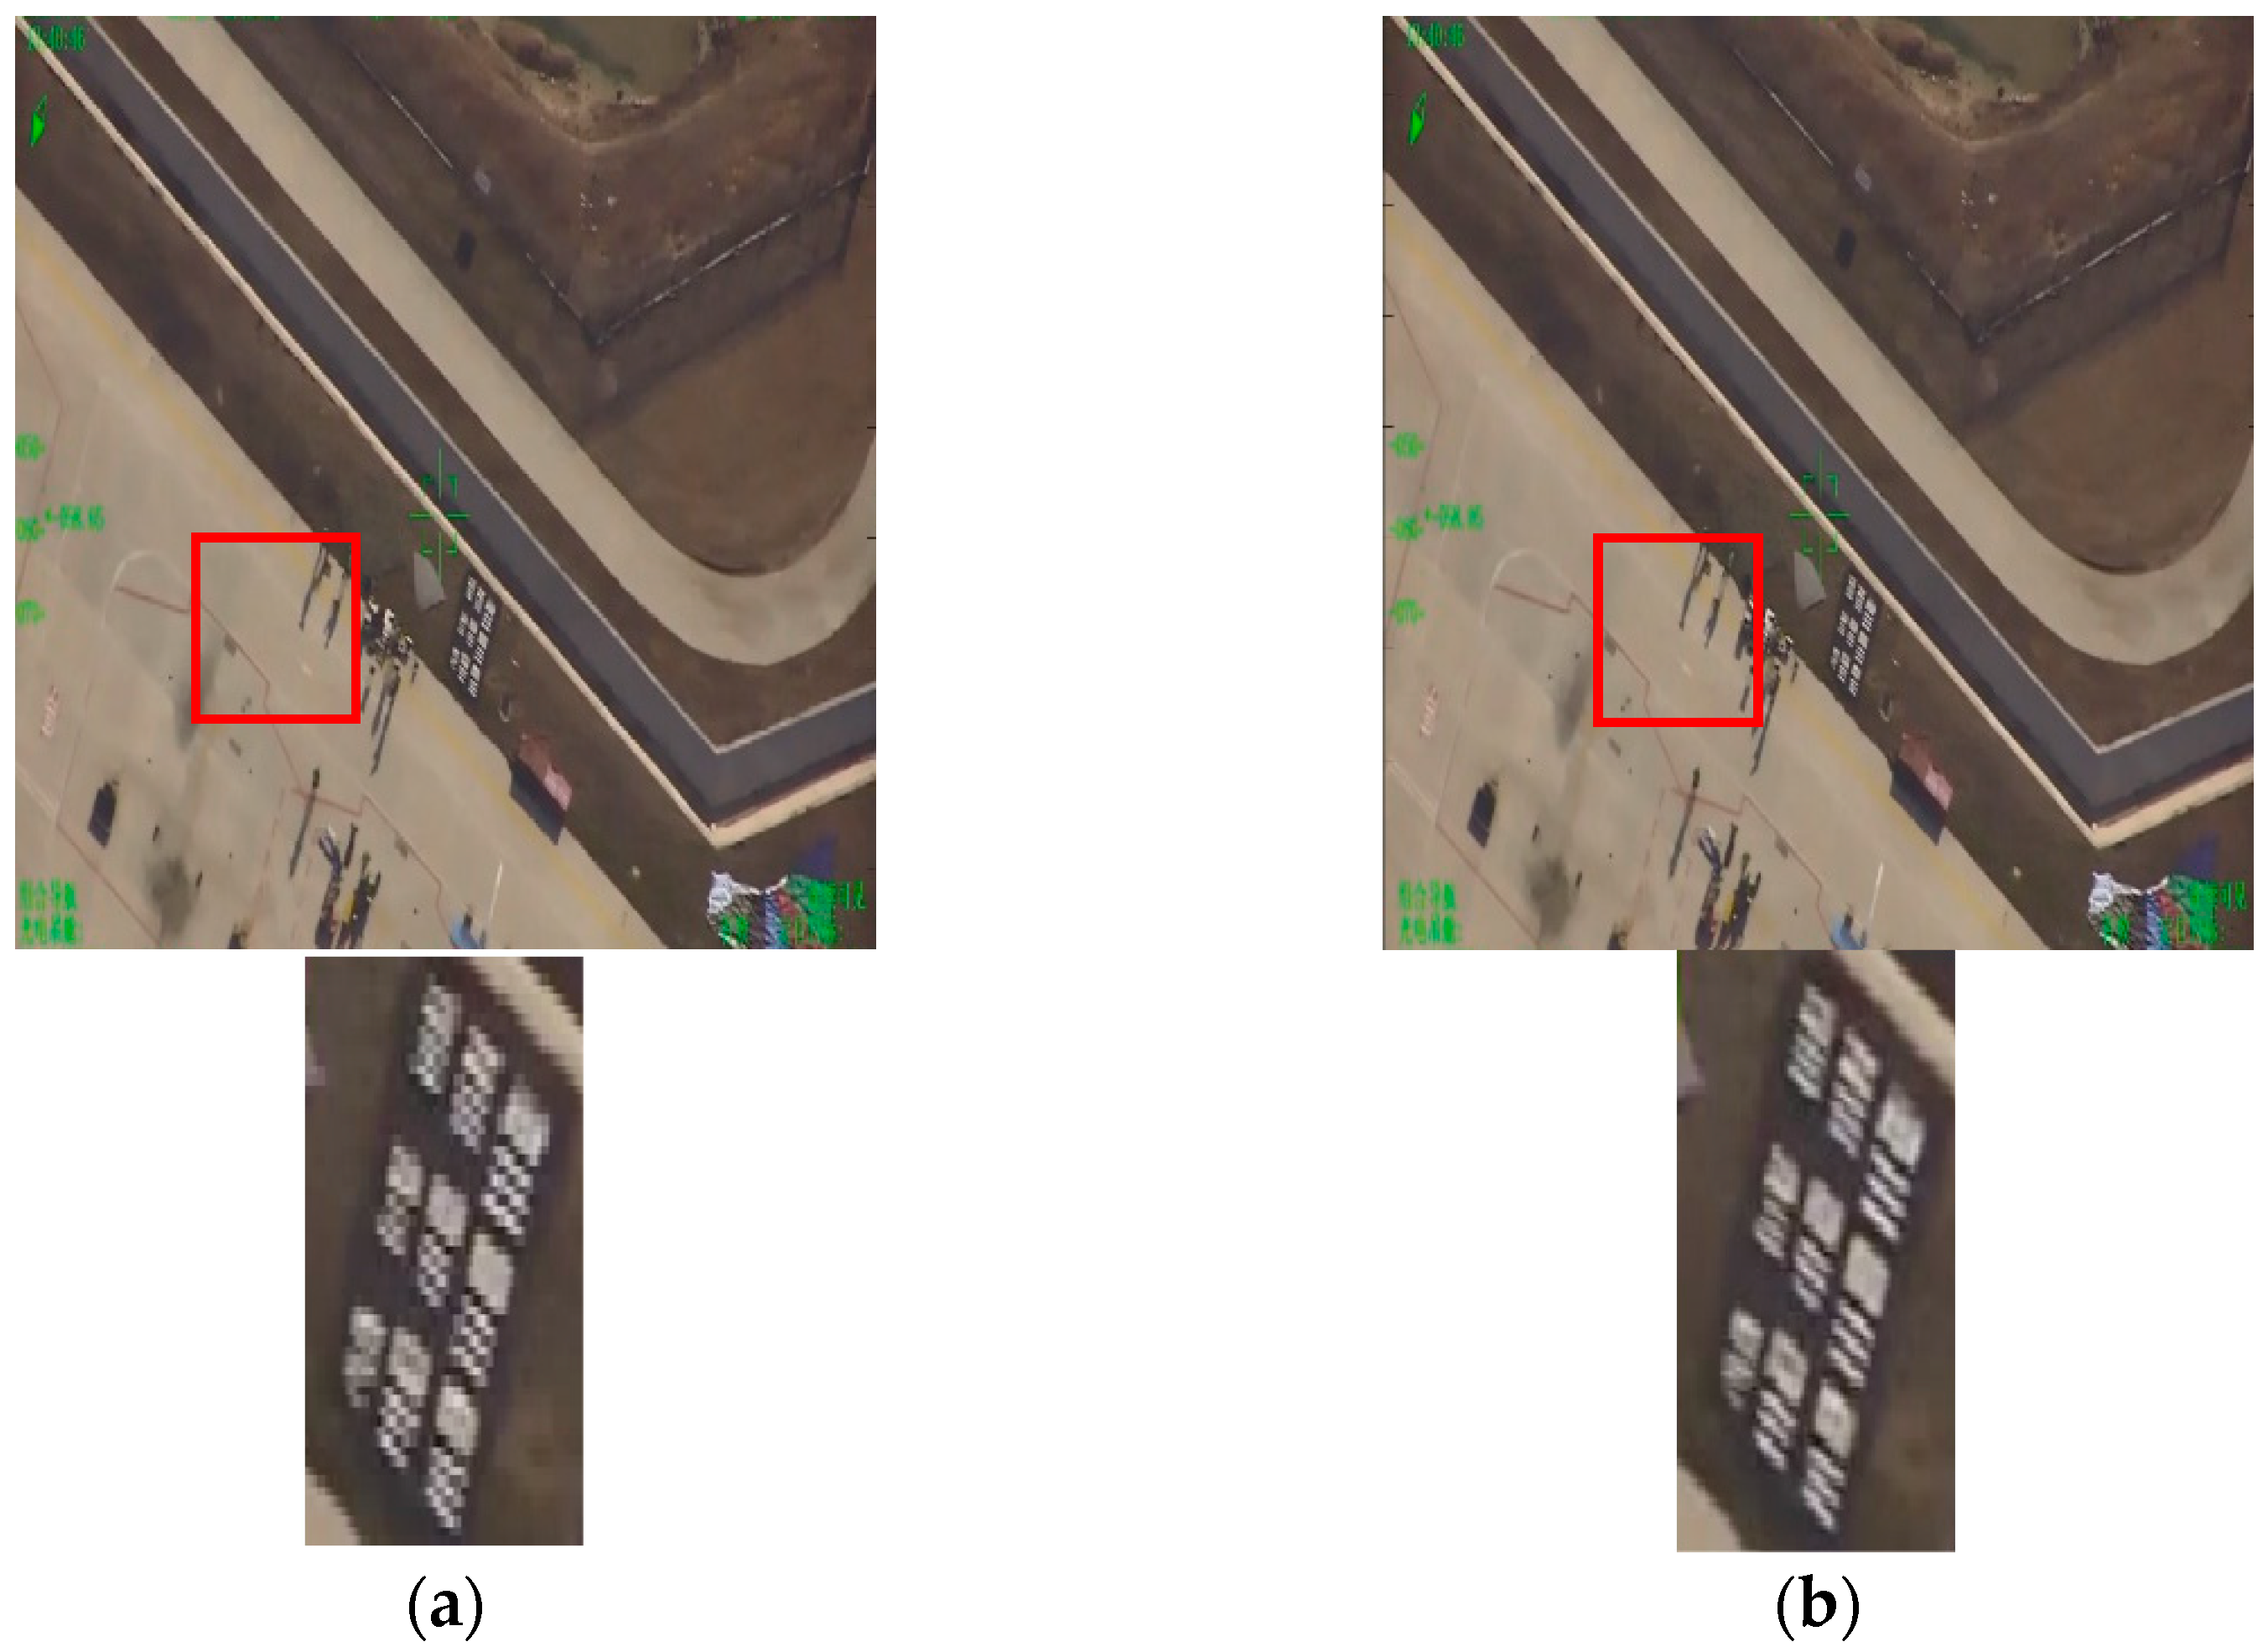
An aeronautical optoelectronic load incorporating the algorithm underwent tests under both daytime and nighttime conditions. The results demonstrate the algorithm’s ability to markedly suppress noise and enhance image resolution in night scenes. In a resolution test, 16 frames in our algorithm increased the resolution of the optical system by 39%.
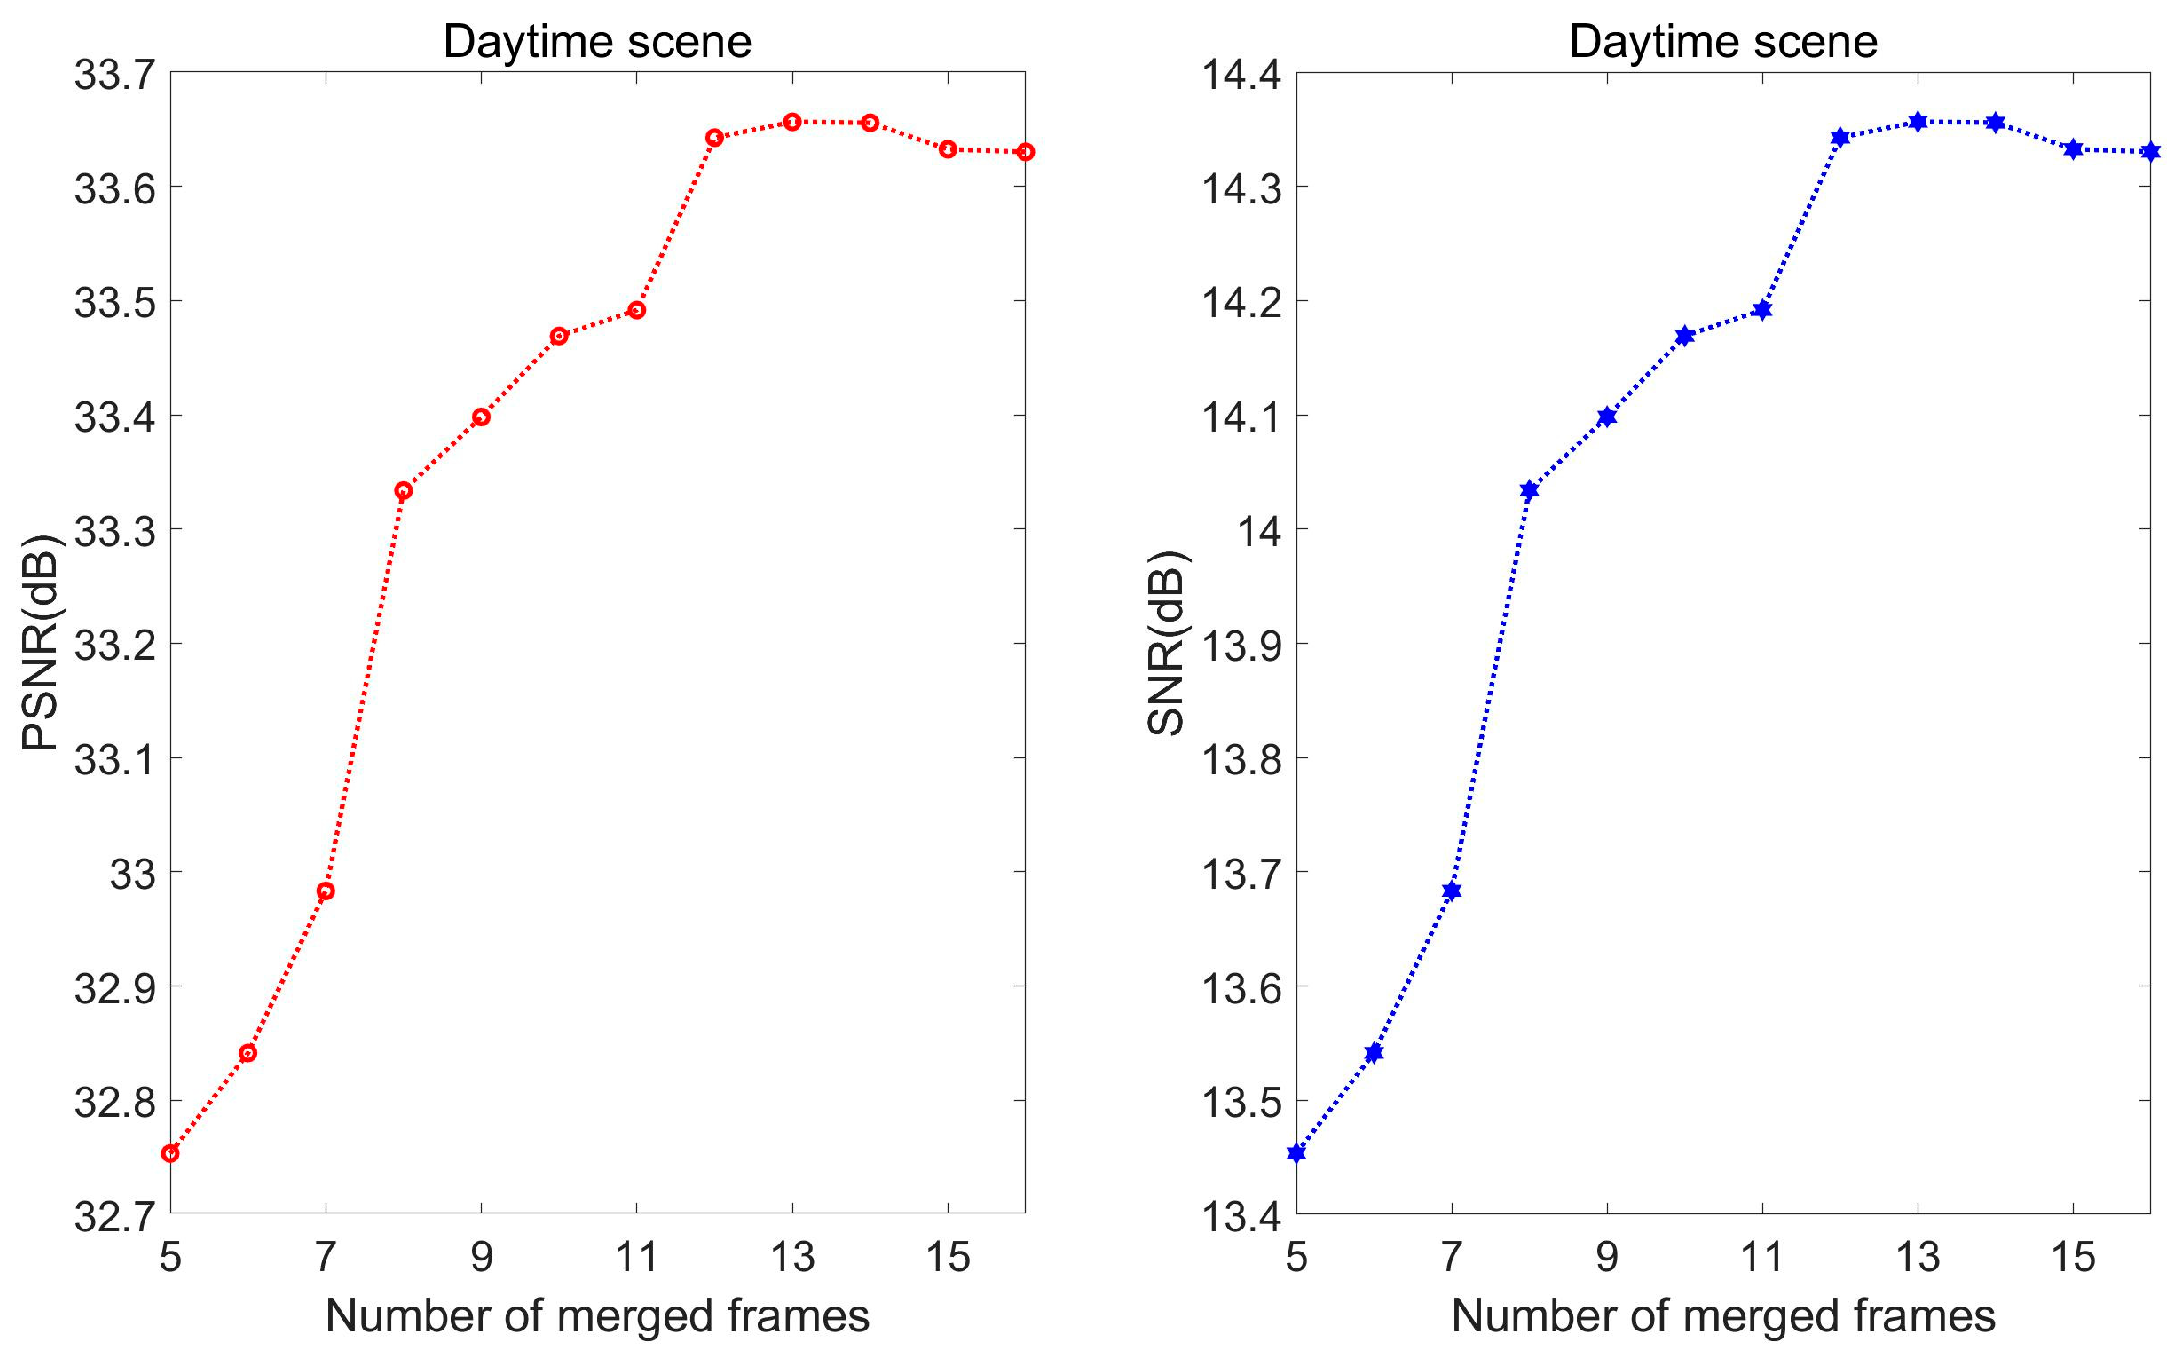
Furthermore, an increase in the sequence’s number of images can elevate the algorithm’s performance, but beyond a certain limit, gains in SNR and PSNR slow down due to factors such as misregistration and compensation of nonlinear errors caused by increased image motion. Data indicate that a sequence depth of 8–12 images should generally be selected for optimal results.

 ,
, 


