Article

Optimised Extraction of Trypsin Inhibitors from Defatted Gac (Momordica cochinchinensis Spreng) Seeds for Production of a Trypsin Inhibitor-Enriched Freeze Dried Powder

1
School of Environmental and Life Sciences, University of Newcastle, Ourimbah, NSW 2258, Australia
2
Faculty of Bio-Food Technology and Environment, University of Technology (HUTECH), Ho Chi Minh City 700000, Vietnam
3
Central Coast Primary Industries Centre, NSW Department of Primary Industries, Ourimbah, NSW 2258, Australia
4
School of Science and Health, Western Sydney University, Penrith, NSW 2751, Australia
*
Author to whom correspondence should be addressed.
Separations 2019, 6(1), 8; https://doi.org/10.3390/separations6010008
Submission received: 10 December 2018 / Revised: 21 January 2019 / Accepted: 28 January 2019 / Published: 5 February 2019
(This article belongs to the Special Issue Development of Alternative Green Sample Preparation Techniques)

Abstract

:
The seeds of the Gac fruit, Momordica cochinchinensis Spreng, are rich in trypsin inhibitors (TIs) but their optimal extraction and the effects of freeze drying are not established. This study aims to (1) compare aqueous solvents (DI water, 0.1 M NaCl, 0.02 M NaOH and ACN)/water/FA, 25:24:1) for extracting TIs from defatted Gac seed kernel powder, (2) to optimise the extraction in terms of solvent, time and material to solvent ratio and (3) to produce a TI-enriched freeze-dried powder (FD-TIP) with good characteristics. Based on the specific TI activity (TIA), the optimal extraction was 1 h using a ratio of 2.0 g of defatted powder in 30 mL of 0.05 M NaCl. The optimisation improved the TIA and specific TIA by 8% and 13%, respectively. The FD-TIP had a high specific TIA (1.57 ± 0.17 mg trypsin/mg protein), although it also contained saponins (43.6 ± 2.3 mg AE/g) and phenolics (10.5 ± 0.3 mg GAE/g). The FD-TIP was likely stable during storage due to its very low moisture content (0.43 ± 0.08%) and water activity (0.18 ± 0.07) and its ability to be easily reconstituted in water due to its high solubility index (92.4 ± 1.5%). Therefore, the optimal conditions for the extraction of TIs from defatted Gac seed kernel powder followed by freeze drying gave a high quality powder in terms of its highly specific TIA and physical properties.

1. Introduction

Trypsin inhibitors (TIs) are low molecular weight peptides which can inhibit the hydrolase activity of many kinds of serine proteases. They are commonly found in the storage organs of plants, such as seeds, roots and tubers. Three major sub-types of TIs have been reported and identified in plants [1]: the Bowman–Birk-type inhibitors, Kunitz-type inhibitors and squash family inhibitors. Their molecular weights are about 7500, 20,000 and 3500 kDa, respectively. The first two types were isolated from leguminous plants while the third was obtained from Cucurbitaceous species [1].
This study focuses on the seeds from Gac (Momordica cochinchinensis Spreng), a plant that belongs to the Cucurbitaceae family. The aril around the seeds of the Gac fruit is widely used as a food ingredient but the seeds are mainly discarded. However, the seeds have long been used as a traditional Chinese medicine (Mu bie zi) to treat many common diseases such as boils, pyodermatitis, mastitis, tuberculous cervical lymphadenitis, ringworm infections, freckles, sebaceous hemorrhoids and hemangiomas [2,3].
Several TIs from Momordica cochinchinensis (MCoTIs) have been characterised [1,3,4,5] and proposed to be among the most important bioactives in Gac seeds. They serve as storage proteins and may also be involved in the regulation of endogenous proteases during seed dormancy [6]. Nine MCoTIs have been isolated and sequenced from the seeds of Gac fruit [1,2,4]. Structurally, MCoTIs consist of 28–34 amino acid residues, six of which are cysteine residues that form three disulfide bonds. The Gac seed TIs have a very small molecular weight of 3–5 kDa [1,2,4] and in comparison to other TI families, they are more compact in structure and exceptionally stable [7,8,9]. Among these, MCoTI-I and MCoTI-II are cyclic peptides and as such, they have a very compact and stable structure [4,10]. This enables them to penetrate into cells and, therefore, they are attractive candidates for use as scaffolds for the development of novel intracellularly-targeted drugs [11,12]. Moreover, the activity of Gac seed TIs is very high, at least 50-fold more potent than those from different Cucurbitaceous seeds [2]. Due to their clinical potential, Gac seed TIs could be used in a variety of applications in medicine, agriculture and food technology.
As for all plant-derived natural products, extraction is the first critical step in the isolation of TIs from their sources. However, up to date, there are only a few papers dealing with the suitability of different solvents and the extraction conditions for the extraction of these valuable compounds from Gac seeds. In one study [13], a mixture of acetonitrile, water and formic acid (ACN/Water/FA) was found to be optimal for extracting cysteine knot peptides from Gac seeds, some of which are trypsin inhibitors. In our previous study [14], we showed that trypsin inhibitors were able to be effectively extracted from defatted Gac seed kernel powder using conventional solvent extraction with deionised (DI) water only. For other plant sources of TIs, water was also the optimal solvent for their extraction from Thai mung beans [15] but 0.1M NaCl was the best for their extraction from Chenopodium quinoa seeds [16] and 0.02 M NaOH was the best for their extraction from grass peas [17]. Clearly, aqueous media are the best solvents for the extraction of TIs.
Apart from the type of solvent used, the efficiency of extractions can be affected by other factors, such as extraction time and the ratio of sample to solvent. For the extraction of trypsin inhibitors, the extraction conditions have so far been studied by conducting one-factor-at-a-time experiments [15,16,17]. However, one-factor-at-a-time experiments cannot fully determine the interactions between different factors [18] and to overcome this deficiency, the response surface methodology (RSM) is used to determine the simultaneous effects of several factors on extractions.
Therefore, the present study aimed to determine the suitability of different aqueous media (DI water, 0.1 M NaCl, 0.02 M NaOH and ACN)/water/FA) as extraction solvents and to further determine the optimal conditions for the extraction of TIs from defatted Gac seed kernel powder by using RSM. The optimised extraction conditions were then used to produce a TI-enriched freeze-dried powder and the physicochemical properties of the freeze-dried powder were determined.

2. Materials and Methods

2.1. Materials

2.1.1. Reagents and Chemicals

Trypsin (type I) from bovine pancreas, benzyl-DL-arginine-para-nitroanilide (BAPNA), dimethyl sulfoxide (DMSO), tris(hydroxymethyl)aminomethane, bovine serum albumin, Folin-Ciocalteu’s phenol reagent, cupric sulphate, sodium carbonate, sodium tartrate and formic acid were products of Sigma-Aldrich (Castle Hills, NSW, Australia). Sodium hydroxide and calcium chloride were from Merck (Bayswater, VIC, Australia) and sodium chloride and acetic acid were from Chem-Supply (Port Adelaide, SA, Australia).

2.1.2. Gac Seeds

Gac seeds were collected from 450 kg of fresh Gac fruit from Momordica cochinchinensis accession VS7 as classified by Wimalasiri et al. [19]. These fruits were obtained at Gac fruit fields in Dong Nai province, Ho Chi Minh City, Vietnam (Latitude: 10.757410; Longitude: 106.673439). The seeds were separated from the seed pulp and then vacuum dried at 40 °C for 24 h to reduce their moisture and to increase the crispness of the shells to facilitate their removal. The dried seeds were de-shelled to get the kernels, which were then packaged in vacuum-sealed aluminium bags and stored at −18 °C for use within 4 years.

2.1.3. Preparation of Defatted Gac Seed Kernel Powder

The Gac seed kernels were ground using an electric grinder (100 g ST-02A Mulry Disintegrator) to a powder that could pass through a 1.4-mm sieve. The powder was then frozen with liquid nitrogen and freeze-dried using a Dynavac FD3 Freeze Dryer (Sydney, NSW, Australia) for 48 h at −45 °C under vacuum at a pressure loading of 10−2 mbar (1 Pa), to reduce the moisture content to 1.21 ± 0.02%. The powder was then defatted using hexane (1:5 w/v, 30 min, ×3) on a magnetic stirrer at ambient temperature. The resulting slurry was suction filtered using a Buchner funnel and Whatman No. 1 filter paper (Sigma-Aldrich, Castle Hills, NSW, Australia). The residue was placed in a fume hood at ambient temperature until dry and free of hexane odour (~12 h) and stored in an air-tight jar at ambient temperature for use within a year. This defatted Gac seed kernel powder was referred to as “defatted powder” and its moisture content was measured, using a Shimazdu MOC63u moisture analyser (Gallay Medical & Scientific, Mulgrave, VIC, Australia), prior to weighing for extractions so that the results could be expressed in terms of the defatted powder’s dry weight (DW).

2.2. Methods

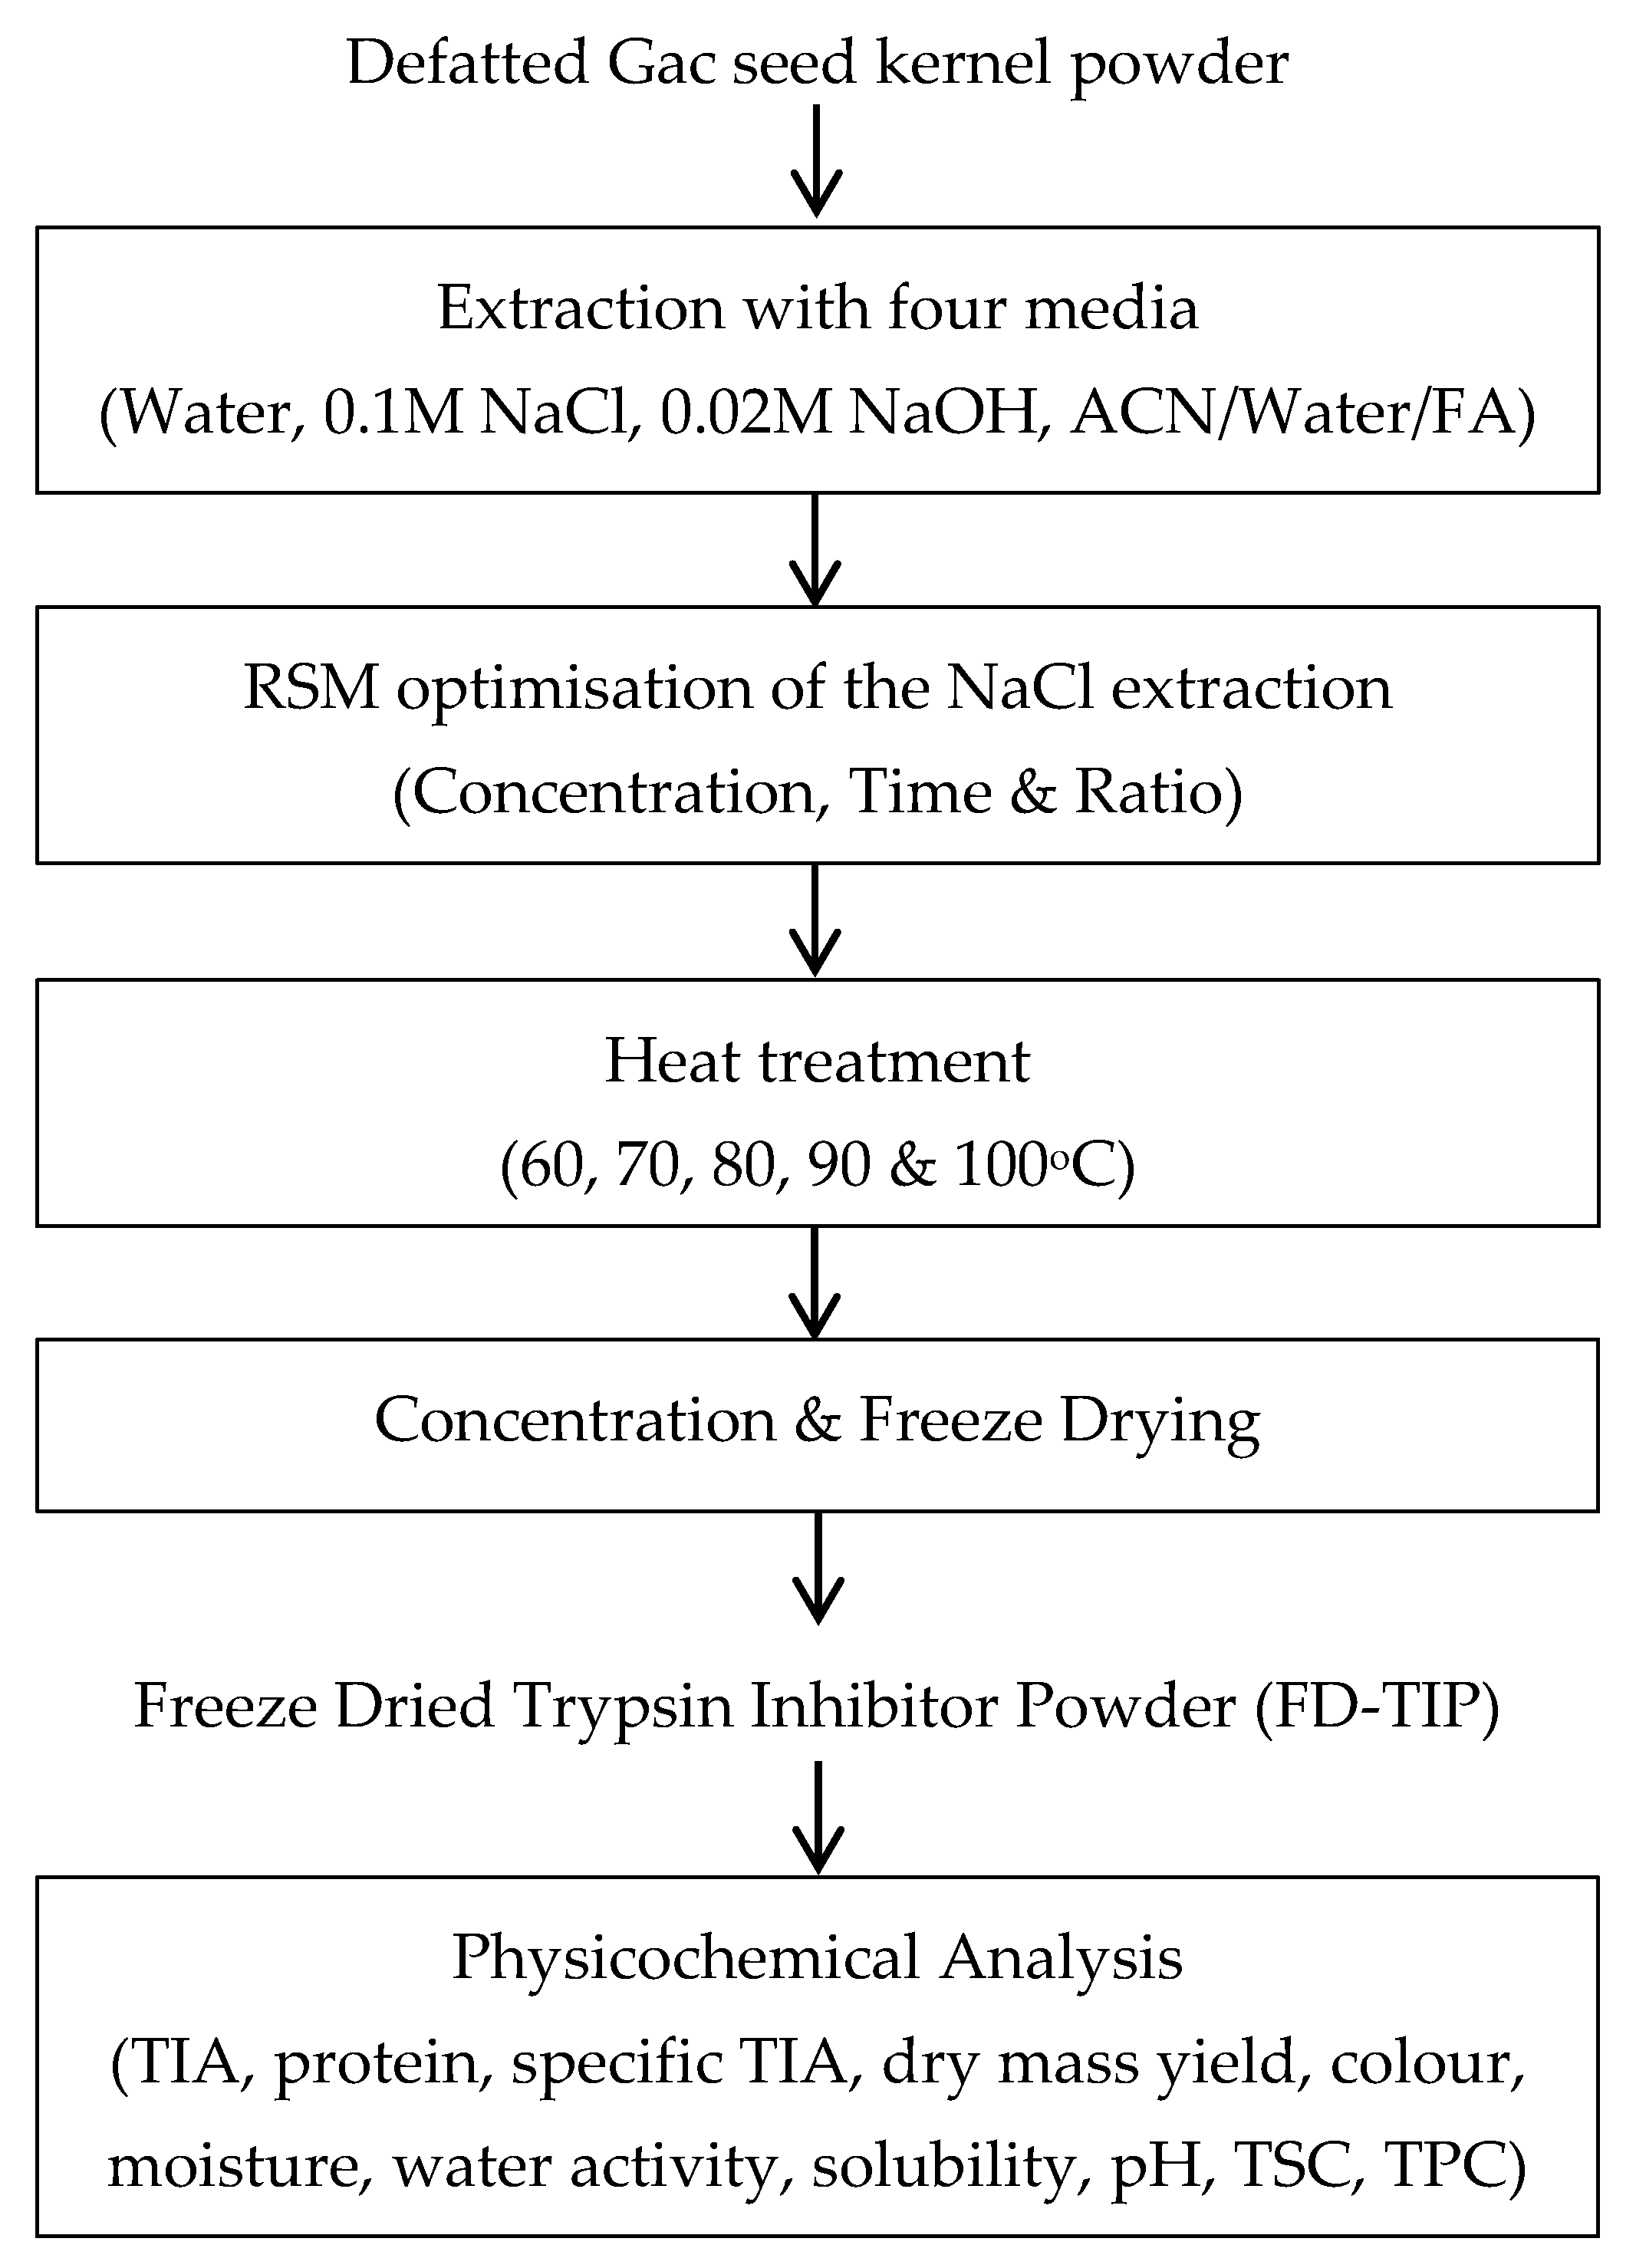
2.2.1. Experiment Design

A summary of the experimental design for the study is shown in Scheme 1.

2.2.2. Extraction with Four Aqueous Media

Due to the known hydrophilic nature of the Gac seed TIs, aqueous solutions were investigated as solvents for their extraction. Four different aqueous media were compared for their efficiency to extract TIA from the defatted powder: (1) DI water, (2) 0.1 M NaCl, (3) 0.02 M NaOH and (4) ACN)/Water/FA, (25:24:1, v/v/v).
Defatted powder (1.5 g) was suspended in 30 mL of each medium in a 100-mL conical flask and shaken for 1 h at 110 rpm at ambient temperature (17 °C) using a Citenco KQ-606 shaking water bath (Citenco Ltd., London, UK). The suspensions were filtered through a 0.45 µm syringe filter (Phenomenex, Lane Cove, NSW, Australia). The clear filtrates were collected and their TIA (mg trypsin/g defatted powder DW), protein content (mg/g defatted powder DW) as well as their specific TIA (TIA/protein content) were analysed. Each extraction was done in triplicate.

2.2.3. Optimisation of the Extraction Conditions Using RSM

The results from the extractions in Section 2.2.2 showed that the 0.1 M NaCl solution was the best media for extracting TIA from the defatted powder. Therefore, the NaCl solution was selected for further optimisation of the extraction using the response surface methodology (RSM) with three independent factors: the NaCl concentration of the extraction media, the extraction time and the ratio of defatted powder to the volume of NaCl solution. Based on the results from preliminary experiments (data not shown), three levels (Table 1) were selected for a Box–Behnken RSM design [20] to test the NaCl concentration (X1, mol/L), the extraction time (X2, hour) and the amount of defatted powder (X3, g) extracted with 30 mL of the extraction NaCl solution. Therefore, 15 experimental combinations representing 12 factorial points and three central points were performed randomly in duplicate and the experimental values for TIA (mg trypsin/g powder DW), protein content (mg/g defatted powder DW) and specific TIA (mg trypsin/mg protein) were determined for each of the 15 combinations.
The data obtained for the selected combinations was used to generate the second-order polynomial equation/quadratic model shown in Equation (1), which was then used to predict the optimal parameters for the extraction process [21]. To test the predicted optimal parameters, these parameters were used for a TI extraction from defatted powder done in triplicate.
Y = β 0 + β 1 X 1 + β 2 X 2 + β 3 X 3 + β 12 X 1 X 2 + β 13 X 1 X 3 + β 23 X 2 X 3 + β 11 X 1 2 + β 22 X 2 2 + β 33 X 3 2
where Y is the response variable; X1, X2, X3 are the coded independent variables for the NaCl concentration, the extraction time and the ratio of sample to solvent (Table 1), respectively. β0, β1, β2, β3 and β11, β22, β33, β12, β13, β23 are the regression coefficients for the constant (β0), the linear effects (β1, β2, β3), the quadratic effects (β11, β22, β33) and the interactions (β12, β13, β23), respectively.

2.2.4. Heat Treatment of the Optimal TI Extract

The extract obtained with the optimal NaCl extraction conditions determined in Section 2.2.3. (2.0 g of defatted powder in 30 mL of 0.05 M NaCl for 1 h) was then heated at different temperatures to determine whether any unstable proteins could be removed as described by Klomklao et al. [15]. Triplicate samples (5 mL) of the extract were heated at different temperatures (60, 70, 80, 90 and 100 °C) for 10 min and then cooled with ice water. As controls, triplicate samples were kept at ambient temperature. To remove any heat coagulated debris, the extracts were filtered through a 0.45 µm syringe filter (Phenomenex, Lane Cove, NSW, Australia). The TIA (mg trypsin/g powder DW), protein content (mg/g defatted powder DW) and specific TIA (mg trypsin/mg protein) were then determined for the clear filtrates.

2.2.5. Concentrating and Freeze Drying the Extract Prepared with the Optimal Parameters

Based on the results in Section 2.2.4, which showed that heat treatment between 60 and 100 °C had no effect on the specific TIA of the extract, heat treatment was not included as a step in the production of a freeze-dried powder with high specific TIA. The optimal extraction parameters determined in Section 2.2.3. were applied to extract the defatted powder but the relative amounts were increased by 60 in order to obtain an amount of freeze-dried material sufficient for the many physicochemical analyses to be undertaken.
The defatted powder (120 g) was stirred with 1800 mL of 0.05 M NaCl for 1 h at ambient temperature and then the suspension was filtered through 3 layers of cheese cloth and finally through a No. 1 Whatman filter paper. The collected filtrate was equally transferred into three evaporating flasks (1 L) and concentrated using a rotary evaporator (Buchi Rotavapor B480, Buchi Australia, Noble Park, VIC, Australia) at 45 °C under vacuum, until around 70 mL of the concentrated extract was left in each flask (~4 h). The three concentrates were transferred into three 250 mL beakers, frozen using liquid nitrogen and freeze-dried using a Scitek BenchTop Pro freeze dryer (Lane Cove, NSW, Australia) at −60 °C and 30 mbar for 48 h.
The three beakers with the freeze dried trypsin inhibitor powder (FD-TIP) were placed in a desiccator, quickly weighed and kept at ambient temperature until analysed. The difference in weight between each beaker with powder and the empty beakers was taken to be the mass recovered in each beaker for the extract.

2.2.6. Determination of Trypsin-Inhibiting Activity (TIA)

The TIA assay was performed as described by Makkar et al. [22] except that the absorbance was measured at 385 nm, as suggested by Stauffer [23], instead of at 410 nm.
Reagent preparation:
Substrate solution: A substrate solution of 92 mM BAPNA was made in 0.05 M Tris-buffer (pH 8.2) containing 0.02 M CaCl2. The BAPNA was first dissolved in DMSO (40 mg/mL) and then diluted with the buffer solution pre-warmed to 37 °C (1:100 v/v). This BAPNA solution was prepared daily and kept at 37 °C while in use.
Trypsin solution: 20 mg of trypsin (type I) from bovine pancreas was dissolved in 1 mM HCl to make 1 L, stored at 4 °C for use within 2 weeks.
Determination of TIA
The liquid extracts from Section 2.2.2, Section 2.2.3 and Section 2.2.4 or the freeze-dried trypsin-inhibitor powder (FD-TIP) from Section 2.2.5 was dissolved and diluted in water at a concentration to give an inhibition of Trypsin between 40 and 60%. The assay was setup as shown in Table 2 with four test tubes (a, b, c and d) prepared for each sample. All the prepared test tubes were kept in a water bath at 37 °C for 10 min to promote the formation of an enzyme-inhibitor complex; 2.5 mL of BAPNA solution pre-warmed to 37 °C was then added into each tube. The contents of the tubes were well mixed after each addition. The tubes were then incubated in the water bath at 37 °C for another 10 min before 0.5 mL of 30% acetic acid solution was added to each tube to stop the reaction. Then, 1.0 mL of trypsin solution was added into each blank tube (Table 2). After thorough mixing, the absorbance of the reaction mixture (due to the release of p–nitroanilide) was measured at 385 nm.
Calculations
The TIA was calculated in terms of milligrams of pure trypsin inhibited per gram on a dry-weight basis (mg/g DW) of the defatted Gac seed kernel powder or the FD-TIP (Equation (2)) [14].
TIA = A I × V × D 19 × S × ( 1 m % / 100 )
where, AI: Change in absorbance due to inhibition per 1 mL of diluted extract
  • A I = ( A b A a ) ( A d A c ) , subscripts as per Table 2.
  • V: Volume of undiluted extract (mL)
  • D: Dilution factor of the extract
  • S: Weight of defatted Gac seed kernel powder or FD-TIP in V mL (g)
  • 19: Constant figure based on the absorbance given by 1 mg of pure trypsin
  • m%: moisture content of defatted Gac seed kernel powder or freeze-dried extract powder

2.2.7. Determination of Total Protein Yield (TPY)

Total protein yield (TPY) was defined as the amount (mg) of water-soluble protein obtained per 100 g of ground defatted seed kernel powder on dry weight (DW) basis. TPY was measured by the method of Lowry et al. [24] as described by Klomklao et al. [15], with some modifications. Briefly, 0.5 mL of diluted sample or standard was mixed with 2.5 mL of reagent A containing 2 mL of 0.5% CuSO4 in 1% sodium citrate and 100 mL of 2% sodium carbonate in 0.1 N NaOH for 10 min at ambient temperature. Then, 0.25 mL of 0.5 N Folin-Ciocalteu phenol reagent was added while vortexing. After incubating for 30 min, the absorbance of the reaction mixture was measured at 750 nm using a Cary 50 Bio UV–VIS spectrophotometer (Agilent Technologies, Mulgrave, VIC, Australia). Bovine serum albumin (BSA) was used as a standard and the result was expressed as mg BSA per gram of the defatted Gac seed kernel powder or the FD-TIP (mg BSA/g DW).

2.2.8. Physicochemial Analyses on the FD-TIP

Along with the determination of TIA (Section 2.2.6) and protein content (Section 2.2.7), the following physicochemical analyses were done on each of the FD-TIP in the three beakers described in Section 2.2.5.
Dry Mass Yield, Moisture Content, Water Activity, Water Solubility Index, pH and Colour
The dry mass yield was defined as the amount (g) of FD-TIP produced per 100 g of dried defatted Gac seed kernel powder. Equation (3) was used to calculate the dry mass yield (DM), in which FD (g) is the weight of the FD-TIP obtained after the extraction and DS (g) is the mass of the dried defatted Gac seed kernel powder used for the extraction.
DM   ( g / 100   g ) =   FD DS × 100
The moisture content of the FD-TIP was determined by weight difference after drying at 80 °C for 24 h in a vacuum oven drier (Thermoline Scientific, Wetherill Park, NSW, Australia). The water activity of the freeze dried powder was measured using a Pawkit water activity meter (Graintec, Toowoomba, QLD, Australia).
The water solubility index of the FD-TIP was determined according to Anderson [25] with some modifications. The FD powder (2.5 g) was dispersed in 25 mL of DI water and stirred constantly for 10 min at ambient temperature. The solution was centrifuged at 3000 rpm for 10 min in a Clements 2000 centrifuge (Clements Medical Equipment Pty Ltd., Somersby, NSW, Australia). The supernatant was vacuum oven dried at 80 °C and −70 kPas for 44 h. The water solubility index is expressed as a percentage of the dry solids obtained after drying of the extracted material compared to the original 2.5 g FD powder sample.
To determine the pH of the powders, 2.5 g of powder was dissolved in 25 mL of deionized water and the pH was measured using a labCHEM pH meter (TPS Pty Ltd., Brendale, QLD, Australia) calibrated with standard pH 4 and 7 buffers.
The colour of the powder was measured using a CR-400 chroma meter (Thermo Fisher Scientific, North Ryde, NSW, Australia) calibrated with a white standard tile. Each of the three FD-TIPs were packed into a polyethylene pouch for colour measurements, and the results for each sample were the average of five measurements expressed as the Hunter colour values for the L*, a* and b* co-ordinates as defined by the CIE (Commission Internationale de l’Eclairage). The L* value represents the lightness–darkness dimension, the a* value represents the red–green dimension and the b* value represents the yellow–blue dimension.
Total Saponin Content (TSC)
The FD-TIP crude extract was dissolved in water at a concentration of 2 mg/mL and vortexed before the TSC was determined according to Le et al. [26]. Briefly, 0.25 mL of each extract was mixed with 0.25 mL of 8% (w/v) vanillin solution and 2.5 mL of 72% (v/v) sulphuric acid. The mixture was vortexed and incubated in a water bath at 60 °C for 15 min and then cooled on ice for 10 min. The absorption of the mixture was measured at 560 nm using a Cary 50 Bio UV–VIS spectrophotometer (Agilent Technologies, Mulgrave, VIC, Australia). Aecsin was used as a standard and the results are expressed as milligram aecsin equivalents (AE) per gram of the FD-TIP (mg AE/g DW).
Total Phenolic Content (TPC)
The FD-TIP was dissolved in water at a concentration of 2 mg/mL and vortexed before the TPC was determined according to the method of Le et al. [26]. Briefly, 0.5 mL of each extract was mixed with 2.5 mL of 10% (v/v) Folin-Ciocalteu’s phenol reagent in water and incubated at ambient temperature for 2 min to equilibrate. Then, 2 mL of 7.5% (w/v) sodium carbonate solution in water was added and the mixture was incubated at ambient temperature for 1 h. The absorption of the reaction mixture was measured at 765 nm using a Cary 50 UV–Vis spectrophotometer. Gallic acid was used as a standard and the results are expressed as milligram gallic acid equivalents (GAE) per gram of the FD-TIP (mg GAE/g DW).

2.2.9. Statistical Analyses

For designing and analysing the RSM experiment, including generating the three-dimensional (3D) surface and two-dimensional (2D) contour plots, the JMP software version 13.0 (SAS, Cary, NC, USA) was used. The adequacy of the RSM second-order polynomial model was determined based on the lack of fit and the coefficient of determination (R2).
For extractions performed in triplicate, the means ± SD were assessed with the IBM SPSS Statistics 24 program (IBM Corp., Armonk, NY, USA) using the Student’s t-test, when only two means were compared, or the one-way analysis of variance (ANOVA) and Tukey’s Post Hoc multiple comparisons test, when more than two means were compared. Differences in means were considered statistically significant at p < 0.05.

3. Results and Discussion

3.1. Extraction with four Aqueous Media

The highest TIA was obtained with the ACN/water/FA extraction media (Table 3). This result was in accordance with the findings of Mahatmanto [13], who reported that the extraction mixture of ACN/water/FA yielded the highest concentration in cyclotides from Gac seeds, some of which are trypsin inhibitors. However, in the present study, a high TPY was also found for this solvent mixture, which reduced the specific TIA to the second lowest value (Table 3).
The solution of 0.1 M NaCl achieved the second highest TIA. However, this solvent extracted a low protein content, which therefore resulted in the highest specific TIA value. The effectiveness of 0.1 M NaCl is consistent with the extraction of TIs from Chenopodium quinoa seeds [16]. DI water also achieved the highest specific TIA; however, it yielded a 35% lower TIA in comparison to 0.1 M NaCl (Table 3) and, therefore, water was less effective than 0.1 M NaCl in the recovery of Gac seed trypsin inhibitors.
The 0.02 M NaOH showed the lowest capacity for extracting trypsin inhibitors from Gac seeds, as evidenced by the lowest specific activity, particularly with the highest protein concentration (Table 3). This is consistent with a study on the extractability of protein from flamboyant seeds [27], which found that their protein was most soluble in NaOH followed by NaCl and then water. The result was also in agreement with Benjakul et al. [28], who reported that the extraction of proteins from cowpea and pigeon pea was markedly increased when alkaline solution was used, compared to NaCl. The increase of protein content was observed when grass pea was solubilised with NaOH solution [17]. There are many factors involved in protein solubility and recovery including protein meal and solvent ratio, particle size of flour, temperature, length of extraction time, pH, ionic strength, type and concentration of extraction as well as the hydration properties of proteins [29]. From the results, 0.1 M NaCl was selected as the extractant for Gac seeds.

3.2. Optimisation of the Extraction Conditions Using RSM

3.2.1. Fitting the Response Surface Model

Table 4 shows the experimental values (Exp.) measured for TIA and TPY and the Exp. values calculated for specific TIA in the extracts prepared as described by the RSM Box–Behnken design in Table 2. From the Exp. TIA values, the response surface model described in Equation (4) was generated and the values predicted (Pred.) for the specific TIA values by this model are also shown in Table 4.
Y = 1.557 0.154 X 1 + 0.041 X 2 0.043 X 3 + 0.014 X 1 2 + 0.234 X 2 2 0.153 X 3 2 + 0.020 X 1 X 2 + 0.063 X 1 X 3 + 0.038 X 2 X 3 ; ( R 2 = 0.98 )
The determination coefficient (R2 = 0.98) and the p value for the lack of fit (0.42), shown in Table 5, indicated that the model for the specific TIA of the 15 extracts (Equation (4)) had a very high and statistically significant fit; there was a 98% fit of the predicted values with the experimental values (Table 4). Therefore, the response surface model for the specific TIA (Equation (4)) was adequate and suitable for describing the effects of and the interactions between the three independent factors, the NaCl concentration of the extraction media, the extraction time and the ratio of defatted powder to extraction media and could be used to determine the optimum values for these extraction parameters.

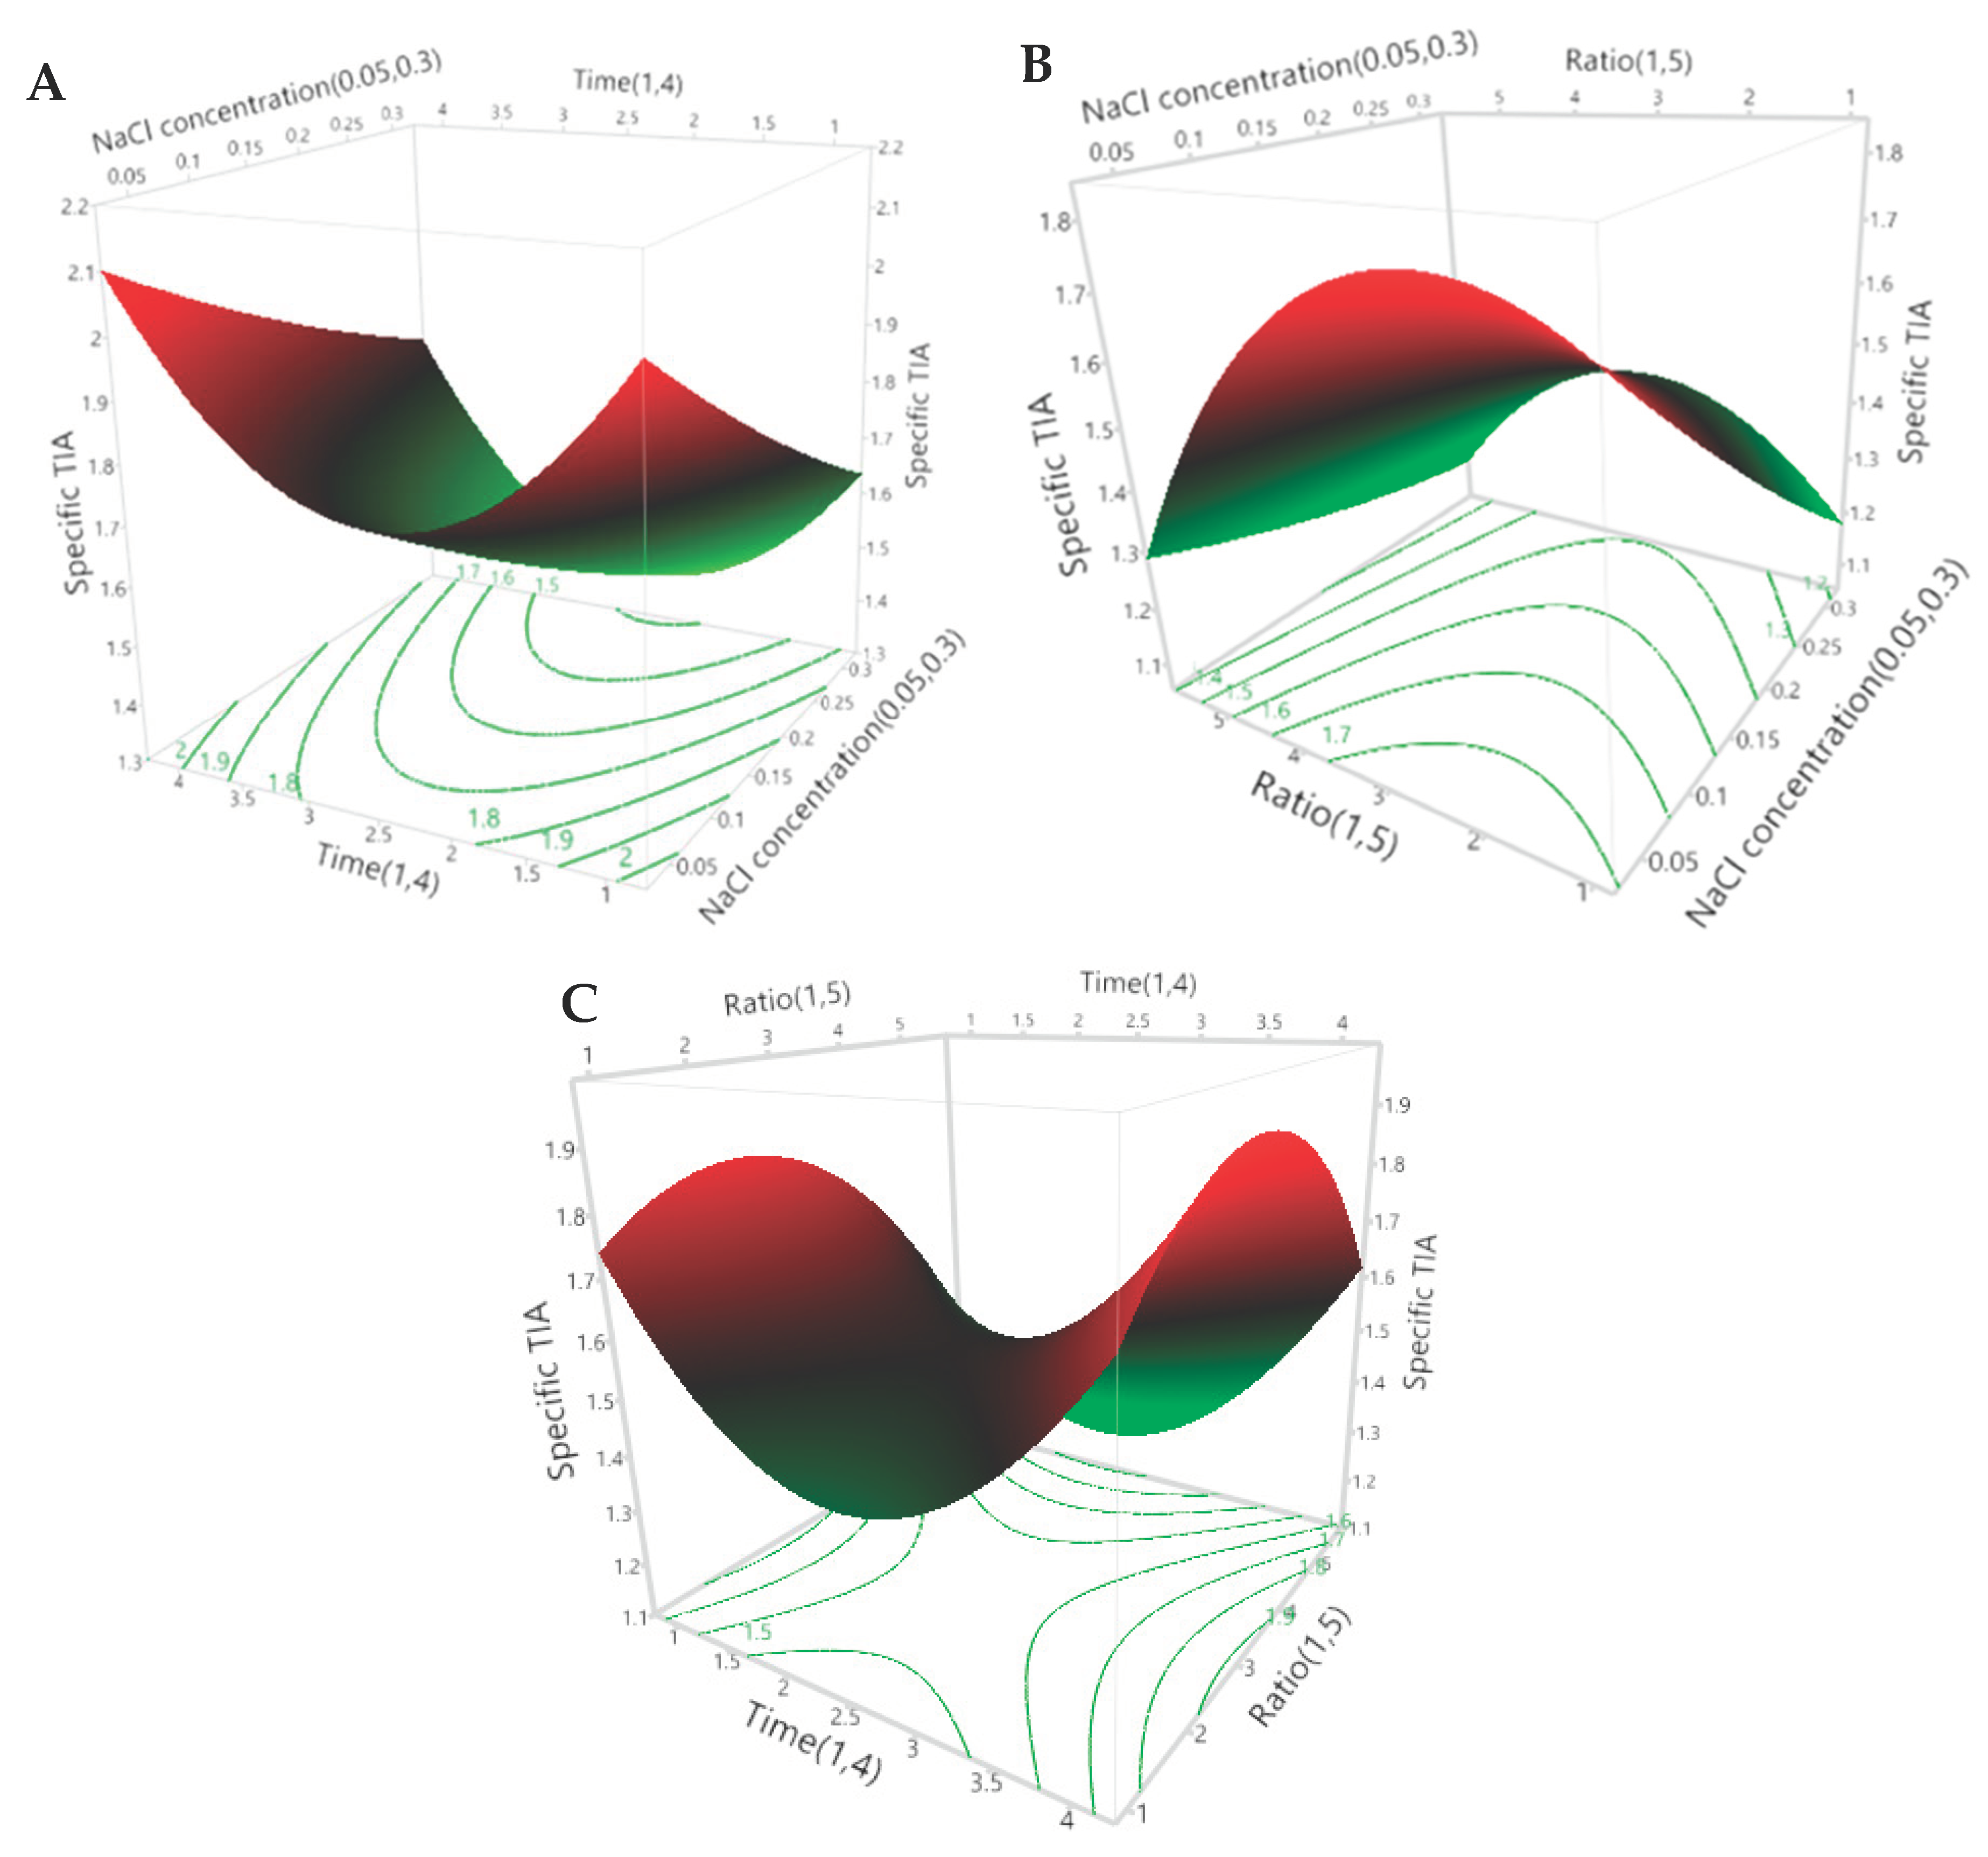
3.2.2. Effects of the Extraction Parameters on the Specific TIA

It can be seen in Table 5 that all three of the extraction parameters had a significant effect on the specific TIA. The NaCl concentration of the extraction media (X1) had a significant inverse linear effect, the extraction time (X2) had a significant positive quadratic effect and the ratio of defatted powder to extraction media (X3) had a significant inverse quandratic effect on the specific TIA of the extracts. However, there were no significant interactive effects between the three parameters. The predicted effects of the three independent extraction parameters are presented visually in the 3D surface and 2D contour plots of Figure 1A–C.

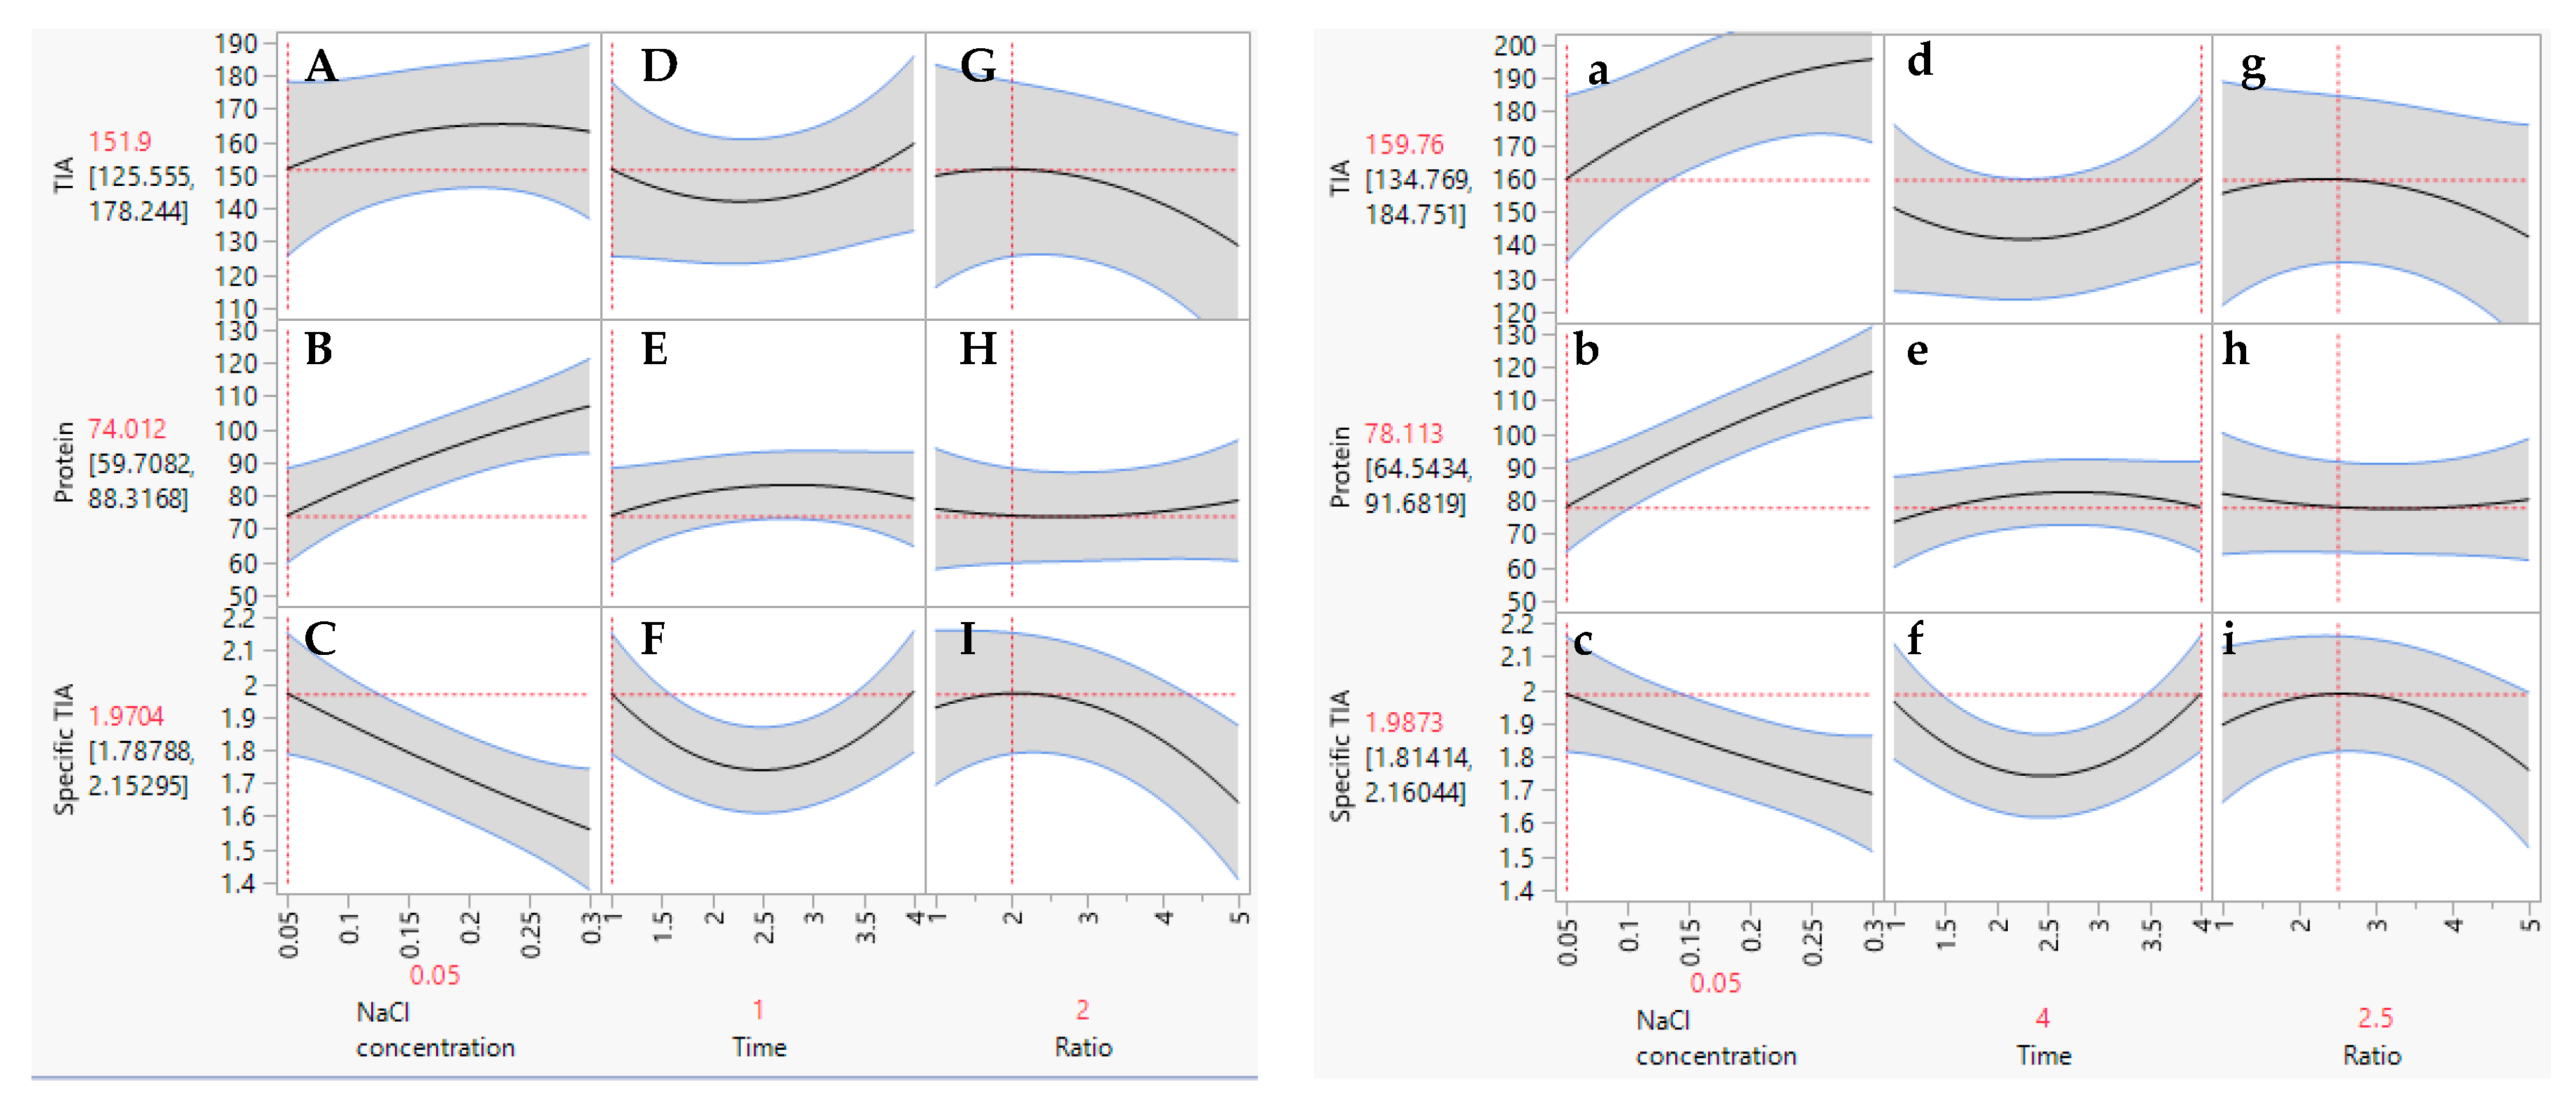
3.2.3. Optimal Extraction Parameters and Validation of the Model

The extraction conditions for obtaining the highest TIA, protein and specific TIA from the defatted Gac kernel powder were generated using the prediction profiler as seen in the plots presented in Figure 2. There were two sets of theoretical maximum values predicted for the extraction parameters to achieve the highest specific TIA. The first optimum set of extraction conditions was 0.05 M NaCl, an extraction time of 1 h and ratio of 2.0 g of defatted powder in 30 mL of the extraction media (Figure 2, left panels). The second optimum set of conditions was 0.05 M NaCl, an extraction time of 4 h and a ratio of 2.5 g/30 mL (Figure 2, right panels). However, for the first set, a much shorter extraction time (1 h) was predicted in comparison to the second set (4 h). Therefore, the first set was chosen as the optimal conditions for the extraction of trypsin inhibitors from the defatted Gac kernel powder (0.05 M NaCl, 1 h extraction with a ratio of 2.0 g/30 mL). Under these optimal condititions, the TIA and specific TIA improved by 8% and 13%, respectively, in comparison to the un-optimal conditions.
To validate the response model (Equation (3)), three independent extractions were conducted for 1 h using a ratio of 2.0 g of defatted powder in 30 mL of 0.05 M NaCl. There was no difference (p = 0.45) between the measured (1.86 ± 0.12 mg trypsin/mg protein) and predicted (1.97 ± 0.19 mg trypsin/mg protein) values for the specific TIA of the extracts. This indicated that the response model (Equation (3)) was valid and reliable, and thus, the conditions (1 h at a ratio of 2.0 g/30 mL 0.05 M NaCl) were used in subsequent studies for the extraction of trypsin inhibitors from the defatted Gac seed kernel powder.

3.3. Heat Treatment of the Optimal TI Extract

The optimal TI extract was subjected to heat treatment (Table 6) to determine whether this preparation was resistant to heat as previously observed for Gac seed TIs [13] and to determine whether its specific TIA could be increased because heat treatment has been used previously to remove protein without loss of TIA [30]. Table 6 shows that the TI extract was mostly resistant to heat treatment with only 13% of the TIA lost. However, there was also only an 11% loss of protein and, therefore, the heat treatment between 60 and 100 °C did not improve the specific TIA of the optimal TI extract (Table 6). This meant that the trypsin inhibitors as well as the other proteins in the extract were stable at these elevated temperatures and suggests that the trypsin inhibitors may be the dominant proteins in the preparation.
The heat stability of the TIs in the present study is consistent with the findings of Mahatmanto [13], who showed that boiling water could be used to successfully extract trypsin inhibitors from Gac seeds. This attribute of the Gac seed trypsin inhibitors is most likely due to their small size and their compact cyclical conformation [4]. Other TIs are also heat stable; for example, the trypsin inhibitor from barley has also been found to be heat stable when exposed to 100 °C for 15 min [31].

3.4. The Physicochemical Properties of the Freeze Dried Trypsin-Inhibitor Powder (FD-TIP)

The physicochemical properties of the powder obtained by freeze-drying the optimal TI extract are shown in Table 7. The dry mass yield for the FD-TIP (16.3 ± 0.1) was higher than that obtained for extracts in previous studies using water (13.1 ± 0.1 g/100 g) [26] and ACN/water/FA (14.3 g/100 g) [13] as the extraction solvents. However, the high value in the present study is likely due to the retention, through the freeze-drying process, of the NaCl in the 0.05 M NaCl extraction media used, which could have added approximately 4.6 g/100 g to the dry mass yield.
As is often seen with freeze-drying [21,32], the moisture content of the FD-TIP was very low (Table 7), which ensure the stability of the powder. Nonetheless, moisture content alone is insufficient to predict the stability and quality of dried products. For example, according to Mai et al. [33], dried Gac fruit powder with a moisture content between 15% and 18% had better physicochemical properties than powder with a moisture content of 6%. Therefore, it is important to understand whether the water in a dried product is available for microbial growth or for enzyme or chemical activity, which can all lead to degradation of the product. Water activity (aw) of a product reflects the free water available for the growing of microbials and chemical reactions. The aw level of 0.18 for the powder in this study can be considered as a low-moisture product with the aw level lower than 0.70, hence having a long shelf life [34]. It is well known that reduced aw protects against microbiological growth and degradation-causing chemical reactions [35]. Generally, the rate of deterioration can be reduced if the water activity is below 0.6 because the growth of moulds and bacteria is inhibited at those levels [36]. The powder prepared in the present study had water activity less than 0.18 (Table 7), and thus, was likely to be microbiologically stable during storage.
The FD-TIP had a high water solubility index (Table 7), which means the powder could be used as a water-based preparation or in water-based products. Its high water solubility is likely due to the aqueous nature of the 0.05M NaCl extraction media; the ionic strength of the proteins thus extracted and the presence of NaCl in the powder most likely both contributed to the powder’s high water solubility [37]. It also suggests that the FD-TIP may have had a small particle size, which also helps solubility [32]. The water solubility index of the FD-TIP was higher than for bitter melon freeze-dried powder (69–79%) [21] and Gac aril spray-dried powder (37%) [38], which suggests it contained more hydrophilic components than these other powders. However, the powder was white in colour and had an acidic pH of 5.3 (Table 7), which is similar to those of the freeze-dried powders from bitter melon [21].
The results on the TIA of the FD-TIP (Table 7) showed that the recovery of trypsin inhibitors and protein were ~67% and 79% compared to the values shown in Table 6 for the control samples, respectively. The 33% and 21% losses may have been due to degradation of the trypsin inhibitors and other proteins occurring during the lengthy concentration (~4 h) and freeze-drying processes or to incomplete resolubilisation of the trypsin inhibitors and other proteins in the FD-TIP powder in water prior to the TIA and protein assays. Compared to the starting material, the defatted powder, the FD-TIP was 4.1-fold and 4.9-fold more concentrated in trypsin inhibitors and protein, respectively (Table 7 vs. Table 6). This means that the specific TIA of the FD-TIP was 16% lower (1.57 ± 0.17 vs. 1.86 ± 0.09) than for the starting material (Table 7 vs. Table 6). This specific TIA was very similar to the activity of the trypsin inhibitor from bovine pancreas (1.5 mg trypsin/mg protein), which is commercially available from Sigma-Aldrich (CAS number 9035-81-8).
The total saponin content of the FD-TIP (Table 7) was comparable to a comercial bitter melon powder (43.6 ± 2.3 vs. 40.2 ± 1.6) [21] but it was higher than for a Gac seed powder previously extracted using deionised water (43.6 ± 2.3 vs. 34.0 ± 1.4) [26]. In contrast, the total phenolic content of the FD-TIP (Table 7) was lower than for the Gac seed powder extracted with the deionised water (10.5 ± 0.3 vs. 17.8 ± 0.5) [26]. This suggests that the saline water used in the present study promoted the extraction of saponins but hindered the extraction of phenolics from the defatted Gac seed kernel powder.

4. Conclusions

Using the RSM and the Box–Behnken system, the optimal conditions for the extraction of trypsin inhibitors from defatted Gac seed kernel powder were determined to be 1 h using a ratio of 2.0 g of defatted powder in 30 mL of 0.05 M NaCl. The powder obtained by freeze-drying the extract prepared using these optimal conditions had a highly specific TIA, although it also contained some saponins and phenolics. The powder was likely to be stable during storage due to its very low moisture content and water activity and to be easily reconstituted in water due to its high water solubility. Therefore, the optimal conditions for the extraction of trypsin inhibitors from defatted Gac seed kernel powder followed by freeze drying gave a high quality trypsin inhibitor-enriched powder.

Supplementary Materials

The following are available online at https://www.mdpi.com/2297-8739/6/1/8/s1.

Author Contributions

Conceptualisation, A.V.L., M.H.N. and P.D.R.; Methodology, A.V.L.; Validation, A.V.L; Formal Analysis, A.V.L.; Investigation, A.V.L.; Data Curation, A.V.L. and P.D.R.; Writing-Original Draft Preparation, A.V.L.; Writing-Review & Editing, P.D.R., M.H.N. and S.E.P.; Supervision, P.D.R., M.H.N. and S.E.P.

Funding

This research received no external funding.

Acknowledgments

AVL acknowledges the University of Newcastle and VIED for their financial support.

Conflicts of Interest

The authors declare no conflict of interest.

Abbreviations

ACNAcetonitrile
awwater activity
BAPNABenzyl-DL-arginine-para-nitroanilide
DIDeionised
DMSODimethyl sulfoxide
DWDry weight
FAFormic acid
FD-TIPFreeze dried trypsin-inhibitor powder
MCoTIMomordica cochinchinensis trypsin inhibitor
RSMResponse surface methodology
TITrypsin inhibitor
TIATrypsin-inhibitor activity
TPCTotal phenolic content
TPYTotal protein yield
TSCTotal saponin content

References

  1. Wong, R.C.; Fong, W.; Ng, T. Multiple trypsin inhibitors from Momordica cochinchinensis seeds, the Chinese drug mubiezhi. Peptides 2004, 25, 163–169. [Google Scholar] [CrossRef] [PubMed]
  2. Huang, B.; Ng, T.; Fong, W.; Wan, C.; Yeung, H. Isolation of a trypsin inhibitor with deletion of N-terminal pentapeptide from the seeds of Momordica cochinchinensis, the Chinese drug mubiezhi. Int. J. Biochem. Cell Biol. 1999, 31, 707–715. [Google Scholar] [CrossRef]
  3. Chan, L.Y.; Wang, C.K.L.; Major, J.M.; Greenwood, K.P.; Lewis, R.J.; Craik, D.J.; Daly, N.L. Isolation and characterization of peptides from Momordica cochinchinensis seeds. J. Nat. Prod. 2009, 72, 1453–1458. [Google Scholar] [CrossRef] [PubMed]
  4. Hernandez, J.F.; Gagnon, J.; Chiche, L.; Nguyen, T.M.; Andrieu, J.P.; Heitz, A.; Hong, T.T.; Pham, T.T.C.; Nguyen, D.L. Squash trypsin inhibitors from Momordica cochinchinensis exhibit an atypical macrocyclic structure. Biochemistry 2000, 39, 5722–5730. [Google Scholar] [CrossRef] [PubMed]
  5. Felizmenio-Quimio, M.E.; Daly, N.L.; Craik, D.J. Circular Proteins in Plants: Solution structure of a novel macrocyclic trypsin inhibitor from Momordica Cochinchinensis. J. Biol. Chem. 2001, 276, 22875–22882. [Google Scholar] [CrossRef] [PubMed]
  6. Birk, Y. Protein proteinase inhibitors in legume seeds-overview. Arch. Latinoam. Nutr. 1996, 44, 26S–30S. [Google Scholar] [PubMed]
  7. Greenwood, K.P.; Daly, N.L.; Brown, D.L.; Stow, J.L.; Craik, D.J. The cyclic cystine knot miniprotein MCoTI-II is internalized into cells by macropinocytosis. Int. J. Biochem. Cell Biol. 2007, 39, 2252–2264. [Google Scholar] [CrossRef] [PubMed]
  8. Contreras, J.; Elnagar, A.Y.; Hamm-Alvarez, S.F.; Camarero, J.A. Cellular uptake of cyclotide MCoTI-I follows multiple endocytic pathways. J. Control. Release 2011, 155, 134–143. [Google Scholar] [CrossRef] [PubMed]
  9. Cascales, L.; Henriques, S.T.; Kerr, M.C.; Huang, Y.-H.; Sweet, M.J.; Daly, N.L.; Craik, D.J. Identification and characterization of a new family of cell-penetrating peptides cyclic cell-penetrating peptides. J. Biol. Chem. 2011, 286, 36932–36943. [Google Scholar] [CrossRef] [PubMed]
  10. Mahatmanto, T.; Mylne, J.S.; Poth, A.G.; Swedberg, J.E.; Kaas, Q.; Schaefer, H.; Craik, D.J. The evolution of Momordica cyclic peptides. Mol. Biol. Evol. 2014, 32, 392–405. [Google Scholar] [CrossRef] [PubMed]
  11. Craik, D.J.; Swedberg, J.E.; Mylne, J.S.; Cemazar, M. Cyclotides as a basis for drug design. Exp. Opin. Drug Discov. 2012, 7, 179–194. [Google Scholar] [CrossRef] [PubMed]
  12. Wang, C.K.; Gruber, C.W.; Cemazar, M.; Siatskas, C.; Tagore, P.; Payne, N.; Sun, G.; Wang, S.; Bernard, C.C.; Craik, D.J. Molecular grafting onto a stable framework yields novel cyclic peptides for the treatment of multiple sclerosis. ACS Chem. Biol. 2013, 9, 156–163. [Google Scholar] [CrossRef] [PubMed]
  13. Mahatmanto, T.; Poth, A.G.; Mylne, J.S.; Craik, D.J. A comparative study of extraction methods reveals preferred solvents for cystine knot peptide isolation from Momordica cochinchinensis seeds. Fitoterapia 2014, 95, 22–33. [Google Scholar] [CrossRef] [PubMed]
  14. Le, A.V.; Parks, S.E.; Nguyen, M.H.; Roach, P.D. Effect of solvents and extraction methods on recovery of bioactive compounds from defatted Gac (Momordica cochinchinensis Spreng.) seeds. Separations 2018, 5, 39. [Google Scholar] [CrossRef]
  15. Klomklao, S.; Benjakul, S.; Kishimura, H.; Chaijan, M. Extraction, purification and properties of trypsin inhibitor from Thai mung bean (Vigna radiata (L.) R. Wilczek). Food Chem. 2011, 129, 1348–1354. [Google Scholar] [CrossRef]
  16. Pesoti, A.R.; de Oliveira, B.M.; de Oliveira, A.C.; Pompeu, D.G.; Gonçalves, D.B.; Marangoni, S.; da Silva, D.A.; Granjeiro, P.A. Extraction, purification and characterization of inhibitor of trypsin from Chenopodium quinoa seeds. Food Sci. Technol. 2015, 35, 588–597. [Google Scholar] [CrossRef]
  17. Deshpande, S.S.; Campbell, C.G. Effect of different solvents on protein recovery and neurotoxin and trypsin inhibitor contents of grass pea (Lathyrus sativus). J. Sci. Food Agric. 1992, 60, 245–249. [Google Scholar] [CrossRef]
  18. Baş, D.; Boyacı, İ.H. Modeling and optimization I: Usability of response surface methodology. J. Food Eng. 2007, 78, 836–845. [Google Scholar] [CrossRef]
  19. Wimalasiri, D.; Piva, T.; Urban, S.; Huynh, T. Morphological and genetic diversity of Momordica cochinchinenesis (Cucurbitaceae) in Vietnam and Thailand. Genet. Resour. Crop Evol. 2016, 63, 19–33. [Google Scholar] [CrossRef]
  20. Box, G.E.P.; Behnken, D.W. Some New Three Level Designs for the Study of Quantitative Variables. Technometrics 1960, 2, 455–475. [Google Scholar] [CrossRef]
  21. Tan, S.P.; Vuong, Q.V.; Stathopoulos, C.E.; Parks, S.E.; Roach, P.D. Optimized aqueous extraction of saponins from bitter melon for production of a saponin-enriched bitter melon powder. J. Food Sci. 2014, 79, E1372–E1381. [Google Scholar] [CrossRef] [PubMed]
  22. Makkar, H.P.; Siddhuraju, P.; Becker, K. Trypsin Inhibitor. Plant Secondary Metabolites; Humana Press: New York, NY, USA, 2007; pp. 1–6. [Google Scholar]
  23. Stauffer, C.E. Measuring trypsin inhibitor in soy meal: Suggested improvements in the standard method. Cereal Chem 1990, 67, 296–302. [Google Scholar]
  24. Lowry, O.H.; Rosebrough, N.J.; Farr, A.L.; Randall, R.J. Protein measurement with the Folin phenol reagent. J. Biol. Chem. 1951, 193, 265–275. [Google Scholar] [PubMed]
  25. Anderson, R. Water absorption and solubility and amylograph characteristics of roll-cooked small grain products. Cereal Chem. 1982, 59, 265–269. [Google Scholar]
  26. Le, A.; Huynh, T.; Parks, S.; Nguyen, M.; Roach, P. Bioactive Composition, Antioxidant Activity, and Anticancer Potential of Freeze-Dried Extracts from Defatted Gac (Momordica cochinchinensis Spreng) Seeds. Medicines 2018, 5, 104. [Google Scholar] [CrossRef] [PubMed]
  27. Marfo, E.; Oke, O. Effect of sodium chloride, calcium chloride and sodium hydroxide on Denolix regia protein solubility. Food Chem. 1989, 31, 117–127. [Google Scholar] [CrossRef]
  28. Benjakul, S.; Visessanguan, W.; Thummaratwasik, P. Isolation and characterization of trypsin inhibitors from some Thai legume seeds. J. Food Biochem. 2000, 24, 107–127. [Google Scholar] [CrossRef]
  29. Sathe, S.; Salunkhe, D. Solubilization and electrophoretic characterization of the Great Northern bean (Phaseolus vulgaris L.) proteins. J. Food Sci. 1981, 46, 82–87. [Google Scholar] [CrossRef]
  30. Hamato, N.; Koshiba, T.; Pham, T.-N.; Tatsumi, Y.; Nakamura, D.; Takano, R.; Hayashi, K.; Hong, Y.-M.; Hara, S. Trypsin and elastase inhibitors from bitter gourd (Momordica charantia LINN.) seeds: purification, amino acid sequences, and inhibitory activities of four new inhibitors. J. Biochem. 1995, 117, 432–437. [Google Scholar] [CrossRef] [PubMed]
  31. Mikola, J.; Suolinna, E.M. Purification and properties of a trypsin inhibitor from barley. Eur. J. Biochem. 1969, 9, 555–560. [Google Scholar] [CrossRef] [PubMed]
  32. Lee, C.-W.; Oh, H.-J.; Han, S.-H.; Lim, S.-B. Effects of hot air and freeze drying methods on physicochemical properties of citrus ‘hallabong’powders. Food Sci. Biotechnol. 2012, 21, 1633–1639. [Google Scholar] [CrossRef]
  33. Mai, H.C.; Truong, V.; Haut, B.; Debaste, F. Impact of limited drying on Momordica cochinchinensis Spreng. aril carotenoids content and antioxidant activity. J. Food Eng. 2013, 118, 358–364. [Google Scholar] [CrossRef]
  34. Blessington, T.; Theofel, C.G.; Harris, L.J. A dry-inoculation method for nut kernels. Food Microbiol. 2013, 33, 292–297. [Google Scholar] [CrossRef] [PubMed]
  35. Tuyen, C.K.; Nguyen, M.H.; Roach, P.D. Effects of pre-treatments and air drying temperatures on colour and antioxidant properties of Gac fruit powder. Int. J. Food Eng. 2011, 7. [Google Scholar] [CrossRef]
  36. Fellows, P.J. Food Processing Technology: Principles and Practice, 4th ed.; Woodhead Publishing: Cambridge, UK, 2009; ISBN 9780081019078. [Google Scholar]
  37. Vojdani, F. Solubility. In Methods of Testing Protein Functionality; Hall, G.M., Ed.; Blackie Academic & Professional: London, UK, 1996; pp. 11–60. [Google Scholar]
  38. Tan, S.P.; Tuyen, K.C.; Parks, S.E.; Stathopoulos, C.E.; Roach, P.D. Effects of the spray-drying temperatures on the physiochemical properties of an encapsulated bitter melon aqueous extract powder. Powder Technol. 2015, 281, 65–75. [Google Scholar] [CrossRef]
Scheme 1. Experimental design for the study. ACN: acetonitrile; FA: formic acid; TIA: trypsin inhibitor activity, TSC: total saponin content, TPC: total phenolic content.
Separations 06 00008 sch001
Figure 1. The 3D response surface and 2D contour plots for the specific trypsin-inhibitor activity (TIA) of the extracts. The effects of the NaCl concentration and the extraction time (A), the NaCl concentration and the ratio of defatted powder to solvent (B) and the extraction time and ratio of defatted powder to solvent (C) on the predicted specific TIA of the extracts are plotted according to the 2nd-order polynomial equation generated by the RSM (Equation (4)).
Separations 06 00008 g001
Figure 2. Prediction profiler plots for TIA, protein and specific TIA relative to NaCl concentration, time, and ratio of defatted powder to solvent. Two sets of optimal conditions were predicted as per the panels on the left (capital letters) and the panels on the right (small letters).
Separations 06 00008 g002
Table 1. Independent factors and their levels for the RSM Box–Behnken design.
LevelsIndependent Factors
X1
NaCl Concentration (mol/L)
X2
Extraction Time (h)
X3
Ratio (g/30 mL)
−10.0501.01.0
00.1752.53.0
+10.3004.05.0
Table 2. Reagent composition in extracted filtrate.
Component (mL)Reagent Blank (a)Standard (b)Sample Blank (c)Sample (d)
DI water110.50.5
Trypsin solution-1-1
Trypsin-inhibitor sample--0.50.5
Trypsin solution after reaction inactivation1-1-
Table 3. Effect of extraction media on the extraction of Gac seed trypsin inhibitors .
Extraction MediaMean ± SD
TIA
(mg trypsin/g Defatted Powder)
TPY
(mg BSA/g Defatted Powder)
Specific TIA
(mg trypsin/mg Protein)
DI Water85.22 ± 0.47 c42.55 ± 3.15 d2.01 ± 0.14 a
0.1 M NaCl140.39 ± 8.33 b80.58 ± 0.65 c1.74 ± 0.11 a
ACN/Water/FA168.11 ± 0.50 a152.44 ± 2.08 b1.10 ± 0.01 b
0.02 M NaOH81.43 ± 2.02 c245.19 ± 1.06 a0.33 ± 0.01 c
The defatted powder was extracted in different media at ambient temperature (17 ± 1 °C) for 1 h. Trypsin-inhibitor activity (TIA) was analysed using BAPNA as a substrate [23,24] and total protein yield (TPY) was determined using the Lowry assay [25]. Different letter superscripts for the values in the same column denote statistically significant differences (p < 0.05).
Table 4. The experimental values for trypsin-inhibiting activity (TIA), total protein yield (TPY) and specific TIA and the predicted values for specific TIA for the extracts produced using a 15 run RSM Box–Behnken design.
RunPatternX1
NaCl (mol/L)
X2
Time (h)
X3
Ratio
(g/30 mL)
TIATPYSpecific TIA
Exp.Exp.Exp.Pred.
1− − 00.0513155.0479.851.941.94
2− + 00.0543156.1979.181.971.98
3+ − 00.313164.01102.431.601.59
4+ + 00.343189.26110.691.711.71
50 − −0.17511152.3993.851.621.68
60 − +0.17515143.5591.791.561.52
70 + −0.17541178.60108.971.641.68
80 + +0.17545177.72102.651.731.67
9− 0 −0.052.51142.6382.311.731.68
10+ 0 −0.32.51168.29130.121.291.24
11− 0 +0.052.55115.6581.721.421.47
12+ 0 +0.32.55145.57118.481.231.28
130000.1752.53167.90105.471.591.56
140000.1752.53147.0299.211.481.56
150000.1752.53163.60102.101.601.56
Table 5. The regression coefficients and their significance values generated from the fitted 2nd order equation for the Box–Behnken design.
Regression CoefficientSpecific Trypsin-Inhibitor Activity (mg trypsin/mg protein)
Regression Coefficient Valuest Ratiop Value
β01.5635.23<0.0001
Linear
β1−0.15−5.680.002
β20.041.520.188
β3−0.04−1.570.177
Quadratic
β110.010.360.74
β220.235.880.002
β33−0.15−3.850.012
Interaction
β120.020.520.623
β130.061.630.163
β230.040.980.372
R20.98
p value of lack of fit0.42
Table 6. Trypsin-inhibitory activity (TIA), total protein yield (TPY) and specific TIA of Gac seed extracts after heating for 10 min at diferent temperatures.
Temperature (°C)Mean ± SD
TIA
(mg trypsin/g DW Defatted Powder)
TPY
(mg BSA/g DW Defatted Powder)
Specific TIA
(mg trypsin/mg Protein)
Control169.46 ± 4.73 a91.17 ± 2.05 a1.86 ± 0.09 a
60155.28 ± 2.29 a84.96 ± 2.64 ab1.83 ± 0.07 a
70149.24 ± 2.58 b83.00 ± 3.09 b1.80 ± 0.06 a
80157.34 ± 6.84 ab84.29 ± 2.15 ab1.87 ± 0.13 a
90147.76 ± 7.98 b81.19 ± 3.34 b1.82 ± 0.05 a
100149.13 ± 7.31 b83.25 ± 2.76 b1.79 ± 0.08 a
The values are means ± SD of triplicate determinations for each temperature. Values in a column not sharing the same superscript letter are significantly different at p < 0.05.
Table 7. Physicochemical properties the trypsin-inhibitor freeze-dried powder.
PropertiesMean ± SD
Dry mass yield (g FD-TIP/100g DW defatted powder)16.3 ± 0.1
Moisture content (%, w/w)0.43 ± 0.08
Water activity0.18 ± 0.07
Water solubility (%)92.4 ± 1.5
pH5.33 ± 0.01
Colour
  L*96.73 ± 0.18
  a*−0.50 ± 0.03
  b*8.22 ± 0.15
Trypsin-ininbitor activity (mg trypsin/g DW FD-TIP)695.6 ± 77.2
Protein content (mg protein/g DW FD-TIP)444.0 ± 21.5
Specific trypsin-inhibitor activity (mg trypsin/mg protein)1.57 ± 0.17
Total saponin content (mg AE/g DW FD-TIP)43.6 ± 2.3
Total phenolic content (mg GAE/g DW FD-TIP)10.5 ± 0.3
FD-TIP: freeze dried trypsin-inhibitor powder; AE: Aescin equivalents; GAE: gallic acid equivalents.

