Communication

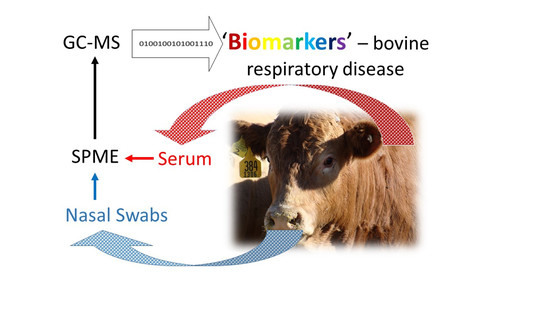
Detection of Volatile Compounds Emitted from Nasal Secretions and Serum: Towards Non-Invasive Identification of Diseased Cattle Biomarkers

1
Department of Agricultural and Biosystems Engineering, Iowa State University, Ames, IA 50011, USA
2
Department of Veterinary Diagnostic and Production Animal Medicine, Iowa State University, Ames, IA 50011, USA
*
Author to whom correspondence should be addressed.
Separations 2018, 5(1), 18; https://doi.org/10.3390/separations5010018
Submission received: 11 January 2018 / Revised: 20 February 2018 / Accepted: 1 March 2018 / Published: 12 March 2018

Abstract

:
Non-invasive diagnostics and finding biomarkers of disease in humans have been a very active research area. Some of the analytical technologies used for finding biomarkers of human disease are finding their use in livestock. Non-invasive sample collection from diseased cattle using breath and headspace of fecal samples have been reported. In this work, we explore the use of volatile organic compounds (VOCs) emitted from bovine nasal secretions and serum for finding biomarkers for bovine respiratory disease (BRD). One hundred nasal swabs and 100 serum samples (n = 50 for both ‘sick’ and ‘healthy’) were collected at the time of treatment for suspected BRD. Solid-phase microextraction (SPME) was used to collect headspace samples that were analyzed using gas chromatography-mass spectrometry (GC-MS). It was possible to separate sick cattle using non-invasive analyses of nasal swabs and also serum samples by analyzing and comparing volatiles emitted from each group of samples. Four volatile compounds were found to be statistically significantly different between ‘sick’ and ‘normal’ cattle nasal swabs samples. Five volatile compounds were found to be significantly different between ‘sick’ and ‘normal’ cattle serum samples, with phenol being the common marker. Future studies are warranted to improve the extraction efficiency targeting VOCs preliminarily identified in this study. These findings bring us closer to the long-term goal of real-time, animal-side detection and separation of sick cattle.

Graphical Abstract

1. Introduction

Non-invasive diagnostics and finding biomarkers of disease in humans have been a very active research area [1,2,3]. Some of the analytical technologies used for finding biomarkers of human disease are finding their use in livestock [4,5,6,7,8]. Non-invasive sample collection from diseased cattle using breath [4,5,6] and headspace of fecal samples [7] have been reported. In this work, we explore the use of volatile organic compounds (VOCs) emitted from bovine nasal secretions and serum for finding biomarkers for bovine respiratory disease (BRD).
BRD is not caused by ‘a’ pathogen—it is a multi-factorial complex that involves various combinations of physiological stress, animal mismanagement, assorted bacterial and viral pathogens, and inclement weather conditions [9,10]. BRD is the most costly disease condition found in feedyards in the U.S. with losses occurring in the form of decreased feeding performance, increased death loss and treatment costs, and lower carcass value at the time of harvest [11]. Various strategies have been utilized to mitigate the losses associated with BRD with varying results [9,12]. Vaccination strategies have been combined with antibiotic therapy to minimize pathogen exposure and spread within groups of calves. Improved nutritional practices have attempted to optimize feed efficiency while minimizing the metabolic effects of sub-acute acidosis. Even with these advancements, the feedlot industry in the U.S. continues to see only marginal improvement in the overall morbidity and mortality levels due to BRD.
Recently, interest has grown in the identification of metabolic markers for various disease conditions in cattle using metabolomics. Metabolomics (proteomics) is the study of either primary or secondary metabolites of a biological system and their changes to better understand system responses to disease and other influences or manipulations on that biological system [13,14]. Body fluids are composed of various electrolytes, hormones, and especially its proteome that may contain information about feeding status, nutritional requirement, and adaptations to diet and environment, and also about the health status of the animal. Biological fluids, oral fluids, serum, and plasma can be harvested and analyzed to map changes to cellular biology to better understand the effect that outside factors have on a biological system.
A recent review of the relative strengths and weaknesses of the main proteomic techniques used in human and animal studies is published [13]. These techniques included liquid or gas chromatography-mass spectrometry (GC-MS), matrix-assisted laser desorption ionization-time of flight mass spectrometry (MALDI-TOF/MS), and nuclear magnetic resonance (NMR). GC-MS gives the best overall view of primary metabolism in a biological system. The majority of metabolites found in the GC-MS data are lower molecular weight, primary metabolites, and those from core metabolic processes including amino acid metabolism, fatty acid metabolism, tricarboxylic acid (TCA) cycle, and glycolysis.
Saliva has been widely used in swine as a diagnostic sample to monitor disease status and metabolic state [14]. Metabolomic studies involving cattle have utilized milk, rumen fluid, urine, serum, and plasma to evaluate the presence of ketosis, heat stress, odor generation, feed digestion, and transition time in dairy cattle [15,16,17,18,19]. One study focused on differences in metabolomic profiles between young dairy calves with acute bronchopneumonia and normal contemporaries [20]. Plasma was collected from these calves and NMR was utilized to detect differences between the two groups. These groups had two distinctly different and distinguishable metabolic fingerprints using both water soluble and lipid extracts. Alterations in various metabolites were meaningful for pathogenic mechanisms of calf bronchopneumonia.
Since this type of profiling study had yet to be performed in a feedlot environment in the U.S., this research aimed to evaluate metabolomic profiles from nasal secretions and serum between healthy calves and those affected with acute BRD. The main objective of this research was to identify ‘sick’ and ‘normal’ (healthy) cattle using headspace analyses of (1) nasal swabs and (2) serum samples for volatile compounds with GC-MS. Our working hypothesis was that headspace gases of nasal swabs, and serum samples have the distinct signature of VOCs between cattle diagnosed as sick and healthy.

2. Materials and Methods

2.1. Sample Collection

A total 200 samples from cattle (i.e., 100 nasal swab and 100 serum; n = 50 for both ‘sick’ and ‘healthy’ of each) were collected at the time of treatment for suspected BRD. Cattle were identified in pen as morbid if they showed signs such as depression, reduced rumen fill, increased respiratory effort, and/or discharge from the eyes and nose. Cattle identified as morbid (sick) were pulled from the pen and taken to the treatment chute for further evaluation. Once in the chute, a rectal temperature was taken by an M700 thermometer (GLA Agricultural Electronics, San Luis Obispo, CA, USA) and a lung score was assessed by a veterinary stethoscope (Whisper, Plymouth, MN, USA). Cattle with a rectal temperature of greater than or equal to 40 °C (104 F) and a lung score greater than or equal to 2 (on a five-point scale) were deemed ‘sick’ and were used for sample collection. Setup for sample collection is shown in Figure S1 (Supplementary Material).
Nasal secretions were collected by using a facial tissue grasped within a hemostat to swab the inside of one nostril (Figure S2). The tissue was then placed inside of a 35 mL syringe and the liquid squeezed from the tissue by depressing the plunger. Small aliquot of liquid (0.25 mL) from the tissue was collected into a clean 10 mL vial. Hemostats were washed in distilled water and then 75% isopropyl alcohol between each calf that was sampled. Blood was collected from the tail vein via needle and syringe (Figure S3). Blood was then immediately transferred into a 10 mL serum blood collection vacutainer (BD Vacutainer, Franklin Lakes, NJ, USA). Serum vacutainers were centrifuged no longer than 30 min after collection. After centrifuge, serum was poured away from the clot and into clean 10 mL vials. The 10 mL vials with samples were used later for headspace solid-phase microextraction (SPME). Samples were placed in dry ice immediately after processing chute-side. At the end of each sample collection day, all samples were placed into a freezer and maintained between −66 and −71 °C. Samples remained in the freezer until they were analyzed.
Samples from ‘healthy’ cattle were collected from a random sample of cattle receiving their terminal growth implant. Nasal secretions and blood from ‘healthy’ cattle were collected, processed, and stored in the same manner as nasal secretions and blood from the ‘sick’ cattle.

2.2. Volatile Organic Compounds

Chemical analyses of nasal secretion and serum samples were completed using the multidimensional gas chromatograph–mass spectrometer–olfactometer (MDGC-MS-O) system (no multidimensional mode was used or olfactometry was performed for this research). A two cm 50/30 µm DVB/Carboxen/PDMS (57348-U, Supelco, Bellefonte, PA, USA) SPME fiber was used for all samples to extract and pre-concentrate volatile organic compounds (VOCs) from samples. Samples were collected by headspace extraction with SPME. The SPME procedure was performed with a robotic CTC Combi PAL™ LEAP GC autosampler (LEAP Technologies, part of Trajan Family, Inc., Carrboro, NC, USA) equipped with a heated agitator. For each sample, the automated sequence started by transferring the headspace vial to the agitator, set to 37 °C, and the vial was equilibrated at this temperature for 10 min with 250 rpm agitation. The equilibration was followed by exposing the SPME fiber to the headspace of the vial for 45 min while agitating at 250 rpm. After the exposition period, the SPME fiber with extracted odorants was immediately inserted into the 250 °C GC injector for 2 min for thermal desorption, sample introduction, odorant separation, and analysis [7].
The MDGC-MS-O (Microanalytics, a part of Volatile Analysis Corporation, Round Rock, TX, USA) was equipped with two columns connected in series. The non-polar pre-column was 30 m, 0.53 mm i.d.; film thickness, 0.50 µm with 5% phenyl polysilphenylene siloxane stationary phase (SGE BPX-5) and operated with constant pressure mode at 11.2 psi (0.76 atm). The polar analytical column was a 30 m × 0.53 mm bonded polyethylene glycol (PEG) embedded in a synthetic glass (SGE SolGel-Wax) at a film thickness of 0.50 µm. System automation and data acquisition software were MultiTraxTM V. 10.1 (Microanalytics® A part of Volatile Analysis Corporation, Round Rock, TX, USA) and ChemStation™ (Agilent Technologies, Santa Clara, CA, USA). The general GC run parameters used were as follows: injector, 250 °C; column, 40 °C initial, 3 min hold, 7 °C/min ramp to 240 °C final, 8.43 min hold; carrier gas, UHP-grade helium (99.999%). The GC was operated in a constant pressure mode where the mid-point pressure—i.e., the pressure between pre-column and analytical column—was always at 5.7 psi (0.39 atm) and the heart-cut sweep pressure was 5.0 psi. The MS full scan range was 34 to 350 m/z. The quadrupole MS was set to electron ionization (EI) mode with ionization energy of 70 eV. MS tuning was performed using the default autotune setting using perfluorotributylamine (PFTBA) daily.

2.3. Statistical Analyses

The standard least squares in a REML method, in JMP System (version Pro 12, SAS Institute, Inc., Cary, NC, USA) was used to analyze the data and determine the p-values. A significance level of 0.05 was used as the cut off for statistical significance.

3. Results

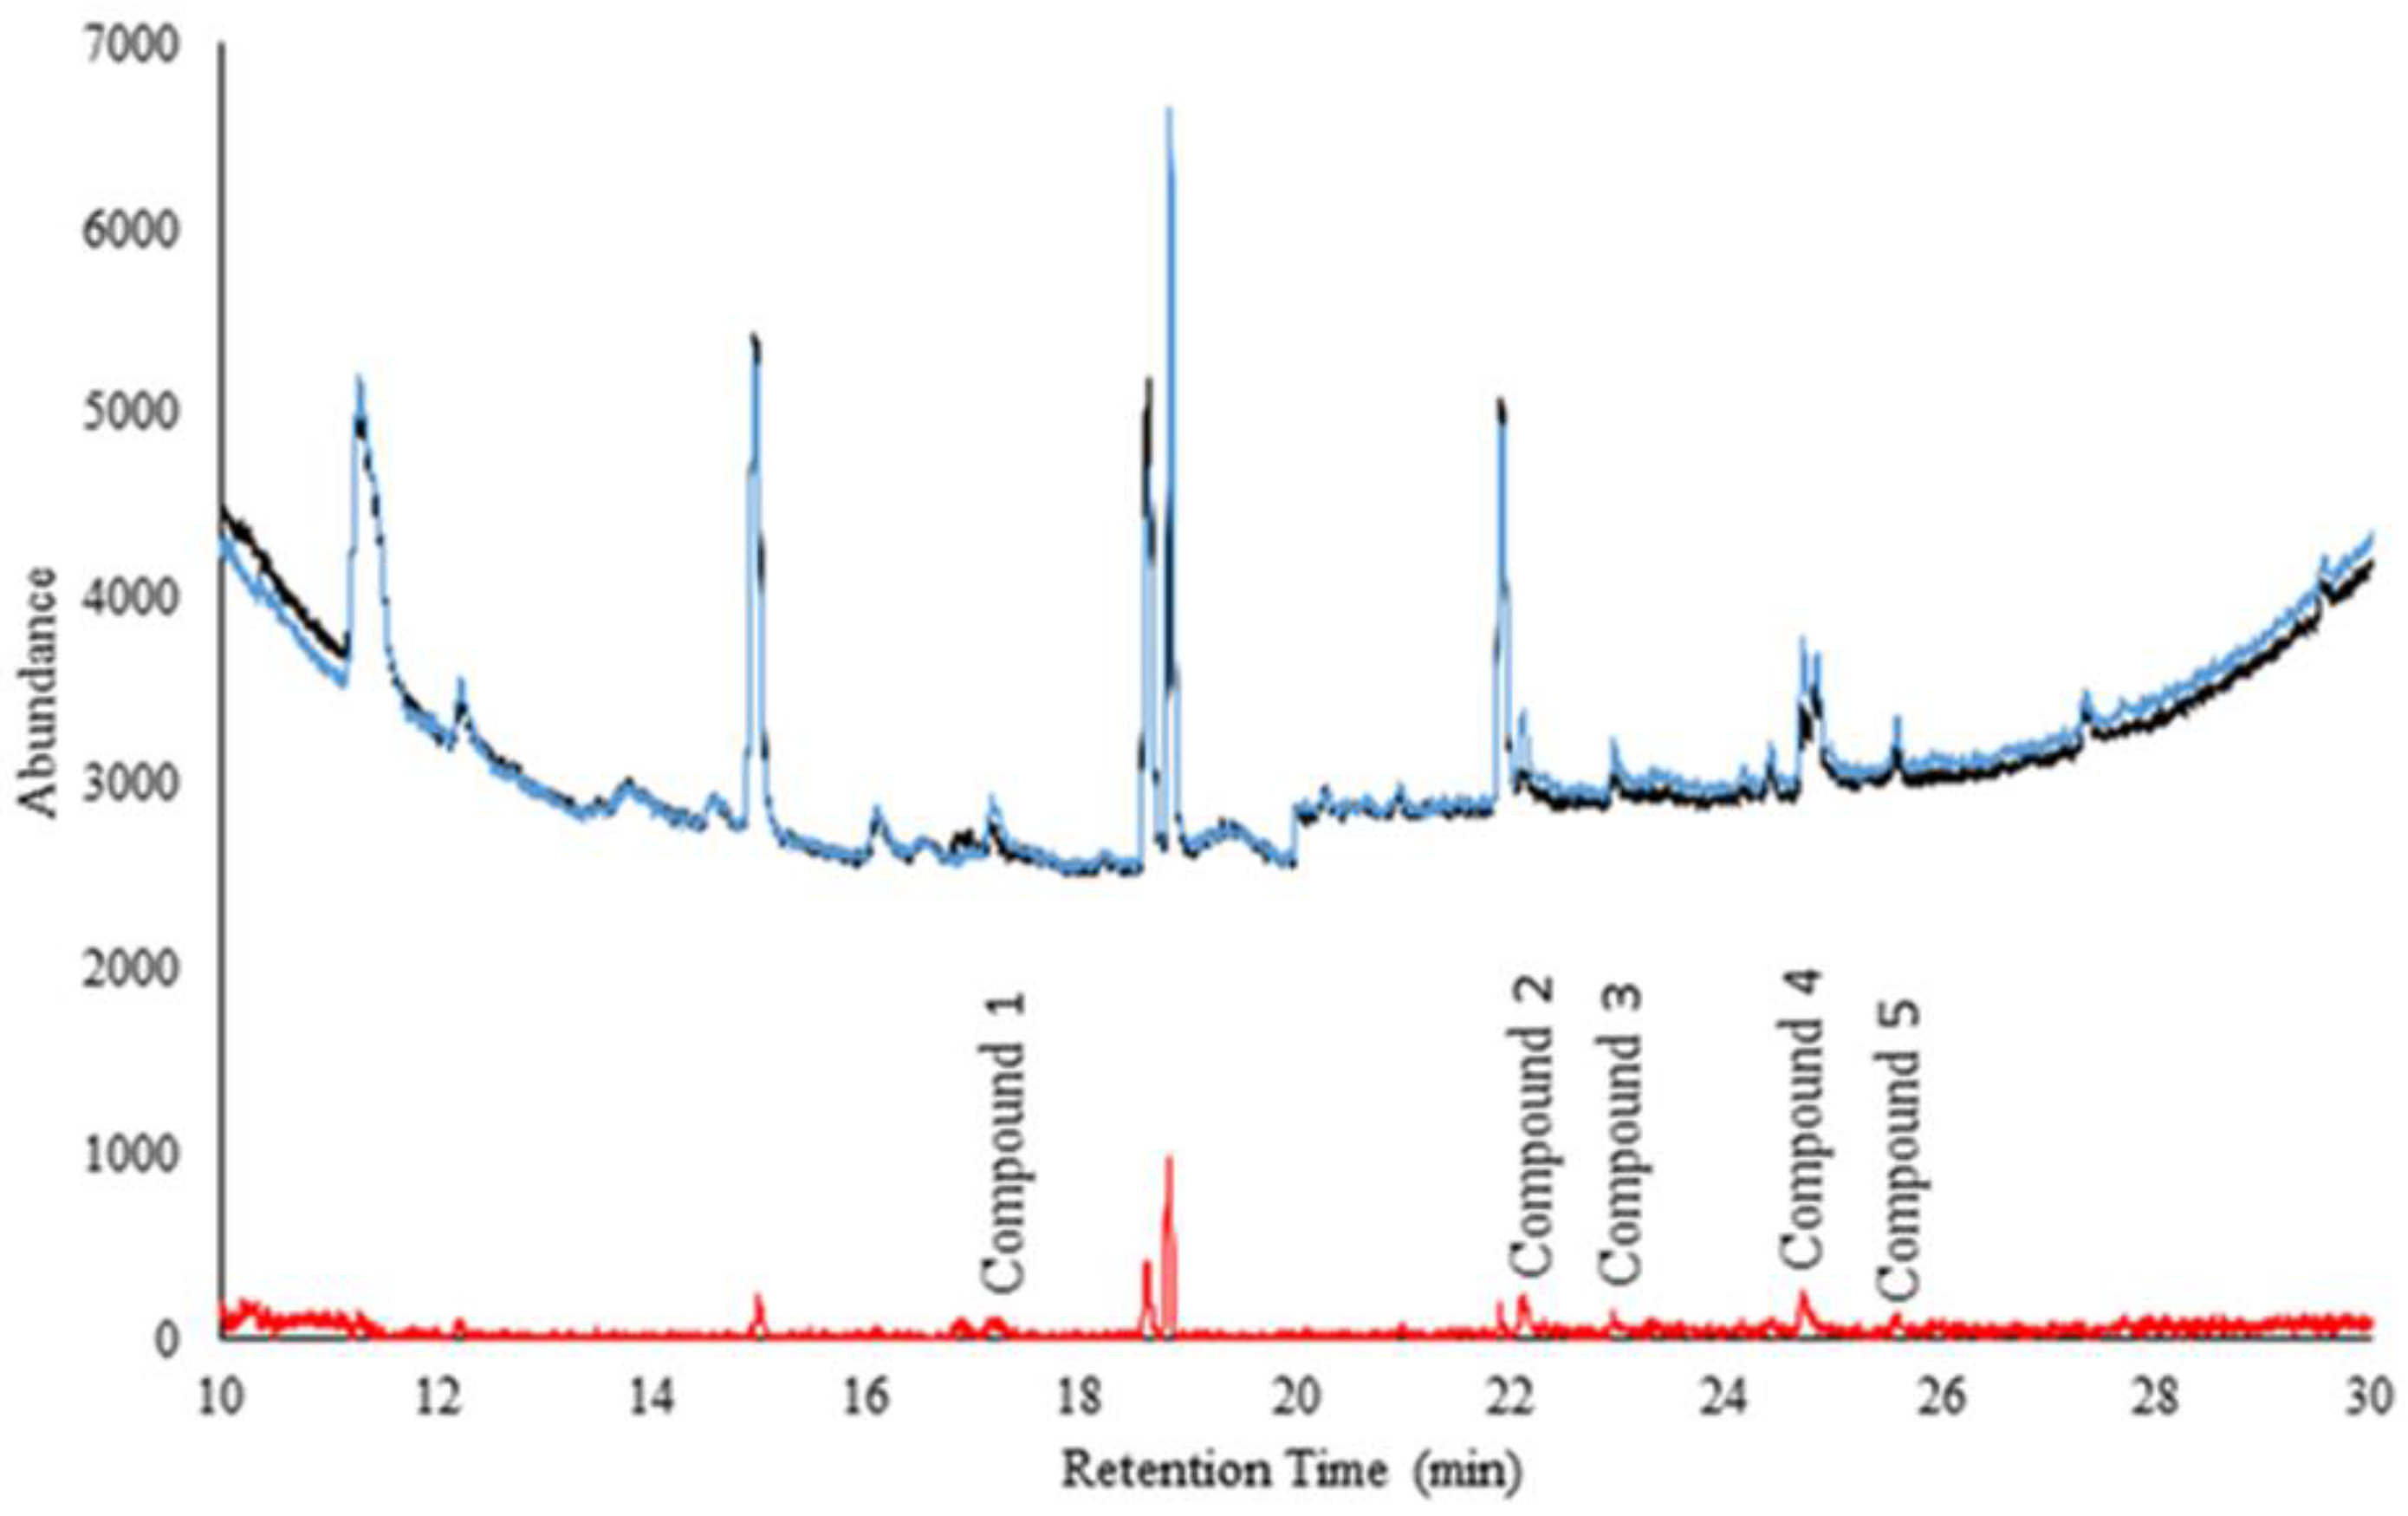
3.1. Cattle Nasal Swabs
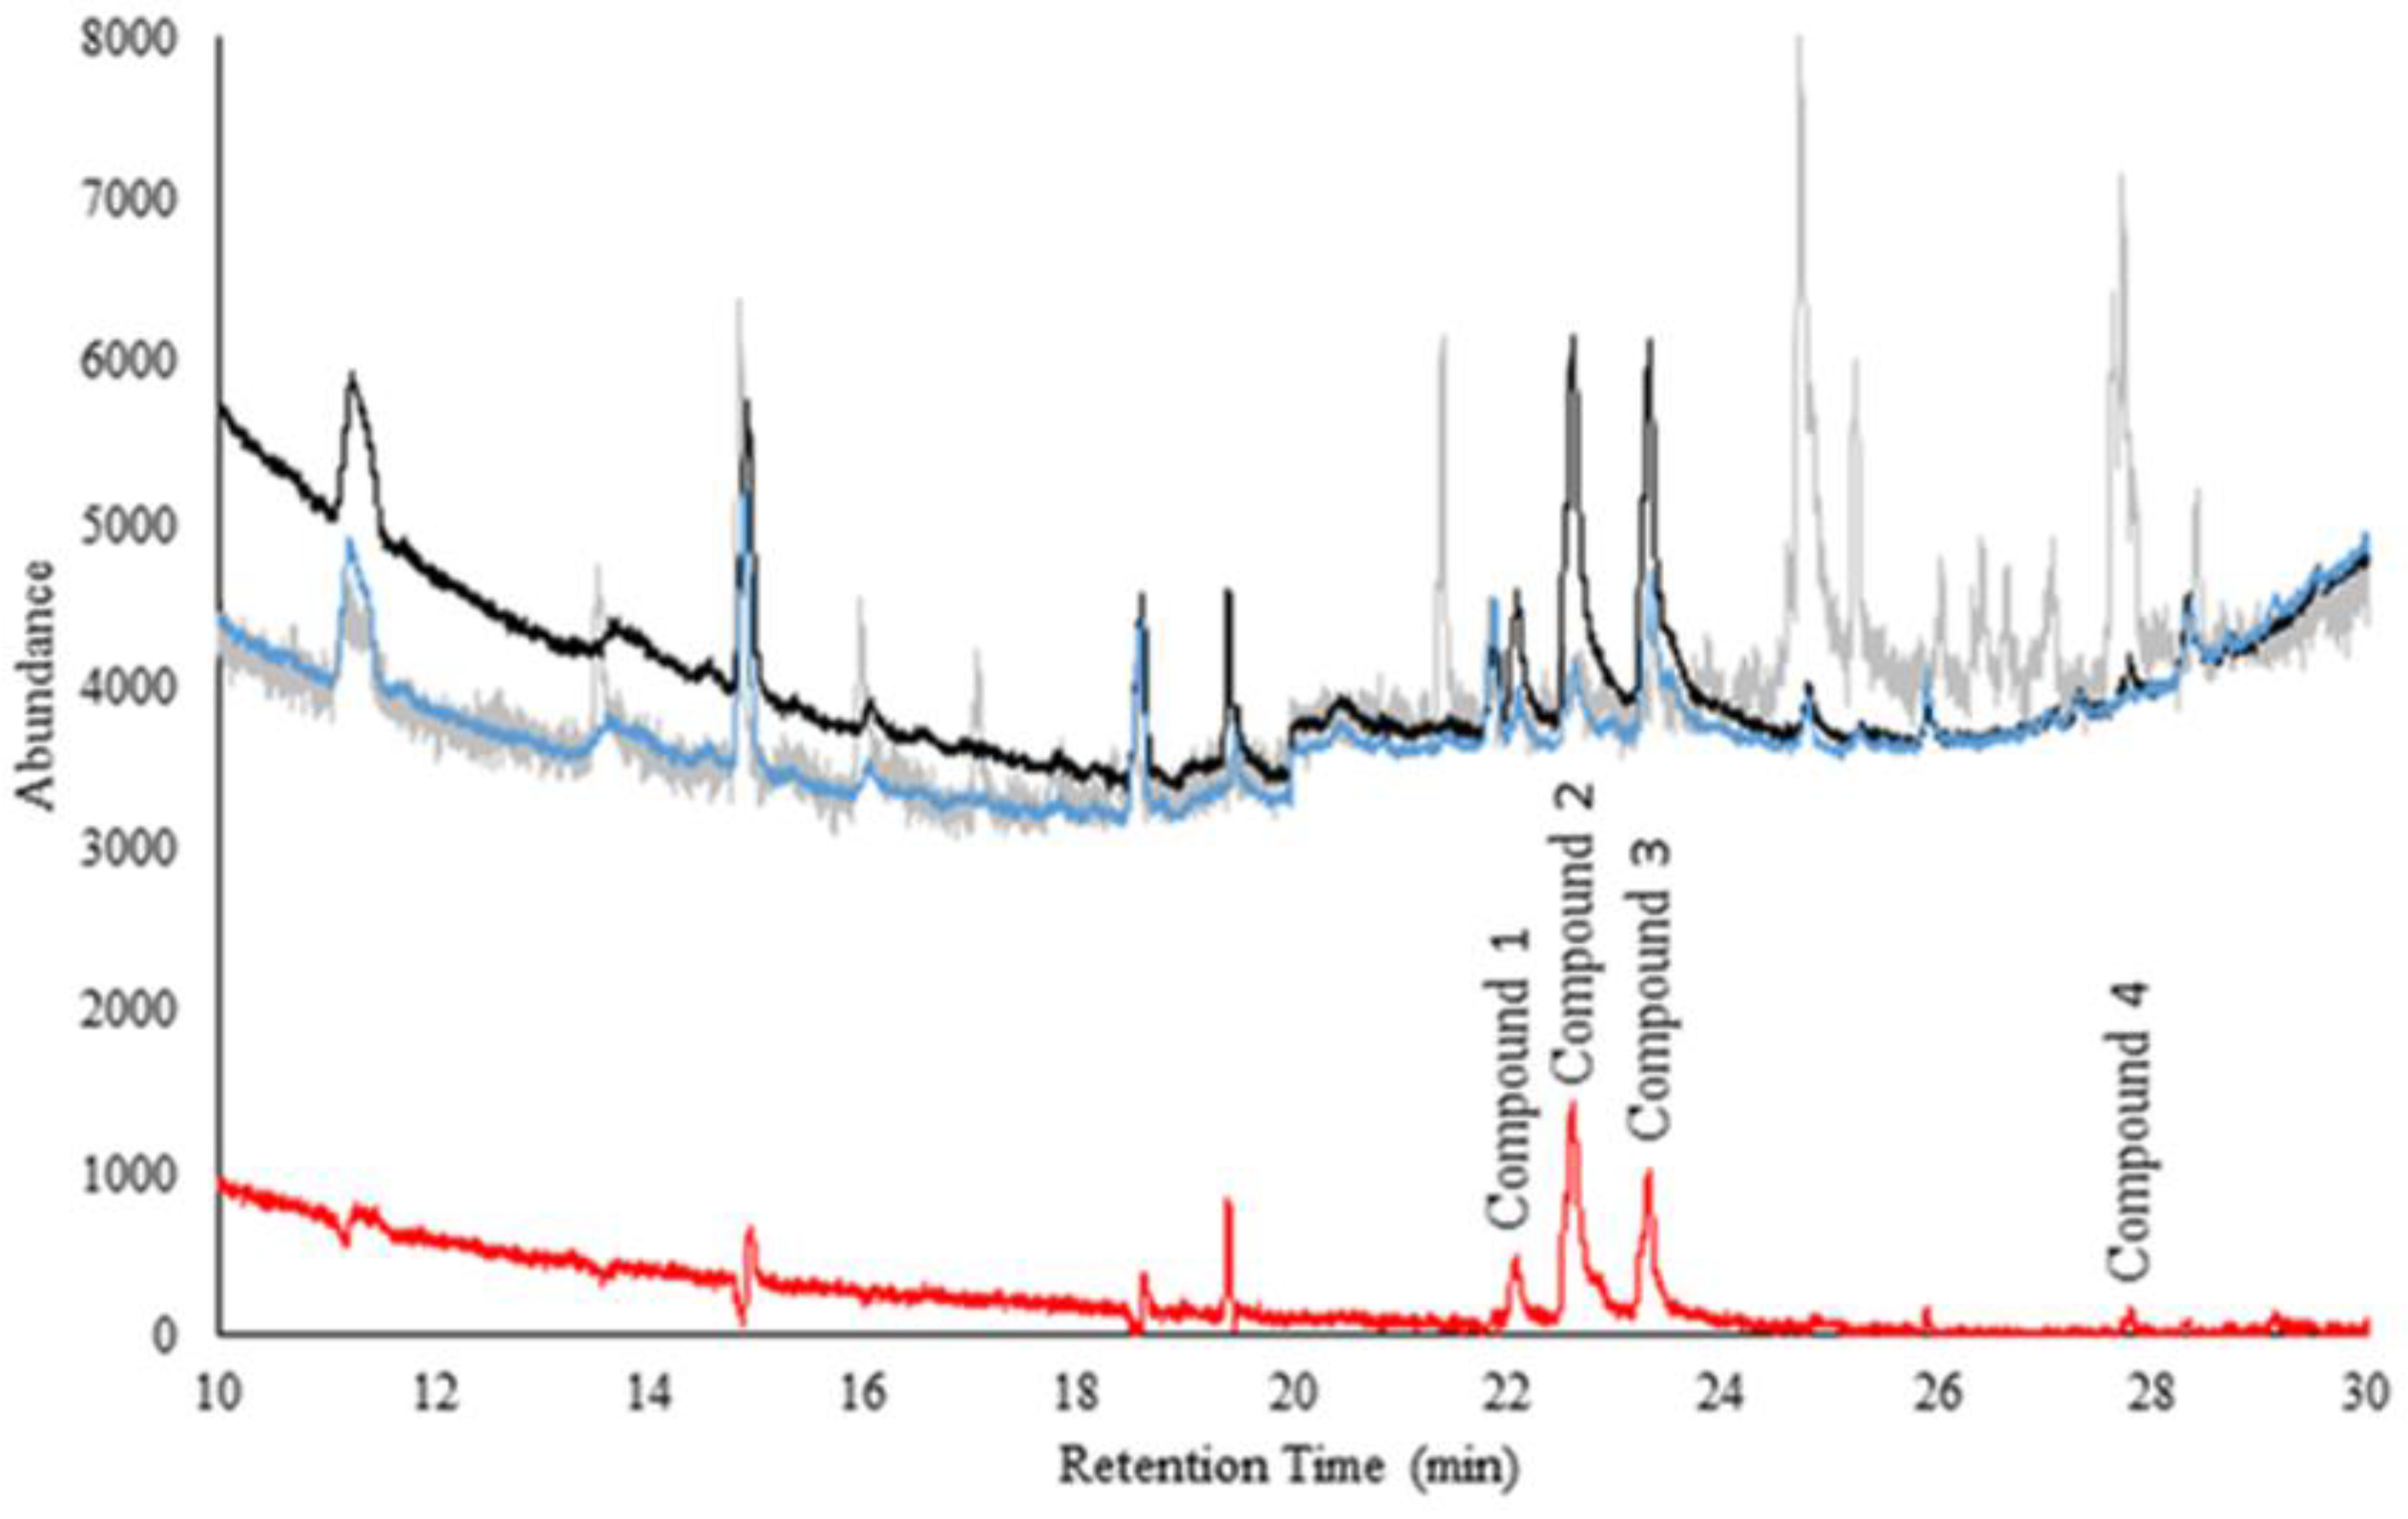
Figure 1 shows the comparison of averaged chromatograms of headspace over (n = 50 and n = 50) nasal swab samples from ‘sick’ and ‘healthy’ cattle. The difference (shown in red) illustrates the preliminary separation of disease markers.
Compounds 14 are significantly different (peak areas) between the ‘sick’ and ‘healthy’ cattle samples (p = 0.001, p < 0.0001, p < 0.0001 and p = 0.0358, respectively). It is remarkable to note that statistical differences were obtained considering the complexity of nasal secretions and possible confounding compounds. Table 1 shows a summary of the preliminary ID of compounds, CG column retention time, spectral match and the top five most intense ions. Phenol and p-cresol were identified also using match with neat standards for these compounds. Since the multidimensional GC-MS has two columns connected in series, it is difficult to use a routine Kovats index system to further improve the quality of preliminary identification. Thus, the top five ions distribution carries the useful spectral information for future comparisons. More research is warranted to confirm these findings.

3.2. Cattle Serum

Figure 2 shows the comparison of averaged chromatograms of headspace over (n = 50 and n = 50) serum samples from ‘sick’ and ‘healthy’ cattle. The difference (shown in red) illustrates the preliminary separation of disease markers.
Compounds 15 are significantly different (peak areas) between the ‘sick’ and ‘healthy’ cattle samples (p = 0.0268, p < 0.0033, p < 0.0326, p = 0.0049, and p = 0.0266 respectively). It is remarkable to note that statistical differences were obtained considering the complexity of serum and possible confounding compounds. Table 2 shows a summary of the preliminary ID of compounds, CG column retention time, spectral match, and the top five most intense ions. Phenol was positively identified with the column retention time match to its neat standard. Phenol was one common marker compound between headspace of nasal swabs and serum samples.

4. Discussion

Similar to earlier studies [4,5,7,8], the headspace SPME-GC-MS sampling, sample preparation, and analysis have shown to be useful in elucidating statistically significant differences in compound profiles from ‘sick’ and ‘healthy’ cattle. The same approach was used to study marking fluids of wild cats and plant-insect interactions [21,22,23]. Volatile organic compounds that are feasible to extract, separate and detect via relatively simple headspace SPME extraction followed by analyses using GC-MS can provide an initial glance for identifying the scope of biomarker candidates emitted from both cattle nasal swabs and serum samples. Preliminary markers in both types of samples were different except phenol which was expected considering animal metabolism and therefore expressions of compounds in different media. Future studies are warranted to improve further the extraction efficiency targeting VOCs that were preliminarily identified in this study, including identification and quantification. Research towards real-time detection of selected VOCs using portable, field-ready for animal-side capable (e.g., maximum 30 s to 5 min long cattle retention/processing in feedlot chute), and minimally invasive sampling methods is warranted.
The phenolic compounds (phenol and p-cresol) identified in the both nasal secretions and serum could simply represent the presence of the parent compound [24,25,26,27,28]. These compounds may be directly produced by certain gastrointestinal bacteria via the metabolism of tyrosine, associated with kidney failure, protein breakdown, or fatty liver disease. It is of interest to note that creatinine, which is commonly used to in cattle to evaluate muscle catabolism also is a phenolic compound. Diphenyl ether could also be included in this group as this compound may be produced from phenol ethers. It is possible that there are multiple other phenolic compounds that went undetected or the assay was not sensitive enough to differentiate between metabolites within this family.
Other metabolites identified in this research appear to be more distinct in their identification and action. 5-Octadecenal is a fatty aldehyde lipid molecule that can be ingested with grain diets and has the potential to serve as an energy source [24,25,26]. It has also been utilized as an estrus biomarker in buffalo [29]. TMC is an endogenous biomarker that is produced in the biosynthesis of steroids, cell signaling, membrane stabilization, and energy metabolism [24,25,26]. Benzothiazole can be found in cranberries and persimmons and has multiple physiological properties [24,25,26]. There is evidence to support that this compound may be produced by rumen bacteria. It is also closely related structurally to the benzimidazoles which is a class of anthelmintics commonly used in cattle. However, some caution must be used when evaluating these compounds within human-based libraries such as the HMBD (human metabolome database).

5. Conclusions

Four volatile compounds were found to be significantly different between ‘sick’ and ‘healthy’ cattle nasal swabs samples. Five volatile compounds were found to be significantly different between ‘sick’ and ‘healthy’ cattle serum samples. Phenol was identified as the only common compound between the two types of samples. Future work would include verifying compound identifications, quantification, and development of methods for rapid, animal-side VOC detection that could be used for diagnostics.

Supplementary Materials

The following are available online at https://www.mdpi.com/2297-8739/5/1/18/s1: Figure S1. Set up for nasal swabs and serum sample collection. Figure S2. Nasal swab collection tools. Figure S3. Blood collection from the tail vein.

Acknowledgments

This research was partially supported by the Iowa Agriculture and Home Economics Experiment Station, Ames, Iowa. Project no. IOW05400 (Animal Production Systems: Synthesis of Methods to Determine Triple Bottom Line Sustainability from Findings of Reductionist Research) is sponsored by Hatch Act and State of Iowa funds. This research was also partially supported by Boehringer Ingelheim Animal Health, Duluth, GA, USA).

Author Contributions

D.L.M., J.A.K., T.J.E., and V.L.C. conceived and designed the experiments; T.J.E. and J.L.F. performed the experiments; D.L.M. and J.A.K. analyzed the data; T.J.E., J.A.K., and V.L.C. contributed reagents/materials/analysis tools; D.L.M., J.A.K., T.J.E., J.L.F., and V.L.C. wrote the paper.

Conflicts of Interest

The authors declare no conflict of interest. The founding sponsors had no role in the design of the study; in the collection, analyses, or interpretation of data; in the writing of the manuscript, or in the decision to publish the results.

References

  1. Wang, A.; Wang, C.P.; Tu, M.; Wong, D.T. Oral Biofluid Biomarker Research: Current Status and Emerging Frontiers. Diagnostics 2016, 6, 45. [Google Scholar] [CrossRef] [PubMed]
  2. Majem, B.; Rigau, M.; Reventós, J.; Wong, D.T. Non-Coding RNAs in Saliva: Emerging Biomarkers for Molecular Diagnostics. Int. J. Mol. Sci. 2015, 16, 8676–8698. [Google Scholar] [CrossRef] [PubMed]
  3. Rapado-González, Ó.; Majem, B.; Muinelo-Romay, L.; López-López, R.; Suarez-Cunqueiro, M.M. Cancer Salivary Biomarkers for Tumours Distant to the Oral Cavity. Int. J. Mol. Sci. 2016, 17, 1531. [Google Scholar] [CrossRef] [PubMed]
  4. Spinhirne, P.J.; Koziel, J.A.; Chirase, N. Sampling and analysis of VOCs in bovine breath using solid-phase microextraction and gas chromatography-mass spectrometry. J. Chrom. A 2004, 1025, 63–69. [Google Scholar] [CrossRef]
  5. Spinhirne, P.J.; Koziel, J.A.; Chirase, N. A device for noninvasive on-site sampling of cattle breath with solid phase microextraction. Biosyst. Eng. 2003, 84, 239–246. [Google Scholar] [CrossRef]
  6. Ellis, C.K.; Stahl, R.S.; Nol, P.; Waters, W.R.; Palmer, M.V.; Rhyan, J.C.; VerCauteren, K.C.; McCollum, M.; Salman, M.D. A Pilot Study Exploring the Use of Breath Analysis to Differentiate Healthy Cattle from Cattle Experimentally Infected with Mycobacterium bovis. PLoS ONE 2014, 9, e89280. [Google Scholar] [CrossRef] [PubMed]
  7. Ellis, C.K.; Rice, S.; Maurer, D.; Stahl, R.; Waters, W.R.; Palmer, M.V.; Nol, P.; Rhyan, J.C.; VerCauteren, K.C.; Koziel, J.A. Use of fecal volatile organic compound analysis to discriminate between non-vaccinated and BCG—Vaccinated cattle prior to and after Mycobacterium bovis challenge. PLoS ONE 2017, 12, e0179914. [Google Scholar] [CrossRef] [PubMed]
  8. Maurer, D.; Ellis, C.; Thacker, T.; Rice, S.; Koziel, J.A.; VerCauteren, K.C.; Nol, P. Screening of microbial volatile organic compounds for detection of disease in cattle: Development of lab-scale method. Sci. Rep. 2018. under review. [Google Scholar]
  9. Smith, R.A. Factors Influencing Bovine Respiratory Disease in Stocker and Feedlot Cattle. In Proceedings of the American Association of Bovine Practitioners Annual Meeting, Albuquerque, NM, USA, 19–21 August 2010; Volume 43, pp. 10–15. [Google Scholar]
  10. Griffin, D.D. The monster we don’t see: Subclinical BRD in beef cattle. Anim. Health Res. Rev. 2014, 15, 138–141. [Google Scholar] [CrossRef] [PubMed]
  11. Busby, D. Tri-County Steer Carcass Futurity Data. In Proceedings of the American Association of Bovine Practitioners Annual Meeting, Albuquerque, NM, USA, 19–21 August 2010; Volume 43, pp. 71–81. [Google Scholar]
  12. Reinhardt, C.; Thomson, D.U. Nutrition of Newly Received Feedlot Cattle. Vet. Clin. North Am. Food Anim. Pract. 2015, 31, 283–294. [Google Scholar] [CrossRef] [PubMed]
  13. Goldansaz, S.A.; Guo, A.C.; Sajed, T.; Steele, M.A.; Plastow, G.S.; Wishart, D.S. Livestock metabolomics and the livestock metabolome: A systemic review. PLoS ONE 2017, 12, e0177675. [Google Scholar] [CrossRef] [PubMed]
  14. Lamy, E.; Mau, M. Saliva proteomics as an emerging, non-invasive tool to study livestock physiology, nutrition and diseases. J. Proteom. 2012, 75, 4251–4258. [Google Scholar] [CrossRef] [PubMed]
  15. Bertram, H.C.; Yde, C.C.; Zhang, X.; Zhang, X.; Kristensen, N.B. Effect of dietary nitrogen content on the urine metabolite profile of dairy cows assessed by nuclear magnetic resonance (NMR)-based metabolomics. J. Agric. Food Chem. 2011, 59, 12499–12505. [Google Scholar] [CrossRef] [PubMed]
  16. Hailemariam, D.; Mandal, R.; Saleem, F.; Dunn, S.M.; Wishart, D.S.; Ametaj, B.N. Identification of predictive biomarkers of disease state in transition dairy cows. J. Dairy Sci. 2014, 97, 2680–2693. [Google Scholar] [CrossRef] [PubMed]
  17. Zhao, S.; Zhao, J.; Bu, D.; Sun, P.; Wang, J.; Dong, Z. Metabolomics analysis reveals large effect of roughage types on rumen microbial metabolic profile in dairy cows. Lett. Appl. Microbiol. 2014, 59, 79–85. [Google Scholar] [CrossRef] [PubMed]
  18. Cai, L.; Koziel, J.A.; Davis, J.; Lo, Y.C.; Xin, H. Characterization of VOCs and odors by in vivo sampling of beef cattle rumen gas using SPME and GC-MS-olfactometry. Anal. Bioanal. Chem. 2006, 386, 1791–1802. [Google Scholar] [CrossRef] [PubMed]
  19. Spinhirne, J.P.; Koziel, J.A.; Chirase, N. Characterizing volatile fatty acids and other gases in a rumen closed in vitro fermentation system using solid phase microextraction. Trans. ASABE 2003, 46, 585–588. [Google Scholar] [CrossRef]
  20. Basoglu, A.; Baspinar, N.; Tenori, L.; Vignoli, A.; Yildiz, R. Plasma metabolomics in calves with acute bronchopneumonia. Metabolomics 2016, 12, 128. [Google Scholar] [CrossRef]
  21. Soso, S.B.; Koziel, J.A. Analysis of odorants in marking fluid of Siberian tiger (Panthera tigris altaica) using simultaneous sensory and chemical analysis with headspace solid-phase microextraction and multidimensional gas chromatography-mass spectrometry-olfactometry. Molecules 2016, 21, 834. [Google Scholar] [CrossRef] [PubMed]
  22. Soso, S.B.; Koziel, J.A. Characterizing the scent and chemical composition of Panthera leo marking fluid using solid-phase microextraction and multidimensional gas chromatography-mass spectrometry-olfactometry. Sci. Rep. 2017, 7, 5137. [Google Scholar] [CrossRef] [PubMed]
  23. Cai, L.; Koziel, J.A.; O’Neal, M. Studying plant—Insect interactions with solid phase microextraction: Screening for airborne volatile emissions of soybeans to the soybean aphid, Aphis glycines Matsumura (Hemiptera: Aphididae). Chromatography 2015, 2, 265–276. [Google Scholar] [CrossRef]
  24. Wishart, D.S.; Tzur, D.; Knox, C.; Eisner, R.; Guo, A.C.; Young, N.; Cheng, D.; Jewell, K.; Arndt, D.; Sawhney, S.; et al. HMDB: The Human Metabolome Database. Nucleic Acids Res. 2007, 35, 17202168. [Google Scholar] [CrossRef] [PubMed]
  25. Wishart, D.S.; Knox, C.; Guo, A.C.; Eisner, R.; Young, N.; Gautam, B.; Hau, D.D.; Psychogios, N.; Dong, E.; Bouatra, S.; et al. HMDB: A knowledgebase for the human metabolome. Nucleic Acids Res. 2009, 37, 18953024. [Google Scholar] [CrossRef] [PubMed]
  26. Wishart, D.S.; Jewison, T.; Guo, A.C.; Wilson, M.; Knox, C.; Liu, Y.; Djoumbou, Y.; Mandal, R.; Aziat, F.; Dong, E.; et al. HMDB 3.0—The Human Metabolome Database in 2013. Nucleic Acids Res. 2013, 41, 23161693. [Google Scholar] [CrossRef] [PubMed]
  27. Wolff, M.S.; Teitelbaum, S.L.; Windham, G.; Pinney, S.M.; Britton, J.A.; Chelimo, C.; Godbold, J.; Biro, F.; Kushi, L.H.; Pfeiffer, C.M.; et al. Pilot study of urinary biomarkers of phytoestrogens, phthalates, and phenols in girls. Environ. Health Perspect. 2007, 115, 116–121. [Google Scholar] [CrossRef] [PubMed]
  28. National Center for Biotechnology Information. PubChem Compound Database. CID 7583. Available online: https://pubchem.ncbi.nlm.nih.gov/ (accessed on 18 February 2018).
  29. Muniasamy, S.; Selvam, R.M.; Rajanarayanan, S.; Saravanakumar, V.R.; Archunan, G. P-cresol and oleic acid as reliable biomarkers of estrus: Evidence from synchronized Murrah buffaloes. Iran. J. Vet. Res. 2017, 18, 124–127. [Google Scholar] [PubMed]
Figure 1. Comparison of averaged ‘sick’ and ‘healthy’ cattle nasal swab samples. The gray is the possible background contributed by the tissues used. The black is the average of all 50 ‘healthy’ cattle samples. The blue is the average of all 50 ‘sick’ cattle samples. The red is the standard deviation between the ‘sick’ and the ‘healthy’ cattle samples (to visualize the presence of probable markers).
Separations 05 00018 g001
Figure 2. Comparison of averaged ‘sick’ and ‘healthy’ cattle serum samples. The black is the average of all 50 ‘healthy’ cattle samples. The blue is the average of all 50 ‘sick’ cattle samples. The red is the standard deviation between the ‘sick’ and the ‘normal’ cattle samples (to visualize the presence of probable markers).
Separations 05 00018 g002
Table 1. Preliminary compound identification for markers in nasal swab samples (Figure 1).
Compound #Preliminary IDColumn Retention Time (min)Sick Cattle Peak Area (a.u.)Healthy Cattle Peak Area (a.u.)Confirmed RT with standardSpectral Match (%)Top Five Ion Distribution, Ion (%)
Compound 1Phenol22.1091,300 (±44,100)145,000 (±89,700)yes6294(100), 65(37), 66(33), 39(31), 40(21)
Compound 2Benzothiazole22.61120,000 (±121,000)378,000 (±157,000)no78135(100), 108(32), 69(17), 44(10), 63(10)
Compound 3p-Cresol23.3190,000 (±128,000)340,000 (±187,000)yes57108(100), 107(89), 77(59), 79(30), 41(23)
Compound 45-Octadecenal27.8033,100 (±39,900)64,100 (±90,400)no5655(100), 41(46), 73(44), 97(37), 84(35)
Note: values in parantheses are standard deviations.
Table 2. Preliminary compound identification for markers in cattle serum samples (Figure 2).
Compound #Preliminary IDColumn Retention Time (min)Sick Cattle Peak Area (a.u.)Healthy Cattle Peak Area (a.u.)Confirmed RT with StandardSpectral Match (%)Top Five Ion Distribution, Ion (%)
Compound 19-Hexyl-heptadecane,17.1540,200 (±44,200)25,400 (±22,000)no4957(100), 43(89), 45(69), 71(36), 41(31)
Compound 2Phenol22.1063,000 (±52,500)38,400 (±32,900)yes4994(100), 65(31), 66(27), 39(23), 40(22)
Compound 3Isolongifolene23.0553,400 (±38,000)36,800 (±27,300)no50159(100), 55(41), 145(34), 202(29), 43(27)
Compound 4Diphenyl ether24.7271,800 (±81,300)31,400 (±42,900)no57170(100), 141(63), 51(52), 77(45), 44(44)
Compound 5TMC 125.6043,700 (±27,900)33,500 (±20,400)no5168(100), 67(87), 189(52), 207(41), 93(40)
Note: 1 1,5,9-trimethyl-1,5,9-cyclododecatriene; values in parentheses are standard deviations.

