Article

Method for the Determination of Benzene Metabolite t,t-Muconic Acid in Urine by HPLC-UV with an Ion Exclusion Column

by
Rafaela De Paiva Gomes
,
Ananda Lima Sanson
,
Fabiana Aparecida Lobo
,
Robson José de Cássia Franco Afonso
and
Mauricio Xavier Coutrim
*
Department of Chemistry, Institute of Exact and Biological Sciences, Federal University of Ouro Preto, Campus Morro do Cruzeiro, s/n, Bauxita, 35400-000 Ouro Preto, MG, Brazil
*
Author to whom correspondence should be addressed.
Separations 2016, 3(2), 14; https://doi.org/10.3390/separations3020014
Submission received: 14 December 2015 / Revised: 6 April 2016 / Accepted: 26 April 2016 / Published: 13 May 2016

Abstract

:
The benzene metabolite trans,trans-muconic acid (tt-MA) is widely used as a biological indicator of exposure to this xenobiotic. An analytical method was developed and validated for the determination of urinary tt-MA using solid phase extraction onto a Strata SAX cartridge. The analysis was performed by HPLC with an Aminex HPX-87H ion exclusion column and a UV diode array detector. The sample preparation conditions were optimized using a 24−1 factorial design. Comparison of the slopes of standard analytical curves prepared in aqueous solution and urine showed that the biological matrix suppressed the tt-MA signal by around 50%, so the analytical curves were prepared with tt-MA standard at low concentrations in pooled urine. The analytical curves in the range of 5–500 μg·L−1 showed determination coefficients values (R2) > 0.99 for tt-MA standard in water and R2 > 0.98 for tt-MA standards in pooled urine. The coefficients of variation obtained using seven replicates were lower than 3.6%, and recoveries of tt-MA from solutions containing 5, 25, 50 and 100 μg·L−1 of the analyte were in the range 85%–90%, demonstrating the satisfactory precision and accuracy of the method. The limits of detection and quantification were 0.11 and 0.36 µg ·L−1, respectively. The benefits of this new method developed is the possibility of complete chromatographic peak separation for the determination of tt-MA at baseline, without matrix components’ interference as normally found in the C18 column. This is the first time that this chromatographic column has been used for the analysis of tt-MA in urine.

Graphical Abstract

1. Introduction

Despite substantial progress over the last 20 years in understanding the risks posed by benzene, there is a continuing need for the development of sensitive techniques able to determine the compound at low levels, in order to assist in the implementation of control strategies. Various methods have been reported for the evaluation of the contamination of humans by benzene. These normally measure benzene in its original form and have been applied to exhaled air [1,2,3,4], blood [4,5,6,7] and urine [6,8,9,10]. However, various difficulties have been described, related to problems in sample preparation (for air samples), the small fraction of benzene that remains unaltered (in urine) and invasive sample collection (of blood). An alternative to the evaluation of exposure to benzene by directly measuring its concentration in air is to determine the concentrations of its metabolites in urine or blood that involve the use of biological exposure indicators (BEIs). Two of the metabolites of benzene that can be used as a BEI are trans,trans-muconic acid (tt-MA) and S-phenyl mercapturic acid (SPMA), which are biomarkers that are more sensitive and specific, compared to urinary phenol [11]. This exposure biomarker has therefore been adopted in Brazilian legislation for the monitoring of occupational exposure to benzene [12]. The widespread use of tt-MA as a BEI is due to the good correlation obtained between the level of the compound in urine and the concentrations of benzene in air and blood, even after exposure to low concentrations of benzene.
Various techniques have been developed for the determination of tt-MA in urine. The most widely-used sample preparation procedure employs solid phase extraction (SPE) with ion exchange resins [13,14,15,16,17,18]. This procedure reduces the quantities of solvents required and provides better recoveries, as well as clearer extracts, compared to the non-extraction procedure [19,20].
Only a few studies have employed gas chromatography for the determination of urinary tt-MA [21,22,23,24,25]. On the other hand, there has been widespread use of high performance liquid chromatography (HPLC) with reverse phase columns and ultraviolet and visible spectrophotometry (UV-VIS) or mass spectrometry (MS) detection [26,27,28,29,30,31,32,33,34,35,36,37,38,39,40,41,42]. One way to separate anions by chromatography is to use cation exchange columns where the ions are separated by ion exclusion. In this type of chromatography, the analytical conditions allow that part of the mobile phase to remain immobilized in the stationary phase, and the separation is due to the differences in the partitioning of the molecular solute between the solvent from the mobile phase and the solvent immobilized on the resin [43]. However, no analytical method has been described in the literature for the determination of urinary tt-MA as a BEI for benzene using HPLC with an Aminex HPX-87H column, although this analyte and other volatile organic acids have been determined in various other sample matrices using this type of column [44,45,46].
The objective of this work was to develop a new technique for the measurement of tt-MA in urine, using SPE (SAX cartridges) and HPLC with an Aminex HPX-87H column and UV detection.

2. Experimental Section

2.1. Instruments and Accessories

The extraction of tt-MA employed Strata SAX cartridges containing 500 mg of trimethylaminopropylsilane (Phenomenex®, Torrance, CA, USA), a manifold (Phenomenex®) and a vacuum pump (Model 131, Prismatec Ind Com, Itu, SP, Brazil). Analysis was performed with an HPLC (Model 20A, Shimadzu, Columbia, MD, USA) equipped with a diode array. The column used was an Aminex HPX-87H (300 × 7.8 mm, Bio-Rad Laboratories, Hercules, CA, USA), recommended for the separation of carboxylic acids, installed in a temperature-controlled oven (Model TC300, GBC Scientific Equipment Pty Ltd., Hamsphire, IL, USA), and the chromatograms were recorded at 264 nm using LabSolutions System software, version 5.53 SP3 (Shimadzu, Laval, Quebec, PQ, Canada). Additional items of equipment were micropipettes of various volumes, an analytical balance (Model AUY 220, Shimadzu) and a membrane filtration system (PTFE, 0.22-µm pore size, Phenomenex®).

2.2. Reagents, Solutions and Samples

The reagents used were methanol, acetic acid, acetonitrile and sulfuric acid, all chromatography grade (JT Baker®, Center Valley, PA, USA), trans,trans-muconic acid (analytical grade, 99% min. purity, Sigma-Aldrich®, St. Louis, MO, USA) and pH 8.0 tris-phosphate buffer (Sigma-Aldrich®). The ultra-pure water (conductivity of 0.065 µS) was obtained from a LAB-UPW system (TKA, Niederelbert, Germany).
A standard solution of tt-MA (10 mg·L−1) was prepared in water and diluted to obtain standards at lower concentrations. Ten different urine samples were obtained from non-smoker volunteers (5 males and 5 females) and were combined to produce a pooled urine sample.

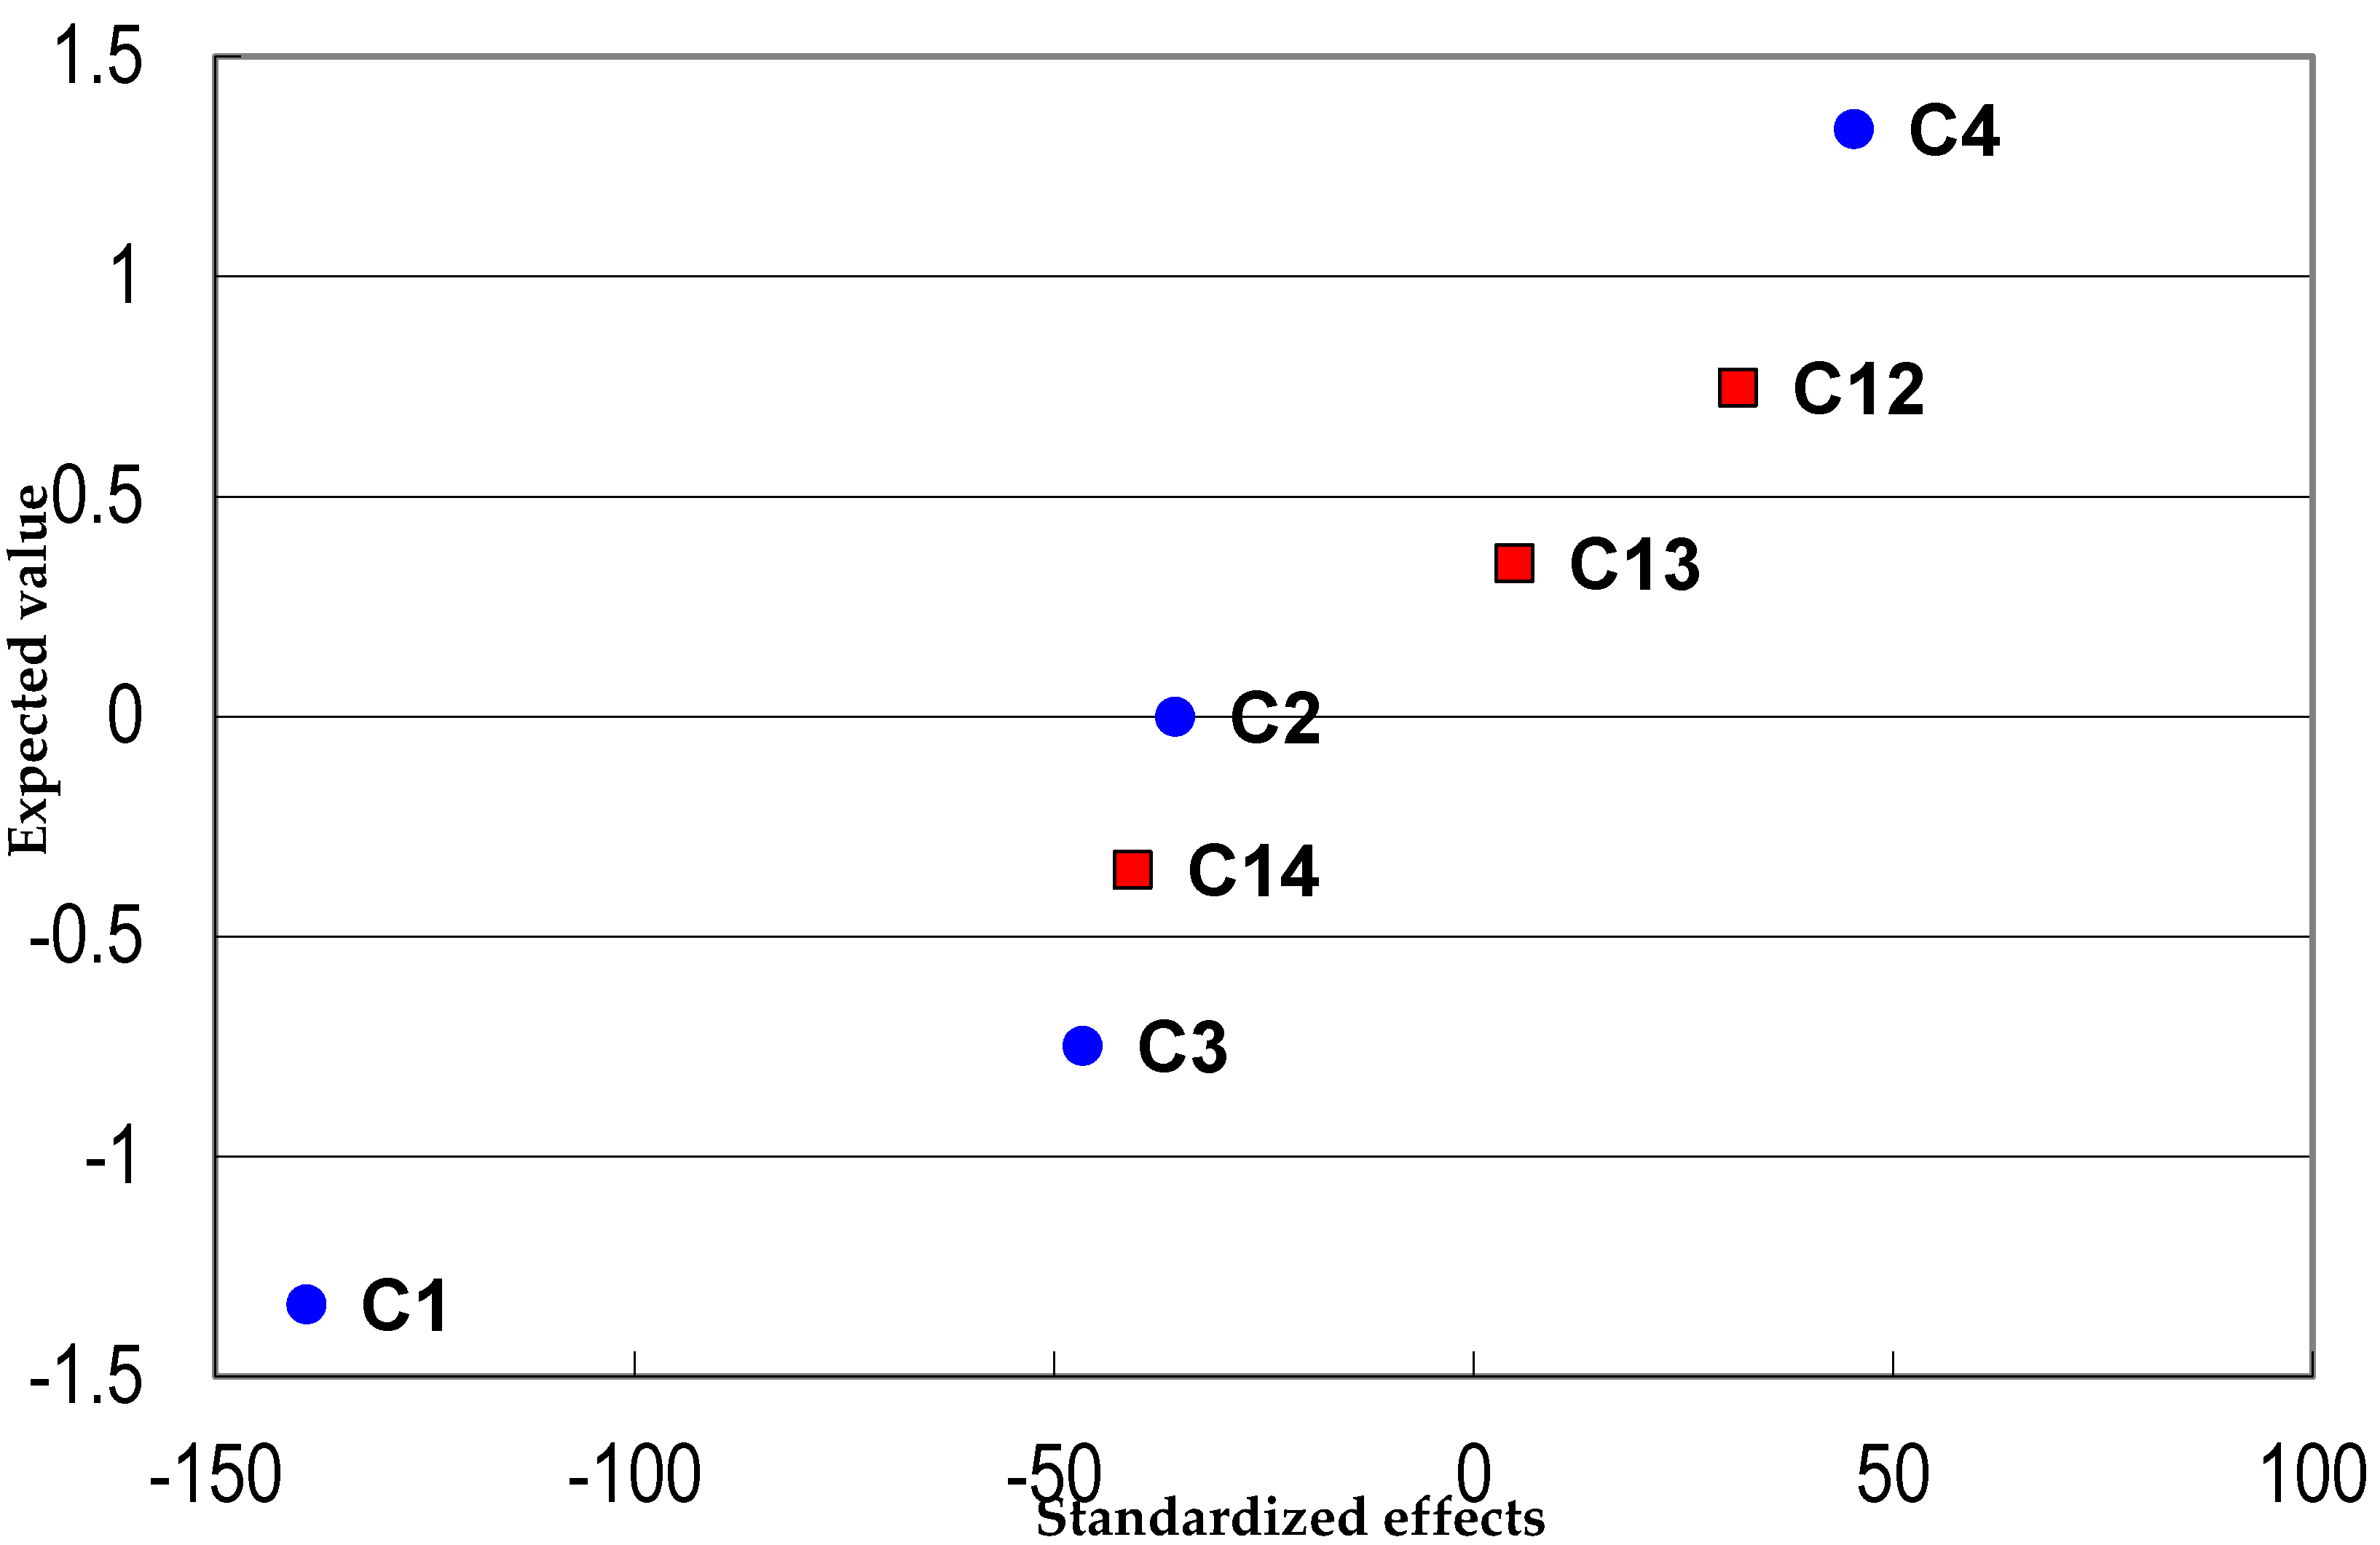
2.3. Optimization of the Procedure

A 24−1 factorial design was used to define the sample preparation conditions. The chromatographic conditions were optimized in a univariate manner.

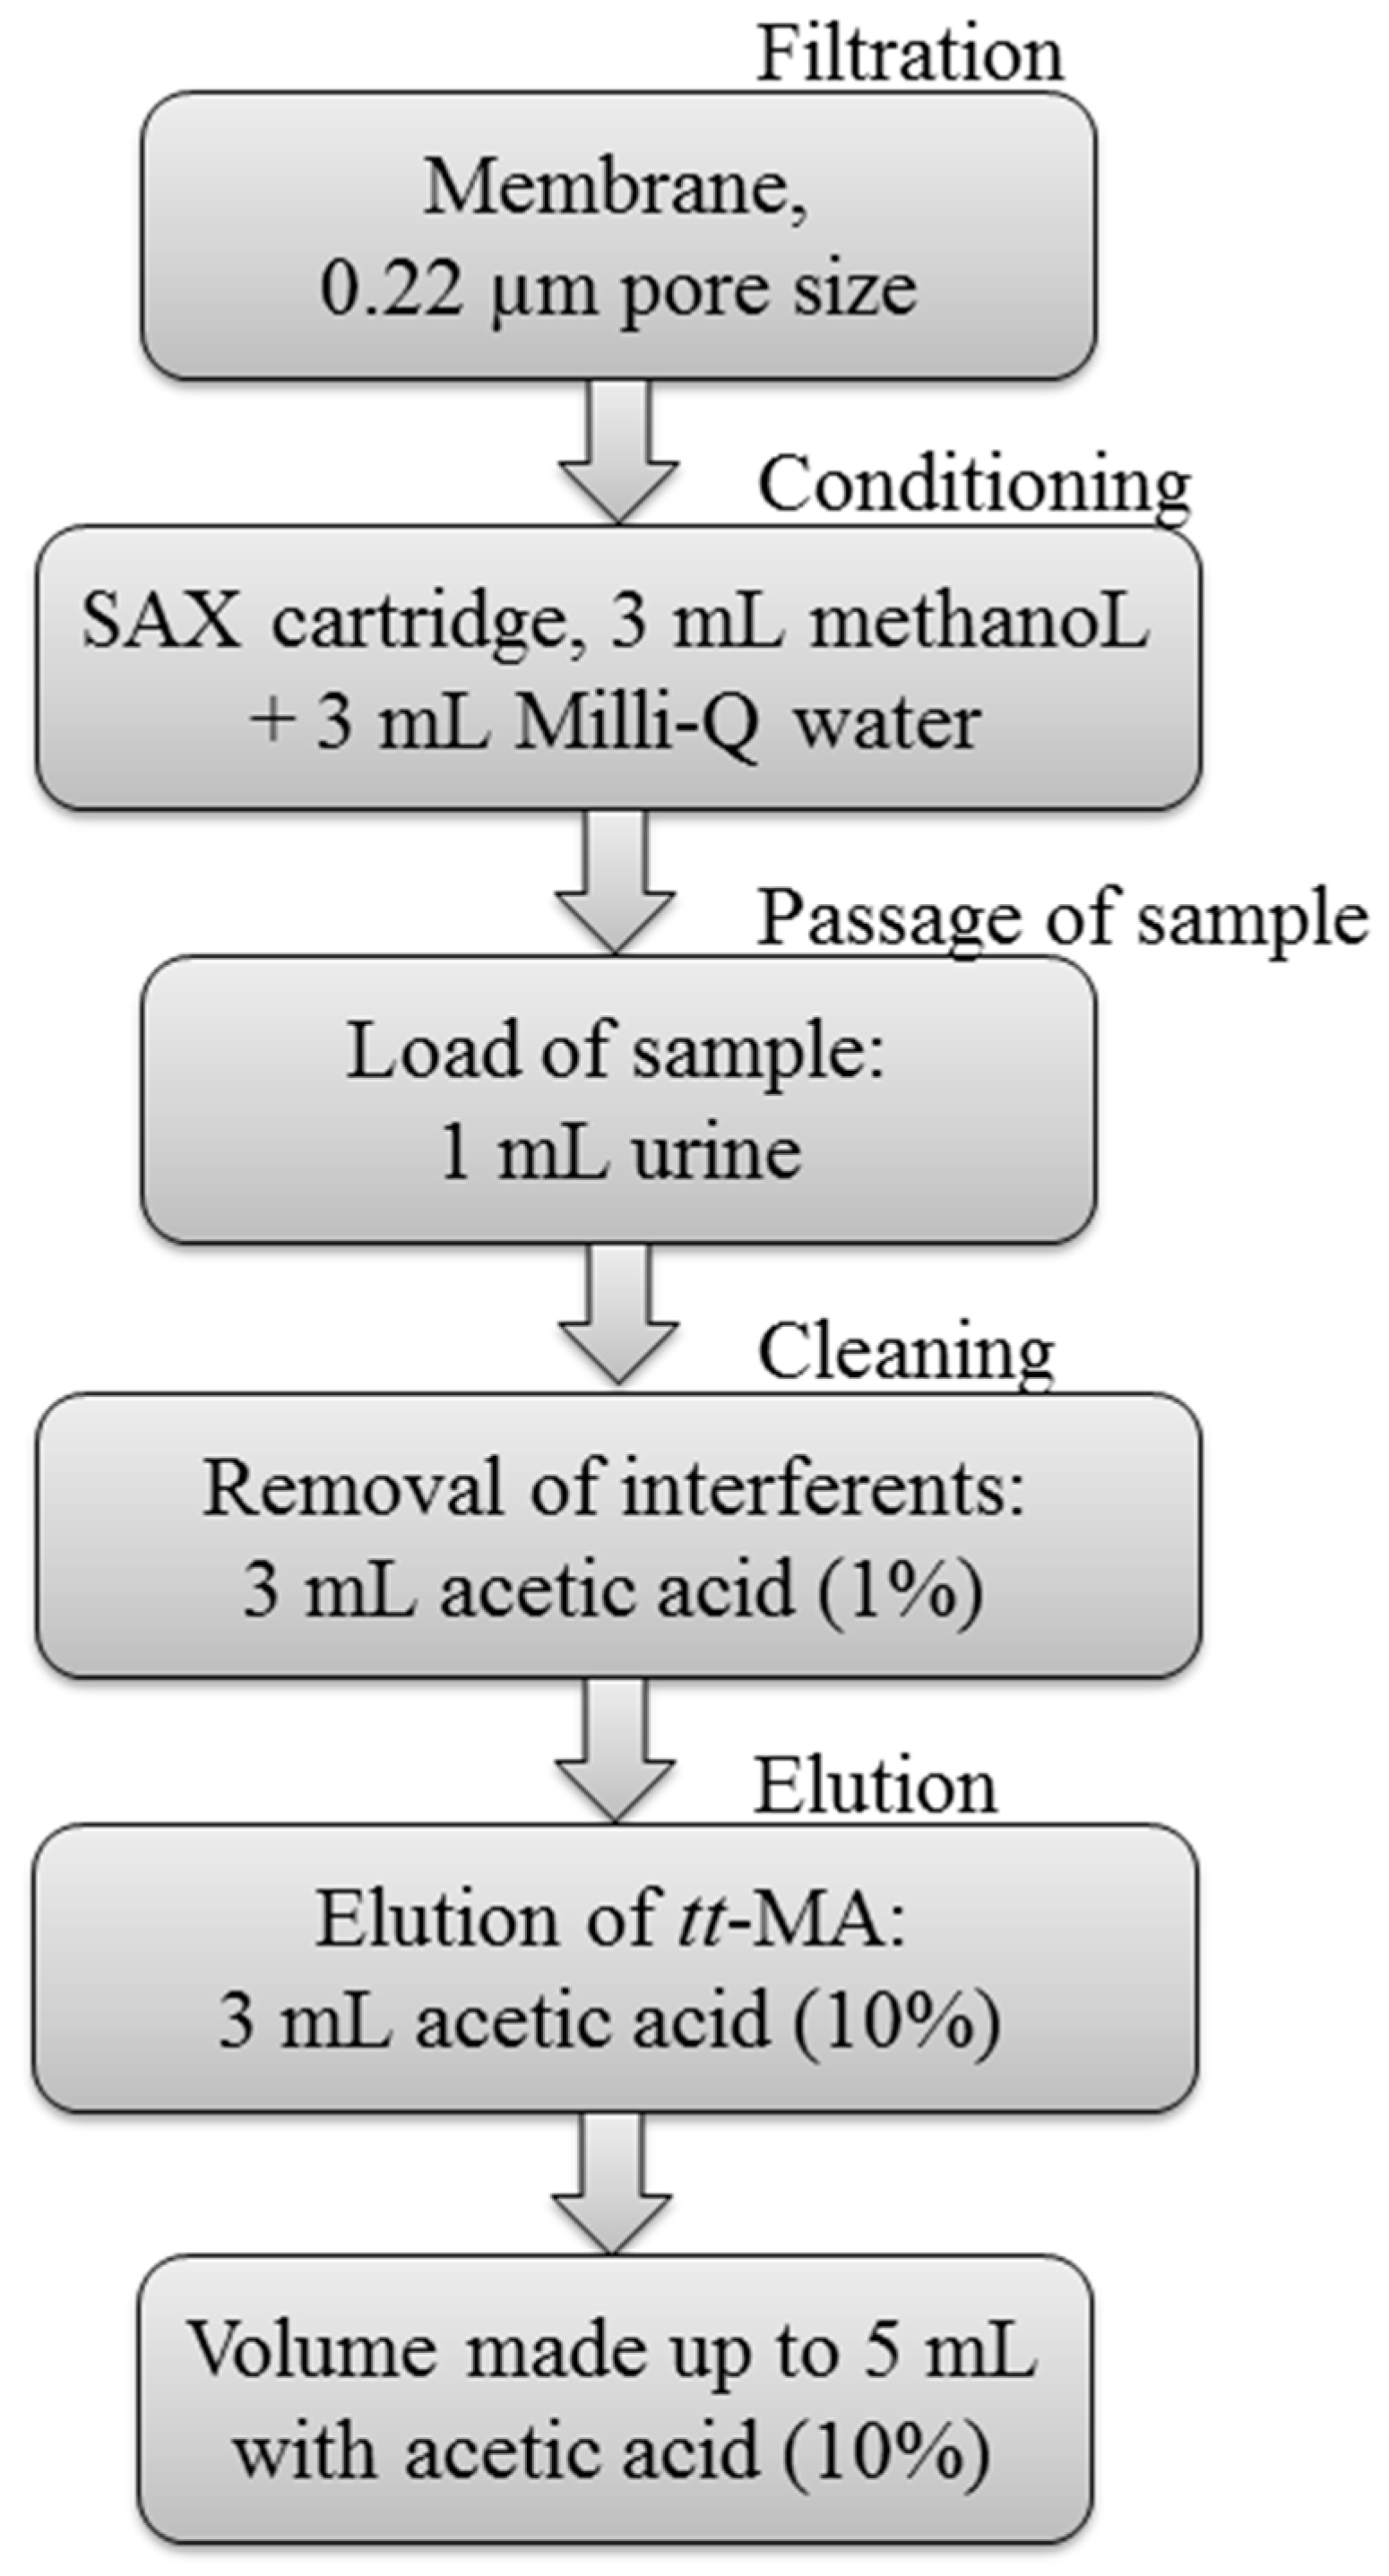
2.3.1. Preparation of Samples

The sample cleanup procedure was based on the method described previously by Ducos et al. (1990) [27] and is illustrated in the flow diagram of Figure 1.
The sample was filtered through a 0.22 μm membrane, after which the tt-MA was extracted using a SAX cartridge. The extraction was performed under vacuum using a manifold with a capacity for 12 cartridges. The entire procedure was performed in triplicate.

2.3.2. Optimization of the Sample Preparation Procedure

A factorial design was used to evaluate the need for the buffering of the samples, as well as to adjust other factors related to sample transfer, cleanup and elution. An appropriate electronic spreadsheet was used for the preparation and interpretation of the experimental designs [47]. Four variables were investigated (sample buffering, removal of interferents (washing), final volume and sample volume), at three levels (Table 1).
The parameters shown in Table 1 were used to generate 11 experiments, as shown in Table 2. The experiments were performed in random order. Throughout the optimization procedure, the response was based on the analyte peak area.

2.3.3. Chromatographic Conditions

Development of the new analytical method was initially based on the procedure described by Ducos et al. (1990) [27], with modifications in terms of the types of chromatographic precolumn and main column employed, as well as the mobile phase and the wavelength used to detect tt-MA. In this step of the work, the optimization of the variables was performed in a univariate manner. Nine chromatographic mobile phase compositions were tested, together with two different flow rates and the presence or absence of the precolumn.

2.4. Validation of the Method
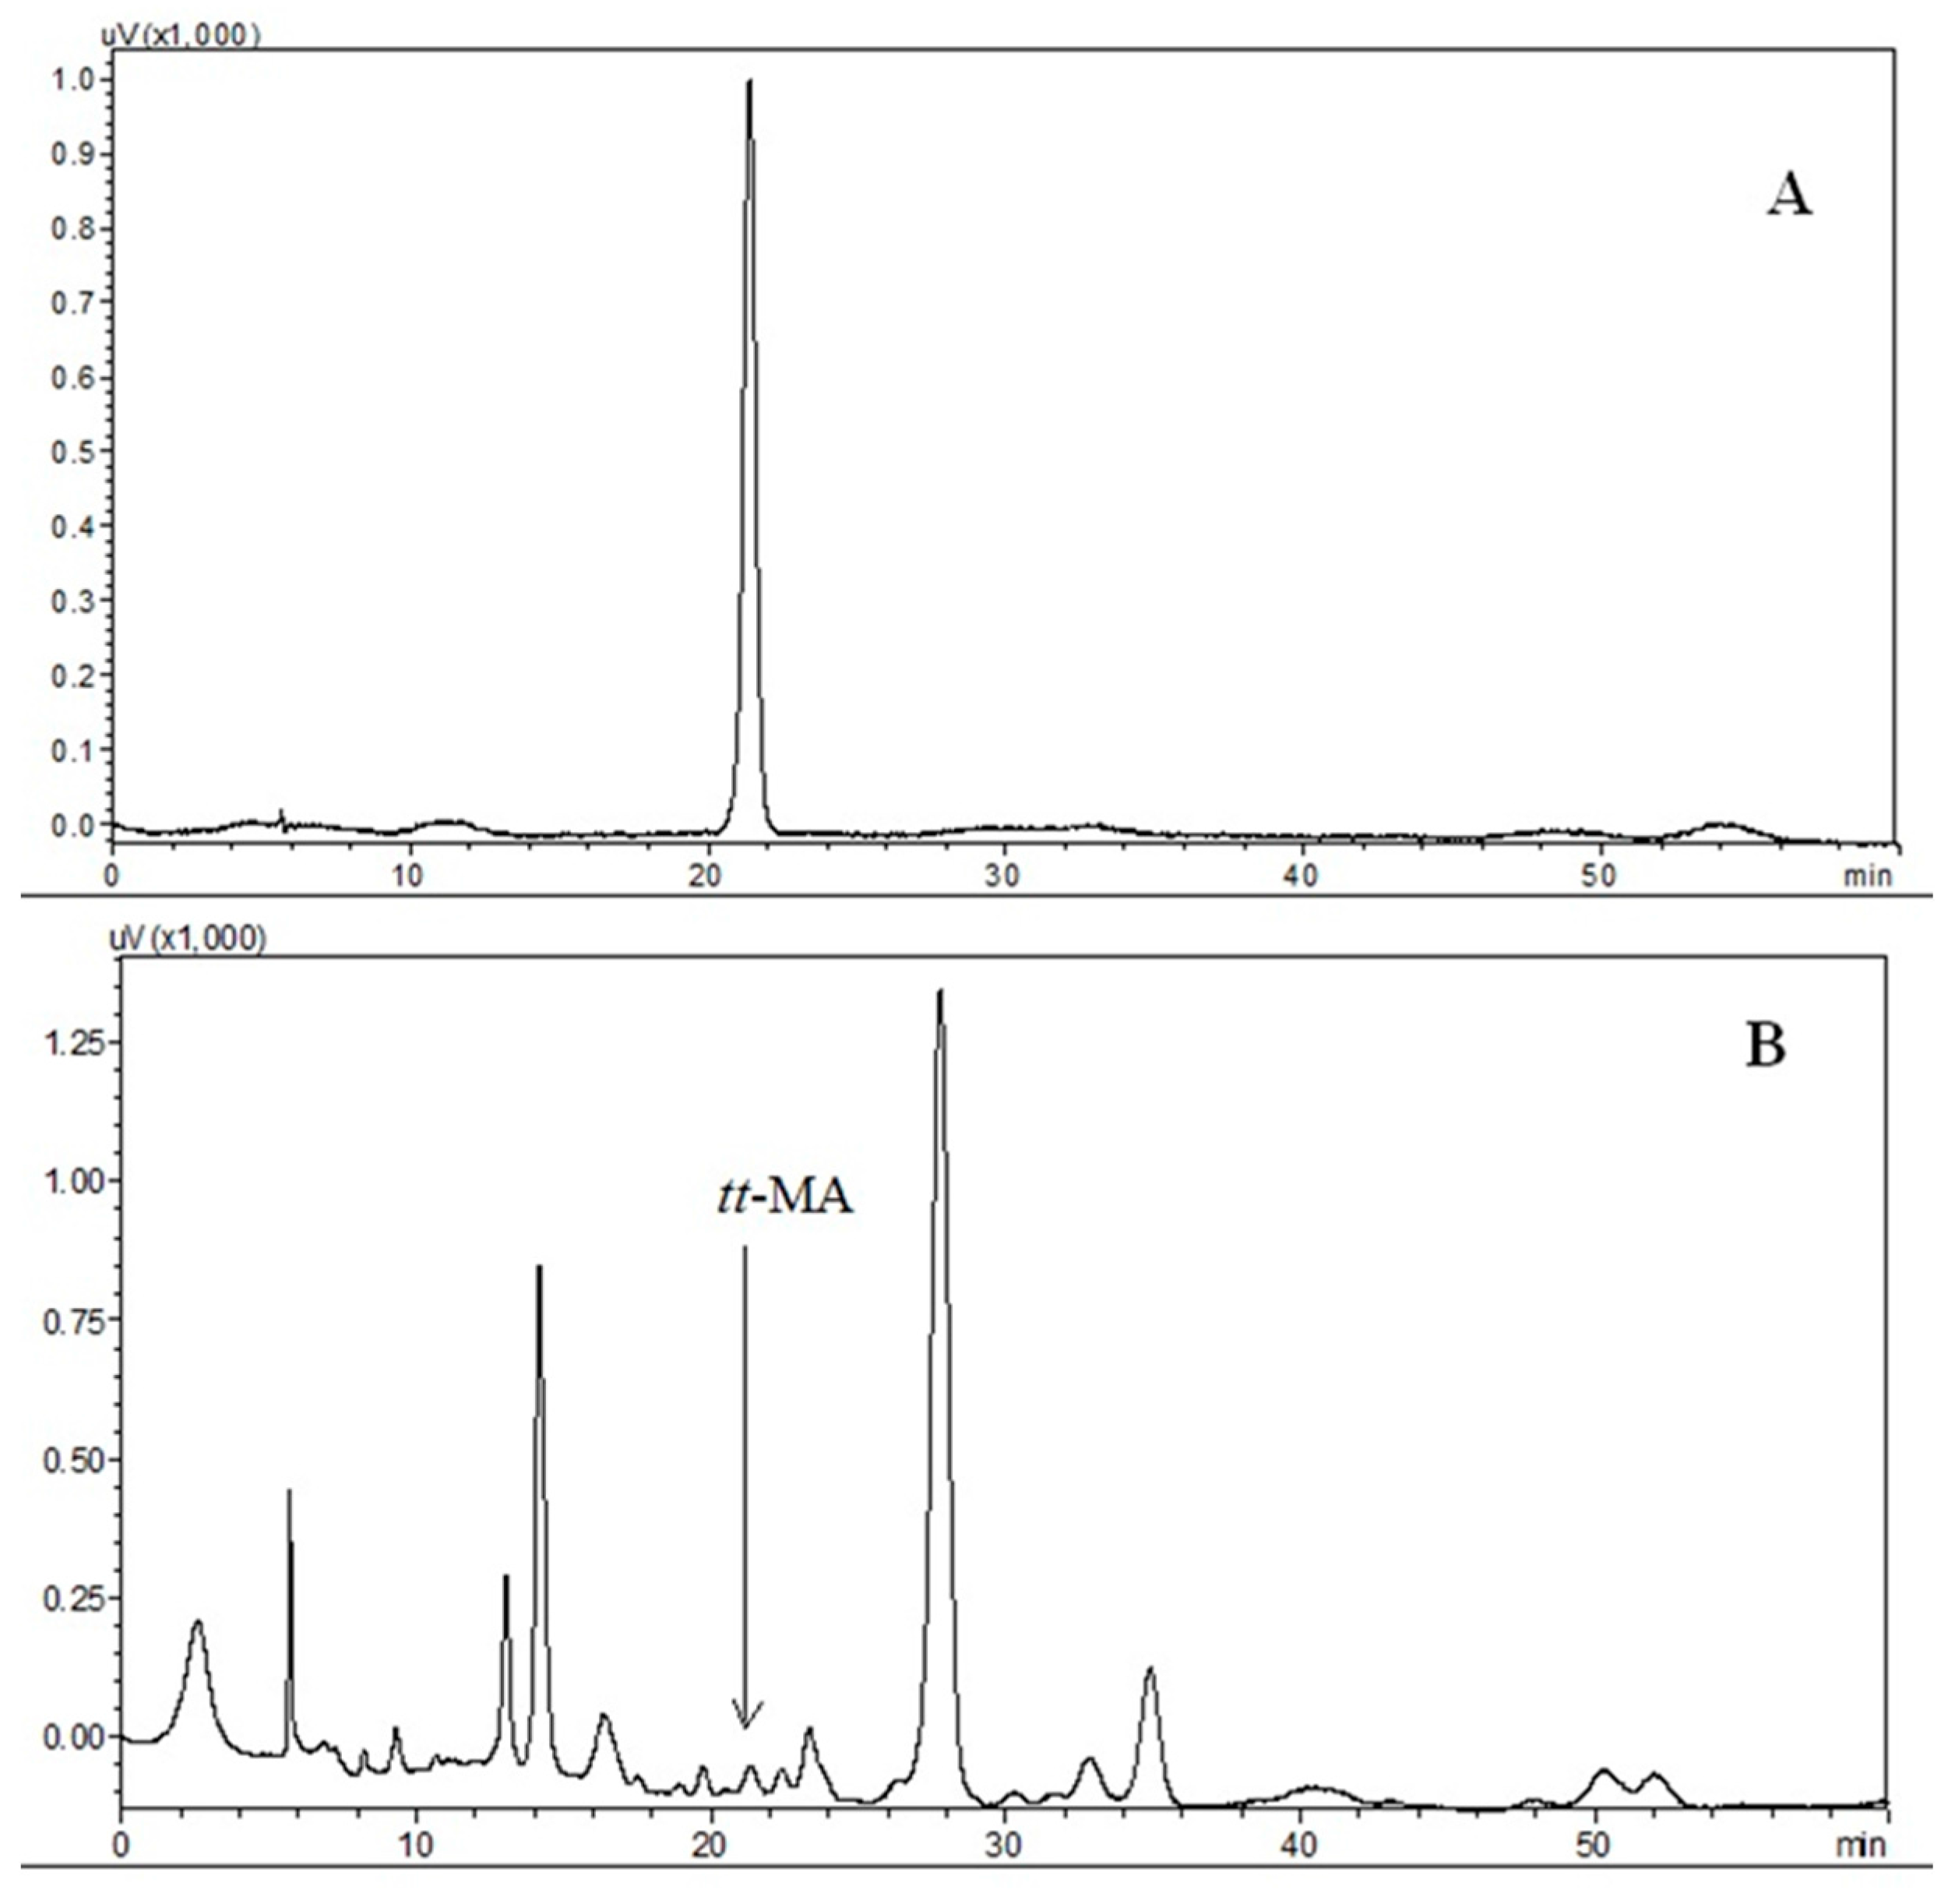
The analytical method was validated considering the following parameters: selectivity, linearity, working range, limits of detection and quantification, precision and accuracy.
A comparison was made of analytical curves constructed using solutions prepared in water and in the sample matrix. In the case of the sample matrix, the curves employed the results obtained for standard solutions prepared by adding aliquots of tt-MA solutions to volumes of the pooled urine sample composed of the samples obtained from the ten non-smoker volunteers. The tt-MA solutions were prepared by fortification of the pooled urine with an intermediate standard solution obtained by dilution of the 10 mg·L−1 solution of tt-MA in water.
The standards prepared in the sample matrix were subsequently submitted to the same treatment employed for the samples: filtration through a 0.22 μm membrane, solid phase extraction, and injection onto the chromatographic column (as described in Section 2.3.1).

2.4.1. Selectivity

The selectivity of the method was evaluated by comparing the analyte retention times obtained for the samples and the standard solutions and by comparing the absorption spectra of the chromatographic peaks obtained for urine samples fortified with tt-MA standard with those for standard solutions of tt-MA prepared in water.

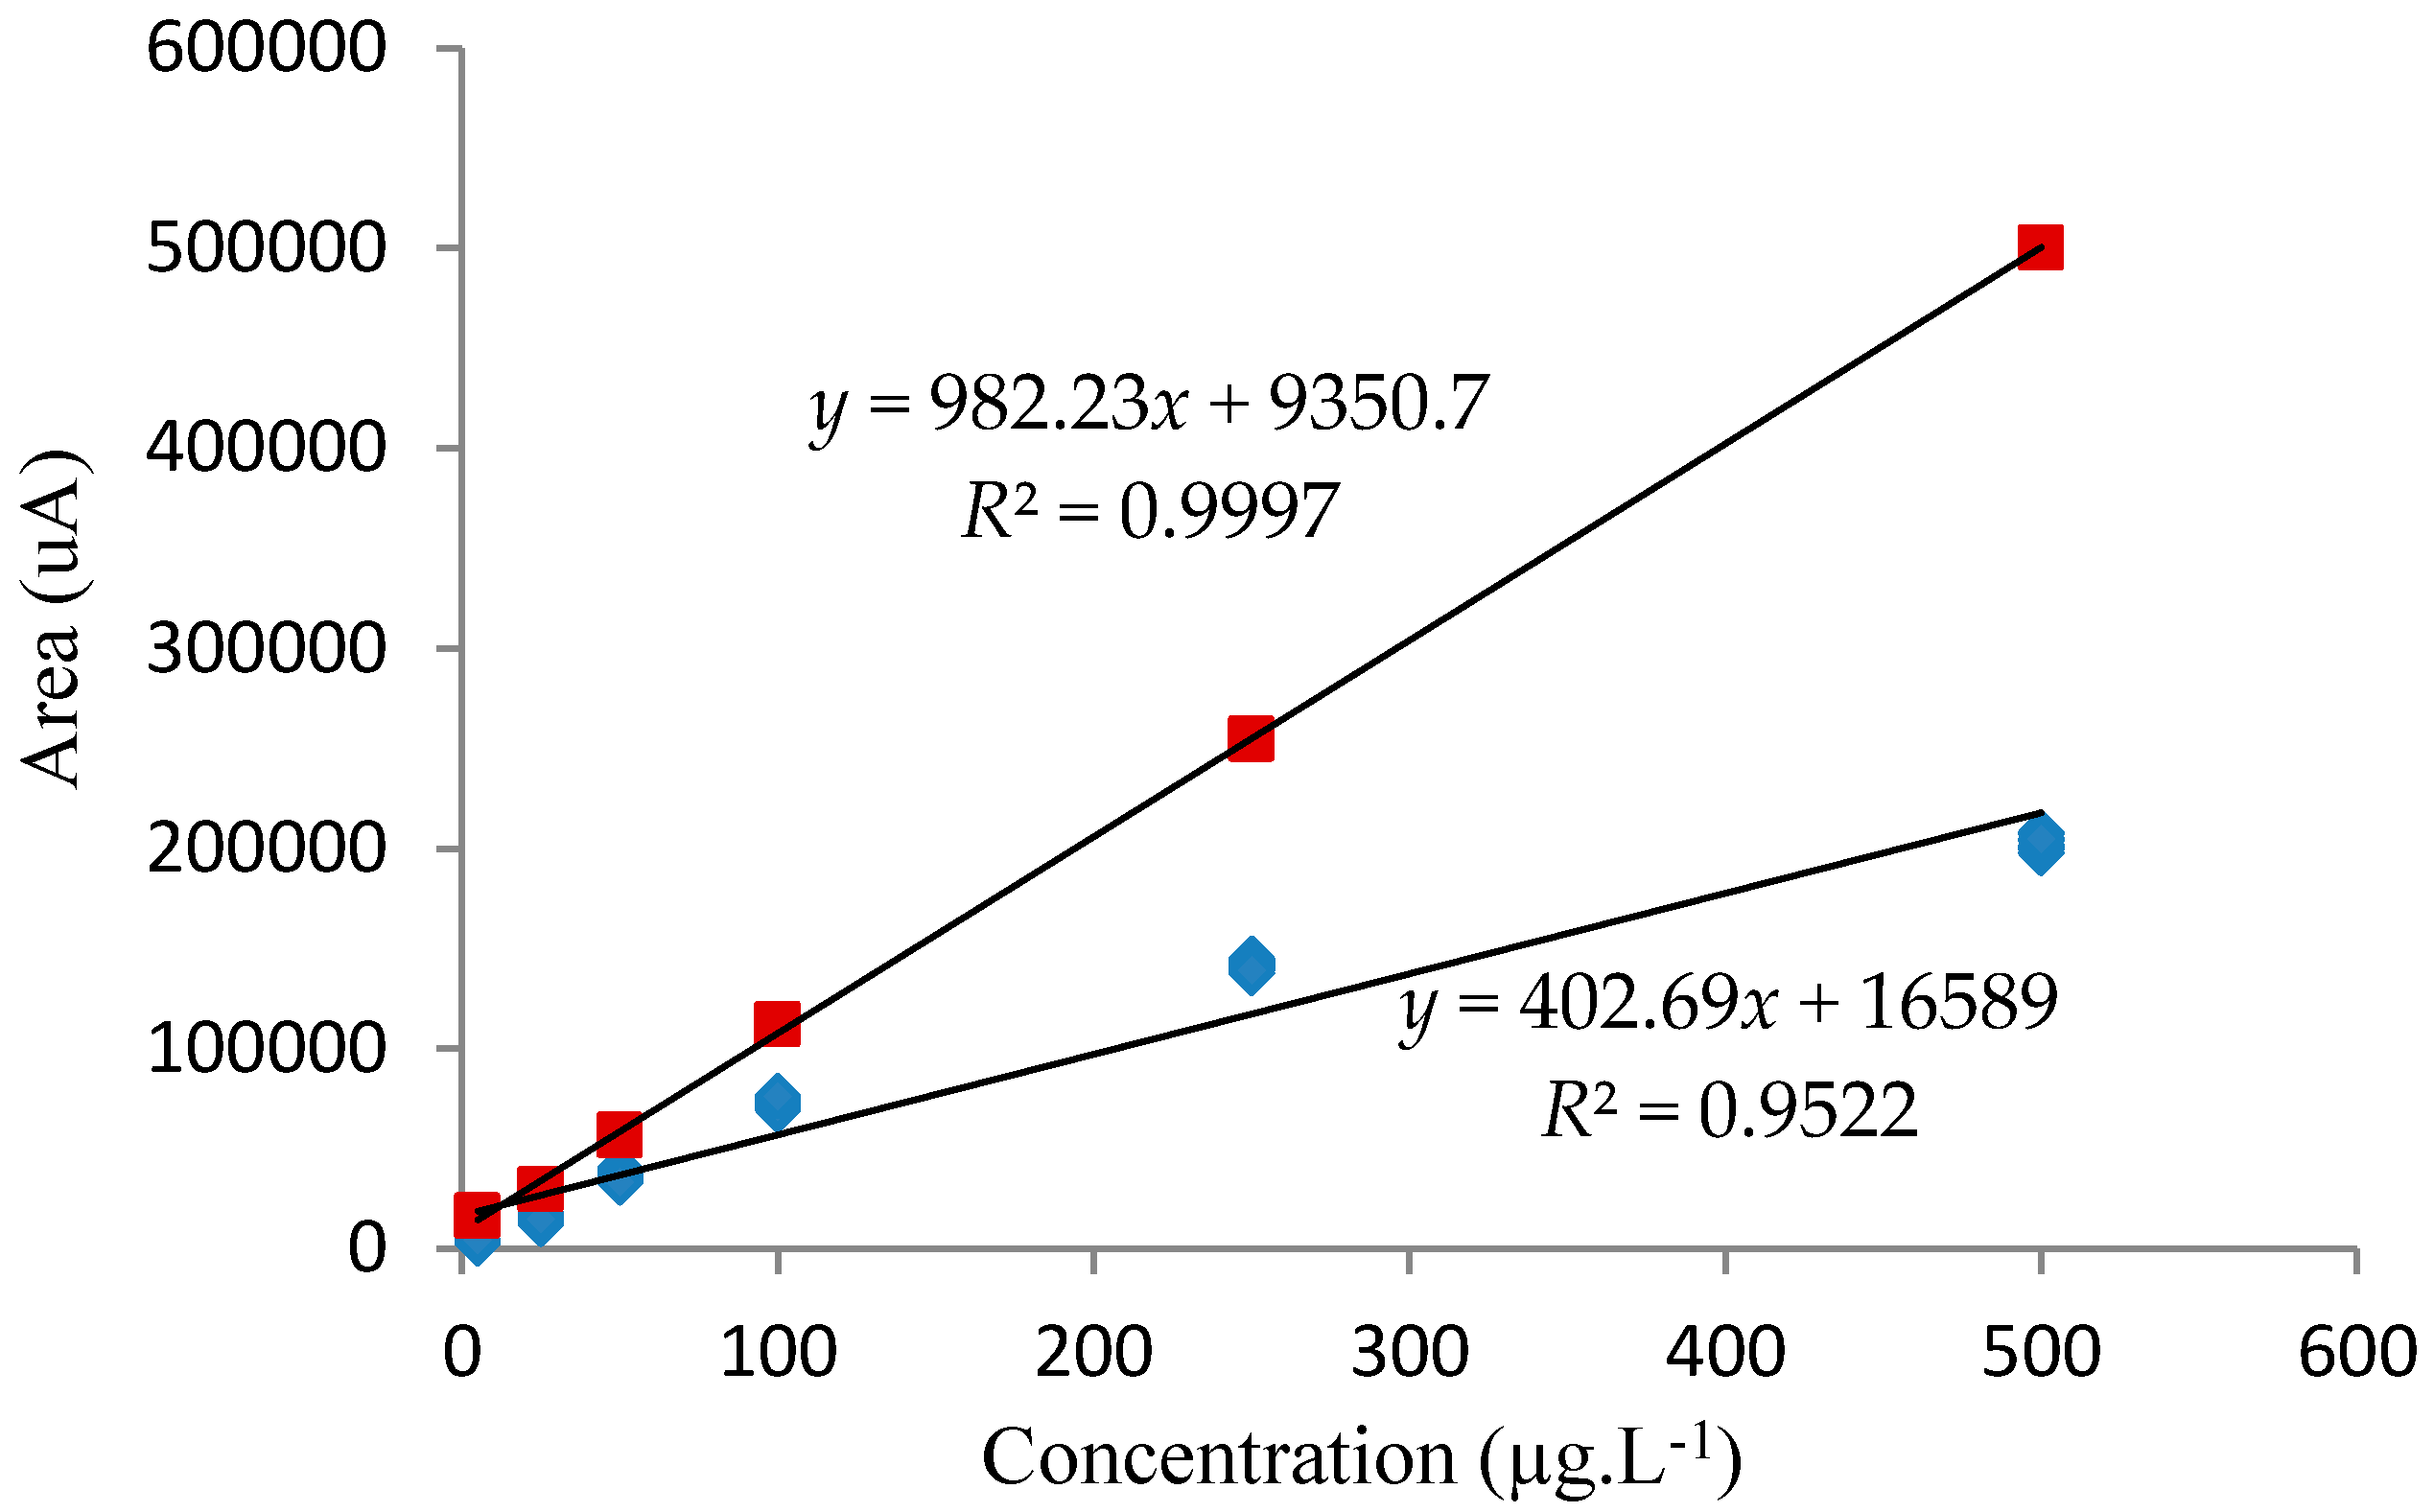
2.4.2. Matrix Interferences

Interferences caused by the presence of the biological matrix were assessed by comparing the coefficients of determination obtained for analytical curves constructed using aqueous standard solutions and standard solutions prepared using the pooled urine sample. The SPE extraction was performed under the optimized conditions.

2.4.3. Analytical Curve Adjustment and Working Range

The analytical curve adjustment and working range of the method were evaluated using the determination coefficients (R2) obtained for the analytical curves constructed using the standards prepared in the pooled urine, in the concentration range 5–500 μg·L−1.

2.4.4. Limits of Detection and Quantification

The limits of detection (LOD) and quantification (LOQ) of the method were determined using the average area of the baseline noise of several chromatograms obtained for the analysis of the pooled urine sample. The calculated LOD and LOQ concentration values were equivalent to 3- and 10-times the average area of the baseline noise, respectively.

2.4.5. Precision and Accuracy

The precision of the technique was measured using the coefficient of variation (CV) value obtained for repetitions of the entire procedure, from sample preparation up to injection onto the chromatographic column. Values of up to 20% are normally considered acceptable for analytical methods applied to environmental samples with complex matrices [48,49].
Accuracy was determined using the percentage recovery of tt-MA added to urine at concentrations of 5.0, 50 and 500 µg·L−1, with nine replicates [48].

3. Results and Discussion

3.1. Optimization of Sample Preparation

Urine is a complex matrix that includes protein, salt, hormones, drugs and a variety of other compounds. Therefore, it is recommended that a pretreatment might be required in order to obtain a satisfactory chromatography performance. Qualitative tests of protein precipitation were performed using four systems: (1) pure sample; (2) sample with 0.01 mol·L−1 sulfuric acid; (3) sample with 0.01 mol·L−1 sulfuric acid and acetonitrile (65:35); and (4) 0.01 mol·L−1 sulfuric acid, used as a reference. All of the systems were kept at a temperature of 55 °C for 24 h, for the observation of turbidity. However, no cloudiness was observed in any of the cases, and then it was adopted only passing the sample through a 0.22 µm membrane.
A 24−1 fractional factorial design with triplicate central points was used to optimize the extraction process, considering the following variables: sample buffering, remove of interferents, final volume and the volume of sample used in the extraction process. In the normal probability plot (Figure 2), point C1, corresponding to sample buffering, showed a large negative effect. Some of the previous studies reported in the literature used extraction without buffering [27,30,36,38,41], while in other work concerning the exposure of humans to benzene, better analytical results were achieved by buffering of samples [29,50,51].
The sample volume (C4 in Figure 2) showed the greatest positive effect, indicating that the best extraction conditions were obtained using 3 mL of urine, which provided a greater quantity of urinary tt-MA.
In the fractional factorial design, the coefficient of variation of the tests was obtained by the analysis of the triplicate in the central point. The coefficient of variation of the signal obtained under the conditions was 1.95%. The highest tt-MA peak areas were obtained for Test 5, followed by Test 3 (Table 3).
Comparing the levels of four variables tested in the two best conditions, 3 and 5, we can see that variables that interfered more with the system of extraction, sample buffering (C1) and sample volume (C4) have the same levels in these two tests, confirming that the other variables (C2 and C3) do not interfere with the system.
The optimized sample preparation conditions (Table 4) were used in all of the subsequent experiments.

3.2. Evaluation of Analytical Conditions

As shown in the results of the factorial design, the absence of buffering therefore provided the best analytical conditions. The first mobile phase used for the chromatographic separation of tt-MA was 0.01 mol·L−1 sulfuric acid. Other mobile phases tested were sulfuric acid at a concentration of 0.02 mol·L−1, as well as sulfuric acid solutions with the addition of an organic modifier (acetonitrile) at different ratios (65:35, 75:25, 85:15, 90:10 and 95:5). However, none of these mobile phases showed better performance than sulfuric acid at a concentration of 0.01 mol·L−1. Typical chromatograms obtained for the separation of tt-MA using this mobile phase at a flow rate of 0.6 mL·min−1 are shown in Figure 3.

3.3. Validation of the Method
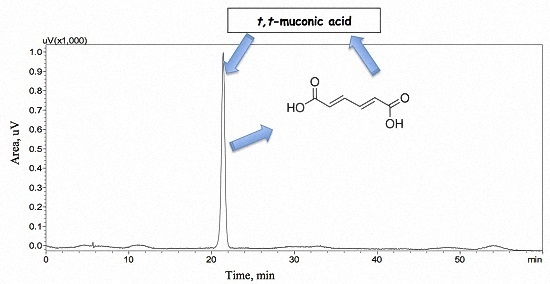
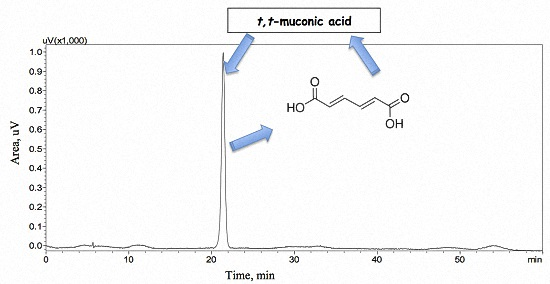
After optimization of the chromatographic conditions (summarized in Table 5) and the sample preparation procedure, the method was validated to ensure that it complied with established norms [48,49,52].

3.3.1. Selectivity

Since this work employed high performance liquid chromatography, the evaluation of the selectivity of the method employed the analyte retention times, comparing the retention times obtained for the in natura sample, standard solutions and fortified samples. A comparison was also made of the absorption diode array detector (DAD) spectra of the species eluted at the retention time of tt-MA in the sample chromatograms and the spectra obtained for the tt-MA standard solutions.
The presence of tt-MA peaks in the sample chromatograms was confirmed using four different techniques, depending on the level of uncertainty in the evaluation: (1) by comparing the retention time of the tt-MA peak in the sample chromatogram with the retention time of the peak obtained for a tt-MA standard, under the same conditions; (2) by the increase in the area of the peak resulting from the addition of tt-MA standard to the sample; (3) by comparison of the absorption spectrum of the tt-MA peak obtained for a standard solution with that of the peak obtained for the sample; and (4) according to the degree of purity of the eluted peak, as determined using the LabSolutions software, version 5.53 SP3 (Shimatzu, Laval, PQ, Canada). In the last case, the evaluation is made of the absorption spectra at the retention times corresponding to the upslope, top and downslope regions of the chromatographic peak, comparing them in order to identify any possibility of co-elution of other substances. The results of these different procedures applied to the chromatographic peaks showed that the method was selective to tt-MA.

3.3.2. Interferences due to the Biological Matrix

The analytical curve obtained using standards prepared in aqueous solution showed a slope (angular coefficient) that was greater than the slope of the curve for standards prepared in the pooled urine from the ten volunteers (all of whom were non-smokers with no history of occupational exposure to benzene). These results (Figure 4) indicated that the presence of the sample matrix depressed the analyte extraction efficiency by around 50% (Equation (1)), resulting in a decrease in sensitivity. Despite the existence of matrix interferences, this is not a problem, since all of the analytical curves used for the quantification of tt-MA in urine samples were constructed using standards prepared in the pooled urine.
Matrix effect (%) = X 1 X 2 × 100
where:
  • X1: tt-MA peak area for the analytical curve prepared using aqueous standards;
  • X2: tt-MA peak area for the analytical curve prepared using pooled urine.

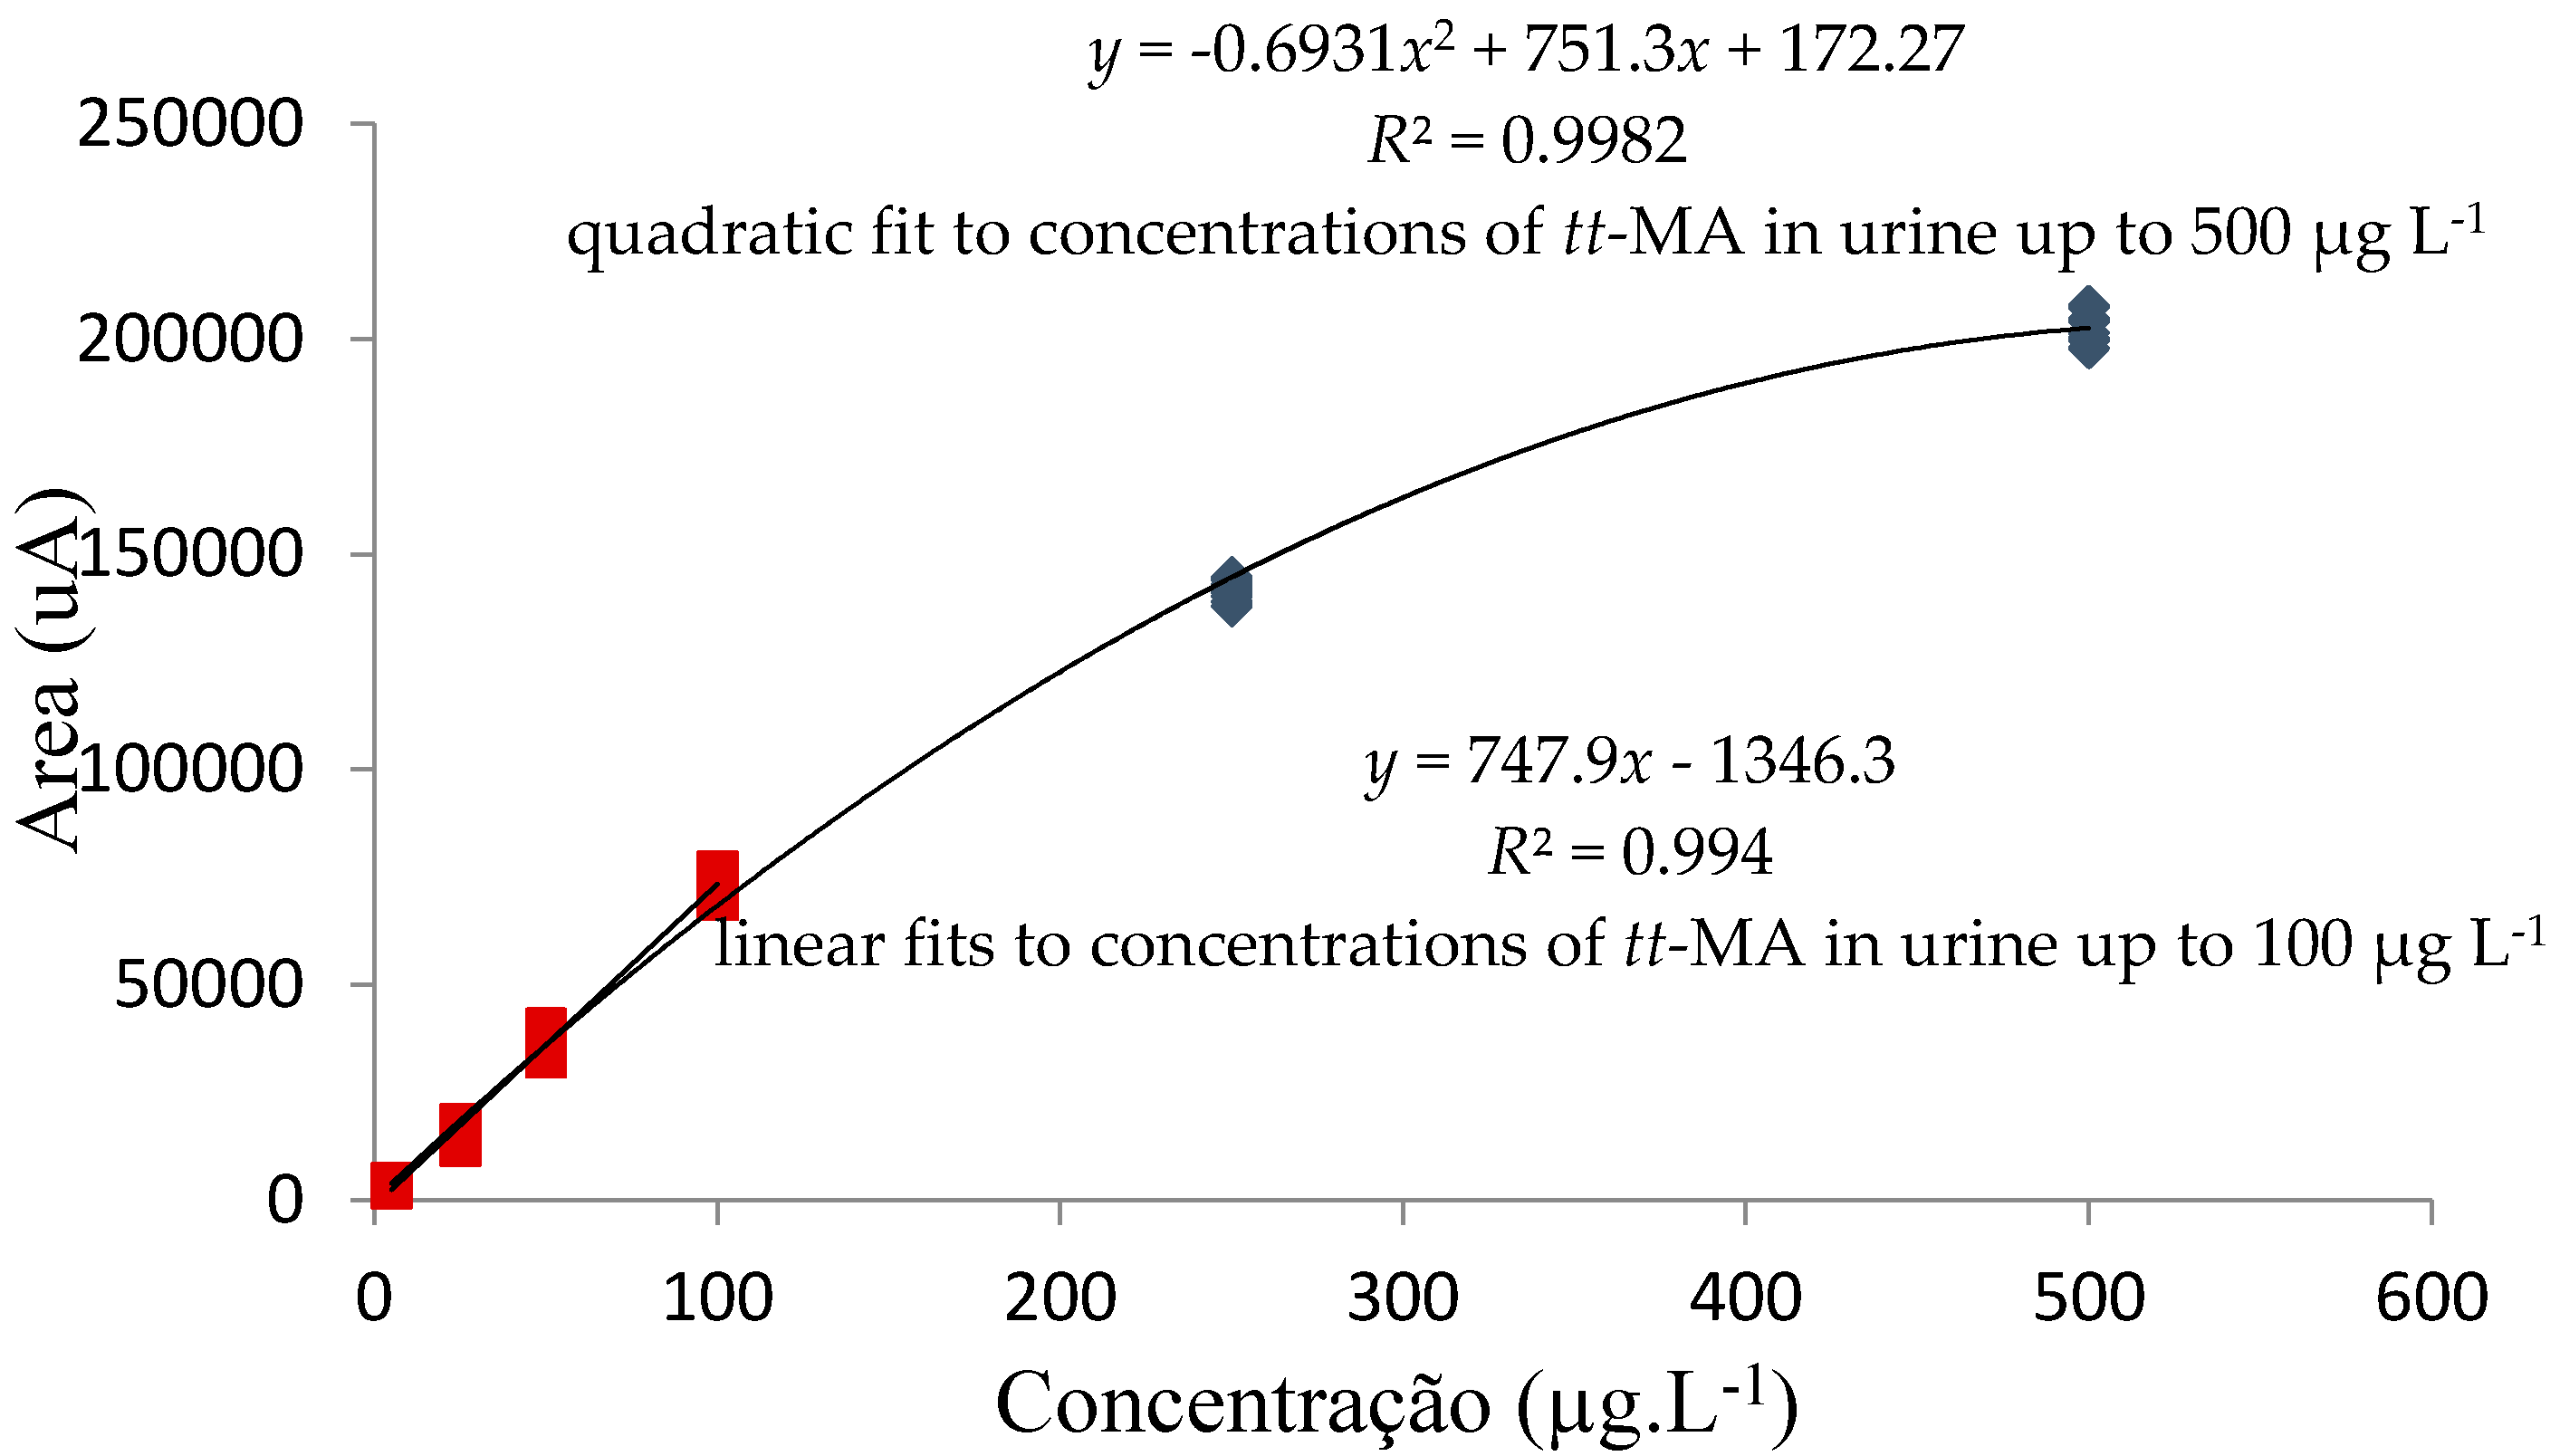
3.3.3. Analytical Curve Adjustment and Working Range

A coefficient of determination (R2) value exceeding 0.99 was obtained for linear fitting of the analytical curve prepared using aqueous tt-MA standards in the concentration range 5–500 µg·L−1. An R2 value of 0.98 was obtained for linear fitting of the curve prepared using standards prepared in the pooled urine at concentrations in the range 5–250 µg·L−1, while a quadratic fit with an R2 value exceeding 0.99 was obtained for standards prepared in the pooled urine at concentrations in the range 5–500 µg·L−1 (Figure 5). These results were in accordance with established norms and were considered satisfactory [48,52].
The concentrations used to determine the working range were based on tt-MA concentrations reported in the literature [42,50]. The results showed that linear fits (determination coefficient, R2 = 0.9909) could be applied to analytical curves prepared using concentrations of tt-MA in urine up to 100 µg·L−1. At higher concentrations (up to 500 µg·L−1), a quadratic fit (determination coefficient, R2 = 0.9982) could be used, or the samples could be diluted after the extraction step, in order to use the linear model.

3.3.4. Limits of Detection and Quantification

The limits of detection (LOD) and quantification (LOQ) of the method were calculated using the signal-to-noise ratio, as described previously. The values obtained were 0.11 µg·L−1 (LOD) and 0.36 µg·L−1 (LOQ).

3.3.5. Precision and Accuracy

The precision of the method was determined from the intra-experiment repeatability, considering the tt-MA concentrations obtained for one sample extract that was analyzed seven times on the same day. No evaluation was made of inter-experiment repeatability (analyses on different days). The results were calculated as coefficient of variation (CV) values (Table 6). The highest value obtained was 1.47%, demonstrating that the method provided good precision. The results also showed that the precision was independent of the amount of tt-MA present in the sample. Although the intermediate precision was not determined, the results indicated that there was little variation for the measurements made on different days or by different analysts.
The accuracy of the method was determined using the recovery of tt-MA standards added to the pooled urine at concentrations of 5.0, 50.0 and 500.0 µg·L−1. The concentration of tt-MA in the unfortified pooled urine was 88.6 µg·L−1, calculated using the linear equation describing the analytical curve constructed using aqueous standards.
The concentrations of tt-MA quantified in the fortified urine samples using the quadratic equation describing the analytical curve constructed using standards prepared in the pooled urine represented recoveries close to 100% (Table 7), with the exception of the sample fortified with 5.0 µg·L−1 of tt-MA, for which a recovery of 87.20% was obtained. The lower recovery found for an added concentration of 5 µg·L−1 can be explained by the fact that the concentration of tt-MA already present in the urine (88.6 µg·L−1) was much higher than the amount added. Ideally, the additions of tt-MA standard should be made to samples of urine containing lower levels of the analyte. However, it is impossible to obtain a priori knowledge of the concentrations of tt-MA in pooled urine samples. Despite the fact that the samples used here were obtained from volunteers for whom low concentrations of tt-MA were expected, metabolic differences between individuals contribute to uncertainty.
Although the quantification of urinary tt-MA using analytical curves constructed employing standards prepared in the pooled urine made the method more labor-intensive, the accuracy was much improved. In the case of analytical methods involving complex matrices, such as urine, recovery values in the range 80%–120% are acceptable [49,52]. The results obtained here could therefore be considered satisfactory. Although the analysis time was higher in these proposed conditions than using reverse phase, the results obtained here could therefore be considered satisfactory because the separation of the different compounds, particularly tt-muconic acid, was well performed by a combination of different mechanisms: hydrophobicity, size exclusion and ion exclusion. Thus, the chromatographic resolutions were much better, allowing a separation of tt-muconic acid at baseline without interference.

4. Conclusions

The method, not yet described in the literature, was optimized and validated for the determination of urinary tt-MA, using solid phase extraction with Strata SAX cartridges and chromatographic separation with an Aminex HPX 87H column. This method presented low limits of detection and quantification (0.11 and 0.36 µg·L−1, respectively) and better resolution compared to other techniques described in the literature.

Acknowledgments

The authors thank Federal University of Ouro Preto (UFOP), National Counsel of Technological and Scientific Development (CNPq)—financing 47983/2013-3 and Research Support Foundation of the State of Minas Gerais (FAPEMIG)—financing APQ 00918-13.

Author Contributions

Rafaela de Paiva Gomes participated in the research as an undergraduate student, and his research project was led by Mauricio Xavier Coutrim. The other authors, Ananda Lima Sanson, Fabiana Aparecida Lobo and Robson Jose de Cassia Franco Afonso, were collaborators in the development of the project at various stages of research.

Conflicts of Interest

The authors declare no conflict of interest.

References

  1. Protano, C.; Andreoli, R.; Manini, P.; Guidotti, M.; Vitali, M. A tobacco-related carcinogen: Assessing the impact of smoking behaviours of cohabitants on benzene exposure in children. Tob. Control 2012, 21, 325–329. [Google Scholar] [CrossRef] [PubMed]
  2. Guarieiro, L.L.N.; Vasconcellos, P.C.; Solci, M.C. Air Pollutants from the burning of fossil fuels and biofuels: A brief review. Rev. Virtual Quim. 2011, 3, 434–445. [Google Scholar] [CrossRef]
  3. Manini, P.; de Palma, G.; Andreoli, R.; Poli, D.; Mozzoni, P.; Folesani, G.; Mutti, A.; Apostoli, P. Environmental and biological monitoring of benzene exposure in a cohort of Italian taxi drivers. Toxicol. Lett. 2006, 167, 142–151. [Google Scholar] [CrossRef] [PubMed]
  4. Kivistö, H.; Pekari, K.; Peltonen, K.; Svinhufvud, J.; Veidebaum, T.; Sorsa, M.; Aitio, A. Biological monitoring of exposure to benzene in the production of benzene and in a cokery. Sci. Total Environ. 1997, 199, 49–63. [Google Scholar] [CrossRef]
  5. Choi, Y.; Shin, D.; Park, S.; Chung, Y.; Kim, M. Biological monitoring of benzene in residents living near petrochemical industrial areas in Korea. J. Occup. Health 2000, 42, 31–37. [Google Scholar] [CrossRef]
  6. Kirkeleit, J.; Riise, T.; Bråtveit, M.; Pekari, K.; Mikkola, J.; Moen, B.E. Biological monitoring of benzene exposure during maintenance work in crude oil cargo tanks. Chem.-Biol. Interact. 2006, 164, 60–67. [Google Scholar] [CrossRef] [PubMed]
  7. Brugnone, F.; Perbellini, L.; Maranelli, G.; Romeo, L.; Guglielmi, G.; Lombardini, F. Reference values for blood benzene in the occupationally unexposed general population. Int. Arch. Occup. Environ. Health 1992, 64, 179–184. [Google Scholar] [CrossRef]
  8. Aprea, C.; Sciarra, G.; Bozzi, N.; Pagliantini, M.; Perico, A.; Bavazzano, P.; Leandri, A.; Carrieri, M.; Scapellato, M.; Bettinelli, M.; et al. Reference Values of Urinary trans,trans-muconic Acid: Italian Multicentric Study. Arch. Environ. Contam. Toxicol. 2008, 55, 329–340. [Google Scholar] [CrossRef] [PubMed]
  9. Fustinoni, S.; Campo, L.; Mercadante, R.; Manini, P. Methodological issues in the biological monitoring of urinary benzene and S-phenylmercapturic acid at low exposure levels. J. Chromatogr. B 2010, 878, 2534–2540. [Google Scholar] [CrossRef] [PubMed]
  10. Waidyanatha, S.; Rothman, N.; Fustinoni, S.; Smith, M.T.; Hayes, R.B.; Bechtold, W.; Dosemeci, M.; Guilan, L.; Yin, S.; Rappaport, S.M. Urinary benzene as a biomarker of exposure among occupationally exposed and unexposed subjects. Carcinogenesis 2001, 22, 279–286. [Google Scholar] [CrossRef] [PubMed]
  11. Coutrim, M.X.; de Carvalho, L.R.F.; Arcuri, A.S.A. Evaluation of the analytical methods to determinate benzene metabolites as potencial biomarkers for determining human exposure to benzene in air. Quím. Nova 2000, 23, 653–663. [Google Scholar] [CrossRef]
  12. Ministry of Labor and Employment of Brazil. Portaria No. 34, 20 December 2001, Attachment: Protocolo para a Utilização de Indicador Biológico da Exposição Ocupacional ao Benzeno. Available online: http://www.capecanaveral4045.com/legislacao/port_34_2001_benzeno_indicador_biologico.html (accessed on 12 September 2015).
  13. Menezes, M.; Balbão, M.S.; Siqueira, M.E.P.B.; Martins, I. Influence of tobacco smoking on urinary excretion of trans,trans-muconic acid. Braz. J. Pharm. Sci. 2008, 44, 459–464. [Google Scholar]
  14. Roma-Torres, J.; Teixeira, J.P.; Silva, S.; Laffon, B.; Cunha, L.; Mendez, J.; Mayan, O. Evaluation of genotoxicity in a group of workers from a petroleum refinery aromatics plant. Mutat. Res. 2006, 604, 19–27. [Google Scholar] [CrossRef] [PubMed]
  15. Violante, F.; Sanguinetti, G.; Barbieri, A.; Accorsi, A.; Mattioli, S.; Cesari, R.; Fimognari, C.; Hrelia, P. Lack of correlation between environmental or biological indicators of benzene exposure at parts per billion levels and micronuclei induction. Environ. Res. 2003, 91, 135–142. [Google Scholar] [CrossRef]
  16. Kouniali, A.; Cicolella, A.; Gonzalez-Flesca, N.; Dujardin, R.; Gehanno, J.-F.; Bois, F.Y. Environmental benzene exposure assessment for parent-child pairs in Rouen. France. Sci. Total Environ. 2003, 308, 73–82. [Google Scholar] [CrossRef]
  17. Cocco, P.; Tocco, M.G.; Ibba, A.; Scano, L.; Ennas, M.G.; Flore, C.; Randaccio, F. trans,trans-Muconic acid excretion in relation to environmental exposure to benzene. Int. Arch. Occup. Environ. Health 2003, 76, 456–460. [Google Scholar] [CrossRef] [PubMed]
  18. Marrubini, G.; Coccini, T.; Manzo, L. Direct analysis of urinary trans,trans-muconic acid by coupled column liquid chromatography and spectrophotometric ultraviolet detection: Method applicability to human urine. J. Chromatogr. B 2001, 758, 295–303. [Google Scholar] [CrossRef]
  19. Waidyanatha, S.; Rothman, N.; Li, G.; Smith, M.T.; Yin, S.; Rappaport, S.M. Rapid determination of six urinary benzene metabolites in occupationally exposed and unexposed subjects. Anal. Biochem. 2004, 327, 184–199. [Google Scholar] [CrossRef] [PubMed]
  20. Kim, S.; Vermeulen, R.; Waidyanatha, S.; Johnson, B.A.; Lan, Q.; Rothman, N.; Smith, M.T.; Zhang, L.; Li, G.; Shen, M.; et al. Using urinary biomarkers to elucidate dose-related patterns of human benzene metabolism. Carcinogenesis 2006, 27, 772–781. [Google Scholar] [CrossRef] [PubMed]
  21. Mudiam, M.K.R.; Chauhan, A.; Singh, K.P.; Gupta, S.K.; Jain, R.; Ch, R.; Murthy, R.C. Determination of t,t-muconic acid in urine samples using a molecular imprinted polymer combined with simultaneous ethyl chloroformate derivatization and pre-concentration by dispersive liquid-liquid microextraction. Anal. Bioanal. Chem. 2013, 405, 341–349. [Google Scholar] [CrossRef] [PubMed]
  22. Sørensen, M.; Skov, H.; Autrup, H.; Hertel, O.; Loft, S. Urban benzene exposure and oxidative DNA damage: Influence of genetic polymorphisms in metabolism genes. Sci. Total Environ. 2003, 309, 69–80. [Google Scholar] [CrossRef]
  23. Wiwanitkit, V.; Suwansaksri, J.; Soogarun, S. A note on urine trans, trans muconic acid level among a sample of Thai police: Implication for an occupational health issue. Yale J. Biol. Med. 2003, 76, 103–108. [Google Scholar] [PubMed]
  24. Ruppert, T.; Scherer, G.; Tricker, A.R.; Rauscher, D.; Adlkofer, F. Determination of urinary trans,trans-muconic acid by gas chromatography-mass spectrometry. J. Chromatogr. B 1995, 666, 71–76. [Google Scholar] [CrossRef]
  25. Franqui, L.S.; Vieira, A.C.; Maia, P.P.; Figueiredo, E.C. Molecularly imprinted solid-phase extraction of urinary trans,trans-muconic acid and analysis by gas chromatography-mass spectrometry. Quím. Nova 2012, 35, 1577–1581. [Google Scholar] [CrossRef]
  26. Johnson, E.S.; Langård, S.; Lin, Y.-S. A critique of benzene exposure in the general population. Sci. Total Environ. 2007, 374, 183–198. [Google Scholar] [CrossRef] [PubMed]
  27. Ducos, P.; Gaudin, R.; Robert, A.; Francin, J.; Maire, C. Improvement in HPLC analysis of urinary trans,trans-muconic acid, a promising substitute for phenol in the assessment of benzene exposure. Int. Arch. Occup. Environ. Health 1990, 62, 529–534. [Google Scholar] [CrossRef] [PubMed]
  28. Negri, S.; Bono, R.; Maestri, L.; Ghittori, S.; Imbriani, M. High-pressure liquid chromatographic-mass spectrometric determination of sorbic acid in urine: Verification of formation of trans,trans-muconic acid. Chem.-Biol. Interact. 2005, 153, 243–246. [Google Scholar] [CrossRef] [PubMed]
  29. Schroijen, C.; Baeyens, W.; Schoeters, G.; den Hond, E.; Koppen, G.; Bruckers, L.; Nelen, V.; van de Mieroop, E.; Bilau, M.; Covaci, A.; et al. Internal exposure to pollutants measured in blood and urine of Flemish adolescents in function of area of residence. Chemosphere 2008, 71, 1317–1325. [Google Scholar] [CrossRef] [PubMed]
  30. Serena, P.; Tapparo, A.; Bombi, G. Direct determination of t,t-muconic acid in human urine by two-dimensional liquid chromatography. Analyst 2000, 125, 689–692. [Google Scholar] [CrossRef] [PubMed]
  31. Melikian, A.A.; Connor, R.; Prahalad, A.; Hu, P.; Li, H.; Kagan, M.; Thompson, S. Determination of the urinary benzene metabolites S-phenylmercapturic acid and trans,trans-muconic acid by liquid chromatography-tandem mass spectrometry. Carcinogenesis 1999, 20, 719–726. [Google Scholar] [CrossRef] [PubMed]
  32. Senzolo, C.; Frignani, S.; Pavoni, B. Environmental and biological monitoring of occupational exposure to organic micropollutants in gasoline. Chemosphere 2001, 44, 67–82. [Google Scholar] [CrossRef]
  33. Barbieri, A.; Sabatini, L.; Accorsi, A.; Roda, A.; Violante, F. Simultaneous determination of t,t-muconic, S-phenylmercapturic and S-benzylmercapturic acids in urine by a rapid and sensitive liquid chromatography/electrospray tandem mass spectrometry method. Rapid Commun. Mass Spectrom. 2004, 18, 1983–1988. [Google Scholar] [CrossRef] [PubMed]
  34. Manini, P.; Andreoli, R.; Niessen, W.M.A. Liquid chromatography-mass spectrometry in occupational toxicology: A novel approach to the study of biotransformation of industrial chemicals. J. Chromatogr. A 2004, 1058, 21–37. [Google Scholar] [CrossRef]
  35. Fustinoni, S.; Buratti, M.; Campo, L.; Colombi, A.; Consonni, D.; Pesatori, A.C.; Bonzini, M.; Farmer, P.; Garte, S.; Valerio, F.; et al. Urinary t,t-muconic acid, S-phenylmercapturic acid and benzene as biomarkers of low benzene exposure. Chem.-Biol. Interact. 2005, 153, 253–256. [Google Scholar] [CrossRef] [PubMed]
  36. Lee, B.; Ong, H.; Ong, Y.; Ong, C. A sensitive liquid chromatographic method for the spectrophotometric determination of urinary trans,trans-muconic acid. J. Chromatogr. B 2005, 818, 277–283. [Google Scholar] [CrossRef] [PubMed]
  37. Navasumrit, P.; Chanvaivit, S.; Intarasunanont, P.; Arayasiri, M.; Lauhareungpanya, N.; Parnlob, V.; Settachan, D.; Ruchirawat, M. Environmental and occupational exposure to benzene in Thailand. Chem.-Biol. Interact. 2005, 153, 75–83. [Google Scholar] [CrossRef] [PubMed]
  38. Carrieri, M.; Bonfiglio, E.; Scapellato, M.L.; Maccà, I.; Tranfo, G.; Faranda, P.; Paci, E.; Bartolucci, G.B. Comparison of exposure assessment methods in occupational exposure to benzene in gasoline filling-station attendants. Toxicol. Lett. 2006, 162, 146–152. [Google Scholar] [CrossRef] [PubMed]
  39. Scherer, G.; Engl, J.; Urban, M.; Gilch, G.; Janket, D.; Riedel, K. Relationship between machine-derived smoke yields and biomarkers in cigarette smokers in Germany. Regul. Toxicol. Pharm. 2007, 47, 171–183. [Google Scholar] [CrossRef] [PubMed]
  40. Ray, M.; Roychoudhury, S.; Mukherjee, S.; Lahiri, T. Occupational benzene exposure from vehicular sources in India and its effect on hematology, lymphocyte subsets and platelet P-selectin expression. Toxicol. Ind. Health 2007, 23, 167–175. [Google Scholar] [CrossRef] [PubMed]
  41. Chakroun, R.; Faidi, F.; Hedhili, A.; Charbaji, K.; Nouaigui, H.; Laiba, M.B. Inhalant Abuse Detection and Evaluation in Young Tunisians. J. Forensic Sci. 2008, 53, 232–237. [Google Scholar] [CrossRef] [PubMed]
  42. Weaver, V.; Buckley, T.; Groopman, J.D. Lack of specificity of trans,trans-muconic acid as a benzene biomarker after ingestion of sorbic acid-preserved foods. Cancer Epidemiol. Biomarkers Prev. 2000, 9, 749–755. [Google Scholar] [PubMed]
  43. Fritz, J.S. Review: Principles and applications of ion-exclusion chromatography. J. Chromatogr. 1991, 546, 111–118. [Google Scholar] [CrossRef]
  44. Kelebek, H.; Selli, S. Determination of volatile, phenolic, organic acid and sugar components in a Turkish cv. Dortyol (Citrus sinensis L. Osbeck) orange juice. J. Agric. Food Chem. 2011, 91, 1855–1862. [Google Scholar] [CrossRef] [PubMed]
  45. Eyeghe-Bickong, H.; Alexandersson, E.O.; Gouws, L.; Young, P.; Vivier, M.A. Optimisation of an HPLC method for the simultaneous quantification of the major sugars and organic acids in grapevine berries. J. Chromatogr. B 2012, 885, 43–49. [Google Scholar] [CrossRef] [PubMed]
  46. Jeon, J.; Brigham, C.J.; Kim, Y.; Kim, H.; Yi, D.; Kim, H.; Rha, C.; Sinskey, A.; Yang, Y. Biosynthesis of poly(3-hydroxybutyrate-co-3-hydroxyhexanoate) (P(HB-co-HHx)) from butyrate using engineered Ralstonia eutropha. Appl. Microbiol. Biotech. 2014, 98, 5461–5469. [Google Scholar] [CrossRef] [PubMed]
  47. Teófilo, R.F.; Ferreira, M.M.C. Chemometrics II: Spreadsheets for experimental design calculations, a tutorial. Quím. Nova 2006, 29, 338–350. [Google Scholar] [CrossRef]
  48. Brazil, National Institute of Metrology (INMETRO). Orientação Sobre Validação de Métodos Analíticos, 3rd Review, February 2010. Available online: http://www.inmetro.gov.br/sidoq/arquivos/cgcre/doq/doq-cgcre-8_03.pdf (accessed on 14 September 2015).
  49. Ribani, M.; Bottoli, C.B.G.; Collins, C.H.; Jardim, I.C.S.F.; Melo, L.F.C. Validation for chromatographic and electrophoretic methods. Quím. Nova 2004, 27, 771–780. [Google Scholar] [CrossRef]
  50. Martins, I.; Siqueira, M.E.P.B. Determination of trans,trans-muconic acid in urine: Validation of a high performance liquid chromatographic method. Braz. J. Pharmac. Sci. 2002, 38, 205–213. [Google Scholar]
  51. Tranfo, G.; Paci, E.; Sisto, R.; Pigini, D. Validation of an HPLC/MS/MS method with isotopic dilution for quantitative determination of trans,trans-muconic acid in urine samples of workers exposed to low benzene concentrations. J. Chromatogr. B 2008, 867, 26–31. [Google Scholar] [CrossRef] [PubMed]
  52. Brazilian National Health Surveillance Agency (ANVISA). Resolution RE No. 899, 29 May 2003, Attachment: Guia para Validação de Métodos Analíticos e Bioanalíticos, pp. 56–59. Available online: http://pesquisa.in.gov.br/imprensa/jsp/visualiza/index.jsp?data=02/06/2003&jornal=1&pagina=56&totalArquivos=176 (accessed on 14 September 2015).
Figure 1. Flow diagram illustrating the sample cleanup procedure. tt-MA, trans,trans-muconic acid.
Separations 03 00014 g001
Figure 2. Normal probability plot showing the effects of sample buffering (C1), removal of interferents (C2), final volume (C3) and sample volume (C4).
Separations 03 00014 g002
Figure 3. Chromatograms obtained for the separation of tt-MA using the Aminex HPX-87H (300 mm × 7.8 mm) ion exchange column with a mobile phase of 0.01 mol·L−1 sulfuric acid at a flow rate of 0.6 mL·min−1, detection by diode array detector (DAD) at 264 nm. Chromatogram A: standard solution of tt-MA (500 µg·L−1); Chromatogram B: in natura urine sample.
Separations 03 00014 g003
Figure 4. Analytical curves obtained for the determination of trans,trans-muconic acid in urine. The square red and blue points correspond to the values obtained for standards prepared in aqueous solution and pooled urine, respectively.
Separations 03 00014 g004
Figure 5. Analytical curves constructed using standards (nine replicates) prepared in pooled urine.
Separations 03 00014 g005
Table 1. Variables and levels used in the 24−1 fractional factorial design.
VariableLevel
−101
Solution bufferingNo bufferingpH 8.0pH 10.0
Removal of interferents (washing)No addition of water1.5 mL of water3.0 mL of water
Final volume3.0 mL4.0 mL5.0 mL
Sample volume1.0 mL2.0 mL3.0 mL
Table 2. Investigation of the experimental variables using a 24−1 fractional factorial design with three replicates at the central point (CP).
VariableBuffering of the SolutionWashingFinal VolumeSample Volume
Tests
Test 1no buffering (−1)no water addition (−1)3.0 mL (−1)1.0 mL (−1)
Test 2pH 10.0 (1)no water addition (−1)3.0 mL (−1)3.0 mL (1)
Test 3no buffering (−1)3.0 mL of water (1)3.0 mL (−1)3.0 mL (1)
Test 4pH 10.0 (1)3.0 mL of water (1)3.0 mL (−1)1.0 mL (−1)
Test 5no buffering (−1)no water addition (−1)5.0 mL (1)3.0 mL (1)
Test 6pH 10.0 (1)no water addition (−1)5.0 mL (1)1.0 mL (−1)
Test 7no buffering (−1)3.0 mL of water (1)5.0 mL (1)1.0 mL (−1)
Test 8pH 10.0 (1)3.0 mL of water (1)5.0 mL (1)3.0 mL (1)
CP 1pH 8.0 (0)1.5 mL of water (0)4.0 mL (0)2.0 mL (0)
CP 2pH 8.0 (0)1.5 mL of water (0)4.0 mL (0)2.0 mL (0)
CP 3pH 8.0 (0)1.5 mL of water (0)4.0 mL (0)2.0 mL (0)
Note: Level (1): highest value; Level (−1): lowest value; Level (0): central point (CP).
Table 3. Optimization using the 24−1 fractional factorial design. X1: buffering of sample; X2: removal of interferents; X3: final volume; X4: sample volume; y: area of the tt-MA peak.
TestX1X2X3X4y
1−1−1−1−1106,519
21−1−1138,378
3−11−11116,419
411−1−133,805
5−1−111124,593
61−11−114,086
7−111−144,460
8111114,293
CP1000038,802
CP2000037,527
CP3000037,513
CP (mean)37,947
CP (standard deviation)740.2
CP (RSD, %)1.95
Table 4. Optimized sample preparation conditions.
ParameterCondition
BufferingNone
Sample volume3.0 mL
Sample washing5.0 mL of acetic acid (1%)
Final volume5.0 mL of acetic acid (10%)
Table 5. Optimized chromatographic conditions employed for the validation of the method for the determination of trans,trans-muconic acid.
Chromatographic ConditionsDescription
ColumnAminex HPX-87H (300 mm × 7.8 mm) ion exclusion
Mobile phase flow rate0.6 mL·min−1
Injection volume20 μL (automatic injection system)
Column temperature55 °C
Run time60 min
Table 6. Coefficients of variation (CV) for the determination of tt-MA in the pooled urine sample and in pooled urine enriched with tt-MA at concentrations of 5.0, 50.0 and 500.0 µg·L−1, using nine replicates (n = 9).
Urine SampleAverage Peak Area (µA)CV (%)
Pool of 10 samples96,4611.22
Pool with addition of 5.0 µg·L−199,8920.53
Pool with addition of 50.0 µg·L−1133,0921.47
Pool with addition of 500 µg·L−1299,5461.16
Table 7. Recoveries obtained for quantification using the analytical curve constructed using standards prepared in the pooled urine from ten non-smoker volunteers. Amounts of tt-MA standard equivalent to concentrations of 5.0, 50.0 and 500.0 µg·L−1 were added to pooled urine with a tt-MA content of 88.6 µg·L−1 (n = 9).
Concentration of tt-MA Added (µg·L−1)Concentration of tt-MA Found (µg·L−1)Recovery (%)
5.04.487.20
50.050.9101.84
500.0510.6102.12

