
Quantification of Temozolomide in Nonhuman Primate Fluids by Isocratic Ultra-High Performance Liquid Chromatography-Tandem Mass Spectrometry to Study Brain Tissue Penetration Following Intranasal or Intravenous Delivery

Abstract
:1. Introduction
2. Experimental Section
2.1. Materials
2.2. Preparation of Stock Solutions
2.3. Sample Preparation
2.3.1. Plasma and CSF
2.3.2. MD Extracellular Fluid
2.4. Instrument Conditions
2.5. Validation
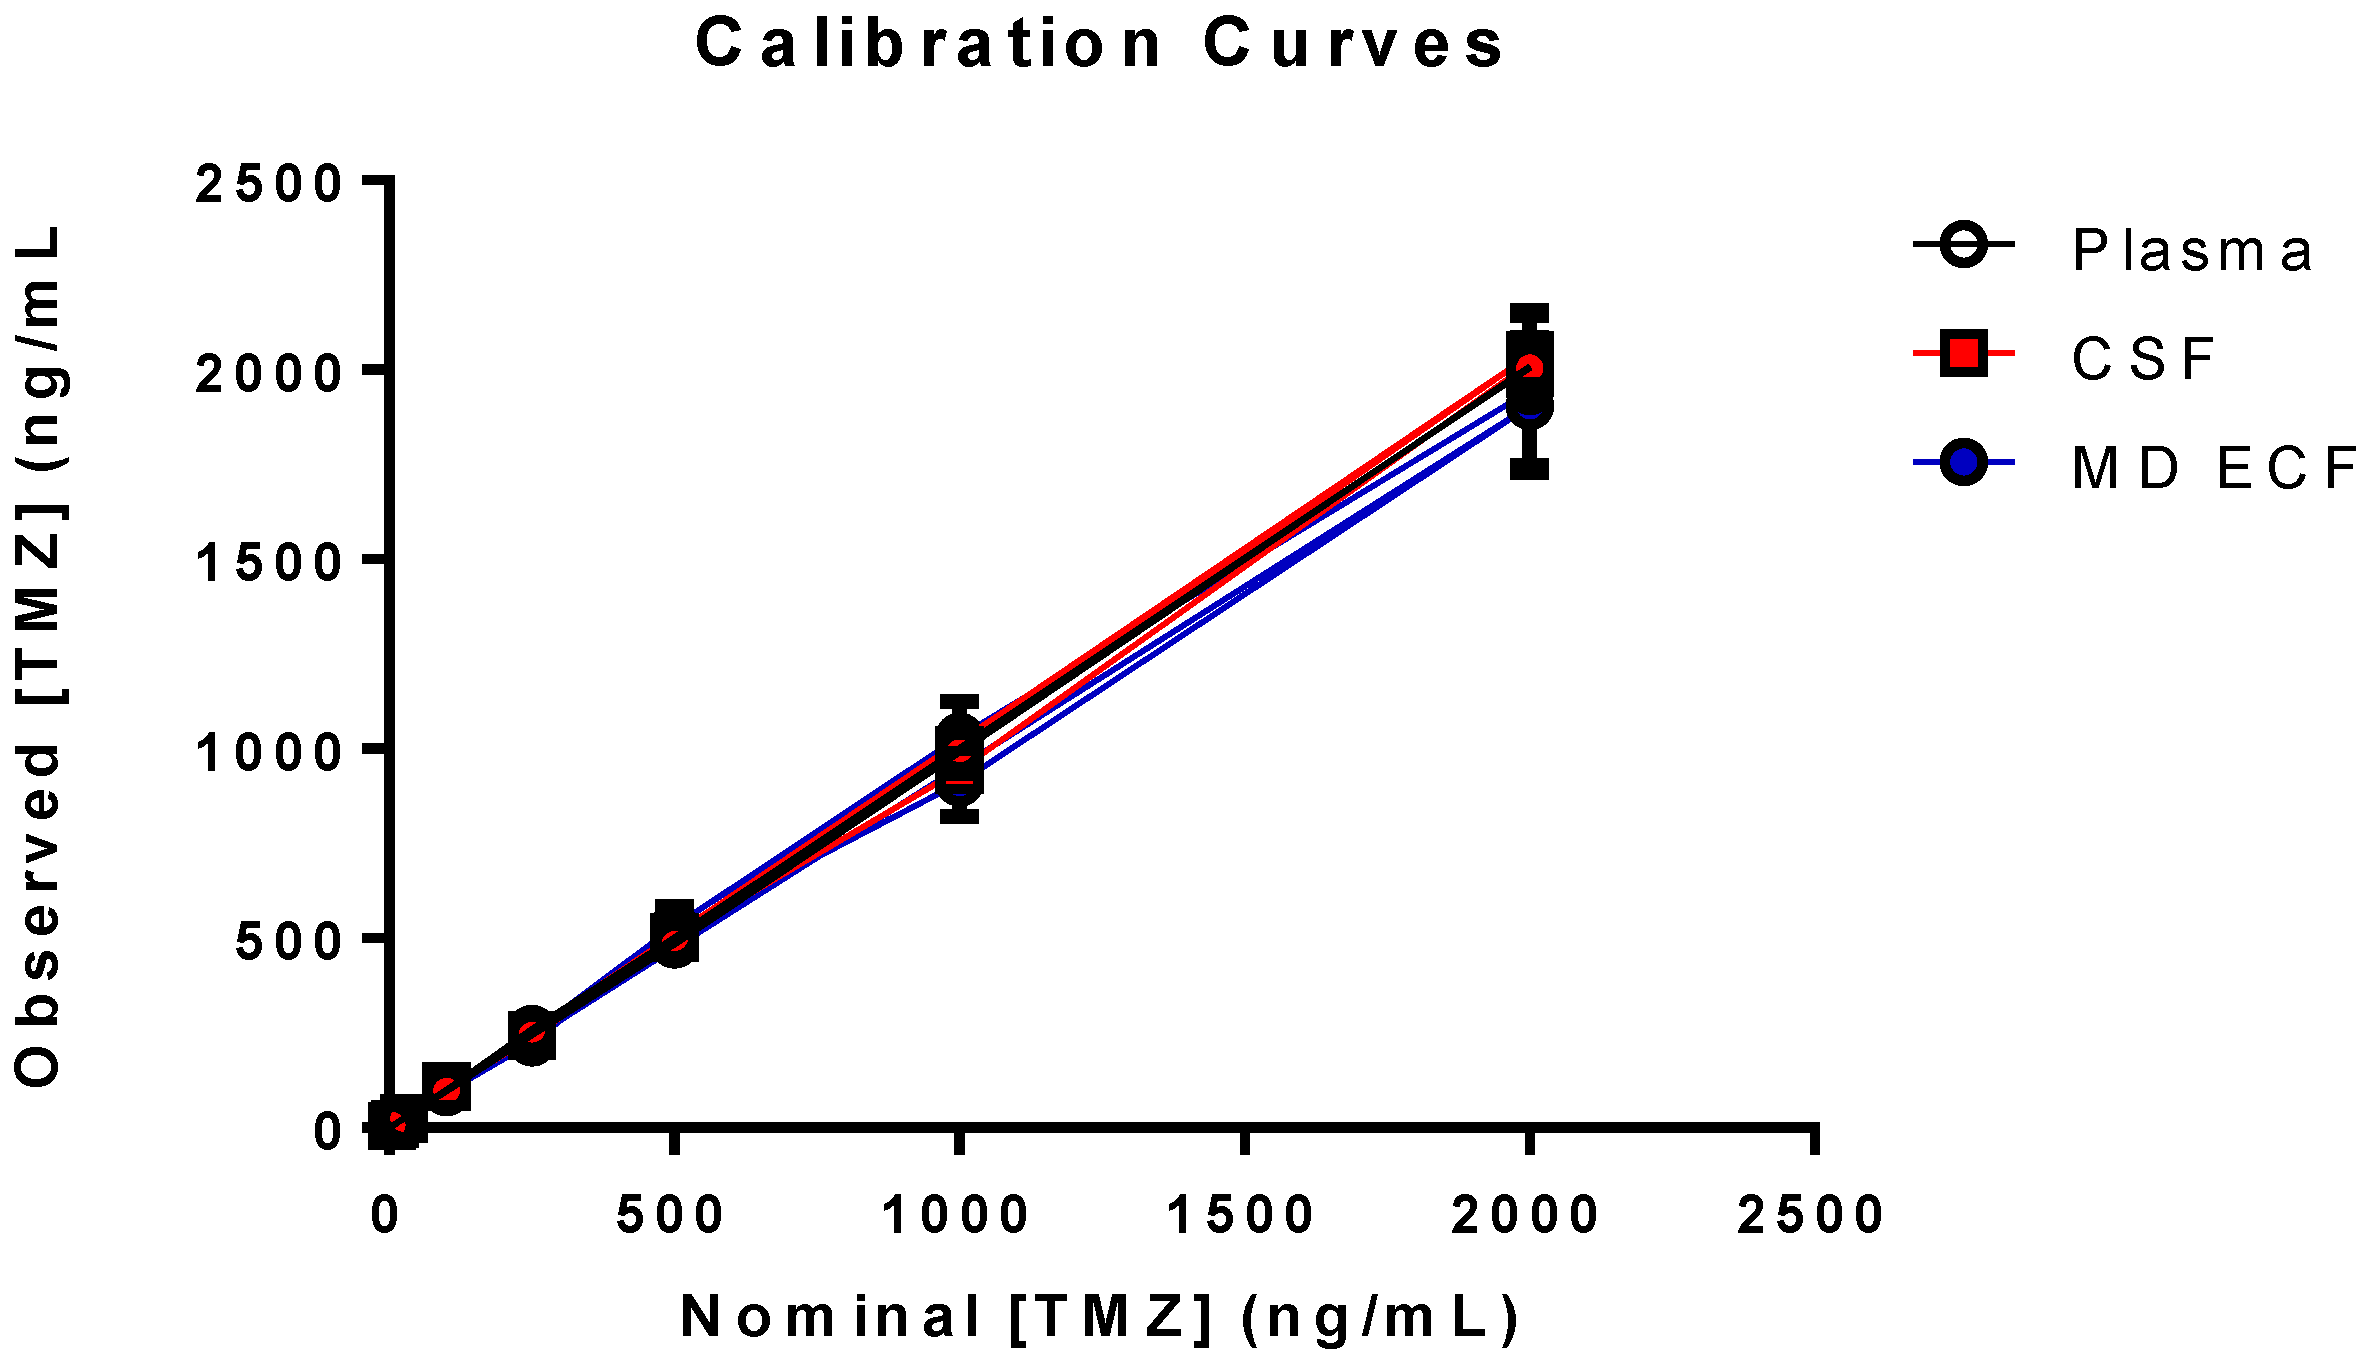
2.5.1. Linearity
2.5.2. Accuracy and Precision
2.5.3. Stability
2.5.4. Extraction Recovery and Matrix Effects
| A = mean area count of Set 3 for one concentration level |
| B = mean area count of Set 2 for one concentration level |
2.6. Application
3. Results and Discussion
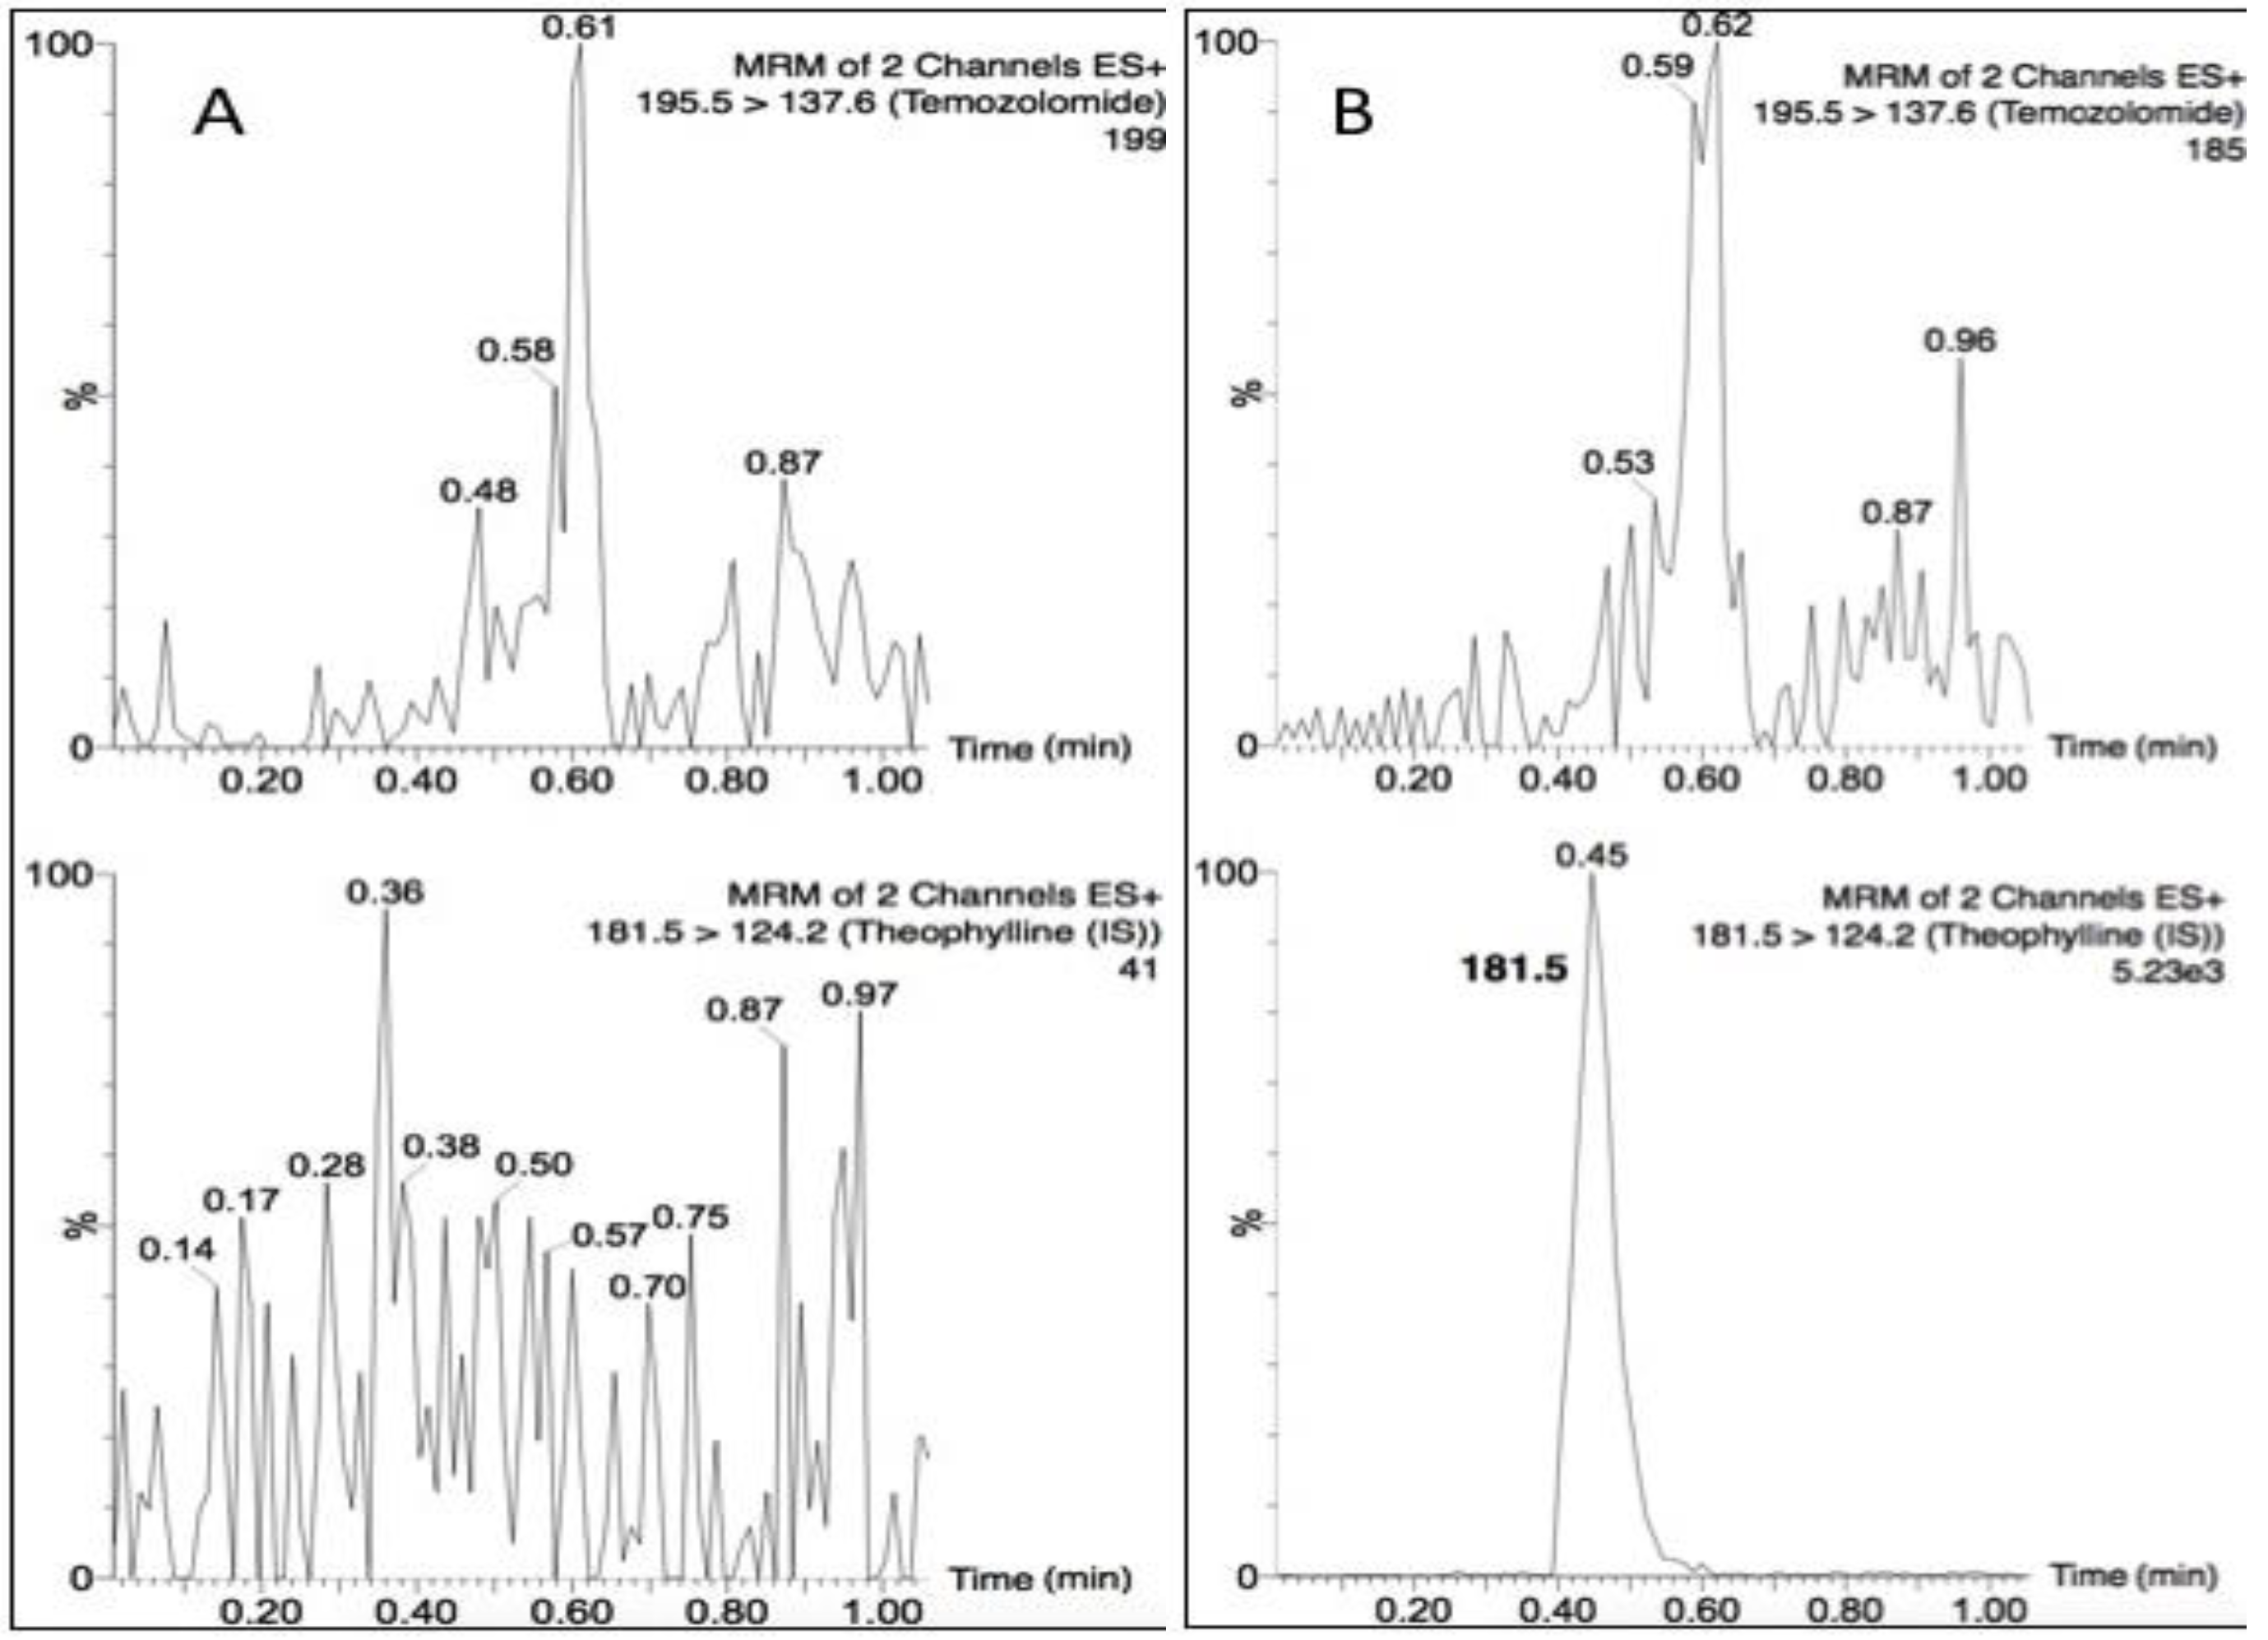
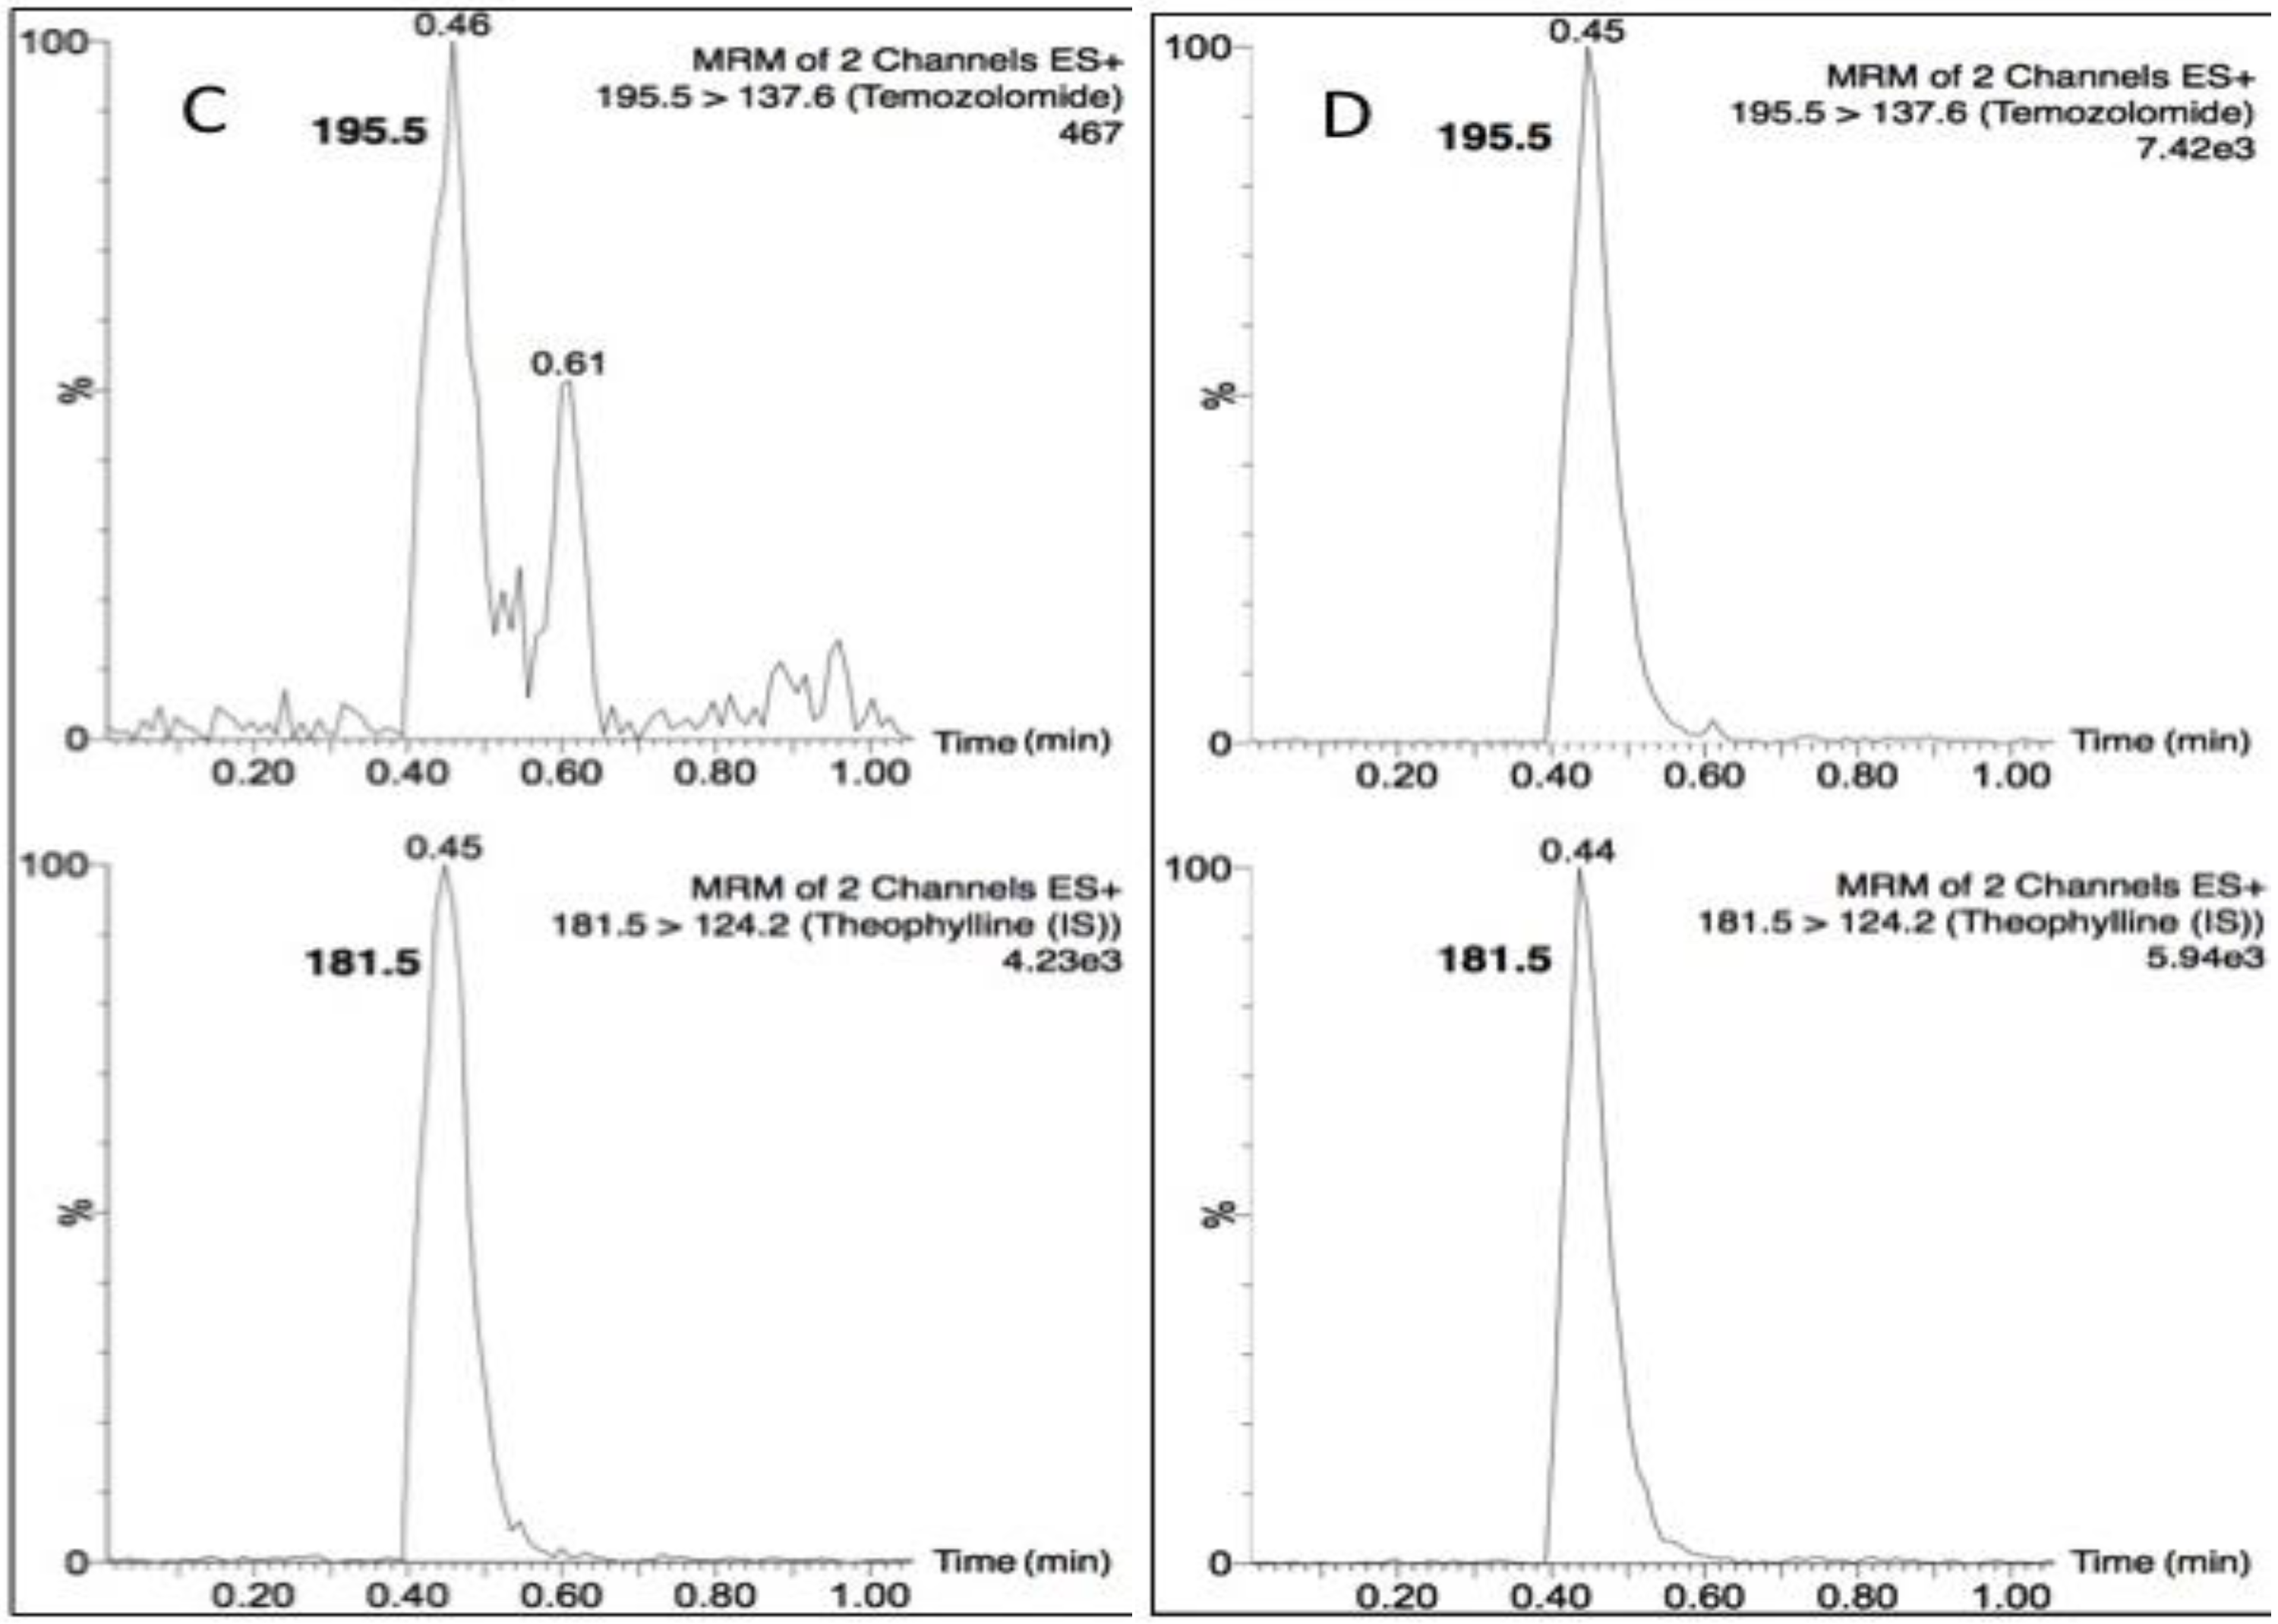
3.1. Selectivity


3.2. Validation

| Nominal (ng/mL) | GM (ng/mL) | SD (ng/mL) | Accuracy (%) | WRP (%) | BRP (%) | n |
|---|---|---|---|---|---|---|
| 15 | 15.5 | 2.9 | 103 | 13.7 | 14.7 | 20 |
| 800 | 795 | 45.2 | 99.4 | 5.2 | 2.6 | 20 |
| 1600 | 1593 | 76.3 | 99.5 | 4.5 | 1.9 | 20 |
| 50,000 | 50,325 | 5,150 | 101. | 7.0 | 8.4 | 20 |
| Nominal (ng/mL) | GM (ng/mL) | SD (ng/mL) | Accuracy (%) | WRP (%) | BRP (%) | n |
|---|---|---|---|---|---|---|
| 15 | 13.3 | 1.4 | 88.6 | 10.0 | 3.1 | 15 |
| 800 | 809 | 54.4 | 101 | 4.2 | 6.2 | 15 |
| 1600 | 1583 | 102 | 99 | 6.2 | 1.8 | 15 |
| 50,000 | 51,580 | 5373 | 96.8 | 9.6 | 4.8 | 15 |
| Nominal (ng/mL) | GM (ng/mL) | SD (ng/mL) | Accuracy (%) | WRP (%) | BRP (%) | n |
|---|---|---|---|---|---|---|
| 15 | 15.1 | 1.8 | 101 | 8.0 | 8.6 | 20 |
| 800 | 8109 | 59.4 | 101 | 6.8 | 2.3 | 20 |
| 1600 | 1646 | 149 | 103 | 8.7 | 3.9 | 20 |
| 5000 | 5289 | 331 | 106 | 4.9 | 4.2 | 20 |
3.3. Stability
3.4. Extraction Recovery and Matrix Effects
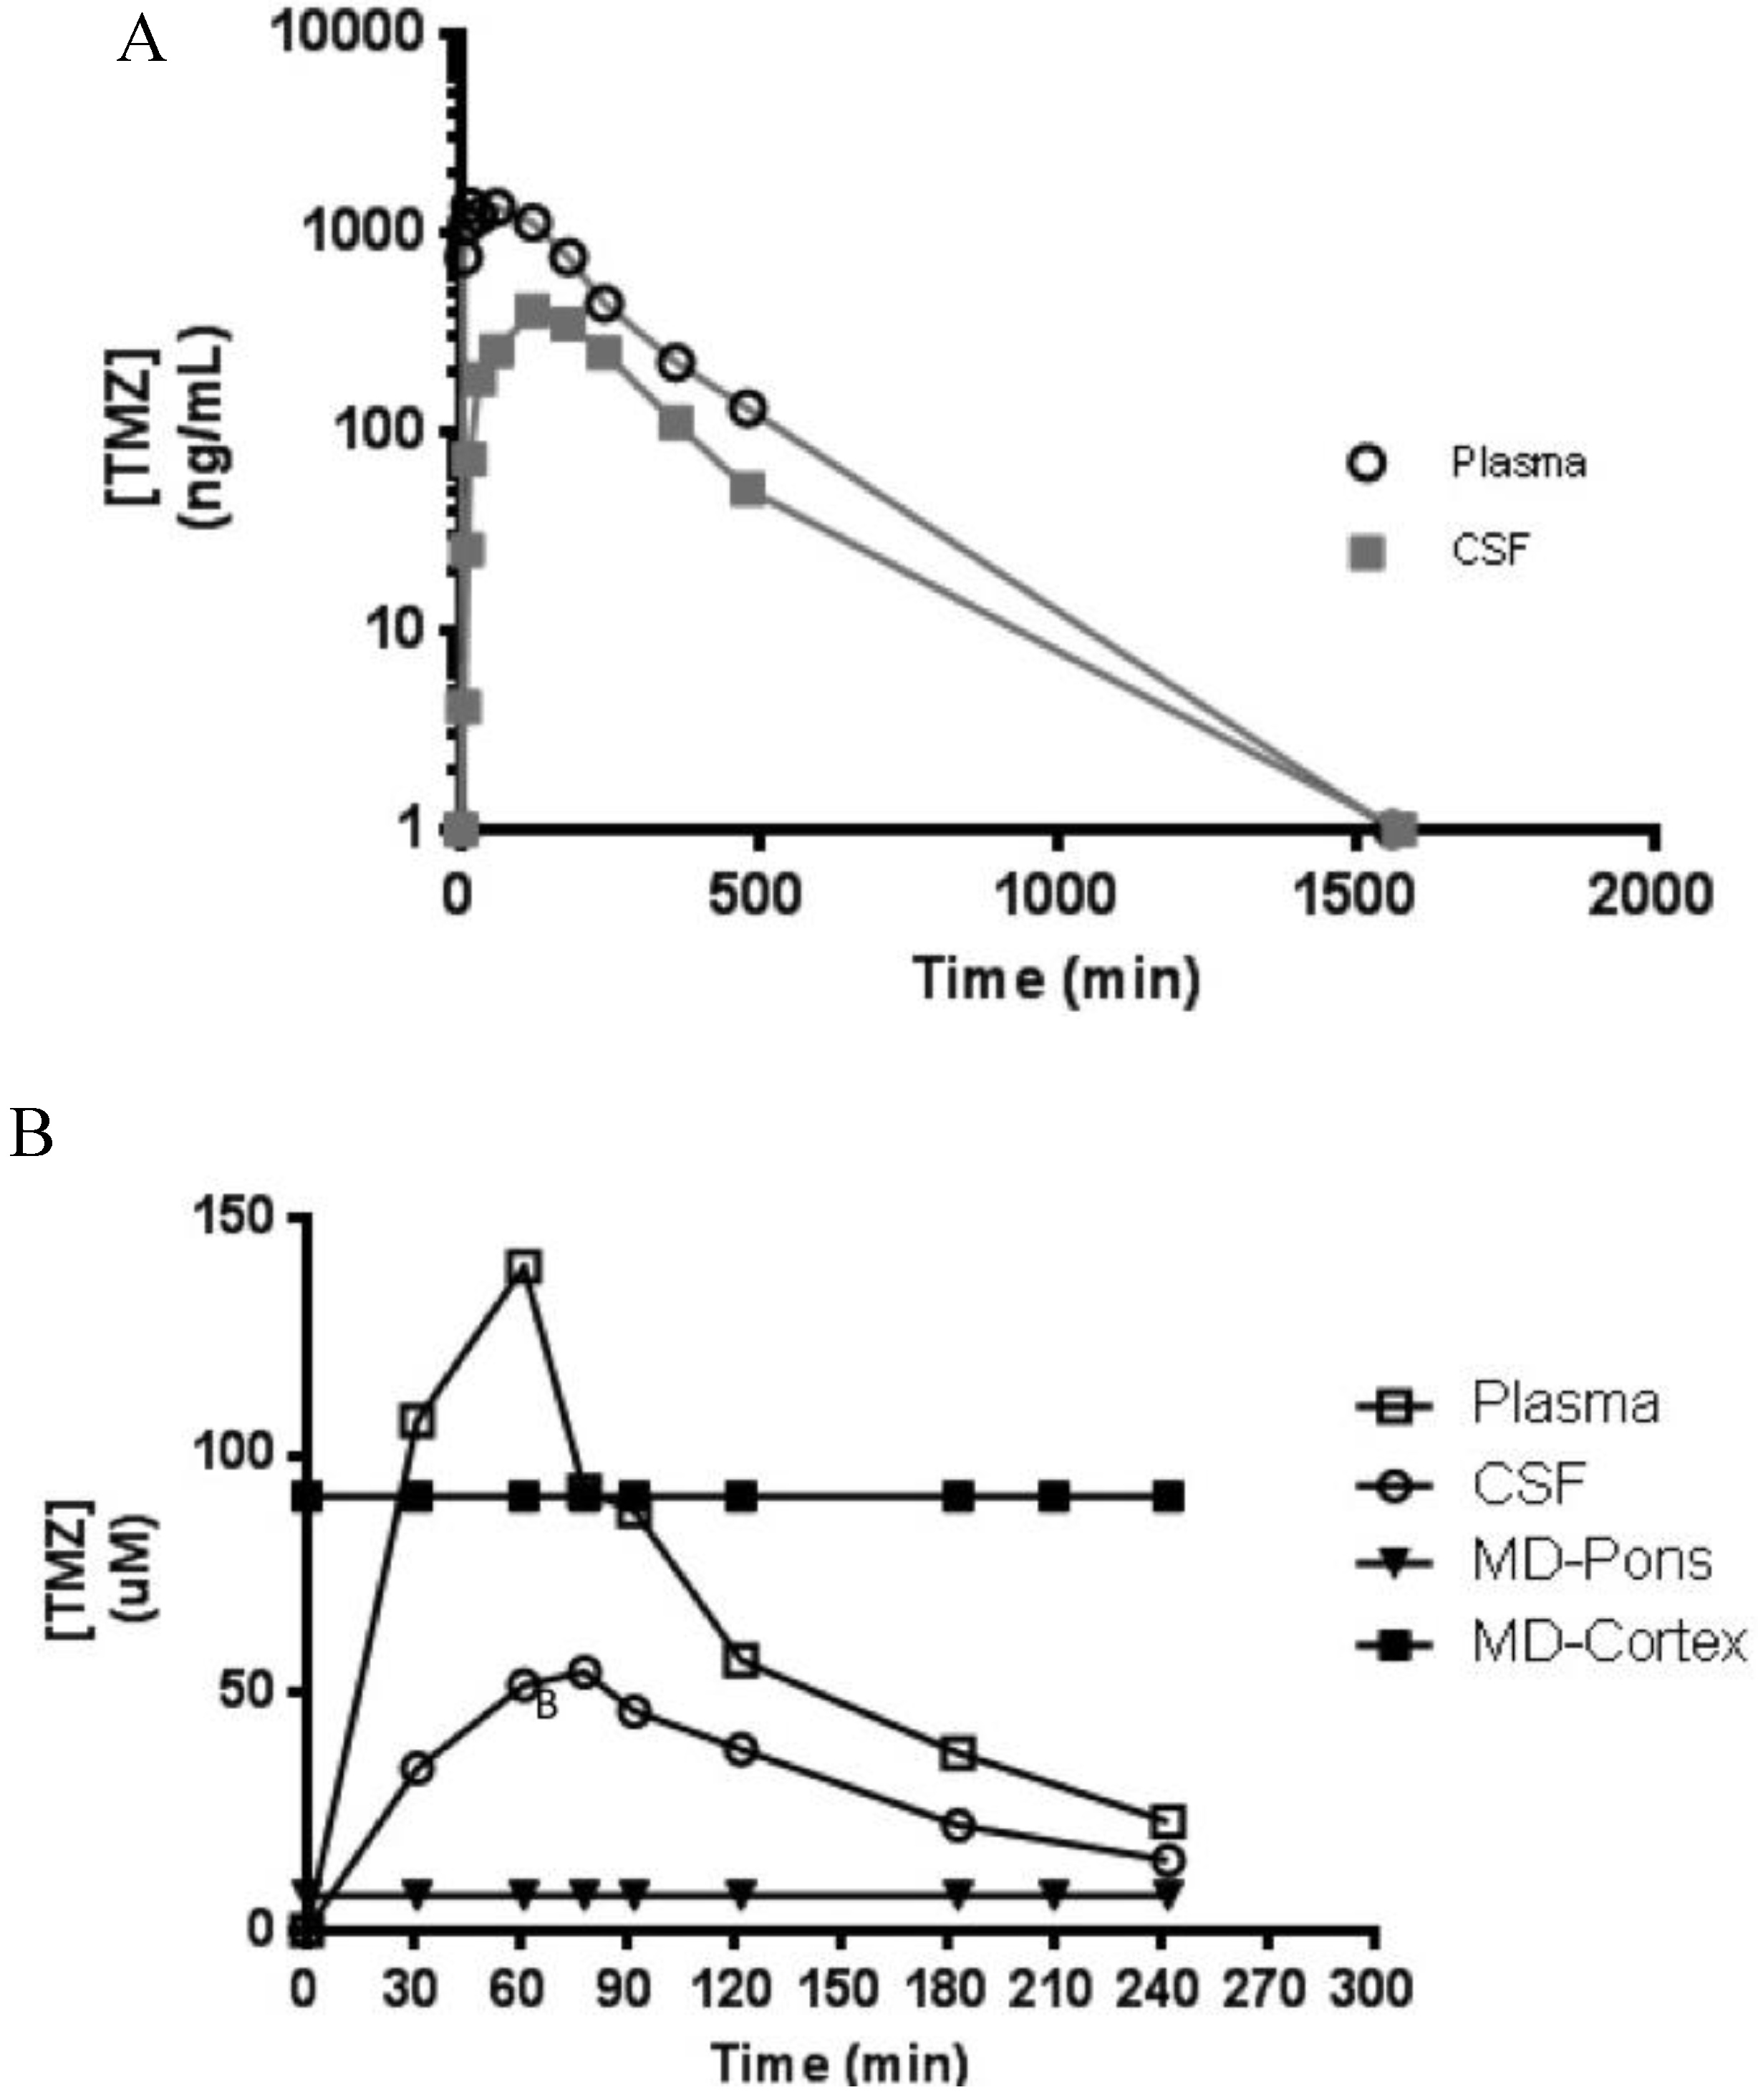
3.5. Clinical Application

4. Conclusions
Disclaimer
Acknowledgments
Author Contributions
Conflicts of Interest
Abbreviations
| UHPLC | ultra-high performance liquid chromatography |
| MS | mass spectrometry |
| MS/MS | tandem mass spectrometry |
| QC | Quality control |
| LLOQ | Lower limit of quantification |
| NHP | nonhuman primates |
| CSF | cerebrospinal fluid |
| MD | microdialysis |
| PK | pharmacokinetics |
| ECF | extracellular fluid |
References
- Denny, B.J.; Wheelhouse, R.T.; Stevens, M.F.; Tsang, L.L.; Slack, J.A. NMR and molecular modeling investigation of the mechanism of activation of the antitumor drug temozolomide and its interaction with DNA. Biochemistry 1994, 33, 9045–9051. [Google Scholar] [PubMed]
- Stupp, R.; Mason, W.P.; van den Bent, M.J.; Weller, M.; Fisher, B.; Taphoorn, M.J.; Belanger, K.; Brandes, A.A.; Marosi, C.; Bogdahn, U.; et al. Radiotherapy plus concomitant and adjuvant temozolomide for glioblastoma. New Engl. J. Med. 2005, 352, 987–996. [Google Scholar] [PubMed]
- Ostermann, S.; Csajka, C.; Buclin, T.; Leyvraz, S.; Lejeune, F.; Decosterd, L.A.; Stupp, R. Plasma and cerebrospinal fluid population pharmacokinetics of temozolomide in malignant glioma patients. Clin. Cancer Res. 2004, 10, 3728–3736. [Google Scholar] [PubMed]
- Newlands, E.S.; Stevens, M.F.; Wedge, S.R.; Wheelhouse, R.T.; Brock, C. Temozolomide: A review of its discovery, chemical properties, pre-clinical development and clinical trials. Cancer Treat. Rev. 1997, 23, 35–61. [Google Scholar] [PubMed]
- McCully, C.L.; Balis, F.M.; Bacher, J.; Phillips, J.; Poplack, D.G. A rhesus monkey model for continuous infusion of drugs into cerebrospinal fluid. Lab. Anim. Sci. 1990, 40, 520–525. [Google Scholar] [PubMed]
- Patel, M.; McCully, C.; Godwin, K.; Balis, F.M. Plasma and cerebrospinal fluid pharmacokinetics of intravenous temozolomide in non-human primates. J. Neurooncol. 2003, 61, 203–207. [Google Scholar] [PubMed]
- McCully, C.M.; Pastakia, D.; Bacher, J.; Thomas, M.L., 3rd; Steffen-Smith, E.A.; Saleem, K.; Murphy, R.F.; Walbridge, S.; Brinster, L.; Widemann, B.C.; et al. Model for concomitant microdialysis sampling of the pons and cerebral cortex in rhesus macaques (Macaca mulatta). Comp. Med. 2013, 63, 355–360. [Google Scholar] [PubMed]
- Grossman, R.; Rudek, M.A.; Brastianos, H.; Zadnik, P.; Brem, H.; Tyler, B.; Blakeley, J.O. The impact of bevacizumab on temozolomide concentrations in intracranial U87 gliomas. Cancer Chemother. Pharmacol. 2012, 70, 129–139. [Google Scholar] [PubMed]
- Grossman, R.; Tyler, B.; Rudek, M.A.; Kim, E.; Zadnik, P.; Khan, U.; Blakeley, J.O.; Pathak, A.P.; Brem, H. Microdialysis measurement of intratumoral temozolomide concentration after cediranib, a pan-VEGF receptor tyrosine kinase inhibitor, in a U87 glioma model. Cancer Chemother. Pharmacol. 2013, 72, 93–100. [Google Scholar] [CrossRef] [PubMed]
- Meany, H.J.; Warren, K.E.; Fox, E.; Cole, D.E.; Aikin, A.A.; Balis, F.M. Pharmacokinetics of temozolomide administered in combination with O6-benzylguanine in children and adolescents with refractory solid tumors. Cancer Chemother. Pharmacol. 2009, 65, 137–142. [Google Scholar] [CrossRef] [PubMed]
- Goldwirt, L.; Zahr, N.; Farinotti, R.; Fernandez, C. Development of a new UPLC-MSMS method for the determination of temozolomide in mice: Application to plasma pharmacokinetics and brain distribution study. Biomed. Chromatogr. 2013, 27, 889–893. [Google Scholar] [PubMed]
- Chowdhury, S.K.; Laudicina, D.; Blumenkrantz, N.; Wirth, M.; Alton, K.B. An LC/MS/MS method for the quantitation of MTIC (5-(3-N-methyltriazen-1-yl)-imidazole-4-carboxamide), a bioconversion product of temozolomide, in rat and dog plasma. J. Pharm. Biomed. Anal. 1999, 19, 659–668. [Google Scholar] [PubMed]
- Reyderman, L.; Statkevich, P.; Thonoor, C.M.; Patrick, J.; Batra, V.K.; Wirth, M. Disposition and pharmacokinetics of temozolomide in rat. Xenobiotica 2004, 34, 487–500. [Google Scholar] [CrossRef] [PubMed]
- Jain, D.; Athawale, R.; Bajaj, A.; Shrikhande, S. Double-salting out assisted liquid-liquid extraction (SALLE) HPLC method for estimation of temozolomide from biological samples. J. Chromatogr. B 2014, 970, 86–94. [Google Scholar]
- Gilant, E.; Kaza, M.; Szlagowska, A.; Serafin-Byczak, K.; Rudzki, P.J. Validated HPLC method for determination of temozolomide in human plasma. Acta Pol. Pharm. 2012, 69, 1347–1355. [Google Scholar] [PubMed]
- Panetta, J.C.; Kirstein, M.N.; Gajjar, A.; Nair, G.; Fouladi, M.; Heideman, R.L.; Wilkinson, M.; Stewart, C.F. Population pharmacokinetics of temozolomide and metabolites in infants and children with primary central nervous system tumors. Cancer Chemother. Pharmacol. 2003, 52, 435–441. [Google Scholar] [PubMed]
- Kim, H.; Likhari, P.; Parker, D.; Statkevich, P.; Marco, A.; Lin, C.C.; Nomeir, A.A. High-performance liquid chromatographic analysis and stability of anti-tumor agent temozolomide in human plasma. J. Pharm. Biomed. Anal. 2001, 24, 461–468. [Google Scholar] [PubMed]
- Shen, F.; Decosterd, L.A.; Gander, M.; Leyvraz, S.; Biollaz, J.; Lejeuneb, F. Determination of temozolomide in human plasma and urine by high-performance liquid chromatography after solid-phase extraction. J. Chromatogr. B 1995, 667, 291–300. [Google Scholar]
- U.S. Food and Drug Administration. Guidance for Industry: Bioanalytical Method Validation; U.S. Food and Drug Administration: Silver Spring, MD, USA, 2015.
© 2016 by the authors; licensee MDPI, Basel, Switzerland. This article is an open access article distributed under the terms and conditions of the Creative Commons by Attribution (CC-BY) license (http://creativecommons.org/licenses/by/4.0/).
Share and Cite
Peer, C.J.; Ronner, L.; Rodgers, L.; McCully, C.M.L.; Warren, K.E.; Figg, W.D. Quantification of Temozolomide in Nonhuman Primate Fluids by Isocratic Ultra-High Performance Liquid Chromatography-Tandem Mass Spectrometry to Study Brain Tissue Penetration Following Intranasal or Intravenous Delivery. Separations 2016, 3, 4. https://doi.org/10.3390/chromatography3010004
Peer CJ, Ronner L, Rodgers L, McCully CML, Warren KE, Figg WD. Quantification of Temozolomide in Nonhuman Primate Fluids by Isocratic Ultra-High Performance Liquid Chromatography-Tandem Mass Spectrometry to Study Brain Tissue Penetration Following Intranasal or Intravenous Delivery. Separations. 2016; 3(1):4. https://doi.org/10.3390/chromatography3010004
Chicago/Turabian StylePeer, Cody J., Lukas Ronner, Louis Rodgers, Cynthia M. Lester McCully, Katherine E. Warren, and William D. Figg. 2016. "Quantification of Temozolomide in Nonhuman Primate Fluids by Isocratic Ultra-High Performance Liquid Chromatography-Tandem Mass Spectrometry to Study Brain Tissue Penetration Following Intranasal or Intravenous Delivery" Separations 3, no. 1: 4. https://doi.org/10.3390/chromatography3010004