Article

Metabolite Profiling and Molecular Network Shows Kinkeloids as Promoting of Collagen Synthesis from Combretum micranthum

1
Sisley Paris, 32, Avenue des Béthunes, CS30003, 95067 Saint-Ouen-l’Aumône, France
2
Institut de Chimie Organique et Analytique (ICOA), Université d’Orléans, UMR 7311, 45100 Orléans, France
*
Authors to whom correspondence should be addressed.
Separations 2024, 11(5), 132; https://doi.org/10.3390/separations11050132
Submission received: 4 April 2024 / Revised: 22 April 2024 / Accepted: 24 April 2024 / Published: 26 April 2024

Abstract

:
Combretum micranthum, a plant native to Africa, has a well-documented traditional use in the treatment of various ailments such as fever, diabetes, and malaria. Its pharmaceutical benefits include nephroprotective, anti-inflammatory, antioxidant, and antimicrobial properties, which were proven. In addition, its potential for cosmetic applications is being explored due to its depigmenting, anti-inflammatory, and UV-damage-repairing properties. This article investigates the molecular composition and new cosmetically relevant biological activity of C. micranthum and enriched fractions to begin the establishment of the structure–activity relationship. Firstly, an extract of C. micranthum was prepared and selected for its overall biological response and then fractionated to obtain simplified molecular fractions. One fraction was particularly enriched in kinkeloids, a specific family of compounds to this species. All the fractions and the crude extract were then tested on biological targets to evaluate and compare their cosmetic activities. Molecular networks were constructed from the UHPLC-MS/HRMS data to better characterize the extract and fractions and to highlight structure–activity relationships. This study highlights the metabolic profiling of a butylene glycol extract of C. micranthum, showing its main chemical families and revealing that the kinkeloids, identified by HRMS and NMR, promote an increase in collagen I synthesis, an interesting cosmetic activity neither previously described for these compounds and neither for C. micranthum extract.

1. Introduction

Combretum micranthum (CM), also known as “kinkeliba,” is a shrubby plant native to West Africa, belonging to the Combretaceae family. Its presence is significant in traditional African medicine [1], where it has been utilized for centuries to treat a variety of ailments [2]. This plant is distinguished by its botanical description, diverse chemical properties, and multiple pharmaceutical, medicinal, and cosmetic applications. In Africa, C. micranthum is found in the fields, streets, and forests. It is also sold in the local market as a vegetable, spice, and for traditional medicinal treatment.
Primarily native to West African regions, including Senegal, Mali, and Burkina Faso, C. micranthum is widespread in subtropical and tropical zones. Its traditional use in African medicine is well documented, where plant parts, especially leaves, barks, and roots, are prepared as decoctions or infusions to treat various disorders such as diabetes, fever, diarrhea, pain, bronchitis, malaria, and liver disorders [3,4].
The chemical composition of C. micranthum is rich and varied, including compounds such as polyphenols, flavonoids, tannins, triterpenes, steroids, and alkaloids [5,6,7,8]. The leaves of the plant contain a diversity of molecular families, each contributing to its beneficial health effects. Scientific studies [9,10] have highlighted the pharmaceutical benefits of C. micranthum, demonstrating its nephroprotective [11], anti-inflammatory [12], antioxidant [9,10,11,12,13,14], antimicrobial [15], antiviral [16], antimalarial [17], and antidiabetic properties [5,6,7,8,9,10,11,12,13,14,15,16,17,18]. Furthermore, the cosmetic applications of C. micranthum are beginning to be explored due to its depigmenting [19], moisturizing, anti-inflammatory, and repair of UV-induced damage properties [20]. Only a dozen cosmetics brands use CM extract in combination with other botanical extracts for around 53 products launched over the last 20 years. The marketing claims found are mainly focused on ‘moisturizing’, ‘dermatologically tested’, and ‘firming’ [21], while more specific targets such as anti-ageing with collagen synthesis have not been explored.
To identify the optimal crude extract on main biochemical and biological activities (antioxidant, depigmenting, anti-inflammatory, and anti-aging), different extracts from different extraction processes were prepared. The best crude extract (taking into account the overall biological response) was then fractionated to obtain simplified molecular composition fractions. One of the aims of fractionation was also to produce a highly enriched kinkeloids fraction, flavan alkaloids specific to this botanic species. Next, all fractions and the crude extract were tested on biological targets, especially collagen I synthesis, not previously performed, to evaluate and compare their cosmetic activities. Finally, molecular networks (MNs) were constructed using UHPLC-HRMS/MS data to better characterize the extract and fractions and to highlight the structure–activity relationship.

2. Materials and Methods

2.1. Chemicals

The following reagents were purchased from Sigma-Aldrich (Saint Quentin Fallavier, France): 2,2-diphenyl-1-picrylhydrazyl (DPPH), sodium acetate (≥99%), Trolox (≥98%), sodium carbonate, gallic acid, tyrosinase, phosphoric acid, sodium hydroxide, and L-Dopa. Formic acid was purchased from Thermo Fisher Scientific (Waltham, MA, USA). Folin solution was obtained from Merck (Darmstadt, Germany). The human cells were purchased HaCat (T0020001) via the supplier AddexBio (San Diego, CA, USA), and FHN (C0045C) was obtained from Life technologies (Carlsbad, CA, USA).
All the solvents used for the plant extraction, preparative HPLC, and UHPLC-HRMS analysis were HPLC grade; methanol was purchased from Sigma-Aldrich (Saint Quentin Fallavier, France). The acetonitrile from Merck (Darmstadt, Germany) used for UHPLC-HRMS analysis was of HPLC PLUS gradient. Biobased butylene glycol and pentylene glycol were purchased from Azelis (Courbevoie, France). Finally, ultrapure water was produced with a Purelab Flex system from Veolia (Wissous, France).

2.2. Plant Material and Sample Preparation

2.2.1. Grinding

In 2021, leaves of C. micranthum were collected and sun-dried from Senegal and packed by the supplier Cailleau Herboristerie (Chemillé-en-Anjou, France). The leaves were then ground using a Retsch GM 200 knife mill in “cut” mode, operated twice for 5 s at 6000 rpm to obtain a particle size ranging from 500 µm to 3 mm.

2.2.2. Extraction

In order to evaluate the influence of extraction processes and evaluate compounds recovery and activities, different solvent, conventional solid–liquid, ultrasound-, and/or microwave-assisted extraction were initially tested. The choice of the best crude extract was based (internal study) on the compromise of different criteria such as better yield extraction, the high recovery of bioactive compounds, enrichment in original and specific compounds, and the biochemical activity obtained.
In this described retained experiment, 20 g of dried and ground leaves of C. micranthum was introduced into 100 mL of butylene glycol/water (6:4, v:v), and the extraction was conducted for 60 min under reflux conditions. Subsequently, the pomace was separated from the extract and squeezed, while the extract was filtered through membranes of 12–15 µm, then 2–3 µm, and finally 0.2 µm successively.
Another aqueous extract, to allow for a comparison with the water extracts described in the scientific literature, was made by introducing 400 g of dried and ground leaves of C. micranthum into 4 L of water in a 6 L vessel for microwave extraction for 45 min at 900 W. The extract was then filtered to 0.45 µm before adding 5% pentylene glycol, 0.05% citric acid, and 0.05% citrate sodium to preserve it.

2.3. Fractionation and Analytical Characterization

2.3.1. Preparative Chromatography Fractionation

Then, the method was scaled up for extract fractionation. Purification was performed on a PLC2250 Purification System (Gilson, Saint-Ave, France) equipped with a DAD detector used in the range of 200–400 nm and an ELSD detector. The separation was performed on a Nucleodur C18 HTec column (250 × 21 mm; 5 µm). The mobile phase consisted of water (A) and methanol (B) at a flow rate of 19 mL/min. The mobile phase gradient was programmed as follows: 0–1 min, 10% B; 1–10 min, 50% B; 10–12 min, 50% B; 12–18 min, 100% B; 18–30 min, 100% B, and was carried out at 40 °C. One milliliter of the C. micranthum crude complex extract, at a concentration of 32 mg/mL, was injected 24 times to obtain a minimum of 200 mg per dried fraction. Three main fractions were collected according to their compositions; among them, one fraction contained mainly the targeted kinkeloids.
In order to determinate the percentage content of total kinkeloids in the crude extract and enriched fraction, we first collect the fraction enriched in the kinkeloid and then from this fraction, the mass peak 358 (the most abundant) was collected on the analytical column used for the fraction analysis.
The analysis of crude extraction and fractions and purified m/z 358 solution was carried out using a TSQ Endura triple quadrupole mass spectrometer (Thermo Fisher Scientific Inc., Waltham, MA, USA) equipped with an electrospray ionization ion source (H-ESI). The capillary voltage was −3.2 kV in negative mode and 3.5 kV in positive mode to favor compound ionization; the vaporizer temperature was set at 420 °C, and the ion transfer tube temperature was set at 356 °C. Gas flow was in arbitrary units, the sheath gas was fixed at 30, Aux gas at 5, and sweep gas at 3. The scan range (m/z) was 100–1000 with a scan rate of 1000 Da/sec and a resolution of 0.7 FWHM for the Q1 quadrupole.
The main targeted kinkeloid molecules monitored are as follows: C19H23NO8 [M] = 393.1424 u/isomers D1 and D2, C20H23NO7 [M] = 389.1475 u/isomers C1 and C2, C20H23NO6 [M] = 373.1525 u/isomers B1 and B2, C20H23NO5 [M] = 357.1576 u/isomers A1 and A2, and C19H23NO4 [M] = 329.1627 u [22]. The extract ion chromatogram of the targeted compounds was recorded to follow the presence and the abundance of the kinkeloid in the butylene glycol CM extract and fractions. Then, to perform the semi-quantification of the kinkeloid in butylene glycol CM extract and in the enriched fraction, the peak areas of the targeted compounds were compared to the total chromatogram peak area, and the kinkeloid content was estimated in m/z 358 equivalent.

2.3.2. UHPLC-UV-ESI-QTOF-MS/MS

The MS and MS/MS experiments were conducted on an Agilent G6545B UHR-Q-TOF mass spectrometer (Agilent, Les Ulis, France) using data-dependent acquisition (DDA) mode with an Agilent Jet Stream (AJS) ionization source operating in positive ion mode. Nitrogen was employed as the drying gas at a flow rate of 10 L/min and 325 °C and as the nebulizing gas at a pressure of 20 psi (1.38 bar). Mass spectra were recorded over the m/z range of 100–1700 at a rate of 2 spectra/second and over the m/z range of 100–1700 at a rate of 5 spectra/s, respectively, for MS and MS/MS. The capillary voltage was set to 4 kV. Three precursor ions were selected per cycle and fragmented at a collision energy of 15 eV. All the MS data were processed using MassHunter 10.0 software (Agilent). Molecular formulas were generated using elemental composition (C, H, O) up to infinite, Na ≤ 1, and N ≤ 5 with a mass accuracy of ≤5 ppm.
Chromatographic analysis was conducted using an Agilent 1290 Infinity II system equipped with an auto sampler, a quaternary pump, a thermostat column compartment, and a DAD detector. The column employed was an UHPLC Eclipse Zorbax column (150 × 2.1 mm; 1.8 µm) (Agilent, Les Ulis, France). The mobile phase consisted of water (A) and methanol (B), both acidified with 0.1% and 0.08% formic acid, respectively, at a flow rate of 400 µL/min. The mobile phase gradient was programmed as follows: 0–1 min 10% (B), 1–8 min 80% (B), 8–9 min 80% (B), 9–11 min 100% (B), 11–15 min 100% (B), 15–15.1 min 10% (B), and 15.1–18 min 10% (B). Compound separation was performed at 40 °C. Samples were diluted 100 times in water, and 2 µL was injected into the system.

2.4. NMR Characterization

The fraction obtained through semi-preparative HPLC was analyzed by NMR to confirm the presence and nature of the enriched kinkeloids in this sample. It was passed through an SPE cartridge to reduce some of the butylene glycol solvent that could interfere with the NMR spectral interpretation. The fraction was then solubilized in MeOD and analyzed using a Bruker 400 MHz NMR spectrometer (Billerica, MA, USA).
NMR spectra were recorded on a Bruker Avance III HD–400 MHz spectrometer equipped with a 5 mm BBFO probe at 293 K. Chemical shifts (δ) were referenced using the CD3OD signals (δH 3.31, δC 49.00). Spectra were processed using MestReNova software (MNova 14.1.1 Mestrelab Research). Structural assignments were based on 1H NMR, 1H-1H COSY, 1H-13C HSQC, 1H-13C HMBC, and 1H-1H NOESY spectra.

2.5. Determination of Total Polyphenols Content

In this experiment, 100 µL of butylene glycol CM extract and fractions (diluted 100-fold in water) was mixed with 500 µL of 10% Folin–Ciocalteu reagent and 400 µL of 75 g/L aqueous solution of sodium carbonate. The mixture was then transferred to a 96-well plate, and the absorbance of the blue-colored mixtures was recorded after 5 min of incubation at 40 °C. The analysis wavelength was set at 735 nm relative to a blank containing only the extraction solvent. The total polyphenol content was calculated in gallic acid equivalents from the calibration curve of gallic acid standard solutions (5 to 200 mg/L GAE).

2.6. In Tubo and In Vitro Biological Activities

The first biochemical activities were evaluated in tubo (acellular assay) using DPPH and tyrosinase assays. This was determined by measuring the absorbance of the reagent in the presence of different samples (solvent for blank, Trolox and kojic acid for positive controls, total extract, or fractions). The assessment of activity was conducted in 96-well plates, with each sample deposited. Water was used to dilute the samples and as the negative control. All assays were performed in triplicate.
Additionally, the samples were also studied in vitro (biological assays) to assess their anti-inflammatory capacity on skin cells (PGE2) and their effect on the synthesis of collagen I. The assessment of biological activity was conducted in 96-well plates, with each sample deposited at three consecutive concentrations for the dose effect.
All assays were performed on a BMG Labtech ClariostarPlus microplate reader using Clariostar Mars software 5.70 R3 to read and process the data.

2.6.1. DPPH Radical Scavenging Activity Assay

DPPH assays were performed by readjusting the method described by Lee et al. [23]. Briefly, 10 µL of sample was mixed with 190 µL of DPPH reagent at 60 µM in ethanol and incubated for 30 min in the dark at room temperature. Trolox (1 mg/mL) was used as a control inhibitor. The absorbance was recorded using a microplate reader at 516 nm.
%   DPPH   scavenging = A c o n t r o l A s a m p l e A c o n t r o l × 100
  • A control: Absorbance measured with DPPH and without sample (solvent).
  • A sample: Absorbance recorded for the sample when combined with the DPPH reagent.

2.6.2. Tyrosinase Assay

The inhibition of tyrosinase was assessed following the method outlined by Lim et al. [24]. In summary, a buffer solution was prepared using 250 mL of water, 1 mL of 2 M NaOH, and 1.15 mL of 1 M H3PO4 (pH 6.8). The enzyme was prepared at a concentration of 125 U/mL, while the L-Dopa substrate was prepared at 1.65 mg/mL. Samples (40 µL) were combined with 40 µL of tyrosinase enzyme (125 U/mL), or 40 µL of buffer was added to the blank sample and blank control wells and incubated for 5 min. Kojic acid (1 mg/mL) was used as a control inhibitor. Finally, 120 µL of substrate L-Dopa was added to all wells before incubating for 30 min at 37 °C, followed by measuring the absorbance at 490 nm. The percentage inhibition of tyrosinase was calculated using the following formula:
%   Tyrosinase   inhibition = ( A   c o n t r o l A   b l a n k   c o n t r o l ) ( A   s a m p l e A   b l a n k   s a m p l e ) ( A   c o n t r o l A   b l a n k   c o n t r o l ) × 100
  • A control: Absorbance measured for the enzyme and substrate mixture without the sample.
  • A blank control: Absorbance measured for the enzyme alone.
  • A sample: Absorbance recorded for the sample when combined with the enzyme and substrate.
  • A blank sample: Absorbance obtained for the sample when mixed with the enzyme only.

2.6.3. Anti-Inflammatory Effect on Skin Cells (PGE2)

Human keratinocytes (HaCat) were seeded at 40,000 cells/well in a 12-well microplate and incubated for 24 h at 37 °C and 5% CO2 with the test products. The cellular layers were then irradiated with UVB (18 mJ/cm2). The PGE2 (Prostaglandin E2) content in the supernatant was evaluated using an ELISA.
%   Anti - inflammatory = A   s a m p l e A   c o n t r o l A   c o n t r o l × 100
  • A control: Absorbance measured for the buffer without the sample.
  • A sample: Absorbance recorded for the sample.

2.6.4. Collagen I Synthesis

Normal human fibroblasts were seeded onto a 96-well microplate and incubated for 4 days at 37 °C and 5% CO2 with the test products. Extracellular collagen I fibers were then revealed by immunofluorescence. The quantification of collagen I fibers was performed at 488 nm. The fluorescence intensity was obtained using Image J software 1.53T.
%   Collagen   I   synthesis = F   s a m p l e F   c o n t r o l F   c o n t r o l × 100
  • F control: Fluorescence measured for the buffer without the sample.
  • F sample: Fluorescence recorded for the sample.

2.7. Molecular Network Design

The molecular network was constructed using the GNPS (Global Natural Products Social Molecular Networking) platform [http://gnps.ucsd.edu] (accessed on 5 February 2024). All MS/MS spectra obtained were exported to the GNPS platform in the form of a peak list (.mgf) containing comprehensive analysis information: mass spectrometer properties, precursor ions (m/z), retention times, and fragment ions (m/z, intensity, charge). Subsequently, the MS/MS spectra were pairwise compared to search for spectral similarities, i.e., identical fragment ions and/or neutral losses. The optimal parameters were as follows: tolerance of 0.02 Da for parent and fragment, identical fragment ions and/or neutral losses; cosine score ≥ 0.7; minimum matched peaks ≥ 6; topK network 10; maximum connected component size 100; minimum cluster size 2, with no MSCluster execution for one molecular network and yes for another one. The results were downloaded and exported for visualization using the Cytoscape 3.8.2 software [https://cytoscape.org] (accessed on 5 February 2024). Compound identification relied on the spectral libraries within GNPS. The MS/MS spectra of compounds from C. micranthum were compared to the MS/MS spectra of compounds contained in the GNPS library platform using the following parameters: library search minimum matched peaks 6; score threshold 0.7; and maximum analog search mass difference 100.

3. Results and Discussion

To stay in a green context, the extraction method and solvents evaluated should be carefully chosen in order to completely meet cosmetic compliance and be eco-friendly. Extract should be retained considering several factors such as biological efficacies, galenic acceptance, safety, industrial process scalability, energy costs, and environmental impact. Considering these data (internal study, not presented in this paper), the crude complex extract retained of C. micranthum leaves, which has been studied in detail, was made from maceration in bio-based butylene glycol and water (6:4, v:v).
This bio-based solvent yields a stable extract, suitable for cosmetics and without the need for additional preservatives. Microbiologically, the extract is compliant according to ISO standard NF EN ISO4831 [25] (<100 CFU, total coliforms) and contains a dry matter content of 3.9%, meaning 3.9 g of dry extract per 100 g of liquid crude extract, and an extraction yield of 18.3%, i.e., 3.6 g of dry extract for 20 g of the engaged plant, compatible with industrial development.
As previously mentioned, the aim of this study, in addition to finding the original biological efficacy for the CM extract, is to investigate whether the new biological activities (in tubo and in vitro), or those already demonstrated in the existing literature (e.g., antioxidant and anti-inflammatory responses), could be attributed to the presence of specific groups of compounds, in particular kinkeloids, a specific flavan alkaloids family found in the Combretum species.

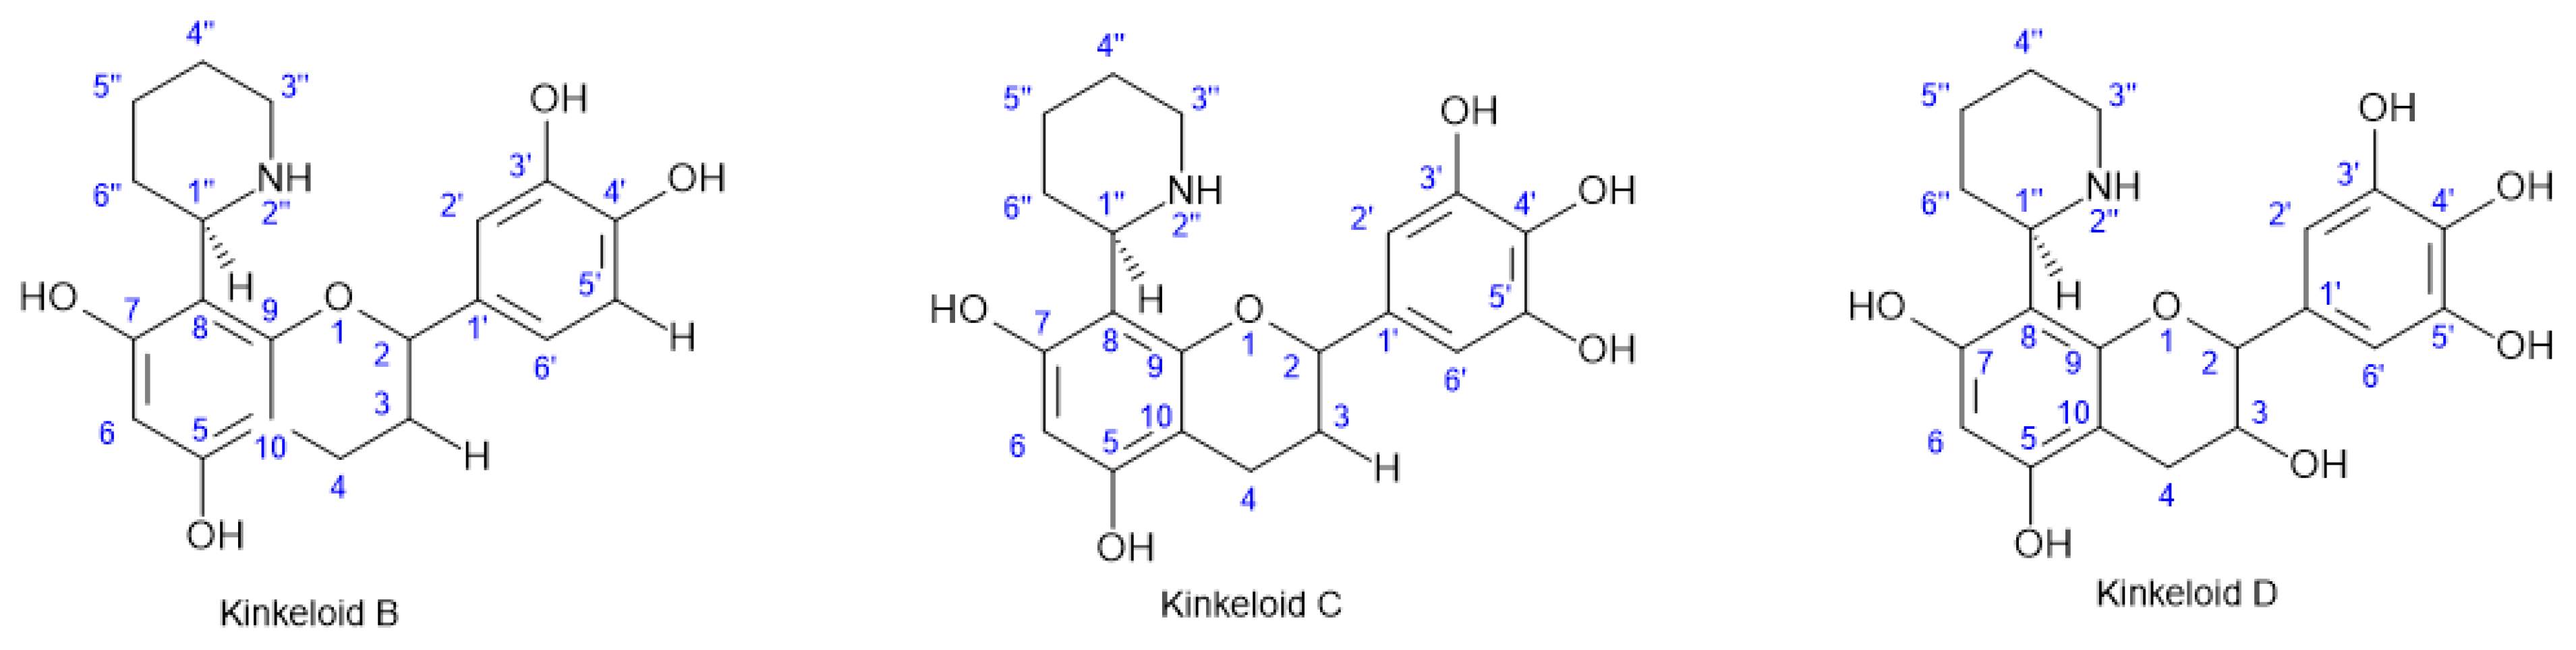
3.1. Fractionation, MSMS, and NMR Analyses

To test this structure–activity relationship hypothesis, and contribute to the better chemical characterization of CM, a fractionation of the crude complex butylene glycol CM extract was performed: 24 g of crude extract (i.e., 800 mg dried) was partitioned into three fractions, 1, 2, and 3, containing 400, 200, and 200 mg, respectively, of dried fractions.
LC/MS preparative monitoring allowed us to validate that fraction 2 is highly enriched in kinkeloids, the target compounds for this study.
These various kinkeloids and isomers were identified by ion extraction of their molecular formulae (molecules of interest). Figure 1 shows the extraction protonated molecular ion chromatograms of compounds of target mass 390 u between 7.5 and 10.5 min, compounds of mass 374 u between 8.5 and 11 min, compounds of mass 358 u between 10.2 and 12.8 min (as well as a small peak at 3 min), and compounds of mass 342 u between 11.9 and 14 min (as well as a small peak at 3 min). No peak was observed at mass 394 u.
The planar structure of the kinkeloids was determined by MS/HRMS. Figure 2 shows an example of the characterization, i.e., an MS/MS spectrum of a kinkeloid C fragmented at 15 eV. The molecular formulae of the parent ion and the various daughter ions (fragments) are given in Table 1.
In order to confirm the attribution of these compounds as kinkeloids, fraction 2 was also analyzed by 1D and 2D NMR and compared with the chemical shifts of kinkeloids A–D [26,27]. Kinkeloids A, B, C, and D, flavonoid alkaloids discovered from CM, consisting of a flavan moiety with a piperidine ring attached at either the 6 or 8 position, have been described and differ only in the number of hydroxyl groups attached, resulting in consecutive mass unit differences in the mass spectra. Due to the complex mixture in fraction B, the identification of compounds was not possible only with the 1H NMR spectrum. Kinkeloids identification was performed by the comparison of chemical shifts deduced from the 1H-13C HSQC correlations with those previously reported by J. Zhen [27] but also confirmed by 1H-1H COSY, 1H-13C HBMC, and 1H-1H NOESY correlations. The 1H-13C HSQC showed correlations corresponding to aliphatic signals at δH/C 4.54 (H-1″)/54.5 (C-1″), 2.98, 3.39 (H-3a″, H-3b″)/46.4 (C-3″), 1.64, 1.84 (H-4a″, H-4b″, H-5a″, H-5b″)/23.4 (C-4″, C-5″), and 1.84, 2.28 (H-6a”, H-6b″)/29.3 (C-6″), consistent with the piperidine moiety characteristic of the kinkeloids. The spin system of aliphatic signals at δH/C 4.74 (H-2)/78.8 (C-2), 1.88, 2.08 (H-2a, H-2b)/30.3 (C-2), and 2.62 (H-3)/19.9 (C-3) was confirmed thanks to the 1H-1H COSY correlations and can be attributed to cycle C of the flavan moiety of kinkeloids B and C. Another spin system of aliphatic signals at δH/C 4.93 (H-2)/79.2 (C-2), 4.17 (H-2)/67.1 (C-2) and 2.82 (H-3)/28.5 (C-3) was also confirmed thanks to the 1H-1H COSY correlations and can be, this time, attributed to cycle C of the flavanol moiety of kinkeloid D. The 1H-13C HSQC showed correlations corresponding to aromatic signals at δH/C 6.84 (H-2′)/114.1 (C-2′), 6.76 (H-5′)/115.7 (C-5′) and 6.72 (H-6′)/118.4 (C-6′) consistent with dihydroxylated cycle B of the kinkeloid B. It was also confirmed by 1H-13C HMBC correlations between H-2′ and C-2 and between H-2′, H-5′, and C-3′, C-4′ (δC 146.0). Similarly, there were correlations corresponding to aromatic signals at δH/C 6.41 (H-2′, H-6′)/106.2 (C-2′, C-6′), consistent with trihydroxylated cycle B of the kinkeloids C and D, which can be observed on the 1H-13C HSQC. The presence of the two compounds can be confirmed by HMBC correlations of H-2′ both with the C-2 of the flavan moiety (kinkeloid C) and the flavanol moiety (kinkeloid D). The 1H-13C HSQC correlations at δH/C 6.06 (H-6)/95.7 (C-6) correspond to the aromatic signals of the only proton on cycle A of the kinkeloids. The 1H-1H NOESY correlation between H-1″ and H-2′ indicated that the piperidine moiety seems to be linked in C-8 rather than C-6.
Table 2 and Table 3 show the NMR results obtained with kinkeloids B, C, and D (Figure 3) compared to the literature [27].
To confirm that fraction 2 is clearly enriched in kinkeloid compounds, the kinkeloid content (target mass 358, 374, 390, 342 m/z) was evaluated using crude CM extract and fraction 2 ESI-TQMS chromatograms and expressed in an equivalent 358 m/z isolated pure compound. A comparative estimation of the kinkeloid content gave 21% of total kinkeloids for the crude butylene glycol CM extract and 63% for fraction 2.
On the basis of these different NMR analyses (Table 2 and Table 3), detecting mainly the presence of kinkeloid compounds, and HRMS analyses (Figure 2 and Table 1), and considering the semi-quantification performed showing three-fold enrichment in fraction 2, it can be assumed that fraction 2 is clearly enriched in kinkeloids.

3.2. UHPLC-HRMS and Polyphenol Content Analyses

The complex crude butylene glycol CM extract and all fractions were then tested in parallel in chemical and biological assays. The chemical analysis, polyphenolic content, and metabolic profiling approach using UHPLC-HRMS/MS and, next, molecular networking was used to investigate the kinkeloids and other phytochemical groups. The MS/MS data are used to create molecular networks for the faster characterization of the extract than individual mass spectra processing, which is more tedious and time consuming.
Figure 4 shows the Total Ion Chromatogram (TIC) profiles of the crude CM extract along with various fractions obtained by preparative chromatography, along with a blank (extraction solvent) to identify the system analytical impurities.
The preparative chromatographic conditions adopted produced a clear distribution of chemical families with the different polarity groups and partitioned retention times (Rt): fraction 1 Rt 1–2.5 min; fraction 2 (kinkeloids) Rt 4–8 min; fraction 3 Rt 5.5–15 min, with complete overlap with the crude extract.
The total phenolic content of the CM extract and fractions 1, 2, and 3 (fraction tested in proportion to their concentration in the total crude extract) were also analyzed and gave 9.6, 1.2, 3.8, and 5.3 g/L GAE, respectively. These results show a variation in the total polyphenol content, with a distribution of total polyphenols from the total extract among the three fractions. This polyphenol content retrieved in each fraction is also the result of the clear fractionation by polarity of the chemical composition profiles of the fractions (Figure 4). Fraction 1 is very low in polyphenol compounds, fraction 2 is enriched in a particular family (kinkeloids), and fraction 3, depleted in kinkeloids, contains polyphenol compounds and probably other chemical groups.

3.3. Analyses of In Tubo Biological Activities

For biological activities, fractions were tested at equivalent concentrations found in the crude extract, using in tubo assays for antioxidant and depigmenting properties (already reported in the literature for crude aqueous CM [19,20,21,22,23,24,25,26,27,28,29], and next, using in vitro cellular assays for anti-inflammatory activity [12] and collagen I synthesis, an activity never before reported for CM.
The results of the DPPH and tyrosinase in tubo tests (Table 4) showed high percentages of activity for the complex butylene glycol CM extract, with 91% DPPH radical scavenging and 91% tyrosinase inhibition (depigmentation) at the 3.2 mg/mL tested compared to the positive controls (pure compounds) at 1 mg/mL. These activities are absent or not relevant (~26% at 1.6 mg/mL tested) in fraction 1, which contains more polar compounds, very few polyphenols, and no kinkeloids. In contrast, fractions 2 and 3 show similar antioxidant and tyrosinase inhibitory activities to the extract, despite the low kinkeloid content of fraction 3.
These initial results suggest that kinkeloids (fraction 2) seem to intrinsically possess this anti-tyrosinase in tubo activity, which is a new activity directly described for these flavan alkaloid compounds. Moreover, the similar tyrosinase or antioxidant response for fractions 2 and 3, respectively, enriched in kinkeloids, polyphenols, and other compounds, seems to indicate that it is the combination of polyphenols and not just the specific kinkeloids that support these antioxidant and depigmenting activities observed in the whole crude butylene glycol CM extract.
We can also assume, based on the equivalent antioxidant and tyrosinase responses of fraction 2 and 3 (each has the same high percent of antioxidant effect than the CM extract), similar to the butylene glycol CM extract responses, that there is no additional or antagonistic effect on their molecular composition. Equally, fraction 1, mainly composed of polar compounds, does not contribute to these activities (neither synergistic nor antagonistic effect), considering the 50% weight of this fraction in the crude extract.

3.4. Analyses of Molecular Network and In Vitro Activities

To allow for the elucidation of structure–activity relationships focused on kinkeloids, anti-inflammatory, and collagen I synthesis, the performed and networking in vitro assays were used in combination.
Then, to view in a global window the in vitro responses and chemical characterization, Figure 5 presents the molecular network carried out with the butylene glycol CM extract and the fractions. The figure was performed highlighting clusters with a node size proportional either to the percentage of activities (on the left: B1, C1) or to the quantity (chromatographic MS peak area) of the molecule in each sample (on the right: B2, C2). As a reminder, Table 4 shows the quantified responses and trends obtained in the in tubo and in vitro assays. Moreover, to understand the specificity of the butylene glycol CM extract’s composition, with respect to the anti-inflammatory activity mentioned in the literature for aqueous CM extract [12], an additional aqueous CM extract was also performed and analyzed, in additional to butylene CM extract and kinkeloid fraction 2. The aqueous CM extract was obtained with the same plant/solvent ratio as the butylene glycol CM extract and was carried out in 100% water, assisted by a microwave to accelerate the process. This latter, called CM-MO, has a dry matter content of 2.2%, i.e., 2.2 g of dry extract per 100 g of liquid extract, with an extraction yield of 14.2%, i.e., 54.7 g of dry extract per 400 g of used plant. The anti-inflammatory (cf. Table 4, low/negative response expected) and collagen I synthesis (cf. Table 4, high percent expected) bioassays were performed with three concentrations (to evaluate potential dose effect) in triplicate (Table 4).
Interesting results were observed for anti-inflammatory and collagen I synthesis. No response for anti-inflammatory activity was observed for the butylene glycol CM extract or its kinkeloid enriched fraction; this anti-inflammatory activity is only observed for the aqueous CM-MO extract. This surprising response, given the literature on anti-inflammatory activity and CM extracts, especially aqueous extracts [19,20,21,22,23,24,25,26,27,28,29], suggests three main hypotheses: Firstly, kinkeloids alone have no anti-inflammatory effect and require the highest presence of other components such as favonoids (found in the aqueous extract), as shown in Figure 5. Secondly, the possible antagonistic effect of the residual butylene glycol blank solvent on the expected anti-inflammatory response. To develop this hypothesis, an additional assay of the butylene glycol blank solvent was carried out under the same conditions as CM extracts. Two high concentrations (0.5% and 0.25%) were carried out and fortunately did not give any anti-inflammatory or pro-inflammatory effect (no significant percentage obtained: 9% with 0.5% butylene glycol blank tested and −4% with 0.25% butylene glycol blank tested). This response seems to be in line with what is described in the scientific literature for butylene glycol: use as a solvent, enhancer of preservative action, widely used in cosmetics, and documented for its humectant, moisturizing, and antimicrobial action [30,31,32,33].
Thirdly, the specific composition of this butylene glycol CM extract (content and combination of polyphenols, kinkeloids and other compounds) would not allow the anti-inflammatory response, probably because of the presence (content) of undesirable compounds, i.e., antagonist effect, or the absence of a specific compound, compared to the composition of the aqueous extract. The Venn diagram and heat map in Figure 6 seem to support the latter hypothesis; 25 additional and specific compounds are present in butylene glycol extract compared to CM-MO extract.
The structure–activity relationship analysis of collagen I synthesis was then carried out using the molecular network (Figure 5), a molecular fingerprint of the butylene glycol CM extract, which shows the different clusters representing groups of molecules with similar structures. Each structure is represented by a node, and the spectral similarity is highlighted by the connection between the nodes. The greater the similarity between two structures, the stronger the bond between them (mathematically represented by the cosine score, ranging from 0 for no similarity to 1 for perfect MS/MS spectral similarity).
Figure 5 shows the molecular networks of C. micranthum extract together with the fractions obtained by preparative chromatography. In part (A), the entire network is observed, consisting of clusters and singleton nodes that either have no spectral similarity to other structures or could not be fragmented with the collision energy used, resulting in their MS/MS spectrum containing only the parent ion. Parts (B) and (C) of the figure highlight two characterized clusters from the butylene glycol CM extract and fractions, namely kinkeloids with glycosylated flavonoids and non-glycosylated flavonoids.
Each sample (crude extract and fractions) is represented by a color specified in the legend. Figure 5(B1,C1) depict a cluster with a node size proportional to the percentage of collagen I synthesis activity in the sample, allowing for the rapid identification of molecules present in the active fraction. In parallel, Figure 5(B2,C2) display pie chart nodes proportional to the quantity (chromatographic peak area) of the molecule in each sample. This enables a quick comparison of the molecule presence across different samples; however, comparing the true quantity (mass) between the different classes of molecules (kinkeloid, flavonoid glycosylated and not, and other kinds of compounds) within samples is more limited due to their possible varying ionization capacities.
Molecules exhibiting identical MS/MS fragmentation patterns (i.e., sharing a common structural core) are grouped into a single cluster, where bonds are depicted with a thickness proportional to the cosine score, reflecting spectral and hence structural similarity (Figure 5(B2,C2)).
Overall, fraction 1 contains polar compounds eluting early in the gradient (sugars, amino acids), followed by fraction 2 containing some flavonoids and strongly enriched in kinkeloids, and finally fraction 3 containing some compounds from fraction 2 but with lesser intensities and variable proportions, including the mid-polar compounds absent in fraction 2.
A total of 48 compounds were characterized by mass spectrometry in this butylene glycol CM extract: phenolic acids (caffeic, chlorogenic, gentisic, ferulic, protocatechuic, coumaric acids), amino acid (phenylalanine), flavonoids (orientin, isovitexin, vitexin, myrecitin-3-o-glucoside, hyperoside, rutin, kaempferol, quercetin, 3′,4′,5′,5,7-pentahydroxyflavan, 3′,4′,5,7-tetrahydroxyflavan, 2′′-o-galloylvitexin, 2′′-o-galloyl isoorientin), kinkeloids (A, B, C, D, and isomers), anthocyanins (maldivine, cyanidin-3-glucoside and isomer, cyanidin-3-o-rutinoside), triterpenes and saponins (oleanolic acid 28-O-beta-D-glucopyranoside, bartogenic acid), alkaloids (betonicine and isomer), and tannin (urolithin). Some of the compounds characterized have been annotated on the C. micranthum molecular network and are listed in Table 5.
To further the chemical characterization, the molecular network highlights that the cluster of kinkeloids and non-glycosylated flavonoids is mainly present in fraction 2, shown in red, whereas glycosylated flavonoids are mainly present in fraction 3, shown in blue, and in the B1 figure. The connections between the compounds are notably thick, particularly for kinkeloids, as they possess very similar structures and undergo identical group losses during fragmentation in the collision cell of the mass spectrometer. This network method also facilitates characterization since a molecule’s membership in a cluster provides an indication of its chemical family if the compound is unknown.
Furthermore, some kinkeloids not described in the literature have been observed as they are directly linked to known kinkeloids and exhibit structural similarities.
So, in terms of collagen I synthesis responses, very interesting positive results are obtained from the butylene glycol CM extract and the associated fraction (Table 4). This last result shows that the butylene glycol CM extract has a collagen I synthesis activity, an activity that has never been demonstrated on CM. Moreover, as shown in the molecular network Figure 5 and Table 4, it can be seen that it is the kinkeloids cluster that is most important for collagen I synthesis. Considering that the fractions were tested at concentrations proportional to those found in the total extract, the next hypothesis is that the kinkeloids are probably also the most important contributors to the collagen I synthesis recovered in the crude CM extract.

4. Conclusions

The existing literature reports that C. micranthum is a promising traditional medicinal plant in the treatment of a wide range of inflammation-related diseases, including diabetes, obesity, and malaria. Furthermore, its traditional application on the skin to accelerate the healing process underscores its potential in dermatological treatments. This study aims to highlight the structure–activity relationship of its anti-inflammatory activity and collagen I synthesis, a previously undescribed biological activity.
This article demonstrated that a specific group of flavan alkaloids, namely kinkeloids, identified (HRMS and NMR) in the butylene glycol extract, promotes an increase in collagen I synthesis, a novel activity not previously described for these compounds. Regarding the previously described anti-inflammatory effect of C. micranthum in the existing literature, this study suggests that it depends on the overall composition. A balance between the different groups of flavonoids present (kinkeloids, glycosylated, or non-glycosylated flavonoids) seems essential to manifest this effect. Additionally, the constructed molecular network revealed the presence of some new kinkeloids, not described in the literature, as they are directly linked to known kinkeloids in the molecular network.

Author Contributions

Conceptualization, E.D. (Eldra Delannay); methodology, E.D. (Eldra Delannay) and S.M.; software, S.M.; validation, E.D. (Eldra Delannay); investigation, E.D. (Eldra Delannay) and S.M.; resources, S.M., M.B., P.-E.C. and D.H.; data curation, S.M., M.B., E.D. (Emilie Destandau), P.-E.C. and D.H.; writing—original draft preparation, E.D. (Eldra Delannay), S.M., E.D. (Emilie Destandau) and P.-E.C.; writing—review and editing, E.D. (Eldra Delannay), S.M. and D.H.; visualization, E.D. (Eldra Delannay), S.M., E.D. (Emilie Destandau) and D.H.; supervision, E.D. (Eldra Delannay); project administration, E.D. (Eldra Delannay). All authors have read and agreed to the published version of the manuscript.

Funding

This research received no external funding.

Data Availability Statement

Data are available through contact with the corresponding author.

Acknowledgments

This research was supported by CFEB Sisley. Our sincere thanks are due to Isabelle Thuiller and José Ginestar for their support and for the funding they provided.

Conflicts of Interest

The authors declare no conflicts of interest. The funders had no role in the design of the study; in the collection, analyses, or interpretation of the data; in the writing of the manuscript; or in the decision to publish the results.

References

  1. Hama, O.; Kamou, H.; Abdou, M.M.A.; Saley, K. Connaissances Ethnobotaniques et Usages de Combretum micranthum Dans La Pharmacopée Traditionnelle Au Sud-Ouest de Tahoua (Niger, Afrique de l’Ouest). Int. J. Biol. Chem. Sci. 2019, 13, 2173. [Google Scholar] [CrossRef]
  2. Tine, Y.; Sene, M.; Gaye, C.; Diallo, A.; Ndiaye, B.; Ndoye, I.; Wele, A. Combretum micranthum G. Don (Combretaceae): A Review on Traditional Uses, Phytochemistry, Pharmacology and Toxicology. Chem. Biodivers. 2024, 14, e202301606. [Google Scholar] [CrossRef]
  3. Le Grand, A.; Wondergem, P.A.; Verpoorte, R.; Pousset, J.L. Anti-Infectious Phytotherapies of the Tree-Savannah of Senegal (West-Africa) II. Antimicrobial Activity of 33 Species. J. Ethnopharmacol. 1988, 22, 25–31. [Google Scholar] [CrossRef] [PubMed]
  4. Tignokpa, M.; Laurens, A.; Mboup, S.; Sylla, O. Popular medicinal plants of the markets of Dakar (Senegal). Int. J. Crude Drug Res. 1986, 24, 75–80. [Google Scholar] [CrossRef]
  5. Welch, C.; Zhen, J.; Bassène, E.; Raskin, I.; Simon, J.E.; Wu, Q. Bioactive Polyphenols in Kinkéliba Tea (Combretum micranthum) and Their Glucose-Lowering Activities. J. Food Drug Anal. 2018, 26, 487–496. [Google Scholar] [CrossRef]
  6. Bony, N.F.; Libong, D.; Solgadi, A.; Bleton, J.; Champy, P.; Malan, A.K.; Chaminade, P. Establishing High Temperature Gas Chromatographic Profiles of Non-Polar Metabolites for Quality Assessment of African Traditional Herbal Medicinal Products. J. Pharm. Biomed. Anal. 2014, 88, 542–551. [Google Scholar] [CrossRef]
  7. Umoh, S.D.; Bojase, G.; Masesane, I.B.; Loeto, D.; Majinda, R.T. A Comprehensive Review of Combretum Flavonoids and Their Biological Activities: An Update between 1990 and 2022. Biochem. Syst. Ecol. 2023, 108, 104644. [Google Scholar] [CrossRef]
  8. Bougma, A.; Sere, A.; Bazie, B.S.R.; Sangare, H.; Ouilly, J.T.; Bassole, I.H.N. Composition and Physicochemical Properties of Combretum collinum, Combretum micranthum, Combretum nigricans, and Combretum niorense Seeds and Seed Oils from Burkina Faso. J. Am. Oil Chem. Soc. 2021, 98, 1083–1092. [Google Scholar] [CrossRef]
  9. Touré, A.; Xu, X.; Michel, T.; Bangoura, M. In Vitro Antioxidant and Radical Scavenging of Guinean Kinkeliba Leaf (Combretum micranthum G. Don) Extracts. Nat. Prod. Res. 2011, 25, 1025–1036. [Google Scholar] [CrossRef]
  10. Kpemissi, M.; Eklu-Gadegbeku, K.; Veerapur, V.P.; Potârniche, A.-V.; Adi, K.; Vijayakumar, S.; Banakar, S.M.; Thimmaiah, N.V.; Metowogo, K.; Aklikokou, K. Antioxidant and Nephroprotection Activities of Combretum micranthum: A Phytochemical, in-Vitro and Ex-Vivo Studies. Heliyon 2019, 5, e01365. [Google Scholar] [CrossRef]
  11. Kpemissi, M.; Eklu-Gadegbeku, K.; Veerapur, V.P.; Negru, M.; Taulescu, M.; Chandramohan, V.; Hiriyan, J.; Banakar, S.M.; Thimmaiah, N.V.; Suhas, D.S.; et al. Nephroprotective Activity of Combretum micranthum G. Don in Cisplatin Induced Nephrotoxicity in Rats: In-Vitro, In-Vivo and In-Silico Experiments. Biomed. Pharmacother. 2019, 116, 108961. [Google Scholar] [CrossRef] [PubMed]
  12. Olajide, O.A.; Makinde, J.M.; Okpako, D.T. Evaluation of the Anti-Inflammatory Property of the Extract of Combretum micranthum G. Don (Combretaceae). InflammoPharmacology 2003, 11, 293–298. [Google Scholar] [CrossRef] [PubMed]
  13. Kpemissi, M.; Kantati, Y.T.; Veerapur, V.P.; Eklu-Gadegbeku, K.; Hassan, Z. Anti-Cholinesterase, Anti-Inflammatory and Antioxidant Properties of Combretum micranthum G. Don: Potential Implications in Neurodegenerative Disease. IBRO Neurosci. Rep. 2023, 14, 21–27. [Google Scholar] [CrossRef] [PubMed]
  14. Mashi, R.L.; Abu, M.S.; Yakubu, O.E.; Silas, T.V.; Mayel, M.H. Antioxidant and Angiotensin-Converting Enzyme Inhibitory Activities of Fractionated Extract of Combretum micranthum Leaves. J. Biol. Sci. 2022, 22, 57–64. [Google Scholar] [CrossRef]
  15. Karou, D.; Dicko, M.H.; Simpore, J.; Traore, A.S. Antioxidant and Antibacterial Activities of Polyphenols from Ethnomedicinal Plants of Burkina Faso. Afr. J. Biotechnol. 2005, 4, 823–828. Available online: https://www.ajol.info/index.php/ajb/article/view/15190 (accessed on 24 March 2024).
  16. Ferrea, G.; Canessa, A.; Sampietro, F.; Cruciani, M.; Romussi, G.; Bassetti, D. In Vitro Activity of a Combretum micranthum Extract against Herpes Simplex Virus Types 1 and 2. Antivir. Res. 1993, 21, 317–325. [Google Scholar] [CrossRef]
  17. Benoit, F.; Valentin, A.; Yapo, A.; Marion, C.; Bastide, J.-M.; Kone, M.; Kone-Bamba, D.; Mallie, M.; Pelissier, Y.; Diafouka, F. In Vitro Antimalarial Activity of Vegetal Extracts Used in West African Traditional Medicine. Am. J. Trop. Med. Hyg. 1996, 54, 67–71. [Google Scholar] [CrossRef] [PubMed]
  18. Simon, J.E.; Wu, Q.; Welch, C. Peperidine-Flavan Alkaloid Compounds Derived from African Herb Tea Kinkeliba as Anti-Diabetic Agents. U.S. Patent 8642769B2. Available online: https://patents.google.com/patent/US8642769B2/en (accessed on 24 March 2024).
  19. Zeitoun, H.; Jubeli, R.M.; El Khoury, R.; Baillet-Guffroy, A.; Tfayli, A.; Salameh, D.; Lteif, R. Skin Lightening Effect of Natural Extracts Coming from Senegal Botanical Biodiversity. Int. J. Dermatol. 2020, 59, 178–183. [Google Scholar] [CrossRef]
  20. Hu, S.; Simon, J.E.; Wu, Y.; Wang, M.; Wu, Q. Use of Combretum micranthum Extract in Cosmetics. World Intellectual Property Organization. WO2020052571A1. Available online: https://patents.google.com/patent/WO2020052571A1/en (accessed on 24 March 2024).
  21. Mintel. Combretum micranthum—March 2024. 2024. Available online: https://clients.mintel.com/ (accessed on 11 March 2024).
  22. Welch, C.R. Chemistry and Pharmacology of Kinkéliba (Combretum micranthum), a West African Medicinal Plant. Doctor’s Dissertation, Rutgers University, Graduate School, New Brunswick, NJ, USA, 2010. [Google Scholar] [CrossRef]
  23. Lee, S.K.; Mbwambo, Z.H.; Chung, H.; Luyengi, L.; Gamez, E.J.C.; Mehta, R.G.; Kinghorn, A.D.; Pezzuto, J.M. Evaluation of the Antioxidant Potential of Natural Products. Comb. Chem. High Throughput Screen. 1998, 1, 35–46. [Google Scholar] [CrossRef]
  24. Lim, T.Y.; Yule, C. Evaluation of Antioxidant, Antibacterial and Anti-Tyrosinase Activities of Four Macaranga Species. Food Chem. 2009, 114, 594–599. [Google Scholar] [CrossRef]
  25. 14:00–17:00. “ISO 4831:2006.” ISO. Available online: https://www.iso.org/fr/standard/38280.html (accessed on 25 April 2024).
  26. Zhen, J.; Welch, C.; Guo, Y.; Bassène, E.; Raskin, I.; Simon, J.E.; Wu, Q. Novel Skeleton Flavan-Alkaloids from African Herb Tea Kinkéliba: Isolation, Characterization, Semisynthesis, and Bioactivities. In African Natural Plant Products, Volume III: Discoveries and Innovations in Chemistry, Bioactivity, and Applications; ACS Symposium Series; American Chemical Society: Washington, DC, USA, 2020; Volume 1361, pp. 297–312. [Google Scholar] [CrossRef]
  27. Zhen, J.; Simon, J.E.; Wu, Q. Total Synthesis of Novel Skeleton Flavan-Alkaloids. Molecules 2020, 25, 4491. [Google Scholar] [CrossRef] [PubMed]
  28. Abdullahi, M.H.; Anuka, J.A.; Yaro, A.H.; Musa, A. Effect of Aqueous Leaf Extract of Combretum micranthum g. Don (Combretaceae) on Gastro Intestinal Smooth Muscle. Bayero J. Pure Appl. Sci. 2014, 7, 21–25. [Google Scholar] [CrossRef]
  29. Osonwa, U.E.; Umeyor, C.E.; Okon, U.V.; Uronnachi, E.M.; Nwakile, C.D. Stability Studies on the Aqueous Extract of the Fresh Leaves of Combretum micranthum G. Don used as Antibacterial Agent. J. Chem. 2012, 6, 417–424. [Google Scholar]
  30. 8 Final Report on the Safety Assessment of Butylene Glycol, Hexylene Glycol, Ethoxydiglycol, and Dipropylene Glycol. J. Am. Coll. Toxicol. 1985, 4, 223–248. [CrossRef]
  31. Sethi, A.; Kaur, T.; Malhotra, S.; Gambhir, M.L. Moisturizers: The Slippery Road. Indian J. Dermatol. 2016, 61, 279. [Google Scholar] [CrossRef] [PubMed]
  32. Kis, N.; Gunnarsson, M.; Berkó, S.; Sparr, E. The Effects of Glycols on Molecular Mobility, Structure, and Permeability in Stratum Corneum. J. Control. Release 2022, 343, 755–764. [Google Scholar] [CrossRef]
  33. Kinnunen, T.; Koskela, M. Antibacterial and Antifungal Properties of Propylene Glycol, Hexylene Glycol, and 1,3-Butylene Glycol in Vitro. Acta Derm.-Venereol. 1991, 71, 148–150. [Google Scholar] [CrossRef]
Figure 1. Extraction ion chromatogram (EIC) of the Kinkeloids by +ESIQ1MS. Separation was performed on a Nucleodur C18 HTec (150 × 4 mm; 5 µm) with gradient elution composed of water and methanol, both acidified with 0.1% formic acid, respectively, at a flow rate of 0.7 mL/min. The red box represents kinkeloid peaks.
Separations 11 00132 g001
Figure 2. MS/MS spectrum of a fragmented kinkeloid C at 15 eV.
Separations 11 00132 g002
Figure 3. Planar structures of kinkeloids B, C, and D obtained with the ACD/ChemSketch 2022.2.1 software.
Separations 11 00132 g003
Figure 4. Total Ion Chromatogram (TIC) of CM butylene glycol extract and its fractions, obtained using an Eclipse Zorbax column (150 × 2.1 mm; 1.8 µm) with the mobile phase consisting of water and methanol, both acidified with 0.1% and 0.08% formic acid, at a flow rate of 400 µL/min.
Separations 11 00132 g004
Figure 5. Combretum micranthum butylene glycol crude extract (grey), fraction 1 (green), fraction 2 (red), and fraction 3 (blue) molecular networks, obtained using GNPS platform and visualized with Cytoscape software 3.8.2. (A) The global molecular network. (B) The kinkeloids and non glycosylated flavonoids cluster. (C) The glycosylated flavonoids cluster.
Separations 11 00132 g005
Figure 6. (A) Heatmap using the hierarchical algorithm (similarity measure Elucidian, rule stations) and a (B) Venn diagram obtained with Mass Profiler Professional 15.1 software.
Separations 11 00132 g006
Table 1. Identifying parent and fragment ions obtained from fragmented kinkeloid C using MS/MS at 15 eV.
m/zFormulaMass (MFG)Diff (ppm)
374.1598C20H24NO6374.16040.07
356.1490C20H22NO5356.1498−3.33
339.1232C20H19O5339.12321.21
321.1112C20H17O4321.1127−1.97
285.0747C16H13O5285.0763−3.76
234.1118C13H16NO3234.113−2.79
222.1120C12H16NO3222.113−2.02
217.0853C13H13O3217.0865−2.03
175.0744C11H11O2175.0759−7.17
163.0379C9H7O3163.0395−6.48
150.0906C9H12NO150.0919−4.88
123.0433C7H7O2123.0446−6.18
Table 2. The NMR results obtained with kinkeloids B in comparison with the literature.
Kinkeloids B from Fraction 2Zhen Molecules 2020 [27] Kinkeloid B
δHδCδH literatureδC literature
24.7478.85.0079.57
32.08/1.8830.32.13/1.8730.48
42.6319.92.6220.03
5-155.5-155.62
66.0695.76.07102.97/96.01
7-158.0-155.07
8-106.96.0796.01/102.97
9-157.4-157.96
10-102.3-103.12
1′-133.9-134.02
2′6.84114.16.85106.16
3′-146.0-147.15
4′-146.0-145.1
5′6.76115.76.78115.3
6′6.72118.46.72106.16
1′′4.5454.54.5454.76
3′′3.39/2.9846.43.4/2.9746.83
4′′1.84/1.6423.41.89/1.6224.24
5′′1.84/1.6423.41.89/1.6223.54
6′′2.28/1.8429.32.31/1.8729.57
Table 3. Kinkeloid C and D NMR results.
Kinkeloids C from Fraction 2Kinkeloids D From Fraction 2
δHδCδHδC
25.0078.84.9379.2
32.13/1.8730.34.1767.1
42.6219.92.8228.5
5-155.5-155.5
66.0795.76.0695.7
7-158.0-158.0
86.07106.9-106.9
9-157.4-157.4
10-102.3-101.1
1′-133.9-133.9
2′6.41106.26.41106.2
3′-146.8-146.8
4′-133.4-133.4
5′-146.8-146.8
6′6.41106.26.41106.2
1′′4.5454.54.5454.5
3′′3.4/2.9746.43.39/2.9846.4
4′′1.89/1.6223.41.84/1.6423.4
5′′1.89/1.6223.41.84/1.6423.4
6′′2.28/1.8429.32.28/1.8429.3
Table 4. Summary of in tubo and in vitro results of C. micranthum extracts and their simplified fractions.
Samples%DPPH Radical Trapping%Tyrosinase InhibitionCollagen I SynthesisInflammatory Response (PEG2)
CM butylene glycol extract91 ± 0.5%
[] 3.2 mg/mL
91 ± 0.1%
[] 3.2 mg/mL
66% *
176,151 ± 56,985 **
[] 0.002%
71%
182,276 ± 89,369
[] 0.001%
72%
183,155 ± 64,542
[] 0.0004%
Control
106,385 ± 28,312
35% *
3400 ± 408 ***
[] 0.5%
95%
4918 ± 319
[] 0.25%
148%
6262 ± 1047
[] 0.125%
Control
2526 ± 239
Fraction 126 ± 1.1%
[] 1.6 mg/mL
23 ± 0.4%
[] 1.6 mg/mL
9%
115,626 ± 47,184
[] 0.00036%
33%
141,491 ± 33,628
[] 0.00018%
0%
99,253 ± 14,329
[] 0.00009%
Control
106,385 ± 28,312
NTNTNTNT
Fraction 281 ± 0.5%
[] 0.8 mg/mL
96 ± 1.1%
[] 0.8 mg/mL
159%
138,438 ± 92,622
[] 0.00015%
164%
140,889 ± 69,336
[] 0.00008%
142%
129,390 ± 90,969
[] 0.00004%
Control
53,411 ± 9096
29%
3943 ± 176
[]0.05%
56%
4770 ± 312
[] 0.025%
9%
3334 ± 285
[] 0.0125%
Control
3049 ± 339
Fraction 379 ± 2.8%
[] 0.8 mg/mL
87 ± 4%
[] 0.8 mg/mL
73%
152,088 ± 86,959
[] 0.000012%
50%
131,696 ± 89,110
[] 0.000006%
76%
154,656 ± 76,739
[] 0.000003%
Control
87,690 ± 28,057
NTNTNTNT
CM-MO supplementary water extractNTNTNTNTNTNT−36%
484 ± 130
[] 0.5%
−26%
557 ± 181
[] 0.125%
−12%
665 ± 196
[] 0.0625%
Control
756 ± 221
[]: concentration/dilution tested of CM extract or fractions; * %variation from control: (product—control)/control × 100; ** fluorescence intensity: mean of triplicates +/− standard deviation; *** quantity of PGE2 in pg/mL reported on viability (MTT): mean of triplicates +/− standard deviation; NT: not tested.
Table 5. Annotated compounds on the molecular network of butylene glycol CM extract and its fractions.
Measured m/z [M + H]+Molecular Formula [M]Calculated m/z [M + H]+Error (ppm)Compound Assignment
342.1694C20H23NO4342.17001.76Kinkeloid A
358.1650C20H23NO5358.16490.93Kinkeloid B1, B2, B3, B4
374.1593C20H23NO6374.15980.24Kinkeloid C1, C2, C3
390.1551C20H23NO7390.15470.86Kinkeloid D
291.0860C15H14O6291.08631.75Catechin
291.0860C15H14O6291.08631.74Epicatechin
307.0808C15H14O7307.08121.23Epigallocatechin
449.1073C21H20O11449.10060.78Isoorientin
433.113C21H20O10433.11290.11Isovitexin
433.113C21H20O10433.11290.11Vitexin
Disclaimer/Publisher’s Note: The statements, opinions and data contained in all publications are solely those of the individual author(s) and contributor(s) and not of MDPI and/or the editor(s). MDPI and/or the editor(s) disclaim responsibility for any injury to people or property resulting from any ideas, methods, instructions or products referred to in the content.

