
Quality Evaluation and Identification of Phyllanthi fructus (Yuganzi) Based on the Spectrum-Effect Relationship

1
Institute of Feed Research of Chinese Academy of Agricultural Sciences, Beijing 100081, China
2
Anyou Biotechnology Group Co., Ltd., Taicang 215421, China
*
Authors to whom correspondence should be addressed.
†
These authors contributed equally to this work.
Separations 2024, 11(4), 104; https://doi.org/10.3390/separations11040104
Submission received: 22 February 2024
/
Revised: 20 March 2024
/
Accepted: 26 March 2024
/
Published: 29 March 2024
(This article belongs to the Section Analysis of Natural Products and Pharmaceuticals)
Abstract
:To establish a quality evaluation and identification method for Phyllanthi fructus (Yuganzi), the spectrum-effect relationship was explored. A high-performance liquid chromatography (HPLC) fingerprint was established using ultraviolet spectrophotometry, and the in vitro antioxidant activity was determined using a total antioxidant capacity assay kit. Similarity analysis, hierarchical cluster analysis (HCA), and partial least squares regression (PLSR) were performed to establish the spectrum-effect relationships. Thirteen batches of Yuganzi were collected for testing. The results revealed that the optimal chromatographic conditions for the HPLC fingerprint were as follows: the mobile phase consisted of 0.1% phosphoric acid solution (A) and acetonitrile (B), the detection wavelength was 214 nm, the column temperature was 30 °C, and the flow rate was 0.8 mL/min. Among the batches of samples, the similarity values of 10 samples (S1–S10) from Yunnan were larger than 0.995; the similarity values of 3 samples (S11–S13) from India, Gaoligong Mountain, and Fujian were less than or equal to 0.986. Furthermore, nineteen characteristic peaks of Yuganzi were calibrated using fingerprint evaluation software. The study on the spectrum-effect relationship further revealed that compounds corresponding to peaks 5 and 8 were potentially key ingredients for the quality evaluation and identification of Yuganzi, closely related to the stable antioxidant activities of Yuganzi. The spectrum-effect relationship is an agile and efficient approach that can ensure the intra-assay stability of Yuganzi from same region and identify Yuganzi from different regions. Compounds with antioxidant activity can be identified as quality markers for Yuganzi.
1. Introduction
Yuganzi, also known as Phyllanthus emblica Linn., Dian Olive, Kuiza (Tibet) or Indian gooseberry, is a tree belonging to the Euphorbiaceae family [1]. Every year, it blooms from March to April, the fruit grows from late May to mid-August and matures from September to November [2]. Yuganzi is mainly distributed in subtropical and tropical regions. According to relevant data, the countries with the largest distribution area of Yuganzi in the world are China and India. In China, Yuganzi has a wide distribution area of about 130,000 hectares, making Yuganzi resources extremely abundant [3,4].
Furthermore, Yuganzi has a history of consumption and medicinal use spanning nearly two thousand years. More specifically, it is an important economic crop in the southwest region, and a valuable resource for traditional Chinese medicine (TCM) and folk medicine [5]. According to the 2020 edition of the Chinese Pharmacopoeia, Yuganzi fruit is used for indigestion, blood heat, blood stasis, abdominal distention, cough, etc., and is commonly used in folk medicine for treating biliary diseases and bronchitis [6]. As a result, Yuganzi has been designated by the United Nations Health Organization as one of the health plants recommended for cultivation, as it provides essential raw materials for the development of food, health products, and drugs [7,8]. Yuganzi is both a medicinal herb and a nutritional supplement that is rich in nutrients, containing various phytochemicals, including vitamin C, tannins, phyllembelic acid, phyllemblin, rutin, curcuminoides, and phenolic compounds [9]. Among them, quercetin, gallic acid, ellagic acid, and other polyphenolic compounds have been identified as key active ingredients of Yuganzi for health promotion, with concentrations ranging from 60 to 300 mg/g [10]. These ingredients exhibit potent pharmacological properties, including anti-viral, antiinflammatory, antitumor, antioxidant, and hepatoprotective effects [11,12]. Panchabhai TS et al. found that the combination of Tinospora cordifolia and Yuganzi significantly prevented necrosis in a rat model [13]. Jaijoy K and Sripanidkulchai B et al. found that the aqueous extracts from Yuganzi and its phenolic compounds, such as gallic acid and vanillic acid, exhibited significant anti-inflammatory activity on account of their inhibitory effect on the synthesis and expression of inflammatory and pain mediators (TNF-α, COX-2, iNOS, IL-6, and IL-16) in a dose-dependent manner [14,15]. It was also reported that Yuganzi from Yunnan province exhibited the optimal antioxidant activity. The ethanolic extracts could protect the cells from oxidative damage; the mechanism was related to reducing the release of pro-inflammatory mediators, increasing glutathione content and total superoxide dismutase activity, and inhibiting MDA content [5]. However, the active ingredients responsible for the antioxidant activity of Yuganzi have yet not been determined.
Chromatographic fingerprints, especially high-performance liquid chromatography (HPLC) fingerprints, are widely utilized for the quality evaluation and identification of natural plants [16]. By combining them with pharmacological indicators, a rational spectrum-effect model and analysis method can be established, which can systematically reveal the relationship between the components and the pharmacological effects, further elucidating pharmacologically active components and composition compatibility. Based on the establishment of the spectrum-effect correlation between pharmacodynamic indexes (the cell viability, ALT, AST activity, and TNF-α, IL-1β production) and HPLC chromatograms, Zhang H et al. [17] revealed that daidzin, 6″-O-xylosylglycitin, 6″-O-xylosyl-tectorid in a Flos Puerariae–Semen Hoveniae medicine pair made a great contribution to treating alcohol-induced liver damage by modulating the PI3K/AKT/mTOR signaling pathways. Hanting Yang and Qian Li [18] found that isoimperatorin and byakangelicol exerted antioxidant activity in Angelica dahurica by establishing spectrum-effect relationships between antioxidant indexes and GC-MS chromatograms. At present, the spectrum-effect relationships of many herbs, such as Ligustrum lucidum, Callicarpa nudiflora, etc., have been used for the quick screening of pharmacologically active substances, providing new ideas for quality evaluation research [19,20].
Therefore, to determine a quality evaluation and identification method for Yuganzi, this study established a high-performance liquid chromatography (HPLC) fingerprint of Yuganzi, conducted a similarity analysis and a hierarchical cluster analysis (HCA) on the fingerprint, and then correlated the fingerprint with antioxidant activity through orthogonal partial least squares analysis (PLSA). The establishment of the spectral-effect relationship will contribute to the quality evaluation and identification of natural plants such as Yuganzi.
2. Materials and Methods
2.1. Plant Materials and Reagents
A total of 10 batches (S1–S10) of Yuganzi fruit samples were collected from the same region in Yunnan, China. The other three samples (S11–S13) were from India, Gaoligong Mountain, and Fujian, respectively. Methanol and acetonitrile of HPLC grade were obtained from Thermo Fisher Scientific (Waltham, MA, USA). In this study, we used formic acid, trifluoroacetic acid, and phosphoric acid supplied by Agela Technologies (Tianjin, China), all of which were of analytical grade at least. The total antioxidant capacity assay kit with the FRAP method was purchased from Beyotime Biotechnology Co., Ltd. (Shanghai, China).
2.2. Apparatus
HPLC analysis was performed on a Shimadzu HPLC system (Shimadzu, Kyoto, Japan) equipped with an auto sampler (SIL-20A), a binary solvent delivery pump (LC-20 AD), a column temperature chamber (CT0-20A), a system controller (CBM-20A), and UV–Visible diode array detector (SPD-M20A 230 V). Chromatographics were conducted on a Venusil XBP C18(A) column (4.6 × 250 mm, 5 µm, Agela Technologies, Tianjin, China), Kromasil 100-5-C18 (4.6 × 250 mm, 5 µm, Nouryon, Sweden), and Venusil C18 plus (4.6 × 250 mm, 5 µm, Agela Technologies, Tianjin, China). The total antioxidant capacity was detected using a microplate reader (Multiskan SkyHigh, Thermo Fisher Scientific, Waltham, MA, USA).
2.3. Sample Preparation
According to the Chinese Pharmacopoeia (2020 edition), each batch of dried Yuganzi fruit was ground into powder (50 mesh). For HPLC analysis, we precisely weighed 0.1 g of the powder and performed extraction with 50 mL of 50% methanol through heating and refluxing for 1 h. Subsequently, the weight loss of the sample extract decoction was compensated for by 50% methanol. The solution was filtered through a 0.22 µm membrane filter before being injected into the HPLC system. To detect the antioxidant activity, we precisely weighed 1 mg of the powder and dissolved it in 1 mL of 50% methanol.
2.4. Optimization of HPLC Conditions
Optimizing the HPLC chromatography conditions can improve the separation efficiency of compounds, allowing for different components to be better separated for accurate quantification; enhance the detection sensitivity, ensuring the more accurate and reliable detection of target compounds; shorten the analysis time, enhancing experimental efficiency; and ensure the stable retention time of target compounds, aiding in accurate qualitative and quantitative analysis. Therefore, different chromatographic columns (Kromasil 100-5-C18 (4.6 × 250 mm, 5 µm), Venusil XBP C18(A) (4.6 × 250 mm, 5 µm), Venusil C18 plus (4.6 × 250 mm, 5 µm)), mobile phase systems (water (A), methanol (B); water (A), acetonitrile (B); 0.1% phosphoric acid solution (A), acetonitrile (B); 0.1% trifluoroacetic acid solution (A), acetonitrile (B); 0.1% formic acid solution (A), acetonitrile (B)), column temperatures (25 °C, 30 °C, and 35 °C), and detection wavelengths (from 190 nm to 800 nm) were employed for HPLC analysis. The injection volume was 10 μL. The mobile phase system is presented in Table 1.
2.5. Method Validation for HPLC Fingerprint Analysis
The precision of the HPLC fingerprint method was determined by evaluating six injections of the same working sample. The stability was assessed by analyzing a sample at 0, 2, 4, 6, 8, 10, and 12 h. The repeatability was evaluated by calculating the relative standard deviation (RSD) of six independently prepared extracts of Yuganzi. In the method validation process, sample 1 was chosen as the sample solution, and the RSD values were calculated using the relative retention time and peak area of each characteristic peak.
2.6. Determination of the HPLC Fingerprint
Under the optimized HPLC method mentioned above, 13 batches (S1–S13) of Yuganzi samples were analyzed to establish the representative chromatographic fingerprint. The “Similarity Evaluation System for Chromatographic Fingerprints of TCMs (Version 2012A; Beijing, China)” software was applied to perform the similarity analysis, establish reference fingerprints, and confirm their common chromatographic peaks. HCA was performed using SPSS software (version 24) to demonstrate the similarity and differences among the 13 batches of samples.
2.7. Hierarchical Cluster Analysis (HCA)
Firstly, we opened the SPSS software and imported the dataset for the systematic clustering analysis. Then, we selected “Analyze”, “Classify”, and “Cluster” in the menu bar to open the Cluster Analysis dialog box and set the clustering parameters. After determining the settings, we ran the hierarchical clustering analysis (HCA), and SPSS calculated the similarity between the samples based on the selected parameters and generated clustering results. Finally, we analyzed the generated clustering results and viewed the formed clustering structure and sample grouping. The clustering results could be visualized through a tree diagram to help understand the relationships between the samples.
2.8. Antioxidant Activity
The principle of determining total antioxidant capacity using the FRAP method is that under acidic conditions, antioxidants can reduce Ferric-tripyridyltriazine (Fe3+-TPTZ) to produce a blue Fe2+-TPTZ complex. The operation steps were as follows: Firstly, 180 μL FRAP working fluid was added to each detection hole of a 96-well plate. Then, 5 μL distilled water or PBS was added to the blank control well; 5 μL FeSO4 standard solution was added into the standard curve detection well; 5 μL samples or 0.15–1.5 mM Trolox as a positive control was added to the sample detection well. After incubation, absorbance was measured at 593 nm for each well. Finally, the total antioxidant capacity of the sample was calculated based on the standard curve. The values of total antioxidant capacity are shown as the mean ± SD, and they were analyzed using SPSS (version 25.0).
2.9. Establishment of Spectrum-Effect Relationship
After obtaining the HPLC fingerprint and antioxidant data of the Yuganzi samples, we ensured the data format was correct and imported them into the SIMCA-P software (version 12.0); chose partial least squares regression analysis (PLSR) as the modeling method; configured the model parameters, including selecting independent and dependent variables; ran the model to fit the data and generated the regression model; assessed the model’s goodness of fit and predictive ability; examined statistical metrics and graphical displays; and, finally, interpreted the impact of each independent variable on the dependent variable within the model before analyzing the coefficients and VIP scores.
3. Results and Discussion
3.1. Optimization of HPLC Chromatographic Conditions
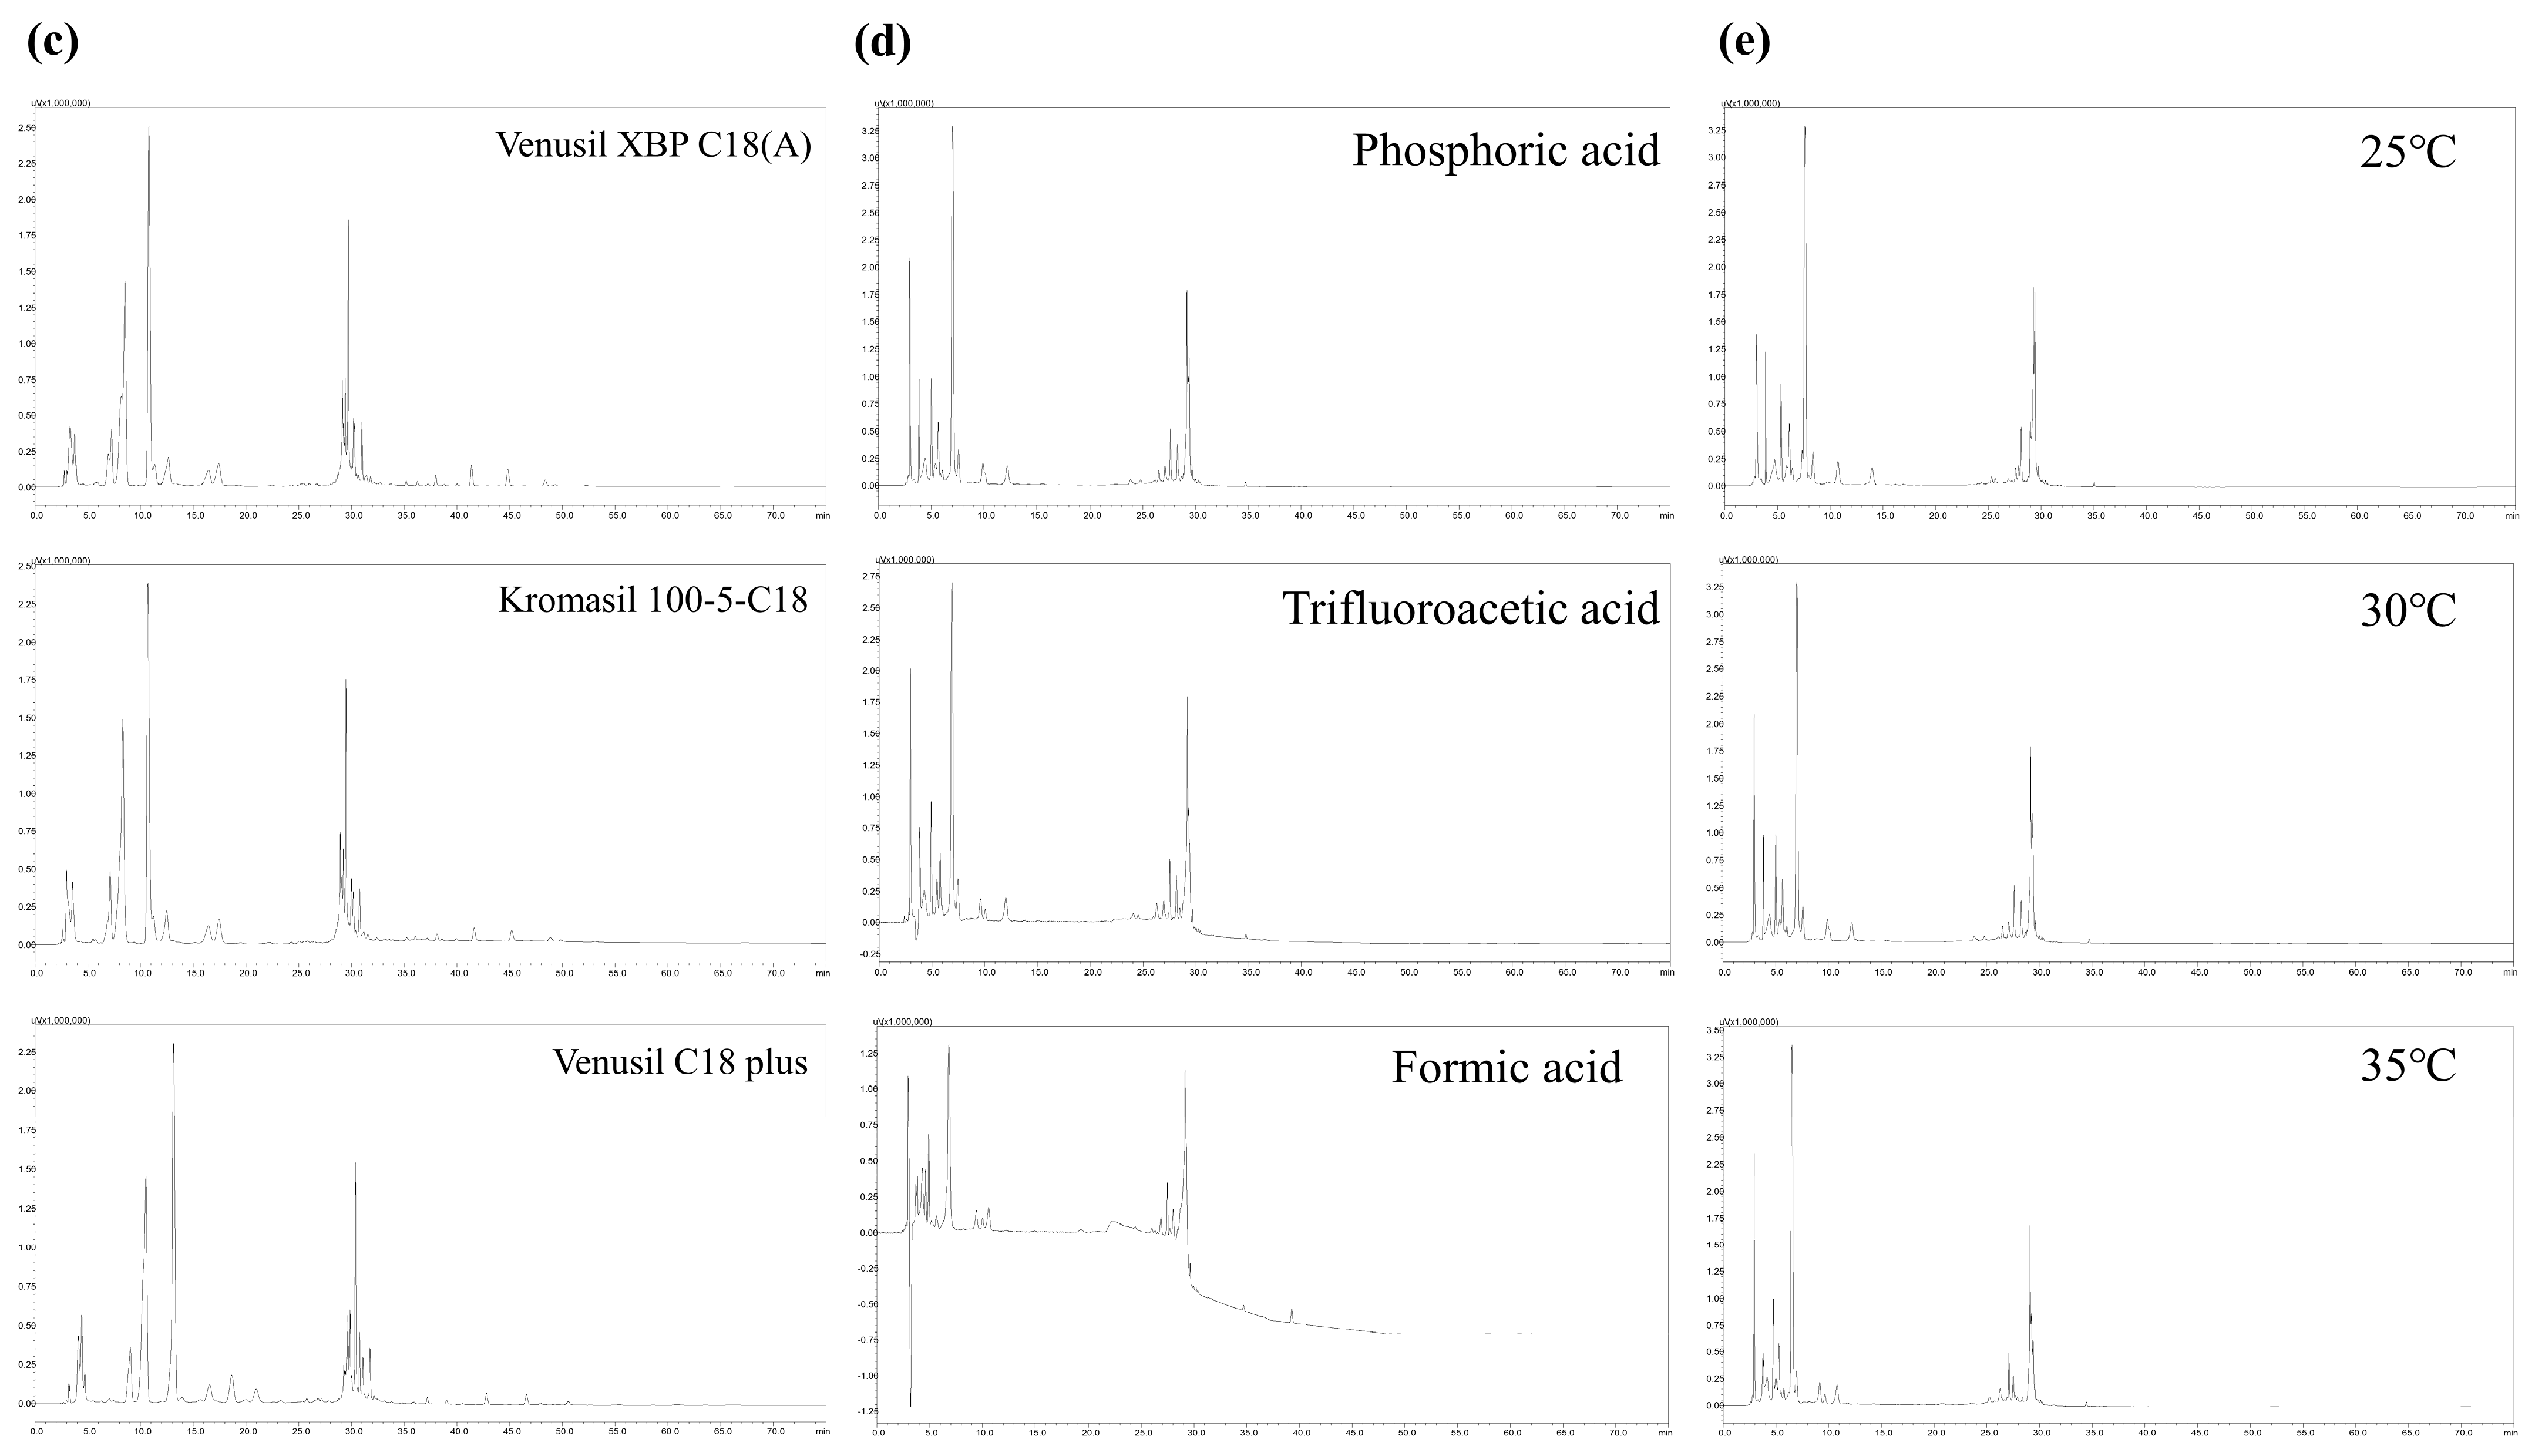
To obtain the fingerprint chromatograms of Yuganzi, the different chromatographic columns, mobile phase systems, column temperatures, and detection wavelengths were investigated and optimized on the basis of the chromatographic peak number, retention time, and peak area [21,22]. A full wavelength scan from 190 nm to 800 nm was applied to select detection wavelengths. The results showed the presence of the strongest absorption signal peak at around 214 nm (Figure 1a). Compared to the other two types of chromatographic columns, Venusil XBP C18 (A) exhibited the highest number of peaks, shorter retention times, and higher peak areas (Figure 1c and Table 1). When water (A) and acetonitrile (B) were selected as the mobile phase, more chromatographic peaks, a shorter retention time, and a better separation effect were observed (Figure 1b and Table 1). Modifiers were then added to the aqueous phase to improve peak shapes. The results showed that good peak shapes were obtained with a mobile phase of 0.1% phosphoric acid solution (A) and acetonitrile (B), despite this phase having the smallest number of peaks (Figure 1d and Table 1). Chromatographic separation at different column temperatures revealed larger peak areas at 30 °C, with similar numbers of peaks, retention times, and separation effects. Hence, for the quantitative analysis and the HPLC fingerprint analysis, the optimal separation conditions of HPLC for Yuganzi were as follows: the Venusil XBP C18 (A) (4.6 × 250 mm, 5 µm) chromatographic column, mobile phase of 0.1% phosphoric acid solution (A) and acetonitrile (B), detection wavelength at 214 nm, and column temperature at 30 °C (Table 2).
3.2. Method Validation for the HPLC Fingerprint Analysis
The precision, repeatability, and stability were determined and used to verify the feasibility and reliability of the HPLC fingerprint analysis method [23,24]. In this study, the precision, repeatability, and stability were determined by calculating the relative standard deviations (RSDs) of relative retention times and relative peak areas for the 19 common characteristic peaks. The precision experiments showed that the RSDs of the relative retention times were <0.08%, and the RSDs of the relative peak areas were <2.91%. The repeatability experiments showed that the RSDs of the relative retention times were <0.06%, and the RSDs of the relative peak areas were <4.14%. Furthermore, the stability experiments showed that within 12 h, the RSDs of the relative retention times were <0.12% and the RSDs of the relative peak areas were <2.78%, indicating the stability of the sample solution within 12 h. The results demonstrated that the variations in the RSDs of the characteristic peaks did not exceed 5%, further confirming the feasibility and reliability of using the HPLC fingerprint analysis method for Yuganzi extraction.
3.3. Analysis of HPLC Fingerprints and Similarities
3.3.1. Establishment of the Fingerprint and Characteristic Chromatogram
Following the methods outlined in Section 2.3, ten batches (S1–S10) of Yuganzi from Yunnan and the three samples (S11–S13) from India, Gaoligong Mountain, and Fujian, respectively, were prepared under the optimal chromatographic conditions. The HPLC fingerprint of the Yuganzi extracts from the 13 samples was established and analyzed using the Similarity Evaluation System for Chromatographic Fingerprints of Traditional Chinese Medicine (version 2012 A) (Figure 2). The peaks with relatively high intensity and good resolution in the characteristic chromatogram were assigned as common characteristic peaks of the samples [25,26]. There were 19 common characteristic peaks (1 to 19) completely separated from the nearby peaks, covering over 90% of the total area in the chromatogram (Figure 3).
3.3.2. Similarity Analysis of the HPLC Fingerprints of Yuganzi
Using the chromatogram fingerprint of sample 1 (Figure 3) as a reference atlas, the similarity analysis of the fingerprints of Yuganzi was carried out using the Similarity Evaluation System for Chromatographic Fingerprints of Traditional Chinese Medicine (version 2012 A). The similarity values for the 10 batches (S1–S10) of Yuganzi from Yunnan were larger than 0.995 (Table 3), indicating good consistency among the samples from the same source [27,28]. The similarity values of the three samples (S11–S13) from India, Gaoligong Mountain, and Fujian, respectively, were less than or equal to 0.986, indicating differences in composition among the samples from different regions.
3.3.3. Hierarchical Cluster Analysis (HCA)
HCA provides a means for analyzing and simplifying datasets. The analysis can reduce the dimensionality of the dataset, retain the maximum contribution to the variance of the dataset, and highlight the similarity and difference between data points [29]. In this study, the peak areas of the 19 common peaks from the 13 batches of samples were firstly imported into the R studio software (4.2.1) as variables to obtain a 13 × 19-order original data matrix. Then, clustering was performed using the intergroup connection method and the Euclidean square distance as the metric. As shown in Figure 4, the Yuganzi samples can be divided into four subgroups: A, B, C, and D. Specifically, subgroup A included S1, S2, S9, S4, S5, S8, S3, S7, S10, and S6; subgroup B only consisted of S11; subgroup C only consisted of S12; and subgroup D only consisted of S13. The findings indicated that the content and distribution of compounds in S1–S10 were highly consistent, further revealing the quality uniformity and stability of the Yuganzi samples with the same origin but from different batches. Furthermore, S11, S12, and S13 were classified as the other, different three groups, which demonstrated there were significant differences in composition and content among the samples from Yunnan, India, Gaoligong Mountain, and Fujian.
3.3.4. Antioxidant Activity Test Results
The antioxidant activities of Yuganzi were determined using the FRAP method with the total antioxidant capacity assay kit [30]. As shown in Table 3, there was no significant difference in the antioxidant capacity of S1–S10, but there was a significant difference in antioxidant capacity compared to S11, S12, and S13. This indicated the stability of the antioxidant function of homologous Yuganzi and the differences in activity among the samples from different regions. Combined with the results of the similarity analysis and hierarchical cluster analysis, this further validated that there was a significant correlation between the antioxidant potential of Yuganzi and their active ingredients, and good quality control could ensure the stability of the pharmacological effects from different batches of Yuganzi.
3.3.5. The Results of Spectrum-Effect Relationship Analysis
To analyze the relationship between the characteristic fingerprint of Yuganzi and antioxidant capacity, the correlation between the peak area of Yuganzi and the value of antioxidant capacity was studied using a PLSR model established using SIMCA-P software (14.1). The regression coefficient and the variable importance in projection (VIP) were used to show the relative influence of predictor variables (peak areas of each characteristic peak in the fingerprint of Yuganzi extracts) on the dependent variable (the value of total antioxidant capacity) of the PLSR model, as shown in Figure 5 and Figure 6.
Generally, the larger the coefficient, the greater the effect of the component on antioxidant activity. A positive coefficient indicates a positive correlation between the component and antioxidant activity, while a negative number indicates a negative correlation. The results showed that the common peaks (P2, P5, P7, P8, P9, P11, P12, and P16) in the fingerprint were positively correlated with the antioxidant activities, while peaks P1, P3, P4, P6, P10, P13, P14, P17, P18, and P19 were negatively correlated with the antioxidant activities (Figure 5). VIP scores are important indicators that reflect the ability of independent variables to explain dependent variables. A higher VIP score indicates a stronger explanatory power of the independent variable. The PLSR analysis results showed that the VIP scores of peaks P5, P8, P1, P14, and P9 were all greater than 1, indicating that changes in the content of these components significantly affected the antioxidant activity (Figure 6). Based on the above results, it can be concluded that the compounds corresponding to P5 and P8 played a significant positive role in antioxidant activity.
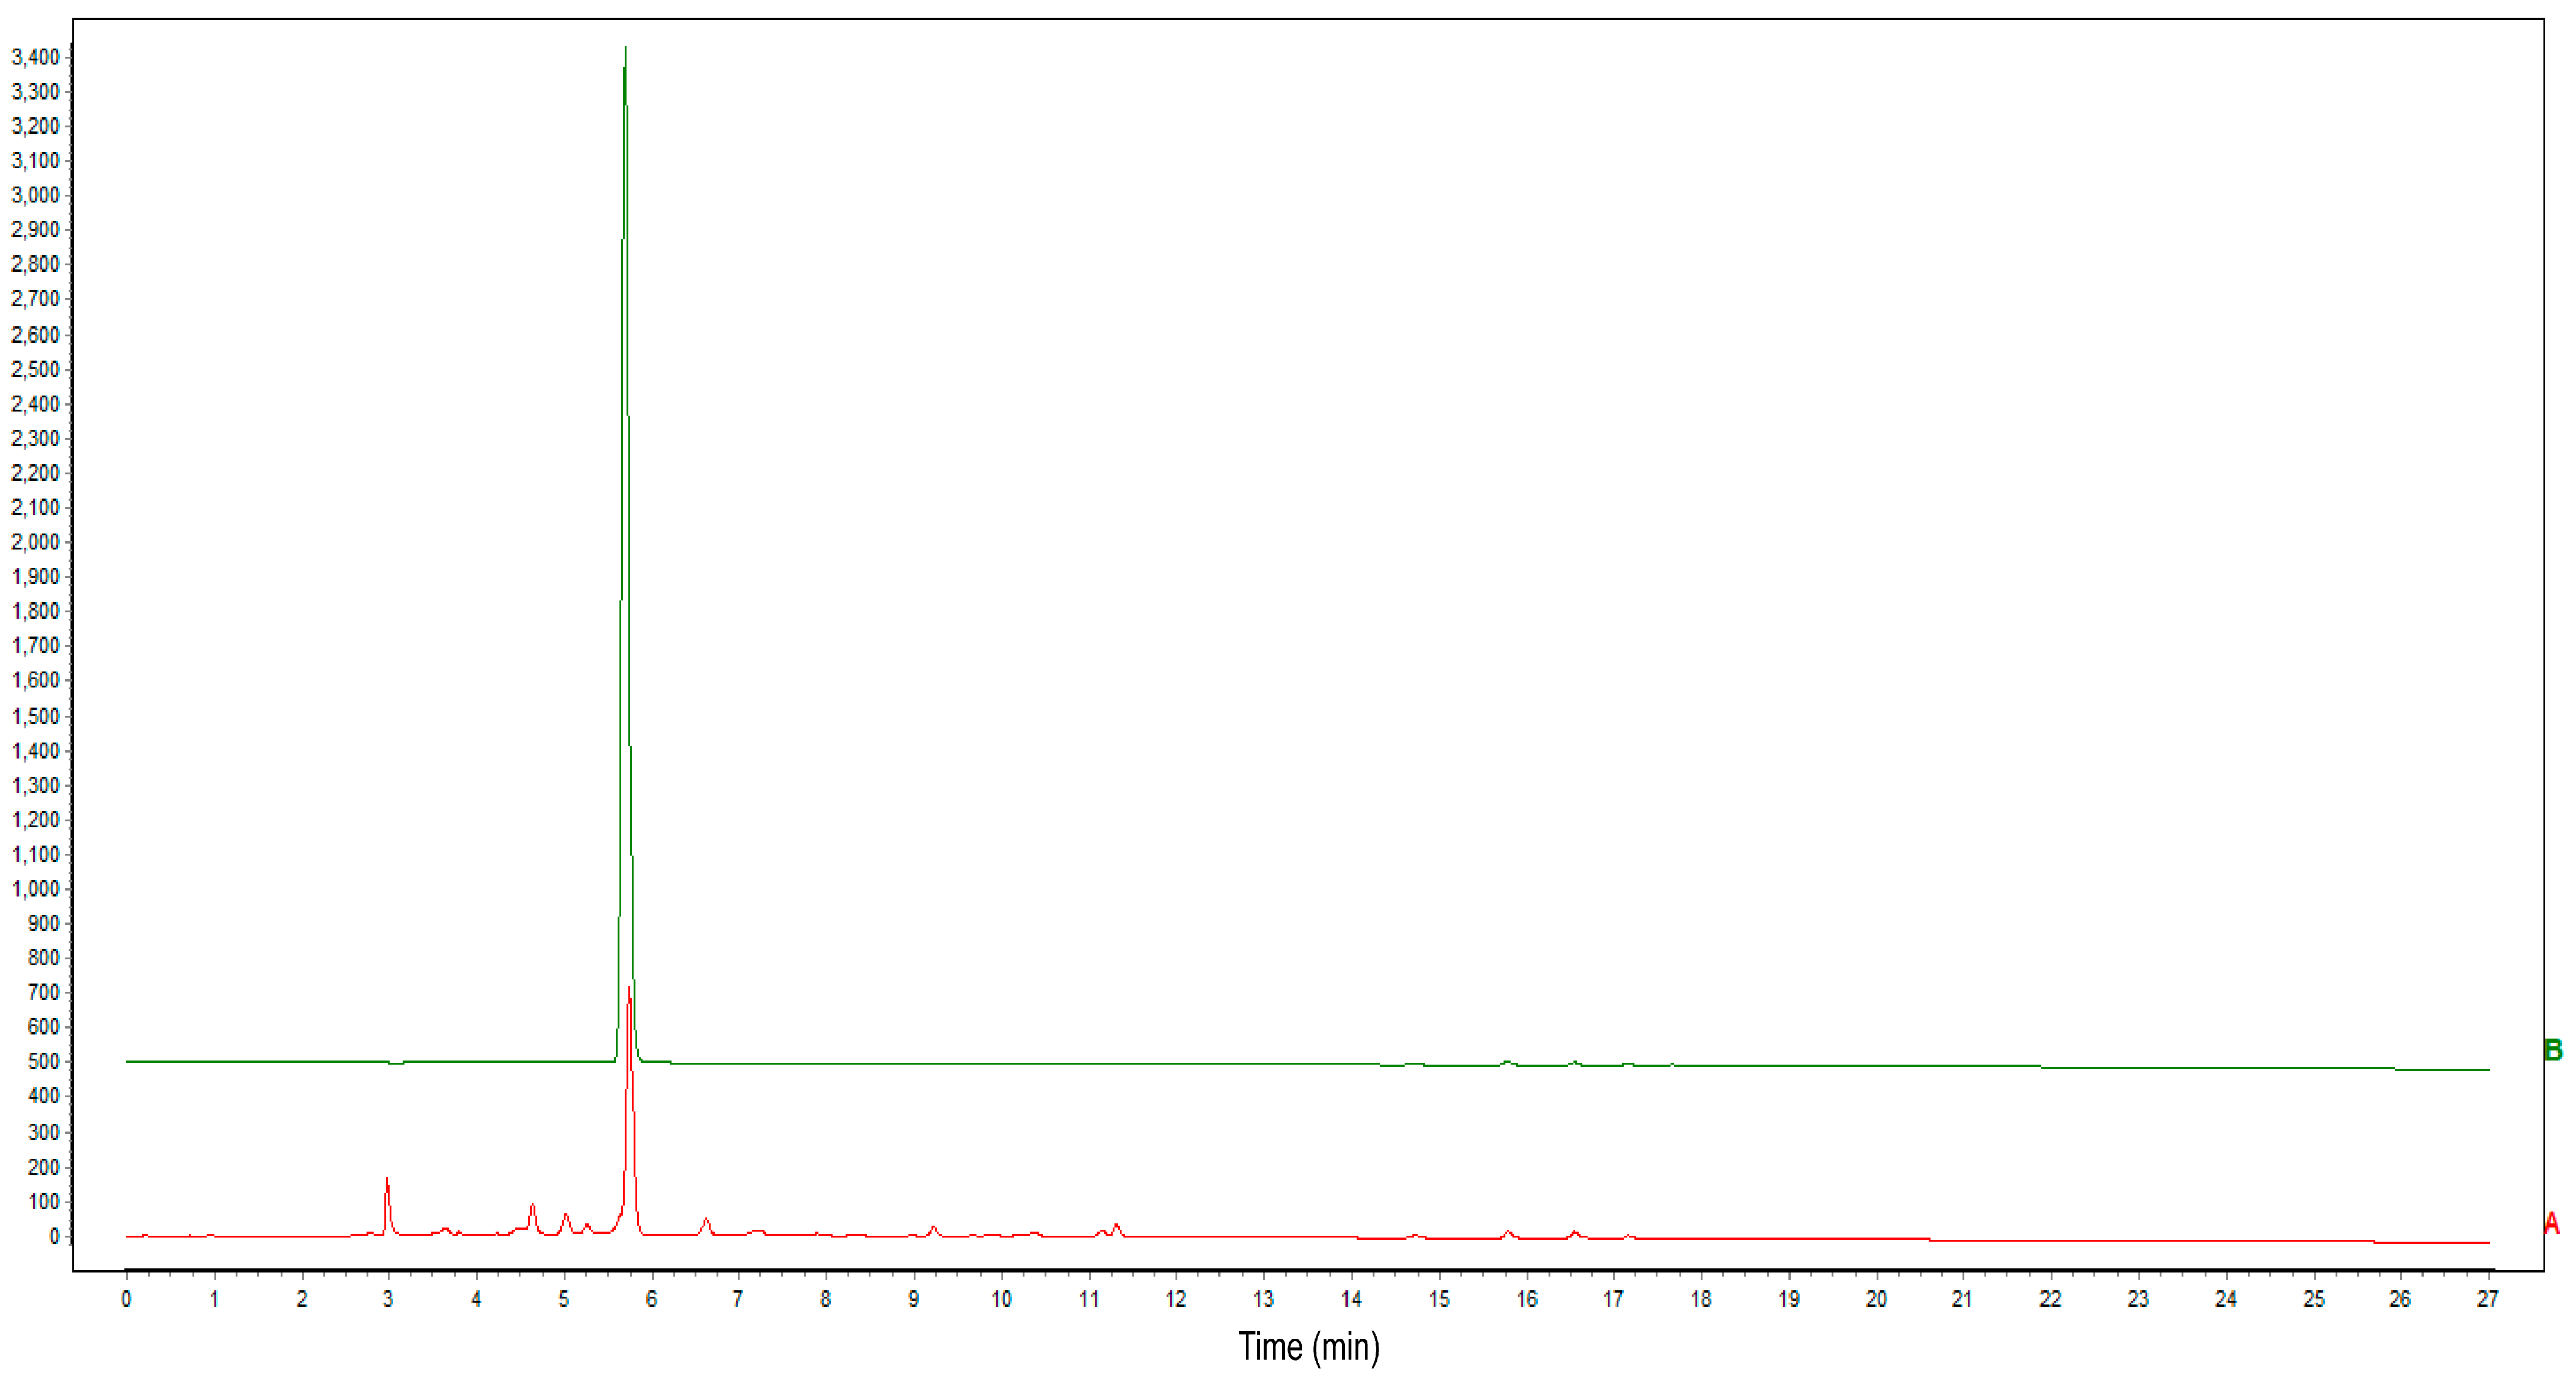
As shown in Figure 7, P8, with the highest intensity, was identified as gallic acid by comparing the chromatogram of standard products. Gallic acid (3,4,5-trihydroxybenzoic acid) is a yellowish white crystalline triphenolic compound extracted from various plants, such as fruits, green tea, etc. [31]. It has been reported to be responsible for many important biological activities, such as anti-inflammatory, anti-bacterial, and anti-fungal properties, among others [32]. It is also well known as an antioxidant agent, exhibiting better efficacy in scavenging DPPH (2,2-diphenyl-1-picrylhydrazine) free radicals compared to vitamin C [33,34,35]. The above findings further proved the correctness and reliability of the analysis result that P8 (gallic acid) was positively correlated with the antioxidant activities of Yuganzi extracts based on the spectrum-effect relationship method. Therefore, previous studies have focused more on the content and activity of P8 (gallic acid) in Yuganzi, because gallic acid not only has a high content but also significant biological activity and has even been specified in the Chinese Pharmacopoeia as a quality control indicator. However, little attention has been paid to the components corresponding to peak 5. This study found that peak 5 was closely related to antioxidant activity, which could be screened as another potential quality indicator [36].
The spectrum-effect relationship method is a feasible method for identifying active ingredients and assessing the internal quality of complex mixtures like plant extracts [37,38]. Generally, the information found in a “spectrum” refers to a fingerprint obtained through modern analytical techniques such as ultra-high-performance liquid chromatography (UPLC), gas chromatography (GC), and high-performance liquid chromatography (HPLC), among others [39]. The information of “efficacy” is derived from reasonable pharmacological models both in vivo and in vitro. After obtaining the “spectrum” and “efficacy” information, bioinformatics and mathematical analysis techniques are applied to organically combine to both strengthen the correlation between the compound and the efficacy and screen the efficacy-associated substances in the extracts [40]. In this study, the spectrum-effect relationship between the chemical fingerprint and antioxidant activity of Yuganzi extracts was established, and the chemical constituents that imparted antioxidant activity were identified using PLSR. Although there existed the limitation that the biological activity was only tested in vitro, this did not prevent the application of the spectrum-effect relationship method in the quality evaluation and identification of the Yuganzi extracts [41]. However, because the establishment of a spectrum-effect relationship highly relies on data statistics methods such as hierarchical cluster analysis (HCA) and orthogonal partial least squares analysis (PLSA), different data processing methods can lead to differences in analysis results and insufficient accuracy regarding experimental results. Therefore, appropriate data analysis methods based on the actual circumstances should be selected. Additionally, the establishment of characteristic information peaks in fingerprints needs to be more standardized and comprehensive.
4. Conclusions
In this study, the HPLC fingerprint of Yuganzi was successfully established by gradually optimizing different conditions to fully reflect the types and quantities of chemical compounds contained in different batches of Yuganzi samples. Both the similarity analysis and HCA results demonstrated significant differences in the composition and contents of the samples from different regions of Yunnan, India, Gaoligong Mountain, and Fujian, while the samples from the same region in Yunnan showed no significant differences. The antioxidant activity of the Yuganzi extracts was determined using a total antioxidant capacity assay kit, revealing stable antioxidant functionality in homologous Yuganzi extracts and variations in the antioxidant activity of the Yuganzi extracts from different regions. Ultimately, the relationship between the HPLC fingerprint and bioactivity was analyzed using PLSR, identifying key representative bioactive compounds. In addition, it was demonstrated that the ingredients corresponding to peaks P5 and P8 (gallic acid) in the Yuganzi extracts were potential quality control indicators for Yuganzi fruits and were highly correlated with the antioxidant activity. In conclusion, the spectrum-effect relationship method can not only be used to ensure the stability and uniformity of the quality of Yuganzi fruits with the same origin but also to differentiate samples from different regions. With the maturity and development of the spectrum-effect relationship method, it will provide a high-precision and quick quality evaluation and identification method for natural plants. In the future, quantitative studies of ingredients corresponding to peaks P5 and P8 in Yuganzi extracts will be performed. Also, more samples from different regions and samples influenced by environmental factors will be collected to validate the feasibility of the spectrum-effect relationship method established in this study.
Author Contributions
All Authors contributed equally in terms of data curation, writing, and editing. Conceptualization, J.L.; methodology, L.L.; writing—original draft preparation, W.Z.; writ-ing—review and editing, B.W.; visualization and supervision, D.S.; project administration, X.L. All authors have read and agreed to the published version of the manuscript.
Funding
This research received no external funding.
Data Availability Statement
Data and information are available on request to the authors.
Acknowledgments
The authors would like to thank the Anyou Biotechnology Group Co., Ltd., for their administrative and technical support.
Conflicts of Interest
Author Bencheng Wu was employed by the company Anyou Biotechnology Group Co., Ltd. The remaining authors declare that the research was conducted in the absence of any commercial or financial relationships that could be construed as a potential conflict of interest.
References
- Nayak, P.; Behera, P.R.; Thirunavoukkarasu, M.; Chand, P.K. High frequency plant regeneration through adventitious multiple shoot organogenesis in epicotyl explants of Indian gooseberry (Emblica officinalis Gaertn). Sci. Hortic. 2010, 123, 473–478. [Google Scholar] [CrossRef]
- Gantait, S.; Mahanta, M.; Bera, S.; Verma, S.K. Advances in biotechnology of Emblica officinalis Gaertn. syn. Phyllanthus emblica L.: A nutraceuticals-rich fruit tree with multifaceted ethnomedicinal uses. 3 Biotech 2021, 11, 62. [Google Scholar] [CrossRef] [PubMed]
- Saini, R.; Sharma, N.; Oladeji, O.S.; Sourirajan, A.; Dev, K.; Zengin, G.; El-Shazly, M.; Kumar, V. Traditional uses, bioactive composition, pharmacology, and toxicology of Phyllanthus emblica fruits: A comprehensive review. J. Ethnopharmacol. 2022, 282, 114570. [Google Scholar] [CrossRef]
- Yan, X.; Li, Q.; Jing, L.; Wu, S.; Duan, W.; Chen, Y.; Chen, D.; Pan, X. Current advances on the phytochemical composition, pharmacologic effects, toxicology, and product development of Phyllanthi Fructus. Front. Pharmacol. 2022, 13, 191017268. [Google Scholar] [CrossRef]
- Li, W.; Zhang, X.; Chen, R.; Li, Y.; Miao, J.; Liu, G.; Lan, Y.; Chen, Y.; Cao, Y. HPLC fingerprint analysis of Phyllanthus emblica ethanol extract and their antioxidant and anti-inflammatory properties. J. Ethnopharmacol. 2020, 254, 112740. [Google Scholar] [CrossRef] [PubMed]
- Li, G.; Jiang, Y.; Zhang, D.; Han, L.; Mo, T.; Fan, S.; Huang, H.; Lin, J. Phyllanthi Fructus: A modal medicinal and food homologous item in quality evaluation. Chin. Herb. Med. 2023, 15, 360–368. [Google Scholar] [CrossRef]
- Liu, X.; Zhao, M.; Wu, K.; Chai, H.; Yu, H.; Tao, Z.; Wang, J. Immunomodulatory and anticancer activities of phenolics fromemblica fruit (Phyllanthus emblica L.). Food Chem. 2012, 131, 685–690. [Google Scholar] [CrossRef]
- Gan, J.; Zhang, X.; Ma, C.; Sun, L.; Feng, Y.; He, Z.; Zhang, H. Purification of polyphenols from Phyllanthus emblica L. pomace using macroporous resins: Antioxidant activity and potential anti-Alzheimer’s effects. J. Food Sci. 2022, 87, 1244–1256. [Google Scholar] [CrossRef]
- Zhang, Y.J.; Tanaka, T.; Iwamoto, Y.; Yang, C.R.; Kouno, I. Novel norsesquiterpenoids from the roots of Phyllanthus emblica. J. Nat. Prod. 2000, 63, 1507–1510. [Google Scholar] [CrossRef] [PubMed]
- Avula, B.; Wang, Y.H.; Wang, M.; Shen, Y.H.; Khan, I.A. Simultaneous determination and characterization of tannins and triterpene saponins from the fruits of various species of Terminalia and Phyllantus emblica using a uhplc-uv-ms method: Application to triphala. Planta Med. 2013, 29, 181–188. [Google Scholar] [CrossRef]
- Chatterjee, U.R.; Bandyopadhyay, S.S.; Ghosh, D.; Ghosal, P.K.; Ray, B. In vitro anti-oxidant activity, fluorescence quenching study and structural features of carbohydrate polymers from Phyllanthus emblica. Int. J. Biol. Macromol. 2011, 49, 637–642. [Google Scholar] [CrossRef]
- Zhang, Y.J.; Tanaka, T.; Yang, C.R.; Kouno, I. New phenolic constituents from the fruit juice of Phyllanthus emblica. Chem. Pharm. Bull. 2001, 49, 537–540. [Google Scholar] [CrossRef]
- Panchabhai, T.S.; Ambarkhane, S.V.; Joshi, A.S.; Samant, B.D.; Rege, N.N. Protective effect of Tinospora cordifolia, Phyllanthus emblica and their combination against antitubercular drugs induced hepatic damage: An experimental study. Phytother. Res. 2008, 22, 646–650. [Google Scholar] [CrossRef]
- Jaijoy, K.; Soonthornchareonnon, N.; Panthong, A.; Sireeratawong, S. Anti-inflammatory and analgesic activities of the water extract from the fruit of Phyllanthus emblica Linn. Int. J. Appl. Res. Nat. Prod. 2010, 3, 48–58. [Google Scholar]
- Sripanidkulchai, B.; Junlatat, J. Bioactivities of alcohol based extracts of Phyllanthus emblica branches: Antioxidation, antimelanogenesis and anti-inflammation. J. Nat. Med. 2014, 68, 615–622. [Google Scholar] [CrossRef]
- Yang, H.; Yang, T.; Gong, D.; Li, X.; Sun, G.; Guo, P. A trinity fingerprint evaluation system of traditional Chinese medicine. J. Chromatogr. A 2022, 1673, 463118. [Google Scholar] [CrossRef]
- Zhang, H.; Wei, Z.; Tong, Y.; Song, X.; Li, S.; Sun, Y.; Liu, C.; Han, F.; Yu, J. Spectrum-effect relationship study to reveal the pharmacodynamic substances in Flos Puerariae-Semen Hoveniae medicine pair for the treatment of alcohol-induced liver damage. J. Ethnopharmacol. 2023, 314, 116628. [Google Scholar] [CrossRef]
- Yang, H.; Li, Q. Optimization of extraction process and the antioxidant activity spectrum-effect relationship of Angelica dahurica. Biomed. Chromatogr. 2022, 36, e5322. [Google Scholar] [CrossRef]
- Gao, S.; Chen, H.; Zhou, X. Study on the spectrum-effect relationship of the xanthine oxidase inhibitory activity of Ligustrum lucidum. J. Sep. Sci. 2019, 42, 3281–3292. [Google Scholar] [CrossRef] [PubMed]
- Liu, X.; Yang, J.; Yang, Y.; Yang, Y.; Kang, X.; Ye, Y.; Li, X.; Wu, Y.; Xiao, J.; Li, L.; et al. Research on the hemostasis and coagulation effects of Callicarpa nudiflora based on the spectrum-effect relationship. Nat. Prod. Res. 2023, 30, 1–8. [Google Scholar] [CrossRef] [PubMed]
- Zhu, L.; Fang, L.; Li, Z.; Xie, X.; Zhang, L. A HPLC fingerprint study on Chaenomelis Fructus. BMC Chem. 2019, 13, 7. [Google Scholar] [CrossRef]
- Hawrył, A.; Hawrył, M.; Hajnos-Stolarz, A.; Abramek, J.; Bogucka-Kocka, A.; Komsta, Ł. HPLC Fingerprint Analysis with the Antioxidant and Cytotoxic Activities of Selected Lichens Combined with the Chemometric Calculations. Molecules 2020, 25, 4301. [Google Scholar] [CrossRef]
- Yang, G.; Li, S.; Sun, X.; Lv, Y.; Huang, H. Quality monitoring of Shenmai injection by HPLC pharmacodynamic fingerprinting. BMC Chem. 2023, 17, 28. [Google Scholar] [CrossRef]
- Xue, Y.; Zhu, L.; Yi, T. Fingerprint analysis of Resina Draconis by ultra-performance liquid chromatography. Chem. Cent. J. 2017, 11, 67. [Google Scholar] [CrossRef]
- Han, J.; Xu, K.; Yan, Q.; Sui, W.; Zhang, H.; Wang, S.; Zhang, Z.; Wei, Z.; Han, F. Qualitative and quantitative evaluation of Flos Puerariae by using chemical fingerprint in combination with chemometrics method. J. Pharm. Anal. 2022, 12, 489–499. [Google Scholar] [CrossRef]
- Wang, S.; Zhang, J.; Liu, J.; Qian, G.; Fu, C. Quality evaluation of Huaijiao pill by chromatographic fingerprint and simultaneous determination of its major bioactive components. J. Pharm. Anal. 2016, 6, 249–255. [Google Scholar] [CrossRef]
- Wei, G.; Jia, R.; Kong, Z.; Ji, C.; Wang, Z. Cold-hot nature identification of Chinese herbal medicines based on the similarity of HPLC fingerprints. Front. Chem. 2022, 10, 1002062. [Google Scholar] [CrossRef]
- Schulze, A.E.; De Beer, D.; Mazibuko, S.E.; Muller, C.J.; Roux, C.; Willenburg, E.L.; Nyunaï, N.; Louw, J.; Manley, M.; Joubert, E. Assessing similarity analysis of chromatographic fingerprints of Cyclopia subternata extracts as potential screening tool for in vitro glucose utilisation. Anal. Bioanal. Chem. 2016, 408, 639–649. [Google Scholar] [CrossRef]
- Anwar, S.; Crouch, R.A.; Awadh Ali, N.A.; Al-Fatimi, M.A.; Setzer, W.N.; Wessjohann, L. Hierarchical cluster analysis and chemical characterisation of Myrtus communis L. essential oil from Yemen region and its antimicrobial, antioxidant and anti-colorectal adenocarcinoma properties. Nat. Prod. Res. 2017, 31, 2158–2163. [Google Scholar] [CrossRef] [PubMed]
- Dżugan, M.; Tomczyk, M.; Sowa, P.; Grabek-Lejko, D. Antioxidant Activity as Biomarker of Honey Variety. Molecules 2018, 23, 2069. [Google Scholar] [CrossRef] [PubMed]
- Aline, D.C.S.A.; Rubiana, M.M.; Najeh, M.K. Nanoencapsulation of gallic acid and evaluation of its cytotoxicity and antioxidant activity. Mater. Sci. Eng. C Mater. Biol. Appl. 2016, 60, 126–134. [Google Scholar]
- Choubey, S.; Goyal, S.; Varughese, L.R.; Kumar, V.; Sharma, A.K.; Beniwal, V. Probing Gallic Acid for Its Broad Spectrum Applications. Mini Rev. Med. Chem. 2018, 18, 1283–1293. [Google Scholar] [CrossRef] [PubMed]
- Abdelwahed, A.; Bouhlel, I.; Skandrani, I.; Valenti, K.; Kadri, M.; Guiraud, P.; Steiman, R.; Mariotte, A.M.; Ghedira, K.; Laporte, F.; et al. Study of antimutagenic and antioxidant activities of gallic acid and 1,2,3,4,6-pentagalloylglucose from Pistacia lentiscus—Confirmation by microarray expression profiling. Chem. Biol. Interact. 2007, 165, 1–13. [Google Scholar] [CrossRef] [PubMed]
- Yen, G.C.; Duh, P.D.; Tsai, H.L. Antioxidant and pro-oxidant properties of ascorbic acid and gallic acid. Food Chem. 2002, 79, 307–313. [Google Scholar] [CrossRef]
- Pal, C.; Bindu, S.; Dey, S.; Alam, A.; Goyal, M.; Iqbal, M.S.; Maity, P.; Adhikari, S.S.; Bandyopadhyay, U. Gallic acid prevents nonsteroidal anti-inflammatory drug induced gastropathy in rat by blocking oxidative stress and apoptosis. Free Radic. Bio. Med. 2010, 249, 258–267. [Google Scholar] [CrossRef] [PubMed]
- National Pharmacopoeia Committee. Pharmacopoeia of Peoples Republic of China. Part 2; Chemical Industry Press: Beijing, China, 2020. [Google Scholar]
- Nijat, D.; Lu, C.F.; Lu, J.J. Spectrum-Effect Relationship between UPLC Fingerprints and Antidiabetic and Antioxidant Activities of Rosa rugosa. J. Chromatogr. B 2021, 1179, 122843. [Google Scholar] [CrossRef] [PubMed]
- Wang, F.; Xiong, Z.Y.; Li, P.; Yang, H.; Gao, W.; Li, H.J. From chemical consistency to effective consistency in precise quality discrimination of Sophora flower-bud and Sophora flower: Discovering efficacy-associated markers by fingerprint-activity relationship modeling. J. Pharm. Biomed. Anal. 2017, 132, 7–16. [Google Scholar] [CrossRef] [PubMed]
- Alaerts, G.; Dejaegher, B.; Smeyers-Verbeke, J.; Vander, H.Y. Recent Developments in Chromatographic Fingerprints from Herbal Products: Set-Up and Data Analysis. Comb. Chem. High Throughput Screen. 2010, 13, 900–922. [Google Scholar] [CrossRef]
- Xu, G.L.; Xie, M.; Yang, X.Y.; Song, Y.; Yan, C.; Yang, Y.; Zhang, X.; Liu, Z.Z.; Tian, Y.X.; Wang, Y.; et al. Spectrum-Effect Relationships as a Systematic Approach to Traditional Chinese Medicine Research: Current Status and Future Perspectives. Molecules 2014, 19, 17897–17925. [Google Scholar] [CrossRef]
- Wu, X.; Zhang, H.; Fan, S.; Zhang, Y.; Yang, Z.; Fan, S.; Zhuang, P.; Zhang, Y. Quality markers based on biological activity: A new strategy for the quality control of traditional Chinese medicine. Phytomedicine 2018, 44, 103–108. [Google Scholar] [CrossRef]
Figure 1.
HPLC chromatograms of Yuganzi at different separation conditions. (a) Wavelength, (b) mobile phase, (c) chromatographic column, (d) modifying agent, and (e) column temperature.
Figure 1.
HPLC chromatograms of Yuganzi at different separation conditions. (a) Wavelength, (b) mobile phase, (c) chromatographic column, (d) modifying agent, and (e) column temperature.
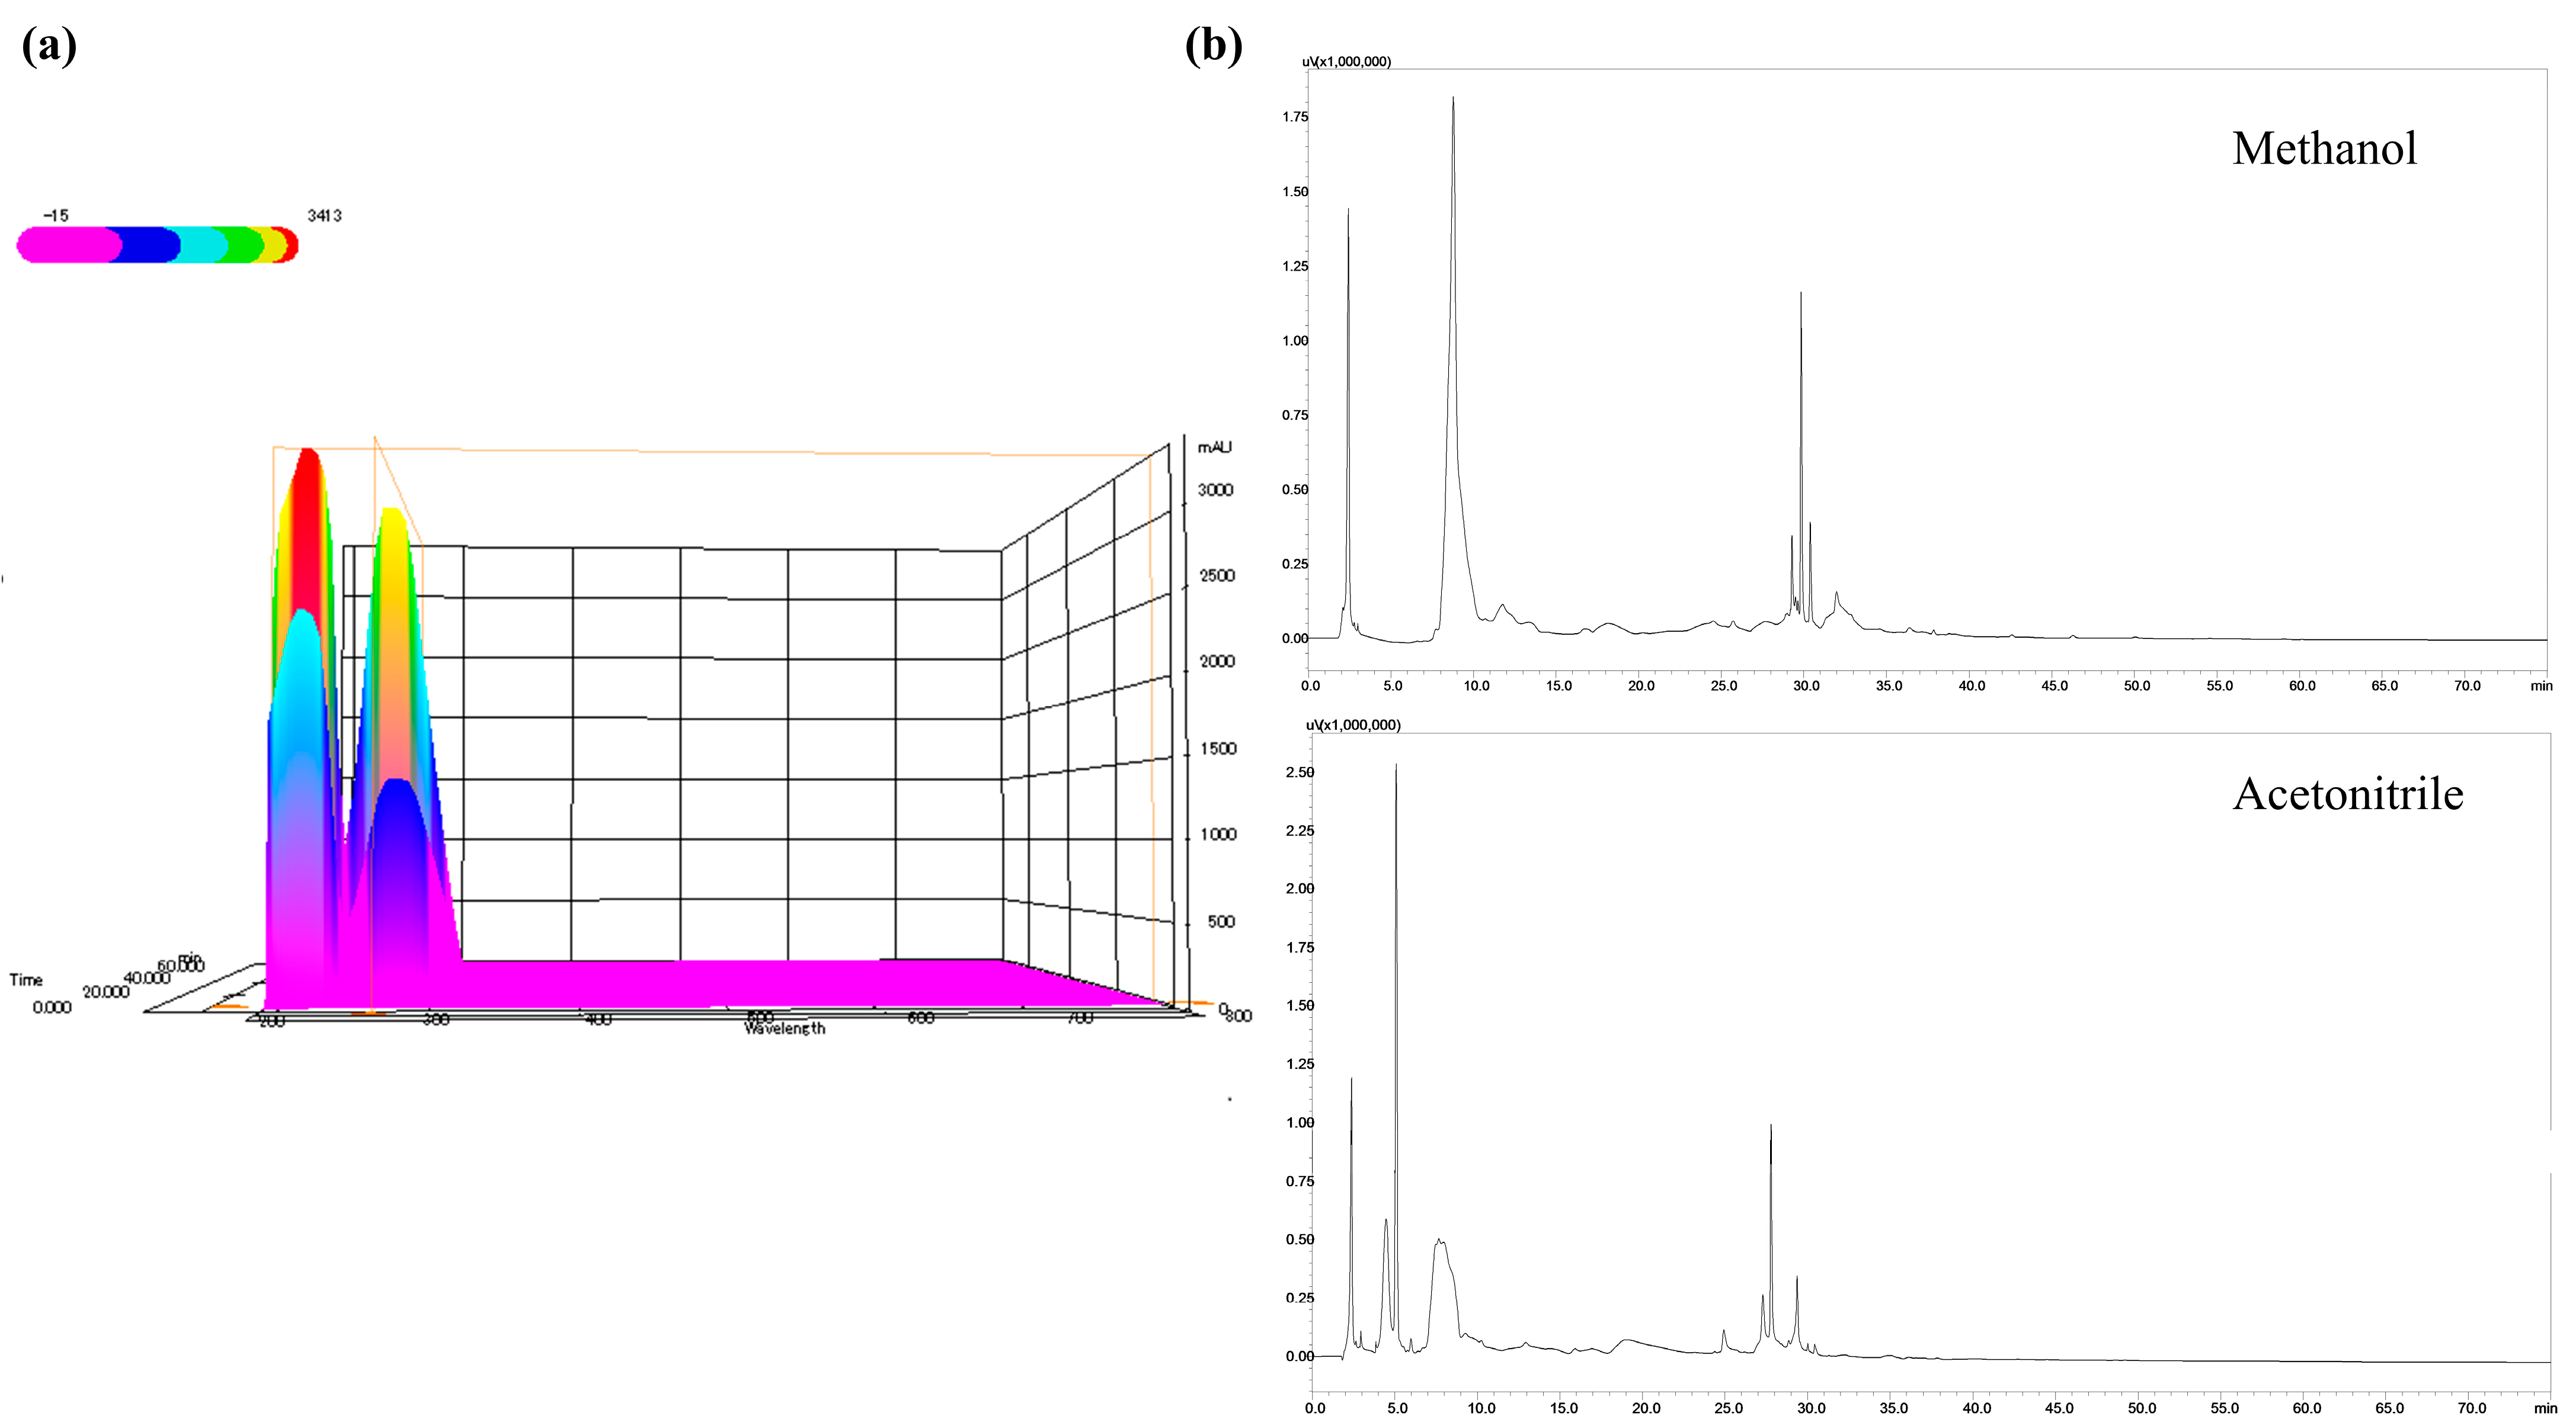

Figure 2.
HPLC fingerprint of the 13 batches of Yuganzi.

Figure 3.
Characteristic chromatogram of the 13 batches of Yuganzi.
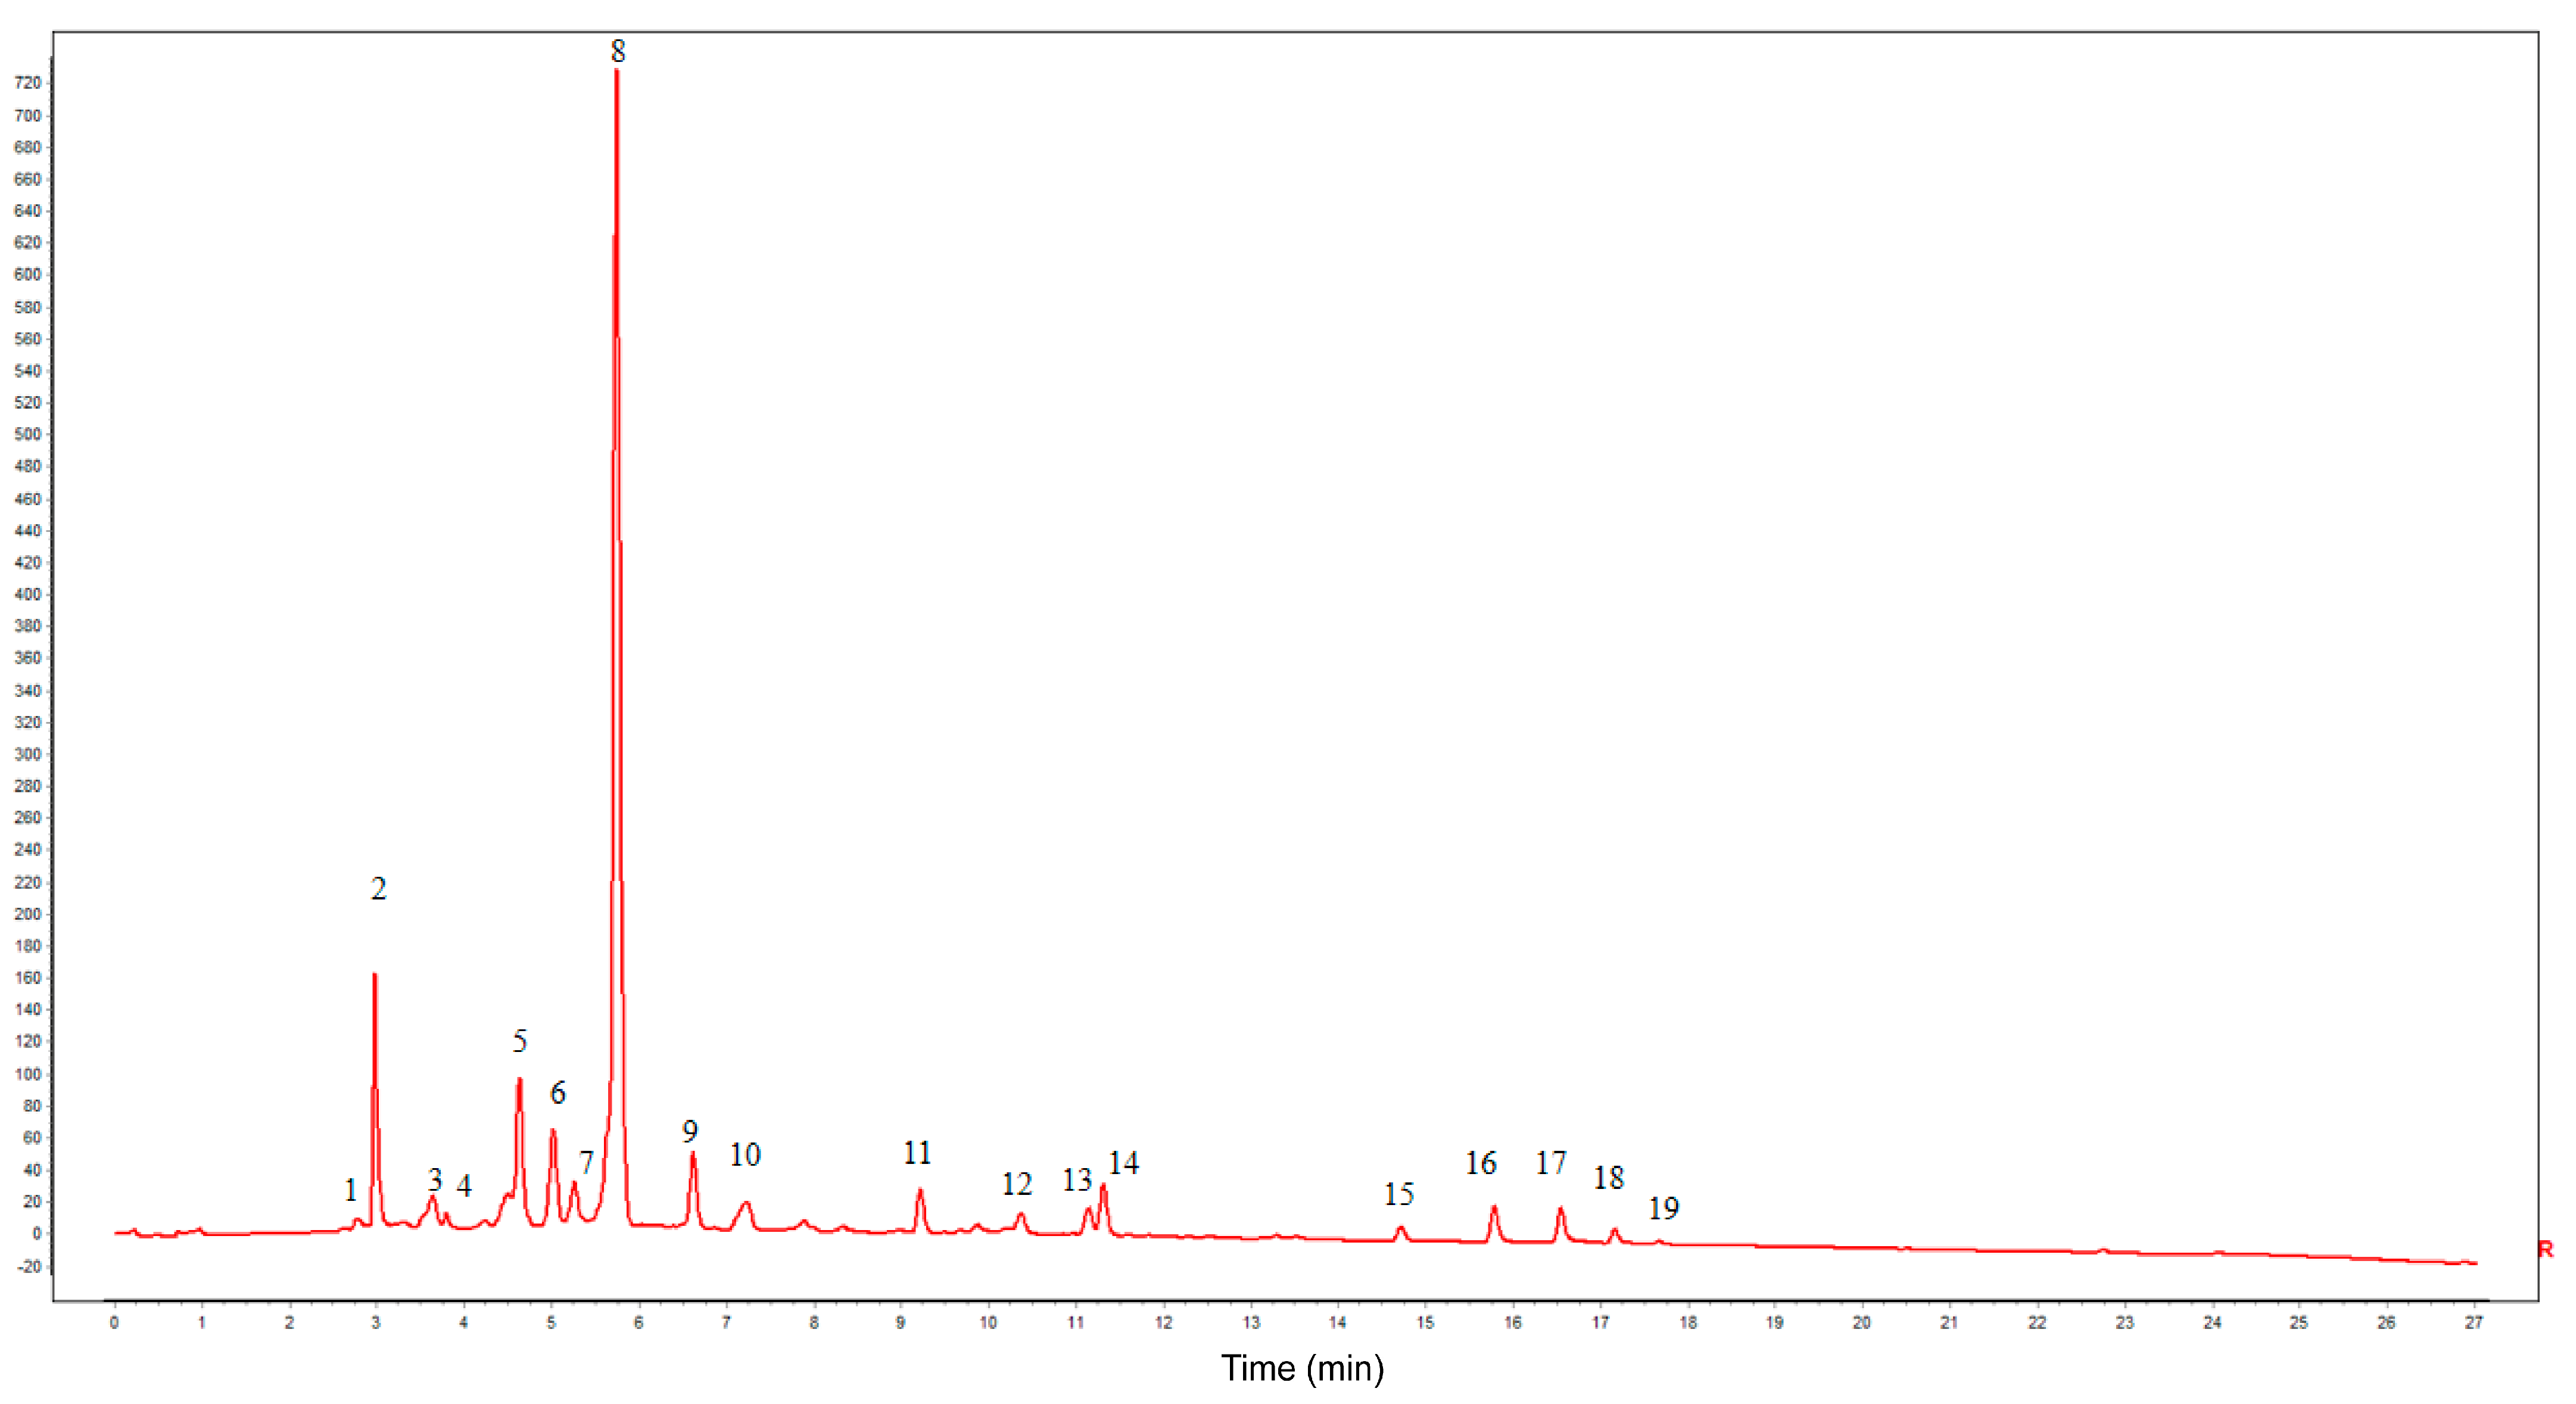
Figure 4.
HCA of Yuganzi.
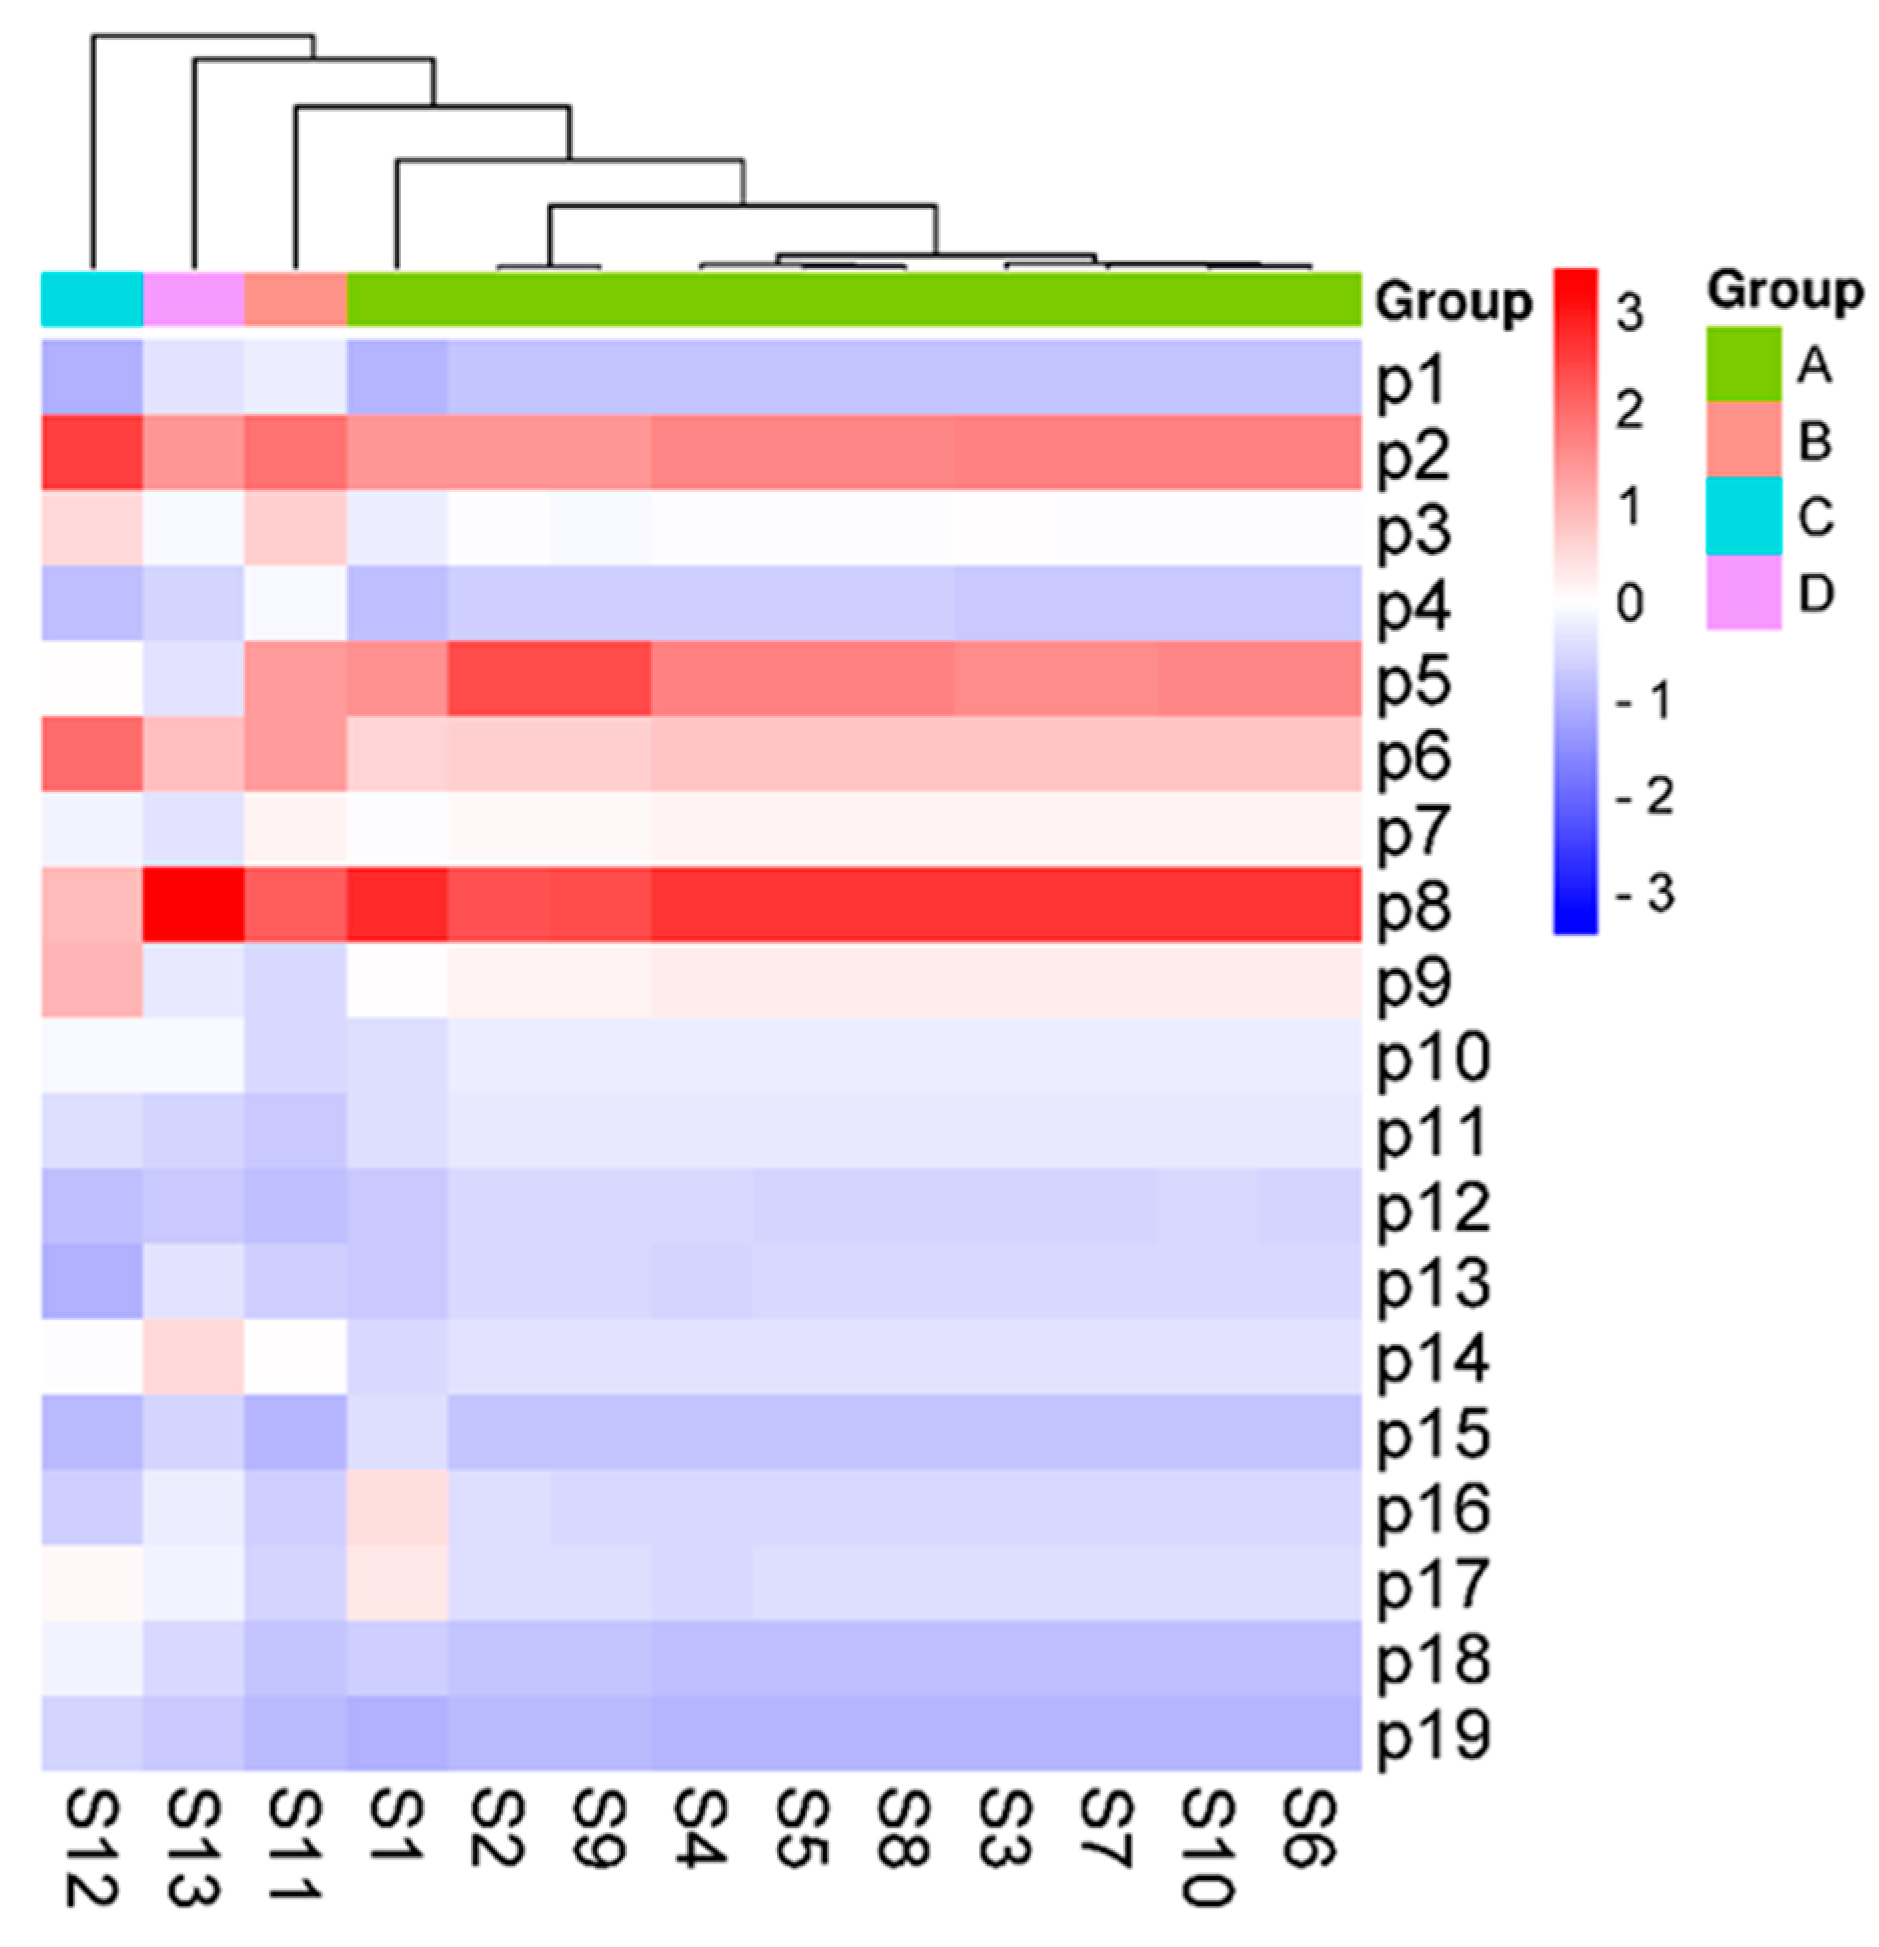
Figure 5.
Correlations between each characteristic peak and the antioxidant activity.

Figure 6.
VIP scores of each characteristic peak.
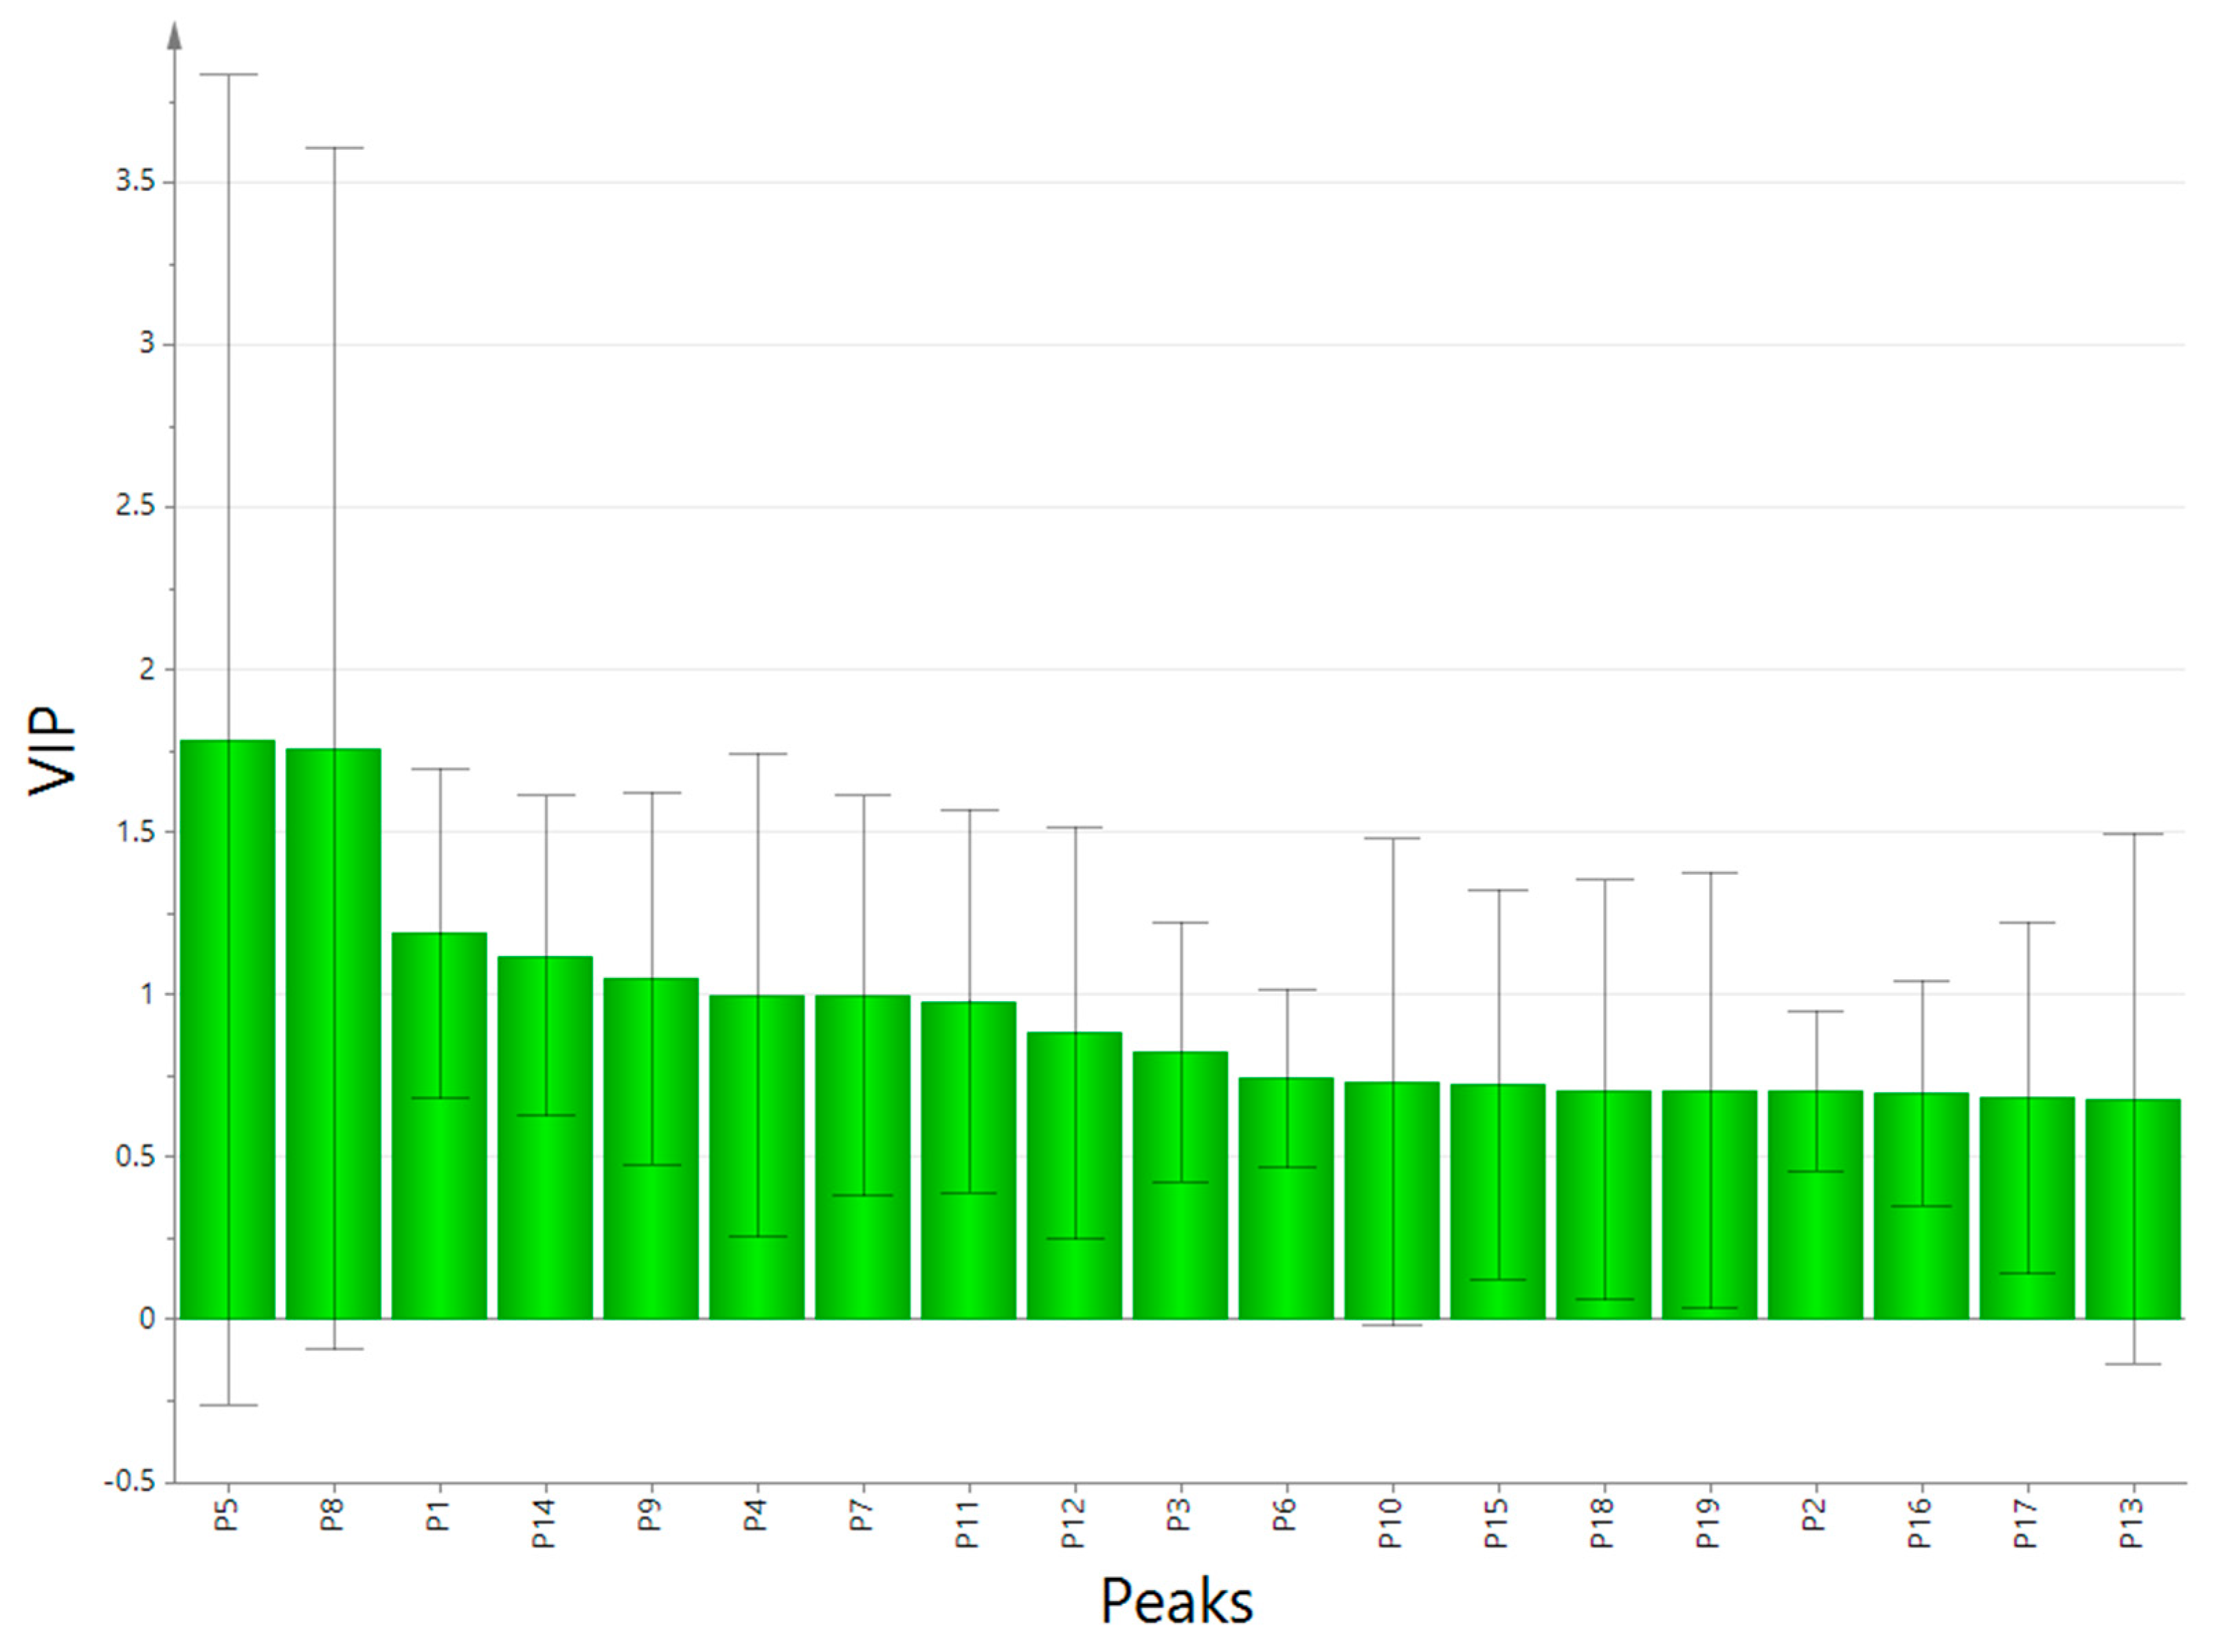
Figure 7.
HPLC of gallic acid reference substance (A) and Yuganzi (B).

Table 1.
The mobile phase system of the HPLC fingerprint analysis.
| t/min | Organic Phase (%) | 0.1% Aqueous Phase (%) |
|---|---|---|
| 0.01 | 7 | 93 |
| 6 | 14 | 86 |
| 30 | 30 | 70 |
| 35 | 70 | 30 |
| 40 | 70 | 30 |
| 40.01 | 7 | 93 |
Table 2.
Chromatographic analysis results of Yuganzi at different separation conditions.
| Separation Conditions | Peak No. | Retention Time | Peak Area |
|---|---|---|---|
| Venusil XBP C18(A) (4.6 × 250 mm, 5 µm) | 94 | 10.796 | 38,794,698 |
| Kromasil 100-5-C18 (4.6 × 250 mm, 5 µm) | 79 | 10.709 | 39,285,826 |
| Venusil C18 plus (4.6 × 250 mm, 5 µm) | 92 | 13.130 | 43,000,712 |
| Water (A), methanol (B) | 51 | 8.0782 | 90,466,269 |
| Water (A), acetonitrile (B) | 60 | 5.085 | 23,792,670 |
| 0.1% phosphoric acid solution (A), acetonitrile (B) | 92 | 7.014 | 46,425,891 |
| 0.1% trifluoroacetic acid solution (A), acetonitrile (B) | 154 | 6.903 | 51,262,774 |
| 0.1% formic acid solution (A), acetonitrile (B) | 158 | 6.821 | 120,584,524 |
| 25 °C | 94 | 7.600 | 42,940,841 |
| 30 °C | 92 | 7.014 | 46,425,891 |
| 35 °C | 93 | 6.524 | 42,825,871 |
Table 3.
Total antioxidant capacity of 13 batches of Yuganzi.
| Samples | Similarity Values | Antioxidant Capacity (mmol/mg) |
|---|---|---|
| 1 | 1.000 | 0.296 ± 0.004 |
| 2 | 0.995 | 0.291 ± 0.004 |
| 3 | 0.997 | 0.297 ± 0.002 |
| 4 | 0.997 | 0.291 ± 0.001 |
| 5 | 0.997 | 0.292 ± 0.001 |
| 6 | 0.997 | 0.291 ± 0.003 |
| 7 | 0.997 | 0.290 ± 0.002 |
| 8 | 0.997 | 0.292 ± 0.004 |
| 9 | 0.995 | 0.295 ± 0.002 |
| 10 | 0.997 | 0.292 ± 0.005 |
| 11 | 0.986 | 0.311 ± 0.001 |
| 12 | 0.841 | 0.338 ± 0.001 |
| 13 | 0.973 | 0.316 ± 0.001 |
Disclaimer/Publisher’s Note: The statements, opinions and data contained in all publications are solely those of the individual author(s) and contributor(s) and not of MDPI and/or the editor(s). MDPI and/or the editor(s) disclaim responsibility for any injury to people or property resulting from any ideas, methods, instructions or products referred to in the content. |
© 2024 by the authors. Licensee MDPI, Basel, Switzerland. This article is an open access article distributed under the terms and conditions of the Creative Commons Attribution (CC BY) license (https://creativecommons.org/licenses/by/4.0/).
Share and Cite
MDPI and ACS Style
Zhou, W.; Wu, B.; Liu, L.; Li, J.; Shi, D.; Li, X. Quality Evaluation and Identification of Phyllanthi fructus (Yuganzi) Based on the Spectrum-Effect Relationship. Separations 2024, 11, 104. https://doi.org/10.3390/separations11040104
AMA Style
Zhou W, Wu B, Liu L, Li J, Shi D, Li X. Quality Evaluation and Identification of Phyllanthi fructus (Yuganzi) Based on the Spectrum-Effect Relationship. Separations. 2024; 11(4):104. https://doi.org/10.3390/separations11040104
Chicago/Turabian StyleZhou, Weiwei, Bencheng Wu, Ling Liu, Jun Li, Dongdong Shi, and Xiumei Li. 2024. "Quality Evaluation and Identification of Phyllanthi fructus (Yuganzi) Based on the Spectrum-Effect Relationship" Separations 11, no. 4: 104. https://doi.org/10.3390/separations11040104
Note that from the first issue of 2016, this journal uses article numbers instead of page numbers. See further details here.