
MALDI-TOF MS: A Promising Analytical Approach to Cancer Diagnostics and Monitoring
by
 , and
, and
Patrícia Sousa
1,
Laurentina Silva
2,
Catarina Luís
1 ,
,
José S. Câmara
1,3 and
Rosa Perestrelo
1,* 1
CQM—Centro de Química da Madeira, Universidade da Madeira, Campus da Penteada, 9020-105 Funchal, Portugal
2
Hospital Dr. Nélio Mendonça, SESARAM, EPERAM—Serviço de Saúde da Região Autónoma da Madeira, Avenida Luís de CamõesK, 9004-514 Funchal, Portugal
3
Departamento de Química, Faculdade de Ciências Exatas e Engenharia, Universidade da Madeira, Campus da Penteada, 9020-105 Funchal, Portugal
*
Author to whom correspondence should be addressed.
Separations 2023, 10(8), 453; https://doi.org/10.3390/separations10080453
Submission received: 5 July 2023
/
Revised: 26 July 2023
/
Accepted: 11 August 2023
/
Published: 14 August 2023
Abstract
:Cancer remains the second most common cause of death after cardiovascular diseases, accounting for nearly 10 million deaths in 2020. Although the incidence of cancer increases considerably with age, the cancer burden can also be reduced and have a high chance of cure through early detection, appropriate treatment, and care of patients. The development of high-throughput analytical approaches, like matrix-assisted laser desorption/ionization time-of-flight mass spectrometry (MALDI-TOF MS), contributes to identifying a pool of proteins/peptides as putative biomarkers for the early detection, diagnosis, and tumor progression. The purpose of the current review is to present an updated outline of recent proteome/peptidome research to establish putative cancer biomarkers using MALDI-TOF MS and highlight the applicability of statistical analysis in the oncology field. The pros and cons of MALDI-TOF MS application on cancer diagnostics and monitoring will be discussed, as well as compared with tandem mass spectrometry (MS/MS)-based proteomics (e.g., liquid chromatography–tandem mass spectrometry). In addition, pre-analytical (e.g., sample quality control) and analytical (e.g., sample pre-treatment, instrumental analytical conditions) properties that influence the robustness of MALDI-TOF MS data will be also discussed.
1. Introduction
Cancer is one of the major public health concerns worldwide, representing a major life-threatening disease responsible for millions of deaths every year. It is characterized by a huge class of diverse diseases that can influence any part of the body, usually sites such as the breast, lung, colon and rectum, prostate, liver, skin, and stomach. In other words, cancer comprises a big class of related diseases that can start in almost any organ or tissue of the body when cells produce new cells, and the old or abnormal ones do not die when they should. As these abnormal cells grow out of control, they can crowd out normal cells and spread into surrounding tissues to invade adjoining parts of the body and/or extend to other organs [1].
According to the American Cancer Society [2], approximately 1,918,030 new cases and 609,360 deaths were observed in the United States in 2022, with the most dominant kinds being lung, prostate, and colorectum cancer in men, and lung, breast, and colorectum cancer in women. In recent years, cancer incidence and mortality have increased, partly this is due to the coronavirus disease 2019 pandemic (COVID-19), which restricted access to care and, consequently, has adversely affected cancer detection and therapy [3].
Even though there are diagnostic and screening tools available for the most varied types of cancer, which help the detection of the disease and subsequent improvement in survival rates, certain limitations persist in the fight against cancer. Several studies have emerged and have focused on changes in genes, their transcripts, proteins, and lipid products involved in the most important cellular processes. Among omics approaches, Figure 1, proteomics tandem with the progress in mass spectrometry (MS), has been gaining increasing curiosity as it can help or monitor the disease to improve diagnosis and prognosis through more efficient treatments, combined with its high sensitivity and specificity [4]. Therefore, due to its continuous and high increase, there is a need to research multidisciplinary approaches in different areas, as well as investigate new clinical diagnostic tests to enhance the effectiveness of therapies and improve survival rates.
Because of the variability in clinical behavior, treatment choices, and therapeutic responses, researchers are constantly working to investigate new potential biomarkers that are useful for studying diseases, identifying patients at different clinical stages, and developing adaptive therapies [5,6]. Thus, a considerable advancement in proteomic is the quantification of biomarkers, with high sensitivity and specificity provided by new and powerful platforms, from biological fluids (e.g., urine, blood, seminal fluid, saliva) and tissues [7]; with the objective of favoring not only physicians in clinical decision-making but also the patient, to promote early diagnosis and treatment follow-up [8]. It is presently considered that, in contrast to the genome, the proteome itself shows a more dynamic state of the cell [9] due to complex regulatory systems that control the levels of protein expression.
Proteomic is one of the many important core technologies in the current approaches to post-genomic systems biology that has constantly improved in several areas of research, with an emphasis on microbiology, food sciences, cancer, plant sciences, marine sciences, and immunology [10], to understand the molecular mechanisms underlying normal and disease states and identifying critical diagnostic and prognostic biomarkers [11]. This field consists of a wide range of significant methodologies, which have been largely driven by the modern development of involved technology [12], whose objective is the characterization of proteomes, including expressions, structures, functions, isoforms, molecular interactions, and post-translational modifications (PTMs) [13]. Hence, proteomic is essential to understanding the complexity of the host–pathogen interaction process. Numerous tools have been used to enhance and develop the latest protein analysis techniques to open up novel opportunities in fields beyond protein science, with an emphasis on the fields of polymer and biopharmaceutical research [11].
Over the last decades, matrix-assisted laser desorption/ionization time-of-flight mass spectrometry (MALDI-TOF MS) has become a popular and versatile analytical approach to establish potential cancer biomarkers, even at low concentration levels. This analytical approach has an interesting potential as a clinical tool since it is easy to use, cost-effective, and fast in terms of analysis time [14]. This analytical approach consists of a soft ionization process by means of a laser that reaches the analyte mixed with a solution of a matrix in an organic solvent [e.g., α-cyano-4-hydroxycinnamic acid (HCCA), 2,5-dihydroxybenzoic acid (DHB), 3,5-dimethoxy-4-hydroxycinnamic acid (SA)] able to absorb energy in the form of UV light. The mixture is first deposited onto a sample plate known as a target, in which the solvent then evaporates, and the sample is co-crystallized. After a bombardment by a pulsed laser beam (UV or infrared radiation), the matrix molecules that are energetically ablated from the surface of the sample transfer protons to the analyte, resulting in the formation of intact gas-phase molecular ions (which usually carry a single positive charge), Figure 2. After the ionization process, the masses can be analyzed by TOF MS, which accelerates the gas-phase ions in a high-voltage electric field, which transmits a constant amount of kinetic energy that will cause the smallest of the ions to travel the fastest and, consequently, become separated by mass (the heavier the ions, the longer the time of detection). The TOF reflector mode analyzer reflection mode provides a greater resolution because it is equipped with a longer flight path, ion mirrors, and electric fields that refocus ions by their masses [15].
The purpose of the current review is to provide an updated outline of recent proteomic research to establish potential cancer biomarkers using MALDI-TOF MS and highlight the applicability of statistical analysis in the oncology field. The pros and cons of MALDI-TOF MS application on cancer diagnostics and monitoring will be discussed and compared with tandem mass spectrometry (MS/MS)-based proteomics (e.g., liquid chromatography–tandem mass spectrometry). In addition, pre-analytical (e.g., sample quality control) and analytical (e.g., sample pre-treatment, instrumental analytical conditions) properties will be discussed to improve the robustness of MALDI-TOF MS data and a developed high-throughput protocol.
2. MALDI-TOF MS Proteome/Peptidome Profile
MALDI-TOF MS is an unconventional technology for investigating protein profiles in clinical samples. Numerous studies have reported that protein profiling is of impressive significance in the diagnosis of distinct types of cancer [16,17,18,19,20,21,22,23,24,25]. An overall workflow involves a sample preparation followed by MALDI-TOF MS acquisition, preprocessing, and statistical analysis of the data, Figure 3. The critical steps in the establishment of potential cancer biomarkers mentioned previously will be discussed in the following subsection.
2.1. Sampling and Sample Preparation Approaches in MALDI-TOF MS Analysis
Sampling represents one of the most crucial steps in analytical analysis to obtain correct data. In this sense, an unsuitable sampling process results in an irreversible impairment that cannot be resolved through quality assurance assays. The contamination during sampling represents the main source of acquiring invalid data. For this fact, it is crucial to establish beforehand the most suitable method to collect the sample, the amount of sample required, and identify any critical issues in the sampling step to minimize sampling errors. In addition, the sample should be submitted to sample preparation to guarantee the quality previous to performing the analytical analysis since the direct analysis can have low sensitivity, accuracy, and reproducibility due to interferences of a sample matrix. It is possible that sample preparation represents 60% of the time spent during an analytical assessment; it is an important step to acquire high-quality analytical results with high selectivity, accuracy, reproducibility, and low limit of detection and quantification since it includes steps like fractionation, isolation, and enrichment of the target analytes. Moreover, the selective isolation of the target analytes and the elimination of interfering sample components are important to reduce the matrix effect, as well as protect the analytical instrument from potential damages [26,27].
2.2. Sample Pre-Treatment Procedures
The biological fluids (e.g., blood, urine, tissues) are complex samples in terms of proteome/peptidome profile, and it is necessary that the applied simple, fast, and cost-effective sample preparation procedures reduce the samples’ complexity, consequently increasing the detection of low-abundant proteins [28]. Regarding Table 1, some studies performed in the proteomic field include ultrafiltration, dialysis with subsequent lyophilization, and precipitation by organic solvents [21,25,29,30].
Those sample pre-treatment procedures offer high-quality biological fluid proteome/peptidome profiles. Nonetheless, these procedures present several disadvantages, like being laborious, high-cost consumable supplies, and requiring specialized equipment. In this sense, new sample pre-treatment procedures that are simple, robust, cost-effective, and readily accessible could facilitate large-scale multicenter analyses that have been proposed to establish the proteome/peptidome profile of biological fluids. The most common sample pre-treatment procedures used in proteome/peptidome MS are solid-phase extraction (SPE), magnetic beads (MBs), immunoaffinity chromatography (IAC), and glycoproteome and phosphoproteome enrichment, Figure 4.
2.2.1. Ultrafiltration
Ultrafiltration has been extensively used to remove salts and concentrate protein fractions. The main disadvantage of this sample pre-treatment procedure is the electrostatic interaction of the filtering membrane that can act as a barrier for protein diffusion. This fact can be supported by protein–protein interaction since proteins with a low MW (e.g., albumina) or proteins with non-globular tertiary structure may interfere with the diffusion of other proteoforms [14]. However, Chernokalskaya et al. [62] demonstrated that the ultrafiltration procedure can also be applied to prepare larger proteins (>10 kDa) from biological fluids for electrophoresis and, at the same time, separate low-molecular-weight (<10 kDa) polypeptides for MS analysis.
2.2.2. Solid-Phase Extraction
Solid-phase extraction (SPE) is an extraction procedure that isolates specific subsets of molecules (subproteomes) to decrease the complexity of the sample by excluding large-size proteins and to concentrate the retained subproteomes from femtomoles to picomoles [14,17,63].
Gobom et al. [64] introduced the micro-SPE (μ-SPE), which has become a simple, fast, cost-effective, hardly time-consuming, and versatile sample pre-treatment procedure for clinical proteome analysis. The main outcome of μ-SPE compared to SPE is the low volume of sorbents, samples, and solvents required. Of these sorbents, commercially available, reverse phase with narrow pipette tips, packaged with hydrocarbon chains (C4, C8, C18) are most commonly used for the isolation and/or fractionation of proteins and peptides, whereas the ion-exchange sorbents were less used. Protein separation was usually performed using C4 and C8 hydrocarbon chains, whereas the separation of small peptides was performed using C18 hydrocarbon chains. Recently, Xing et al. [65] reviewed the selective enrichment of low-abundance proteins using the combination of molecularly imprinted polymer (MIPs)-based affinity extraction and MS for targeted proteome analysis. MIPs, also called artificial antibodies, are chemically synthesized receptors formed through the polymerization of functional monomer(s) and a cross-linker around a molecular template. MIPs are more stable than antibodies, cost-effective, easy to prepare, and resistant to a wide range of pH, solvents, and temperatures [65,66,67]. MIP-SPE has been extensively used in cancer biomarkers detection with excellent efficiency [68,69,70,71].
There is a diversity of SPE tips commercially available with diverse functionalities for desalting and concentration of proteins/peptides before MALDI-TOF MS, namely, Eppendorf Perfect Pure Tips (Eppendorf), NuTips (Glygen), Stage-Tips (Proxeon), Vivapure Micro spin columns (m-SPE) (Sartorius), ZipTips (Millipore), and OMIX (Agilent). Nonetheless, there are contradictory ideas in the connected literature around the effectiveness of the extraction properties of SPE pipette tips in MS analyses [72].
2.2.3. Magnetic Beads
The introduction of MBs with several functional units able to bind proteins/peptides represents an important step in the clinical field. This sample pre-treatment utilizes various chemical chromatographic surfaces on an outer layer of MBs to selectively purify specific subgroups of proteins/peptides, consequently permitting unbound impurities to be eliminated by washing with buffers. On the other hand, proteins bound to the MBs are then eluted, diluted, and directly analyzed by MALDI-TOF MS [73]. MBs have high surface areas per unit volume, excellent stability, and enable fast kinetic processes involving solution species compared to bulk solid surfaces [14,17]. From the sets of MBs, commercially available weak ion exchanges (WCX, WAX) were the most used in the establishment of cancer biomarkers, as can be observed in Table 1 [41,42]. Villanueva et al. [74] compared the extraction efficiency of C1-, C2-, C3-, C8-, and C18-derivatized hydrophobic particles to establish the peptidome profile using the following criterion: total number of peaks combined from the low-range and high-range MALDI-TOF mass readouts. C8 beads yielded the most peaks, but higher polypeptides were especially captured on less hydrophobic (C1–3) and small peptides in more hydrophobic (C18) media. In addition, the efficiency of MB-WCX, MB-HIC C8, and MB-IMAC Cu beads was compared in the establishment of a peptidome profile of a non-pathological human cerebrospinal fluid (CSF) [75]. The results showed that an increase in albumin or immunoglobulin concentration meaningfully affected the CSF preparation made with MB-HIC C8 beads, leading to a suppression of signal intensities, whereas preparations with MB-IMAC Cu or MB-WCX beads were not affected. Gode and collaborators [76] proposed a direct application of the MBs to the MALDI plate without prior compound elution, and the results demonstrated that bead-bound analyte evidenced exceptional and reproducible ionization yields.
2.2.4. Immunoaffinity Chromatography
Immunoaffinity chromatography (IAC) is a kind of liquid chromatography (LC) in which the stationary phase is comprised of an antibody or antibody-related reagent. This sample pre-treatment procedure denotes a particular subsection of affinity chromatography in which a biologically linked binding agent is applied for the selective purification or study of a target analyte [77]. The complexity of biofluids, mainly the blood proteome, can be reduced using the commercially available kits, like as ProteoPrep 20 Plasma Immunodepletion Kit, Seppro IgY14 system, SuperMix, Multiple Affinity Removal system, and Qproteome [28]. Sharma et al. [78] developed an immunoaffinity-based method for melanoma-derived exosomes (MTEX) captured from the plasma of melanoma patients. Utilizing a monoclonal antibody (mAb) 763.74 specifically for the chondroitin sulfate proteoglycan 4 (CSPG4) epitope distinctively expressed in melanoma cells, these authors separated MTEX from non-tumor cell-derived exosomes and assessed the proteins of both fractions by quantitative flow cytometry. Nicol and coworkers [79] developed an immunoaffinity-MS-based method for quantifying protein biomarkers from the serum of lung cancer patients, and the concentration of carcinoembryonic antigen (tumor biomarker) is higher in individuals with lung cancer. Recently, immunoaffinity combined with MALDI-TOF MS has been explored as a powerful tool for quantitative biomarkers analysis. Choi et al. [80] identified possible EV biomarkers for lung cancer by analyzing particular components inside serum-derived extracellular vesicles (EVs) using polyethylene glycol (PEG)-based precipitation, immunoaffinity separation utilizing antibodies against CD9, CD63, CD81, and EpCAM, combined with MALDI-TOF MS. Due to CD5L expression being correlated with cancer origin and exemplifying a central regulatory protein with respect to activities connected to lung cancer, the findings obtained suggest that CD5L can be employed as an EV biomarker for liquid biopsy. Hsiao et al. [81] elaborated on a workflow involving dry saliva spot sampling and immunoenrichment-coupled MALDI-TOF MS (immuno-MALDI) to quantify salivary metalloproteinase-1 (MMP1), one of the most promising salivary biomarkers for oral squamous cell carcinoma (OSCC) detection. A high concentration of MMP1 (from 5.95 to 242.5 ng/mL) was detected in 7 of 9 OSCCs, whereas MMP1 was not detected in the samples collected from healthy controls (HCs). Nevertheless, immunoaffinity capturing presents some limitations since the generation of high-quality antibodies is expensive, time-consuming, and still unreasonable sometimes. Moreover, the stability and reproducibility of antibodies are, every so often, problematic [65].
2.2.5. Glycoproteome and Phosphoproteome Enrichment
Post-translational modifications (PTMs), such as glycosylation or phosphorylation, are essential to recognize the activities of multilayered cellular protein networks. Numerous diseases, as well as cancer, are recognized to obtain the abnormal activation of kinase signaling pathways that reveal substantial differences in the dynamic regulation of protein phosphorylation and denote an effective source of information [82,83,84]. Lectins, titanium dioxide, graphitized carbon, and zwitterionic hydrophilic interaction chromatography (ZIC-HILIC) were used to enrich the glycopeptide, with ZIC-HILIC being reported as the most effective [85]. The main drawback of ZIC-HILIC results from favoring the N-linked glycans over the less hydrophilic O-linked glycans. To overcome this drawback, carbohydrate fractions are primarily deglycosylated from proteins through an enzymatic reaction followed by a purification step using SPE [28].
Metabolic labeling with phosphospecific antibodies, radioactive phosphate, and/or in vitro kinase assays were the traditional procedures used in the protein phosphorylation profile. Nevertheless, these procedures presented several disadvantages like being laborious, slow, and frequently requiring a previous understanding of the sites under study [83]. In this sense, the MALDI-based approach appeared as a suitable tool for the analysis of phosphopeptides, providing qualitative and quantitative analyses to identify and profile the abundance of thousands of phosphopeptides in a single experiment using microgram amounts of sample [83]. However, this approach requires a proper sample pre-treatment procedure to improve the enrichment and increase their detection by MS. The sample pre-treatment includes protein digest since it simplifies the solubilization and offers an effective depletion of non-phosphorylated peptides [28]. In phosphoproteomics, research has used several purification approaches, such as immunoaffinity procedures, IMAC with multivalent cations (e.g., Fe3+, Ga3+), metal oxide affinity chromatography (MOAC) with TiO2, ZrO2, or Nb2O5, and covalent modification [83,84]. Ruprechet et al. [86] compared MALDI-TOF MS/MS and nano-electrospray ionization (nESI) orbitrap instruments regarding their capacity to identify phosphopeptides enriched from tryptic digests of cell lines using Fe-IMAC column chromatography. The results showed that MALDI-TOF MS/MS identified an unexpectedly high number and percentage of phosphotyrosine sites (~20% of all sites), maybe as a direct result of more efficient ionization. Tsai et al. [87] used a Ga3+-Fe3+-IMAC approach for the sequential purification of phosphopeptides with diverse properties. Using Raji B cells, the sequential Ga3+-Fe3+-IMAC demonstrated a better detection sensitivity in comparison to the use of a single IMAC (Fe3+, Ti4+, Ga3+, Al3+). A sequential Ga3+-Fe3+-IMAC analysis of human lung cancer tissue produced 2560 distinct phosphopeptides with just 8% overlap. The in vivo phosphorylation network’s complementary identification of kinase substrates and their phosphorylation sites was made possible by the minimal overlapping enrichment, marking an impressive step toward the thorough mapping of the signaling pathways implicated in lung cancer [87]. Jiang and collaborators [88] evaluated the performance of Fe3O4@PDA microspheres coated with metal ions on the phosphopeptides enrichment, and based on the findings, different metal ions have varying degrees of selectivity, sensitivity, and capacity to enrich phosphopeptides from the samples under study, with Fe3O4@PDA-Nb5+ and Fe3O4@PDA-Ti4+ being the most effective.
2.3. MALDI Target Preparation
MALDI-TOF MS has been used in several analytical fields despite some limitations that persist, namely, the variability of signal intensities, resolution among different spots of the same sample, and the fact that the mechanisms of ion formation and desorption are weakly understood [28,89,90]. For these reasons, the direct MALDI-TOF MS analysis is avoided in proteome/peptidome research using complex biological samples since the competition between the co-existing components for desorption and/or ionization processes is well-known as an analyte suppression effect (ASE) [28]. Abundant proteins (e.g., albumin in serum or plasma) usually interfere with the proteome/peptidome analysis. Moreover, lipids, carbohydrates, and salts present in biological fluid results provide an increase in the suppression effects, reducing the ionization efficiency of proteins/peptides [91].
Furthermore, the low reproducibility of the analyte peak intensity can be affected by matrix amount and inhomogeneous crystallization. The analytes are protected from laser segregation by the homogeneous dispersion of the tiny crystal surface. The effective species–matrix ratios in the crystal may be enhanced, resulting in a reduction of the suppression effect [92]. To overcome inhomogeneous crystallization, several efforts have been performed, such as the application of ionic liquids (ILs) equimolar mixtures of typical MALDI matrixes (e.g., HCCA, SA) combined with organic bases (e.g., pyridine, tributylamine) to improve spot homogeneity [93], the design of new matrices capable of generating a small number of interfering backgrounds [94], the use strong base matrices as proton sponges [95], or an electron transfer matrix [96] to improve the ionization of nonpolar target analytes [89]. In addition, other alternative approaches in proteomic MALDI-TOF MS research have been developed to improve the sensitivity, resolution, and reproducibility, namely, the application of HCCA and SA, either in dried-droplet and/or surface preparation mode. Nevertheless, the main disadvantage of HCCA is denoted by its evident inclination for effectively basic arginine-containing peptides and the consequent suppression of acidic peptides, restricting the identification of low-abundance proteins [89]. In this sense, a rationally invented chloro-cinnamic derivative of HCCA, namely, α-cyano-5-phenyl-2,4-pentadienic acid (CPPA), was developed to overcome this problem, demonstrating the effectiveness of CPPA in the analysis of intact protein by MALDI-TOF MS in complex samples [89]. Moreover, o-alkylates dihydroxybenzoic acid (ADHB) was used as a matrix additive to HCCA to improve the sensitivity of hydrophobic peptides from 10- to 100-fold [97].
2.4. Statistical Analysis
As stated previously, MALDI-TOF MS is one of the most valuable analytical approaches in the research of proteome/peptidome due to its resolution and high speed in the detection of proteins/peptides putative biomarkers in complex biological fluids (e.g., plasma, urine, saliva, serum). Raw data produced by MALDI-TOF MS are typically composed of large spectra sets since each single spectrum comprises thousands of measurements entailing m/z signals and intensities [98]. To give clinical professionals a dynamic view of the data quality, effective visualization of huge datasets obtained from patient cohorts is crucial. Thus, statistical tools and pattern matching algorithms (e.g., quick classifier (QC), genetic algorithm (GA), supervised neural network (SNN)) are crucial to validate signal patterns that may be substantially differentially expressed between the patient and HCs [99]. For this purpose, fast, user-friendly software for high-throughput data pre-processing, flexibility in changing input variables, and statistical tools are required [100]. Usually, comprehensive data analysis in proteome/peptidome profiling includes the following subsequent steps: data import (mzXML, mzML, mzDATA), quality control, dataset pre-treatment (normalization, transformation, smoothing, baseline estimation, aligning, peak calculation), pre-processing (exploratory projection, variables selection), processing (predictive models), validation (model verification), and post-processing (pathway analysis) [28]. The quality control can be performed manually or automatically through the application of specific selecting filters. The data pre-treatment is carried out to decrease the heteroscedasticity of the dataset and to improve the performance for downstream statistical analysis. Additionally, the intensity is normalized and transformed to reduce systematic variation and enhance performance for subsequent statistical analysis. According to Meuleman et al. [101], the spectra normalization is a vital stage in pre-processing and that, despite its ease, total ion current (TIC) is the greatest possibility in profile experiments, especially to account for the effects between technical replicas, assuming that the overall number of proteins in the sample is much lower than the number of proteins with variable expression [102]. Considering that the raw data are counts of ionized molecules with intensity values that generally match the Poisson distribution [103], a square root transformation can be applied to convert the Poisson distributed data to approximately normal data, with regular variance independent of the mean, which is an important requirement for many statistical tests [104]. The transformed spectral data are then smoothed to remove noise and small- and high-frequency changes. For this determination, several filters are available for data smoothing, including the Savitzky–Golay algorithm, which is based on polynomial regressions in a moving window [105]. In MALDI-TOF MS profiling, the elevation of the intensity values is called the baseline, which is caused by chemical noise that is mostly derived from the matrix and its cluster-derived signals. Therefore, the statistics-sensitive non-linear iterative peak-clipping algorithm (SNIP) algorithm, an interactive algorithm that computes the baseline by considering the local minima and local mean intensities in windows of increasing size, was used to remove these background effects to reduce their influence in the quantification of the peak intensities. As the main purpose of MALDI-TOF MS profiling is establishing a proteome/peptidome pattern of whole samples that allows the discrimination of patients from HCs, instead of an identification of a singular protein/peptide. For this purpose, multivariate statistical tests presented several limitations, being that multivariate analysis is preferably used in exploratory experiments to establish proteins/peptides patterns distinguishing through the correlations between groups. The most commonly used statistical and machine learning methods comprise analysis of variance (ANOVA, for multiple group comparisons), principal component analysis (PCA), and partial least square discriminant analysis (PLS-DA) because it is necessary to handle many variables and visualize these datasets [106]. In exploratory analyses, PCA is an unsupervised learning technique that employs complex mathematical principles to minimize the dimensionality of enormous datasets without external interference from the user [107,108]. The interpretation, analysis, and processing are easier when using the reduced-dimension dataset. PCA showed a projection of the dataset into a smaller dimensional subspace based on the optimal orthogonal transformation [109], obtaining the directions of maximum variance in high-dimensional data that are equal to the least squares line of greatest fit over the plotted data and preserving most of the information in the data [108]. The PCA approach provides the contribution of each principal component to the total variance and the eigenvectors associated with non-zero eigenvalues of the coordinates [108]. For this fact, an unsupervised approach is a better alternative for the initial visualization of the dataset, subsequently permitting the discovery of the outliers and the determination of what are the main influences assessed in the investigation [106]. As opposed to that, PLS-DA is a supervised algorithm that merges variable extraction (dimension reduction) and discriminant analysis (prediction model construction) into one algorithm. Theoretically, PLS-DA is a multivariate dimensionality reduction tool in which datasets of distinct groups are mapped far apart. Using the non-linear iterative partial least squares (NIPALS) technique, the transformation is easily calculated [110]. This supervised learning technique allows the development of a predictive response model to categorize novel samples (e.g., diagnostic tools), identify valuable variables (e.g., biomarkers), and/or investigate the mechanism pathways (e.g., protein pathways) [109]. Then, the predictive model should be validated to verify the performance in correctly predicting the hypothesized relations between variables and response [109]. The cross-validation (CV) approach is the most utilized in the validation as it offers a qualitative and quantitative assessment of the model’s capacity to predict novel independent samples without collecting extra data. CV is a conventional procedure that splits the original dataset into a training set and a test set to assess the performance of the predictive model [109]. K-Fold is the easiest method of making CV, which splits the training data into k blocks using a random partition; more particularly, the K-CV leave-one-out cross-validation (LOOCV) and the Monte Carlo cross-validation (MCCV), the former being employed in small datasets [107]. Laputková et al. [30] used statistical analysis and automated MALDI-TOF MS to establish a salivary proteome profile indicating the state of temporomandibular joint disorders (TMDs). In this study, for the grouping of MS from the model generation classes of diseased salivas and HCs, three mathematical algorithms were applied, namely, QC, GA, and SNN. The SNN algorithms provided 11 peptide ion signatures with a recognition capability of 97.2% and cross-validation of 84.3%. With an area under the curve (AUC) value of 0.866 and 0.853, respectively, the diagnostic panel primarily contains two peaks at 5174.2 and 10,823.7 m/z, indicating great accuracy in identifying the disease condition. The QC model produced the greatest results in a research by Zaki et al. [111], with 100% identification capability and 96.4% cross-validation accuracy. Three peptide ion signatures with m/z 1570.31, 1897.4, and 2568.17 were achieved as a proteome profile for a cross-validation set to discriminate the BC from HCs. The AUCs ranged from 0.984 to 1, with a 95% confidence interval, which was revealed to be strongly associated with sensitivity and specificity. Exo-ANN is an artificial neural network-based multi-classifier that Zheng and collaborators [60] developed to simultaneously distinguish between BC, pancreatic cancer (PC), and high-grade carcinomas (HCs). This study was motivated by the superior performance of machine learning algorithms to identify spectrum signals. The training set’s three groups’ discrimination accuracy steadily improves, reaching an accuracy score of 80.6%. Additionally, the three independent groups’ AUC values for BC, PC, and HCs were 0.89, 0.86, and 0.93, respectively, demonstrating Exo-ANN’s reliable performance in the clinical diagnosis of various cancer types. There are available several open-source (e.g., Mass-up, MetaboAnalyst, MALDIquant, ROCCET) and commercial tools (e.g., ClinProTools, Markerview) specifically for MALDI profiling. These commercial tools are friendly and guarantee easy data transfer without requiring data conversion since they are completely compatible with data formats produced by MS platforms [28].
3. MALDI-TOF MS Applications in Cancer Diagnosis
Despite the adoption of multi-marker diagnostic techniques, it is still difficult to diagnose diseases like cancer. Thus, innovative approaches based on new methods, such as proteome/peptidome research, have been applied, namely, untargeted proteomics, such as protein/peptide profiling, have appeared as attractive tools for clinical diagnostics. By aiding the identification of new biomarkers, permitting tissue imaging, and measuring the levels of existing biomarkers, MALDI-TOF MS holds the potential to modernize cancer diagnostics. It is a fantastic analytical method for exploring proteins and peptides. MALDI-TOF MS has been used to find cancer biomarkers in bladder, ovarian, lung, and breast cancer, among other malignancies, as shown in Table 1.
3.1. Bladder Cancer
Bladder cancer has a high rate of morbidity and mortality and is the tenth most prevalent cancer in the world [112]. Reappearance and disease progression to the muscle-invasive phenotype are the primary problems encountered throughout the clinical therapy of bladder cancer. Because of this, a successful outcome depends greatly on early diagnosis and efficient, individualized treatment. Currently, the recommended methods for diagnosing BC are cystoscopy and urine cytology [32]. Nedjadi et al. [20] used two-dimensional difference gel electrophoresis (2D-DIGE) coupled with MALDI-TOF MS as a powerful approach for the discovery of biomarker proteins connected to insistent forms of urothelial bladder cancer. Nine plasma proteins are suggested as possible biomarkers by the findings, including the serum amyloid P component, mesoderm development candidate-1, plasma membrane calcium-transporting ATPase-1, plasminogen, gelsolin, inversin, and apolipoprotein A1. Among them, apolipoprotein A1 (Apo A1) displayed elevated specificity and sensitivity (AUC = 0.906), and for this fact, could act as a possible biomarker for bladder cancer progression, delivering a new perspective on this disease’s diagnosis. In addition, Lemańska-Perek and collaborators [31] established the plasma proteome maps from patients with urothelial bladder cancer using two-dimensional sodium dodecyl sulfate polyacrylamide gel electrophoresis (2D SDS-PAGE) combined with MALDI-TOF MS. The preliminary results suggest vitamin D-binding protein, haptoglobin, transferrin, fibrinogen, IgM, complement C3b, alpha-2-macroglobulin, and pigment epithelium-derived as potential biomarkers associated with bladder cancer, Figure 5.
On the other hand, Ding et al. [32] used a serum peptide model to predict bladder cancer and verified that five peptides with m/z 3525.45, 4281.66, 4963.10, 5804.12, and 5903.43 could be used for diagnostic purposes. Additionally, in the training set, the AUC value of the five-peptide model was 0.923, and the sensitivity and specificity were 93.75% and 96.77%, respectively. Magnetic nanoprobes coated with three broad-spectrum lectins (MNP@Lectins) were utilized by Azevedo et al. [33] to selectively collect glycoproteins from the urine of patients with bladder cancer.
A total of 63 glycoproteins were found to only be present in cancer samples. The bladder cancer stem cell marker CD44, which has been linked to a poor prognosis, is one of these proteins.
3.2. Breast Cancer
The most common heterogeneous tumor among women globally is breast cancer (BC), which has overtaken other cancers as the primary cause of mortality, with an expected 685,000 deaths in 2020 [1]. Even though there has been a decline in mortality, managing BC patients clinically is still difficult, and better diagnostic, prognostic, and therapeutic approaches are urgently needed. Zaki et al. [111] used plasma to establish the peptidome patterns in BC, in which the main conclusions were that the 92 peaks varied among the analyzed groups, and 33 peaks were significantly distinct (p < 0.05). From these, three peptides (m/z 1570.31, 1897.40, and 1568.17) were delivered by the QC model to distinguish the BC patients from HCs with 96.4% accuracy. On the other hand, Zografos et al. [9] studied male BC and identified four proteins, namely, actin-related protein 2/3 complex subunit 4 (ARPC4), dual specificity mitogen activated protein kinase 4 (MP2K4), ectoderm-neural cortex protein 1 (ENC1), and matrix metalloproteinase-27 (MMP27), were detected only in BC patients. Lee and collaborators [35] studied blood and serum N-glycans to identify markers for BC diagnosis because changes in protein glycosylation are linked to the development and progression of cancer. In this study, 24 NosID glycan biomarkers that differentiate HCs from N (−) and N (+) BrC subtypes were identified. Moreover, the sensitivity between normal and stage 1 BC samples was 84.1%, indicating that N-glycomics is an encouraging approach for quick and sensitive early BC diagnosis in the clinic.
3.3. Cervical Cancer
The second most prevalent gynecological malignancy for women is cervical cancer (CC), which poses a serious threat to their lives and general well-being. Despite the numerous discoveries that have considerably decreased the prevalence of CC, it continues to be a major source of fatalities in weaker populations of women. Therefore, to identify alternative molecular therapeutic targets that are more efficient than the current ones, additional knowledge of the pathophysiology of cervical cancer is required. In this sense, Chen et al. [39] establish potential serum biomarkers for CC by comparing serum peptidome profiles among the three groups (HCs, female CC patients before and after surgery) using MB-WCX tandem with MALDI-TOF MS. The data obtained showed that the 3 peaks (m/z: 2435.63, 2575.3, and 2761.79 Da) may be prognostic serum biomarkers for CC since AUC values of these 3 peaks ranging from 0.692 to 0.846. LC-ESI-MS/MS and the Uniprot database were used to identify these peaks in further detail as regions of transketolase (m/z 2435.63, 499–524), apolipoprotein A-I precursor (m/z 2575.3, 245–260), and isoform 1 of fibrinogen alpha chain precursor (m/z 2761.79, 603–629).
To better understand the molecular mechanisms behind CC, Kontostathi et al. [37] performed a proteomic investigation of the secretome from the following useful cervical cell lines: SiHa (HPV16+), HeLa (HPV18+), C33A (HPV−), and HCK1T (normal). The data obtained suggest that NRF2-mediated oxidative stress response is a potential biomarker of CC since its levels were up-regulated in SiHa and C33A compared to HCK1T. The analyses of differently expressed proteins between HeLa and invasive HeLa-I5 cells were performed using 2D-DIGE tandem with MALDI-TOF MS by Shih and collaborators [38]. According to the evidence, progesterone receptor membrane component 1 (PGRMC1) may promote the growth and spread of cancer by altering the functions of EMT indicators and the G1 to S cell cycle transition. So, according to these experts, PGRMC1 may serve as a crucial diagnostic biomarker and therapeutic target for the treatment of metastatic CC.
3.4. Colorectal Cancer
The glandular, epithelial cells of the large intestine are frequently the source of colorectal adenocarcinoma. This aggressive kind of tumor develops when certain epithelial cells undergo a sequence of genetic or epigenetic changes that give them a selective advantage [113]. The mortality rate can be decreased by early detection and a variety of medical treatments, but this requires further research into the molecular intricacies of cancer development, survival, and spread. Buttacavoli et al. [43] made a comparative proteome investigation using 2D-DIGE combined with MALDI-TOF MS between pooled CRC surgical tissues and adjacent non-tumoral tissues to discover possible target proteins correlated with carcinogenesis. This study discovered a novel potential biomarker for CRC, transgelin (TAGL), which has four distinct protein species and was collectively down-regulated in colon cancer tissues. It was selected as the top CRC biomarker. In addition, Kirana et al. [19] find protein biomarkers to classify CRC patient’s risk of disease spread. For this purpose, the cancer cells from primary colorectal tumors of stage II patients were isolated using laser micro-dissection, whereas the protein expression differences were profiled by 2D-DIGE with saturation CyDye labeling and recognized using MALDI-TOF MS. The results indicate that the expression of HLA class 1 histocompatibility antigen B39 alpha chain (HLAB), protein 14-3-3β, latent-transforming growth factor beta binding protein 3 (LTBP3), a disintegrin and metalloproteinase with thrombospodin motifs 2 (ADAMTS2), protein jagged-2 (JAG2) and nucleoside diphosphate kinase B (NME2) on tumor cells was significantly associated with disease progression. On the other hand, using serum samples, Liu and collaborators [40] isolated the immunoglobulin G (IgG) N-glycome using a MiniChrom™ Pre-packed Columns with Eshmuno® and observed that nine of IgG N-glycans were expressed differently in CRC compared with HCs. Additionally, five out of them were significantly changed in CRCs at all tumor node metastasis stages as compared with HCs. Yu et al. [41] used a serum proteome method to detect potential CRC cancer biomarkers. Serine/threonine kinase 4 (STK4, also known as MST1) is suggested as a potential biomarker for the early identification, prognosis, and prediction of distant metastasis of CRC by the findings.
3.5. Gastric Cancer
An estimated 723,100 people worldwide died from gastric cancer in 2012 [114]. It has one of the highest fatality rates because of late detection, which occurs after the cancer has advanced to an inoperable stage and cannot be removed through surgical resection [45]. To find new biomarkers with early diagnostic significance, establish effective diagnostic procedures, and uncover new targets for the treatment of GC, analytical approaches combined with proteome investigations have been actively investigated in recent years. Shi et al. [45] screened potential biomarkers using magnetic beads-based immobilized metal-ion affinity chromatography (MB-IMAC-Cu) combined with MALDI-TOF MS. In this study, 107 peptides were detected, 12 of which were differentially expressed among GC patients (pre- and post-operative) and HCs. Twelve peptide peaks were recognized as fibrinogen alpha chain precursor (FGA), alpha-2-HS-glycoprotein precursor (AHSG), apolipoprotein A-I precursor (APOA1), hemoglobin subunit beta (HBB), isoform 5 of thioredoxin reductase 1, cytoplasmic (TXNRD1), eukaryotic peptide chain release factor GTP-binding subunit ERF3B (GSPT2), and cytoskeleton-associated protein 5 (CAKP5). Lee et al. [44] used pectolinarigenin (PEC), a naturally occurring flavonoid found in citrus fruits that has been shown to have antitumor effects in a number of malignancies. These scientists demonstrated that the activation of cell cycle arrest, apoptosis, and autophagy by PEC reduced the viability of human gastric cancer cells AGS and MKN28. In addition, new target proteins, such as the E3 ubiquitin-protein ligase LRSAM1 (LRSAM1) and probable ATP-dependent RNA helicase DDX4 (DDX4), are differentially expressed in both cell lines after PEC treatment. On the other hand, Qin et al. [46] used ethyl esterification derivatization combined with MALDI-TOF MS to create glycan indicators that would indicate the beginning and progression of gastric cancer using thorough serum glycomic analysis. The results indicate that core fucose (AUC = 0.923) played an outstanding diagnostic performance for the early detection of GC.
3.6. Liver Cancer
According to GLOBOCAN 2020 [1], liver cancer was the fourth greatest cause of cancer-related mortality globally [115], accounting for nearly 830,000 fatalities. The prognosis for patients with liver cancer is still not the greatest, despite the substantial advancements achieved over the previous few decades. Because of the high morbidity and mortality associated with the malignancy, the discovery of efficient markers and the investigation of their potential roles have significant clinical significance for the early diagnosis, prevention, and control of liver cancer. A pilot investigation of salivary N-glycome in cirrhosis, hepatocellular carcinoma, and chronic hepatitis caused by the hepatitis B virus (HBV) was conducted by Qin et al. [47]. A total of 40, 47, 29, and 33 N-glycan peaks, respectively, were found and annotated in HCs, HBV-infected individuals, individuals with cirrhosis, and individuals with hepatocellular cancer. The proportion of fucosylated N-glycans was increased to a greater extent in the hepatocellular carcinoma patients than in any other group, nonetheless, the proportion of sialylated N-glycans declined more in hepatocellular carcinoma patients than in any other group. Park et al. [48] exploited a simple and robust cancer diagnostic method using MALDI-TOF MS-based total serum proteome profile. The results showed that the optimized serum preparation protocol provided elevated reproducibility, and PLS-DA established a statistically significant change between liver cancer patients and HCs proving to be a valuable tool to a liver cancer diagnosis. Sun et al. [49] identified 81 protein peaks in serum with HBV-related liver cancer, and 27 protein peaks had significant differences (p < 0.05), of which 17 were up-regulated and 10 were down-regulated. The blind test showed that the sensitivity and specificity of the three protein peaks (m/z 9179.55, 7789.00, and 4097.00) were 90.91% and 77.78%, respectively. Furthermore, Li et al. [50] established the GA, SNN, and QC models to distinguish malignant from benign liver tumors. Recognition capabilities of the established models were 100%, 89.38%, and 80.84% for GA, SNN, and QC, respectively, where the accuracy rates of the blinded validation test were 78% (GA), 84% (SNN), and 84% (QC). Three peaks with m/z values of 2860.34, 2881.54, and 3155.67 were found among the 27 discriminatory peptide peaks and were determined to represent fragments of the fibrinogen alpha chain, fibrinogen beta chain, and inter-alpha-trypsin inhibitor heavy chain H4, respectively. Mahalingam et al. [51] used machine learning utilizing spectral data and alpha-fetoprotein to build a model for early detection of hepatocellular carcinoma. The data obtained show sensitivity and specificity of the test higher than 80% to detect hepatocellular carcinoma. The findings point to a novel method for hepatocellular carcinoma diagnosis that uses a machine learning algorithm that incorporates mass spectral data and AFP values from blood samples.
3.7. Lung Cancer
Internationally, lung cancer continues to be the primary reason for cancer-related fatalities in both men and women [116]. Because of the late-stage diagnosis and the inadequate treatment choices, the survival rate is subpar, and as a result, screening for novel biomarkers is critical for the early detection of lung cancer. Hou et al. [52] studied cell-type lung cancer cells proteome profile and observed that five differentially expressed proteins, including ubiquitin carboxyl-terminal hydrolase isozyme L1 (UCHL1), cytokeratin 19 (CK19), cytokeratin 8 (CK8), ERO1L, and peroxiredoxin 2 (PRDX2), were significant between NCI-H358 and A549 cells. None of them demonstrated applicability as a reliable lung cancer biomarker. Yu and collaborators [25] combined differential ultracentrifugation and MALDI-TOF MS to establish the proteome pattern of the human lung carcinoma cell line (A549). The extracellular vesicles of lung cancer cells contain RPS27A (a ribosomal protein), which is crucial for mRNA translation and ribosome assembly for the differentiation of cancer cells and is associated with cancer cell migration and invasion. This study also found S100A10_S100 calcium-binding protein A10, a recognized tumor diagnostic marker. Furthermore, Saleem et al. [53] used plasma to trace a proteome profile. Only seven proteins—haptoglobin, retinol-binding protein 4, -1 antitrypsin, Ig lambda 2 chain C region, Ig alpha 1 chain C region, clusterin, and transthyretin—were found to be expressed in disease and smoker groups at higher levels than in HCs out of a total of 23 proteins. Moreover, haptoglobin and α-1-antitrypsin were observed to be consecutively increased in HCs along with smoking, obstructive pulmonary disease, and lung cancer. Xu et al. [23] explored the potential of peptides as biomarkers in malignant pleural effusion (MPE) of lung cancer. Five peptide peaks (m/z 917.37, 1466.5, 3216.87, 4469.39, and 4585.21) were chosen to identify MPE and tuberculosis pleural effusion (TPE) by MALDI-TOF MS. On the other hand, Li et al. [24] investigated unfailing biomarkers for an early and accurate diagnosis of small-cell lung cancer (SCLC). Five peptide peaks with m/z 1021.55, 1467.31, 3139.18, 4137.6, and 8944.33 showed the greatest efficiency in separating the patients from HCs. To identify possible tumor markers for NSCLC, Song et al. [54] examined the serum peptide model between non-small-cell lung cancer (NSCLC) patients and HCs, as well as between matched pre- and post-operative NSCLC patients. Based on the results, it was possible to observe that among the three models built, the GA model had the greatest diagnostic efficacy. Lv and collaborators [55] extracted peptides from serum and urine using copper ion-chelating nanomagnetic beads and identified them with MALDI-TOF MS. Eight differentially expressed peptides in urine and 19 peptides that are expressed differently in serum. Blinded model validation was performed using five peptides peak, and the classification model of this study has great theoretical significance for detecting patients with small-cell lung cancer, as shown by the good results that were achieved.
3.8. Ovarian Cancer
Ovarian cancer (OC) is the seventh most prevalent cancer in women and the one with the greatest mortality rate because of its late detection and vague symptoms, being the most lethal gynecological malignancies [16]. As a result of ineffective screening, there is a growing need for innovative tools and cutting-edge methods to diagnose ovarian cancer. Several studies have been performed on this topic, namely, Rizk et al. [16] combines MagSi-proteomics C8 beads, Ultraflextreme MALDI-TOF, and ClinProTools software (version 3.0) to investigate the plasma proteome profile with the aim of discriminating benign masses from epithelial OC. Using 21 peaks for external validation, epithelial OC were distinguished from HCs with a sensitivity of 73% and a specificity of 82.8%, whereas a 5-peak profile distinguished epithelial OC patients from those with benign ovarian masses with a sensitivity of 81% and a specificity of 73.7%. Additionally, a 20-peak profile with a recognition capability of 88.3% and cross-validation of 70% was created to distinguish between the early and late phases of the OC. Also, Swiatly et al. [17] screened the serum proteome profile using an SPE enrichment procedure coupled with MALDI-TOF MS to discriminate the OC patients from HCs. Four potential OC biomarkers (complement C3, kininogen-1, inter-α-trypsin inhibitor heavy chain H4, transthyretin) that were overexpressed in this pathology were identified. Pais et al. [56] developed a rapid, fully automated, and greatly sensitive and inexpensive screening tool for early-stage OC detection based on MALDI-TOF MS of blood serum proteome profile. This approach reported optimal sensitivities (from 82 to 92%) with specificities between 86 and 95% for early-stage OC, whereas for later-stage OC, longitudinal models and circBNC2-based tests report sensitivities of 90–100% with specificities of 84–95%.
3.9. Prostate Cancer
The fifth leading cause of mortality from cancer in males globally is prostate cancer [1]. Due to its continued prevalence, prostate cancer (PCa) is the second most common type of urological cancer in men diagnosed with the disease [57]. It is classified as a heterogeneous disease with a range of clinical behaviors, from deadly tumors to aggressive tumors, and is characterized by diverse clinical behavior. This makes early diagnosis and the detection of PCa aggressiveness essential preconditions for effective patient treatment [117]. Padoan et al. [22] performed peptidome analysis of serum and post-prostatic massage urine specimens to identify PCa biomarkers. The findings showed that 43 peptides were shared across urine and serum, and numerous characteristics were shown to be linked to illness. Two patterns of serum fragmentation also matched the complement C4-A. Zhao et al. [59] used 2DE followed by MALDI-TOF MS to differentiate expressed urinary proteins among patients with PCa, benign prostatic hyperplasia (BPH), and HCs. Ferritin heavy chain (FTH) gene and ferritin light chain (FTL), which are essential for PCa cells’ proliferation, apoptosis, and migration, were among the 15 distinct types of elevated proteins found. Thus, FTL and FTH1 could be used as candidate cancer-relevant genes involved in the formation and progression of PCa. Hydrophilic interaction chromatography nanoparticles (HICNPs) were employed by Sun et al. [58] to enrich the proteins and peptides in the blood of several PCa patients and healthy controls. With an analytical accuracy of 77%, PCA and PLS-DA of the samples demonstrated a considerable difference in the MALDI-TOF MS signals between PCa and HCs, approaching those of approaches based on prostate-specific antigen.
3.10. Other Cancers
TMDs are a diverse group of pathologies that affect the temporomandibular joint, masticatory muscles, and surrounding structures and result in pain and dysfunction [118]. They affect 10–15% of adults and appear to affect women three times more frequently than men [119]. Numerous attempts have been undertaken in recent years to investigate certain biochemical indicators of TMDs. A proper validation of any laboratory tests for the diagnosis and prognosis of these disorders has not yet been achieved. In this sense, Laputková et al. [30] determined if individuals with TMDs and HCs had different polypeptide/protein profiles in their unstimulated total saliva. With a recognition capability of 97.2% and cross-validation of 84.3%, these authors discovered a panel of salivary markers that predicted the patients with TMDs (m/z 2728.0, 4530.2, 5174.2, 5193.3, 6303.4, 6886.7, 8141.7, 8948.7, 10,663.2, 10,823.7, and 11,009.0). Regarding plasma exosomes, Zheng et al. [60] separated exosomes from human plasma using sequential size-exclusion chromatography (SSEC) with the purpose of discriminating different cancers (e.g., BC, PC). In this work, the same training set and test set as Exo-ANN were used to evaluate the classification performance using the following four traditional machine-learning techniques: logistic regression (LR), decision tree (DT), K-nearest neighbor (KNN), and support vector machine (SVM). The results indicate that the optimized Exo-ANN model distinguished distinct cancer types effectively using an independent test set.
With an annual incidence of 6–7 occurrences per 1,000,000 persons worldwide [120], multiple myeloma (MM) is the second most prevalent hematological malignancy. This type of cancer is linked to plasma cells, and despite enormous efforts over the past few decades, treatment for MM remains ineffective in addition to its bad prognosis. Regarding MM, Bai et al. [18] studied the peptides in serum from patients with MM and concluded that α-fibibrinogen, dihydropyrimidinase-like 2, α-fetoprotein, and platelet factor 4 were strong candidates for biomarkers once they showed dynamic changes along the progression or remission of MM. Also, their levels may be used for the monitoring of the disease state and assessment of therapeutic effects. Regarding the gestational trophoblastic diseases (GTDs), Banach and collaborators [61] performed protein/peptide profiling on the urine of patients affected with GTDs, and from healthy pregnant and non-pregnant controls using MALDI-TOF MS. The findings show that the composition of the ions in the several groups under study differs significantly. Additionally, by contrasting the urines from the post-treatment patients and the non-pregnant controls, these authors were able to pinpoint the presence of complement C4A (m/z 1895.43) and uromodulin fragments (m/z 1682.34 and 1913.54).
4. Mass Spectrometry-Based Proteome
An MS/MS-based proteome is a suitable analytical approach for the identification, characterization, and quantification of proteins (e.g., the phosphoproteome, proteoglycome, or peptidome) in a diversity of biological fluids [121]. Nevertheless, this analytical approach indirectly incorporates a variety of additional fractionation, separation, and other analytical approaches [122]. In MS/MS-based proteomes, a mixture of proteins is isolated and chemically or enzymatically cleaved into peptides, and the resulting complex peptide mixture is fractionated using different methods (e.g., gel electrophoresis, high-performance liquid chromatography (HPLC), ultra-high-performance liquid chromatography (UPLC), nano-liquid chromatography (nano-LC), ion mobility) before the detection via MS/MS or MSn [121]. Since it requires the acquisition of an initial mass spectrum (MS1) of the intact (precursor) peptide, dissociation of the isolated target precursor ion into smaller fragments, and subsequent mass analysis of the fragments (MS2), the detection via MS/MS provides specific information for the peptide amino acid sequence [122]. Collision-induced dissociation (CID), electron capture dissociation (ECD) and/ or electron transfer dissociation (ETD) are the most universal techniques used in peptide fragmentation. The electron-based fragmentation techniques (e.g., ECD, ETD) use low-energy electrons to produce protein fragment ions and, for this reason, offer an improved sequence coverage of greater analytes that are highly charged and display excellent potential for enhanced characterization of labile PTMs (e.g., phosphorylation) [122].
Regarding MS, currently, MALDI-TOF MS and liquid chromatography–tandem mass spectrometry (LC-MS/MS), in combination with advanced bioinformatics tools, are the most common techniques used in proteomic analysis to identify several human cancer biomarkers [17,22,123,124]. Both of them provide qualitative and quantitative analysis of proteins as high-throughput research technologies [123]; it depends on analyzing possible biomarkers by identifying distinctive MS fingerprints. Current research has revealed that MALDI-TOF MS profiling is a simple, non-invasive, and economical tool commonly used for top-down proteomes since it comprises the investigation of intact proteins being efficient in the study of high molecular weight proteins (tens or hundreds of kilodaltons). MALDI-TOF MS has been reported as a robust and sensitive instrument for clinical trials [17] due to the technician processing time and overall 95% accuracy, which enables patients to receive treatment more quickly and accurately. Additionally, because ions have low internal energy, direct molecular weight evaluation is possible by using soft ionization in MALDI-TOF MS, which enables the observation of ionized molecules with little to no fragmentation [125]. Due to the MALDI-TOF MS inherent limitations, including low analytical sensitivity without prior pre-treatment and the inability to discriminate or identify the underlying peptides that may be in charge of the m/z values, LC-MS/MS could be used as an alternative identification method.
LC-MS/MS is a high-throughput method frequently used in bottom-up proteomes that allow the determination of complete protein sequences and PTMs [12], provides discrimination between analytes and has the ability to simultaneously quantify thousands of proteins in a short time. Additionally, it may be automated to enhance performance, accuracy, sensitivity, and reproducibility in high-throughput environments. [126]. For proteome analysis, electrospray ionization (ESI), a soft ionization method is the most suitable interface for LC-MS/MS since without destroying chemical bonds or further fragmenting the peptides, ionization is achieved. The sample is prepared for the ESI technique as a liquid at atmospheric pressure, and it flows into a very small needle that is charged with a high voltage. The droplets of solvent that are released from the needle tip dissociate into a tiny spray of highly charged droplets as a result of electrostatic repulsion. The droplets vanish when the solvent evaporates, leaving behind highly charged molecules [127]. Currently, bottom-up LC-MS/MS-based proteomics analyses, in which proteins are digested into small peptides prior to LC-MS/MS analysis, are frequently used to identify sites of PTMs on peptides due to better fragmentation and fewer possibilities of localization [128]. Nevertheless, in most quantitative proteomics studies, the bottom-up approach introduces a ‘peptide-to-protein’ inference problem, which complicates the identification and quantification steps [129], whereby this method obliterates data pertaining to the interactions between several PTMs on a certain protein species [128]. Comparatively, the benefit of an LC-MS/MS analysis of intact proteins is that many PTM sites are retained, resulting in a variety of protein forms. In other words, proteoforms have the benefit of easier and quicker sample preparation, which decreases the possibility of experimentally produced PTMs, such as deamidation and oxidation. Proteoforms may also be identified in the same study [130]. For this reason, the top-down MS approach is often carried out for relative quantification of protein modifications, as small modifying groups have much less impact on the physicochemical properties of intact proteins compared to those of peptides [131,132]. Although top-down analysis may be employed in a high-throughput setting, it becomes more challenging to effectively fragment the ionized protein and resolve fragment peaks as the protein size grows, making PTM identification and site localization problematic [128,133]. Due to inadequate fragmentation, as well as other problems as the protein size increases, such as solubility, the inherent difficulties in LC separation, and restrictions in mass spectrometer efficiency, top-down MS/MS has traditionally concentrated on smaller proteins (less than roughly 50 kDa) [128]. Table 2 summarizes the main differences between MS/MS-based proteomes and MALDI-TOF MS proteome profiling [121,134].
In addition, the protein extraction/digestion in bottom-up proteomics is a crucial step for the identification and quantification of the proteome. Nevertheless, this procedure involves the use of a detergent (e.g., sodium dodecyl sulfate) and/or buffers (e.g., phosphate buffered saline) that are incompatible with downstream MS/MS analysis, since it forms peak clusters that mask all other signals in the MS; in addition, can form salt crystals during electrospray ionization, and may block the LC columns [135]. To avoid these problems, a pre-treatment and clean-up procedure should be applied before LC-MS/MS analysis to remove the interferent compounds, which increases the analysis time. As opposed to that, MALDI-TOF MS requires a minimal sample pre-treatment, and for this fact, each single run can take from 20 to 30 s.
5. Future Perspective
MALDI-TOF MS has the potential to revolutionize cancer diagnostics by enabling biomarker discovery, enabling tissue imaging, and quantifying biomarker levels. However, the use of MALDI-TOF MS as a diagnostic tool for cancer is still evolving, and there are some critical assessments that need to be addressed, including further validation, standardization, data interpretation, optimization of sensitivity and specificity, cost considerations, and expanding biomarker coverage [36,136]. In this sense, the standardization of sample preparation, instrument calibration, and data analysis protocols is crucial to ensure the reproducibility and reliability of the data obtained [136,137]. On the other hand, the complexity of the data generated by MALDI-TOF MS can make data interpretation challenging [138] in the context of the development of robust algorithms and bioinformatics tools for data analysis and for extracting meaningful information from the mass spectra [136]. Moreover, MALDI-TOF MS can be used not only for the identification of one specific target analyte but also for mass fingerprinting. These approaches have advantages and disadvantages; however, their combination could open a new window in cancer diagnostics.
6. Conclusions
The identification of new biomarkers represents a crucial help to clinicians for early detection, diagnosis, and tumor progression. In this sense, the proteomic/peptidomic combined with MALDI-TOF MS is considered a suitable approach towards 5.0 generation on cancer diagnostics and monitoring. Nevertheless, the validation of the data obtained is influenced by errors introduced during pre-analytical (e.g., sample quality control) and analytical (e.g., sample pre-treatment, instrumental analytical conditions) assays. For this fact, to guarantee the reproducibility of the analysis it is required robust, precise, and standardized procedures in the collection, handling, and storage of the biological samples. In addition, a sample pre-treatment procedure (e.g., ultrafiltration, SPE, MBs, IAC, PTMs) that includes steps like fractionation, isolation, and enrichment of the target analytes, which should be performed prior to the MALDI-TOF MS analysis to obtain high-quality analytical results with high selectivity, accuracy, reproducibility, and low sensitivity limits. After that, the robustness of MALDI-TOF MS data is submitted to statistical analysis to establish putative cancer biomarkers. Nowadays, several chemometric approaches provide the proteomics field with important data. However, some of them need extra statistical expertise for the processing and interpretation of the data and for this reason, more friendly interfaces should be developed.
Despite all the restrictions related to MALDI-TOF MS discussed in the review, this analytical approach represents a powerful tool for clinical routine and personalized medicine since it is robust, cost-effective, easy to use, and requires a low analysis time. Moreover, proteome and the ongoing advances in MALDI-TOF MS will allow the introduction of new approaches to enhance sensitivity and reproducibility with the purpose of providing better robustness to MALDI-TOF MS data in the establishment and validation of novel cancer biomarkers.
Author Contributions
Conceptualization: P.S., L.S., C.L., J.S.C. and R.P.; writing—original draft preparation: P.S., L.S., C.L., J.S.C. and R.P.; writing—review and editing: J.S.C. and R.P. All authors have read and agreed to the published version of the manuscript.
Funding
This work was supported by FCT-Fundação para a Ciência e a Tecnologia through the CQM Base Fund—UIDB/00674/2020, and Programmatic Fund—UIDP/00674/2020, and by ARDITI-Agência Regional para o Desenvolvimento da Investigação Tecnologia e Inovação, through the project M1420-01-0145-FEDER-000005—Centro de Química da Madeira—CQM+ (Madeira 14-20 Program). The authors also acknowledge the financial support from Fundação para a Ciência e Tecnologia and Madeira 14-2020 program to the Portuguese Mass Spectrometry Network through PROEQUIPRAM program, M14-20 M1420-01-0145-FEDER-000008.
Data Availability Statement
Data are contained within the review.
Conflicts of Interest
The authors declare no conflict of interest.
References
- Sung, H.; Ferlay, J.; Siegel, R.L.; Laversanne, M.; Soerjomataram, I.; Jemal, A.; Bray, F. Global Cancer Statistics 2020: GLOBOCAN Estimates of Incidence and Mortality Worldwide for 36 Cancers in 185 Countries. CA Cancer J. Clin. 2021, 71, 209–249. [Google Scholar] [CrossRef] [PubMed]
- Siegel, R.L.; Miller, K.D.; Fuchs, H.E.; Jemal, A. Cancer Statistics, 2022. CA Cancer J. Clin. 2022, 72, 7–33. [Google Scholar] [CrossRef] [PubMed]
- Yabroff, K.R.; Wu, X.-C.; Negoita, S.; Stevens, J.; Coyle, L.; Zhao, J.; Mumphrey, B.J.; Jemal, A.; Ward, K.C. Association of the COVID-19 Pandemic with Patterns of Statewide Cancer Services. J. Natl. Cancer Inst. 2022, 114, 907–909. [Google Scholar] [CrossRef]
- Silva, C.; Perestrelo, R.; Silva, P.; Capelinha, F.; Tomás, H.; Câmara, J.S. Volatomic Pattern of Breast Cancer and Cancer-Free Tissues as a Powerful Strategy to Identify Potential Biomarkers. Analyst 2019, 144, 4153. [Google Scholar] [CrossRef] [PubMed] [Green Version]
- Jin, C.; Qiu, L.; Li, J.; Fu, T.; Zhang, X.; Tan, W. Cancer Biomarker Discovery Using DNA Aptamers. Analyst 2016, 141, 461–466. [Google Scholar] [CrossRef] [Green Version]
- Tanase, C.; Albulescu, R.; Neagu, M. Proteomic Approaches for Biomarker Panels in Cancer. J. Immunoass. Immunochem. 2016, 37, 1–15. [Google Scholar] [CrossRef]
- Pin, E.; Fredolini, C.; Petricoin, E.F. The Role of Proteomics in Prostate Cancer Research: Biomarker Discovery and Validation. Clin. Biochem. 2013, 46, 524–538. [Google Scholar] [CrossRef]
- Tanase, C.P.; Codrici, E.; Popescu, I.D.; Mihai, S.; Enciu, A.-M.; Necula, L.G.; Preda, A.; Ismail, G.; Albulescu, R.; Tanase, C.P.; et al. Prostate Cancer Proteomics: Current Trends and Future Perspectives for Biomarker Discovery. Oncotarget 2017, 8, 18497–18512. [Google Scholar] [CrossRef] [Green Version]
- Zografos, E.; Anagnostopoulos, A.K.; Papadopoulou, A.; Legaki, E.; Zagouri, F.; Marinos, E.; Tsangaris, G.T.; Gazouli, M. Serum Proteomic Signatures of Male Breast Cancer. Cancer Genom. Proteom. 2019, 16, 129–137. [Google Scholar] [CrossRef] [Green Version]
- Duong, V.A.; Park, J.M.; Lim, H.J.; Lee, H. Proteomics in Forensic Analysis: Applications for Human Samples. Appl. Sci. 2021, 11, 3393. [Google Scholar] [CrossRef]
- Hameed, S.; Fatima, Z. Integrated Omics Approaches to Infectious Diseases; Springer: Singapore, 2021; ISBN 978-981-16-0690-8. [Google Scholar]
- Dupree, E.J.; Jayathirtha, M.; Yorkey, H.; Mihasan, M.; Petre, B.A.; Darie, C.C. A Critical Review of Bottom-Up Proteomics: The Good, the Bad, and the Future of This Field. Proteomes 2020, 8, 14. [Google Scholar] [CrossRef]
- Aslam, B.; Basit, M.; Nisar, M.A.; Khurshid, M.; Rasool, M.H. Proteomics: Technologies and Their Applications. J. Chromatogr. Sci. 2017, 55, 182–196. [Google Scholar] [CrossRef] [Green Version]
- Greco, V.; Piras, C.; Pieroni, L.; Ronci, M.; Putignani, L.; Roncada, P.; Urbani, A. Applications of MALDI-TOF Mass Spectrometry in Clinical Proteomics. Expert. Rev. Proteom. 2018, 15, 683–696. [Google Scholar] [CrossRef]
- Hosseini, S.; Martinez-Chapa, S.O. Fundamentals of MALDI-ToF-MS Analysis; SpringerBriefs in Applied Sciences and Technology; Springer: Singapore, 2017; ISBN 978-981-10-2355-2. [Google Scholar]
- Rizk, M.M.; Sharaki, O.A.; Meleis, M.E.; Younan, D.N.; Elkayal, A.A.; Moez, P. Detection of Epithelial Ovarian Cancer Using C8Magnetic Bead Separation and MALDI-TOF Plasma Proteome Profiling in Egyptian Females. Asian Pac. J. Cancer Prev. 2019, 20, 3603. [Google Scholar] [CrossRef] [PubMed] [Green Version]
- Swiatly, A.; Horala, A.; Hajduk, J.; Matysiak, J.; Nowak-Markwitz, E.; Kokot, Z.J. MALDI-TOF-MS Analysis in Discovery and Identification of Serum Proteomic Patterns of Ovarian Cancer. BMC Cancer 2017, 17, 472. [Google Scholar]
- Bai, J.; Yang, Y.; Wang, J.; Zhang, L.; Wang, F.; He, A. Variability of Serum Novel Serum Peptide Biomarkers Correlates with the Disease States of Multiple Myeloma. Clin. Proteom. 2019, 16, 17. [Google Scholar] [CrossRef] [Green Version]
- Kirana, C.; Peng, L.; Miller, R.; Keating, J.P.; Glenn, C.; Shi, H.; Jordan, T.W.; Maddern, G.J.; Stubbs, R.S. Combination of Laser Microdissection, 2D-DIGE and MALDI-TOF MS to Identify Protein Biomarkers to Predict Colorectal Cancer Spread. Clin. Proteom. 2019, 16, 3. [Google Scholar]
- Nedjadi, T.; Albarakati, N.; Benabdelkamel, H.; Masood, A.; Alfadda, A.A.; Al-Maghrabi, J. Proteomic Profiling of Plasma-Derived Biomarkers in Patients with Bladder Cancer: A Step towards Clinical Translation. Life 2021, 11, 1294. [Google Scholar] [PubMed]
- Serafim, V.; Shah, A.; Puiu, M.; Andreescu, N.; Coricovac, D.; Nosyrev, A.E.; Spandidos, D.A.; Tsatsakis, A.M.; Dehelean, C.; Pinzaru, I. Classification of Cancer Cell Lines Using Matrix-Assisted Laser Desorption/Ionization Time-of-flight Mass Spectrometry and Statistical Analysis. Int. J. Mol. Med. 2017, 40, 1096–1104. [Google Scholar] [PubMed] [Green Version]
- Padoan, A.; Basso, D.; Zambon, C.F.; Prayer-Galetti, T.; Arrigoni, G.; Bozzato, D.; Moz, S.; Zattoni, F.; Bellocco, R.; Plebani, M. MALDI-TOF Peptidomic Analysis of Serum and Post-Prostatic Massage Urine Specimens to Identify Prostate Cancer Biomarkers. Clin. Proteom. 2018, 15, 23. [Google Scholar]
- Xu, J.; Xu, B.; Tang, C.; Li, X.; Qin, H.; Wang, W.; Wang, H.; Wang, Z.; Li, L.; Li, Z.; et al. The Exploration of Peptide Biomarkers in Malignant Pleural Effusion of Lung Cancer Using Matrix-Assisted Laser Desorption/Ionization Time-of-Flight Mass Spectrometry. Dis. Markers 2017, 2017, 3160426. [Google Scholar] [CrossRef] [PubMed] [Green Version]
- Li, Z.; Tang, C.; Li, X.; Wang, J.W.; Qin, H.; Xu, B.; Chen, J.; Gao, H.; He, K.; Liu, X. Detection and Significance of Small-Cell Lung Cancer Serum Protein Markers Using MALDI-TOF-MS. Int. J. Clin. Exp. Med. 2017, 10, 929–936. [Google Scholar]
- Yu, Z.; Zhao, C.; Hu, S.; Zhang, H.; Li, W.; Zhang, R.; Luo, Q.; Yang, H. MALDI-MS-Based Biomarker Analysis of Extracellular Vesicles from Human Lung Carcinoma Cells. RSC Adv. 2021, 11, 25375–25380. [Google Scholar] [CrossRef] [PubMed]
- Sargazi, M.; Hashemi, S.H.; Kaykhaii, M. Modern Sample Preparation Techniques: A Brief Introduction. In Sample Preparation Techniques for Chemical Analysis; Kaykhaii, M., Ed.; IntechOpen: London, UK, 2021. [Google Scholar] [CrossRef]
- Zacharis, K.; Câmara, J.S.; Perestrelo, R.; Berenguer, C.V.; Andrade, C.F.P.; Gomes, T.M.; Olayanju, B.; Kabir, A.; Rocha, C.M.R.; Teixeira, J.A.; et al. Green Extraction Techniques as Advanced Sample Preparation Approaches in Biological, Food, and Environmental Matrices: A Review. Molecules 2022, 27, 2953. [Google Scholar] [CrossRef]
- Hajduk, J.; Matysiak, J.; Kokot, Z.J. Challenges in Biomarker Discovery with MALDI-TOF MS. Clin. Chim. Acta 2016, 458, 84–98. [Google Scholar] [CrossRef] [PubMed]
- Petre, G.; Durand, H.; Pelletier, L.; Poulenard, M.; Nugue, G.; Ray, P.F.; Rendu, J.; Coutton, C.; Berger, F.; Bidart, M. Rapid Proteomic Profiling by MALDI-TOF Mass Spectrometry for Better Brain Tumor Classification. Proteom. Clin. Appl. 2020, 14, e1900116. [Google Scholar] [CrossRef]
- LaputkovÃi, G.; Talian, I.; SchwartzovÃi, V.; SchwartzovÃi, Z. MALDI-TOF MS Profiling in the Discovery and Identification of Salivary Proteomic Patterns of Temporomandibular Joint Disorders. Open Chem. 2020, 18, 1173–1180. [Google Scholar] [CrossRef]
- Lemańska-Perek, A.; Lis-Kuberka, J.; Lepczyński, A.; Dratwa-Chałupnik, A.; Tupikowski, K.; Kątnik-Prastowska, I.; Ożgo, M. Potential Plasma Biomarkers of Bladder Cancer Identified by Proteomic Analysis: A Pilot Study. Adv. Clin. Exp. Med. 2019, 28, 339–346. [Google Scholar] [CrossRef]
- Ding, D.; Chen, M.; Xiao, X.; Cao, P.; Li, S. Novel Serum Peptide Model Revealed by MALDI-TOF-MS and Its Diagnostic Value in Early Bladder Cancer. Int. J. Biol. Markers 2020, 35, 59–66. [Google Scholar] [CrossRef]
- Azevedo, R.; Soares, J.; Gaiteiro, C.; Peixoto, A.; Lima, L.; Ferreira, D.; Relvas-Santos, M.; Fernandes, E.; Tavares, A.; Cotton, S.; et al. Glycan Affinity Magnetic Nanoplatforms for Urinary Glycobiomarkers Discovery in Bladder Cancer. Talanta 2018, 184, 347–355. [Google Scholar] [CrossRef]
- Zaki, G.; Shoeib, T. Concentrations of Several Phthalates Contaminants in Egyptian Bottled Water: Effects of Storage Conditions and Estimate of Human Exposure. Sci. Total Environ. 2018, 618, 142–150. [Google Scholar] [CrossRef] [PubMed]
- Lee, S.B.; Bose, S.; Ahn, S.H.; Son, B.H.; Ko, B.S.; Kim, H.J.; Chung, I.Y.; Kim, J.; Lee, W.; Ko, M.S.; et al. Breast Cancer Diagnosis by Analysis of Serum N-Glycans Using MALDI-TOF Mass Spectroscopy. PLoS ONE 2020, 15, e0231004. [Google Scholar] [CrossRef] [Green Version]
- Sousa, P.; Camacho, I.; Câmara, J.S.; Perestrelo, R. Urinary Proteomic/Peptidomic Biosignature of Breast Cancer Patients Using 1D SDS-PAGE Combined with Matrix-Assisted Laser Desorption/Ionization-Time of Flight Mass Spectrometry. Separations 2023, 10, 291. [Google Scholar] [CrossRef]
- Kontostathi, G.; Zoidakis, J.; Makridakis, M.; Lygirou, V.; Mermelekas, G.; Papadopoulos, T.; Vougas, K.; Vlamis-Gardikas, A.; Drakakis, P.; Loutradis, D.; et al. Cervical Cancer Cell Line Secretome Highlights the Roles of Transforming Growth Factor-Beta-Induced Protein Ig-H3, Peroxiredoxin-2, and NRF2 on Cervical Carcinogenesis. Biomed. Res. Int. 2017, 2017, 4180703. [Google Scholar] [CrossRef] [PubMed] [Green Version]
- Shih, C.C.; Chou, H.C.; Chen, Y.J.; Kuo, W.H.; Chan, C.H.; Lin, Y.C.; Liao, E.C.; Chang, S.J.; Chan, H.L. Role of PGRMC1 in Cell Physiology of Cervical Cancer. Life Sci. 2019, 231, 116541. [Google Scholar] [CrossRef]
- Chen, Y.; Xiong, X.; Wang, Y.; Zhao, J.; Shi, H.; Zhang, H.; Wang, Y.; Wei, Y.; Xue, W.; Zhang, J. Proteomic Screening for Serum Biomarkers for Cervical Cancer and Their Clinical Significance. Med. Sci. Monit. 2019, 25, 288. [Google Scholar] [CrossRef]
- Liu, S.; Cheng, L.; Fu, Y.; Liu, B.F.; Liu, X. Characterization of IgG N-Glycome Profile in Colorectal Cancer Progression by MALDI-TOF-MS. J. Proteom. 2018, 181, 225–237. [Google Scholar] [CrossRef]
- Yu, J.; Zhai, X.; Li, X.; Zhong, C.; Guo, C.; Yang, F.; Yuan, Y.; Zheng, S. Identification of MST1 as a Potential Early Detection Biomarker for Colorectal Cancer through a Proteomic Approach. Sci. Rep. 2017, 7, 14265. [Google Scholar] [CrossRef] [Green Version]
- Yu, J.; Huang, Y.; Lin, C.; Li, X.; Fang, X.; Zhong, C.; Yuan, Y.; Zheng, S. Identification of Kininogen 1 as a Serum Protein Marker of Colorectal Adenoma in Patients with a Family History of Colorectal Cancer. J. Cancer 2018, 9, 540–547. [Google Scholar] [CrossRef] [Green Version]
- Buttacavoli, M.; Albanese, N.N.; Roz, E.; Pucci-Minafra, I.; Feo, S.; Cancemi, P. Proteomic Profiling of Colon Cancer Tissues: Discovery of New Candidate Biomarkers. Int. J. Mol. Sci. 2020, 21, 3096. [Google Scholar] [CrossRef]
- Lee, H.J.; Saralamma, V.V.G.; Kim, S.M.; Ha, S.E.; Vetrivel, P.; Kim, E.H.; Lee, S.J.; Heo, J.D.; Rampogu, S.; Lee, K.W.; et al. Comparative Proteomic Profiling of Tumor-Associated Proteins in Human Gastric Cancer Cells Treated with Pectolinarigenin. Nutrients 2018, 10, 1596. [Google Scholar] [CrossRef] [PubMed] [Green Version]
- Shi, F.; Wu, H.; Qu, K.; Sun, Q.; Li, F.; Shi, C.; Li, Y.; Xiong, X.; Qin, Q.; Yu, T.; et al. Identification of Serum Proteins AHSG, FGA and APOA-I as Diagnostic Biomarkers for Gastric Cancer. Clin. Proteom. 2018, 15, 18. [Google Scholar] [CrossRef] [PubMed] [Green Version]
- Qin, R.; Zhao, J.; Qin, W.; Zhang, Z.; Zhao, R.; Han, J.; Yang, Y.; Li, L.; Wang, X.; Ren, S.; et al. Discovery of Non-Invasive Glycan Biomarkers for Detection and Surveillance of Gastric Cancer. J. Cancer 2017, 8, 1908. [Google Scholar] [CrossRef]
- Qin, Y.; Zhong, Y.; Ma, T.; Zhang, J.; Yang, G.; Guan, F.; Li, Z.; Li, B. A Pilot Study of Salivary N-Glycome in HBV-Induced Chronic Hepatitis, Cirrhosis, and Hepatocellular Carcinoma. Glycoconj. J. 2017, 34, 523–535. [Google Scholar] [CrossRef]
- Park, H.G.; Jang, K.S.; Park, H.M.; Song, W.S.; Jeong, Y.Y.; Ahn, D.H.; Kim, S.M.; Yang, Y.H.; Kim, Y.G. MALDI-TOF MS-Based Total Serum Protein Fingerprinting for Liver Cancer Diagnosis. Analyst 2019, 144, 2231–2238. [Google Scholar] [CrossRef]
- Sun, F.; Wang, G.; Zhang, J.; Su, J. Application Value of MALDI-TOF-MS in Proteomics of Hepatitis B Virus-Related Liver Cancer. Chin. J. Exp. Clin. Virol. 2019, 6, 95–98. [Google Scholar]
- Li, B.; Li, B.; Guo, T.; Sun, Z.; Li, X.; Li, X.; Wang, H.; Chen, W.; Chen, P.; Qiao, M.; et al. Application Value of Mass Spectrometry in the Differentiation of Benign and Malignant Liver Tumors. Med. Sci. Monit. 2017, 23, 1636. [Google Scholar] [CrossRef] [Green Version]
- Mahalingam, D.; Chelis, L.; Nizamuddin, I.; Lee, S.S.; Kakolyris, S.; Halff, G.; Washburn, K.; Attwood, K.; Fahad, I.; Grigorieva, J.; et al. Detection of Hepatocellular Carcinoma in a High-Risk Population by a Mass Spectrometry-Based Test. Cancers 2021, 13, 3109. [Google Scholar] [CrossRef]
- Hou, W.L.; Chang, M.; Liu, X.F.; Hu, L.S.; Hua, S.C. Proteomic and Ultrastructural Analysis of Clara Cell and Type II Alveolar Epithelial Cell-Type Lung Cancer Cells. Transl. Cancer Res. 2020, 9, 565–576. [Google Scholar] [CrossRef]
- Saleem, M.; Raza, S.K.; G Musharraf, S. A Comparative Protein Analysis of Lung Cancer, along with Three Controls Using a Multidimensional Proteomic Approach. Exp. Biol. Med. 2019, 244, 36–41. [Google Scholar] [CrossRef]
- Song, Y.; Xu, X.; Wang, N.; Zhang, T.; Hu, C. MALDI-TOF-MS Analysis in Low Molecular Weight Serum Peptidome Biomarkers for NSCLC. J. Clin. Lab. Anal. 2022, 36, e24254. [Google Scholar] [CrossRef]
- Lv, P.; Liu, Z.; Xu, B.; Tang, C.; Li, X.; Qin, H.; Yang, S.; Gao, H.; He, K.; Liu, X. Exploratory Study on Application of MALDI-TOF-MS to Detect Serum and Urine Peptides Related to Small Cell Lung Carcinoma. Mol. Med. Rep. 2020, 21, 51–60. [Google Scholar] [CrossRef] [Green Version]
- Pais, R.J.; Zmuidinaite, R.; Lacey, J.C.; Jardine, C.S.; Iles, R.K. A Rapid and Affordable Screening Tool for Early-Stage Ovarian Cancer Detection Based on MALDI-ToF MS of Blood Serum. Appl. Sci. 2022, 12, 3030. [Google Scholar] [CrossRef]
- Andersen, M.K.; Høiem, T.S.; Claes, B.S.R.; Balluff, B.; Martin-Lorenzo, M.; Richardsen, E.; Krossa, S.; Bertilsson, H.; Heeren, R.M.A.; Rye, M.B.; et al. Spatial Differentiation of Metabolism in Prostate Cancer Tissue by MALDI-TOF MSI. Cancer Metab. 2021, 9, 9. [Google Scholar] [CrossRef]
- Sun, J.; Yu, G.; Yang, Y.; Qiao, L.; Xu, B.; Ding, C.; Liu, Y.; Yu, S. Evaluation of Prostate Cancer Based on MALDI-TOF MS Fingerprinting of Nanoparticle-Treated Serum Proteins/Peptides. Talanta 2020, 220, 121331. [Google Scholar] [CrossRef] [PubMed]
- Zhao, H.; Zhao, X.; Lei, T.; Zhang, M. Screening, Identification of Prostate Cancer Urinary Biomarkers and Verification of Important Spots. Investig. New Drugs 2019, 37, 935–947. [Google Scholar] [CrossRef] [PubMed]
- Zheng, H.; Zhao, J.; Wang, X.; Yan, S.; Chu, H.; Gao, M.; Zhang, X. Integrated Pipeline of Rapid Isolation and Analysis of Human Plasma Exosomes for Cancer Discrimination Based on Deep Learning of MALDI-TOF MS Fingerprints. Anal. Chem. 2022, 94, 1831–1839. [Google Scholar] [CrossRef]
- Banach, P.; Dereziński, P.; Matuszewska, E.; Matysiak, J.; Bochyński, H.; Kokot, Z.J.; Nowak-Markwitz, E. MALDI-TOF-MS Analysis in the Identification of Urine Proteomic Patterns of Gestational Trophoblastic Disease. Metabolites 2019, 9, 30. [Google Scholar] [CrossRef] [PubMed] [Green Version]
- Chernokalskaya, E.; Gutierrez, S.; Pitt, A.M.; Leonard, J.T. Ultrafiltration for Proteomic Sample Preparation. Electrophoresis 2004, 25, 2461–2468. [Google Scholar] [CrossRef] [PubMed]
- Callesen, A.K.; Madsen, J.S.; Vach, W.; Kruse, T.A.; Mogensen, O.; Jensen, O.N. Serum Protein Profiling by Solid Phase Extraction and Mass Spectrometry: A Future Diagnostics Tool? Proteomics 2009, 9, 1428–1441. [Google Scholar] [CrossRef]
- Gobom, J.; Nordhoff, E.; Mirgorodskaya, E.; Ekman, R.; Roepstorff, P. Sample Purification and Preparation Technique Based on Nano-Scale Reversed-Phase Columns for the Sensitive Analysis of Complex Peptide Mixtures by Matrix-Assisted Laser Desorption/Ionization Mass Spectrometry—PubMed. J. Mass. Spectrom. 1999, 34, 105–116. [Google Scholar] [CrossRef]
- Xing, R.; Wen, Y.; He, H.; Guo, Z.; Liu, Z. Recent Progress in the Combination of Molecularly Imprinted Polymer-Based Affinity Extraction and Mass Spectrometry for Targeted Proteomic Analysis. TrAC Trends Anal. Chem. 2019, 110, 417–428. [Google Scholar] [CrossRef]
- Shi, H.; Tsal, W.B.; Garrison, M.D.; Ferrari, S.; Ratner, B.D. Template-Imprinted Nanostructured Surfaces for Protein Recognition. Nature 1999, 398, 593–597. [Google Scholar] [CrossRef] [PubMed]
- Chen, L.; Wang, X.; Lu, W.; Wu, X.; Li, J. Molecular Imprinting: Perspectives and Applications. Chem. Soc. Rev. 2016, 45, 2137–2211. [Google Scholar] [CrossRef] [PubMed]
- McKitterick, N.; Bicak, T.C.; Cormack, P.A.G.; Reubsaet, L.; Halvorsen, T.G. Facilitating Serum Determination of Neuron Specific Enolase at Clinically Relevant Levels by Coupling On-Line Molecularly Imprinted Solid-Phase Extraction to LC-MS/MS. Anal. Chim. Acta 2020, 1140, 210–218. [Google Scholar] [CrossRef]
- Özdaş, S.; Baydemir Peşint, G.; Arısoy, P.; Zenger, O.; Eren, B. Neopterin-Imprinted Columns for Selective Neopterin Recognition from Serum and Urine Samples. Process Biochem. 2021, 108, 1–7. [Google Scholar] [CrossRef]
- Scorrano, S.; Longo, L.; Vasapollo, G. Molecularly Imprinted Polymers for Solid-Phase Extraction of 1-Methyladenosine from Human Urine. Anal. Chim. Acta 2010, 659, 167–171. [Google Scholar] [CrossRef]
- Mavliutova, L.; Munoz Aldeguer, B.; Wiklander, J.; Wierzbicka, C.; Huynh, C.M.; Nicholls, I.A.; Irgum, K.; Sellergren, B. Discrimination between Sialic Acid Linkage Modes Using Sialyllactose-Imprinted Polymers. RSC Adv. 2021, 11, 22409–22418. [Google Scholar] [CrossRef]
- Hajduk, J.; Matysiak, J.; Kokot, P.; Nowicki, P.; Dereziński, P.; Kokot, Z.J. The Application of Fuzzy Statistics and Linear Discriminant Analysis as Criteria for Optimizing the Preparation of Plasma for Matrix-Assisted Laser Desorption/Ionization Mass Spectrometry Peptide Profiling. Clin. Chim. Acta 2015, 448, 174–181. [Google Scholar] [CrossRef]
- Liu, W.; Gao, X.; Cai, Q.; Li, J.; Zhu, Z.; Li, C.; Yao, X.; Yang, Q.; Xiang, M.; Yan, M.; et al. Identification of Novel Serum Biomarkers for Gastric Cancer by Magnetic Bead. Front. Biosci. (Elite Ed.) 2010, 2, 961–971. [Google Scholar] [CrossRef] [Green Version]
- Villanueva, J.; Philip, J.; Entenberg, D.; Chaparro, C.A.; Tanwar, M.K.; Holland, E.C.; Tempst, P. Serum Peptide Profiling by Magnetic Particle-Assisted, Automated Sample Processing and MALDI-TOF Mass Spectrometry. Anal. Chem. 2004, 76, 1560–1570. [Google Scholar] [CrossRef]
- Bruegel, M.; Planert, M.; Baumann, S.; Focke, A.; Bergh, F.T.; Leichtle, A.; Ceglarek, U.; Thiery, J.; Fiedler, G.M. Standardized Peptidome Profiling of Human Cerebrospinal Fluid by Magnetic Bead Separation and Matrix-Assisted Laser Desorption/Ionization Time-of-Flight Mass Spectrometry. J. Proteom. 2009, 72, 608–615. [Google Scholar] [CrossRef] [PubMed]
- Gode, D.; Volmer, D.A. A Novel Magnet Focusing Plate for Matrix-Assisted Laser Desorption/Ionization Analysis of Magnetic Bead-Bound Analytes. Rapid Commun. Mass. Spectrom. 2013, 27, 1011–1018. [Google Scholar] [CrossRef] [PubMed]
- Moser, A.C.; Hage, D.S. Immunoaffinity Chromatography: An Introduction to Applications and Recent Developments. Bioanalysis 2010, 2, 769. [Google Scholar] [CrossRef] [Green Version]
- Sharma, P.; Ludwig, S.; Muller, L.; Hong, C.S.; Kirkwood, J.M.; Ferrone, S.; Whiteside, T.L. Immunoaffinity-Based Isolation of Melanoma Cell-Derived Exosomes from Plasma of Patients with Melanoma. J. Extracell. Vesicles 2018, 7, 1435138. [Google Scholar] [CrossRef] [PubMed]
- Nicol, G.R.; Han, M.; Kim, J.; Birse, C.E.; Brand, E.; Nguyen, A.; Mesri, M.; FitzHugh, W.; Kaminker, P.; Moore, P.A.; et al. Use of an Immunoaffinity-Mass Spectrometry-Based Approach for the Quantification of Protein Biomarkers from Serum Samples of Lung Cancer Patients. Mol. Cell. Proteom. 2008, 7, 1974–1982. [Google Scholar] [CrossRef] [Green Version]
- Choi, E.S.; Faruque, H.A.; Kim, J.H.; Kim, K.J.; Choi, J.E.; Kim, B.A.; Kim, B.; Kim, Y.J.; Woo, M.H.; Park, J.Y.; et al. CD5L as an Extracellular Vesicle-Derived Biomarker for Liquid Biopsy of Lung Cancer. Diagnostics 2021, 11, 620. [Google Scholar] [CrossRef]
- Hsiao, Y.C.; Lin, S.Y.; Chien, K.Y.; Chen, S.F.; Wu, C.C.; Chang, Y.T.; Chi, L.M.; Chu, L.J.; Chiang, W.F.; Chien, C.Y.; et al. An Immuno-MALDI Mass Spectrometry Assay for the Oral Cancer Biomarker, Matrix Metalloproteinase-1, in Dried Saliva Spot Samples. Anal. Chim. Acta 2020, 1100, 118–130. [Google Scholar] [CrossRef]
- Kirwan, A.; Utratna, M.; O’Dwyer, M.E.; Joshi, L.; Kilcoyne, M. Glycosylation-Based Serum Biomarkers for Cancer Diagnostics and Prognostics. Biomed. Res. Int. 2015, 2015, 490531. [Google Scholar] [CrossRef] [Green Version]
- Kanshin, E.; Michnick, S.; Thibault, P. Sample Preparation and Analytical Strategies for Large-Scale Phosphoproteomics Experiments. Semin. Cell Dev. Biol. 2012, 23, 843–853. [Google Scholar] [CrossRef]
- Sürmen, M.G.; Sürmen, S.; Ali, A.; Musharraf, S.G.; Emekli, N. Phosphoproteomic Strategies in Cancer Research: A Minireview. Analyst 2020, 145, 7125–7149. [Google Scholar] [CrossRef] [PubMed]
- Huang, B.Y.; Yang, C.K.; Liu, C.P.; Liu, C.Y. Stationary Phases for the Enrichment of Glycoproteins and Glycopeptides. Electrophoresis 2014, 35, 2091–2107. [Google Scholar] [CrossRef] [PubMed] [Green Version]
- Ruprecht, B.; Roesli, C.; Lemeer, S.; Kuster, B. MALDI-TOF and NESI Orbitrap MS/MS Identify Orthogonal Parts of the Phosphoproteome. Proteomics 2016, 16, 1447–1456. [Google Scholar] [CrossRef] [PubMed]
- Tsai, C.F.; Hsu, C.C.; Hung, J.N.; Wang, Y.T.; Choong, W.K.; Zeng, M.Y.; Lin, P.Y.; Hong, R.W.; Sung, T.Y.; Chen, Y.J. Sequential Phosphoproteomic Enrichment through Complementary Metal-Directed Immobilized Metal Ion Affinity Chromatography. Anal. Chem. 2014, 86, 685–693. [Google Scholar] [CrossRef] [PubMed]
- Jiang, J.; Sun, X.; Li, Y.; Deng, C.; Duan, G. Facile Synthesis of Fe3O4@PDA Core-Shell Microspheres Functionalized with Various Metal Ions: A Systematic Comparison of Commonly-Used Metal Ions for IMAC Enrichment. Talanta 2018, 178, 600–607. [Google Scholar] [CrossRef]
- Monopoli, A.; Nacci, A.; Cataldi, T.R.I.; Calvano, C.D.; Piovesana, S.; Montonea, C.M.; Cerrato, A. Synthesis and Matrix Properties of α-Cyano-5-Phenyl-2,4-Pentadienic Acid (CPPA) for Intact Proteins Analysis by Matrix-Assisted Laser Desorption/Ionization Mass Spectrometry. Molecules 2020, 25, 6054. [Google Scholar] [CrossRef]
- Lou, X.; Van Dongen, J.L.J.; Vekemans, J.A.J.M.; Meijer, E.W. Matrix Suppression and Analyte Suppression Effects of Quaternary Ammonium Salts in Matrix-Assisted Laser Desorption/Ionization Time-of-Flight Mass Spectrometry: An Investigation of Suppression Mechanism. Rapid Commun. Mass. Spectrom. 2009, 23, 3077–3082. [Google Scholar] [CrossRef]
- Terracciano, R.; Preianò, M.; Maggisano, G.; Pelaia, C.; Savino, R. Hexagonal Mesoporous Silica as a Rapid, Efficient and Versatile Tool for MALDI-TOF MS Sample Preparation in Clinical Peptidomics Analysis: A Pilot Study. Molecules 2019, 24, 2311. [Google Scholar] [CrossRef] [Green Version]
- Xie, H.; Wu, R.; Hung, Y.L.W.; Chen, X.; Chan, T.W.D. Development of a Matrix Sublimation Device with Controllable Crystallization Temperature for MALDI Mass Spectrometry Imaging. Anal. Chem. 2021, 93, 6342–6347. [Google Scholar] [CrossRef]
- Tholey, A.; Heinzle, E. Ionic (Liquid) Matrices for Matrix-Assisted Laser Desorption/Ionization Mass Spectrometry-Applications and Perspectives. Anal. Bioanal. Chem. 2006, 386, 24–37. [Google Scholar] [CrossRef]
- Monopoli, A.; Calvano, C.D.; Nacci, A.; Palmisano, F. Boronic Acid Chemistry in MALDI MS: A Step Forward in Designing a Reactive Matrix with Molecular Recognition Capabilities. Chem. Commun. 2014, 50, 4322–4324. [Google Scholar] [CrossRef] [PubMed]
- Shroff, R.; Svatoš, A. Proton Sponge: A Novel and Versatile MALDI Matrix for the Analysis of Metabolites Using Mass Spectrometry. Anal. Chem. 2009, 81, 7954–7959. [Google Scholar] [CrossRef] [PubMed]
- Vasil’ev, Y.V.; Khvostenko, O.G.; Streletskii, A.V.; Boltalina, O.V.; Kotsiris, S.G.; Drewello, T. Electron Transfer Reactivity in Matrix-Assisted Laser Desorption/Ionization (MALDI): Ionization Energy, Electron Affinity and Performance of the DCTB Matrix within the Thermochemical Framework. J. Phys. Chem. A 2006, 110, 5967–5972. [Google Scholar] [CrossRef] [PubMed]
- Fukuyama, Y.; Tanimura, R.; Maeda, K.; Watanabe, M.; Kawabata, S.I.; Iwamoto, S.; Izumi, S.; Tanaka, K. Alkylated Dihydroxybenzoic Acid as a MALDI Matrix Additive for Hydrophobic Peptide Analysis. Anal. Chem. 2012, 84, 4237–4243. [Google Scholar] [CrossRef] [PubMed]
- López-Fernández, H.; Santos, H.M.; Capelo, J.L.; Fdez-Riverola, F.; Glez-Peña, D.; Reboiro-Jato, M. Mass-Up: An All-in-One Open Software Application for MALDI-TOF Mass Spectrometry Knowledge Discovery. BMC Bioinform. 2015, 16, 318. [Google Scholar] [CrossRef] [Green Version]
- Ketterlinus, R.; Hsieh, S.Y.; Teng, S.H.; Lee, H.; Pusch, W. Fishing for Biomarkers: Analyzing Mass Spectrometry Data with the New ClinProTools Software. Biotechniques 2005, 38, 37–40. [Google Scholar] [CrossRef]
- Titulaer, M.K.; Siccama, I.; Dekker, L.J.; van Rijswijk, A.L.C.T.; Heeren, R.M.A.; Sillevis Smitt, P.A.; Luider, T.M. A Database Application for Pre-Processing, Storage and Comparison of Mass Spectra Derived from Patients and Controls. BMC Bioinform. 2006, 7, 403. [Google Scholar] [CrossRef] [Green Version]
- Meuleman, W.; Engwegen, J.Y.M.N.; Gast, M.C.W.; Beijnen, J.H.; Reinders, M.J.T.; Wessels, L.F.A. Comparison of Normalisation Methods for Surface-Enhanced Laser Desorption and Ionisation (SELDI) Time-of-Flight (TOF) Mass Spectrometry Data. BMC Bioinform. 2008, 9, 88–98. [Google Scholar] [CrossRef] [Green Version]
- Liu, Y.; Wei, F.; Wang, F.; Li, C.; Meng, G.; Duan, H.; Ma, Q.; Zhang, W. Serum Peptidome Profiling Analysis for the Identification of Potential Biomarkers in Cervical Intraepithelial Neoplasia Patients. Biochem. Biophys. Res. Commun. 2015, 465, 476–480. [Google Scholar] [CrossRef]
- Du, P.; Stolovitzky, G.; Horvatovich, P.; Bischoff, R.; Lim, J.; Suits, F. A Noise Model for Mass Spectrometry Based Proteomics. Bioinformatics 2008, 24, 1070–1077. [Google Scholar] [CrossRef] [Green Version]
- Datta, S.; Mertens, B.J.A. Statistical Analysis of Proteomics, Metabolomics, and Lipidomics Data Using Mass Spectrometry. In Frontiers in Probability and the Statistical Sciences; Springer International Publishing: Berlin/Heidelberg, Germany, 2017. [Google Scholar]
- Labas, V.; Spina, L.; Belleannee, C.; Teixeira-Gomes, A.P.; Gargaros, A.; Dacheux, F.; Dacheux, J.L. Analysis of Epididymal Sperm Maturation by MALDI Profiling and Top-down Mass Spectrometry. J. Proteom. 2015, 113, 226–243. [Google Scholar] [CrossRef] [PubMed]
- Heather, L.C.; Wang, X.; West, J.A.; Griffin, J.L. A Practical Guide to Metabolomic Profiling as a Discovery Tool for Human Heart Disease. J. Mol. Cell Cardiol. 2013, 55, 2–11. [Google Scholar] [CrossRef] [PubMed]
- Yi, L.; Dong, N.; Yun, Y.; Deng, B.; Ren, D.; Liu, S.; Liang, Y. Chemometric Methods in Data Processing of Mass Spectrometry-Based Metabolomics: A Review. Anal. Chim. Acta 2016, 914, 17–34. [Google Scholar] [CrossRef] [PubMed]
- Salem, N.; Hussein, S. Data Dimensional Reduction and Principal Components Analysis. Procedia Comput. Sci. 2019, 163, 292–299. [Google Scholar] [CrossRef]
- Silva, C.; Perestrelo, R.; Silva, P.; Tomás, H.; Câmara, J.S. Breast Cancer Metabolomics: From Analytical Platforms to Multivariate Data Analysis. A Review. Metabolites 2019, 9, 102. [Google Scholar] [CrossRef] [Green Version]
- Aminu, M.; Ahmad, N.A. Complex Chemical Data Classification and Discrimination Using Locality Preserving Partial Least Squares Discriminant Analysis. ACS Omega 2020, 5, 26601–26610. [Google Scholar] [CrossRef]
- Zaki, A.; Ramadan, R.A.; Moez, P.; Ghareeb, H.; Elkarmouty, A. Plasma Peptidome Pattern of Breast Cancer Using Magnetic Beads-Based Plasma Fractionation and MALDI-TOF MS: A Case Control Study in Egypt. Asian Pac. J. Cancer Prev. 2019, 20, 175–184. [Google Scholar] [CrossRef] [Green Version]
- Bray, F.; Ferlay, J.; Soerjomataram, I.; Siegel, R.L.; Torre, L.A.; Jemal, A. Global Cancer Statistics 2018: GLOBOCAN Estimates of Incidence and Mortality Worldwide for 36 Cancers in 185 Countries. CA Cancer J Clin 2018, 68, 394–424. [Google Scholar] [CrossRef] [Green Version]
- Ewing, I.; Hurley, J.J.; Josephides, E.; Millar, A. The Molecular Genetics of Colorectal Cancer. Frontline Gastroenterol. 2014, 5, 26–30. [Google Scholar] [CrossRef] [Green Version]
- Chen, W.; Zheng, R.; Baade, P.D.; Zhang, S.; Zeng, H.; Bray, F.; Jemal, A.; Yu, X.Q.; He, J. Cancer Statistics in China, 2015. CA Cancer J Clin 2016, 66, 115–132. [Google Scholar] [CrossRef] [Green Version]
- Villanueva, A. Hepatocellular Carcinoma. N. Engl. J. Med. 2019, 380, 1450–1462. [Google Scholar] [CrossRef] [PubMed] [Green Version]
- Lin, H.T.; Liu, F.C.; Wu, C.Y.; Kuo, C.F.; Lan, W.C.; Yu, H.P. Epidemiology and Survival Outcomes of Lung Cancer: A Population-Based Study. Biomed. Res. Int. 2019, 2019, 8148156. [Google Scholar] [CrossRef] [PubMed] [Green Version]
- Ziaran, S.; Varchulova Novakova, Z.; Bohmer, D.; Danisovic, L. Biomarkers for Determination Prostate Cancer: Implication for Diagnosis and Prognosis. Neoplasma 2015, 62, 683–691. [Google Scholar] [CrossRef] [Green Version]
- Fernandez-de-las-Penas, C.; Svensson, P. Myofascial Temporomandibular Disorder. Curr. Rheumatol. Rev. 2016, 12, 40–54. [Google Scholar] [CrossRef] [PubMed]
- Slade, G.D.; Ohrbach, R.; Greenspan, J.D.; Fillingim, R.B.; Bair, E.; Sanders, A.E.; Diatchenko, L.; Meloto, C.B.; Smith, S.; Maixner, W. Painful Temporomandibular Disorder: Decade of Discovery from OPPERA Studies. J. Dent. Res. 2016, 95, 1084–1092. [Google Scholar] [CrossRef] [PubMed] [Green Version]
- Gerecke, C.; Fuhrmann, S.; Strifler, S.; Schmidt-Hieber, M.; Einsele, H.; Knop, S. The Diagnosis and Treatment of Multiple Myeloma. Dtsch. Arztebl. Int. 2016, 113, 470–476. [Google Scholar] [CrossRef] [PubMed] [Green Version]
- Luu, G.T.; Sanchez, L.M. Toward Improvement of Screening through Mass Spectrometry-Based Proteomics: Ovarian Cancer as a Case Study. Int. J. Mass. Spectrom. 2021, 469, 116679. [Google Scholar] [CrossRef]
- Angel, T.E.; Aryal, U.K.; Hengel, S.M.; Baker, E.S.; Kelly, R.T.; Robinson, E.W.; Smith, R.D. Mass Spectrometry-Based Proteomics: Existing Capabilities and Future Directions. Chem. Soc. Rev. 2012, 41, 3912–3928. [Google Scholar] [CrossRef] [Green Version]
- Tsai, T.H.; Song, E.; Zhu, R.; Di Poto, C.; Wang, M.; Luo, Y.; Varghese, R.S.; Tadesse, M.G.; Ziada, D.H.; Desai, C.S.; et al. LC-MS/MS-Based Serum Proteomics for Identification of Candidate Biomarkers for Hepatocellular Carcinoma. Proteomics 2015, 15, 2369–2381. [Google Scholar] [CrossRef] [Green Version]
- Ploypetch, S.; Jaresitthikunchai, J.; Phaonakrop, N.; Sakcamduang, W.; Manee-in, S.; Suriyaphol, P.; Roytrakul, S.; Suriyaphol, G. Utilizing MALDI-TOF MS and LC-MS/MS to Access Serum Peptidome-Based Biomarkers in Canine Oral Tumors. Sci. Rep. 2022, 12, 21641. [Google Scholar] [CrossRef]
- Darie-Ion, L.; Whitham, D.; Jayathirtha, M.; Rai, Y.; Neagu, A.N.; Darie, C.C.; Petre, B.A. Applications of MALDI-MS/MS-Based Proteomics in Biomedical Research. Molecules 2022, 27, 6196. [Google Scholar] [CrossRef] [PubMed]
- Carapito, C.; Duong, V.-A.; Lee, H. Bottom-Up Proteomics: Advancements in Sample Preparation. Int. J. Mol. Sci. 2023, 24, 5350. [Google Scholar] [CrossRef]
- Karpievitch, Y.V.; Polpitiya, A.D.; Anderson, G.A.; Smith, R.D.; Dabney, A.R. Liquid Chromatography Mass Spectrometry-Based Proteomics: Biological and Technological Aspects. Ann. Appl. Stat. 2010, 4, 1797–1823. [Google Scholar] [CrossRef] [PubMed]
- Kilpatrick, L.E.; Kilpatrick, E.L. Optimizing High-Resolution Mass Spectrometry for the Identification of Low-Abundance Post-Translational Modifications of Intact Proteins. J. Proteome Res. 2017, 16, 3255–3265. [Google Scholar] [CrossRef]
- Lin, Z.; Wei, L.; Cai, W.; Zhu, Y.; Tucholski, T.; Mitchell, S.D.; Guo, W.; Ford, S.P.; Diffee, G.M.; Ge, Y. Simultaneous Quantification of Protein Expression and Modifications by Top-down Targeted Proteomics: A Case of the Sarcomeric Subproteome. Mol. Cell. Proteom. 2019, 18, 594–605. [Google Scholar] [CrossRef] [Green Version]
- Smith, L.M.; Kelleher, N.L.; Linial, M.; Goodlett, D.; Langridge-Smith, P.; Goo, Y.A.; Safford, G.; Bonilla, L.; Kruppa, G.; Zubarev, R.; et al. Proteoform: A Single Term Describing Protein Complexity. Nat. Methods 2013, 10, 186–187. [Google Scholar] [CrossRef] [Green Version]
- Wu, Z.; Tiambeng, T.N.; Cai, W.; Chen, B.; Lin, Z.; Gregorich, Z.R.; Ge, Y. Impact of Phosphorylation on the Mass Spectrometry Quantification of Intact Phosphoproteins. Anal. Chem. 2018, 90, 4935–4939. [Google Scholar] [CrossRef] [Green Version]
- Peng, Y.; Gregorich, Z.R.; Valeja, S.G.; Zhang, H.; Cai, W.; Chen, Y.C.; Guner, H.; Chen, A.J.; Schwahn, D.J.; Hacker, T.A.; et al. Top-down Proteomics Reveals Concerted Reductions in Myofilament and Z-Disc Protein Phosphorylation after Acute Myocardial Infarction. Mol. Cell Proteom. 2014, 13, 2752–2764. [Google Scholar] [CrossRef] [Green Version]
- Zhang, H.; Ge, Y. Comprehensive Analysis of Protein Modifications by Top-down Mass Spectrometry. Circ. Cardiovasc. Genet. 2011, 4, 711. [Google Scholar] [CrossRef]
- Van Belkum, A.; Welker, M.; Erhard, M.; Chatellier, S. Biomedical Mass Spectrometry in Today’s and Tomorrow’s Clinical Microbiology Laboratories. J. Clin. Microbiol. 2012, 50, 1513–1517. [Google Scholar] [CrossRef] [Green Version]
- Bang, G.; Lee, H.; Kim, H.; Han, E.H.; Park, Y.H.; Kim, J.Y. Comparison of Protein Characterization Using In Solution and S-Trap Digestion Methods for Proteomics. Biochem. Biophys. Res. Commun. 2022, 589, 197–203. [Google Scholar] [CrossRef] [PubMed]
- Ivanova, O.M.; Ziganshin, R.H.; Arapidi, G.P.; Kovalchuk, S.I.; Azarkin, I.V.; Sorokina, A.V.; Govorun, V.M.; Radzinsky, V.E.; Ivanov, V.T. Scope and Limitations of MALDI-TOF MS Blood Serum Peptide Profiling in Cancer Diagnostics. Russ. J. Bioorg Chem. 2016, 42, 497–505. [Google Scholar] [CrossRef]
- Park, J.M.; Kim, M.J.; Noh, J.Y.; Yun, T.G.; Kang, M.J.; Lee, S.G.; Yoo, B.C.; Pyun, J.C. Simultaneous Analysis of Multiple Cancer Biomarkers Using MALDI-TOF Mass Spectrometry Based on a Parylene-Matrix Chip. J. Am. Soc. Mass. Spectrom. 2020, 31, 917–926. [Google Scholar] [CrossRef] [PubMed]
- Tarfeen, N.; Nisa, K.U.; Nisa, Q. MALDI-TOF MS: Application in Diagnosis, Dereplication, Biomolecule Profiling and Microbial Ecology. Proc. Indian Natl. Sci. Acad. 2022, 88, 277–291. [Google Scholar] [CrossRef]
Figure 1.
Overview of omic techniques to establish putative cancer biomarkers.

Figure 2.
The principle of MALDI-TOF MS.

Figure 3.
General workflow of cancer diagnostic via MALDI-TOF MS for proteome/peptidome.

Figure 4.
The most common sample pre-treatment procedure in proteomic field.

Figure 5.
Potential cancer biomarkers.


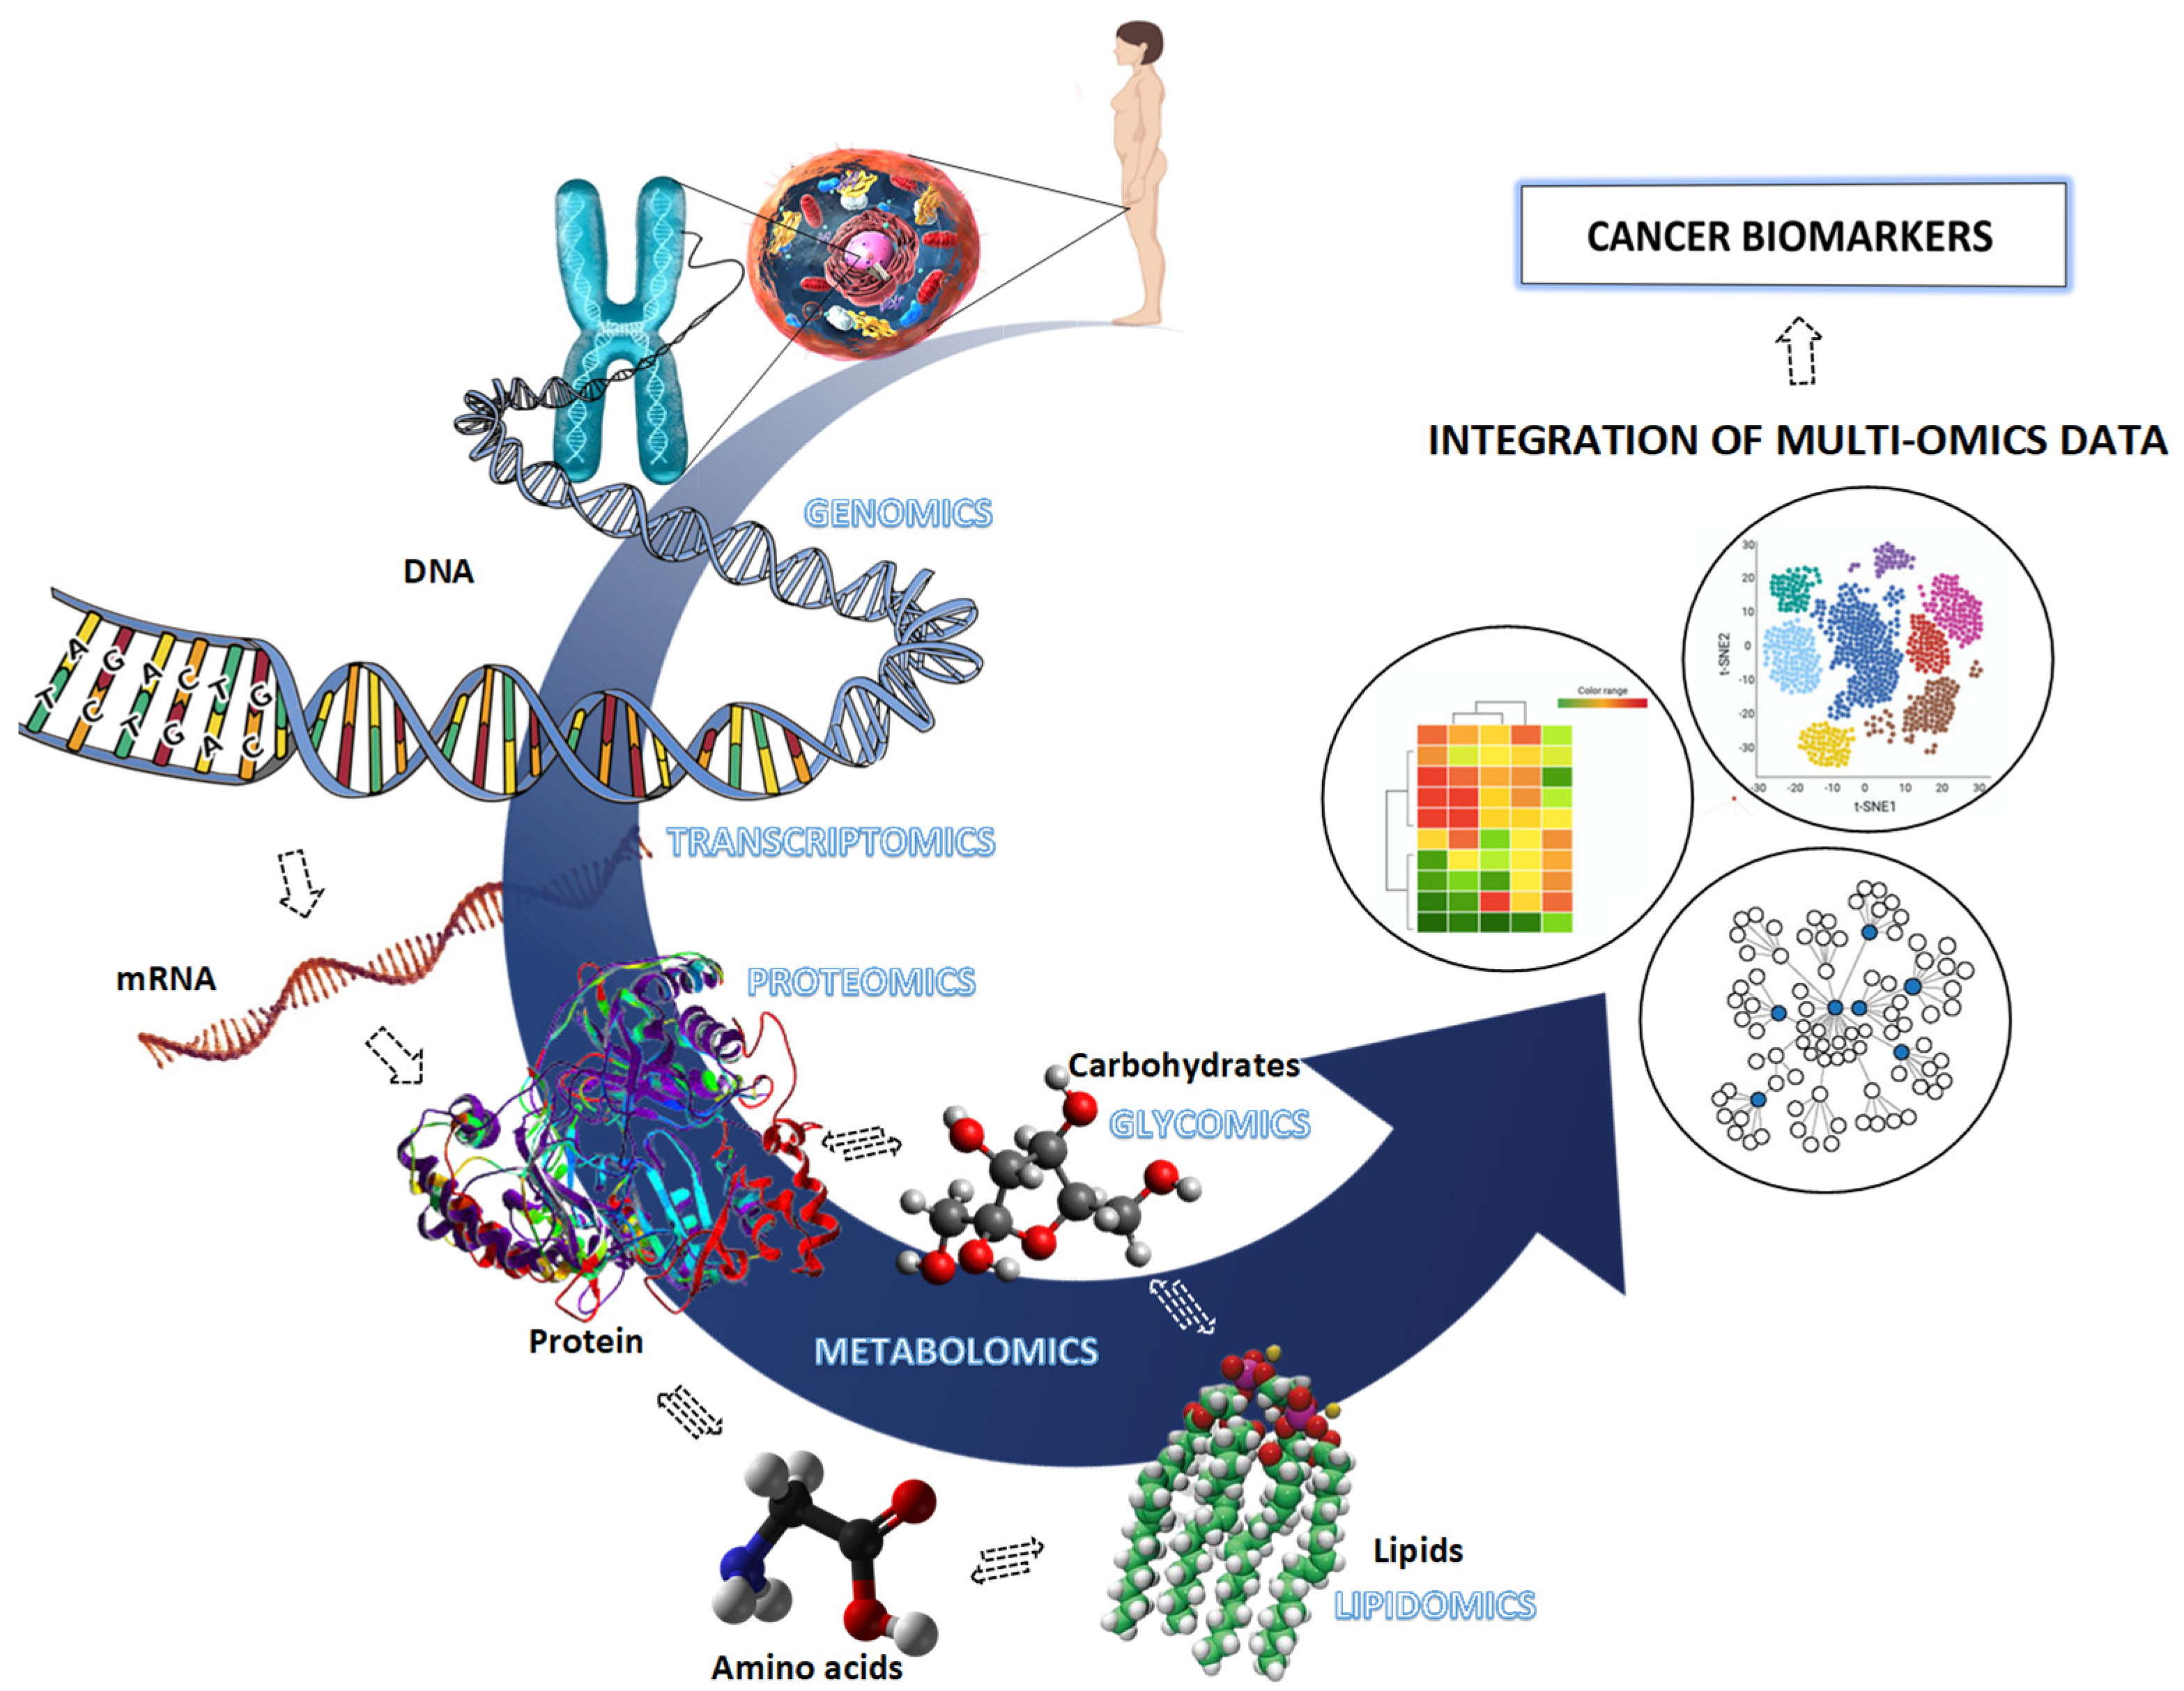
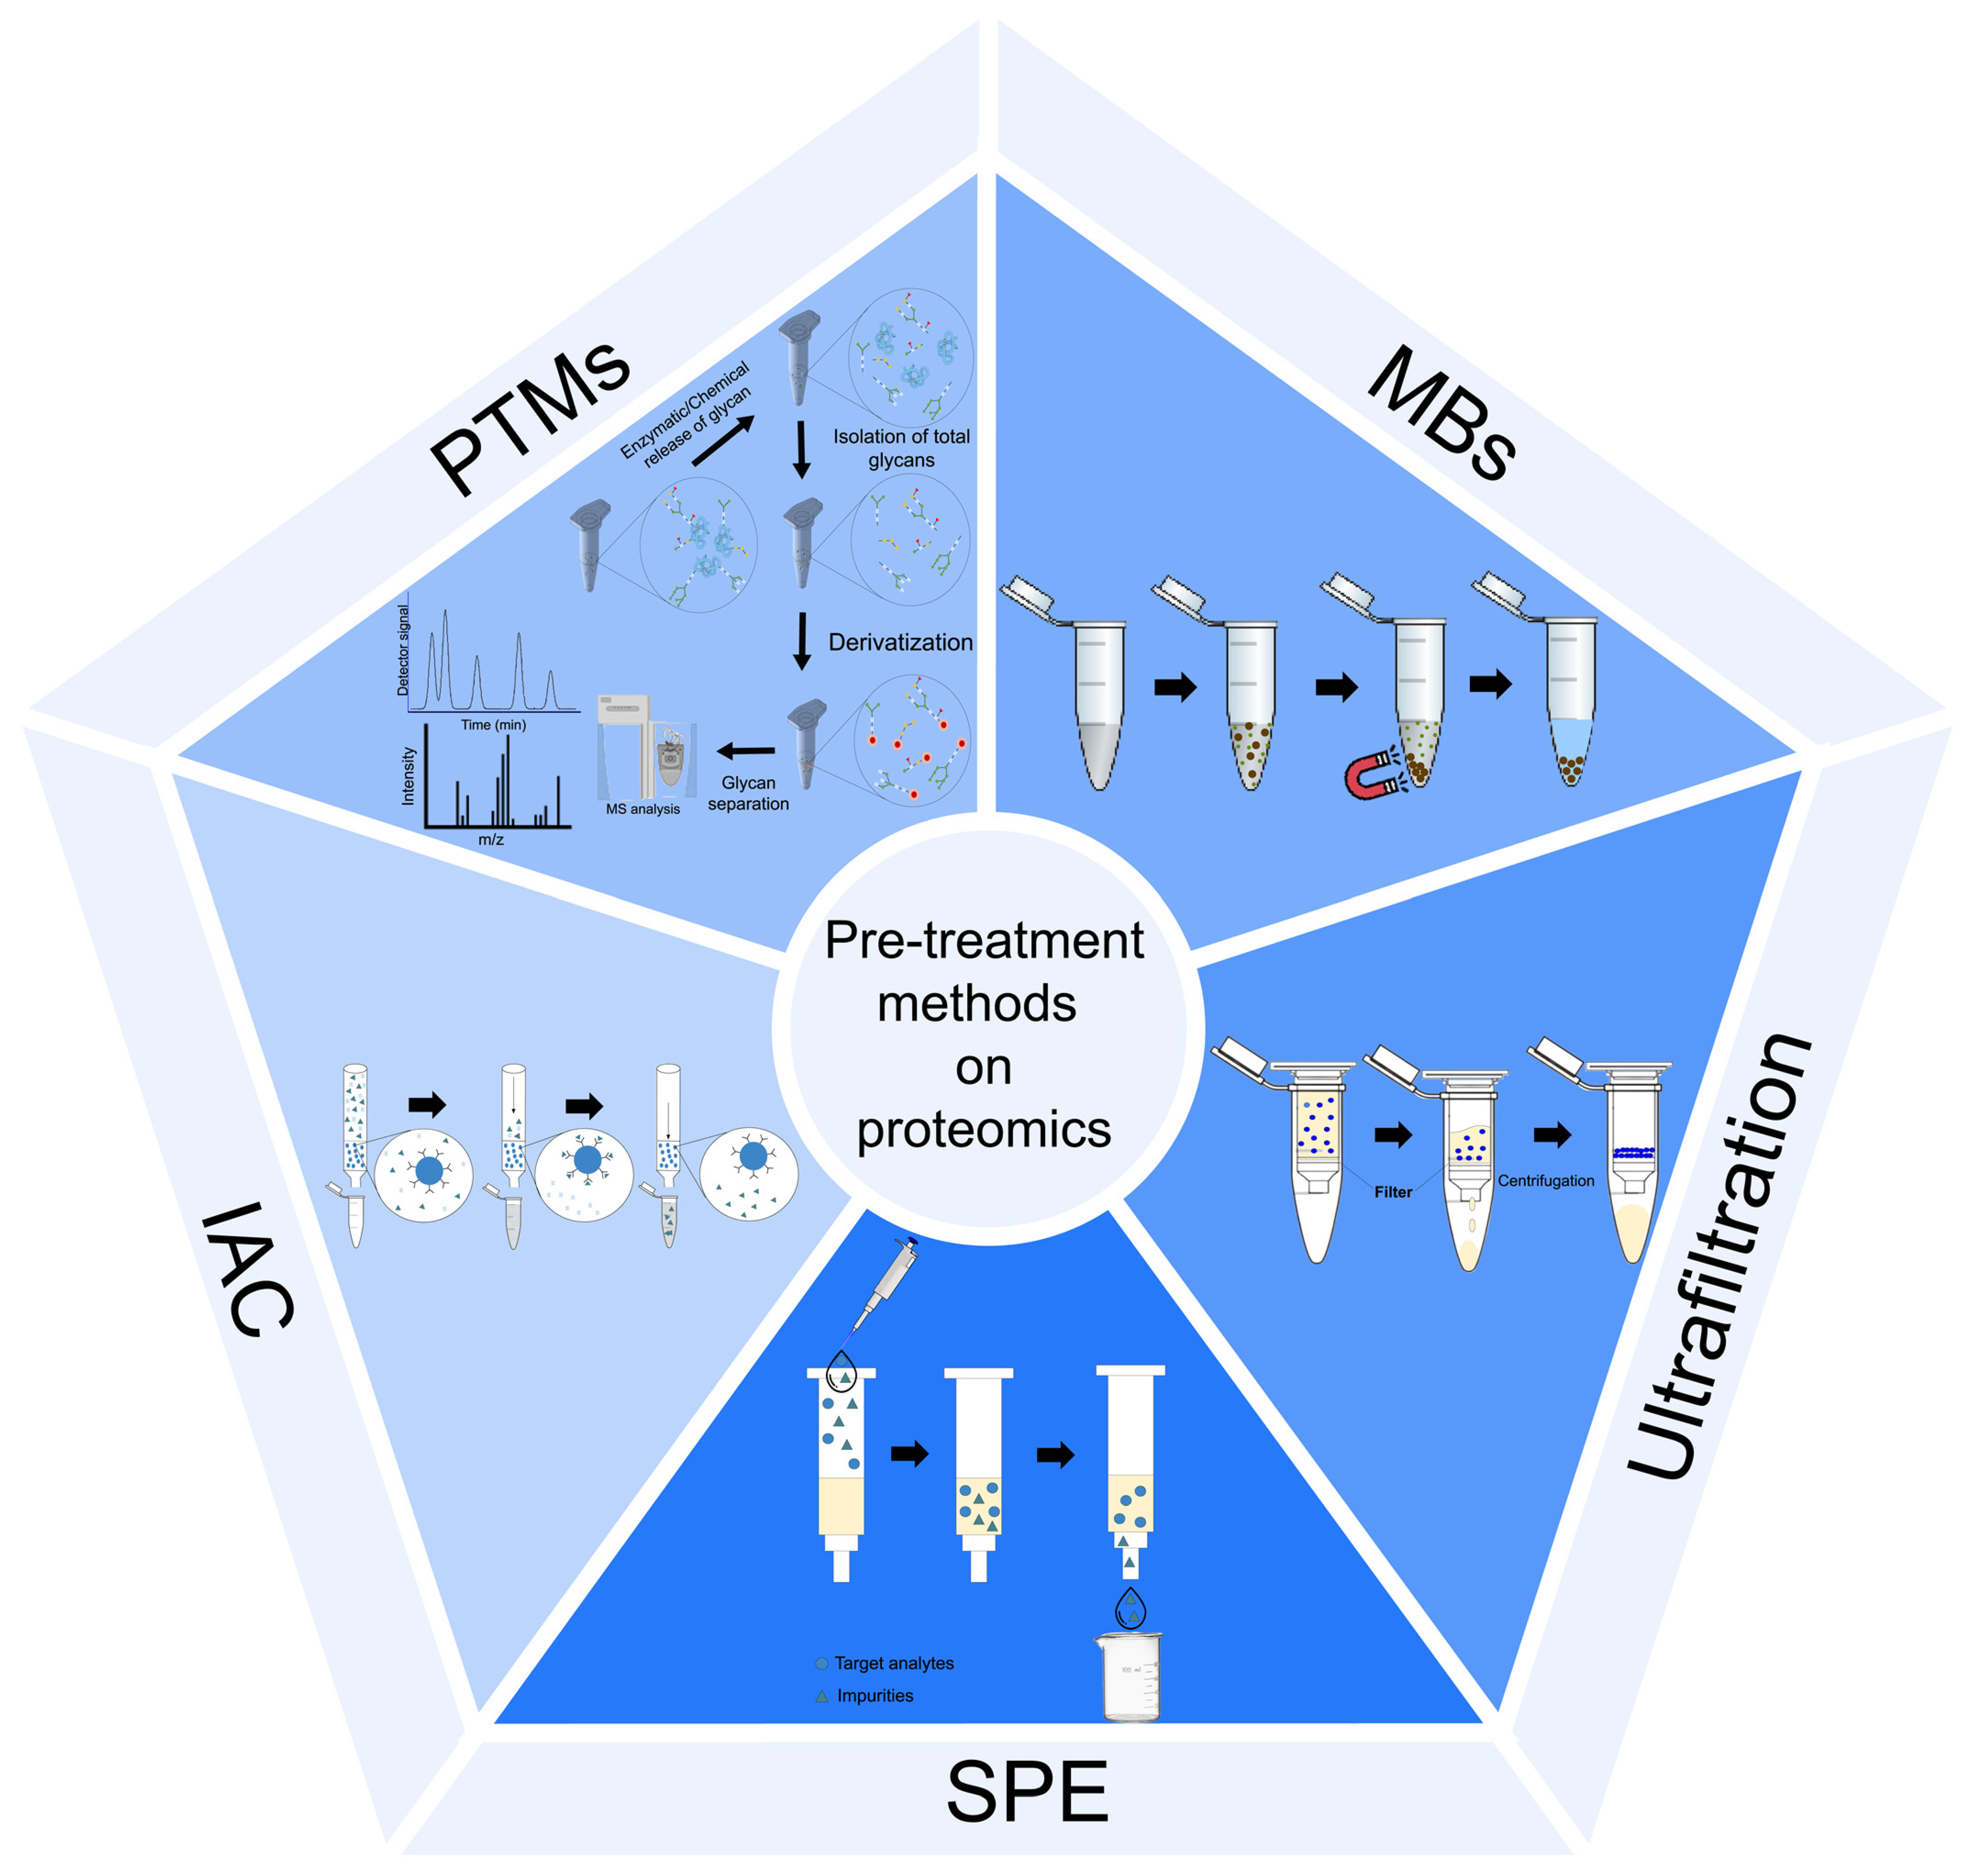
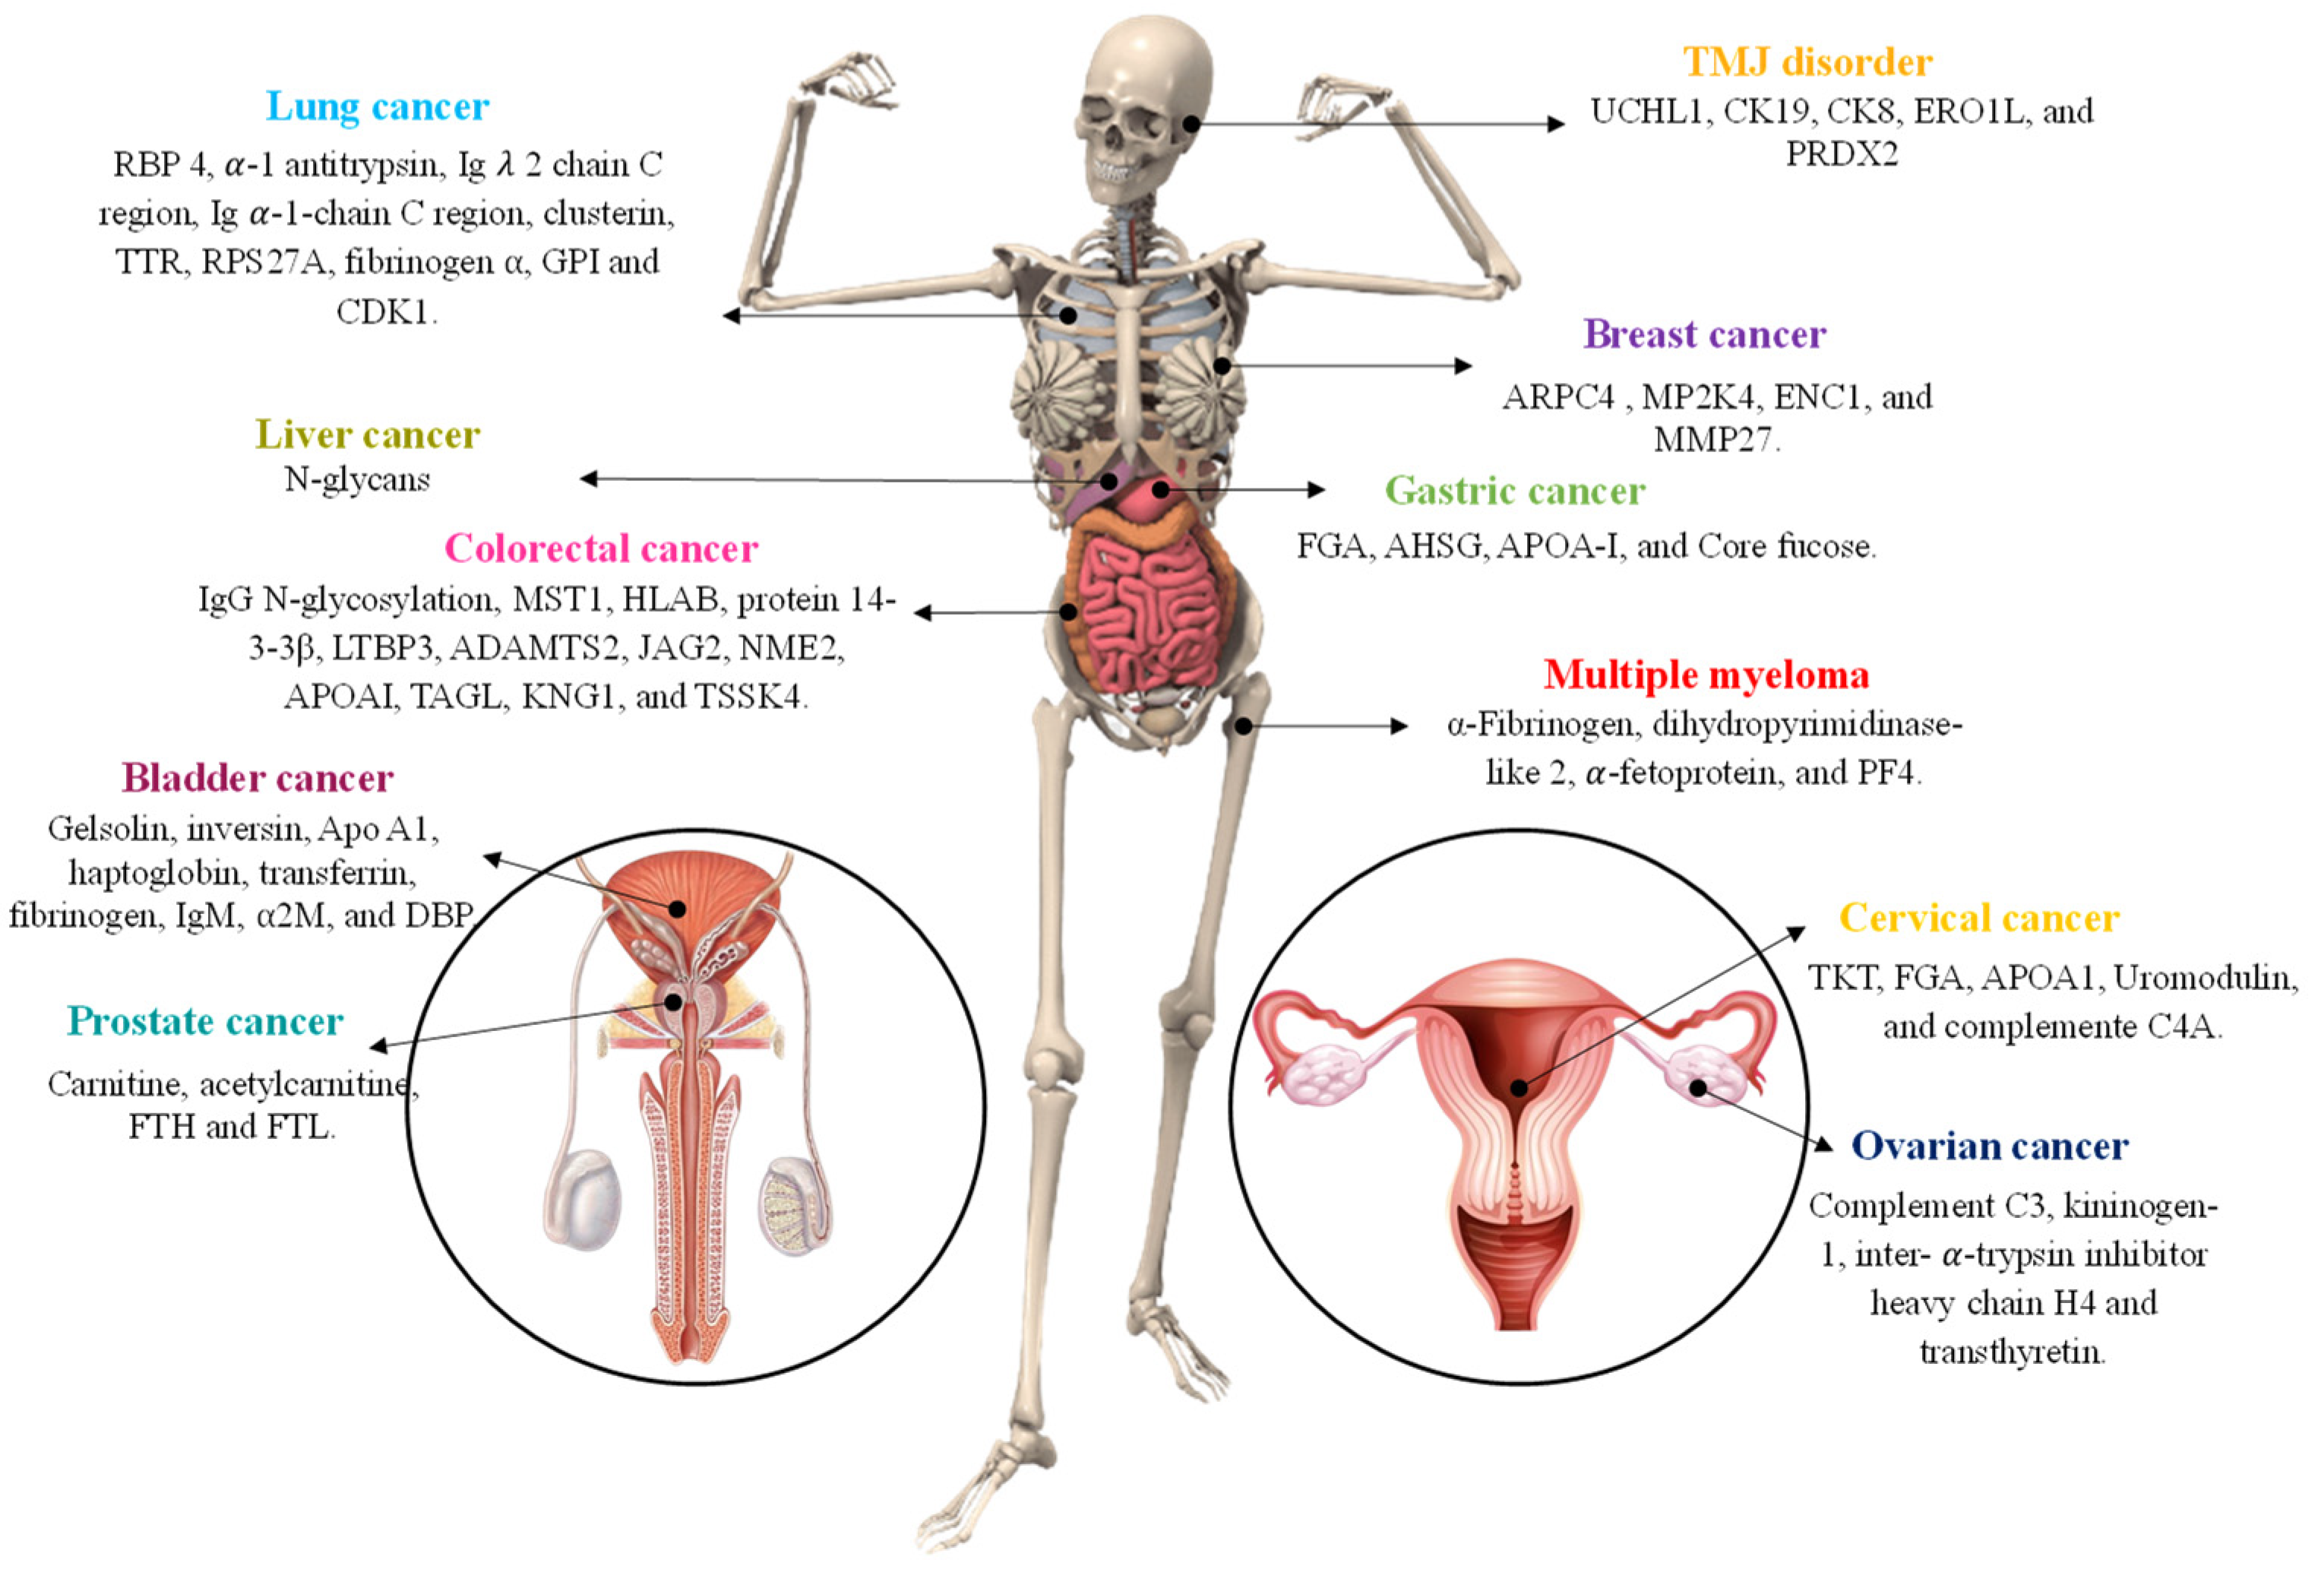
Table 1.
MALDI-TOF MS applications in cancer diagnosis.
| Pathology/Sample | Extraction Procedure | Matrix | Main Conclusions | References |
|---|---|---|---|---|
| Bladder cancer | ||||
| Plasma proteome | 2D-DIGE | HCCA |
| [20] |
| Plasma proteome | SDS-PAGE | HCCA |
| [31] |
| Serum peptidome | MB-WCX | HCCA |
| [32] |
| Urine glycoproteome | MNP@lectins | - |
| [33] |
| Breast cancer (BC) | ||||
| Plasma peptidome | MB-HIC8 | HCCA |
| [34] |
| Serum proteome | 2-DE | HCCA |
| [9] |
| Blood and serum N-glycans | SPE | DHB |
| [35] |
| Urine proteome/peptidome | SDS-PAGE | SA |
| [36] |
| Cervical cancer (CC) | ||||
| Cell lines proteome | 2DE | - |
| [37] |
| Cell lines proteome | 2D-DIGE | HCCA |
| [38] |
| Serum proteome | MB-WCX | HCCA |
| [39] |
| Colorectal cancer (CRC) | ||||
| Serum IgG N-glycome | MiniChromTM Pre-packed Columns with Eshmuno® | DHB |
| [40] |
| Serum proteome | MB-WCX | HCCA |
| [41] |
| Serum proteome | MB-WCX | HCCA |
| [42] |
| Tissue proteome | 2D-DIGE | HCCA |
| [19] |
| Tissue proteome | 2D-DIGE, µZip-TipC18 | HCCA |
| [43] |
| Gastric cancer (GC) | ||||
| Gastric cell lines proteome | 2-DE | HCCA |
| [44] |
| Serum peptidome | MB-IMAC-Cu | HCCA |
| [45] |
| Serum glycoproteome | HILIC SPE | DHB |
| [46] |
| Liver cancer | ||||
| Salivary N-glycome | SPE–C18 | DHB |
| [47] |
| Serum proteome | Samples diluted with H2O and direct application | HCCA |
| [48] |
| Serum proteome | MB-WCX | - |
| [49] |
| Serum proteome | MB-WCX | HCCA |
| [50] |
| Serum proteome | Direct application | - |
| [51] |
| Lung cancer | ||||
| Cell lines proteome | 2D-DIGE | HCCA |
| [52] |
| Cell lines proteome | Ultracentrifugation | DHB, SA |
| [25] |
| Plasma proteome | 2D-SDS-PAGE | HCCA |
| [53] |
| Pleural effusion (PE) and malignant pleural effusion (MPE) peptidome profile | MB-WCX | HCCA |
| [23] |
| Serum proteome | MB-WCX | HCCA |
| [24] |
| Serum peptidome | MB-WCX | HCCA |
| [54] |
| Serum and urine peptidome | SPE-MBs | HCCA |
| [55] |
| Ovarian cancer (OC) | ||||
| Plasma proteome | MagSi-Proteomics C8 beads | HCCA |
| [16] |
| Serum proteome | ZipTip C18 with ACN and 0.1% TFA | HCCA |
| [17] |
| Serum proteome | Samples diluted with H2O (1:80 v/v) and direct application | SA |
| [56] |
| Prostate cancer (PCa) | ||||
| Tissue proteome | Direct | DHB |
| [57] |
| Serum proteome/peptidome | HICNPs | HCCA |
| [58] |
| Urine and serum peptidome | ACN and re-suspension in 0.1% TFA | HCCA |
| [22] |
| Urine proteome | 2DE | - |
| [59] |
| Other cancers | ||||
| Cell lines proteome | Centrifugation (75% ethanol, 70% formic acid, 100% ACN) | HCCA |
| [29] |
| Cell lines proteome | Centrifugation (75% ethanol, 70% formic acid, 100% ACN) | HCCA |
| [21] |
| Plasma exosomes | SSEC (consisting of Mini-SEC and HPL-SEC) | HCCA |
| [60] |
| Urine proteome | ZipTip C18 | HCCA |
| [61] |
| Salivary proteome | Centrifugation | HCCA |
| [30] |
| Serum peptidome | MB-WCX | - |
| [18] |
Abbreviations: 2D-DIGE—two-dimensional difference gel electrophoresis; 2-DE—two-dimensional gel electrophoresis; ACN—acetonitrile; DHB—2,5-dihydroxybenzoic acid; GTN—gestational trophoblastic disease; HCCA—α-cyano-4-hydroxycinnamic acid; HCs—healthy controls; HICNPs—hydrophilic interaction chromatography nanoparticles; MB-HIC8—hydrophobic interaction chromatography magnetic beads; MB-IMAC-Cu—magnetic beads-based immobilized metal-ion affinity chromatography; MB-WCX—weak cation exchange magnetic beads; MM—multiple myeloma; NH4HCO3—ammonium bicarbonate; SA—3,5-dimethoxy-4-hydroxycinnamic acid; SSEC—sequential size-exclusion chromatography; TFA—trifluoroacetic acid; TMDs—temporomandibular joint disorders; (-)—information not available.
| MS/MS | MALDI-TOF MS | |
|---|---|---|
| Sample | Liquid form | Solid form and/or liquid form to dry on plate |
| Sample pre-treatment | Requires more extensive sample pre-treatment/clean-up | Minimal sample pre-treatment |
| Separation/fraction | Usually required an online or offline method | Not required |
| Molecules | Peptides | Proteins, large glycopeptides, oligonucleotides |
| Ionization | Soft ionization with solvent and electronebulization | Soft ionization with matrix |
| Fragmentation | Yes | No |
| Analyze time | Minutes or hours | 20–30 s |
| Quantification | Relative and/or absolute | Only relative |
| Data | Identification and characterization of peptides | Only provides putative m/z |
Disclaimer/Publisher’s Note: The statements, opinions and data contained in all publications are solely those of the individual author(s) and contributor(s) and not of MDPI and/or the editor(s). MDPI and/or the editor(s) disclaim responsibility for any injury to people or property resulting from any ideas, methods, instructions or products referred to in the content. |
© 2023 by the authors. Licensee MDPI, Basel, Switzerland. This article is an open access article distributed under the terms and conditions of the Creative Commons Attribution (CC BY) license (https://creativecommons.org/licenses/by/4.0/).
Share and Cite
MDPI and ACS Style
Sousa, P.; Silva, L.; Luís, C.; Câmara, J.S.; Perestrelo, R. MALDI-TOF MS: A Promising Analytical Approach to Cancer Diagnostics and Monitoring. Separations 2023, 10, 453. https://doi.org/10.3390/separations10080453
AMA Style
Sousa P, Silva L, Luís C, Câmara JS, Perestrelo R. MALDI-TOF MS: A Promising Analytical Approach to Cancer Diagnostics and Monitoring. Separations. 2023; 10(8):453. https://doi.org/10.3390/separations10080453
Chicago/Turabian StyleSousa, Patrícia, Laurentina Silva, Catarina Luís, José S. Câmara, and Rosa Perestrelo. 2023. "MALDI-TOF MS: A Promising Analytical Approach to Cancer Diagnostics and Monitoring" Separations 10, no. 8: 453. https://doi.org/10.3390/separations10080453
Note that from the first issue of 2016, this journal uses article numbers instead of page numbers. See further details here.