
Mass Transfer and Droplet Behaviors in Liquid-Liquid Extraction Process Based on Multi-Scale Perspective: A Review

1
State Key Laboratory of Chemical Engineering, Department of Chemical Engineering, Tsinghua University, Beijing 100084, China
2
Institute of Nuclear and New Energy Technology, Tsinghua University, Beijing 100084, China
*
Authors to whom correspondence should be addressed.
Separations 2023, 10(4), 264; https://doi.org/10.3390/separations10040264
Submission received: 9 March 2023
/
Revised: 31 March 2023
/
Accepted: 17 April 2023
/
Published: 18 April 2023
(This article belongs to the Special Issue Advances in Separation Engineering)
Abstract
:Liquid-liquid extraction is an important separation technology in the chemical industry, and its separation efficiency depends on thermodynamics (two-phase equilibrium), hydrodynamics (two-phase mixing and contact), and mass transfer (molecular diffusion). For hydrodynamics, the dispersion size of droplets reflects the mixing of two phases and determines the mass transfer contact area of the two phases. Therefore, a deep understanding of the droplet dispersion mechanism can help guide process intensification. The mass transfer and droplet behaviors in the liquid-liquid extraction process are reviewed based on three scales: equipment, droplets, and the interface between two liquids. Studies on the interaction between mass transfer and other performance parameters in extraction equipment as well as liquid-liquid two-phase flow models are reviewed at the equipment scale. The behaviors of droplet breakage and coalescence and the kernel function of the population balance equation are reviewed at the droplet scale. Studies on dynamic interfacial tension and interaction between interfaces are reviewed at the interface scale. Finally, the connection among each scale is summarized, the existing problems are analyzed, and some future research directions are proposed in the last section.
1. Introduction
Generally speaking, extraction is a process of enriching the components to be separated into a solvent. It mainly includes liquid-liquid systems and liquid-solid systems. As an important and widely used separation technology, liquid-liquid extraction can make up for the shortcomings of distillation in the separation of azetropes, high-boiling components, non-volatiles, and heat-sensitive materials. Liquid-liquid extraction is widely used in the extraction of uranium and plutonium from nuclear fuels [1], penicillin extraction [2], hydrometallurgy [3], aromatic extraction [4] and solvent deasphalting [5]. In recent years, liquid-liquid extraction has also played an important role in lithium-ion battery recycling [6], lignin separation [7], and natural medicine extraction [8]. In addition, with increasing awareness of the green chemistry concept, green solvents such as supercritical fluids [9], ionic liquids [10], and deep eutectic mixtures [10] are attracting more attention in research.
An extractor is a type of mass transfer equipment in which the extractant contacts with the feed so that the target solute in the feed is sufficiently extracted by the extractant. In some extraction processes, such as co-current or counter-current microflow extraction [11] and membrane contactor extraction [12], two liquids contact each other without phase dispersion, while in some other extraction processes, one liquid is dispersed into the other liquid in form of droplets. Three kinds of traditional extractors, i.e., mixer-settler [13], extraction column [14], and centrifugal extractor [15], are widely used in the chemical industry. In addition, microflow extraction devices [16] have emerged in recent years, along with the development of micro-chemical technology. Mass transfer performance is significantly enhanced by using micro-dispersion and micro-mixing technology. For example, Taylor flow is an important micro-dispersion method for mass transfer process intensification because of the internal circulation of slugs and plugs [17,18,19].
Essentially, liquid-liquid extraction is a liquid-liquid two-phase mass transfer process across the interface, and it is a complex system involving three scales: equipment, droplets, and the interface. The hydrodynamic performance and mass transfer performance at the equipment scale are largely determined by the behaviors of the dispersed phase at the droplet scale, including breakage, coalescence, deformation, and the internal and external circulation of the droplet. Furthermore, droplet behaviors are closely related to interface properties, such as the interfacial tension. Mass transfer is a dynamic process that causes the composition of the two phases to change continually, changing interfacial tension and affecting droplet behaviors. Therefore, it is extremely important to analyze the effect of mass transfer on interfacial tension and droplet behaviors.
This article is organized as follows: Firstly, the research on hydrodynamic performance parameters and mass transfer performance parameters in extraction equipment is reviewed at the equipment scale, including the influence of mass transfer direction on droplet size, hold-up, flooding velocity, axial dispersion coefficient, and mass transfer coefficient. Meanwhile, two-phase flow models are also introduced. Secondly, the research on droplet breakage and coalescence behaviors is reviewed, including the influence of mass transfer on droplet behaviors. Further focusing on the interface scale, the research on dynamic interfacial tension and force between interfaces, as well as the research methods for measuring the force between droplets and liquid film thickness, are summarized for better understanding the relation between interfacial phenomena and droplet behaviors. Finally, based on the research of the above three scales, the existing problems are discussed, and some future research directions are suggested.
2. Equipment Scale
The important performance parameters of the extractor include hydrodynamic performance parameters and mass transfer performance parameters. From hydrodynamic performance parameters, information such as the operating range (flow ratio, flux, external energy input intensity, etc.) and the diameter of column equipment can be calculated from hydrodynamic parameters. Hydrodynamic parameters mainly include Sauter mean diameter d32, hold-up φ, and flooding velocity uf. Information such as the mass transfer efficiency and the height of column equipment can be calculated from mass transfer performance parameters. Mass transfer performance parameters mainly include axial dispersion coefficient Ec and mass transfer coefficient K. Here, each performance parameter will be introduced with an extraction column as an example.
The Sauter mean diameter is the average of the volume-to-surface area ratio, as shown in Equation (1), which is widely used to calculate the average size of bubbles [20], droplets [21], and particles [22]. The Sauter mean diameter can be used to calculate two-phase momentum transfer and two-phase contact area. Therefore, researchers carried out experimental measurements and established empirical correlations for droplet Sauter mean diameter. Hinze [23] preliminarily explored the mechanism of breakage between dispersed phase and fluid and gave a method to calculate the Sauter mean diameter of the dispersed phase. When the viscosity of the dispersed phase is low, the Sauter mean diameter of the droplet is mainly dominated by turbulent kinetic energy, continuous phase density, and interfacial tension, as shown in Equation (2). Subsequently, researchers [24,25,26,27,28] also studied other factors such as physical properties of the dispersed phase, energy input intensity, and two-phase flow rate and concluded that the physical parameters, operating parameters, geometric parameters, wettability of equipment internals, and mass transfer were important factors affecting the Sauter mean diameter in an extraction column. Rohlfing et al. [29] analyzed the effect of mass transfer on the Sauter mean diameter of a droplet in the n-butylacetate-water-acetone system. For the c→d mass transfer, the Sauter mean diameter was not sensitive to the mass transfer flux. For the d→c mass transfer, the size of the Sauter mean diameter was larger and went up with the increase of the mass transfer flux. In addition, the Sauter mean diameter of the c→d mass transfer is smaller than that of the d→c mass transfer. They believed that the mass transfer direction changed the droplet coalescence behaviors by influencing the process of liquid film drainage between droplets.
Hold-up is the ratio of dispersed phase volume to the total volume of two phases under stable operating conditions. Hold-up can reflect the operating performance and processing capacity of equipment. Kumar and Hartland [30] summarized the experiment data of eight kinds of extraction columns and proposed a general correlation. The correlation was suitable for calculating the hold-up in the dispersion region and the emulsification region, as expressed by Equation (3), where Π reflects the influence of energy input, Φ mainly reflects the influence of two-phase flow rate, Ω represents the influence of the physical properties of two phases, and Γ represents the influence of the geometric parameters of the extraction column. In addition, the slip velocity can be used to predict hold-up. The Pratt equation [31] first used the concept of slip velocity, and by deriving the relationship between slip velocity and characteristic velocity, a method of calculating the hold-up in the extraction column was obtained, as shown in Equation (4), where Vd and Vc represent the apparent flow velocity of the dispersed phase and the continuous phase, respectively. Vslip is the slip velocity, defined as the relative velocity between the two phases in the extraction column. V0 is the characteristic velocity, defined as the sedimentation velocity of dispersed phase droplets in a continuous phase when the apparent flow velocities of two phases approach zero. Tsouris et al. [32] studied the effect of mass transfer on droplet size distribution and hold-up and found that, compared with no mass transfer conditions, for the c→d mass transfer, the droplet size distribution was smaller and the hold-up was higher, and for the d→c mass transfer, the size distribution of the droplets was larger and the hold-up was lower. They believed that the former droplet swarm had a higher breakage rate, and the latter droplet swarm had a higher coalescence rate.
Flooding velocity is important for the design and performance calculations of the extraction column. Taking the packed extraction column as an example, the maximum processing capacity can be derived from the flooding velocity, while the required column diameter can be calculated from a given throughput. Summarizing a large number of the literature’s data, Kumar and Hartland [33] suggested a correlation that could be used to calculate the flooding velocity of the packed extraction column. However, most of the experiment data were acquired from high and medium interfacial tension systems with low porosity packing and an organic dispersed phase. Therefore, when the correlation was used in other systems, it usually had a large deviation and needed to be modified. Yu et al. [34] found that, compared with no mass transfer conditions, the flooding velocity under the mass transfer condition was higher, and the flooding velocity of the d→c mass transfer was higher than that of the c→d mass transfer.
In order to understand mass transfer problems in the column equipment, researchers have developed one-dimensional models, such as the plug flow model, the axial diffusion model, and the back-mixing stage model. The plug flow model has no axial mixing or diffusion, so it is also called the ideal flow model. Both the axial diffusion model and the back-mixing stage model take axial mixing into account. The former is in differential form, and the latter is in stage-wise form. The axial dispersion coefficient is an important parameter used to describe the degree that the true flow deviates from the ideal flow. For the dispersed phase, the deviation is caused by different residence times due to the different sizes of the droplets. For the continuous phase, deviation is due to axial mixing and axial dispersion. For the pulsed disc-and-doughnut extraction column, Jahya et al. [28] established the continuous phase axial dispersion coefficient correlation, considering the effect of two phases physical properties, equipment geometry, and operating conditions. Charton et al. [35] used a computational fluid dynamics (CFD) simulation to reexamine the available axial dispersion experiment data of the pulsed disc-and-doughnut column and derived a unified axial dispersion coefficient correlation. Panahinia et al. [36] conducted modeling and simulation in a horizontal pulsed sieve-plate extraction column. The systems used in the simulation were benzene-acetone-water and butylacetate-acetone-water, and the simulation results of both systems showed that the c→d mass transfer led to a higher axial dispersion coefficient.
The mass transfer coefficient is an important parameter to describe the mass transfer rate across interfaces, which is generally related to the operating parameters, physical properties, and hydrodynamic performance parameters. Classical models for calculating the mass transfer coefficient include the two-film theory [37], the percolation theory [38], and the surface renewal theory [39]. Based on the mass transfer experiment results of the droplet swarm, Kumar and Hartland [40] proposed correlations to predict the continuous phase Sherwood number, Shc, and the dispersed phase Sherwood number, Shd. By applying certain physical property parameters, operating parameters, and hydrodynamic parameters, the continuous phase mass transfer coefficient kc, and the dispersed phase mass transfer coefficient kd, were obtained, and finally the mass transfer coefficient could be calculated by the two-film theory, as shown in Equation (5), where M is the equilibrium distribution coefficient. In addition, some studies showed that mass transfer direction has a significant effect on the mass transfer coefficient. Torab-Mostaedi et al. [41] found that the coefficient of the d→c mass transfer was higher than that of the c→d mass transfer under certain conditions. Asadollahzadeh et al. [42] also found that the coefficient of the d→c mass transfer was much higher in a pilot scale extraction column. For a preliminary analysis, the d→c mass transfer promotes droplet coalescence and leads to a decrease in the interface area. The deceased interface area is not good for improving mass transfer performance. With regard to the experiment results of Asadollahzadeh et al. [42], it indicates that there are other factors that contribute to the improvement of the mass transfer coefficient. In Table 1, the effect of mass transfer on the performance parameters mentioned above is summarized.
From the studies above, it is clear that the hydrodynamic parameters are closely related to the mass transfer performance of the equipment. Enhancing the mass transfer requires a deep understanding of the flow dynamics and mixing behaviors of the two phases. Although the axial dispersion model and the back-mixing stage model both consider the non-ideality of flow, these two models homogenize the droplet size instead of considering the droplet size distribution. In addition, one-dimensional models do not include information related to other dimensions. Therefore, for further understanding of the two-phase flow in equipment, it is important to obtain the 3D spatial and temporal distribution of parameters such as velocity, concentration, droplet size, etc.
Two-phase flow simulations are divided into two main categories [43]: a “real” simulation that focuses on the shape and deformation of two-phase interfaces and a simplified simulation that ignores interface shape information. Free-interface simulation methods such as VOF and level-set belong to “real” simulation, which requires a mesh size much smaller than the droplet size. But limited by computation load, it is mainly used to calculate two-phase flow in a small volume, such as the generation, deformation, breakage, and coalescence of a small number of droplets. For large-scale geometry such as an extraction column, the calculation area size is much larger than the droplet size, and considering the limitation of calculation capacity, further simplification methods are required, ignoring some highly complex information of the droplets. In a simplified simulation, the Euler-Euler model assumes that the dispersed phase is quasi-continuous, the two phases are described by separate N-S equations and mass transfer equations, and the two sets of equations are solved simultaneously through the momentum exchange and mass exchange between the two phases. The retained characteristic parameter of the dispersed phase in the Euler-Euler model is only d32, but d32 cannot replace the droplet size distribution equivalently because the same d32 can correspond to a variety of droplet size distributions. To obtain the droplet size distribution, the population balance model (PBM) is introduced.
PBM originated from describing population dynamic balance and was later extended to describe groups with common characteristics. For liquid-liquid extraction systems, PBM is used to study dispersed phase droplets. PBM plays an important role in dealing with droplet swarms by predicting droplet size distribution. In addition, PBM is an infinitely extensible model [43]. Theoretically, PBM can describe the entire dispersion system by continuously adding droplet characteristic parameters to approach a “real” model. Due to the limited computation load, PBM usually calculates only one or two key characteristic parameters. According to the number of characteristic parameters, PBM can be divided into the Euler-Euler model (null-element population balance model), the unary population balance model, and the binary population balance model, as shown in Table 2.
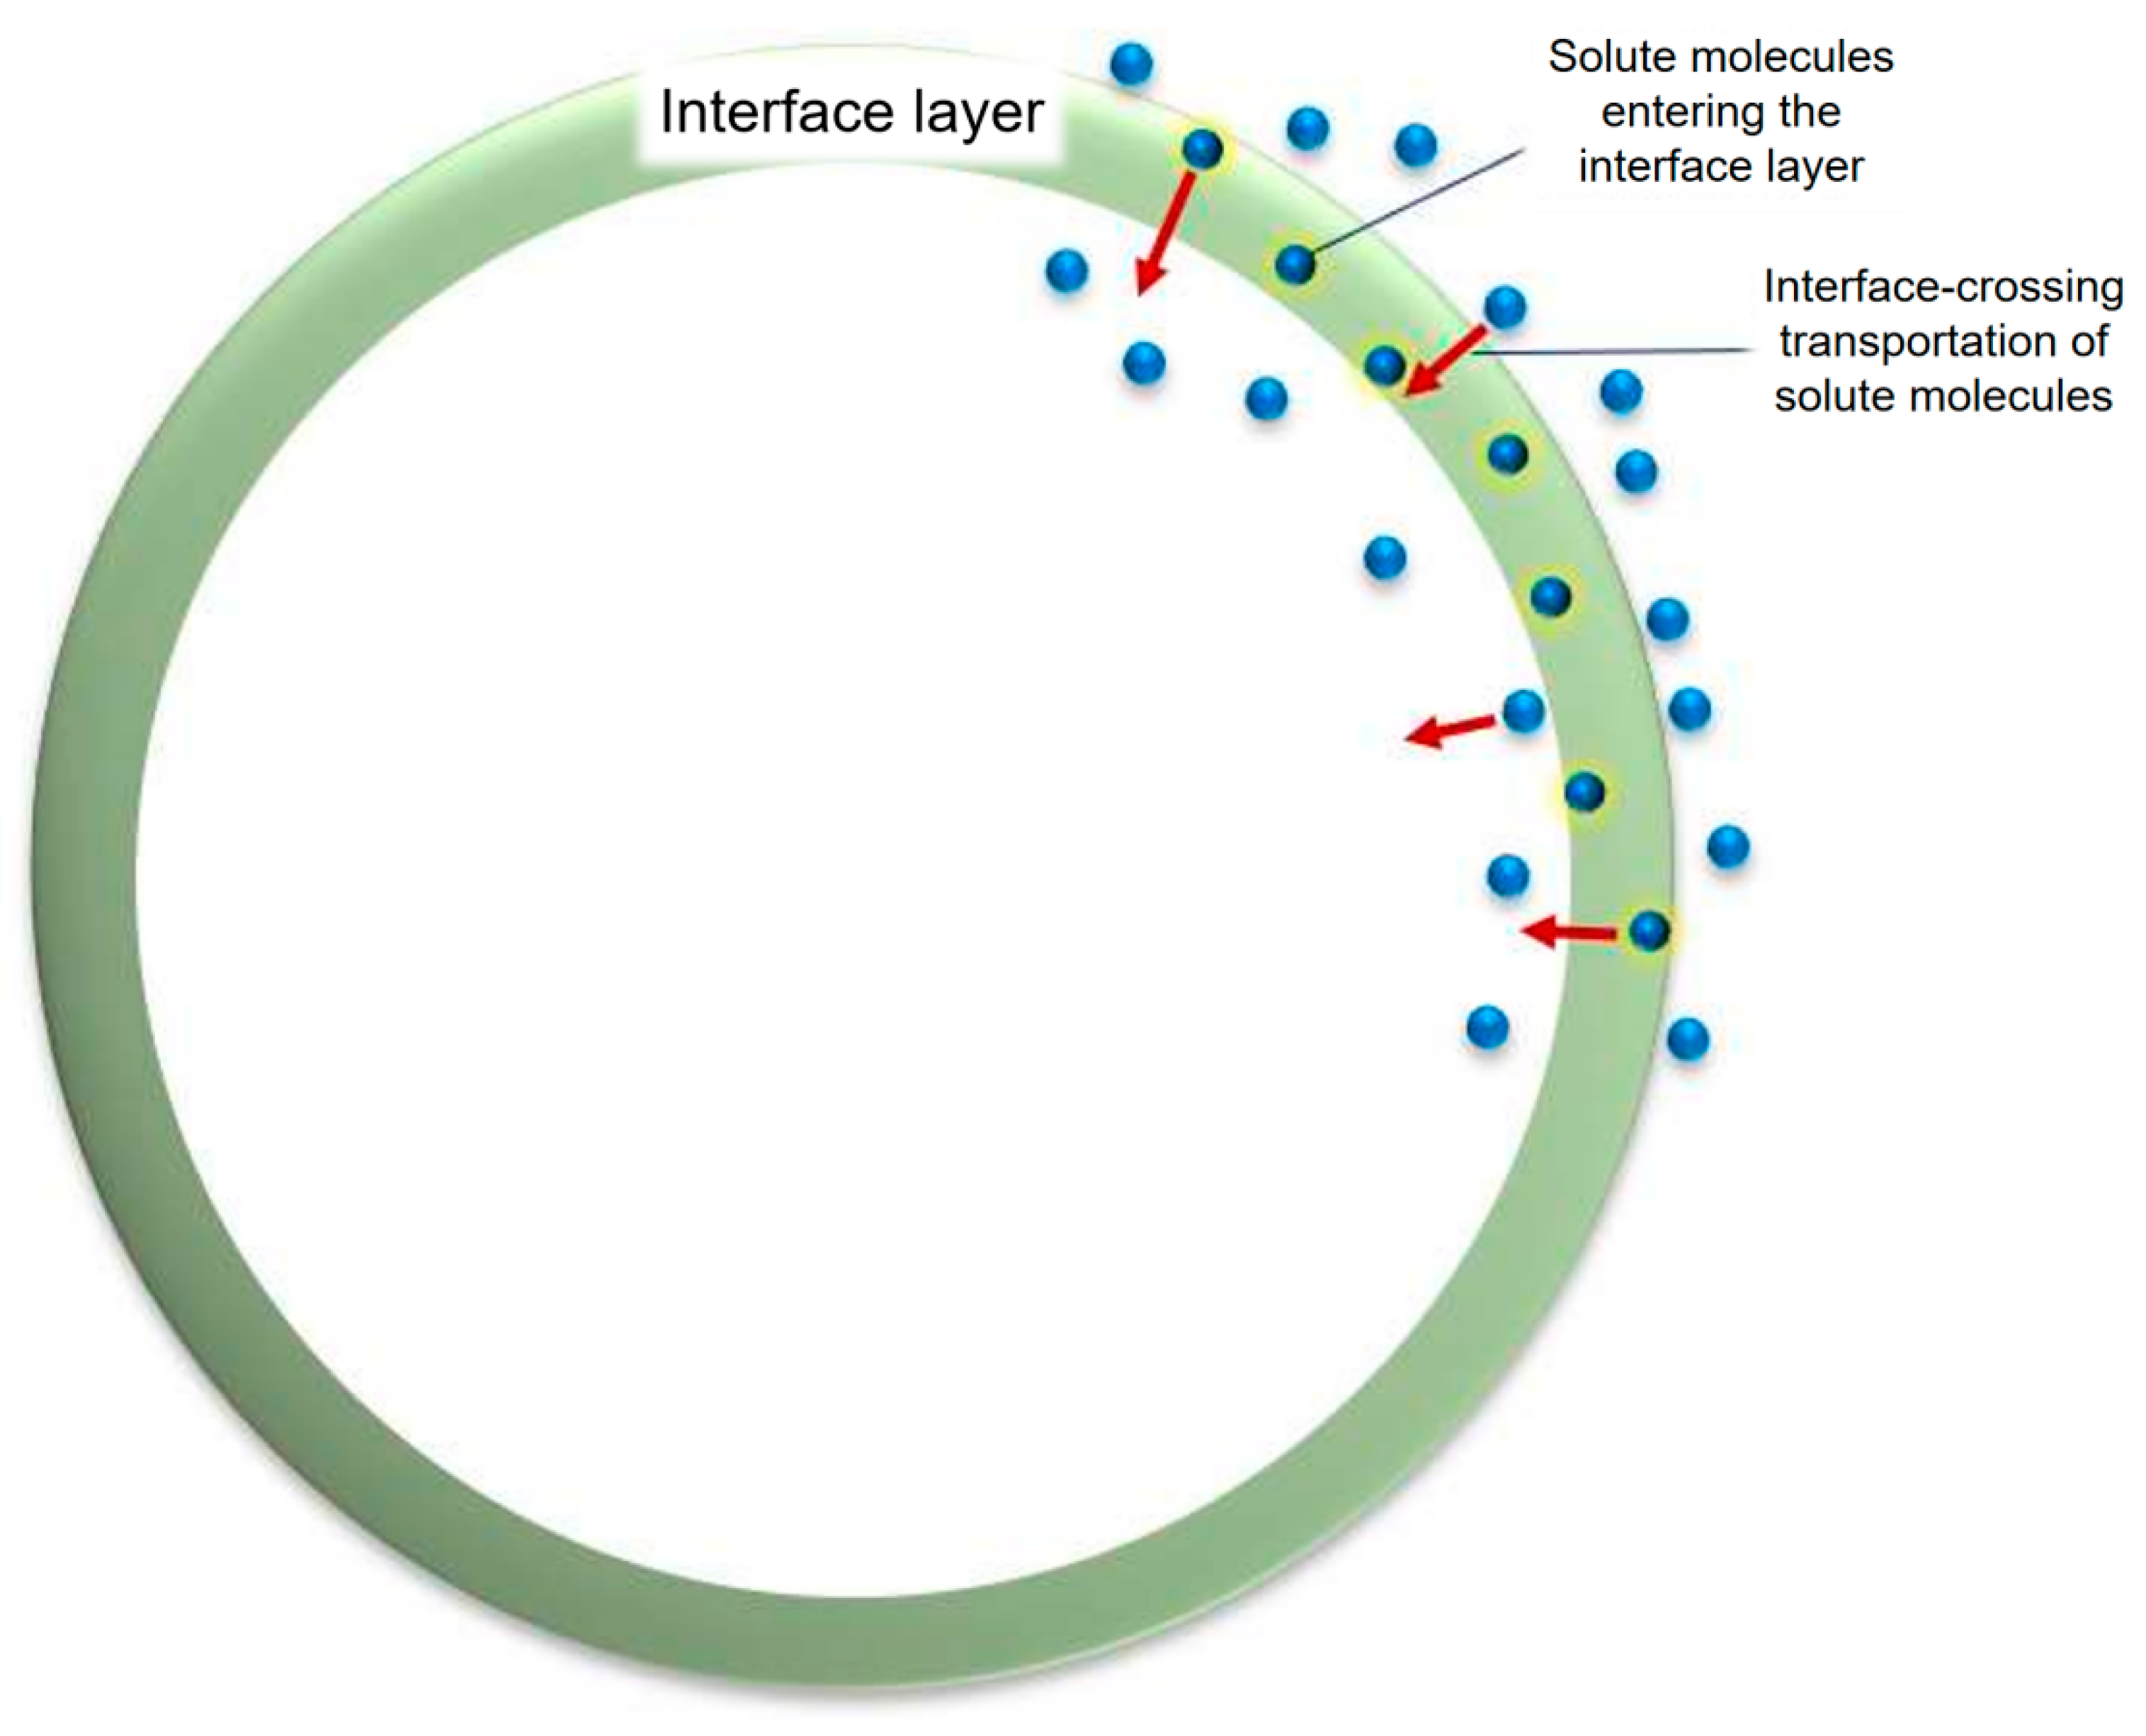
The core of PBM is the population balance equation (PBE), as shown in Equation (6). Its four terms, from left to right, are unsteady term, convection term, diffusion term, and source term. The source term is mainly determined by droplet breakage and coalescence processes, so the source term can be expressed as the sum of the breakage source term (Sb) and the coalescence source term (Sc), as shown in Equation (7). Since both the breakage and coalescence processes involve the disappearance and generation of droplets, Sb and Sc can be expressed as the difference between the generation source term and the disappearance source term, as shown in Equation (8). The expressions for generation and disappearance of source items are shown in Equations (9)–(12). Three kernel functions are involved in these source terms: the breakage frequency function (b (r, d′)), the coalescence frequency function (h (d, d′)), and the daughter droplet size distribution function (β (d, d′)). In addition, if the dispersed phase has good wettability on the equipment internals and forms a liquid layer on the surface, the dispersed phase has some other behaviors in addition to droplet breakage and coalescence, as shown in Figure 1 [44], so it is not accurate to describe the system only with these two behaviors. Fang [45] considered other behaviors of the dispersed phase and expanded the four-source term to the seven-source term, and the result showed that the simulation of the pulsed disc-and-doughnut column could be significantly improved by using the seven-source term [46], as shown in Figure 2.
By coupling CFD with PBM, researchers studied the two-phase flow of a variety of extractors. Some of these studies are summarized in Table 3. Drumm et al. [47] carried out CFD-PBM simulation in the rotating disc column, and the hold-up and velocity field were in good agreement with the experimental values. Mirzaie et al. [48] carried out CFD-PBM simulation in the pulsed packing column, and the results were good for predicting the hydrodynamic characteristics of the column. Amokrane et al. [49] used the CFD-PBM method to calculate the Sauter mean diameter and hold-up of dispersed phase droplets in the pulsed disc-and-doughnut column. They compared and analyzed the calculation results of different kernel functions, showing that the CFD-PBM method can effectively describe the hydrodynamic performance of the two phases, and they also found that if the default constants of the widely used kernel functions were not adjusted, unrealistic results may occur. Li’s group applied the directly measured breakage kernel functions to the CFD-PBM simulation, and successfully predicted the hydrodynamic performance of a pulsed disc-and-doughnut column [50] and a pump-mixer [51]. Recent research has verified the feasibility of the CFD-PBM method to simulate liquid-liquid two-phase flow performance at the equipment scale. However, the simulation results depend on the accuracy of the kernel functions of PBM. Therefore, it is critical to build and verify accurate PBM kernel functions.
To summarize, it can be seen that droplet size distribution is one of the key parameters used to determine mass transfer area and the overall extraction performance at the equipment scale. Mass transfer, in turn, influences the drop size distribution by affecting droplet interactions such as breakage and coalescence. Therefore, detailed studies focusing on the droplet scale and a deep understanding of droplet breakage and coalescence are needed.
3. Droplet Scale
In early studies, although the droplet size distribution of the droplet swarm was studied, it was difficult to study droplet behaviors in detail [32]. Therefore, to analyze the relationship between droplet size distribution and droplet behaviors, researchers carried out single-droplet experiments in extractors to facilitate the observation of droplet behaviors. Bahmanya et al. [52] carried out a single droplet experiment in a rotating disc column with no mass transfer and constructed an empirical correlation between droplet size and critical rotor speed with Reynolds number and Weber number. Then they [53] studied the effect of mass transfer on droplet breakage and used the correlation they established before to derive the effective interfacial tension with mass transfer. The effective interfacial tension could be used in the empirical correlation derived from the no mass transfer condition, and finally obtained the droplet breakage probability under the mass transfer condition. Cauwenberg et al. [54,55] studied the single-droplet breakage process in the rotating disc column and examined the breakage probability and daughter droplet size distribution, including non-mass transfer systems, mass transfer systems (d→c and c→d), and surfactant-containing systems. Based on the modified Weber number, a breakage probability model associated with interfacial tension and shear stress was established. In addition, they established an equation for predicting dynamic interfacial tension under mass transfer conditions and combined this equation with a breakage probability model to achieve the calculation of droplet size distribution at each stage.
The early single-droplet experiment studies in extractors further showed that mass transfer could affect droplet behaviors by changing the interfacial tension, but many conditions of these experiments were quite different from the real operating conditions of a droplet swarm. In addition, due to limited observation technology, it was difficult to measure parameters such as breakage time in the kernel function. Therefore, it is necessary to combine new research methods to analyze the behaviors of droplet breakage and droplet coalescence as well as the influence of mass transfer on these behaviors.
3.1. Droplet Breakage
Droplet breakage is the process where droplets deform under the effect of an external force and then split. Droplet breakage is mainly determined by three forces: (1) the external force of the continuous phase; (2) the interfacial tension of the droplet; and (3) the viscous force inside the droplet. The first force deforms and breaks the droplet, and the latter two forces inhibit the deformation and breakage, maintaining the shape of the droplet. In addition to the study of droplet breakage in macroscopic equipment, droplet dispersion in microchannels is an important way to help understand droplet breakage because of its similarity with droplet breakage mechanisms and good experimental repeatability. Therefore, the study of droplet breakage behaviors can be divided into two categories: (1) controllable microchannel droplet dispersion (micro-dispersion) research with limited area; and (2) macroscopic equipment research with droplet breakage kernel function as the core of the study.
Physical properties affecting the micro-dispersion process are mainly the viscosity of the two phases and the interfacial tension between the two phases. Xu et al. [56] found that in a T-junction microchannel, the droplet size decreases with the increase in continuous phase viscosity. Steegmans et al. [57] found that in a Y-junction microchannel, the viscosity of the dispersed phase has almost no effect on the droplet size. Xu et al. [58] found that during the generation of droplets from a micrometer screen hole, the size of the droplets increased with the increase of interfacial tension. From the effect of physical properties, it can be seen that in the micro-dispersion process, the viscous force of the dispersed phase is quite weak compared with the interfacial tension. Therefore, the viscous force of the dispersed phase has little effect on the dispersion size. In addition to the dispersion mechanism of microchannel droplets, researchers used microchannel devices to measure equilibrium interfacial tension by force balance [59] and pressure drop analysis [60].
Among the physical properties that affect the dispersion of droplets, interfacial tension is most influenced by mass transfer and continuously changes during the mass transfer process. With advantages of good controllability and repeatability, microchannels are helpful to observe droplet dispersion state. Therefore, based on equilibrium interfacial tension measurement, researchers carried out dynamic interfacial tension measurement and droplet dispersion behavior analysis under mass transfer conditions. Mass transfer can be mainly divided into two types: (1) interfacial adsorption mass transfer of surfactant; (2) interface-crossing mass transfer of ordinary solutes.
For interfacial adsorption mass transfer of surfactants, researchers have developed a variety of methods for measuring dynamic interfacial tension: (1) using the relationship between dispersion size and interfacial tension [61]; (2) using the pressure variation of the droplet generation process [62]; (3) using the deformation when droplets pass through suddenly enlarged and contracted microchannels [63]; (4) using the transition process between drop flow and jet flow [64]. For the effect of surfactant interfacial adsorption mass transfer on droplet dispersion, Wang et al. [61] found that surfactants decreased the interfacial tension, making the droplet dispersion size smaller, which meant the droplets were more likely to be dispersed.
For the interface-crossing mass transfer of ordinary solutes, Li et al. [65] used the reaction of H2SO4 and BaCl2 to form BaSO4 in microchannel two-phase flow as a probe to characterize the microscale two-phase flow and transport conditions of a system with both interface-crossing mass transfer and reaction. It was found that mass transfer and chemical reaction could significantly affect the interfacial tension and flow pattern of the system, and the dispersed phase flow pattern transited between drop flow and plug flow according to different mass transfer and reaction rates. Lan et al. [66] studied a micro-dispersion process with solute interface-crossing mass transfer (d→c) in a coaxial microchannel, and investigated the dispersion size of droplets and the transient interfacial tension of the whole process of droplet generation, observing that the interfacial tension changed in the mass transfer process. Different from the system with constant interfacial tension, the dispersion diameter of droplets might decrease with the increase of the dispersed phase flow rate under certain conditions with mass transfer. The reason was that the variation of the interfacial tension was affected by contact time, and the increase in dispersed phase flow rate made the interfacial tension of the droplet neck lower, so the droplet was more likely to be dispersed by continuous phase shear force. Based on this work, Lan et al. [67] replaced commercial pressure sensors with Laplace sensors as pressure probes. They integrated the probes into microfluidic chips and placed the probes close to the mass transfer interface to achieve a wide range and high accuracy of transient interfacial tension measurement, which was helpful to further study on the influence of mass transfer and dynamic interfacial tension on droplet dispersion.
In Table 4, some typical studies on micro-dispersion are summarized. Although micro-dispersion is helpful to analyze the influence of some physical properties and flow rate on droplet breakage behaviors under certain conditions, there is still a big gap between micro-dispersion and droplet breakage in macroscopic equipment. The former is under interfacial tension dominance and laminar flow conditions, while the latter is under turbulent flow and needs to consider dispersed phase viscosity. Therefore, it is still necessary to directly carry out droplet breakage research with macroscopic equipment. The important research content is the droplet breakage kernel function, which includes the breakage frequency function and the daughter droplet size distribution function. Based on different mechanism assumptions and constraints, researchers constructed a series of breakage kernel function models. Liao and Lucas [68] summarized the breakage mechanism into four categories in their review: (1) turbulent fluctuation and collision; (2) viscous shear stress; (3) shearing-off process; and (4) interface instability. Based on different assumptions for each mechanism, researchers have constructed different models of breakage frequency. The daughter droplet size distribution model was divided into three categories: (1) empirical model; (2) statistical model; and (3) phenomenological model.
There are a variety of droplet breakage kernel function models in the literature, but some give different predictions, and it is difficult to understand the applicability and accuracy of the model. Theoretically, one droplet size distribution only corresponds to a set of breakage laws and coalescence laws. In order to make the predicted value of the droplet size distribution closer to the experimental value, some studies [69] combined the widely used kernel functions in the literature and adjusted the constants in the kernel functions to construct the droplet size distribution model. However, the kernel functions selected were not individually verified to determine whether the function could describe the actual law of droplet behaviors; therefore, the applicable range of the droplet size distribution model was generally narrow. Therefore, it is extremely important to directly measure the kernel function of droplets through experiments and construct a kernel function model that conforms to droplet behaviors. In this regard, a feasible research method is to directly measure the kernel functions using a high-speed camera, through the suitable design of camera technology and statistical methods. Based on the directly measured experiment data, the predictive correlation of the kernel function is constructed by dimensional analysis or theoretical modeling. For droplet breakage behaviors, this research method can be further divided into single-droplet studies and droplet swarm studies. Some relative studies are summarized in Table 5.
For single-droplet experiments, the systems are less complex, and the factors affecting droplet behaviors can be analyzed in detail. Maaß et al. [70] constructed a droplet breakage time model through a single-droplet experiment in a stirred tank. Combined with the droplet breakage probability model in the literature, they obtained a droplet breakage frequency model that was in agreement with the tendency of the experiment results. However, the breakage time they measured was recorded from the moment when the droplet was injected, which did not meet the definition of crushing time, so the accuracy of the model needs to be further discussed. Zhang et al. [71,72] measured the droplet breakage probability, breakage time, and number of daughter droplets by single-droplet experiment in a reciprocating plate column, and the obtained breakage probability model can be well applied to the PBM of a Karr column. Korb et al. [73] carried out a single-droplet breakage experiment of D2EHPA extraction of zinc in a Kühni column. Comparing the experimental and predicted values and analyzing the applicability of a few droplet breakage kernel functions, they found that the increase in D2EHPA concentration during the extraction process led to a decrease in interfacial tension and an increase in the viscosity and density of the dispersed phase, and mass transfer of zinc ions had a significant effect on the interfacial tension.
For droplet swarm experiments, the hold-up of the system can be adjusted so that the droplet swarm mainly breaks up without coalescence, achieving an individual study of breakage behaviors and the breakage kernel function. Zhou et al. [74,75] statistically analyzed the droplet swarm behaviors under different liquid-liquid systems and operating conditions in a pulsed disc-and-doughnut extraction column and constructed an empirical model of droplet breakage frequency and daughter droplet size distribution. They found that the breakage frequency increased with a decrease in the interfacial tension. For the original breakage, the droplet tended to break up evenly when the diameter of the mother droplet became smaller, and the size distribution of the daughter droplet was inverted U-shaped. In a stirred tank without mass transfer, Zhou et al. [76] used high-speed camera technology to directly determine the kernel function of droplet swarm breakage and comprehensively analyzed the effects of rotor speed, droplet size, interfacial tension, and dispersed phase viscosity. Binary breakage of the droplets mainly occurred in the system. The breakage mode of droplets could be divided into original tensile breakage, intermediate tensile breakage, and revolving breakage. The daughter drop size distributions of the three breakage modes were inverted U-shaped, U-shaped, and M-shaped, respectively. The empirical model of the two kernel functions of breakage frequency (Equation (13)) and daughter droplet size distribution (Equation (14)) was constructed by introducing turbulent stress, interfacial stress, and viscous stress, and the prediction results of the empirical model agreed well with the experiment results. Combining the research results in the pulse column and stirred tank, they further established a droplet breakage model (Equation (15)) based on second-order oscillation of droplets in a turbulent flow field through theoretical analysis, which was well consistent with the experimental results in a pulse column and stirred tank.
Based on the research of Zhou et al. [74,75], Yu et al. [77] studied the process of removing trace tributylphosphate from nitric acid aqueous solution in a pulsed disc-and-doughnut extraction column by experiments and CFD-PBM simulation, and the simulation successfully predicted the mass transfer performance of pilot equipment. In this study condition, the mass transfer flux was small and the interfacial tension did not change much, so the calculated value based on equilibrium interfacial tension can still be in good agreement with the experimental value. Considering that the variation of interfacial tension at higher mass transfer fluxes cannot be ignored, Wang et al. [78,79] further studied the effect of mass transfer on interfacial tension and droplet breakage in a pulsed disc-and-doughnut extraction column. Firstly, the equilibrium interfacial tension was obtained by using the inverse calculation of the breakage frequency function under no mass transfer condition, and the accuracy of the interfacial tension measurement method was verified. Under mass transfer conditions, the dynamic interfacial tension was measured by the breakage frequency function. By submitting the obtained dynamic interfacial tension into the correlation of the daughter droplet distribution function, it was found that the prediction results were in good agreement with the experimental results, indicating that it was suitable to express the property of the interface by dynamic interfacial tension under mass transfer conditions. Through correlating the dynamic interfacial tension and mass transfer flux in different regions of the column, it was found that the degree of the dynamic interfacial tension deviating from the equilibrium interfacial tension was positively correlated with the mass transfer flux, successfully explaining some results obtained in the experiment (as shown in Figure 3): (1) Compared with no mass transfer conditions, multiple breakage was more likely to occur under mass transfer conditions, especially in the regions with high mass transfer flux; (2) for droplets of the same size, the droplet breakage frequency was higher when the mass transfer flux was higher. This study also found that the dynamic interfacial tension was not only related to the mass transfer flux but also related to the composition of two phases. When the mass transfer flux was low and the composition of the two phases approached equilibrium, the change in the dynamic interfacial tension would be more consistent with that of the equilibrium interfacial tension.

Table 5.
Studies on droplet breakage in a macroscopic setup.
| Authors | Experimental Setup | Conditions | Subject | Objectives |
|---|---|---|---|---|
| Maaβ et al. [70] | Stirred tank | No mass transfer | Single droplet | Breakage probability |
| Zhang et al. [71] | Reciprocating plate column | No mass transfer | Single droplet | Breakage probability |
| Korb et al. [73] | Kühni column | Mass transfer Chemical reaction | Single droplet | Breakage probability; Daughter droplet size distribution |
| Zhou et al. [74,75] | Pulsed disc-and-doughnut column | No mass transfer | Droplet swarm | Breakage frequency; Daughter droplet size distribution |
| Zhou [76] | Stirred tank | No mass transfer | Droplet swarm | Breakage frequency; Daughter droplet size distribution |
| Wang et al. [78,79] | Pulsed disc-and-doughnut column | Mass transfer | Droplet swarm | Effect of mass transfer |
A single, high-speed camera is usually used to carry out two-dimensional observation. However, the non-spherical droplets observed from a two-dimensional perspective cannot accurately reflect their three-dimensional shape, so the measured droplet size is somewhat deviated from the real value. Krakau et al. [80] used two cameras to trace the three-dimensional trajectory and shape of a single bubble. However, this method has difficulties and challenges: it is difficult to track and observe a few bubbles at the same time, so it is difficult to evaluate the daughter bubble distribution function of the bubble breakage. In the future, if a few bubbles or droplets can be tracked and monitored at the same time, it will help to obtain the PBM kernel function more accurately.
To summarize, the interaction between mass transfer and fluid flow affects the interfacial tension and ultimately determines droplet behavior. For interfacial adsorption mass transfer of surfactants, the interfacial tension is mainly related to the surfactant interfacial adsorption amount. For interface-crossing mass transfer of ordinary solutes, the interfacial tension is mainly related to the mass transfer flux and two-phase composition. However, most of the dynamic interfacial tension of the mass transfer process in the above studies is an average value in different degrees, ignoring the interface movement caused by the interfacial tension gradient, so many research results are still different from the actual two-phase flow. Therefore, it is necessary to analyze the relationship between mass transfer and interfacial tension at the interface scale.
3.2. Droplet Coalescence
Droplet coalescence has several steps: (1) Two droplets approach each other and contact, forming a continuous phase liquid film at the contact site; (2) liquid film drainage; (3) liquid film rupture; (4) droplets mergence. There are many factors that affect droplet coalescence, such as density, viscosity, interfacial tension (affected by salt, pH, and surfactants), droplet size, mass transfer flux, mass transfer direction, etc. Temperature is an important factor because it can affect some of the factors listed above. The effects of some factors on droplet coalescence are shown in Table 6 [81]. Experimental setups used to study droplet coalescence include venturi tubes [82], microchannels [83,84,85,86,87], and aggregation cells [88,89], and some of these setups are shown in Figure 4. Simon [82] used a venturi tube to trap the droplets in the venturi area through two-phase counterflow. The trapped droplets then merge with the newly injected droplets. However, a small fluctuation of the flow field in the venturi tube will cause the horizontal movement of the trapped droplets, so the droplets were not easily maintained in the focal plane, and the repeatability of the two droplets coalescing was not satisfying. In addition, the device was difficult to clean due to its complex structure, making it difficult to exclude impurities from interfering with the experiment. Gao [86] et al. studied droplet coalescence in a microchannel. They investigated the effects of interfacial tension, continuous phase viscosity, and other factors on droplet coalescence. Among these factors, surfactant interfacial adsorption significantly reduced the interfacial tension and made it more difficult for droplets to coalesce. Besides, the increase in continuous-phase viscosity also made it more difficult for droplets to coalesce. Narayan et al. [87] analyzed the effect of continuous phase viscosity and surfactant concentration on the liquid film drainage process in a microchannel. They found that with low surfactant concentration (about 1/3 CMC), the drainage time increased with the increase in continuous phase viscosity, while with high surfactant concentration (≥CMC), the continuous phase viscosity nearly had no effect on the drainage time. Kamp et al. [89] built a coalescence cell with a simple structure and carried out a droplet coalescence experiment with good repeatability. They found that the mass transfer direction had a significant effect on droplet coalescence behaviors, and the coalescence was promoted with the d→c mass transfer while the coalescence was inhibited with the c→d mass transfer.
Similar to the breakage frequency function, the coalescence frequency function (Equation (16)) describes the droplet coalescence rate, where ω is the collision frequency and λ is the coalescence efficiency. Researchers established a series of models for collision frequency and coalescence efficiency based on different assumptions.
The widely used collision frequency model (Equation (17)) was proposed by Coulaloglou and Tavlarides [90], and this model was derived from the theory of gas molecule motion. Liao and Lucas [91] divided the coalescence efficiency model into three categories in their review: (1) film drainage model; (2) energy model; and (3) critical velocity model.
For the film drainage model (Equation (18)), Coulaloglou and Tavlarides [90] pointed out that the droplet coalescence efficiency depended on the ratio of the interface contact time and the film drainage time, and that coalescence could occur more easily when the contact time was longer than the drainage time. For the energy model (Equation (19)) [91,92,93], the droplet coalescence efficiency depended on the relative magnitudes of the effective collision energy and the interface energy, and the coalescence would occur when the effective collision energy was higher than a certain value. For the critical velocity model (Equation (20)) [94,95], coalescence could occur when the collision velocity was lower than a critical value, indicating that coalescence efficiency was larger with a lower collision velocity. Obviously, there is a contradiction between the energy model and the critical velocity model. Kamp and Kraume [96] pointed out that only the film drainage model proposed by Coulaloglou and Tavlarides [90] could better match the experimental data. In addition, the film drainage model agrees better with the actual coalescence process, so it has been widely used in relevant research. Notably, similar to the breakage kernel function models, there are large differences among the coalescence kernel function models. It is necessary to directly measure the droplet coalescence kernel function through experiments, but there is still a lack of relevant literature.
Film drainage is the key process in droplet coalescence. The Reynolds lubrication theory is an important hydrodynamic model for the film drainage process; the basic equation of this theory is the Reynolds equation [97,98,99]. Equations (21) and (22) are derived from the Navier-Stokes equation and the continuity equation. The Reynolds equation assumes: (1) constant viscosity; (2) film lubrication; and (3) non-slip boundary conditions. The boundary conditions of the film drainage process depend on the deformability and mobility of the interface. According to deformability, the interface can be divided into a rigid interface and a deformable interface. According to mobility, the interface can be divided into a non-mobile interface, a partially mobile interface, and a fully mobile interface. The mobility of the interface is related to the continuous phase-dispersed phase viscosity ratio and surfactant concentration [87]. Interfaces are non-mobile with a high viscosity ratio and high surfactant concentration, while the interfaces are mobile with a low viscosity ratio and low surfactant concentration. Noticeably, the pressure term in the Reynolds equation of the film draining process is related to the Laplace pressure (determined by the interfacial tension and interfacial curvature) and the interaction between interfaces, and the boundary conditions are related to the thickness distribution of the liquid film along the radius. Therefore, a deeper understanding of the film drainage process requires the analysis of interfacial tension and force between interfaces at the interface scale.
4. Interface Scale
Interfacial tension is an important factor affecting droplet breakage and coalescence. If temperature is not considered, interfacial tension mainly depends on the interface composition. In a two-phase system containing solutes, the solute concentration is an important factor affecting the interfacial tension. When the solute molecules approach the interface of the two immiscible liquid phases, there are three main interface behaviors [100], including positive adsorption, interface-crossing mass transfer, and negative adsorption. These three behaviors are mainly related to the energy distribution of solute molecules near the interface. If the system contains other solutes, it will change the interface properties, and this change has a great effect on the mass transfer process of the original solute [101]. When interface adsorption mass transfer or interface-crossing mass transfer occurs, the interface composition continuously changes until the equilibrium state is reached, accompanied by complex interfacial phenomena such as the Marangoni effect and the Rayleigh effect. Interfacial tension in the mass transfer process is dynamically varying, known as dynamic interfacial tension, which is an important parameter for analyzing the influence of mass transfer on droplet behaviors. In addition, for a droplet coalescence process, the force between interfaces is an important factor affecting the film drainage process, so it is also a research focus at the interface scale.
4.1. Dynamic Interfacial Tension
In general, interfacial tension is determined by temperature and composition. During the mass transfer process, there is always an uneven distribution of temperature or concentration at the interface, resulting in interfacial tension gradients and further causing interface movement. This phenomenon is known as the Marangoni effect. The influence of mass transfer direction on droplet coalescence can be well explained by the interfacial tension gradient [102]. The interfacial tension gradient makes the interface move from a low interfacial tension site to a high interfacial tension site, and the interfacial tension gradients formed by the d→c mass transfer and the c→d mass transfer are in opposite directions. The resulting interface movement promotes and inhibits the film drainage process, respectively. Furthermore, an interfacial tension gradient can also explain the reason for choosing non-mobile boundary conditions in many film drainage models. Klaseboer et al. [103] studied the film drainage process between colliding droplets at constant approach velocity through experiments and simulations and found that non-mobile boundary conditions could predict the variation of film thickness better than mobile boundary conditions. They believed that the reason for the formation of the non-mobile interface was the presence of a trace amount of surfactant in the system, and through calculations, it was found that the small interfacial tension gradient was sufficient to resist the viscous shear force, so that the interface was non-mobile. They believed that it was necessary to ensure the purity of the droplets and the cleanliness of the device to achieve mobile boundary conditions. In addition, Yeo et al. [104] explained in more detail the process of the interfacial tension gradient forming a non-mobile interface: the drainage process generated by droplet collision created a surfactant depletion area near the flow source point, forming an interfacial tension gradient through the surfactant concentration gradient. The interfacial tension gradient delayed the drainage of the film and immobilized the interface.
The Marangoni effect is an important research topic in the interphase mass transfer process, which faces both opportunities and challenges. The opportunity is that mass transfer efficiency can be effectively promoted by the Marangoni effect [105]. The challenge is the uneven temporal and spatial distribution of interfacial tension caused by the complex mass transfer process.
To analyze complex phenomena at the interface, it is necessary to simplify the system into a single droplet and a stationary environment to determine the relationship between mass transfer coefficient and concentration. At a high concentration difference, the d→c mass transfer showed three states as follows [106]: (1) eruption zone; (2) turbulent zone; (3) diffusion zone. Heine et al. [107] combined confocal Raman spectroscopy with interfacial tension measurement to study the d→c mass transfer of a single droplet. Confocal Raman spectroscopy was used to measure the concentration inside the droplet. The concentration at the droplet interface could be obtained by the relationship between interfacial tension and concentration. In this study, the toluene-acetonitrile-water system was used, and it was found that, due to the Marangoni effect, most of the mass transfer was accomplished in the droplets at the early stage of formation. They believed that the research could be extended to the measurement of solute concentrations at different locations inside and outside droplets using confocal Raman spectroscopy under different droplet size, generation rate, and initial concentration conditions. These measurements provide necessary support to the CFD simulation studying a detailed temporal and spatial distribution of important parameters in a droplet formation process. Lan et al. [108] used a bubble and a droplet as probes, as shown in Figure 5, to detect the drop mass and interfacial tension, respectively, through analyzing the deformation of the bubble and droplet profiles. Based on this, they successfully achieved the simultaneous determination of the transient concentration, mass transfer flux, and dynamic interfacial tension during the mass transfer process. They found that the Marangoni effect was more obvious during the c→d mass transfer and that the droplet concentration and the mass transfer flux had a significant effect on the dynamic interfacial tension.
Using Laser-Induced Fluorescence (LIF), researchers can directly understand the distribution and change of solute concentration in a droplet formation process under mass transfer conditions and then analyze the intensity of the Marangoni effect and the influence of the Marangoni effect on fluid flow and mass transfer. Wang et al. [109] used planner laser-induced fluorescence (PLIF) to obtain the concentration distribution of acidic solutes in droplets. They analyzed the bulk flow and the Marangoni effect based on the concentration contours of the solutes and found that the competition between the bulk flow and the unstable flow caused by mass transfer determines the occurrence of the Marangoni effect. Heine et al. [110] investigated the effect of mass transfer during droplet formation in a static continuous phase. Using rhodamine 6G as a tracer, the effects of droplet size, concentration, and formation rate on the internal flow of the suspended droplet were analyzed by LIF. Interfacial turbulent eruptions caused by the Marangoni effect and convection within the droplets were clearly observed. Based on this study, by combining LIF and rainbow schlieren deflectometry (RSD), Heine et al. [111] achieved qualitative, non-invasive, real-time visualization of concentration distribution inside and outside droplets in two standard reference systems. The systems used in this study were: (1) toluene-acetone-water; and (2) n-octanol-butyleneglycol-water. With LIF and RSD measurements in both systems, enhanced mass transfer by Marangoni convection during droplet formation could be observed. The visualized Marangoni effect is shown in Figure 6. Interfacial instability was obvious during droplet formation at lower volumetric flow rates (dispersed phase). It was because the larger specific surface area and lower inlet flow caused a higher concentration gradient. In addition, they found that Marangoni convection dominated the internal mixing of the droplet at low volumetric flow rates, while volumetric flow rates dominated the mixing when the flow rates became high.
In addition to the experimental studies, researchers also studied the effect of the Marangoni effect on fluid flow and mass transfer through numerical simulations. Wegner et al. [112] carried out 2D simulation and 3D simulation of the mass transfer process of single droplets under the influence of Marangoni convection and found that the 2D simulation results had a large deviation from the experimental results, and produced results that contradicted the physical law at a high initial concentration. The 3D simulation enabled the qualitative and quantitative reproduction of experimental data. Engberg et al. [113] proposed that the numerical simulation of mobile droplet Marangoni convection needed to meet the following requirements: (1) complete 3D without a symmetrical plane; (2) couple the velocity field and concentration field through concentration-dependent interfacial tension gradients; (3) allow shape deformation, oscillation, and deviation from the vertical rise path; and (4) adapt sufficiently small grid cells to make the concentration boundary layer have adequate resolution. Based on the above requirements, they carried out a Marangoni effect simulation of a rising single droplet and found that the code captured the essential characteristics of Marangoni convection, namely the interaction of mass transfer and momentum transfer, resulting in a highly transient three-dimensional velocity field and mass transfer enhancement, as shown in Figure 7. In addition, they explained that the path oscillations observed in the Marangoni convection simulation were caused by the asymmetric separation of vortices in the wake of the droplet. Yang et al. [114] conducted numerical simulations of Marangoni convection on mass transfer from a single droplet with a different Reynolds number and found that the flow inside the rising droplet was the combination of Marangoni convection and droplet internal circulation. Increasing the Reynolds number of the droplet would inhibit the development time and development space of the Marangoni convection, so that the droplet could return to the internal circulation state faster, but the total mass transfer rate of the droplet was still improved. They also found that interface-crossing mass transfer with the Marangoni effect was non-Gaussian and oscillating, which was similar to turbulent. These simulations are helpful to understand the effect of the Marangoni effect on fluid flow and mass transfer at macroscopic and mesoscopic scales. For the microscopic properties of Marangoni effect, molecular dynamics (MD) simulation is an important tool [115,116,117]. Liu et al. [117] studied the flow induced by the Marangoni effect at a flat liquid-liquid interface. Through MD simulation, they compared the results of direct nonequilibrium molecular dynamics simulation with the flows that were generated by pressure and chemical-potential gradients and found that the approach based on the chemical-potential gradients agreed with the direct simulation.
The study of droplet breakage under mass transfer conditions shows that dynamic interfacial tension builds an important bridge connecting mass transfer and droplet behaviors. On the one hand, the dynamic interfacial tension reflects the tendency of droplets to break up or coalesce. On the other hand, the magnitude of dynamic interfacial tension reflects the mass transfer of solutes at the interface. Kalli et al. [118] investigated the relationship among mass transfer time, adsorption time, and droplet generation time with different types of surfactants in a microchannel device. They analyzed the effect of surfactant type, concentration, and interfacial adsorption control factors on the interfacial tension during the droplet formation process. Liang [119] measured the adsorption capacity and adsorption rate of surfactants in a microchannel device, and also analyzed the control factors of surfactant interfacial adsorption, namely mass transfer control and adsorption control. For mass transfer control, the decisive factors were mainly concentration differences, physical properties, and flow pattern. For adsorption control, the decisive factors were mainly the adsorption heat and the substance concentration.
In addition, for interfacial adsorption of surfactant and interface-crossing mass transfer of ordinary solutes, researchers [79,120] found that the dynamic interfacial tension was lower than the equilibrium interfacial tension at corresponding concentrations. Based on this phenomenon, Wang [79] proposed the concept of interfacial relaxation force, which was the decrease from the equilibrium interfacial tension to the dynamic interfacial tension. The mechanism of the interfacial relaxation force, as shown in Figure 8, was that when solute molecules were transported across interfaces, their transport “channels” occupied part of the interface, and this part of the interface lost its contribution to the interfacial tension, resulting in the interface “relaxation”. It was believed that the interfacial relaxation force was positively correlated with mass transfer flux, and the correlation was preliminarily quantified through experiments. To some degree, the interfacial relaxation force illustrated the correlation between dynamic interfacial tension and mass transfer flux. Based on this, he explained the influence of mass transfer direction on droplet breakage behaviors from experimental phenomena. When the droplet was stretched and close to breaking up, its shape was dumbbell-shaped, and the condition for droplet breakage was that the pressure in the intermediate neck was higher than the internal pressure at both ends of the droplet. For the d→c mass transfer, the solute concentration in the new stretched neck was higher than that at both ends of the droplet, and the mass transfer flux in the neck was also larger due to the higher difference between the inner and outer concentrations. Both factors caused the dynamic interfacial tension of the neck to be lower than that at both ends of the droplet, which inhibited the neck fracture and the droplet breakage. For the c→d mass transfer, the solute concentration in the neck was lower than that at both ends of the droplet, so that the dynamic interfacial tension of the neck was higher than that at both ends of the droplet, which promoted the neck fracture and the droplet breakage.
Overall, it is necessary to obtain the variation of dynamic interfacial tension when analyzing droplet behaviors coupled with mass transfer. In the study above, although researchers measured dynamic interfacial tension, most of them were spatial averages to different degrees. The interfacial tension distribution can be obtained from the interfacial tension-concentration relationship, the motion equation, and the mass transfer equation in numerical simulations [113,114]. However, there is still a lack of experimental methods to measure interfacial tension distribution, and the numerical simulation results cannot be verified. Not only CFD simulation studies are required to analyze the macroscopic and mesoscopic properties of the dynamic changing interface, but also MD simulation studies are required to analyze the microscopic properties.
4.2. Force between Interfaces
The most important tool for studying forces between interfaces is the DLVO theory, which is derived from the analysis of the forces between solid colloids. Van der Waals forces and electric double-layer forces are mainly considered in this theory. It was found that the force curve between particles sometimes deviated significantly from the DLVO theory [121,122,123], mainly due to the presence of non-DLVO forces such as hydration, solvation, and steric forces [124]. For liquid-liquid systems, some research results [125,126] showed that the force curve between droplets also deviated significantly from the DLVO theory.
In addition to establishing models of force between interfaces based on DLVO theory, researchers have also established a variety of measurement methods for the force between interfaces, as shown in Figure 9 [127]. Among them, the surface force apparatus (SFA) is the most representative measurement tool. In the 1970s, Israelachvili et al. [128] built SFA and achieved the measurement of Van der Waals dispersion force between two surfaces in the distance range of 1.5–130 nm, and its distance resolution could reach 0.1 nm. The greatest advantage of SFA is that it can directly measure the distance and force between two interfaces. However, SFA can only measure the force between two solid interfaces and cannot be used to measure the force between droplets. Total internal reflection microscopy (TIRM) is also an important tool for measuring forces between surfaces, with excellent range resolution (in nm) and force resolution (in pN) [127,129]. However, TIRM can only be used to measure the weak force between colloidal particles and a flat substrate [130], so it is not suitable to measure the force between droplets. The main tools for measuring the force between droplets are atomic force microscopy (AFM) and optical tweezers. Stevens’s group [131,132,133,134,135] used AFM to conduct research on the force between droplets, including: (1) the force between droplets in systems with and without ionic surfactants [131,132,133]; (2) the force between droplets in different concentrations and different types of saline solution [134]; and (3) the steric hindrance of polymers at droplet interfaces in the presence of polymer stabilizers [135]. Although AFM can directly measure the interaction between two droplets, there is still a problem in the study of the droplet film drainage process. Droplets deform during the film drainage process, and the degree of the droplet deformation is unknown. Thus, the front distance between two droplets cannot be accurately obtained. Therefore, the relationship between the force and the front distance cannot be studied by this method. AFM generally measures droplets with the size of 20–200 μm. For smaller droplets (0.1–10 μm), optical tweezers [136] can measure the interaction force. Nilsen-Nygaard et al. [137] tried to measure the force between droplets by optical tweezers and finally obtained some force signals. They qualitatively analyzed the results with the measurement data, but the analysis lacked correlation model fitting and quantitative explanation. Chen et al. [138] directly measured the force between 5.0 μm diameter tetradecane droplets in SDS and NaCl solutions with different concentrations, and analyzed the effect of SDS and NaCl concentrations on the electric double layer. In addition, they found that, compared with the larger droplets studied by AFM, the deformation ability and force mechanism of the smaller droplets studied by optical tweezers were quite different, which required further model analysis. Based on this, Chen et al. [139] refined the model and established a quantitative relationship between the force and the front distance, which provided a basis for better understanding the interaction mechanism between micro-scale droplets. In addition to the above two methods, Lan et al. [140] developed a method, as shown in Figure 10, to measure the dynamic interaction between two droplets by using the profile deformation of droplets, which had the advantages of simplicity, low cost, and visual results. This method was expected to facilitate the study of droplet interaction. However, similar to AFM, it cannot directly obtain the front distance between droplets. The summarized comparison of these force measurement tools is shown in Table 7.
Studying the mechanism of the droplet coalescence process requires simultaneous determination of the force and the front distance between droplets. The liquid film formed during the coalescence process is of nanometer thickness. The above force measurement methods cannot accurately obtain the front distance between droplets. To measure the thickness of the liquid film between the interface fronts, some methods, including the ultrasonic method [141], the electrical method [142], and the optical method [143], are developed. Among them, the optical method uses optical interference fringes to measure the thickness of liquid film, which has the advantages of being non-invasive, high resolution, and highly accurate. Researchers improved SFA and AFM with this method and achieved the simultaneous determination of the interaction force and liquid film thickness of droplet-solid surfaces [144], bubble-solid surfaces [99,145], bubble-bubble surfaces [146,147] in liquid medium. However, there is still a lack of literature on similar measurements in the droplet-droplet system.
The above forces between interfaces were measured without mass transfer. For a film drainage process with interface-crossing mass transfer, the composition at the interface will change continuously, so that the force between interfaces is affected by both the interface composition and the interface distance. If the spatial and temporal variation of the force between interfaces under mass transfer conditions can be characterized, it will help to understand and model the droplet coalescence process in liquid-liquid extraction.
5. Conclusions and Outlook
The core of liquid-liquid extraction process intensification is the efficient mixing of the two phases. In-depth understanding of two-phase mixing needs to focus on muti-scales: equipment, droplet, and interface scales. At the equipment scale, droplet size distribution significantly determines the two-phase mixing and mass transfer. At the droplet scale, droplet dispersion depends on droplet breakage and coalescence behaviors, and droplet behaviors are largely affected by interfacial tension. At the interface scale, interface behavior depends on interface properties, which are greatly affected by mass transfer. The ultimate goal of the studies at each scale is to have a deep understanding of the effect of mass transfer on interface properties and droplet behaviors, and to find a quantitative description. With better predictions on droplet behaviors, people can achieve more accurate simulation of the liquid-liquid two-phase flow and provide theoretical guidance for the intensification of liquid-liquid extraction process.
Focusing on dynamic interfacial tension, force between interfaces, droplet behaviors, and PBM, the conclusion and outlook of this article are as follows:
Dynamic interfacial tension is an important bridge between mass transfer and droplet behaviors. The study based on the Marangoni effect has led to a deep understanding of the coupling of mass transfer and fluid flow. However, there is a lack of experimental methods to measure the interfacial tension distribution to verify the simulation results, and some more microscopic characteristics of the dynamically changing interface need to be studied in depth with MD simulation.
Force between interfaces is an important factor determining droplet coalescence, and a variety of methods have been established to measure the force and liquid film thickness. Among these methods, the optical method is important for accurately measuring nano-scale liquid film. In future research, the combination of optical method and different force measuring tools can realize the simultaneous determination of the force between droplets of various sizes and the thickness of the liquid film, which will provide a basis for better understanding the droplet coalescence process. In addition, the dynamic observation of the film drainage process under mass transfer conditions is a major challenge for future research.
Analyzing droplet behaviors is an important basis for accurately calculating droplet size distribution. At present, a variety of kernel function models have been established for droplet breakage and droplet coalescence, but most of the kernel function models are derived from different assumptions, and it is difficult to obtain satisfactory accuracy and robustness in practical application due to a lack of experimental verification. Therefore, it is important to directly measure the kernel function through experiments and establish the prediction correlation of the kernel function directly based on the experimental data. Currently, this method has made significant progress in studies of droplet breakage behaviors, and it needs to be applied to droplet coalescence studies in the future.
Based on kernel function models acquired at the droplet scale, PBM can be applied to the two-phase flow simulation at the equipment scale. Due to the limitations of computation load, unary PBM is used in most of the current research. With further development of computation power, the efficient application of multi-element PBM can significantly promote two-phase flow simulation.
Author Contributions
Conceptualization, S.Y.; methodology, S.Y.; investigation, S.Y.; writing—original draft preparation, S.Y.; writing—review and editing, Y.W., S.L., Z.C. and J.Z.; supervision, Z.C., S.L. and Y.W.; project administration, S.L. and Y.W.; funding acquisition, S.L. and Y.W. All authors have read and agreed to the published version of the manuscript.
Funding
This research was funded by the National Natural Science Foundation of China, grant numbers 22178196, and 22278234. The APC was funded by the National Natural Science Foundation of China, grant number 22178196.
Data Availability Statement
Not applicable.
Acknowledgments
This work was supported by the National Natural Science Foundation of China.
Conflicts of Interest
The authors declare no conflict of interest.
Glossary
| Nomenclature | |
| Bb | Birth source term of breakage, m−4·s−1 |
| Bc | Birth source term of coalescence, m−4·s−1 |
| B | Breakage frequency, s−1 |
| C1 | Adjustable parameter |
| C2 | Adjustable parameter |
| C3 | Adjustable parameter |
| C4 | Adjustable parameter |
| D | Diffusion coefficient, m2·s−1 |
| Db | Death source term of breakage, m−4·s−1 |
| Dc | Death source term of coalescence, m−4·s−1 |
| d | Diameter, m |
| d32 | Sauter mean diameter, m |
| Ec | Axial diffusion coefficient, m2·s−1 |
| Ecollision | Kinetic collision energy, kg·m2·s−2 |
| Einterfacial | Interfacial energy, kg·m2·s−2 |
| Fβi | Daughter droplet size distribution function (intermediate tensile breakage), 1·m−1 |
| Fβo | Daughter droplet size distribution function (original tensile breakage), 1·m−1 |
| Fβr | Daughter droplet size distribution function (revolving breakage), 1·m−1 |
| fv | Volume ratio of daughter droplet to mother droplet |
| g | Gravitational acceleration, m·s−2 |
| H | Film thickness, m |
| h | Coalescence frequency, m3·s−1 |
| K | Mass transfer coefficient, m·s−1 |
| kc | Mass transfer coefficient of continuous phase, m·s−1 |
| kd | Mass transfer coefficient of dispersed phase, m·s−1 |
| M | Distribution coefficient |
| n | Number density, m−4 |
| p | Pressure, Pa |
| pco | Droplet cohesive force, Pa |
| pv,c | Viscous stress of continuous phase, Pa |
| r | Spatial coordinate, m |
| r | Radial distance, m |
| S | Source term, m−4·s−1 |
| Sb | Breakage source term, m−4·s−1 |
| Sc | Coalescence source term, m−4·s−1 |
| Shc | Continuous phase Sherwood number |
| Shd | Dispersed phase Sherwood number |
| tdrainage | Film drainage time, s |
| tcontact | Droplet contact time, s |
| ucrit | Critical velocity, m·s−1 |
| ucha | Characteristic velocity (collision), m·s−1 |
| U | Bulk velocity, m·s−1 |
| uf | Flooding velocity, m·s−1 |
| Vd | Velocity of dispersed phase, m·s−1 |
| Vc | Velocity of continuous phase, m·s−1 |
| Vslip | Slip velocity, m·s−1 |
| V0 | Characteristic velocity, m·s−1 |
| Wed | Droplet Weber number |
| WeL | Dimensionless Weber number |
| z | Height, m |
| β | Daughter droplet size distribution function, 1·m−1 |
| Γ | The effect the column geometrical characteristics |
| Γ(·) | Upper incomplete gamma function |
| γ | Interfacial tension, N/m |
| ε | Turbulence dissipation rate, m2·s−3 |
| λ | Coalescence efficiency |
| μc | Viscosity of continuous phase, Pa·s |
| μd | Viscosity of dispersed phase, Pa·s |
| Π | The effect of the power input per unit mass |
| ρc | Density of continuous phase, kg·m−3 |
| ρd | Density of dispersed phase, kg·m−3 |
| Φ | The effect of the phase flow rates |
| φ | Hold-up |
| Ω | The effect of physical properties |
| ω | Collision frequency, s−1 |
| Abbreviations | |
| AFM | Atomic force microscopy |
| CFD | Computational fluid dynamics |
| CMC | Critical micelle concentration |
| DBFF | Droplet breakup frequency function |
| LIF | Laser-induced fluorescence |
| MD | Molecular dynamics |
| PBM | Population balance model |
| PBE | Population balance equation |
| PLIF | Planner laser-induced fluorescence |
| RSD | Rainbow schlieren deflectometry |
| SFA | Surface force apparatus |
| TIRM | Total internal reflection microscopy |
| VOF | Volume of fluid method |
References
- Herbst, R.S.; Baron, P.; Nilsson, M. Standard and advanced separation: PUREX processes for nuclear fuel reprocessing. In Advanced Separation Techniques for Nuclear Fuel Reprocessing and Radioactive Waste Treatment; Nash, K.L., Lumetta, G.J., Eds.; Woodhead Publishing: Cambridge, UK, 2011; pp. 141–175. [Google Scholar]
- Guan, Y.X.; Zhu, Z.Q.; Mei, L.H. Technical aspects of extractive purification of penicillin fermentation broth by aqueous two-phase partitioning. Sep. Sci. Technol. 1996, 31, 2589–2597. [Google Scholar] [CrossRef]
- Flett, D.S. Solvent extraction in hydrometallurgy: The role of organophosphorus extractants. J. Organomet. Chem. 2005, 690, 2426–2438. [Google Scholar] [CrossRef]
- Kim, S.J.; Kim, S.C.; Kawasaki, J. Separation and recovery of bicyclic aromatic components in the light cycle oil. Sep. Sci. Technol. 2003, 38, 179–199. [Google Scholar] [CrossRef]
- Long, J.; Shen, B.X.; Ling, H.; Zhao, J.G.; Lu, J.C. Novel solvent deasphalting process by vacuum residue blending with coal tar. Ind. Eng. Chem. Res. 2011, 50, 11259–11269. [Google Scholar] [CrossRef]
- Chagnes, A.; Pospiech, B. A brief review on hydrometallurgical technologies for recycling spent lithium-ion batteries. J. Chem. Technol. Biotechnol. 2013, 88, 1191–1199. [Google Scholar] [CrossRef]
- Smink, D.; Kersten, S.R.A.; Schuur, B. Recovery of lignin from deep eutectic solvents by liquid-liquid extraction. Sep. Purif. Technol. 2020, 235, 116127. [Google Scholar] [CrossRef]
- Sampaio, C.I.; Sousa, L.F.; Dias, A.M. Separation of anthocyaninic and nonanthocyaninic flavonoids by liquid-liquid extraction based on their acid-base properties: A green chemistry approach. J. Chem. Educ. 2020, 97, 4533–4539. [Google Scholar] [CrossRef]
- Molino, A.; Mehariya, S.; Di Sanzo, G.; Larocca, V.; Martino, M.; Leone, G.P.; Marino, T.; Chianese, S.; Balducchi, R.; Musmarra, D. Recent developments in supercritical fluid extraction of bioactive compounds from microalgae: Role of key parameters, technological achievements and challenges. J. CO2 Util. 2020, 36, 196–209. [Google Scholar] [CrossRef]
- Pena-Pereira, F.; Namiesnik, J. Ionic liquids and deep eutectic mixtures: Sustainable solvents for extraction processes. ChemSusChem 2014, 7, 1784–1800. [Google Scholar] [CrossRef]
- TeGrotenhuis, W.E.; Cameron, R.J.; Viswanathan, V.V.; Wegeng, R.S. Solvent extraction and gas absorption using microchannel contactors. In Proceedings of the 3rd International Conference on Microreaction Technology, New Orleans, LA, USA, 18–21 April 1999; pp. 541–549. [Google Scholar]
- Song, J.F.; Niu, X.H.; Li, X.M.; He, T. Selective separation of copper and nickel by membrane extraction using hydrophilic nanoporous ion-exchange barrier membranes. Process Saf. Environ. Prot. 2018, 113, 1–9. [Google Scholar] [CrossRef]
- Takahashi, K.; Abdel-Tawab, A.A.S.; Nii, S.; Yajima, T.; Kawaizumi, F. Extraction of rare earth metals with a multistage mixer-settler extraction column. Chem. Eng. Sci. 2002, 57, 469–478. [Google Scholar] [CrossRef]
- Ferreira, A.E.; Agarwal, S.; Machado, R.M.; Gameiro, M.L.F.; Santos, S.M.C.; Reis, M.T.A.; Ismael, M.R.C.; Correia, M.J.N.; Carvalho, J.M.R. Extraction of copper from acidic leach solution with Acorga M5640 using a pulsed sieve plate column. Hydrometallurgy 2010, 104, 66–75. [Google Scholar] [CrossRef]
- Hamamah, Z.A.; Grutzner, T. Liquid-liquid centrifugal extractors: Types and recent applications—A review. ChemBioEng Rev. 2022, 9, 286–318. [Google Scholar] [CrossRef]
- Wang, K.; Luo, G.S. Microflow extraction: A review of recent development. Chem. Eng. Sci. 2017, 169, 18–33. [Google Scholar] [CrossRef]
- Aoki, N.; Tanigawa, S.; Mae, K. A new index for precise design and advanced operation of mass transfer in slug flow. Chem. Eng. J. 2011, 167, 651–656. [Google Scholar] [CrossRef]
- Roumpea, E.; Chinaud, M.; Angeli, P. Experimental investigations of non-Newtonian/Newtonian liquid-liquid flows in microchannels. AIchE J. 2017, 63, 3599–3609. [Google Scholar] [CrossRef]
- Ghaini, A.; Mescher, A.; Agar, D.W. Hydrodynamic studies of liquid-liquid slug flows in circular microchannels. Chem. Eng. Sci. 2011, 66, 1168–1178. [Google Scholar] [CrossRef]
- Kowalczuk, P.B. Determination of critical coalescence concentration and bubble size for surfactants used as flotation frothers. Ind. Eng. Chem. Res. 2013, 52, 11752–11757. [Google Scholar] [CrossRef]
- Najafabadi, M.M.; Tabrizi, H.B.; Ahmadi, G. Geometry effect on deposition and residence time of polydisperse fine drops in mini-risers under developing flow condition. Part. Sci. Technol. 2014, 32, 560–575. [Google Scholar] [CrossRef]
- Loth, E.; O’Brien, T.; Syamlal, M.; Cantero, M. Effective diameter for group motion of polydisperse particle mixtures. Powder Technol. 2004, 142, 209–218. [Google Scholar] [CrossRef]
- Hinze, J.O. Fundamentals of the hydrodynamic mechanism of splitting in dispersion processes. AIchE J. 1955, 1, 289–295. [Google Scholar] [CrossRef]
- Calabrese, R.V.; Chang, T.P.K.; Dang, P.T. Drop breakup in turbulent stirred-tank contactors.1. Effect of dispersed-phase viscosity. AIchE J. 1986, 32, 657–666. [Google Scholar] [CrossRef]
- Fischer, E.A. Drop sizes in agitated liquid-liquid extraction columns. Effect of physical properties, column geometry, agitator type and agitation speed. Verfahrenstechnik 1971, 5, 360–365. [Google Scholar]
- Rincón Rubio, L.M. On the Hydrodynamics of a Wirz-II Extraction Column. Ph.D. Thesis, Swiss Federal Institute of Technology, Zurich, Swiss, 1992. [Google Scholar]
- Kumar, A.; Hartland, S. Unified correlations for the prediction of drop size in liquid-liquid extraction columns. Ind. Eng. Chem. Res. 1996, 35, 2682–2695. [Google Scholar] [CrossRef]
- Jahya, A.B.; Stevens, G.W.; Pratt, H.R.C. Pulsed disc-and-doughnut column performance. Solvent Extr. Ion Exch. 2009, 27, 63–82. [Google Scholar] [CrossRef]
- Rohlfing, E.; Hartmann, H. Effect of mass-transfer on droplet size in a pulsed packed extraction column. Chem. Ing. Tech. 1992, 64, 470–471. [Google Scholar] [CrossRef]
- Kumar, A.; Hartland, S. A unified correlation for the prediction of dispersed-phase hold-up in liquid-liquid extraction columns. Ind. Eng. Chem. Res. 1995, 34, 3925–3940. [Google Scholar] [CrossRef]
- Gayler, R.; Pratt, H. Holdup and pressure drop in packed columns. Trans. Inst. Chem. Eng. 1951, 29, 110–125. [Google Scholar]
- Tsouris, C.; Tavlarides, L.L. Mass-transfer effects on droplet phenomena and extraction column hydrodynamics revisited. Chem. Eng. Sci 1993, 48, 1503–1515. [Google Scholar] [CrossRef]
- Kumar, A.; Hartland, S. Prediction of drop size, dispersed-phase holdup, slip velocity, and limiting throughputs in packed extraction columns. Chem. Eng. Res. Des. 1994, 72, 89–104. [Google Scholar]
- Yu, J.; Fei, W.Y. Hydrodynamics and mass transfer in a pulsed packed column. Can. J. Chem. Eng. 2000, 78, 1040–1045. [Google Scholar]
- Charton, S.; Duhamet, J.; Borda, G.; Ode, D. Axial dispersion in pulsed disk and doughnut columns: A unified law. Chem. Eng. Sci. 2012, 75, 468–477. [Google Scholar] [CrossRef]
- Panahinia, F.; Safdari, J.; Ghannadi-Maragheh, M.; Amani, P.; Mallah, M.H. Modeling and simulation of a horizontal pulsed sieve-plate extraction column using axial dispersion model. Sep. Sci. Technol. 2017, 52, 1537–1552. [Google Scholar] [CrossRef]
- Whitman, W.G. The two-film theory of gas absorption. Chem. Metall. Eng. 1923, 29, 146–148. [Google Scholar] [CrossRef]
- Higbie, R. The rate of absorption of a pure gas into a still liquid during short periods of exposure. Trans. Am. Inst. Chem. Eng. 1935, 31, 365–389. [Google Scholar]
- Danckwerts, P.V. Significance of liquid-film coefficients in gas absorption. Ind. Eng. Chem. 1951, 43, 1460–1467. [Google Scholar] [CrossRef]
- Kumar, A.; Hartland, S. Correlations for prediction of mass transfer coefficients in single drop systems and liquid-liquid extraction columns. Chem. Eng. Res. Des. 1999, 77, 372–384. [Google Scholar] [CrossRef]
- Torab-Mostaedi, M.; Safdari, J. Mass transfer coefficients in a pulsed packed extraction column. Chem. Eng. Process. 2009, 48, 1321–1326. [Google Scholar] [CrossRef]
- Asadollahzadeh, M.; Ghaemi, A.; Torab-Mostaedi, M.; Shahhosseini, S. Experimental mass transfer coefficients in a pilot plant multistage column extractor. Chin. J. Chem. Eng. 2016, 24, 989–999. [Google Scholar] [CrossRef]
- Li, S.W.; Jing, S.; Zhang, Q.; Wu, Q.L. Advances in simulation of liquid-liquid two-phase flow in extraction columns with CFD-PBM. Chin. J. Process Eng. 2012, 12, 702–711. [Google Scholar]
- Yu, X. Population Balance Modeling of Liquid–Liquid Two-Phase Flows in Pulsed Disc and Doughnut Columns and the Application. Ph.D. Thesis, Tsinghua University, Beijing, China, 2021. [Google Scholar]
- Fang, Q.; Jing, D.; Zhou, H.; Li, S.W. Population balance of droplets in a pulsed disc and doughnut column with wettable internals. Chem. Eng. Sci. 2017, 161, 274–287. [Google Scholar] [CrossRef]
- Yu, X.; Zhou, H.; Jing, S.; Lan, W.J.; Li, S.W. Augmented CFD-PBM simulation of liquid-liquid two-phase flows in liquid extraction columns with wettable internal plates. Ind. Eng. Chem. Res. 2020, 59, 8436–8446. [Google Scholar] [CrossRef]
- Drumm, C.; Attarakih, M.M.; Bart, H.J. Coupling of CFD with DPBM for an RDC extractor. Chem. Eng. Sci. 2009, 64, 721–732. [Google Scholar] [CrossRef]
- Mirzaie, M.; Sarrafi, A.; Pour, H.H.; Baghaie, A.; Molaeinasab, M. Experimental investigation and CFD modeling of hydrodynamic parameters in a pulsed packed column. Solvent Extr. Ion Exch. 2016, 34, 643–660. [Google Scholar] [CrossRef]
- Amokrane, A.; Charton, S.; Sheibat-Othman, N.; Becker, J.; Klein, J.P.; Puel, F. Development of a CFD-PBE coupled model for the simulation of the drops behaviour in a pulsed column. Can. J. Chem. Eng. 2014, 92, 220–233. [Google Scholar] [CrossRef]
- Yu, X.; Zhou, H.; Jing, S.; Lan, W.J.; Li, S.W. CFD-PBM simulation of two-phase flow in a pulsed disc and doughnut column with directly measured breakup kernel functions. Chem. Eng. Sci. 2019, 201, 349–361. [Google Scholar] [CrossRef]
- Zhou, H.; Yu, X.; Wang, B.; Jing, S.; Lan, W.J.; Li, S.W. CFD-PBM simulation of liquid-liquid dispersions in a pump-mixer. Ind. Eng. Chem. Res. 2021, 60, 1926–1938. [Google Scholar] [CrossRef]
- Bahmanyar, H.; Slater, M.J. Studies of drop break-up in liquid-liquid systems in a rotating disc contactor. Part I: Conditions of no mass transfer. Chem. Eng. Technol. 1991, 14, 79–89. [Google Scholar] [CrossRef]
- Bahmanyar, H.; Roy Rean, D.; Dowling, I.C.; Ramlochan, K.M.; Slater, M.J.; Yu, W. Studies of drop break-up in liquid-liquid systems in a rotating disc contactor. Part II: Effects of mass transfer and scale-up. Chem. Eng. Technol. 1991, 14, 178–185. [Google Scholar] [CrossRef]
- Cauwenberg, V.; Degreve, J.; Slater, M.J. The interaction of solute transfer, contaminants and drop break-up in rotating disc contactors: Part I. Correlation of drop breakage probabilities. Can. J. Chem. Eng. 1997, 75, 1046–1055. [Google Scholar] [CrossRef]
- Cauwenberg, V.; Degreve, J.; Slater, M.J. The interaction of solute transfer, contaminants and drop break-up in rotating disc contactors: Part II. The coupling of the mass transfer and breakage processes via interfacial tension. Can. J. Chem. Eng. 1997, 75, 1056–1066. [Google Scholar] [CrossRef]
- Xu, J.H.; Li, S.W.; Tan, J.; Wang, Y.J.; Luo, G.S. Preparation of highly monodisperse droplet in a T-junction microfluidic device. AIchE J. 2006, 52, 3005–3010. [Google Scholar] [CrossRef]
- Steegmans, M.L.J.; De Ruiter, J.; Schroen, K.G.P.H.; Boom, R.M. A descriptive force-balance model for droplet formation at microfluidic Y-junctions. AIchE J. 2010, 56, 2641–2649. [Google Scholar] [CrossRef]
- Xu, J.H.; Luo, G.S.; Chen, G.G.; Wang, J.D. Experimental and theoretical approaches on droplet formation from a micrometer screen hole. J. Membr. Sci. 2005, 266, 121–131. [Google Scholar] [CrossRef]
- Xu, J.H.; Li, S.W.; Lan, W.J.; Luo, G.S. Microfluidic approach for rapid interfacial tension measurement. Langmuir 2008, 24, 11287–11292. [Google Scholar] [CrossRef] [PubMed]
- Zhou, H.B.; Yao, Y.; Chen, Q.; Li, G.; Yao, S.H. A facile microfluidic strategy for measuring interfacial tension. Appl. Phys. Lett. 2013, 103, 234102. [Google Scholar] [CrossRef]
- Wang, K.; Lu, Y.C.; Xu, J.H.; Luo, G.S. Determination of dynamic interfacial tension and its effect on droplet formation in the T-shaped microdispersion process. Langmuir 2009, 25, 2153–2158. [Google Scholar] [CrossRef]
- Wang, X.Y.; Riaud, A.; Wang, K.; Luo, G.S. Pressure drop-based determination of dynamic interfacial tension of droplet generation process in T-junction microchannel. Microfluid. Nanofluidics 2015, 18, 503–512. [Google Scholar] [CrossRef]
- Brosseau, Q.; Vrignon, J.; Baret, J.C. Microfluidic dynamic interfacial tensiometry (μDIT). Soft Matter 2014, 10, 3066–3076. [Google Scholar] [CrossRef] [PubMed]
- Moire, M.; Peysson, Y.; Herzhaft, B.; Pannacci, N.; Gallaire, F.; Augello, L.; Dalmazzone, C.; Colin, A. Ultralow interfacial tension measurement through jetting/dripping transition. Langmuir 2017, 33, 2531–2540. [Google Scholar] [CrossRef]
- Li, S.W.; Xu, J.H.; Wang, Y.J.; Luo, G.S. Controllable preparation of nanoparticles by drops and plugs flow in a microchannel device. Langmuir 2008, 24, 4194–4199. [Google Scholar] [CrossRef] [PubMed]
- Lan, W.J.; Wang, C.; Guo, X.Q.; Li, S.W.; Luo, G.S. Study on the transient interfacial tension in a microfluidic droplet formation coupling interphase mass transfer process. AIchE J. 2016, 62, 2542–2549. [Google Scholar] [CrossRef]
- Lan, W.J.; Wang, Z.H.; Wang, M.; Liu, D.; Guo, X.Q.; Sun, Q.; Li, X.X.; Li, S.W. Determination of transient interfacial tension in a microfluidic device using a Laplace sensor. Chem. Eng. Sci. 2019, 209, 115207. [Google Scholar] [CrossRef]
- Liao, Y.X.; Lucas, D. A literature review of theoretical models for drop and bubble breakup in turbulent dispersions. Chem. Eng. Sci. 2009, 64, 3389–3406. [Google Scholar] [CrossRef]
- Singh, K.K.; Mahajani, S.M.; Shenoy, K.T.; Ghosh, S.K. Population balance modeling of liquid-liquid dispersions in homogeneous continuous-flow stirred tank. Ind. Eng. Chem. Res. 2009, 48, 8121–8133. [Google Scholar] [CrossRef]
- Maaß, S.; Kraume, M. Determination of breakage rates using single drop experiments. Chem. Eng. Sci. 2012, 70, 146–164. [Google Scholar] [CrossRef]
- Zhang, J.Y.Z.; Berry, J.D.; Mumford, K.A.; Harvie, D.J.E.; Fei, W.Y.; Stevens, G.W.; Wang, Y.D. Single drop breakage in a reciprocating plate column. Chem. Eng. J. 2021, 415, 129049. [Google Scholar] [CrossRef]
- Zhang, J.Y.Z.; Li, W.; Mumford, K.; Fei, W.Y.; Stevens, G.; Wang, Y.D. Drop sizes and population balance model for a Karr column. AIchE J. 2022, 68, e17413. [Google Scholar] [CrossRef]
- Korb, C.; Bart, H.J. Solvent extraction in columns in a droplet breakage domain. Hydrometallurgy 2017, 173, 71–79. [Google Scholar] [CrossRef]
- Zhou, H.; Jing, S.; Yu, X.; Zhou, H.; Lan, W.J.; Li, S.W. Study of droplet breakage in a pulsed disc and doughnut column-Part I: Experiments and correlations. Chem. Eng. Sci. 2019, 197, 172–183. [Google Scholar] [CrossRef]
- Zhou, H.; Jing, S.; Fang, Q.; Li, S.W.; Lan, W.J. Direct measurement of droplet breakage in a pulsed disc and doughnut column. AIchE J. 2017, 63, 4188–4200. [Google Scholar] [CrossRef]
- Zhou, H. Studies on the Breakup Behavior of Drop Swarms in Turbulent Flow. Ph.D. Thesis, Tsinghua University, Beijing, China, 2021. [Google Scholar]
- Yu, X.; Zhou, H.; Jing, S.; Lan, W.J.; Li, S.W. Experimental and numerical study of liquid-liquid interphase mass transfer in a pilot-scale extraction column. Chem. Eng. Sci. 2021, 230, 116184. [Google Scholar] [CrossRef]
- Wang, B.; Zhou, H.; Yu, X.; Jing, S.; Zheng, Q.; Lan, W.J.; Li, S.W. Determination of dynamic interfacial tension in a pulsed column under mass transfer condition. AIchE J. 2020, 66, e16257. [Google Scholar] [CrossRef]
- Wang, B. Studies on the Effect of Mass Transfer on Interfacial Tension and Droplet Breakage in a Pulsed Extraction Column. Ph.D. Thesis, Tsinghua University, Beijing, China, 2022. [Google Scholar]
- Krakau, F.; Kraume, M. 3D single bubble breakup tracking in a stirred tank. Chem. Ing. Tech. 2019, 91, 980–990. [Google Scholar] [CrossRef]
- Kamp, J.; Villwock, J.; Kraume, M. Drop coalescence in technical liquid/liquid applications: A review on experimental techniques and modeling approaches. Rev. Chem. Eng. 2017, 33, 1–47. [Google Scholar] [CrossRef]
- Simon, M. Koaleszenz von Tropfen und Tropfenschwärmen. Ph.D. Thesis, Technischen Universität Kaiserslautern, Kaiserslautern, Germany, 2004. [Google Scholar]
- Kovalchuk, N.M.; Reichow, M.; Frommweiler, T.; Vigolo, D.; Simmons, M.J.H. Mass transfer accompanying coalescence of surfactant-laden and surfactant-free drop in a microfluidic channel. Langmuir 2019, 35, 9184–9193. [Google Scholar] [CrossRef]
- Yi, H.Z.; Zhu, C.Y.; Fu, T.T.; Ma, Y.G. Efficient coalescence of microdroplet in the cross-focused microchannel with symmetrical chamber. J. Taiwan Inst. Chem. Eng. 2020, 112, 52–59. [Google Scholar] [CrossRef]
- Deng, Y.J.; Guo, W.X.; Zhu, C.Y.; Fu, T.T.; Ma, Y.G. Coalescence dynamics of two droplets in T-junction microchannel with a lantern-shaped expansion chamber. J. Taiwan Inst. Chem. Eng. 2022, 131, 104193. [Google Scholar] [CrossRef]
- Gao, C.H.; Ling, S.D.; Chen, Z.; Wang, Y.D.; Xu, J.H. Coalescence law of microdroplet swarms in microchannels. Chem. Eng. Sci. 2022, 262, 118055. [Google Scholar] [CrossRef]
- Narayan, S.; Makhnenko, I.; Moravec, D.B.; Hauser, B.G.; Dallas, A.J.; Dutcher, C.S. Insights into the microscale coalescence behavior of surfactant-stabilized droplets using a microfluidic hydrodynamic trap. Langmuir 2020, 36, 9827–9842. [Google Scholar] [CrossRef]
- Eiswirth, R.T.; Bart, H.J.; Ganguli, A.A.; Kenig, E.Y. Experimental and numerical investigation of binary coalescence: Liquid bridge building and internal flow fields. Phys. Fluids 2012, 24, 062108. [Google Scholar] [CrossRef]
- Kamp, J.; Kraume, M. Influence of drop size and superimposed mass transfer on coalescence in liquid/liquid dispersions—Test cell design for single drop investigations. Chem. Eng. Res. Des. 2014, 92, 635–643. [Google Scholar] [CrossRef]
- Coulaloglou, C.A.; Tavlarides, L.L. Description of interaction processes in agitated liquid-liquid dispersions. Chem. Eng. Sci. 1977, 32, 1289–1297. [Google Scholar] [CrossRef]
- Liao, Y.X.; Lucas, D. A literature review on mechanisms and models for the coalescence process of fluid particles. Chem. Eng. Sci. 2010, 65, 2851–2864. [Google Scholar] [CrossRef]
- Howarth, W.J. Coalescence of drops in a turbulent flow field. Chem. Eng. Sci. 1964, 19, 33–38. [Google Scholar] [CrossRef]
- Howarth, W.J. Measurement of coalescence frequency in an agitated tank. AIchE J. 1967, 13, 1007–1013. [Google Scholar] [CrossRef]
- Lehr, F.; Millies, M.; Mewes, D. Bubble-size distributions and flow fields in bubble columns. AIchE J. 2002, 48, 2426–2443. [Google Scholar] [CrossRef]
- Lehr, F.; Mewes, D. A transport equation for the interfacial area density applied to bubble columns. Chem. Eng. Sci. 2001, 56, 1159–1166. [Google Scholar] [CrossRef]
- Kamp, J.; Kraume, M. From single drop coalescence to droplet swarms - Scale-up considering the influence of collision velocity and drop size on coalescence probability. Chem. Eng. Sci. 2016, 156, 162–177. [Google Scholar] [CrossRef]
- Vinogradova, O.I.; Yakubov, G.E. Dynamic effects on force measurements. 2. Lubrication and the atomic force microscope. Langmuir 2003, 19, 1227–1234. [Google Scholar] [CrossRef]
- Bhakta, A.; Ruckenstein, E. Decay of standing foams: Drainage, coalescence and collapse. Adv. Colloid Interface Sci. 1997, 70, 1–124. [Google Scholar] [CrossRef]
- Shi, C.; Cui, X.; Xie, L.; Liu, Q.X.; Chan, D.Y.C.; Israelachvili, J.N.; Zeng, H.B. Measuring forces and spatiotemporal evolution of thin water films between an air bubble and solid surfaces of different hydrophobicity. ACS Nano 2015, 9, 95–104. [Google Scholar] [CrossRef]
- Israelachvili, J.N. Intermolecular and Surface Forces, 3rd ed.; Academic Press: Singapore, 2011; pp. 1–674. [Google Scholar]
- Sattari-Najafabadi, M.; Esfahany, M.N.N. Intensification of liquid-liquid mass transfer in a circular microchannel in the presence of sodium dodecyl sulfate. Chem. Eng. Process. 2017, 117, 9–17. [Google Scholar] [CrossRef]
- Eiswirth, R.T. Binary Droplet Coalescence of Free Rising Droplets. Ph.D. Thesis, Technischen Universität Kaiserslautern, Kaiserslautern, Germany, 2014. [Google Scholar]
- Klaseboer, E.; Chevaillier, J.P.; Gourdon, C.; Masbernat, O. Film drainage between colliding drops at constant approach velocity: Experiments and modeling. J. Colloid Interface Sci. 2000, 229, 274–285. [Google Scholar] [CrossRef]
- Yeo, L.Y.; Matar, O.K.; de Ortiz, E.S.P.; Hewitt, G.E. Film drainage between two surfactant-coated drops colliding at constant approach velocity. J. Colloid Interface Sci. 2003, 257, 93–107. [Google Scholar] [CrossRef] [PubMed]
- Wang, Z.H.; Lu, P.; Wang, Y.; Yang, C.; Mao, Z.S. Experimental investigation and numerical simulation of marangoni effect induced by mass transfer during drop formation. AIchE J. 2013, 59, 4424–4439. [Google Scholar] [CrossRef]
- Sawistowski, V.H.; James, B.R. Einfluß von oberflächenerscheinungen auf die stoffdurchgangszahlen bei der flüssig-flüssig-extraktion. Chem. Ing. Tech. 1963, 35, 175–179. [Google Scholar] [CrossRef]
- Heine, J.S.; Bart, H.J. Mass transfer during droplet formation—A measuring technique study. Chem. Ing. Tech. 2017, 89, 1635–1641. [Google Scholar] [CrossRef]
- Lan, W.J.; Cai, P.X.; Jing, S.; Li, S.W. Study on the dynamic interfacial tension with micro interface sensor. Chem. Eng. Sci. 2023, 268, 118439. [Google Scholar] [CrossRef]
- Wang, Z.Z.; Chen, J.; Feng, X.; Mao, Z.S.; Yang, C. Visual dynamical measurement of the solute-induced Marangoni effect of a growing drop with a PLIF method. Chem. Eng. Sci. 2021, 233, 116401. [Google Scholar] [CrossRef]
- Heine, J.S.; Bart, H.J. Visualization of Mass Transfer during Droplet Formation. Chem. Eng. Technol. 2019, 42, 1388–1394. [Google Scholar] [CrossRef]
- Heine, J.S.; Schulz, J.M.; Junne, H.; Bohm, L.; Kraume, M.; Bart, H.J. Real-time visualization of internal and external concentration fields in multiphase systems via laser-induced fluorescence and rainbow schlieren deflectometry during and after droplet production. Chem. Ing. Tech. 2021, 93, 180–190. [Google Scholar] [CrossRef]
- Wegener, M.; Paschedag, A.R.; Kraume, M. Experimental examinations as well as 2D-and 3D simulations of mass transport in single drops with Marangoni convection. Chem. Ing. Tech. 2007, 79, 73–81. [Google Scholar] [CrossRef]
- Engberg, R.E.; Wegener, M.; Kenig, E.Y. The impact of Marangoni convection on fluid dynamics and mass transfer at deformable single rising droplets - A numerical study. Chem. Eng. Sci. 2014, 116, 208–222. [Google Scholar] [CrossRef]
- Yang, Q.J.; Mao, Q.; Cao, W. Numerical simulation of the Marangoni flow on mass transfer from single droplet with different Reynolds numbers. Colloid Surf. A 2022, 639, 128385. [Google Scholar] [CrossRef]
- Johansson, P.; Galliero, G.; Legendre, D. How molecular effects affect solutal Marangoni flows. Phys. Rev. Fluid 2022, 7, 064202. [Google Scholar] [CrossRef]
- Imai, Y.; Yamamoto, T.; Sekimoto, A.; Okano, Y.; Sato, R.; Shigeta, Y. Numerical investigation of the nano-scale solutal Marangoni convections. J. Taiwan Inst. Chem. Eng. 2019, 98, 20–26. [Google Scholar] [CrossRef]
- Liu, Y.W.; Ganti, R.; Burton, H.G.A.; Zhang, X.R.; Wang, W.C.; Frenkel, D. Microscopic Marangoni flows cannot be predicted on the basis of pressure gradients. Phys. Rev. Lett. 2017, 119, 224502. [Google Scholar] [CrossRef]
- Kalli, M.; Chagot, L.; Angeli, P. Comparison of surfactant mass transfer with drop formation times from dynamic interfacial tension measurements in microchannels. Colloid Interface Sci. 2022, 605, 204–213. [Google Scholar] [CrossRef]
- Liang, X. Dynamic Interfacial Tension and Adsorption Kinetics of Surfactants during Liquid/liquid Micro-Dispersion Process. Ph.D. Thesis, Tsinghua University, Beijing, China, 2022. [Google Scholar]
- Cui, Y.J.; Li, Y.K.; Wang, K.; Deng, J.; Luo, G.S. Determination of dynamic interfacial tension during the generation of tiny droplets in the liquid-liquid jetting flow regime. Langmuir 2020, 36, 13633–13641. [Google Scholar] [CrossRef]
- Adler, J.J.; Rabinovich, Y.I.; Moudgil, B.M. Origins of the non-DLVO force between glass surfaces in aqueous solution. J. Colloid Interface Sci. 2001, 237, 249–258. [Google Scholar] [CrossRef] [PubMed]
- Fa, K.Q.; Nguyen, A.V.; Miller, J.D. Hydrophobic attraction as revealed by AFM force measurements and molecular dynamics simulation. J. Phys. Chem. B 2005, 109, 13112–13118. [Google Scholar] [CrossRef] [PubMed]
- Ducker, W.A.; Xu, Z.; Clarke, D.R.; Israelachvili, J.N. Forces between alumina surfaces in salt-solutions: Non-DLVO forces and the implications for colloidal processing. J. Am. Ceram. Soc. 1994, 77, 437–443. [Google Scholar] [CrossRef]
- Christenson, H.K. Non-DLVO forces between surfaces-solvation, hydration and capillary effects. J. Dispers. Sci. 1988, 9, 171–206. [Google Scholar] [CrossRef]
- Petkov, J.; Senechal, J.; Guimberteau, F.; Leal-Calderon, F. Indirect evidence for non-DLVO forces in emulsions. Langmuir 1998, 14, 4011–4016. [Google Scholar] [CrossRef]
- Dagastine, R.R.; Chau, T.T.; Chan, D.Y.C.; Stevens, G.W.; Grieser, F. Interaction forces between oil-water particle interfaces—Non-DLVO forces. Faraday Discuss. 2005, 129, 111–124. [Google Scholar] [CrossRef]
- Smith, A.M.; Borkovec, M.; Trefalt, G. Forces between solid surfaces in aqueous electrolyte solutions. Adv. Colloid Interface Sci. 2020, 275, 102078. [Google Scholar] [CrossRef]
- Israelachvili, J.N.; Tabor, D. The measurement of van der Waals dispersion forces in the range 1.5 to 130 nm. Proc. Math. Phys. Eng. Sci. 1972, 331, 19–38. [Google Scholar]
- Helden, L.; Dietrich, K.; Bechinger, C. Interactions of colloidal particles and droplets with water-oil interfaces measured by total internal reflection microscopy. Langmuir 2016, 32, 13752–13758. [Google Scholar] [CrossRef]
- Prieve, D.C. Measurement of colloidal forces with TIRM. Adv. Colloid Interface Sci. 1999, 82, 93–125. [Google Scholar] [CrossRef]
- Dagastine, R.R.; Stevens, G.W.; Chan, D.Y.C.; Grieser, F. Forces between two oil drops in aqueous solution measured by AFM. J. Colloid Interface Sci. 2004, 273, 339–342. [Google Scholar] [CrossRef] [PubMed]
- Dagastine, R.R.; Manica, R.; Carnie, S.L.; Chan, D.Y.C.; Stevens, G.W.; Grieser, F. Dynamic forces between two deformable oil droplets in water. Science 2006, 313, 210–213. [Google Scholar] [CrossRef] [PubMed]
- Webber, G.B.; Edwards, S.A.; Stevens, G.W.; Grieser, F.; Dagastine, R.R.; Chan, D.Y.C. Measurements of dynamic forces between drops with the AFM: Novel considerations in comparisons between experiment and theory. Soft Matter 2008, 4, 1270–1278. [Google Scholar] [CrossRef]
- Lockie, H.; Manica, R.; Tabor, R.F.; Stevens, G.W.; Grieser, F.; Chan, D.Y.C.; Dagastine, R.R. Anomalous pull-off forces between surfactant-free emulsion drops in different aqueous electrolytes. Langmuir 2012, 28, 4259–4266. [Google Scholar] [CrossRef]
- Manor, O.; Chau, T.T.; Stevens, G.W.; Chan, D.Y.C.; Grieser, F.; Dagastine, R.R. Polymeric stabilized emulsions: Steric effects and deformation in soft systems. Langmuir 2012, 28, 4599–4604. [Google Scholar] [CrossRef] [PubMed]
- Chen, A.; Luo, G.S.; Xu, J.H. Research progress on quantitative exploration of the interaction mechanism between droplets. CIESC J. 2021, 72, 5955–5964. [Google Scholar]
- Nilsen-Nygaard, J.; Sletmoen, M.; Draget, K.I. Stability and interaction forces of oil-in-water emulsions as observed by optical tweezers - a proof-of-concept study. RSC Adv. 2014, 4, 52220–52229. [Google Scholar] [CrossRef]
- Chen, A.; Li, S.W.; Sang, F.N.; Zeng, H.B.; Xu, J.H. Interactions between micro-scale oil droplets in aqueous surfactant solution determined using optical tweezers. J. Colloid Interface Sci. 2018, 532, 128–135. [Google Scholar] [CrossRef]
- Chen, A.; Li, S.W.; Xu, J.H. A novel approach to study the interactions between polymeric stabilized micron-sized oil droplets by optical tweezers. Chin. J. Chem. Eng. 2020, 28, 1368–1374. [Google Scholar] [CrossRef]
- Lan, W.J.; Cai, D.Z.; Hu, X.J.; Jing, S.; Li, S.W. Determination of dynamic interactions of droplets in continuous fluids using droplet probe. J. Colloid Interface Sci. 2022, 605, 91–100. [Google Scholar] [CrossRef]
- Wada, S.; Kikura, H.; Aritomi, M. Pattern recognition and signal processing of ultrasonic echo signal on two-phase flow. Flow Meas. Instrum. 2006, 17, 207–224. [Google Scholar] [CrossRef]
- Wolf, A.; Jayanti, S.; Hewitt, G.F. Flow development in vertical annular flow. Chem. Eng. Sci. 2001, 56, 3221–3235. [Google Scholar] [CrossRef]
- Xue, T.; Li, Z.L.; Li, C.Y.; Wu, B. Measurement of thickness of annular liquid films based on distortion correction of laser-induced fluorescence imaging. Rev. Sci. Instrum. 2019, 90, 033103. [Google Scholar] [CrossRef] [PubMed]
- Miklavcic, S.J.; Fung, C. Quantifying the force between mercury and mica across an ionic liquid using white light interferometry. J. Colloid Interface Sci. 2019, 538, 218–227. [Google Scholar] [CrossRef]
- Xie, L.; Shi, C.; Cui, X.; Zeng, H.B. Surface forces and interaction mechanisms of emulsion drops and gas bubbles in complex fluids. Langmuir 2017, 33, 3911–3925. [Google Scholar] [CrossRef]
- Liu, B.; Manica, R.; Liu, Q.X.; Klaseboer, E.; Xu, Z.H.; Xie, G.Y. Coalescence of bubbles with mobile interfaces in water. Phys. Rev. Lett. 2019, 122, 194501. [Google Scholar] [CrossRef] [PubMed]
- Liu, B.; Manica, R.; Zhang, X.R.; Bussonniere, A.; Xu, Z.H.; Xie, G.Y.; Liu, Q.X. Dynamic interaction between a millimeter-sized bubble and surface microbubbles in water. Langmuir 2018, 34, 11667–11675. [Google Scholar] [CrossRef]
Figure 1.
Droplet behaviors in a pulsed disc-and-doughnut column with wettable internal plates [44].
Figure 1.
Droplet behaviors in a pulsed disc-and-doughnut column with wettable internal plates [44].

Figure 2.
Comparison of droplet size distributions between augmented PBM and original PBM. Reprinted with permission from Ref. [46]. 2020, ACS (American Chemical Society).
Figure 2.
Comparison of droplet size distributions between augmented PBM and original PBM. Reprinted with permission from Ref. [46]. 2020, ACS (American Chemical Society).

Figure 3.
Statistical results of droplet breakup frequency function (DBFF) in a pulsed disc-and-doughnut column. (a) The DBFF at different heights under mass transfer conditions. (b) The DBFF at different heights for the blank experiments without mass transfer. Reprinted with permission from Ref. [78]. 2020, Wiley (John Wiley and Sons).

Figure 4.
Some typical devices for droplet coalescence studies. (a) Microfluidic device; (b) coalescence cell. Reprinted with permission from Ref. [87]. 2020, ACS (American Chemical Society). Reprinted with permission from Ref. [89]. 2014, Elsevier.

Figure 5.
The setup using a bubble and a droplet as probes to analyze the mass transfer process. Reprinted with permission from Ref. [108]. 2023, Elsevier.
Figure 5.
The setup using a bubble and a droplet as probes to analyze the mass transfer process. Reprinted with permission from Ref. [108]. 2023, Elsevier.

Figure 6.
Visualized Marangoni effect during droplet formation. Reprinted with permission from Ref. [110]. 2019, Wiley (John Wiley and Sons).
Figure 6.
Visualized Marangoni effect during droplet formation. Reprinted with permission from Ref. [110]. 2019, Wiley (John Wiley and Sons).

Figure 7.
Streamlines and concentration fields of simulations without (top) and with Marangoni convection (cA0 = 0.9 g/L (middle), cA0 = 3.7 g/L (bottom), and cA0 was the initial concentration of acetone in the droplet) after a rise time of 0.1 s, 0.5 s, and 1 s ((left) to (right)). Reprinted with permission from Ref. [113]. 2014, Elsevier.

Figure 8.
Schematic diagram of the generation mechanism of the interfacial relaxation force [79].
Figure 8.
Schematic diagram of the generation mechanism of the interfacial relaxation force [79].

Figure 9.
Schematic diagram of tools for direct force measurements. (a) Surface force apparatus (SFA); (b) Atomic force microscopy (AFM); (c) Total internal reflection properties (TIRM); and (d) Optical tweezers. Reprinted with permission from Ref. [127]. 2020, Elsevier.
Figure 9.
Schematic diagram of tools for direct force measurements. (a) Surface force apparatus (SFA); (b) Atomic force microscopy (AFM); (c) Total internal reflection properties (TIRM); and (d) Optical tweezers. Reprinted with permission from Ref. [127]. 2020, Elsevier.

Figure 10.
Measuring the force between two droplets by using profile deformation. Reprinted with permission from Ref. [140]. 2022, Elsevier.
Figure 10.
Measuring the force between two droplets by using profile deformation. Reprinted with permission from Ref. [140]. 2022, Elsevier.

Table 1.
The effect of mass transfer direction on performance parameters.
| Parameters | d→c | c→d | Authors |
|---|---|---|---|
| Sauter mean diameter, d32 | Higher | Lower | Rohlfing et al. [29] |
| Hold-up, φ | Lower | Higher | Tsouris et al. [32] |
| Flooding velocity, uf | Higher | Lower | Yu et al. [34] |
| Axial dispersion coefficient, Ec | Lower | Higher | Panahinia et al. [36] |
| Mass transfer coefficient, K | Higher | Lower | Torab-Mostaedi et al. [41] Asadollahzadeh et al. [42] |
Table 2.
The characteristic parameters of PBM [43].
Table 2.
The characteristic parameters of PBM [43].
| Type of Model | Characteristic Parameters |
|---|---|
| Euler-Euler model (Null-element) | d32 |
| Unary population balanced model | Diameter or volume |
| Binary population balanced model | Diameter or volume, and concentration |
Table 3.
Studies on CFD-PBM simulation.
| Authors | Extractors |
|---|---|
| Drumm et al. [47] | Rotating disc column |
| Mirzaie et al. [48] | Pulsed packing column |
| Amokrane et al. [49] | Pulsed disc-and-doughnut column |
| Yu et al. [50] | Pulsed disc-and-doughnut column |
| Zhou et al. [51] | Pump-mixer |
Table 4.
Studies on micro-dispersion.
| Authors | Experimental Setup | Conditions | Objectives |
|---|---|---|---|
| Xu et al. [56] | T-junction microchannel | No mass transfer | Effect of μc |
| Steegmans et al. [57] | Y-junction microchannel | No mass transfer | Effect of μd |
| Xu et al. [58] | Micrometer screen hole | No mass transfer | Effect of γ |
| Xu et al. [59] | Coaxial microchannel | No mass transfer | Equilibrium interfacial tension |
| Zhou et al. [60] | Microchannel with tapered sub-channels | No mass transfer | Equilibrium interfacial tension |
| Wang et al. [61] | T-junction microchannel | Surfactant adsorption | Dynamic interfacial tension |
| Wang et al. [62] | T-junction microchannel | Surfactant adsorption | Dynamic interfacial tension |
| Brosseau et al. [63] | Microchannel with a chamber | Surfactant adsorption | Dynamic interfacial tension |
| Moiré et al. [64] | Coaxial microchannel | Surfactant adsorption | Dynamic interfacial tension |
| Li et al. [65] | T-junction microchannel | Mass transfer Chemical reaction | Effect of mass transfer and chemical reaction |
| Lan et al. [66] | Coaxial microchannel | Mass transfer | Dynamic interfacial tension |
| Lan et al. [67] | Coaxial microchannel | Mass transfer | Dynamic interfacial tension |
Table 6.
Influencing factors on coalescence [81].
Table 6.
Influencing factors on coalescence [81].
| Promote Factors | Inhibit Factors | No or Undefined Factors |
|---|---|---|
| Interfacial tension Electrostatic field Temperature Surface wetting Mass transfer d→c | Surface potential, pH Energy input Viscosity Surface active component Mass transfer c→d | Droplet diameter Ionic strength Pressure Density |
Table 7.
Comparison of force measurement tools.
| Measurement Tools | Applied Systems | Advantages | Disadvantages |
|---|---|---|---|
| SFA [128] | Force between two planes | Directly measure the absolute separation distance between the two planes | Cannot measure the force between two droplets |
| TIRM [127,129,130] | Force between colloid (6–30 μm) and flat substrate | High distance resolution and high force resolution | Cannot measure the force between two droplets |
| AFM [131,132,133,134,135] | Force between two particles Force between particle and substrate Particle size (20–200 μm) | Measure the force between droplets directly; Have mature theory support | Cannot measure the front distance between two droplets during the film drainage process |
| Optical tweezers [136,137,138,139] | Force between two particles (0.1–10 μm) | Measure the force between micro-scale droplets directly | Fewer studies; Lack of theoretical model support |
| Droplet probe [140] | Force between two droplets (1–2 mm) | Simplicity Low cost Visual results | Cannot measure the front distance between two droplets during the film drainage process |
Disclaimer/Publisher’s Note: The statements, opinions and data contained in all publications are solely those of the individual author(s) and contributor(s) and not of MDPI and/or the editor(s). MDPI and/or the editor(s) disclaim responsibility for any injury to people or property resulting from any ideas, methods, instructions or products referred to in the content. |
© 2023 by the authors. Licensee MDPI, Basel, Switzerland. This article is an open access article distributed under the terms and conditions of the Creative Commons Attribution (CC BY) license (https://creativecommons.org/licenses/by/4.0/).
Share and Cite
MDPI and ACS Style
Yu, S.; Zhang, J.; Li, S.; Chen, Z.; Wang, Y. Mass Transfer and Droplet Behaviors in Liquid-Liquid Extraction Process Based on Multi-Scale Perspective: A Review. Separations 2023, 10, 264. https://doi.org/10.3390/separations10040264
AMA Style
Yu S, Zhang J, Li S, Chen Z, Wang Y. Mass Transfer and Droplet Behaviors in Liquid-Liquid Extraction Process Based on Multi-Scale Perspective: A Review. Separations. 2023; 10(4):264. https://doi.org/10.3390/separations10040264
Chicago/Turabian StyleYu, Sicen, Jiyizhe Zhang, Shaowei Li, Zhuo Chen, and Yundong Wang. 2023. "Mass Transfer and Droplet Behaviors in Liquid-Liquid Extraction Process Based on Multi-Scale Perspective: A Review" Separations 10, no. 4: 264. https://doi.org/10.3390/separations10040264
Note that from the first issue of 2016, this journal uses article numbers instead of page numbers. See further details here.