
Aroma Profile of Grapevine Chips after Roasting: A Comparative Study of Sorbara and Spergola Cultivars for More Sustainable Oenological Production

Abstract
:1. Introduction
2. Materials and Methods
2.1. Sample Preparation
2.2. Proximate Composition
2.3. TGA-MS-EGA
2.4. Volatile Organic Compounds Sampling: HS-SPME
2.5. GC-MS Analysis
2.6. Statistical Analysis
2.7. Chemicals and Reagents
3. Results
3.1. Proximate Composition
3.2. TGA-MS-EGA Analysis
3.3. HS-SPME-GC-MS
4. Conclusions
Author Contributions
Funding
Data Availability Statement
Conflicts of Interest
References
- D’Eusanio, V.; Malferrari, D.; Marchetti, A.; Roncaglia, F.; Tassi, L. Waste By-Product of Grape Seed Oil Production: Chemical Characterization for Use as a Food and Feed Supplement. Life 2023, 13, 326. [Google Scholar] [CrossRef]
- Albergamo, A.; Costa, R.; Bartolomeo, G.; Rando, R.; Vadalà, R.; Nava, V.; Gervasi, T.; Toscano, G.; Germanò, M.P.; D’Angelo, V.; et al. Grape Water: Reclaim and Valorization of a By-product from the Industrial Cryoconcentration of Grape (Vitis vinifera) Must. J. Sci. Food Agric. 2020, 100, 2971–2981. [Google Scholar] [CrossRef] [PubMed]
- OIV. State of the World Vine and Wine Sector 2021. Available online: https://www.oiv.int/sites/default/files/documents/eng-state-of-the-world-vine-and-wine-sector-april-2022-v6_0.pdf (accessed on 10 April 2023).
- Famiyeh, L.; Chen, K.; Xu, J.; Sun, Y.; Guo, Q.; Wang, C.; Lv, J.; Tang, Y.-T.; Yu, H.; Snape, C.; et al. A Review on Analysis Methods, Source Identification, and Cancer Risk Evaluation of Atmospheric Polycyclic Aromatic Hydrocarbons. Sci. Total Environ. 2021, 789, 147741. [Google Scholar] [CrossRef] [PubMed]
- Ogawa, M.; Yoshida, N. Nitrous Oxide Emission from the Burning of Agricultural Residue. Atmos. Environ. 2005, 39, 3421–3429. [Google Scholar] [CrossRef]
- D’Eusanio, V.; Genua, F.; Marchetti, A.; Morelli, L.; Tassi, L. Characterization of Some Stilbenoids Extracted from Two Cultivars of Lambrusco—Vitis Vinifera Species: An Opportunity to Valorize Pruning Canes for a More Sustainable Viticulture. Molecules 2023, 28, 4074. [Google Scholar] [CrossRef]
- Lambert, C.; Richard, T.; Renouf, E.; Bisson, J.; Waffo-Téguo, P.; Bordenave, L.; Ollat, N.; Mérillon, J.-M.; Cluzet, S. Comparative Analyses of Stilbenoids in Canes of Major Vitis Vinifera L. Cultivars. J. Agric. Food Chem. 2013, 61, 11392–11399. [Google Scholar] [CrossRef]
- Rivière, C.; Pawlus, A.D.; Mérillon, J.-M. Natural Stilbenoids: Distribution in the Plant Kingdom and Chemotaxonomic Interest in Vitaceae. Nat. Prod. Rep. 2012, 29, 1317. [Google Scholar] [CrossRef]
- Athar, M.; Back, J.; Tang, X.; Kim, K.; Kopelovich, L.; Bickers, D.; Kim, A. Resveratrol: A Review of Preclinical Studies for Human Cancer Prevention. Toxicol. Appl. Pharmacol. 2007, 224, 274–283. [Google Scholar] [CrossRef]
- Gómez-Zorita, S.; Milton-Laskibar, I.; Eseberri, I.; Beaumont, P.; Courtois, A.; Krisa, S.; Portillo, M.P. Beneficial Effects of ε-Viniferin on Obesity and Related Health Alterations. Nutrients 2023, 15, 928. [Google Scholar] [CrossRef]
- Chang, X.; Heene, E.; Qiao, F.; Nick, P. The Phytoalexin Resveratrol Regulates the Initiation of Hypersensitive Cell Death in Vitis Cell. PLoS ONE 2011, 6, e26405. [Google Scholar] [CrossRef]
- Sánchez-Gómez, R.; Zalacain, A.; Alonso, G.L.; Salinas, M.R. Vine-Shoot Waste Aqueous Extracts for Re-Use in Agriculture Obtained by Different Extraction Techniques: Phenolic, Volatile, and Mineral Compounds. J. Agric. Food Chem. 2014, 62, 10861–10872. [Google Scholar] [CrossRef] [PubMed]
- UN General Assembly. Transforming Our World: The 2030 Agenda for Sustainable Development; A/RES/70/1; United Nations: Nairobi, Kenya, 2015.
- D’Eusanio, V.; Maletti, L.; Marchetti, A.; Roncaglia, F.; Tassi, L. Volatile Aroma Compounds of Gavina® Watermelon (Citrullus Lanatus L.) Dietary Fibers to Increase Food Sustainability. AppliedChem 2023, 3, 66–88. [Google Scholar] [CrossRef]
- Maletti, L.; D’Eusanio, V.; Durante, C.; Marchetti, A.; Pincelli, L.; Tassi, L. Comparative Analysis of VOCs from Winter Melon Pomace Fibers before and after Bleaching Treatment with H2O2. Molecules 2022, 27, 2336. [Google Scholar] [CrossRef] [PubMed]
- Maletti, L.; D’Eusanio, V.; Durante, C.; Marchetti, A.; Tassi, L. VOCs Analysis of Three Different Cultivars of Watermelon (Citrullus Lanatus L.) Whole Dietary Fiber. Molecules 2022, 27, 8747. [Google Scholar] [CrossRef] [PubMed]
- AOAC. Official Methods of Analysis of the Association of Official’s Analytical Chemists, 14th ed.; Associataion of Official Analytical Chemist: Washington, DC, USA, 1990; Volume 223–225, pp. 992–995. [Google Scholar]
- González Martínez, M.; Anca Couce, A.; Dupont, C.; da Silva Perez, D.; Thiéry, S.; Meyer, X.; Gourdon, C. Torrefaction of Cellulose, Hemicelluloses and Lignin Extracted from Woody and Agricultural Biomass in TGA-GC/MS: Linking Production Profiles of Volatile Species to Biomass Type and Macromolecular Composition. Ind. Crops Prod. 2022, 176, 114350. [Google Scholar] [CrossRef]
- Brebu, M.; Tamminen, T.; Spiridon, I. Thermal Degradation of Various Lignins by TG-MS/FTIR and Py-GC-MS. J. Anal. Appl. Pyrolysis 2013, 104, 531–539. [Google Scholar] [CrossRef]
- Wang, S.; Dai, G.; Yang, H.; Luo, Z. Lignocellulosic Biomass Pyrolysis Mechanism: A State-of-the-Art Review. Prog. Energy Combust. Sci. 2017, 62, 33–86. [Google Scholar] [CrossRef]
- Farrell, R.R.; Wellinger, M.; Gloess, A.N.; Nichols, D.S.; Breadmore, M.C.; Shellie, R.A.; Yeretzian, C. Real-Time Mass Spectrometry Monitoring of Oak Wood Toasting: Elucidating Aroma Development Relevant to Oak-Aged Wine Quality. Sci. Rep. 2015, 5, 17334. [Google Scholar] [CrossRef]
- Duval, C.J.; Sok, N.; Laroche, J.; Gourrat, K.; Prida, A.; Lequin, S.; Chassagne, D.; Gougeon, R.D. Dry vs Soaked Wood: Modulating the Volatile Extractible Fraction of Oak Wood by Heat Treatments. Food Chem. 2013, 138, 270–277. [Google Scholar] [CrossRef]
- D’Eusanio, V.; Genua, F.; Marchetti, A.; Morelli, L.; Tassi, L. Exploring the Mineral Composition of Grapevine Canes for Wood Chip Applications in Alcoholic Beverage Production to Enhance Viticulture Sustainability. Beverages 2023, 9, 60. [Google Scholar] [CrossRef]
- Official Journal of the European Union Regulation (EC) No 1107/2009 of the European Parliament and of the Council of 21 October 2009 Concerning the Placing of Plant Protection Products on the Market and Repealing Council Directives 79/117/EEC and 91/414/EEC 2009. Official Journal of the European Union. L 309/1. Available online: https://eur-lex.europa.eu/LexUriServ/LexUriServ.do?uri=OJ:L:2009:309:0001:0050:en:PDF (accessed on 20 March 2023).
- Dorosh, O.; Fernandes, V.C.; Moreira, M.M.; Delerue-Matos, C. Occurrence of Pesticides and Environmental Contaminants in Vineyards: Case Study of Portuguese Grapevine Canes. Sci. Total Environ. 2021, 791, 148395. [Google Scholar] [CrossRef] [PubMed]
- Moldes, A.B.; Bustos, G.; Torrado, A.; Domínguez, J.M. Comparison between Different Hydrolysis Processes of Vine-Trimming Waste to Obtain Hemicellulosic Sugars for Further Lactic Acid Conversion. Appl. Biochem. Biotechnol. 2007, 143, 244–256. [Google Scholar] [CrossRef] [PubMed]
- Max, B.; Salgado, J.M.; Cortés, S.; Domínguez, J.M. Extraction of Phenolic Acids by Alkaline Hydrolysis from the Solid Residue Obtained after Prehydrolysis of Trimming Vine Shoots. J. Agric. Food Chem. 2010, 58, 1909–1917. [Google Scholar] [CrossRef] [PubMed]
- Dávila, I.; Gordobil, O.; Labidi, J.; Gullón, P. Assessment of Suitability of Vine Shoots for Hemicellulosic Oligosaccharides Production through Aqueous Processing. Bioresour. Technol. 2016, 211, 636–644. [Google Scholar] [CrossRef]
- Jesus, M.S.; Romaní, A.; Genisheva, Z.; Teixeira, J.A.; Domingues, L. Integral Valorization of Vine Pruning Residue by Sequential Autohydrolysis Stages. J. Clean. Prod. 2017, 168, 74–86. [Google Scholar] [CrossRef]
- Blackford, M.; Comby, M.; Zeng, L.; Dienes-Nagy, Á.; Bourdin, G.; Lorenzini, F.; Bach, B. A Review on Stems Composition and Their Impact on Wine Quality. Molecules 2021, 26, 1240. [Google Scholar] [CrossRef]
- McKendry, P. Energy Production from Biomass (Part 1): Overview of Biomass. Bioresour. Technol. 2002, 83, 37–46. [Google Scholar] [CrossRef]
- González-Centeno, M.R.; Rosselló, C.; Simal, S.; Garau, M.C.; López, F.; Femenia, A. Physico-Chemical Properties of Cell Wall Materials Obtained from Ten Grape Varieties and Their Byproducts: Grape Pomaces and Stems. LWT—Food Sci. Technol. 2010, 43, 1580–1586. [Google Scholar] [CrossRef]
- Ping, L.; Brosse, N.; Sannigrahi, P.; Ragauskas, A. Evaluation of Grape Stalks as a Bioresource. Ind. Crops Prod. 2011, 33, 200–204. [Google Scholar] [CrossRef]
- Sánchez-Gómez, R.; Alonso, G.L.; Salinas, M.R.; Zalacain, A. Reuse of Vine-Shoots Wastes for Agricultural Purposes. In Handbook of Grape Processing By-Products; Elsevier: Amsterdam, The Netherlands, 2017; pp. 79–104. ISBN 978-0-12-809870-7. [Google Scholar]
- Çetin, E.S.; Altinöz, D.; Tarçan, E.; Göktürk Baydar, N. Chemical Composition of Grape Canes. Ind. Crops Prod. 2011, 34, 994–998. [Google Scholar] [CrossRef]
- Mendívil, M.A.; Muñoz, P.; Morales, M.P.; Juárez, M.C.; García-Escudero, E. Chemical Characterization of Pruned Vine Shoots from La Rioja (Spain) for Obtaining Solid Bio-Fuels. J. Renew. Sustain. Energy 2013, 5, 033113. [Google Scholar] [CrossRef]
- Johnson, C.M. Differential Scanning Calorimetry as a Tool for Protein Folding and Stability. Arch. Biochem. Biophys. 2013, 531, 100–109. [Google Scholar] [CrossRef] [PubMed]
- Ojeda-Galván, H.J.; Hernández-Arteaga, A.C.; Rodríguez-Aranda, M.C.; Toro-Vazquez, J.F.; Cruz-González, N.; Ortíz-Chávez, S.; Comas-García, M.; Rodríguez, A.G.; Navarro-Contreras, H.R. Application of Raman Spectroscopy for the Determination of Proteins Denaturation and Amino Acids Decomposition Temperature. Spectrochim. Acta. A Mol. Biomol. Spectrosc. 2023, 285, 121941. [Google Scholar] [CrossRef] [PubMed]
- Şen, D.; Gökmen, V. Kinetic Modeling of Maillard and Caramelization Reactions in Sucrose-Rich and Low Moisture Foods Applied for Roasted Nuts and Seeds. Food Chem. 2022, 395, 133583. [Google Scholar] [CrossRef] [PubMed]
- Weiss, I.M.; Muth, C.; Drumm, R.; Kirchner, H.O.K. Thermal Decomposition of the Amino Acids Glycine, Cysteine, Aspartic Acid, Asparagine, Glutamic Acid, Glutamine, Arginine and Histidine. BMC Biophys. 2018, 11, 2. [Google Scholar] [CrossRef] [PubMed]
- Salema, A.A.; Ting, R.M.W.; Shang, Y.K. Pyrolysis of Blend (Oil Palm Biomass and Sawdust) Biomass Using TG-MS. Bioresour. Technol. 2019, 274, 439–446. [Google Scholar] [CrossRef]
- Ding, Y.; Huang, B.; Li, K.; Du, W.; Lu, K.; Zhang, Y. Thermal Interaction Analysis of Isolated Hemicellulose and Cellulose by Kinetic Parameters during Biomass Pyrolysis. Energy 2020, 195, 117010. [Google Scholar] [CrossRef]
- Yang, H.; Yan, R.; Chin, T.; Liang, D.T.; Chen, H.; Zheng, C. Thermogravimetric Analysis−Fourier Transform Infrared Analysis of Palm Oil Waste Pyrolysis. Energy Fuels 2004, 18, 1814–1821. [Google Scholar] [CrossRef]
- Zhao, C.; Jiang, E.; Chen, A. Volatile Production from Pyrolysis of Cellulose, Hemicellulose and Lignin. J. Energy Inst. 2017, 90, 902–913. [Google Scholar] [CrossRef]
- Yeo, J.Y.; Chin, B.L.F.; Tan, J.K.; Loh, Y.S. Comparative Studies on the Pyrolysis of Cellulose, Hemicellulose, and Lignin Based on Combined Kinetics. J. Energy Inst. 2019, 92, 27–37. [Google Scholar] [CrossRef]
- Wei, M.; Ma, T.; Ge, Q.; Li, C.; Zhang, K.; Fang, Y.; Sun, X. Challenges and Opportunities of Winter Vine Pruning for Global Grape and Wine Industries. J. Clean. Prod. 2022, 380, 135086. [Google Scholar] [CrossRef]
- Hofmann, T.; Schieberle, P. Formation of Aroma-Active Strecker-Aldehydes by a Direct Oxidative Degradation of Amadori Compounds. J. Agric. Food Chem. 2000, 48, 4301–4305. [Google Scholar] [CrossRef] [PubMed]
- Gernat, D.C.; Brouwer, E.; Ottens, M. Aldehydes as Wort Off-Flavours in Alcohol-Free Beers—Origin and Control. Food Bioprocess Technol. 2020, 13, 195–216. [Google Scholar] [CrossRef]
- Gehlken, J.; Pour Nikfardjam, M.; Zörb, C. Prediction of Sensory Attributes in Winemaking Grapes by On-Line near-Infrared Spectroscopy Based on Selected Volatile Aroma Compounds. Anal. Bioanal. Chem. 2023, 415, 1515–1527. [Google Scholar] [CrossRef] [PubMed]
- Berger, R.G. Flavours and Fragances: Chemistry, Bioprocessing and Sustainability; Springer: Berlin/Heidelberg, Germany, 2007; ISBN 978-3-540-49338-9. [Google Scholar]
- Liu, J.; Wan, P.; Xie, C.; Chen, D.-W. Key Aroma-Active Compounds in Brown Sugar and Their Influence on Sweetness. Food Chem. 2021, 345, 128826. [Google Scholar] [CrossRef] [PubMed]
- Lin, X.; Sui, S.; Tan, S.; Pittman, C.U.; Sun, J.; Zhang, Z. Fast Pyrolysis of Four Lignins from Different Isolation Processes Using Py-GC/MS. Energies 2015, 8, 5107–5121. [Google Scholar] [CrossRef]
- Shen, D.; Liu, G.; Zhao, J.; Xue, J.; Guan, S.; Xiao, R. Thermo-Chemical Conversion of Lignin to Aromatic Compounds: Effect of Lignin Source and Reaction Temperature. J. Anal. Appl. Pyrolysis 2015, 112, 56–65. [Google Scholar] [CrossRef]
- Tipparaju, S.; Ravishankar, S.; Slade, P.J. Survival of Listeria Monocytogenes in Vanilla-Flavored Soy and Dairy Products Stored at 8 °C. J. Food Prot. 2004, 67, 378–382. [Google Scholar] [CrossRef]
- Ngarmsak, M.; Delaquis, P.; Toivonen, P.; Ngarmsak, T.; Ooraikul, B.; Mazza, G. Antimicrobial Activity of Vanillin against Spoilage Microorganisms in Stored Fresh-Cut Mangoes. J. Food Prot. 2006, 69, 1724–1727. [Google Scholar] [CrossRef]
- Durant, S. Vanillins—A Novel Family of DNA-PK Inhibitors. Nucleic Acids Res. 2003, 31, 5501–5512. [Google Scholar] [CrossRef]
- Bezerra, D.P.; Soares, A.K.N.; De Sousa, D.P. Overview of the Role of Vanillin on Redox Status and Cancer Development. Oxid. Med. Cell. Longev. 2016, 2016, 9734816. [Google Scholar] [CrossRef] [PubMed]
- Bosman, R.N.; Lashbrooke, J.G. Grapevine Mono- and Sesquiterpenes: Genetics, Metabolism, and Ecophysiology. Front. Plant Sci. 2023, 14, 1111392. [Google Scholar] [CrossRef] [PubMed]
- Bartikova, H.; Hanusova, V.; Skalova, L.; Ambroz, M.; Bousova, I. Antioxidant, Pro-Oxidant and Other Biological Activities of Sesquiterpenes. Curr. Top. Med. Chem. 2014, 14, 2478–2494. [Google Scholar] [CrossRef] [PubMed]
- Wu, Y.; Duan, S.; Zhao, L.; Gao, Z.; Luo, M.; Song, S.; Xu, W.; Zhang, C.; Ma, C.; Wang, S. Aroma Characterization Based on Aromatic Series Analysis in Table Grapes. Sci. Rep. 2016, 6, 31116. [Google Scholar] [CrossRef] [PubMed]
- Parker, M.; Pollnitz, A.P.; Cozzolino, D.; Francis, I.L.; Herderich, M.J. Identification and Quantification of a Marker Compound for ‘Pepper’ Aroma and Flavor in Shiraz Grape Berries by Combination of Chemometrics and Gas Chromatography−Mass Spectrometry. J. Agric. Food Chem. 2007, 55, 5948–5955. [Google Scholar] [CrossRef] [PubMed]
- Ulrich, D.; Hoberg, E.; Bittner, T.; Engewald, W.; Meilchen, K. Contribution of Volatile Compounds to the Flavor of Cooked Asparagus. Eur. Food Res. Technol. 2001, 213, 200–204. [Google Scholar] [CrossRef]
- Duckham, S.C.; Dodson, A.T.; Bakker, J.; Ames, J.M. Volatile Flavour Components of Baked Potato Flesh. A Comparison of Eleven Potato Cultivars. Nahr. 2001, 45, 317–323. [Google Scholar] [CrossRef]
- Cerny, C. 9—The Role of Sulfur Chemistry in Thermal Generation of Aroma. In Flavour Development, Analysis and Perception in Food and Beverages; Parker, J.K., Elmore, J.S., Methven, L., Eds.; Woodhead Publishing Series in Food Science, Technology and Nutrition; Woodhead Publishing: Sawston, UK, 2015; pp. 187–210. ISBN 978-1-78242-103-0. [Google Scholar]
- Naeher, L.P.; Brauer, M.; Lipsett, M.; Zelikoff, J.T.; Simpson, C.D.; Koenig, J.Q.; Smith, K.R. Woodsmoke Health Effects: A Review. Inhal. Toxicol. 2007, 19, 67–106. [Google Scholar] [CrossRef]
- IARC—International Agency for Research on Cancer. Available online: https://www.iarc.who.int/ (accessed on 12 April 2023).
- Bird, M.G.; Greim, H.; Snyder, R.; Rice, J.M. International Symposium: Recent Advances in Benzene Toxicity. Chem. Biol. Interact. 2005, 153–154, 1–5. [Google Scholar] [CrossRef]
- Salviano dos Santos, V.P.; Medeiros Salgado, A.; Guedes Torres, A.; Signori Pereira, K. Benzene as a Chemical Hazard in Processed Foods. Int. J. Food Sci. 2015, 2015, 545640. [Google Scholar] [CrossRef]

| Spergola | Sorbara | |
|---|---|---|
| Moisture % (at 105 °C) | 23.1 ± 0.4 | 17.9 ± 0.1 |
| Forced drying % (at 120 °C) | 34.3 ± 0.2 | 38.4 ± 0.2 |
| C % * | 45.0 ± 0.1 | 46.6 ± 0.4 |
| H % * | 6.99 ± 0.07 | 6.94 ± 0.08 |
| N % * | 0.50 ± 0.04 | 0.47 ± 0.03 |
| S % * | <0.1 | <0.1 |
| O% *# | 44.5 ± 0.4 | 42.9 ± 0.5 |
| Ash % | 3.01 ± 0.04 | 3.07 ± 0.06 |
| Cellulose $ | ~32–34 | |
| Hemicellulose $ | ~19–27 | |
| Lignin $ | ~26–28 | |
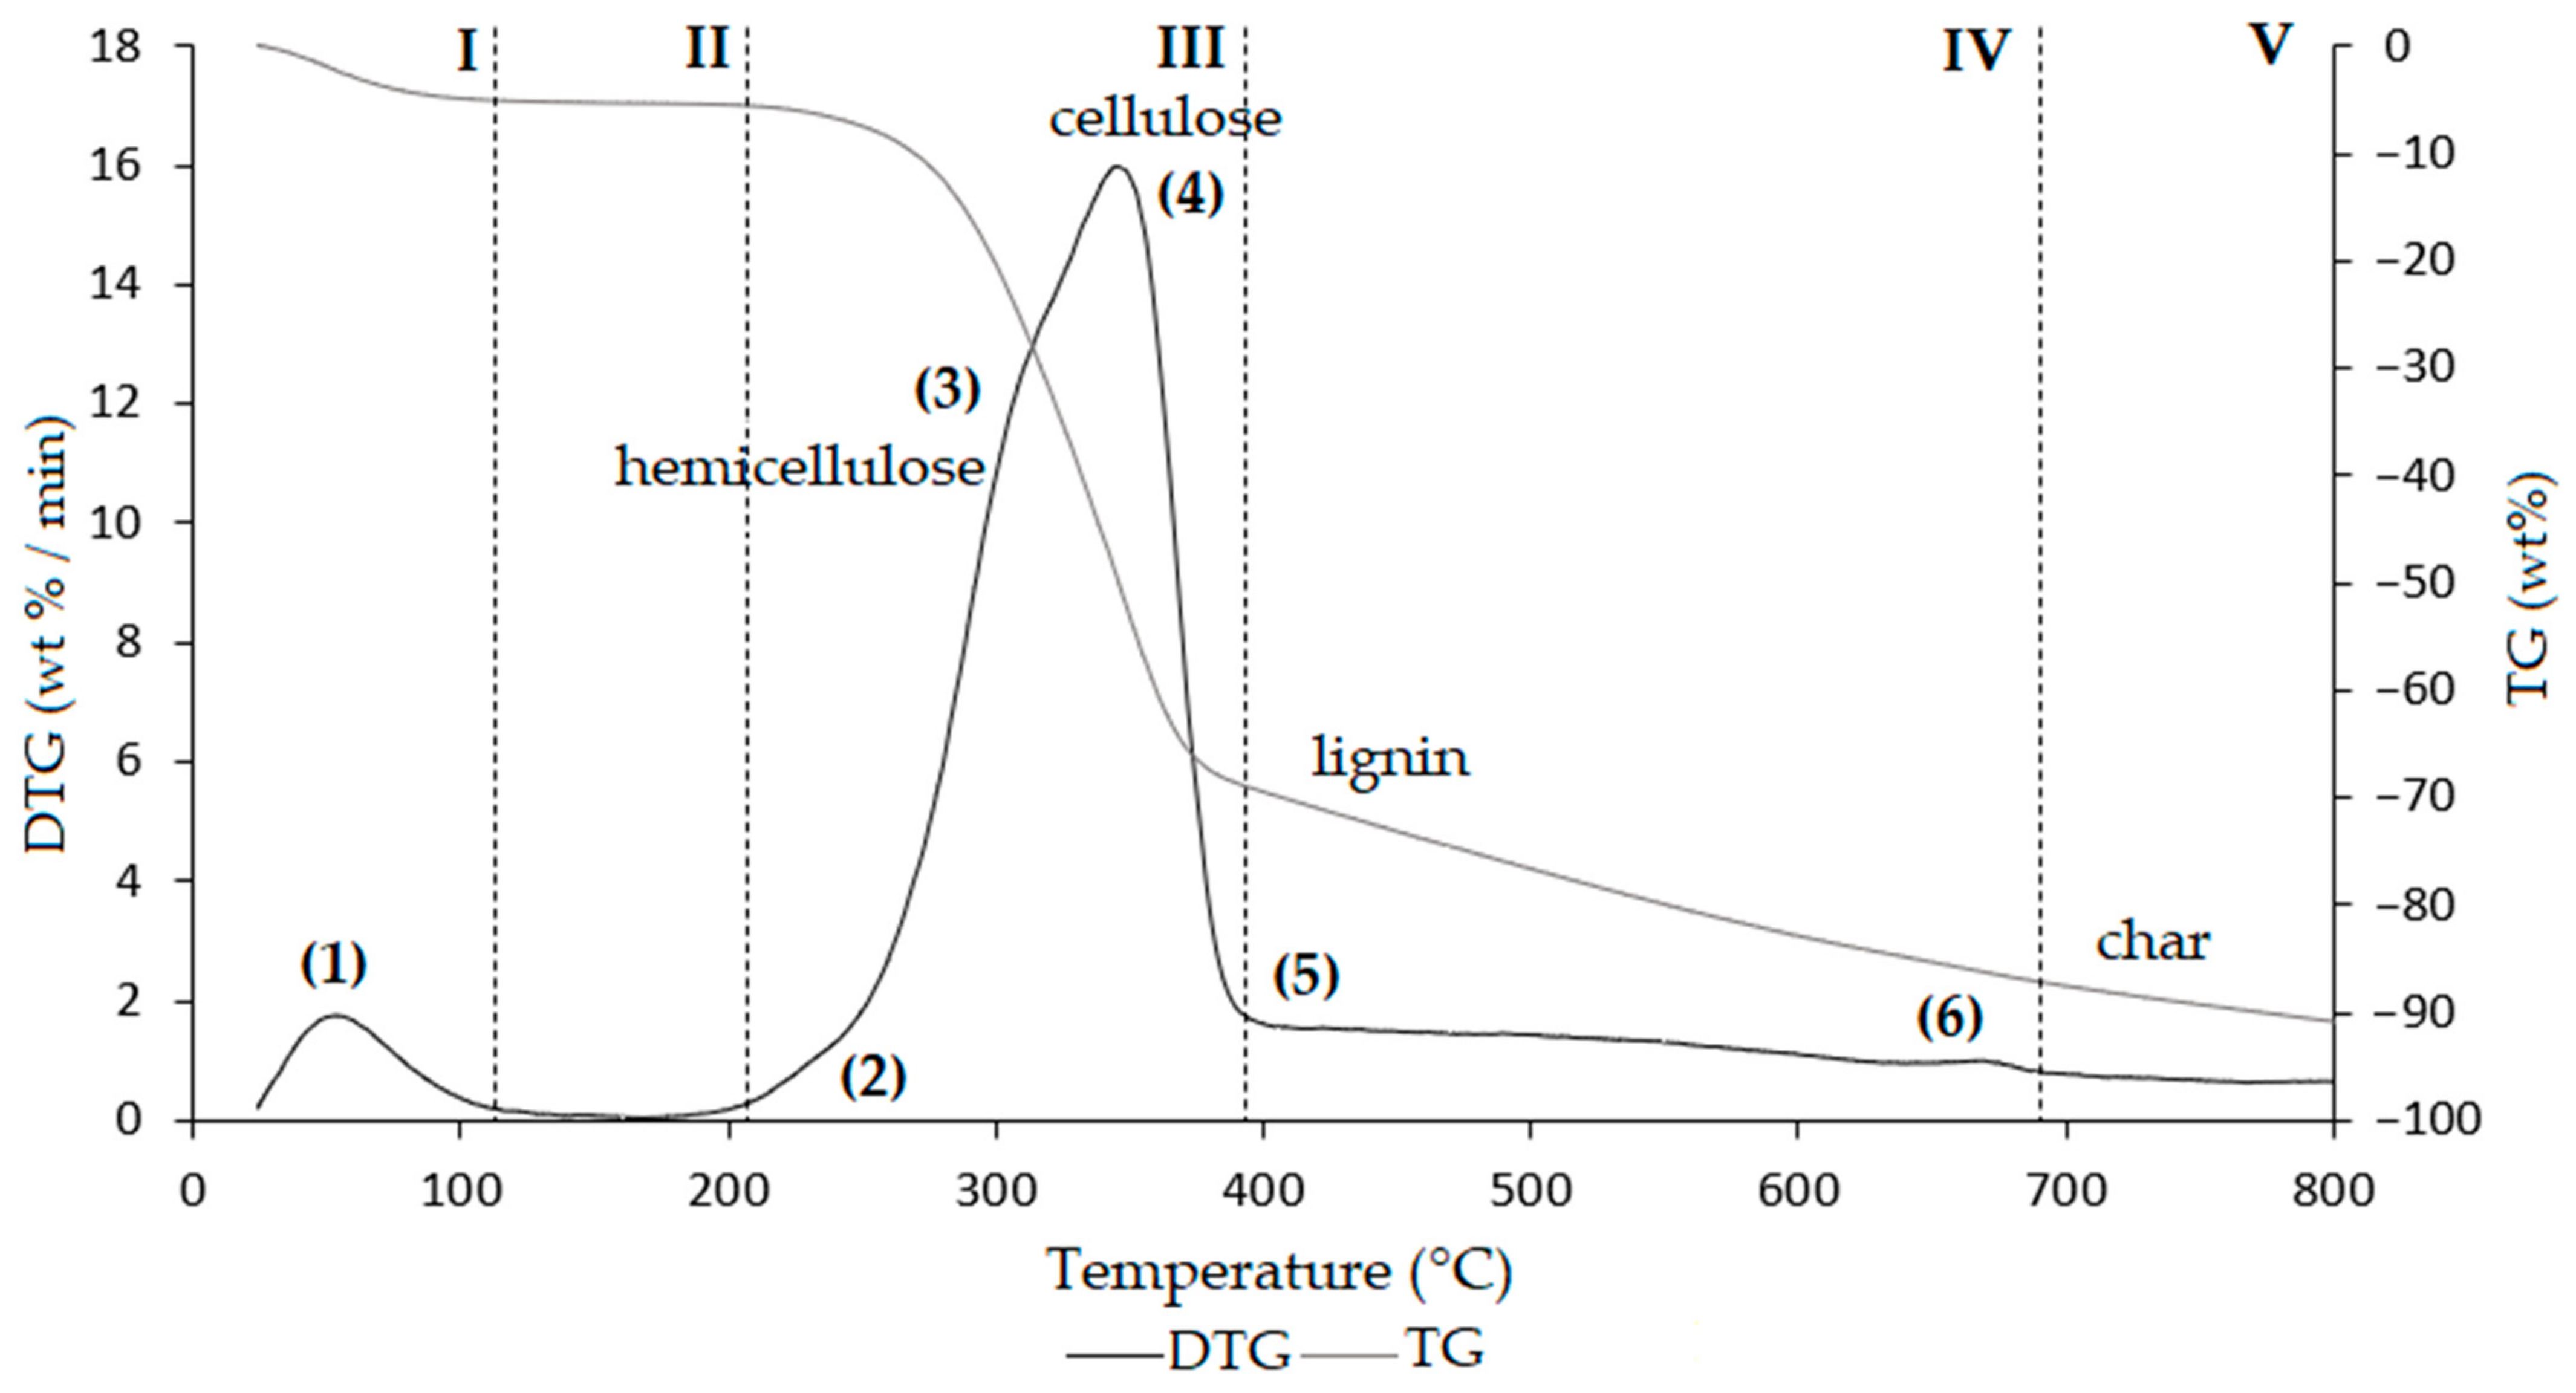
| Region | Thermal Step | To | Tm | Tc | Δm% | Thermally Activated Processes |
|---|---|---|---|---|---|---|
| I | (1) | 30 | 66 | 120 | −3.3 | Removal of moisture and VOCs up to 120 °C |
| II | (1) | 120 | − | 213.5 | −2.0 | Removal of bound water, NH3 from protein denaturation, low-boiling VOCs, loss of CO and CO2 |
| III | (2) | 213.5 | − | 240 | −2.1 | Shoulder related to protein degradation, removal of reaction water, NH3, low-boiling VOCs, and SVOCs, decarboxylation of acids with CO2 loss, degradation of polysaccharides, plasticization, and pseudo-vitrification of the sample |
| (3) | 240 | 297.9 | 318 | −23.6 | ||
| (4) | 318 | 348.8 | 406.5 | −37.3 | Fat degradation, removal of hydrocarbons, water of constitution, CO, and CO2, and volatilization of other metabolites | |
| IV | (5) | 406.5 | − | 641.3 | −10.0 | Removal of reaction water, CO2, and other metabolites, weak reactions related to slow volatilization of CO2 |
| (6) | 641.3 | 658.7 | 680 | −1.0 | ||
| V | 680 | − | 800 | −2.4 | Volatilization of carbon residues, probably C20–C40 fragments | |
| Residual ashes at 1000 °C | Inorganic compounds and carbon residue | |||||
| Spergola Chips | ||||||||
|---|---|---|---|---|---|---|---|---|
| Analyte | ID # | TIC Area × 106 | ||||||
| SO120 | SO140 | SO160 | SO180 | SO200 | SO220 | SO240 | ||
| Aldehydes | ||||||||
| Propanal | A, B | - | 0.126 ± 0.051 a | 0.136 ± 0.090 a | 0.327 ± 0.079 ab | 0.523 ± 0.103 bc | 0.752 ± 0.078 c | 1.15 ± 0.11 d |
| Propanal, 2-methyl- | A, B, C | - | 0.375 ± 0.054 a | 0.230 *ab | 0.111 ± 0.059 b | 0.158 ± 0.096 ab | 0.277 ± 0.065 ab | 2.65 ± 0.15 c |
| Butanal, 3-methyl- | A, B | 0.294 ± 0.086 a | 0.291 ± 0.069 a | 0.326 ± 0.098 a | 0.396 ± 0.075 ab | 0.488 ± 0.107 ab | 0.688 ± 0.115 b | 1.79 ± 0.19 c |
| Butanal, 2-methyl- | A, B | 0.346 ± 0.079 a | 0.321 *a | 0.390 ± 0.058 a | 0.463 ± 0.066 a | 0.512 ± 0.077 a | 0.956 ± 0.099 b | 3.82 ± 0.20 c |
| Pentanal | A, B | 0.241 *a | 0.500 ± 0.124 b | 0.793 ± 0.107 c | 1.11 ± 0.13 d | 0.317 ± 0.051 ab | 0.296 ± 0.061 ab | 0.191 *a |
| Hexanal | A, B, C | 1.84 ± 0.17 a | 2.09 ± 0.23 a | 3.79 ± 0.14 b | 5.36 ± 0.24 c | 0.138 ± 0.096 d | 0.128 ± 0.055 d | 0.115 *d |
| Heptanal | A, B | - | 0.130 *a | 0.478 ± 0.056 b | 0.646 ± 0.095 b | 0.185 *a | 0.102 ± 0.067 a | - |
| Octanal | A, B | 0.079 *a | 0.132 ± 0.086 a | 0.577 ± 0.086 b | 0.585 ± 0.093 b | 0.155 ± 0.060 a | - | - |
| Nonanal | A, B, C | 0.272 ± 0.059 a | 0.304 ± 0.079 a | 0.818 ± 0.105 b | 0.640 ± 0.071 b | 0.115 ± 0.098 a | - | - |
| Esters | ||||||||
| Acetic acid, methyl ester | A, B, C | - | 0.566 ± 0.099 a | 2.06 ± 0.24 b | 2.98 ± 0.30 c | 5.55 ± 0.14 d | 10.8 ± 0.1 e | 38.8 ± 0.3 f |
| Ketones | ||||||||
| Acetone | A, B, C | - | 0.674 ± 0.079 a | 1.29 ± 0.12 b | 1.53 ± 0.09 bc | 1.90 ± 0.18 c | 2.42 ± 0.20 d | 3.79 ± 0.15 e |
| 2,3-Butanedione | A, B | 0.182 ± 0.052 a | 0.330 ± 0.103 a | 0.847 ± 0.068 b | 0.857 ± 0.080 b | 1.35 ± 0.14 c | 2.41 ± 0.11 d | 4.63 ± 0.32 e |
| 2-Butanone | A, B, C | - | - | - | - | 0.441 ± 0.050 a | 1.46 ± 0.16 b | 5.14 ± 0.28 c |
| 2,3-Pentanedione | A, B | - | - | - | 0.236 *a | 0.336 ± 0.057 a | 0.845 ± 0.069 b | 1.00 ± 0.12 b |
| 2-Heptanone | A, B | - | - | 0.165 ± 0.061 a | 0.186 *a | 0.210 *a | - | - |
| 2-Cyclopenten-1-one, 2-methyl- | A, B | - | - | - | - | 0.102 ± 0.053 a | 0.367 ± 0.054 b | 0.504 *c |
| Butyrolactone | A, B, C | - | - | - | - | 0.124 *a | 0.367 ± 0.080 b | 0.504 ± 0.052 b |
| Furan Derivatives | ||||||||
| Furan | A, B | - | - | - | - | 2.04 ± 0.11 a | 5.66 ± 0.25 b | 13.7 ± 0.2 c |
| Furan, 2-methyl- | A, B | - | 0.148 *a | 0.245 ± 0.058 ab | 0.184 ± 0.051 a | 0.589 ± 0.078 b | 2.79 ± 0.16 c | 17.3 ± 0.3 d |
| Furan, 3-methyl- | A, B | - | - | - | - | 0.103 *a | 0.284 ± 0.066 a | 1.14 ± 0.11 b |
| Furan, 2-ethyl- | A, B | 0.118 *a | 0.154 *a | 0.339 ± 0.057 b | 0.619 ± 0.051 c | 0.633 ± 0.079 c | 0.783 ± 0.064 cd | 0.894 ± 0.095 d |
| Furan, 2,5-dimethyl- | A, B | - | - | - | - | 0.073 *a | 0.372 ± 0.053 a | 1.52 ± 0.32 b |
| Furan, 2,4-dimethyl- | A, B | - | - | - | - | 0.099 *a | 0.195 *a | 0.770 ± 0.084 b |
| 2-Vinylfuran | A, B | - | - | - | - | 0.099 *a | 0.180 *ab | 0.266 ± 0.061 b |
| 3(2H)-Furanone, dihydro-2-methyl- | A, B | - | 0.809 ± 0.099 a | 1.40 ± 0.13 b | 0.753 ± 0.085 a | 0.421 ± 0.059 c | - | - |
| Furan, 2-ethyl-5-methyl- | A, B | - | - | - | - | - | 0.100 *a | 0.291 ± 0.062 b |
| Furfural | A, B, C | - | - | 0.847 ± 0.086 a | 0.365 ± 0.071 a | 0.887 ± 0.074 a | 3.02 ± 0.17 b | 4.70 ± 0.34 b |
| Furan, 2-pentyl- | A, B | 1.58 ± 0.15 a | 0.969 ± 0.096 b | 1.73 ± 0.11 a | 1.87 ± 0.27 a | 2.01 ± 0.21 a | 1.66 ± 0.17 a | 0.865 ± 0.054 b |
| Organic Acids | ||||||||
| Acetic acid | A, B, C | 4.77 ± 0.31 ab | 4.64 ± 0.22 a | 5.46 ± 0.10 b | 7.45 ± 0.41 c | 9.02 ± 0.37 d | 21.1 ± 0.3 e | 27.9 ± 0.2 f |
| Aromatic Compounds | ||||||||
| Benzene | A, B, C | - | - | - | - | - | 0.180 ± 0.096 a | 1.37 ± 0.17 b |
| 1H-Pyrrole, 1-methyl- | A, B | - | - | - | - | 0.102 *a | 0.212 *b | 0.435 ± 0.058 c |
| Toluene | A, B | - | - | - | - | 0.228 ± 0.054 a | 0.320 ± 0.055 a | 0.761 ± 0.066 b |
| Benzyl alcohol | A, B | - | - | - | - | - | 0.103 *a | 0.343 *b |
| Benzene, 1,3-dimethyl- | A, B | - | - | - | - | 0.269 ± 0.065 a | 0.254 ± 0.067 a | 0.247 ± 0.071 a |
| p-Xylene | A, B | - | - | - | - | 0.189 ± 0.051 a | 0.190 *a | 0.177 *a |
| Phenol | A, B, C | - | - | - | - | 0.291 *a | 0.364 ± 0.062 ab | 0.478 ± 0.068 b |
| Benzaldehyde | A, B | - | - | 0.441 ± 0.058 a | 0.593 ± 0.073 ab | 0.665 ± 0.070 bc | 0.836 ± 0.092 cd | 0.945 ± 0.052 d |
| Guaiacol | A, B, C | - | - | - | 0.360 ± 0.052 a | 0.758 ± 0.086 b | 0.954 ± 0.057 b | 2.22 ± 0.28 c |
| Vanillin | A, B | - | - | - | 0.102 *a | 0.493 ± 0.063 b | 0.997 ± 0.086 c | 1.84 ± 0.18 d |
| Terpenes | ||||||||
| Limonene | A, B, C | 0.128 *a | 0.079 *a | - | - | - | - | - |
| α-Copaene | A, B | 0.859 ± 0.078 a | 0.537 ± 0.067 b | 0.304 ± 0.061 c | 0.226 ± 0.054 c | - | - | - |
| Epizonarene | A, B | 0.404 ± 0.052 | - | - | - | - | - | - |
| γ-Cadinene | A, B | 0.884 ± 0.058 a | 0.415 ± 0.068 b | 0.193 ± 0.051 c | 0.156 ac | - | - | - |
| Calamenene | A, B | 0.392 * | - | - | - | - | - | - |
| Lambrusco Sorbara Chips | ||||||||
| Analyte | ID # | TIC Area × 106 | ||||||
| SP120 | SP140 | SP160 | SP180 | SP200 | SP220 | SP240 | ||
| Aldehydes | ||||||||
| Propanal, 2-methyl- | A, B, C | 4.38 ± 0.15 a | 2.47 ± 0.28 b | 11.0 ± 0.3 c | 1.77 ± 0.21 d | 3.54 ± 0.30 e | 1.24 ± 0.12 d | 6.02 ± 0.23 f |
| Butanal, 3-methyl- | A, B | 2.42 ± 0.18 ac | 1.11 ± 0.14 b | 1.84 ± 0.11 ab | 1.95 ± 0.18 a | 3.13 ± 0.13 c | 1.93 ± 0.08 ab | 12.7 ± 0.7 d |
| Butanal, 2-methyl- | A, B | 2.17 ± 0.30 a | 1.98 ± 0.09 a | 6.13 ± 0.32 b | 4.79 ± 0.051 c | 3.81 ± 0.17 d | 3.63 ± 0.14 d | 9.23 ± 0.20 e |
| Pentanal | A, B | - | 2.94 ± 0.12 a | 2.37 ± 0.20 b | 2.35 ± 0.11 b | 1.62 ± 0.15 c | 0.792 ± 0.051 d | 1.20 ± 0.09 e |
| Hexanal | A, B, C | 3.32 ± 0.27 a | 8.69 ± 0.35 b | 6.21 ± 0.24 c | 5.28 ± 0.17 d | 4.86 ± 0.19 d | 1.99 ± 0.10 e | - |
| Heptanal | A, B | - | 0.443 ± 0.091 a | 0.374 ± 0.066 ab | 0.262 *b | - | - | - |
| Octanal | A, B | - | 0.305 ± 0.088 a | 0.230 *a | 0.240 ± 0.051 a | - | - | - |
| Nonanal | A, B, C | - | 0.968 ± 0.107 a | 0.163 *b | 0.221 *b | - | - | - |
| Esters | ||||||||
| Methyl formate | A, B | 0.393 ± 0.052 a | 0.309 ± 0.064 a | 2.56 ± 0.15 b | 3.49 ± 0.23 c | 10.4 ± 0.3 d | 7.35 ± 0.13 e | 6.19 ± 0.20 f |
| Acetic acid, methyl ester | A, B, C | 0.981 ± 0.098 a | 2.13 ± 0.11 a | 12.0 ± 0.4 b | 16.5 ± 0.3 c | 68.1 ± 1.7 d | 76.4 ± 1.9 e | 116 ± 1 f |
| Propanoic acid, methyl ester | A, B | - | - | - | 0.319 ± 0.063 a | 1.56 ± 0.23 b | 2.53 ± 0.16 c | 3.98 ± 0.21 d |
| Ketones | ||||||||
| Acetone | A, B, C | 1.83 ± 0.23 a | 4.12 ± 0.11 b | 7.64 ± 0.20 c | 5.63 ± 0.14 d | 13.4 ± 0.9 e | 12.9 ± 0.4 e | 16.9 ± 0.2 f |
| 2,3-Butanedione | A, B | 0.895 ± 0.066 a | 1.10 ± 0.20 a | 4.46 ± 0.17 b | 3.26 ± 0.24 b | 16.1 ± 1.1 c | 16.4 ± 0.9 c | 25.5 ± 0.3 d |
| 2-Butanone | A, B, C | 0.251 ± 0.059 a | 0.357 ± 0.063 a | 1.43 ± 0.09 b | 1.52 ± 0.10 b | 4.96 ± 0.17 c | 6.48 ± 0.11 d | 11.7 ± 0.1 e |
| 2-Propanone, 1-hydroxy- | A, B | - | - | 0.634 ± 0.075 a | 1.00 ± 0.08 a | 1.45 ± 0.09 b | 1.48 ± 0.10 b | 5.79 ± 0.31 c |
| 2,3-Pentanedione | A, B | - | - | 1.60 ± 0.15 a | 1.15 ± 0.16 a | 3.38 ± 0.22 b | 2.77 ± 0.14 c | 9.38 ± 0.29 d |
| 2-Butanone, 3-hydroxy- | A, B | - | - | 0.474 ± 0.057 a | 0.210 aa | 3.61 ± 0.11 b | 0.264 ± 0.058 a | 5.96 ± 0.32 c |
| 2-Heptanone | A, B | - | 0.107 ± 0.071 a | 0.289 *b | 0.299 ± 0.051 b | - | - | - |
| 2-Cyclopenten-1-one, 2-methyl- | A, B | - | - | - | - | - | 0.152 *a | 0.963 ± 0.085 b |
| Butyrolactone | A, B, C | - | - | 0.317 ± 0.059 a | 0.402 ± 0.065 a | 1.35 ± 0.08 b | 1.50 ± 0.13 b | 4.92 ± 0.14 c |
| Furan Derivatives | ||||||||
| Furan | A, B | - | - | - | - | 65.1 ± 3.4 a | 72.0 ± 2.0 b | 72.7 ± 1.7 b |
| Furan, 2-methyl- | A, B | 0.418 ± 0.089 a | 0.477 ± 0.057 a | 2.53 ± 0.17 b | 2.58 ± 0.13 b | 19.9 ± 0.4 c | 15.0 ± 0.3 d | 48.9 ± 0.7 e |
| Furan, 3-methyl- | A, B | - | - | - | 0.143 *a | 1.42 ± 0.07 b | 1.15 ± 0.09 b | 4.04 ± 0.16 c |
| Furan, 2-ethyl- | A, B | - | 1.54 ± 0.16 a | 1.07 ± 0.09 b | 0.608 ± 0.050 c | 2.38 ± 0.09 d | 2.34 ± 0.05 d | 2.32 ± 0.07 d |
| Furan, 2,5-dimethyl- | A, B | - | - | - | 0.161 *a | 1.43 ± 0.10 b | 1.65 ± 0.10 b | 4.23 ± 0.19 c |
| 3(2H)-Furanone, dihydro-2-methyl- | A, B | - | 0.194 ± 0.059 a | 1.12 ± 0.10 b | 0.999 ± 0.064 b | 2.89 ± 0.14 c | 0.953 ± 0.076 b | 1.13 ± 0.12 b |
| Furfural | A, B, C | - | - | 1.10 ± 0.08 a | 6.42 ± 0.42 b | 21.9 ± 0.9 c | 24.1 ± 1.0 d | 44.9 ± 0.7 e |
| 2-Furanmethanol | A, B | - | - | - | - | - | 0.869 ± 0.067 a | 4.77 ± 0.13 b |
| 2-Furancarboxyaldehyde, 5-methyl- | A, B, C | - | - | - | 0.357 ± 0.071 a | 3.21 ± 0.27 b | 3.63 ± 0.30 b | 4.39 ± 0.22 c |
| 3-Furancarboxylic acid, methyl ester | A, B | - | - | - | - | - | - | 1.03 ± 0.07 |
| 2-Furanmethanol, acetate | A, B | - | - | - | - | - | 0.393 ± 0.056 a | 2.05 ± 0.13 b |
| Furan, 2-pentyl- | A, B | 2.81 ± 0.23 a | 4.06 ± 0.17 b | 4.16 ± 0.23 b | 0.465 ± 0.074 c | 0.945 ± 0.096 c | - | - |
| Organic Acids | ||||||||
| Acetic acid | A, B, C | 4.73 ± 0.22 a | 24.9 ± 0.3 b | 25.0 ± 0.4 b | 33.7 ± 0.7 c | 53.5 ± 1.3 d | 80.4 ± 2.3 e | 96.6 ± 4.1 f |
| Propanoic acid | A, B | - | - | - | - | - | 0.456 ± 0.083 a | 5.47 ± 0.21 b |
| Aromatic Compounds | ||||||||
| Benzene | A, B, C | - | - | - | 0.397 ± 0.061 a | 0.424 ± 0.051 a | - | - |
| 3-Methylpyridazine | A, B | - | - | - | - | - | 0.587 ± 0.067 a | 1.37 ± 0.21 b |
| 1H-Pyrrole, 1-methyl- | A, B | - | - | - | - | 0.270 ± 0.062 a | 0.391 *a | 1.42 ± 0.11 b |
| Pyridine | A, B | - | - | - | - | - | 0.522 ± 0.068 a | 2.31 ± 0.13 b |
| Toluene | A, B | - | - | - | 0.399 *a | 0.828 ± 0.077 b | 0.454 ± 0.061 a | 2.23 ± 0.30 c |
| p-Xylene | A, B | - | - | - | 0.762 ± 0.051 a | 0.851 ± 0.071 a | 0.191 *b | - |
| Phenol | A, B, C | - | - | - | - | - | 0.412 ± 0.079 a | 0.711 ± 0.069 b |
| Benzaldehyde | A, B | 0.379 ± 0.065 a | 0.400 ± 0.077 a | 0.553 ± 0.050 a | 0.505 ± 0.063 a | 0.663 ± 0.080 b | - | - |
| Guaiacol | A, B, C | - | - | - | 0.460 ± 0.052 a | 0.846 ± 0.066 ab | 1.07 ± 0.12 b | 4.85 ± 0.26 c |
| Guaiacol, 4-methyl- | A, B | - | - | - | - | - | - | 0.161 * |
| Syringol | A, B | - | - | - | - | - | - | 0.188 * |
| Vanillin | A, B | - | - | - | 0.160 *a | 0.563 ± 0.063 b | 0.697 ± 0.071 b | 1.21 ± 0.17 c |
| Terpenes | ||||||||
| Ylangene | A, B | 0.460 ± 0.051 a | 0.323 *b | - | - | - | - | - |
| Sulfur Compounds | ||||||||
| Thiophene | A, B | - | - | - | - | - | - | 0.765 ± 0.062 |
| Disulfide, dimethyl- | A, B | - | 0.131 *a | 0.199 *a | 0.425 ± 0.088 a | 2.15 ± 0.11 b | 2.40 ± 0.25 b | 5.03 ± 0.20 c |
| Trisulfide, dimethyl- | A, B | - | - | - | - | - | - | 0.549 ± 0.074 |
| TIC Area × 106 | ||||||||
|---|---|---|---|---|---|---|---|---|
| ALD | EST | KET | FUD | OA | ARC | TER | SUL | |
| SO120 | 3.07 ± 0.39 a | - | 0.182 ± 0.052 a | 1.70 ± 0.15 a | 4.77 ± 0.31 a | - | 2.67 ± 0.19 a | - |
| SO140 | 4.27 ± 1.40 a | 0.566 ± 0.099 a | 0.330 ± 0.182 a | 2.08 ± 0.19 a | 4.64 ± 0.22 a | - | 1.03 ± 0.13 b | - |
| SO160 | 7.54 ± 0.74 b | 2.06 ± 0.24 b | 1.01 ± 0.25 a | 4.56 ± 0.44 b | 5.46 ± 0.10 a | 0.441 ± 0.058 a | 0.498 ± 0.112 c | - |
| SO180 | 9.64 ± 0.91 b | 2.98 ± 0.30 c | 1.28 ± 0.17 ab | 3.79 ± 0.53 ab | 7.45 ± 0.41 b | 2.92 ± 0.12 b | 0.381 ± 0.054 c | - |
| SO200 | 2.59 ± 0.69 a | 5.55 ± 0.14 d | 2.56 ± 0.48 b | 6.96 ± 0.61 c | 9.02 ± 0.37 c | 3.00 ± 0.39 b | - | - |
| SO220 | 3.20 ± 0.54 a | 10.8 ± 0.1 e | 5.31 ± 0.67 c | 15.0 ± 0.9 d | 21.1 ± 0.3 d | 4.41 ± 0.51 c | - | - |
| SO240 | 9.72 ± 0.65 b | 38.8 ± 0.3 f | 11.8 ± 0.9 d | 41.5 ± 1.6 e | 27.9 ± 0.2 e | 6.98 ± 0.94 d | - | - |
| SP120 | 12.3 ± 0.9 a | 1.37 ± 0.15 a | 2.98 ± 0.35 a | 3.23 ± 0.32 a | 4.73 ± 0.22 a | 0.379 ± 0.065 a | 0.460 ± 0.051 a | - |
| SP140 | 18.9 ± 1.3 b | 2.44 ± 0.17 b | 5.68 ± 0.44 a | 6.26 ± 0.45 ab | 24.9 ± 0.3 b | 0.400 ± 0.077 a | 0.323 *b | 0.131 *a |
| SP160 | 28.3 ± 1.2 c | 14.6 ± 0.5 c | 16.8 ± 0.8 b | 9.98 ± 0.67 ab | 25.0 ± 0.4 b | 0.553 ± 0.050 a | - | 0.199 *a |
| SP180 | 16.9 ± 0.8 b | 20.3 ± 0.6 d | 13.5 ± 0.8 b | 11.7 ± 0.8 b | 33.7 ± 0.7 c | 2.68 ± 0.23 b | - | 0.425 *a |
| SP200 | 16.9 ± 0.9 b | 80.1 ± 2.2 e | 44.2 ± 2.7 c | 119 ± 5 c | 53.5 ± 1.3 d | 4.45 ± 0.47 c | - | 2.15 ± 0.09 b |
| SP220 | 9.58 ± 0.49 a | 86.3 ± 2.2 f | 42.0 ± 1.8 c | 122 ± 4 c | 80.8 ± 2.8 e | 9.61 ± 0.47 d | - | 2.40 ± 0.11 b |
| SP240 | 29.2 ± 1.2 c | 126 ± 1 g | 81.2 ± 1.7 d | 191 ± 4 d | 102 ± 4 f | 14.4 ±1.2 e | - | 6.35 ± 0.34 c |
Disclaimer/Publisher’s Note: The statements, opinions and data contained in all publications are solely those of the individual author(s) and contributor(s) and not of MDPI and/or the editor(s). MDPI and/or the editor(s) disclaim responsibility for any injury to people or property resulting from any ideas, methods, instructions or products referred to in the content. |
© 2023 by the authors. Licensee MDPI, Basel, Switzerland. This article is an open access article distributed under the terms and conditions of the Creative Commons Attribution (CC BY) license (https://creativecommons.org/licenses/by/4.0/).
Share and Cite
D’Eusanio, V.; Morelli, L.; Marchetti, A.; Tassi, L. Aroma Profile of Grapevine Chips after Roasting: A Comparative Study of Sorbara and Spergola Cultivars for More Sustainable Oenological Production. Separations 2023, 10, 532. https://doi.org/10.3390/separations10100532
D’Eusanio V, Morelli L, Marchetti A, Tassi L. Aroma Profile of Grapevine Chips after Roasting: A Comparative Study of Sorbara and Spergola Cultivars for More Sustainable Oenological Production. Separations. 2023; 10(10):532. https://doi.org/10.3390/separations10100532
Chicago/Turabian StyleD’Eusanio, Veronica, Lorenzo Morelli, Andrea Marchetti, and Lorenzo Tassi. 2023. "Aroma Profile of Grapevine Chips after Roasting: A Comparative Study of Sorbara and Spergola Cultivars for More Sustainable Oenological Production" Separations 10, no. 10: 532. https://doi.org/10.3390/separations10100532