
Adsorption of Lactose Using Anion Exchange Resin by Adding Boric Acid from Milk Whey


Division of Marine Biosciences, Graduate School of Fisheries Sciences, Hokkaido University, Minato 3-1-1, Hakodate 041-8611, Japan
*
Author to whom correspondence should be addressed.
Separations 2023, 10(10), 530; https://doi.org/10.3390/separations10100530
Submission received: 31 August 2023
/
Revised: 19 September 2023
/
Accepted: 21 September 2023
/
Published: 3 October 2023
(This article belongs to the Section Separation Engineering)
Abstract
:The influence of adding boric acid (BA) on the adsorption behavior of lactose onto an anion exchange resin (IRA402) was investigated. By adding BA, the amount of lactose adsorbed onto IRA402 was increased ca. 20% compared to without adding BA. In the presence of BA, ca. 70% of the adsorbed lactose could desorb from IRA402, while the absorbed lactose hardly desorbed in the absence of BA. Lactose molecules were considered to bind to tertiary amine group on IRA402 by Maillard reaction. The optimum conditions of the dosage of BA and pH were found at the molar ratio of BA to lactose ranging from 1–2, and pH 7–9. The kinetics and equilibrium of lactose adsorption could be explained by the Langmuir adsorption model (best model). In the case of a real whey solution, phosphate strongly affected the adsorption behavior and could be removed as precipitation from the whey over pH 10. Whey proteins had little effect on lactose adsorption, which was ca. 30% less than that in the model system. Moreover, the different kinds of whey proteins and amino acids had little effect on the amount adsorbed. Minerals in the whey may also be considered to be responsible for the decreased adsorption in the whey.
1. Introduction
Whey is a byproduct of the manufacturing process of dairy products such as cheese and yogurt. Approximately 90% of raw milk is produced as whey in the cheese manufacturing process [1,2,3]. Domestic production of natural cheese in 2020 will be about 45,000 tons, and production volume in Japan has increased by about 30% over the past 10 years. The production of whey, a by-product of this increase, is estimated to be at least 400,000 tons. The chemical oxygen demand (COD) of whey as an indicator of water pollution is 60,000–80,000 mg/L, and lactose in particular has been reported to have the greatest impact on COD levels. The COD standard for wastewater in Japan is 160 mg/L, which indicates that whey has an extremely high environmental impact.
Whey is a byproduct that has a high environmental impact when disposed of in rivers, but efforts are underway to make effective use of it. Efforts include concentrating and drying whey, processing it into whey powder, adding it to confectionery, bread, and ice cream, and adding it to feed for livestock such as pigs to improve meat quality. The main constituents of whey are lactose (45–50 g/L), whey proteins such as β-lactoglobulin, α-lactalbumin, and lactoferrin (6–8 g/L), and minerals (80–100 g/L) such as calcium, phosphorus, sodium, potassium, magnesium, and so on [4]. Separation/recovery of these components can result in the more effective use of whey. However, since whey tends to spoil at room temperature and is produced in large quantities, the effective utilization of whey requires large capital investment and management and maintenance costs for storage facilities for quality control and various processing equipment. As a result, whey processing is not profitable for small and medium-sized producers, and whey is often disposed of as industrial waste, except for some producers who use it as animal feed. At present, whey is mainly treated in septic tanks in Japan, but manufacturers still have to bear the cost of treating whey when it is disposed of. Therefore, it is important to separate and recover lactose from whey to reduce the burden of whey treatment and make effective use of these bio-resources. Although membrane separation using ultrafiltration membranes is used as a large-scale industrial separation method for lactose, a simpler separation method is desirable for relatively small dairy plants [5,6,7].
Adsorption is one of the most widely used separation methods in many fields because it is easy to operate and often does not require expensive equipment [8,9,10], and several adsorbents have been employed to remove heavy metals, i.e., ion-exchange resin [11,12,13], activated carbon [14,15,16], zeolite [17,18,19], hydrogel [20,21], etc. Thus, the recovery of lactose from whey by adsorption is recommended because it is considered to be an easy separation method for small- and medium-scale producers. This relatively inexpensive adsorption technique could reduce the BOD load of wastewater even in small-scale plants or producers. The authors think that this manner is the practical value of this study.
In this study, for the separation of lactose in whey, we attempted the adsorptive separation of the complex on an anion exchange resin using the reaction in which a polyhydric alcohol compound with a diol structure, such as sugar, forms a negative complex structure with boric acid [22]. This complexation reaction has been used for the analysis of sugars by HPLC and boron-selective anion exchange resins [23,24], but there are few reports on its application to the separation of sugars in liquids. Separation of lactose from milk whey by utilization of boric acid and commercial anion exchange resin and by formation of complexation with lactose boric acid has not been reported yet.
Firstly, batch adsorption experiments using lactose solution (model system) were conducted to investigate the influence of the kind of the counterion of the anion exchange resin on the amount of lactose adsorbed, as well as the influence of the addition of boric acid on adsorption and desorption abilities on the anion exchange resin. Then, the influences of the molar ratio of boric acid to lactose and the pH of the solution on the adsorption kinetics and equilibrium were also investigated, and the optimum conditions (molar ratio and initial pH) were determined. The adsorption kinetics under the optimum conditions were evaluated using rate constants obtained from the pseudo-second-order rate equation and the Langmuir rate equation, and the saturated amount adsorbed and the adsorption equilibrium constant were obtained from the Langmuir adsorption model. In addition, adsorption experiments were carried out with actual whey solution under the optimum conditions obtained from the lactose model solution experiments, and the adsorption behavior was compared with that of the model solution.
2. Materials and Methods
2.1. Materials
Lactose one hydrate, phenol, potassium sodium tartrate, copper sulfate tetrahydrate, Folin-Lowry (phenol) reagent, L(+)-ascorbic acid, and ammonium molybdate were purchased from Kanto Chemical Ltd. (Tokyo, Japan). Boric acid, sulfuric acid, sodium hydroxide, sodium carbonate, hydrochloric acid, sodium sulfate, sodium chloride, sodium nitrate, carminic acid, and L-glutamic acid were purchased from Wako Pure Chemical Ltd. (Tokyo, Japan). Bovine serum albumin and β-lactoglobulin were purchased from Sigma-Aldlich Chemical (St. Louis, MO, USA). Anion exchange resin, IRA402BL CL was purchased from Organo Corporation (Tokyo, Japan).
2.2. Preparation of Whey Solution
Cow milk was purchased from a general market and was supplied commercially from Hakodate Dairy Corporation Co., Ltd. in Hokkaido prefecture, Hakodate, Japan. A desired amount of the milk was taken in a 500 mL beaker, then, ca. 1 M hydrogen chloride solution was added until the pH of the milk reached pH 4.6. At the pH, proteins were aggregated and precipitated. After the precipitation, the aggregates of proteins were filtered by a paper filter (5C). The filtered solution was used as a whey solution. The whey solution was diluted, and the pH of the diluted whey solution was adjusted at a desired value if necessary.
In the case of the removal of a phosphate ion dissolved in the whey, the pH of the whey solution was adjusted to pH 10 by adding NaOH solution, then a white precipitate was produced. The whey solution was centrifuged (3250× g, 3000 rpm, 15 min) and filtered using a paper filter (No. 5C). The treated whey solution was used for experiments.
2.3. Preparation of Anion Exchange Resin
IRA402 (anion exchange resin) was used as an adsorbent for lactose in this study. According to the data of the supplier, water retention capacity is about 49–56%, total exchange capacity is 4.2 × 10⁻³ mol/g-dry, particle size is 0.50–0.65 mm, and is part of the tertiary amine functional group. In the following procedure, the counter ion of IRA402 anion exchange resin, meaning that the chloride ion could be exchanged with hydroxyl ion for the adsorption of lactose. An amount of 30 mL of the anion exchange resin was taken in a 100 mL beaker and 50 mL of distilled water was also poured into the beaker to wash the resin with distilled water. After the washing, the resin was dried in a dryer at 50 °C for 24 h. The dried resin was immersed in distilled water for 24 h. The resin was taken from distilled water and was wiped with paper gently to remove water from the outer surface of the resin. An amount of 60 mL of 1 M NaOH aqueous solution per unit mass (g) of the dried resin was added to the resin in an adequate volume beaker; then, the resin was stirred for one hour. After stirring, the resin was collected on a paper filter to separate from the liquid phase by filtration. The resin was rinsed with distilled water and this rinsing was continued until the pH of the rinsed water was confirmed to be the same as the distilled water.
2.4. Procedure of Adsorption Experiment in the Model System
Desired amounts of the lactose solution and boric acid solution were mixed to adjust the desired concentration of lactose and boric acid and the pH of the mixed solution was adjusted to the desired pH value by adding HCl or NaOH solutions. The prepared adsorbent (anion exchange resin, IRA402) and the desired amount of distilled water were taken in a 100 mL Erlenmeyer flask. Then, the flask was set at 30 °C. water bath and the solution was stirred at 400 rpm using a magnetic stirrer. After this, the mixed solution was taken in the flask. In most experiments, 0.1 or 0.5 g (based on dry weight) of adsorbent was used, and the volume of the system was set at 40 or 80 mL. The amount of lactose adsorbed was calculated by the difference between the initial and arbitrary time concentrations of lactose.
2.5. Procedure of Adsorption Experiments Using Whey Solution
After preparing milk whey using the method described in Section 2.2, the pH was adjusted to the desired pH value by adding an appropriate amount of 1 M HCl or 1 M NaOH solution. After that, the whey solution was centrifuged at 3000 rpm for 15 min. The whey solution was filtered again with filter paper (ADVANTEC 5C). In the case of varying the whey protein concentration, whey protein concentration was varied by foam separation to remove whey proteins from the liquid phase. In this operation, the employed apparatus was the same one as in our previous study [25,26,27], and the whey solution was diluted five times to prevent the entire liquid from becoming foam by aeration. Air was used as an aerated gas and the volumetric flow rate was set at 50 cm3/min, which corresponds to a superficial gas velocity of 0.0537 cm/s. The pH value of the prepared whey solution was adjusted at pH 7 by adding HCl or NaOH solutions. The procedure after this was mostly the same as the procedure described in Section 2.4. In addition, the control adsorption experiments were conducted with the lactose solution in which bovine serum albumin (BSA), β-lactoglobulin, (βLG), or L-glutamic acid (Glu) were prepared and added as desired concentrations.
2.6. Procedure of Desorption Experiments
The adsorbents that were used in the adsorption experiments were used once in the desorption experiments. The experimental conditions were as follows: 0.015 M lactose solution or 0.015 M boric acid/lactose mixed solution; adsorbent 1.0 g-dry; volume 40 mL; pH 7. After the adsorption experiment, the loaded adsorbents were collected by filtration using a paper filter (No. 2). The adsorbents were rinsed with distilled water to wash the outer surface of the adsorbents. After this, the collected lactose-loaded adsorbent was taken in 40 mL of 1 M NaCl solution in a 100 mL Erlenmeyer flask. At the desired time, a portion of the solution was sampled and the lactose concentration was determined.
2.7. Determination Method of Lactose, Boric Acid, Phosphate, and Proteins
Lactose concentration was determined spectrophotometrically (486 nm) by the phenol sulfuric acid method [28]. The Boric acid concentration was determined spectrophotometrically (585 nm) by the carminic acid method [29]. Phosphate concentration was determined spectrophotometrically (880 nm) by the molybdenum blue method [30]. Protein concentration was determined spectrophotometrically (725 nm) by the Lowry method [31]. Bovine serum albumin was employed as a standard protein to make the determination line for the Lowry method. A V-630 spectrophotometer (JASCO Co. Ltd., Hachioji, Japan) was used for these measurements described above.
3. Results and Discussion
3.1. Effect of Adding Boric Acid on Adsorption of Lactose onto Anion Exchange Resin
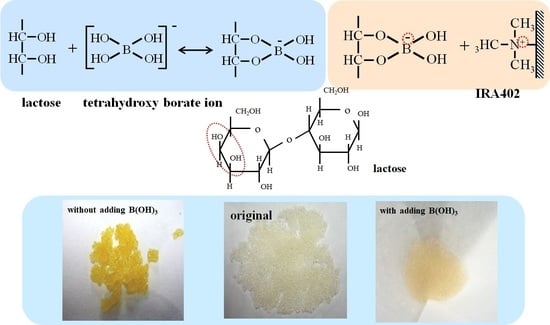
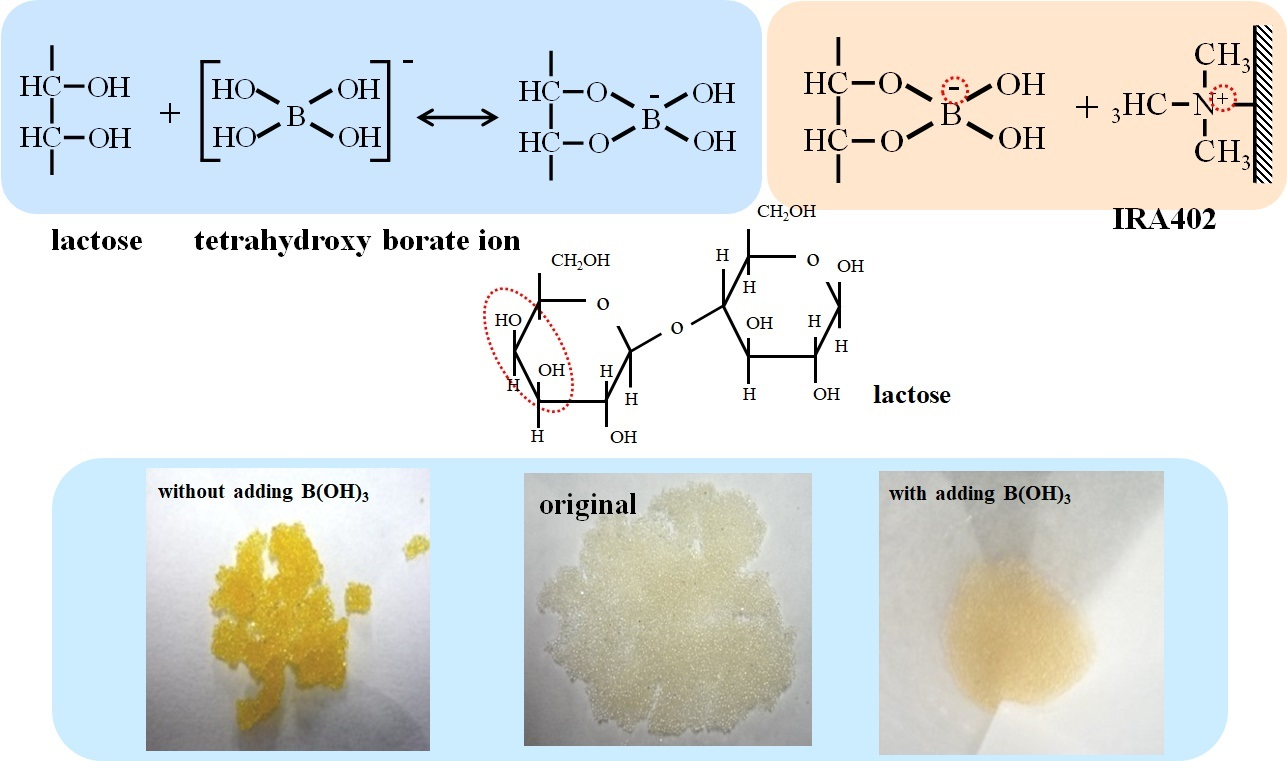
Figure 1 shows a typical result of the influence of the counter ions on the time course of the amount of lactose adsorbed, Xt. In the case of the chloride ion (solid circle), Xt was 5.0 × 10⁻⁵ mol/g; in the case of the hydroxyl ion, Xt was 7.5 × 10⁻⁴ mol/g. The binding strength between the tertiary amine functional group and chloride ion was considered to be stronger than that between the tertiary amine functional group and hydroxyl ion included in IRA402. For the usage of IRA402 for lactose adsorption, this result suggested that the exchange of the counter ion from the chloride ion to the hydroxyl ion was adequate for this purpose in this study. Therefore, the IRA402 that has a hydroxyl ion as a counter ion was used in this study. The preparation procedure was described in Section 2.3.
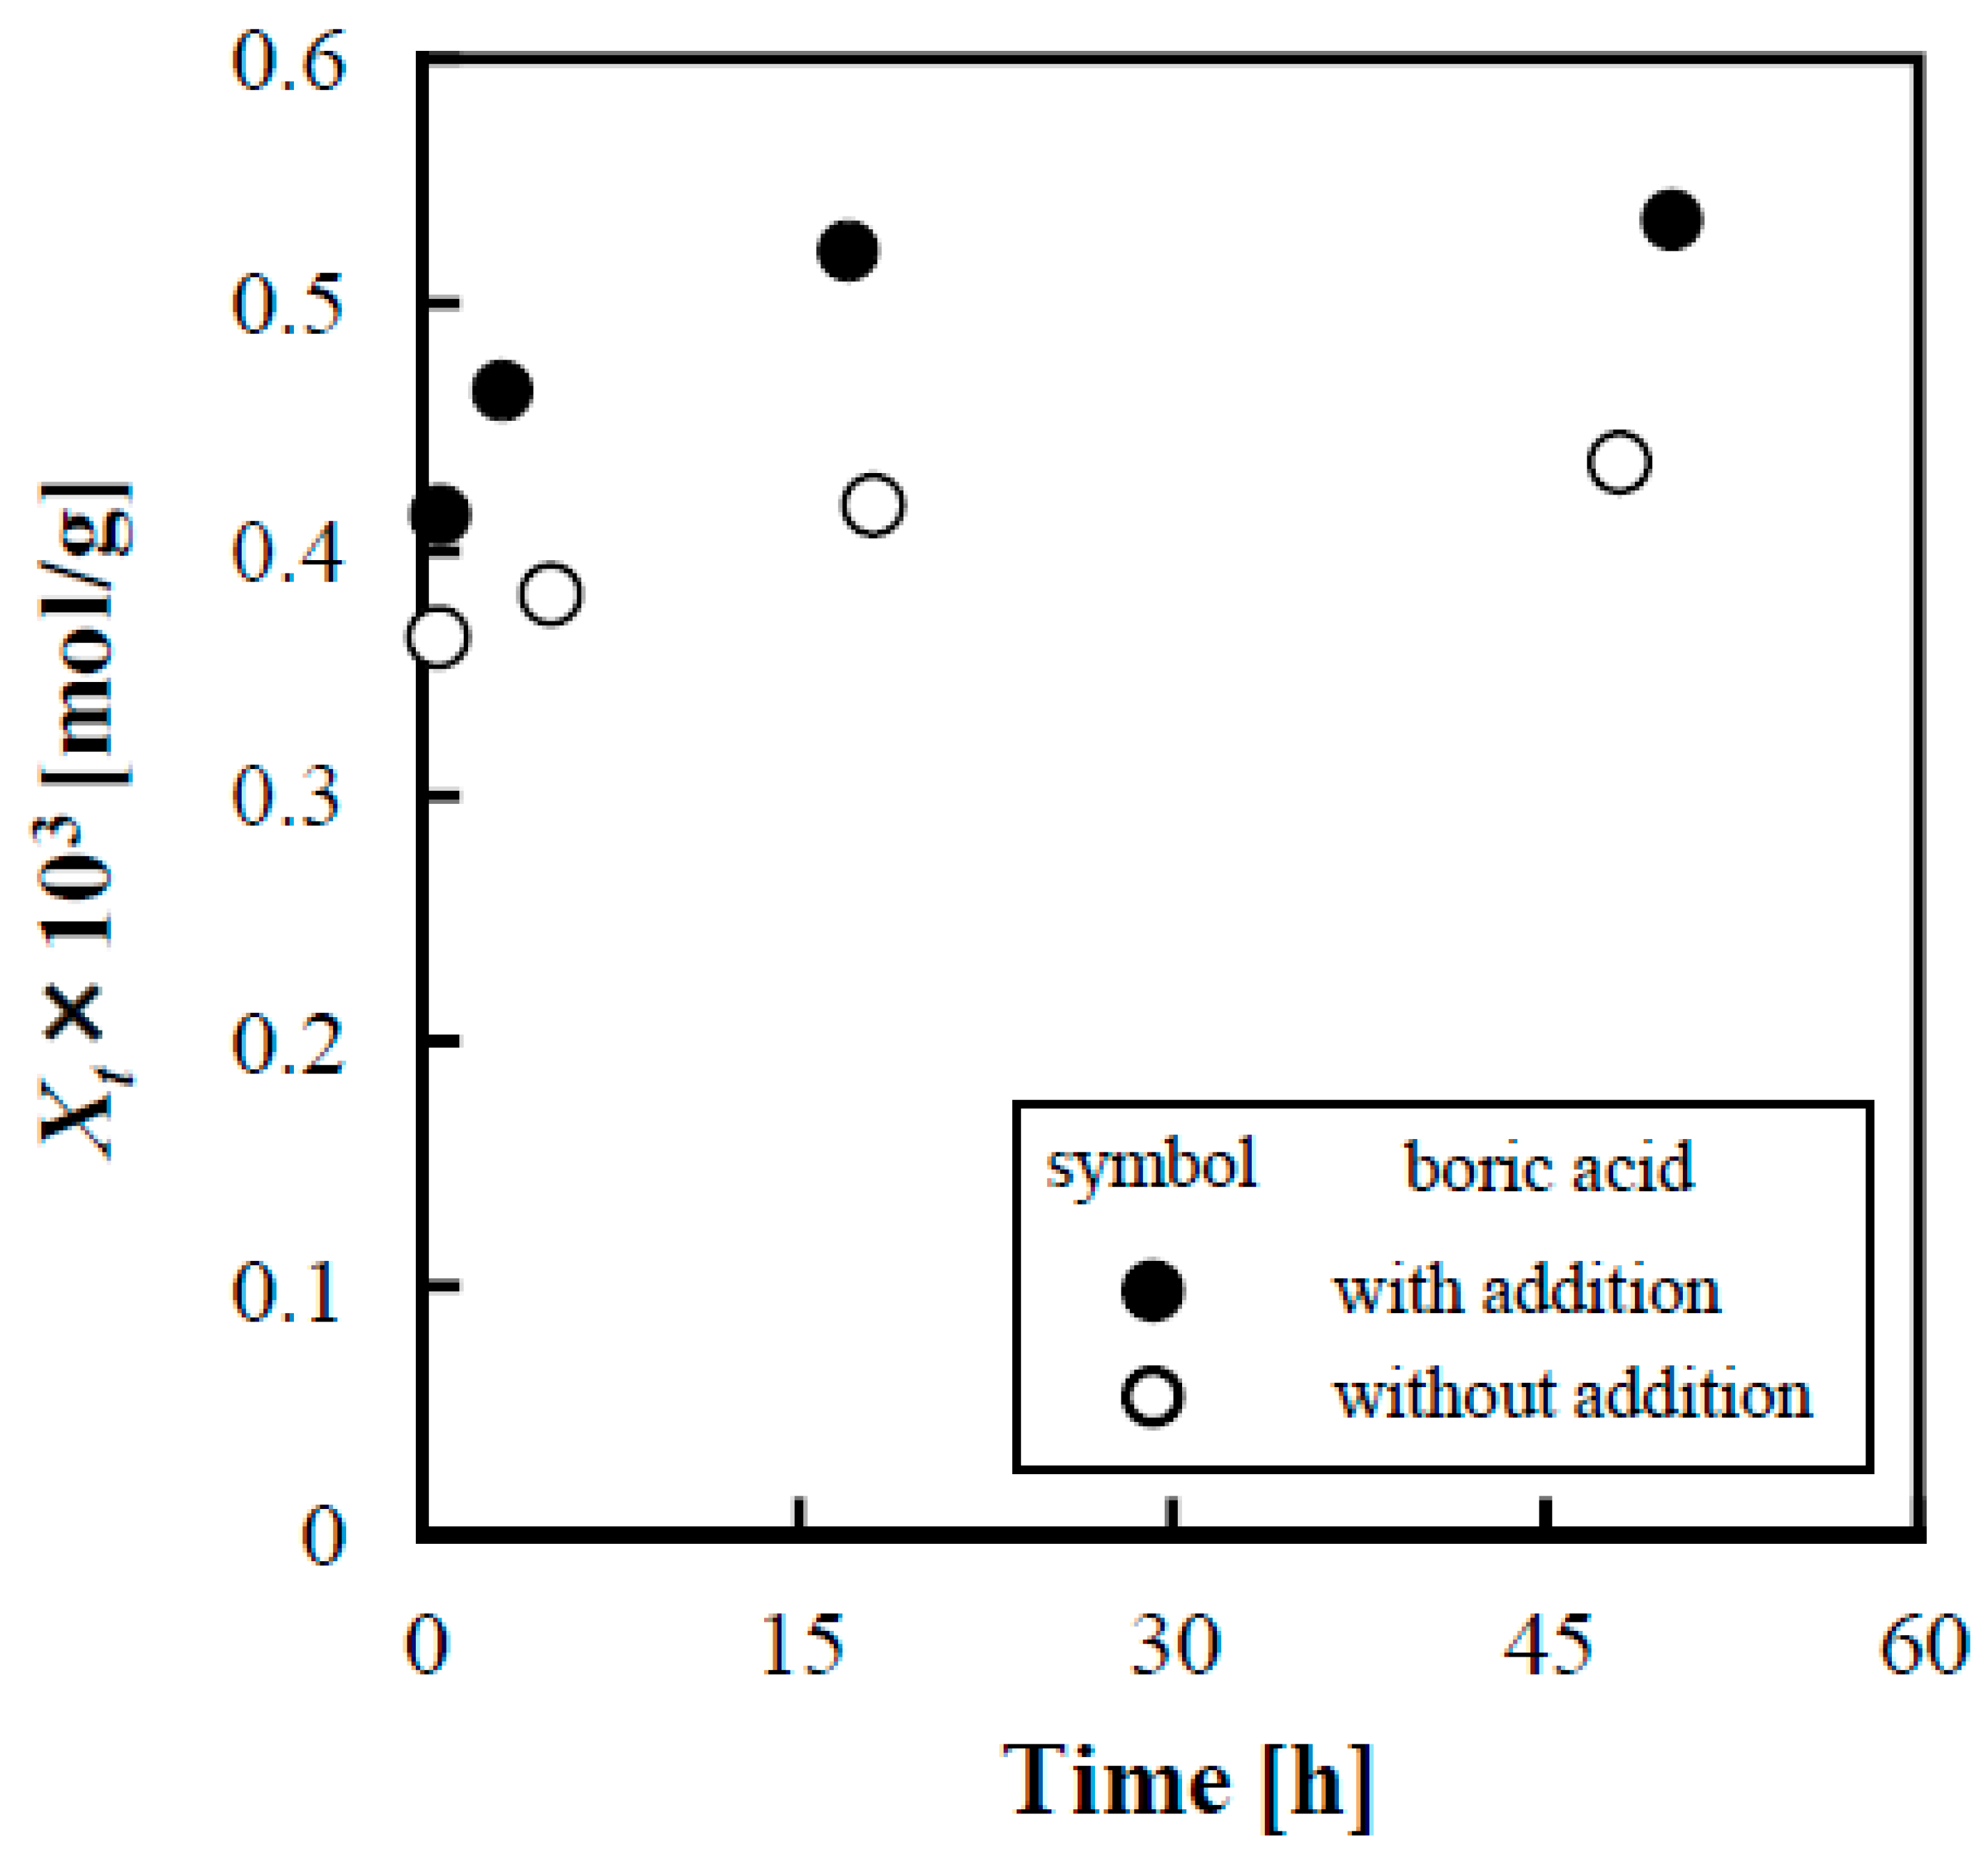
Figure 2 shows the influence of adding boric acid on the typical time course of the amount of lactose adsorbed, Xt. The equilibrium of the adsorption was required for ca. 30–45 h. At the equilibrium state, Xt was 4.4 × 10⁴ mol/g and 5.4 × 10⁴ mol/g without (open circle) and with (solid circle) adding boric acid, respectively. Xt with boric acid was 1.22 times higher than Xt without boric acid. The photographs of IRA402 were shown in the graphical abstract. The color of the resin after adsorption without boric acid was extremely different from the other resins. The reason considered was that the lactose molecule has a carbonyl functional group and IRA402 has a tertiary amine functional group; in the case without boric acid, lactose molecules could bind with the amine functional group within the resin, resulting in the Maillard reaction [32]—which is a non-enzymatic browning reaction—occurring on the resin surface. Moreover, desorption experiments were conducted to confirm the degree of release of lactose from the resin. The results are shown in Figure 3. The loaded adsorbents were obtained from the adsorption experiments as follows: the adsorption experiment was conducted with 1 g-dry IRA402 resin and 80 mL of 0.015 M lactose and 0.015 M lactose–boric acid (role ratio of one to one) at pH 7, respectively. In the ordinate of Figure 3, Cdmax represents the maximum concentration of lactose in case of releasing all amounts of lactose adsorbed in the 40 mL of 1 M NaCl solution, and was defined as,
where Xe, m, and V are the equilibrium amount absorbed of lactose, the mass of adsorbent used in the adsorption experiments, and the volume of the eluent solution, respectively. Thus, C/Cdmax represents the frequency of desorption of lactose from the resin surface. According to the amount adsorbed, the values of Cdmax with and without adding boric were acid 1.41 × 10⁻² M and 2.32 × 10⁻² M, respectively. The value of C/Cdmax without boric acid (ca. 0.1) is smaller than that with boric acid (ca. 0.7). It could be considered that the fact should support the assumption of the Maillard reaction at the resin surface. At the early stage of the Maillard reaction, there seems to be a reversible reaction.
Cdmax = Xe m/V.
As seen in Figure 1, the adsorption equilibrium state reached about 50 h. Thus, as the adsorption time has proceeded, the Maillard reaction would be irreversible. It is well known that ion exchange resin has many pores. At the close surface of the near entrance part of the pore, the adsorption could be irreversible, resulting in a decrease in available adsorption sites. The addition of boric acid would enhance both the adsorption and the desorption of lactose with IRA402.
3.2. Influence of the Molar Ratio of Boric Acid and Lactose and the Initial and Equilibrium pH Values on the Amount of Lactose Adsorbed
Figure 4 shows the influence of the molar ratio of lactose to boric acid and the initial pH on the equilibrium amount of lactose adsorbed, Xe. The experiments were carried out with 0.01 M of the initial concentration of lactose, 40 mL of liquid volume, and 0.5 g of ion exchange resin for 72 h of the adsorption time. At both pH 7 and 9, Xe increased up to the molar ratio of 2, and at higher molar ratios, Xe decreased. Xe in the case of the initial pH of 7 was slightly higher than that in the case of the initial pH of 9 at a molar ratio of 2; overall, there was no significant difference between Xe at molar ratios of 1 and 2. Lactose is a disaccharide sugar that is formed by the β-1→4 glycosidic linkage of β-D-glucose and β-D-galactose and has two cis-diol structures [33]. In contrast, in an aqueous solution, the following equilibrium relationship for boric acid is established [34].
B(OH)3 + H2O ↔ B(OH)4− + H+; pKa = 9.24
The tetrahydroxyborate ion B(OH)4− is formed in the alkaline region [34]. In complexation, the tetrahydroxyborate ion binds with the cis-diol part, L, as follows [35,36].
B(OH)4− + L ↔ BL− + 2 H2O
B(OH)4− + 2 L ↔ BL2− + 4 H2O
As described above, it could be considered that Xe in the case of the molar ratio 2 was relatively higher than that at the case of the ratio 2 because the tetrahydroxyborate ion could bind with the cis-diol part up to two parts.
Figure 5 shows the relationship between the equilibrium amount of adsorbed lactose, Xe, and the equilibrium pH.
The experimental conditions were almost the same as in Figure 4, but only the initial pH was varied from pH 2 to pH 11. In the range of pH 7–9, Xe reached the maximum value for both the molar ratios 1 and 2. The reason could be considered that in the acidic region, the lactose-borate complex is less likely to form; in the alkaline region, the competitive adsorption between OH− and lactose-borate complexes onto ion exchange resin was caused. The fractions of tetrahydroxyborate ion are ca. 0.01 and 0.4 at pH 7 and 9, respectively, which are calculated from the equilibrium relationship (Equation (2)). The relatively high Xe at pH 7 may be related to the release of OH− ions from adsorbent (ion exchange resin).
Judging by the results shown above, the most optimum initial experimental conditions considered were molar ratio 1 and 2, the initial pH 7–9. In further experiments, these initial conditions were employed.
3.3. Evaluation of Adsorption Kinetics of Lactose on Anion Exchange Resin when Adding Boric Acid
In particular, it is important to evaluate the adsorption kinetics for the determination of the operating time of adsorption operation in terms of practical operation. Figure 6 shows the typical time course of the amount of lactose adsorbed at a time, t, Xt. The amount adsorbed increased very abruptly up to the ca. 18 h in all experimental conditions; after this, it slowly reached the adsorption equilibrium state. The adsorption equilibrium was found to reach 30–45 h, same as in Figure 2. Only in the case of the experimental condition of pH 7 and molar ratio 2, Xt seemed to increase slightly linearly after about 24 h, but this is not considered to be a significant diffusion-limited process. There was little difference depending on the experimental conditions, indicating that the adsorption equilibrium was reached in ca. 24 h. The kinetics equations of the pseudo-second order and the Langmuir are expressed by the following equations.
where k in Equation (5) and ka and kd, in Equation (6) are the adsorption rate constant for the pseudo-second order adsorption kinetics, and the adsorption rate constant and the desorption rate constant for Langmuir adsorption kinetics, respectively. These rate constants were determined by fitting the data to Equations (5) and (6) using least squares regression, respectively. The estimated rate constants are summarized in Table 1 and Table 2 with the coefficient of determination, R2. There were no large differences, particularly in the k values except for the experimental condition of pH 7 and the molar ratio 2. The ka values also were mostly the same without large differences. The K value is defined by the ratio of ka to kd, which corresponds to the equilibrium adsorption constant of Langmuir adsorption. In the case of the molar ratio 2, the K value was about two times larger than that in the case of the molar ratio 1. It has been reported that the adsorption equilibrium constant for bidentate adsorption was larger than that for monodentate adsorption [37]. According to the reaction scheme shown in Equations (3) and (4), it is considered that the tetrahydroxyborate ion could bind with two lactose molecules, which as a result might make bidentate-type adsorption within the anion exchange resin.
3.4. Evaluation of Adsorption Equilibrium of Lactose on Anion Exchange Resin when Adding Boric Acid
We employed Langmuir adsorption isotherm to evaluate the adsorption equilibrium in this study because the adsorption site of anion exchange resin (IRA402) is the quaternary ammonium group, and the complex of cis-diol (lactose) and tetrahydroxyborate ion should have a negative charge. Langmuir isotherm is expressed by the following equation:
where Xs is the saturated amount of lactose adsorbed. The adsorption isotherms are shown in Figure 7. As seen in Figure 7, it was found that Xe reached Xs for each experimental condition. The adsorption parameters, K and Xs, for the Langmuir isotherm were determined by fitting the data to Equation (7) using least squares regression. The values of K and Xs are summarized in Table 3. The lines drawn in Figure 7 are the calculated values using K and Xs determined: the dotted line for pH 7 and molar ratio 1, the solid line for pH 9 and molar ratio 1, the dashed-dotted line for pH 7 and molar ratio 2, and the dashed line for pH 9 and molar ratio 2, respectively. In the case of the molar ratio 1, K and Xs were not substantially different between pH 7 and 9. For both pH 7 and 9, Xs at the molar ratio 1 was about 1.2 times larger than Xs at the molar ratio 2. In the case of pH 9 and the molar ratio 9, Xs was estimated larger than the other three cases as 0.846 × 10⁻³ mol/g. According to the supplier’s data, the anion exchange resin (IRA402) has the total adsorption sites as 4.2 × 10⁻³ mol/g. Comparing these values, the value of Xs at pH 9 and the molar ratio 1 corresponds to only ca. 20% of the supplier’s data. It is considered that if in the case of the molar ratio 2, bidentate adsorption may occur, and Xs at the molar ratio 2 should only be naturally estimated lower than Xs at the molar ratio 1. Since the adsorption of the complex to the resin is probably due to electrostatic attraction, it is reasonable to assume that both the adsorption kinetics and the adsorption equilibrium are of the Langmuir-type adsorption mechanism, although the adsorption kinetic data is statistically in good agreement with the pseudo-second order adsorption kinetics equation. Judging from these experimental results, future experiments were conducted at pH 7 with the molar ratio 1, which requires less boric acid and allows for easier pH adjustment.
There have been many papers that apply several kinetics and adsorption isotherm equations to experimental kinetics data or adsorption equilibrium data and determine the statistically optimal equation by correlation coefficient or coefficient of determination. However, for example, the Freundlich isotherm has been derived empirically and does not have some physical meanings. Moreover, it has been reported that there are many cases in which the Freundlich isotherm could be explained by two Langmuir isotherms [38,39,40,41,42,43,44]. Not only judging from statistical parameters, it is necessary to consider the types of adsorbents, the experimental isotherm profiles, and the overall interpretations of the results of the batch adsorption experiments for the adequate kinetic and adsorption equilibrium isotherm equations. It is very likely that it is possible that the adsorption kinetics and adsorption equilibrium relationship of the adsorption experimental data using adsorbents with a finite number of quantitative functional groups could be expressed by the Langmuir kinetics and isotherm equations. The adsorption isotherms shown in Figure 7, Figure 10 and Figure 11 sufficiently show that the saturated amount adsorbed is reached as the equilibrium concentration increases, and a Langmuir adsorption equilibrium relationship is likely established. If the adsorption rate data in the same system are likely to follow the Langmuir adsorption equilibrium, it is quite natural to assume that the rate model will also follow the Langmuir type. The pseudo-second order kinetic model equation was also applied because the pseudo-second order kinetic model equation is considered to be derived from the Langmuir kinetic equation [45,46,47,48,49,50,51].
3.5. Influence of Coexisting Substances in Whey Solution on Adsorption of Lactose on Anion Exchange Resin when Adding Boric Acid
3.5.1. Influence of Phosphate Ion on Adsorption of Lactose
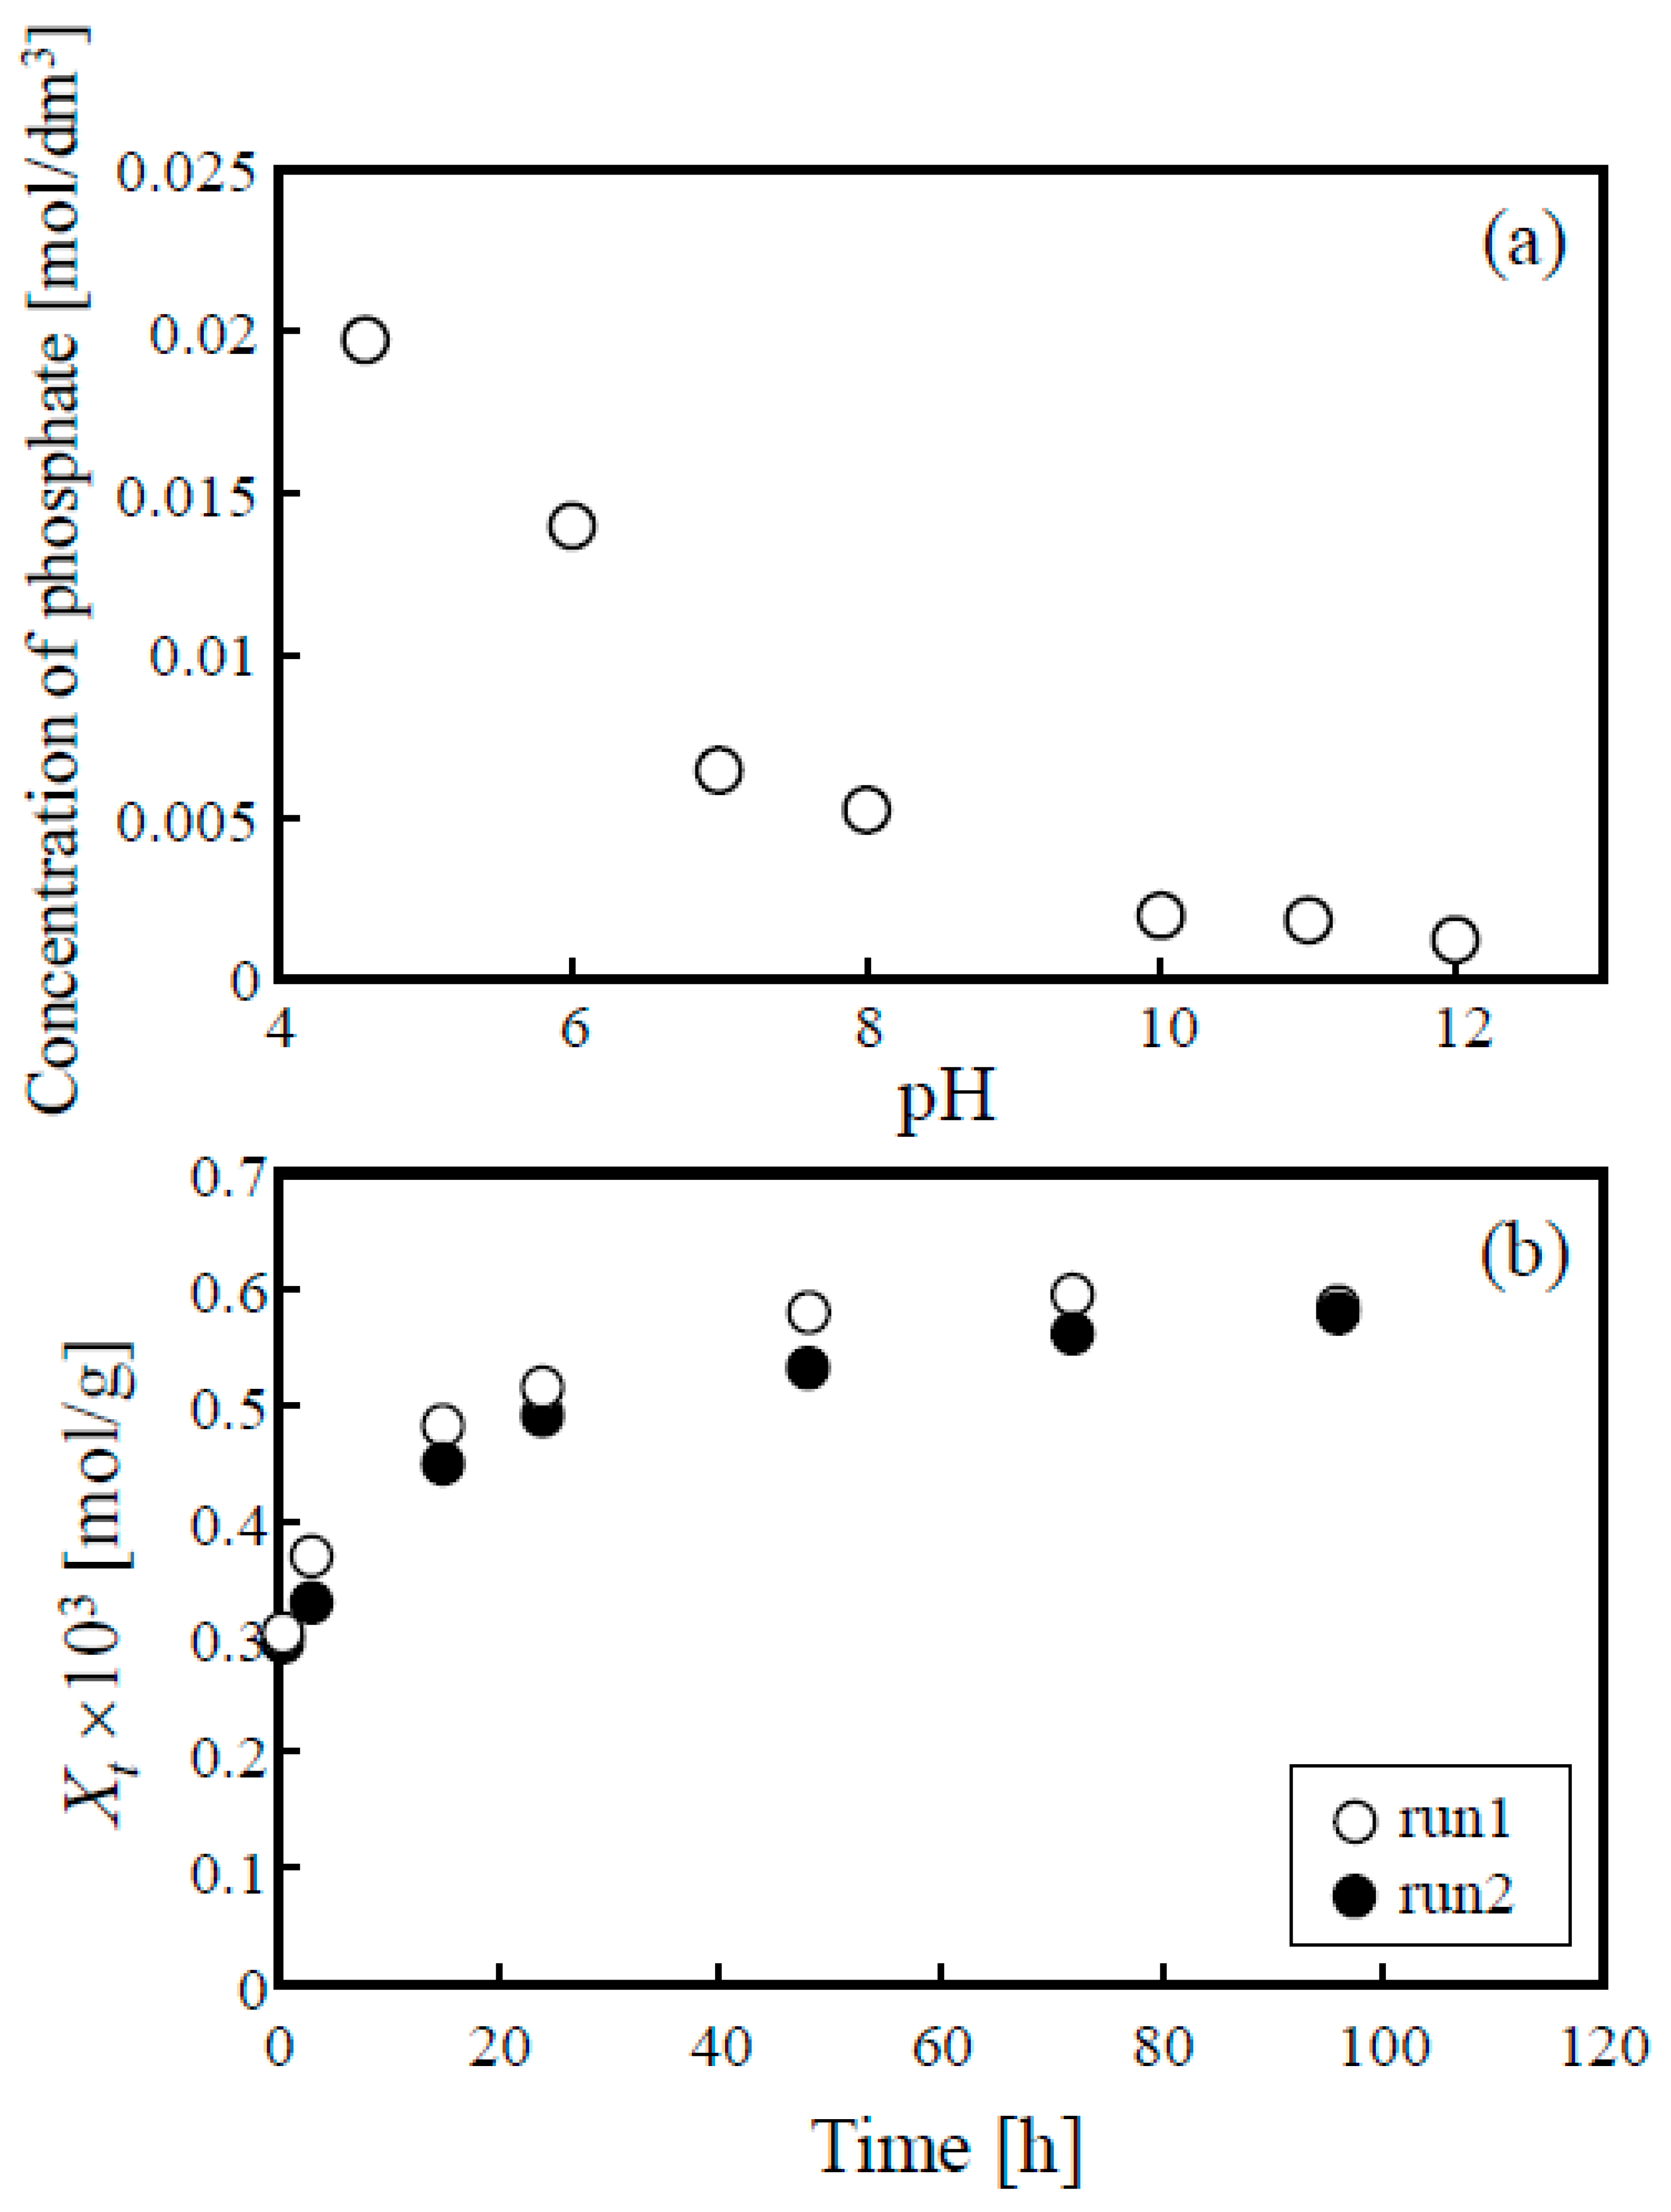
In preliminary experiments, when the pH of the whey solution was raised above 7, the solution became cloudy. Furthermore, in the adsorption experiments, it was difficult to reproduce the experiments because the white precipitated substance adhered to the surface of the resin and was visually confirmed. Phosphate and calcium are two of the most abundant minerals in milk. The concentrations of phosphate and calcium in milk are about 2.9 × 10⁻² mol/L and about 2.5 × 10⁻² mol/L, respectively. More than 70% of calcium is present in casein micelles. Casein micelles are colloidal particles consisting of four components αS1–, αS2–, β–, and κ– caseins dispersed in milk, and are composed of small particles called submicelle, which are bound together via calcium phosphate [4]. The white precipitated substance observed over pH 7 was considered to be calcium phosphate. By varying the pH of the whey solution, the white precipitate was removed by centrifugation and filtration, and the relationship between the pH value and the phosphate concentration was investigated. After preparing the whey solution as described in Section 2.5, the pH value of the whey solution was adjusted to the desired value, and then the solution was centrifuged at 3250× g (3000 rpm) for 15 min. The supernatant solution (whey solution) was filtered by filter paper (Advantec, No. 5C). Figure 8a shows the relationship between the phosphate concentration and pH. When increasing pH value, the phosphate concentration decreased from 1.97 × 10⁻² mol/L (pH 4.6) to 1.23 × 10⁻³ mol/L (pH 12). This result suggests that phosphate was captured in the white precipitated substance and removed from the liquid phase. Lactose adsorption experiments were carried out using the whey solution, which was adjusted at pH 10, centrifuged, and filtered, and then pH was adjusted at pH 7. Figure 8b shows the time course of the amount of lactose adsorbed, in which the results of two experiments (run1 and run2) are shown. The reproducibility of the experiment was very good, indicating that there is no significant variation between the data of the two runs. Compared with the results of adsorption experiments conducted under the same conditions with the model system shown in Figure 1 (open circle symbol), the amount adsorbed at 24 h is 0.727 × 10⁻³ mol/g for the model system, while the amount adsorbed at 96 h is 0.583 × 10⁻³ mol/g for the whey system, indicating that the adsorption rate was slower and the amount was lower than those for the model system.
3.5.2. Influence of Whey Proteins on Adsorption of Lactose
The whey protein concentration was varied by foam separation to investigate the influence of the whey protein concentration on the adsorption of lactose on the resin. Figure 9 shows the typical time course of the whey proteins and lactose within the column. Before conducting foam separation, phosphate ions were removed from the whey solution by adjusting pH 10, centrifugation, and filtration; then, the whey solution was diluted five times and was adjusted to pH 7 to prevent the entire solution from becoming foam by aeration [25]. When the solution was used in the adsorption experiment, the solution was further diluted two times (ten-fold dilution of the original whey solution) and pH was adjusted to pH 7. The whey protein concentration decreased from 0.35 g/L to 0.15 g/L for up to 2 h, while the lactose concentration was kept constant (0.03 mol/L). The adsorption experiments were carried out by varying the whey protein concentration in the whey solution in this manner. The typical result is shown in Figure 10. Boric acid was added to the solution at the molar ratio of 1. As seen in Figure 10, there was no difference in the time course of Xt, even though the initial whey protein concentration was different (0.175 and 0.075 g/L). The open circle symbol corresponded to Xt of the model system (without whey proteins). The Xe (t = 70 min) of the model system was ca. 0.7 × 10⁻³ mol/g, while the Xe (t = 70 min) of the whey system (triangle symbols) was ca. 0.5 × 10⁻³ mol/g, which was 30% lower than that of the model system. These results suggest that the presence of proteins in the system was getting lower than the amount of lactose adsorbed; however, the variation in the protein concentration did not affect the amount of lactose adsorbed.
3.5.3. Influence of Amino Acid and Kinds of Protein on Adsorption of Lactose
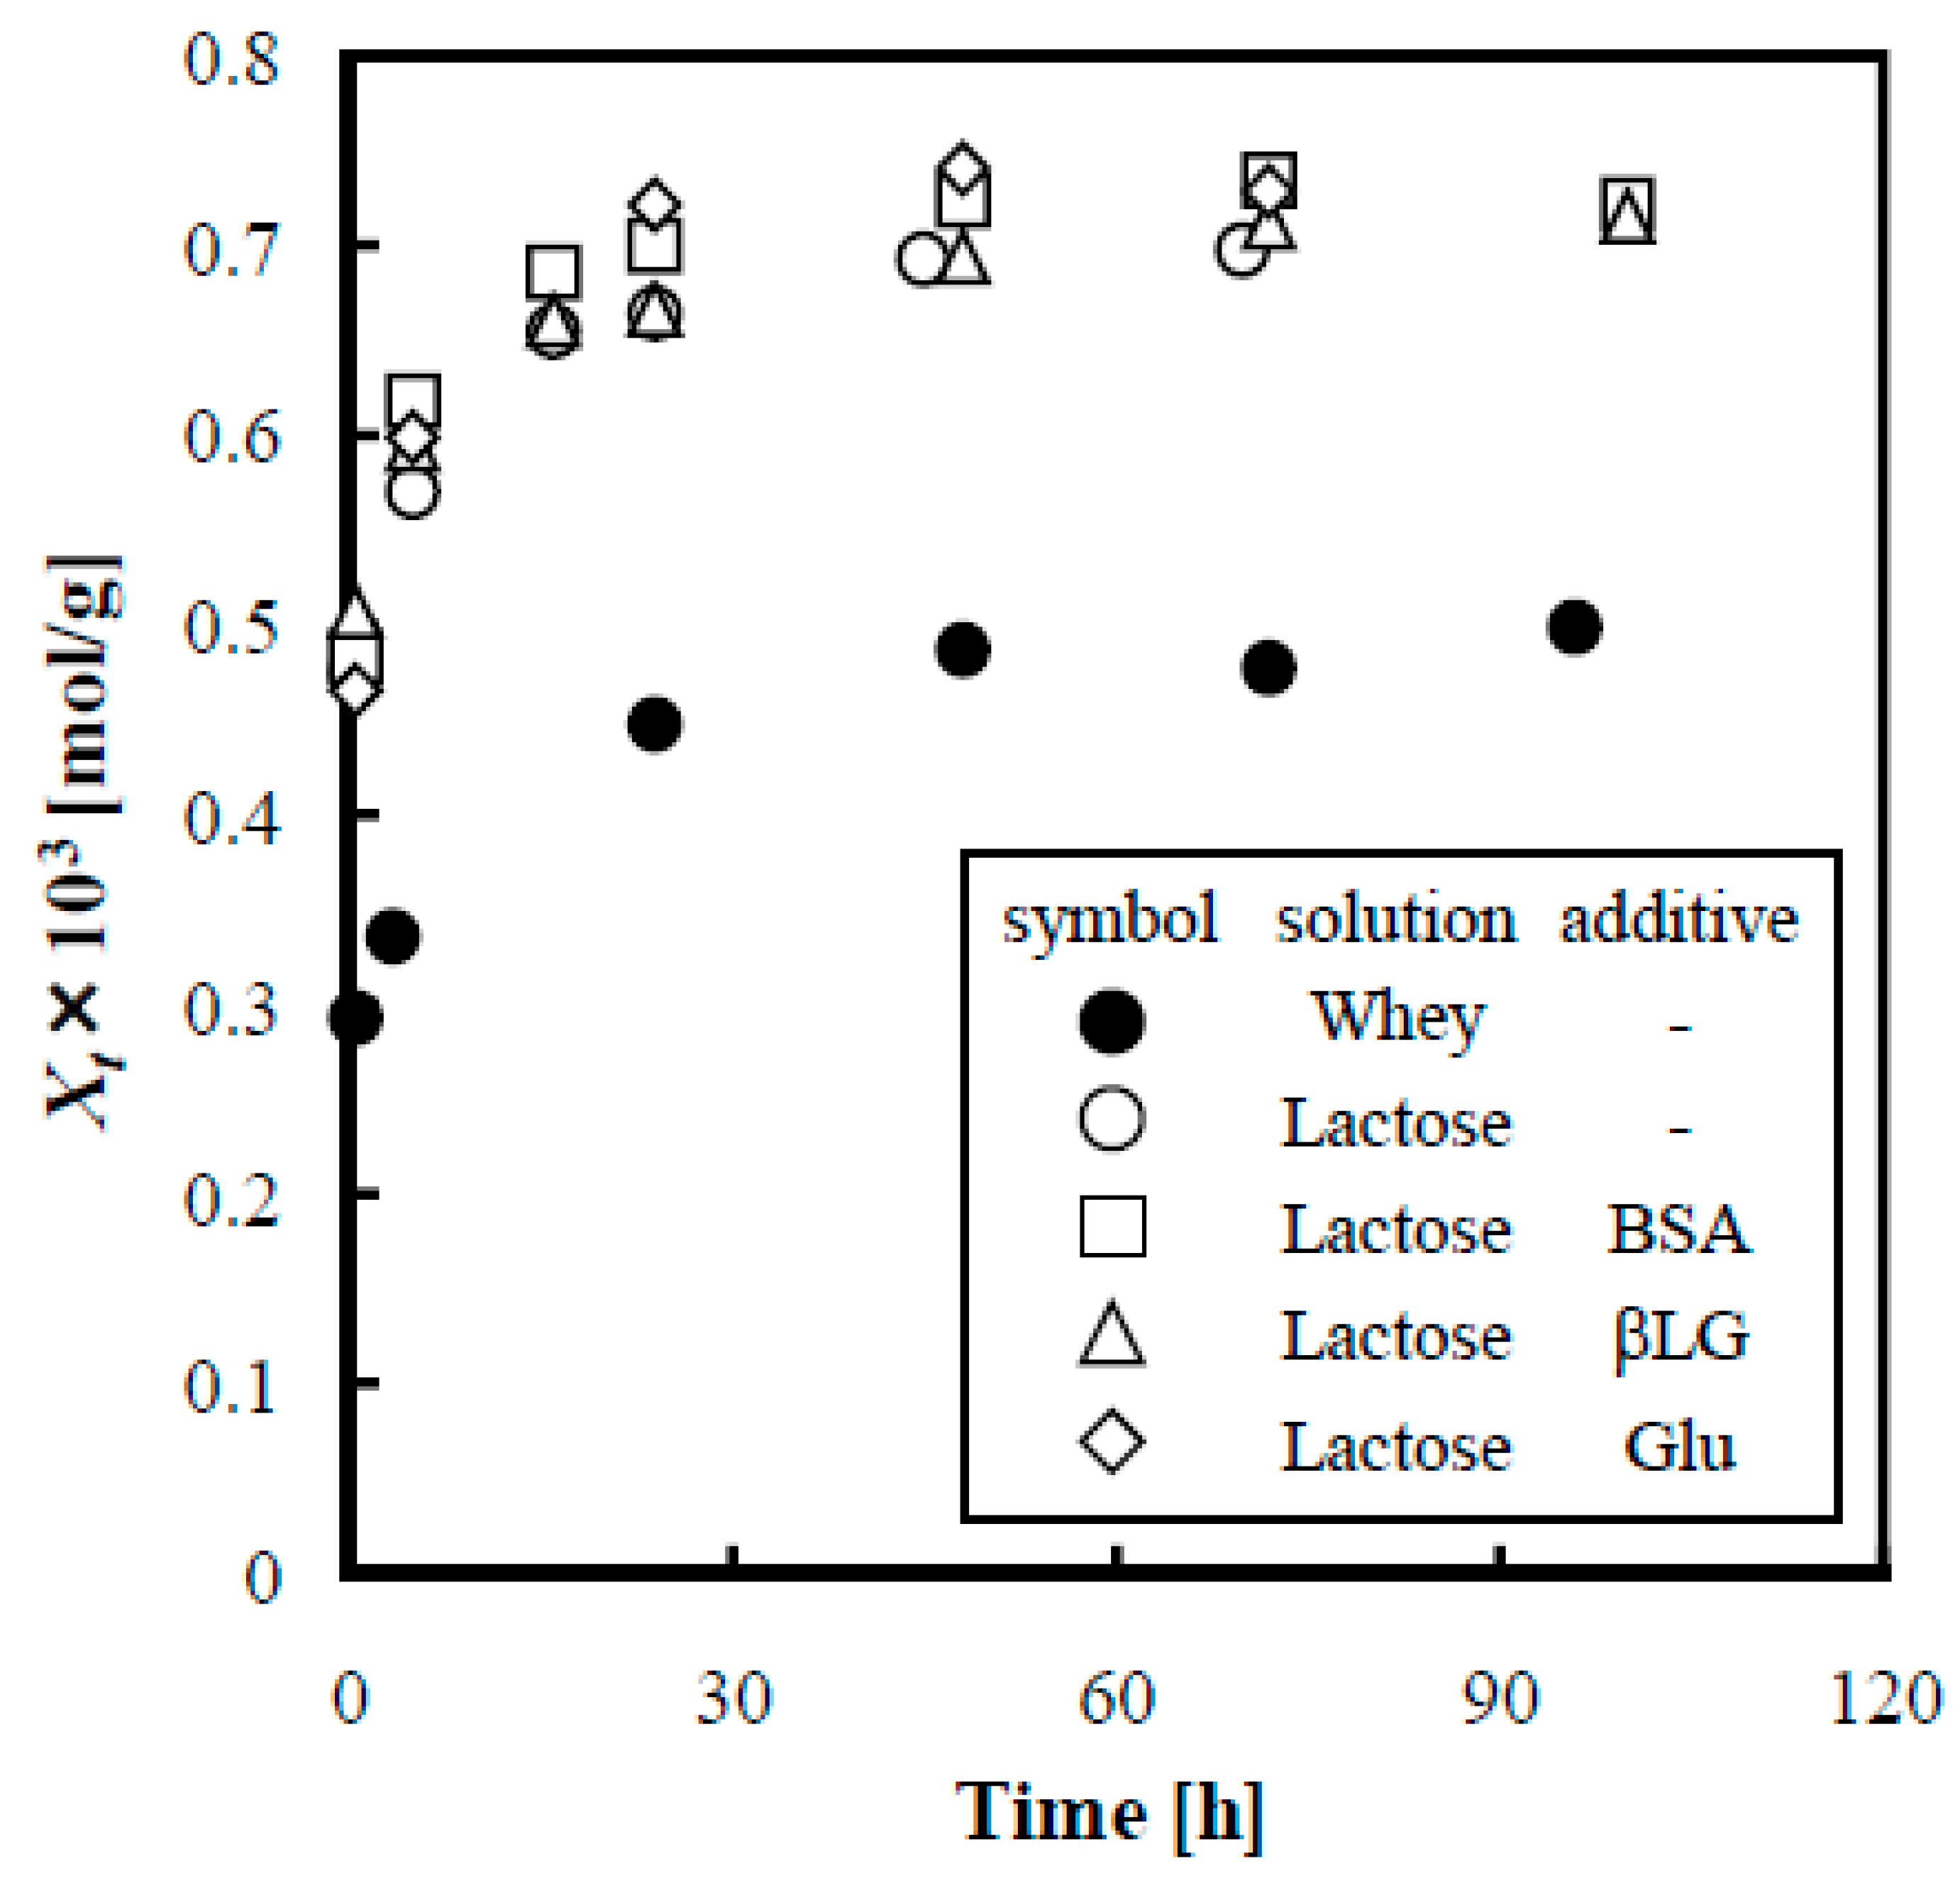
In the previous section, it was suggested that the difference in the concentration of whey proteins did not affect the adsorption of lactose, but the presence of the whey proteins could affect the adsorption of lactose. The difference in the amount of lactose adsorbed between the model system and the whey system was considered to be caused by other substances and types of proteins contained in the whey. Milk whey contains β-lactoglobulin (βLG, 3–4 g/L), α-lactalbumin (ca. 1.5 g/L), and bovine serum albumin (BSA, ca. 0.3–0.6 g/L), which make up ca. 80% content of the total milk whey proteins [52]. In addition, the major amino acid constituents of milk whey are glutamic acid (Glu, ca. 0.04 g/L), tryptophan (0.002 g/L), and glycine (ca. 0.007 g/L), which make up ca. 75% of the total amino acids content of milk whey [53]. βLG, BSA, and glutamic acid were employed as typical proteins and amino acids for the adsorption experiment. The concentration of protein (βLG and BSA) and the amino acid were adjusted to 0.075 g/L and 0.004 g/L in the solution, respectively, and the pH was adjusted to pH 7; the results are shown in Figure 11. The time courses of the amount of lactose adsorbed in the model system were mostly the same, even though any additive was added to the system, while the time courses of the amount of lactose adsorbed in the whey system were ca. 30% lower than those in the model system, and were almost the same with the result shown in Figure 10 (open triangle symbol). Each isoelectric point of βLG, BSA, and Glu is 4.9, 5.2, and 3.25, respectively. They should have a negative charge at pH 7, with which the adsorption experiments were conducted. Based on these experimental results, it is unlikely that the decrease in lactose adsorption in the whey system is due to the influence of proteins or amino acids at pH 7. Because whey also contains various vitamins and chlorine as a major mineral [4], it is assumed that these are influencing factors.
Atra et al. (2005) investigated ultra- and nanofiltration for recovery of whey proteins and lactose and reported that the yield of lactose was ca. 90% by using polyamid nanofilter (RA55 MILLIPORE) under 30 °C [54]. Cuartas-Uribe et al. (2009) studied the separation of lactose from whey ultrafiltration permeate using nanofiltration and reported that the recovery of lactose ranged in 84.6–89.1% by using DS-5 DL (GE-OSMONICS, US) which is made of a thin-film composite with polyamide surface on polysulfone support and polyester matrix [55]. Souza et al. (2010) studied integrated processes (microfiltration, ultrafiltration, ion exchange, reverse osmosis, and spray-drying) to separate and purify lactose from whey and reported that lactose was purified as 88.5% by a single-stage ultrafiltration and also was purified as 97.7% by a second stage ultrafiltration [56]. Ding et al. (2016) studied the shear-enhanced ultrafiltration to concentrate whey protein and lactose and reported that recovery of lactose was 30% using polyethersulphone ultrafiltration membranes [57]. Sánchez-Moya et al. (2020) studied the separation of lactose from sheep whey with ultrafiltration and reported that the recovery of lactose was 10% by using a polysulfone ultrafiltration membrane in the filtration of whey [5]. Zhang et al. (2020) investigated a combination of ultrafiltration, electrodialysis, and nanofiltration to produce low-lactose milk powder, and reported that the recovery of lactose was 44% by ultrafiltration [58]. Based on the results of Figure 10 and Figure 11, the recovery of the adsorption method in this study was 58–60% in the model system for lactose, and 40–42% in the actual system with whey. Even in the case of ultrafiltration, a recovery rate of about 40% has been reported in some cases, and this method can be considered to be doing well as a simple treatment method in small-scale plants.
3.6. Limitation of the Present Adsorption Process
Although the addition of boric acid made it possible to regenerate IRB402, the desorption efficiency was only about 70%, and about 30% of boric acid remained in IRA402, which means that complete regeneration of the resin may be difficult. Although it is only an assumption, because the binding ability of IRA402 and chlorine ions is very strong, it may be possible to regenerate IRA402 by adding NaCl, and so on. Another problem is that it is necessary to remove boric acid from the desorption solution after lactose is desorbed from IRA402. This problem can be solved by using a special ion exchange resin for boric acid.
The necessity to remove minerals and vitamins from the actual whey is also an issue for further study.
4. Conclusions
The adsorption separation of lactose using an anion exchange resin with the addition of boric acid was studied from both fundamental and applied aspects with the aim of effective utilization of whey and reduction of environmental pollution. The following results were obtained.
- By exchanging the counter ion of the anion exchange resin (IRA402) from chloride ion to hydroxide ion, lactose could be adsorbed onto IRA402, and the amount of lactose adsorbed was 14.2 times larger.
- The addition of boric acid enabled the desorption of lactose from anion exchange resins, and resulted in 72% desorption of lactose from IRA402, and the desorption rate (%) increased 6.7-fold.
- The binding between tetrahydroxyboronate ion and the cis-diol of lactose is considered to be the most likely adsorption species.
- The optimal amount of boric acid and pH were 1:1 in the molar ratio of boric acid to lactose and pH 7–9.
- Langmuir-type adsorption equilibrium relationship was established.
- The recovery of the adsorption method in this study was 58–60% in the model system for lactose, and 40–42% in the actual system with whey.
- The amount of lactose adsorbed from the actual whey solution was 35% lower than in the model system. It was suggested that coexisting minerals, vitamins, and chlorine ions influenced the amount of lactose adsorbed from the whey solution.
In further studies, we will conduct a more detailed analysis of the effect of pH on the amount of lactose adsorbed and will extend this study to a fixed-bed adsorption operation and separation of boric acid from a practical point of view. The reuse of waste contributes to SDGs (Sustainable Development Goals subjected by the United Nations), and we could propose one of the contribution manners for SDGs in this study.
Author Contributions
H.M.: Planning the experiments of this research, Conducting the experiments, Analysis of the experimental data, Writing original manuscript. H.S.: Advising experimental method, Discussions about results, Writing—Reviewing and Editing. All authors have read and agreed to the published version of the manuscript.
Funding
This research received no external funding.
Data Availability Statement
Data will be made available on request.
Acknowledgments
The authors appreciate Kazuaki Shibuya, a former graduate student of the Division of Marine Bioscience, Graduate School of Fisheries Sciences, Hokkaido University, and Ryosuke Sato and Hishou Sakamoto, former students of the Department of Marine Bioresources Chemistry, Faculty of Fisheries, Hokkaido University, for their help and efforts in the experiments.
Conflicts of Interest
The authors declare that they have no known competing financial interests or personal relationships that could have appeared to influence the work reported in this paper.
Nomenclature
| C | = concentration of metal ion within the column | [mol/m3] |
| Cdmax | = the maximum concentration of lactose by releasing lactose | [mol/m3] |
| Ci | = initial concentration of of lactose | [mol/m3] |
| Ct | = concentration of lactose at time, t | [mol/m3] |
| k | = adsorption rate constant defined in Equation (5) | [kg/(mol min)] |
| K | = equilibrium adsorption constant defined in Equation (7) | [m3/mol] |
| ka | = adsorption rate constant defined in Equation (6) | [m3/(mol min)] |
| kd | = desorption rate constant defined in Equation (6) | [min−1] |
| m | = mass of anion exchange resin | [kg] |
| R | = removal efficiency of metal ion | [-] |
| t | = time | [min] |
| Xe | = equilibrium amount of lactose adsorbed | [mol/kg] |
| Xs | = saturated amount of lactose adsorbed | [mol/kg] |
| Xt | = amount of lactose adsorbed at time, t | [mol/kg] |
| V | = volume of liquid | [m3] |
References
- Siso, M.I.G. The biotechnological utilization of cheese whey: A review. Bioresour. Technol. 1996, 57, 1–11. [Google Scholar] [CrossRef]
- Illanes, A. Whey upgrading by enzyme biocatalysis. Electron. J. Biotechnol. 2011, 14, 9. [Google Scholar] [CrossRef]
- Chourasia, R.; Phukon, L.C.; Abedin, M.; Padhi, S.; Singh, S.P.; Rai, A.K. Whey valorization by microbial and enzymatic bioprocesses for the production of nutraceuticals and value-added products. Bioresour. Technol. Rep. 2022, 19, 101144. [Google Scholar] [CrossRef]
- Walstra, P.; Jenness, R. Dairy Chemistry and Physics; John Wiley & Sons: NewYork, NY, USA, 1984. [Google Scholar]
- Sánchez-Moya, T.; Hidalgo, A.M.; Ros-Berruezo, G.; López-Nicolás, R. Screening ultrafiltration membranes to separate lactose and protein from sheep whey: Application of simplified model. J. Food Sci. Technol. 2020, 57, 3193–3200. [Google Scholar] [CrossRef]
- Qi, T.; Yang, D.; Chen, X.; Qiu, M.; Fan, Y. Rapid removal of lactose for low-lactose milk by ceramic membranes. Sep. Purif. Technol. 2022, 289, 120601. [Google Scholar] [CrossRef]
- Casado-Coterillo, C.; Díaz-Guridi, P.; Otero, J.A.; Ibáñez, R. Modeling of lactic acid rejection from lactose in acidified cheese whey by nanofiltration. J. Dairy Sci. 2023, 106, 4533–4544. [Google Scholar] [CrossRef]
- Khani, M.H.; Khamseh, A.G. Statistical analysis, equilibrium and dynamic study on the biosorption of strontium ions on Chlorella vulgaris. J. Radioanal. Nucl. Chem. 2023, 332, 3325–3334. [Google Scholar] [CrossRef]
- Khamseh, A.A.G.; Ghorbanian, S.A.; Amini, Y.; Shadman, M.M. Investigation of kinetic, isotherm and adsorption efficacy of thorium by orange peel immobilized on calcium alginate. Sci. Rep. 2023, 13, 8393. [Google Scholar] [CrossRef]
- Khamseh, A.G.; Ghorbanian, S.A. Experimental and modeling investigation of thorium biosorption by orange peel in a continuous fixed-bed column. J. Radioanal. Nucl. Chem. 2018, 317, 871–879. [Google Scholar] [CrossRef]
- Elbadawy, H.A.; Abdel-Salam, A.H.; Khalil, T.E. The impact of an Amberlite XAD-16-based chelating resin for the removal of aqueous Cd(II) and Pb(II)ions. Microchem. J. 2021, 165, 106097. [Google Scholar] [CrossRef]
- Shaaban, A.; Fadel, D.; Mahmoud, A.; Elkomy, M.; Elbahy, S. Synthesis of a new chelating resin bearing amidoxime group for adsorption of Cu(II), Ni(II) and Pb(II) by batch and fixed-bed column methods. J. Environ. Chem. Eng. 2014, 2, 632–641. [Google Scholar] [CrossRef]
- Gossuin, Y.; Hantson, A.-L.; Vuong, Q.L. Low resolution benchtop nuclear magnetic resonance for the follow-up of the removal of Cu2+ and Cr3+ from water by amberlite IR120 ion exchange resin. J. Water Process Eng. 2020, 33, 101024. [Google Scholar] [CrossRef]
- Asuquo, E.; Martin, A.; Nzerem, P.; Siperstein, F.; Fan, X. Adsorption of Cd(II) and Pb(II) ions from aqueous solutions using mesoporous activated carbon adsorbent: Equilibrium, kinetics and characterisation studies. J. Environ. Chem. Eng. 2017, 5, 679–698. [Google Scholar] [CrossRef]
- Aguayo-Villarreal, I.; Bonilla-Petriciolet, A.; Muñiz-Valencia, R. Preparation of activated carbons from pecan nutshell and their application in the antagonistic adsorption of heavy metal ions. J. Mol. Liq. 2017, 230, 686–695. [Google Scholar] [CrossRef]
- Bian, Y.; Bian, Z.; Zhang, J.; Ding, A.; Liu, S.; Zheng, L.; Wang, H. Adsorption of cadmium ions from aqueous solutions by activated carbon with oxygen-containing functional groups. Chin. J. Chem. Eng. 2015, 23, 1705–1711. [Google Scholar] [CrossRef]
- Hong, M.; Yu, L.; Wang, Y.; Zhang, J.; Chen, Z.; Dong, L.; Zan, Q.; Li, R. Heavy metal adsorption with zeolites: The role of hierarchical pore architecture. Chem. Eng. J. 2019, 359, 363–372. [Google Scholar] [CrossRef]
- Zanin, E.; Scapinello, J.; de Oliveira, M.; Rambo, C.L.; Franscescon, F.; Freitas, L.; de Mello, J.M.M.; Fiori, M.A.; Oliveira, J.; Magro, J.D. Adsorption of heavy metals from wastewater graphic industry using clinoptilolite zeolite as adsorbent. Process Saf. Environ. Prot. 2017, 105, 194–200. [Google Scholar] [CrossRef]
- Kasai, M.; Kobayashi, Y.; Togo, M.; Nakahira, A. Synthesis of zeolite-surface-modified perlite and their heavy metal adsorption capability. Mater. Today Proc. 2019, 16, 232–238. [Google Scholar] [CrossRef]
- Tanan, W.; Panpinit, S.; Saengsuwan, S. Comparison of microwave-assisted and thermal-heated synthesis of P(HEMA-co-AM)/PVA interpenetrating polymer network (IPN) hydrogels for Pb(II) removal from aqueous solution: Characterization, adsorption and kinetic study. Eur. Polym. J. 2021, 143, 110193. [Google Scholar] [CrossRef]
- Gokmen, F.; Yaman, E.; Temel, S. Eco-friendly polyacrylic acid based porous hydrogel for heavy metal ions adsorption: Characterization, adsorption behavior, thermodynamic and reusability studies. Microchem. J. 2021, 168, 106357. [Google Scholar] [CrossRef]
- Zumreoglu-Karan, B.; Köse, D.A. Boric acid: A simple molecule of physiologic, therapeutic and prebiotic significance. Pure Appl. Chem. 2015, 87, 155–162. [Google Scholar] [CrossRef]
- Kunin, R.; Preuss, A.F. Characterization of a Boron-Specific Ion Exchange Resin. I&EC Prod. Res. Dev. 1964, 3, 304–306. [Google Scholar] [CrossRef]
- Bai, S.; Li, J.; Ding, W.; Chen, S.; Ya, R. Removal of boron by a modified resin in fixed bed column: Breakthrough curve analysis using dynamic adsorption models and artificial neural network model. Chemosphere 2022, 296, 134021. [Google Scholar] [CrossRef] [PubMed]
- Maruyama, H.; Seki, H. Recovery of milk whey proteins by foam separation. Process Saf. Environ. Prot. 2022, 159, 566–574. [Google Scholar] [CrossRef]
- Maruyama, H.; Seki, H.; Suzuki, A.; Inoue, N. Batch foam separation of a soluble protein. Water Res. 2007, 41, 710–718. [Google Scholar] [CrossRef] [PubMed]
- Maruyama, H.; Seki, H. Enhancement of separation rate and recovery efficiency of milk whey proteins by addition of calcium and magnesium ions in batch foam separation. Process Saf. Environ. Prot. 2022, 162, 1102–1106. [Google Scholar] [CrossRef]
- DuBois, M.; Gilles, K.A.; Hamilton, J.K.; Rebers, P.A.; Smith, F. Colorimetric method for determination of sugars and related substances. Anal. Chem. 1956, 28, 350–356. [Google Scholar] [CrossRef]
- Smith, W.C.; Goudie, A.J.; Sivertson, J.N. Colorimetric Determination of Trace Quantities of Boric Acid in Biological Materials. Anal. Chem. 1955, 27, 295–297. [Google Scholar] [CrossRef]
- Crouch, S.R.; Malmstadt, H.V. Mechanistic investigation of molybdenum blue method for determination of phosphate. Anal. Chem. 1967, 39, 1084–1089. [Google Scholar] [CrossRef]
- Lowry, O.H.; Rosebrough, N.J.; Farr, A.L.; Randall, R.J. Protein measurement with the Folin phenol reagent. J. Biol. Chem. 1951, 193, 265–275. [Google Scholar] [CrossRef]
- Maillard, L.C. Action of amino acids on sugars. Formation of melanoidins in a methodical way. C. R. 1912, 154, 66–68. (In French) [Google Scholar] [CrossRef]
- Belitz, H.D.; Grosch, W.; Schieberle, P. Food Chemistry; Springer: Berlin/Heidelberg, Germany, 2009. [Google Scholar] [CrossRef]
- Smith, J.T.; Nashabeh, W.; El Rassi, Z. Micellar electrokinetic capillary chromatography with in situ charged micelles. Evaluation of N-D-Gluco-N-methylalkanamide surfactants as anionic borate complexes. Anal. Chem. 1994, 66, 1119–1133. [Google Scholar] [CrossRef]
- Van Duin, M.; Peters, J.; Kieboom, A.; Van Bekkum, H. Studies on borate esters II: Structure and stability of borate esters of polyhydroxycarboxylates and related polyols in aqueous alkaline media as studied by 11B NMR. Tetrahedron 1985, 41, 3411–3421. [Google Scholar] [CrossRef]
- Makkee, M.; Kieboom, A.P.G.; van Bekkum, H. Studies on borate esters III. Borate esters of D-mannitol, D-glucitol, D-fructose and D-glucose in water. Recl. Trav. Chim. Pays-Bas 1985, 104, 230–235. [Google Scholar] [CrossRef]
- Seki, H.; Suzuki, A. Adsorption of Heavy Metal Ions to Floc-Type Biosorbents. J. Colloid Interface Sci. 2002, 249, 295–300. [Google Scholar] [CrossRef] [PubMed]
- González-García, C.; González-Martín, M.; Denoyel, R.; Gallardo-Moreno, A.; Labajos-Broncano, L.; Bruque, J. Ionic surfactant adsorption onto activated carbons. J. Colloid Interface Sci. 2004, 278, 257–264. [Google Scholar] [CrossRef]
- González-García, C.; González-Martín, M.; González, J.; Sabio, E.; Ramiro, A.; Gañán, J. Nonionic surfactants adsorption onto activated carbon. Influence of the polar chain length. Powder Technol. 2004, 148, 32–37. [Google Scholar] [CrossRef]
- González-García, C.; González-Martín, M.; Denoyel, R.; Gallardo-Moreno, A.; Labajos-Broncano, L.; Bruque, J. Adsorption enthalpies of sodium dodecyl sulphate onto carbon blacks in the low concentration range. Carbon 2005, 43, 567–572. [Google Scholar] [CrossRef]
- Escudero, R.R.; Robitzer, M.; Di Renzo, F.; Quignard, F. Alginate aerogels as adsorbents of polar molecules from liquid hydrocarbons: Hexanol as probe molecule. Carbohydr. Polym. 2008, 75, 52–57. [Google Scholar] [CrossRef]
- Maruyama, H.; Seki, H. Adsorption modeling by two sites Langmuir type isotherm for adsorption of bisphenol-A and diethyl phthalate onto activated carbon in single and binary system. Sep. Sci. Technol. 2022, 57, 1535–1542. [Google Scholar] [CrossRef]
- Hamza, M.F.; Guibal, E.; Althumayri, K.; Vincent, T.; Yin, X.; Wei, Y.; Li, W. New Process for the Sulfonation of Algal/PEI Biosorbent for Enhancing Sr(II) Removal from Aqueous Solutions—Application to Seawater. Molecules 2022, 27, 7128. [Google Scholar] [CrossRef] [PubMed]
- Salih, K.A.M.; Zhou, K.; Hamza, M.F.; Mira, H.; Wei, Y.; Ning, S.; Guibal, E.; Salem, W.M. Phosphonation of Alginate–Polyethyleneimine Beads for the Enhanced Removal of Cs(I) and Sr(II) from Aqueous Solutions. Gels 2023, 9, 152. [Google Scholar] [CrossRef] [PubMed]
- Liu, Y.; Shen, L. From Langmuir Kinetics to First- and Second-Order Rate Equations for Adsorption. Langmuir 2008, 24, 11625–11630. [Google Scholar] [CrossRef] [PubMed]
- Marczewski, A.W. Analysis of Kinetic Langmuir Model. Part I: Integrated Kinetic Langmuir Equation (IKL): A New Complete Analytical Solution of the Langmuir Rate Equation. Langmuir 2010, 26, 15229–15238. [Google Scholar] [CrossRef]
- Regazzoni, A.E. Adsorption kinetics at solid/aqueous solution interfaces: On the boundaries of the pseudo-second order rate equation. Colloids Surfaces A Physicochem. Eng. Asp. 2020, 585, 124093. [Google Scholar] [CrossRef]
- Rodrigues, A.E.; Silva, C.M. What’s wrong with Lagergreen pseudo first order model for adsorption kinetics? Chem. Eng. J. 2016, 306, 1138–1142. [Google Scholar] [CrossRef]
- Shen, L.; Liu, Y.; Paul, E. A simple geometric approach for simplification of Langmuir kinetics for adsorption. Colloids Surfaces A Physicochem. Eng. Asp. 2009, 349, 78–82. [Google Scholar] [CrossRef]
- Tan, K.; Hameed, B. Insight into the adsorption kinetics models for the removal of contaminants from aqueous solutions. J. Taiwan Inst. Chem. Eng. 2017, 74, 25–48. [Google Scholar] [CrossRef]
- Rudzinski, W.; Plazinski, W. Kinetics of Solute Adsorption at Solid/Solution Interfaces: A Theoretical Development of the Empirical Pseudo-First and Pseudo-Second Order Kinetic Rate Equations, Based on Applying the Statistical Rate Theory of Interfacial Transport. J. Phys. Chem. B 2006, 110, 16514–16525. [Google Scholar] [CrossRef]
- Zydney, A.L. Protein Separations Using Membrane Filtration: New Opportunities for Whey Fractionation. Int. Dairy J. 1998, 8, 243–250. [Google Scholar] [CrossRef]
- Vasson, M.-P.; Farges, M.-C.; Sarret, A.; Cynober, L. Free amino acid concentrations in milk: Effects of microwaveversus conventional heating. Amino Acids 1998, 15, 385–388. [Google Scholar] [CrossRef]
- Atra, R.; Vatai, G.; Bekassy-Molnar, E.; Balint, A. Investigation of ultra- and nanofiltration for utilization of whey protein and lactose. J. Food Eng. 2005, 67, 325–332. [Google Scholar] [CrossRef]
- Cuartas-Uribe, B.; Alcaina-Miranda, M.; Soriano-Costa, E.; Mendoza-Roca, J.; Iborra-Clar, M.; Lora-García, J. A study of the separation of lactose from whey ultrafiltration permeate using nanofiltration. Desalination 2009, 241, 244–255. [Google Scholar] [CrossRef]
- de Souza, R.R.; Bergamasco, R.; da Costa, S.C.; Feng, X.; Faria, S.H.B.; Gimenes, M.L. Recovery and purification of lactose from whey. Chem. Eng. Process. Process Intensif. 2010, 49, 1137–1143. [Google Scholar] [CrossRef]
- Ding, L.; Zhang, W.; Ould-Dris, A.; Jaffrin, M.Y.; Tang, B. Concentration of Milk Proteins for Producing Cheese Using a Shear-Enhanced Ultrafiltration Technique. Ind. Eng. Chem. Res. 2016, 55, 11130–11138. [Google Scholar] [CrossRef]
- Zhang, H.; Tao, Y.; He, Y.; Pan, J.; Yang, K.; Shen, J.; Gao, C. Preparation of Low-Lactose Milk Powder by Coupling Membrane Technology. ACS Omega 2020, 5, 8543–8550. [Google Scholar] [CrossRef]
Figure 1.
Influences of the counter ions of anion exchange resin (chlorine ion and hydroxyl ion), on lactose adsorption onto anion exchange resin, IRA402. Experimental conditions: lactose 0.015 M; boric acid 0.015 M; solution volume 80 mL; IRA402 1.0 dry–g; initial pH 7.
Figure 1.
Influences of the counter ions of anion exchange resin (chlorine ion and hydroxyl ion), on lactose adsorption onto anion exchange resin, IRA402. Experimental conditions: lactose 0.015 M; boric acid 0.015 M; solution volume 80 mL; IRA402 1.0 dry–g; initial pH 7.
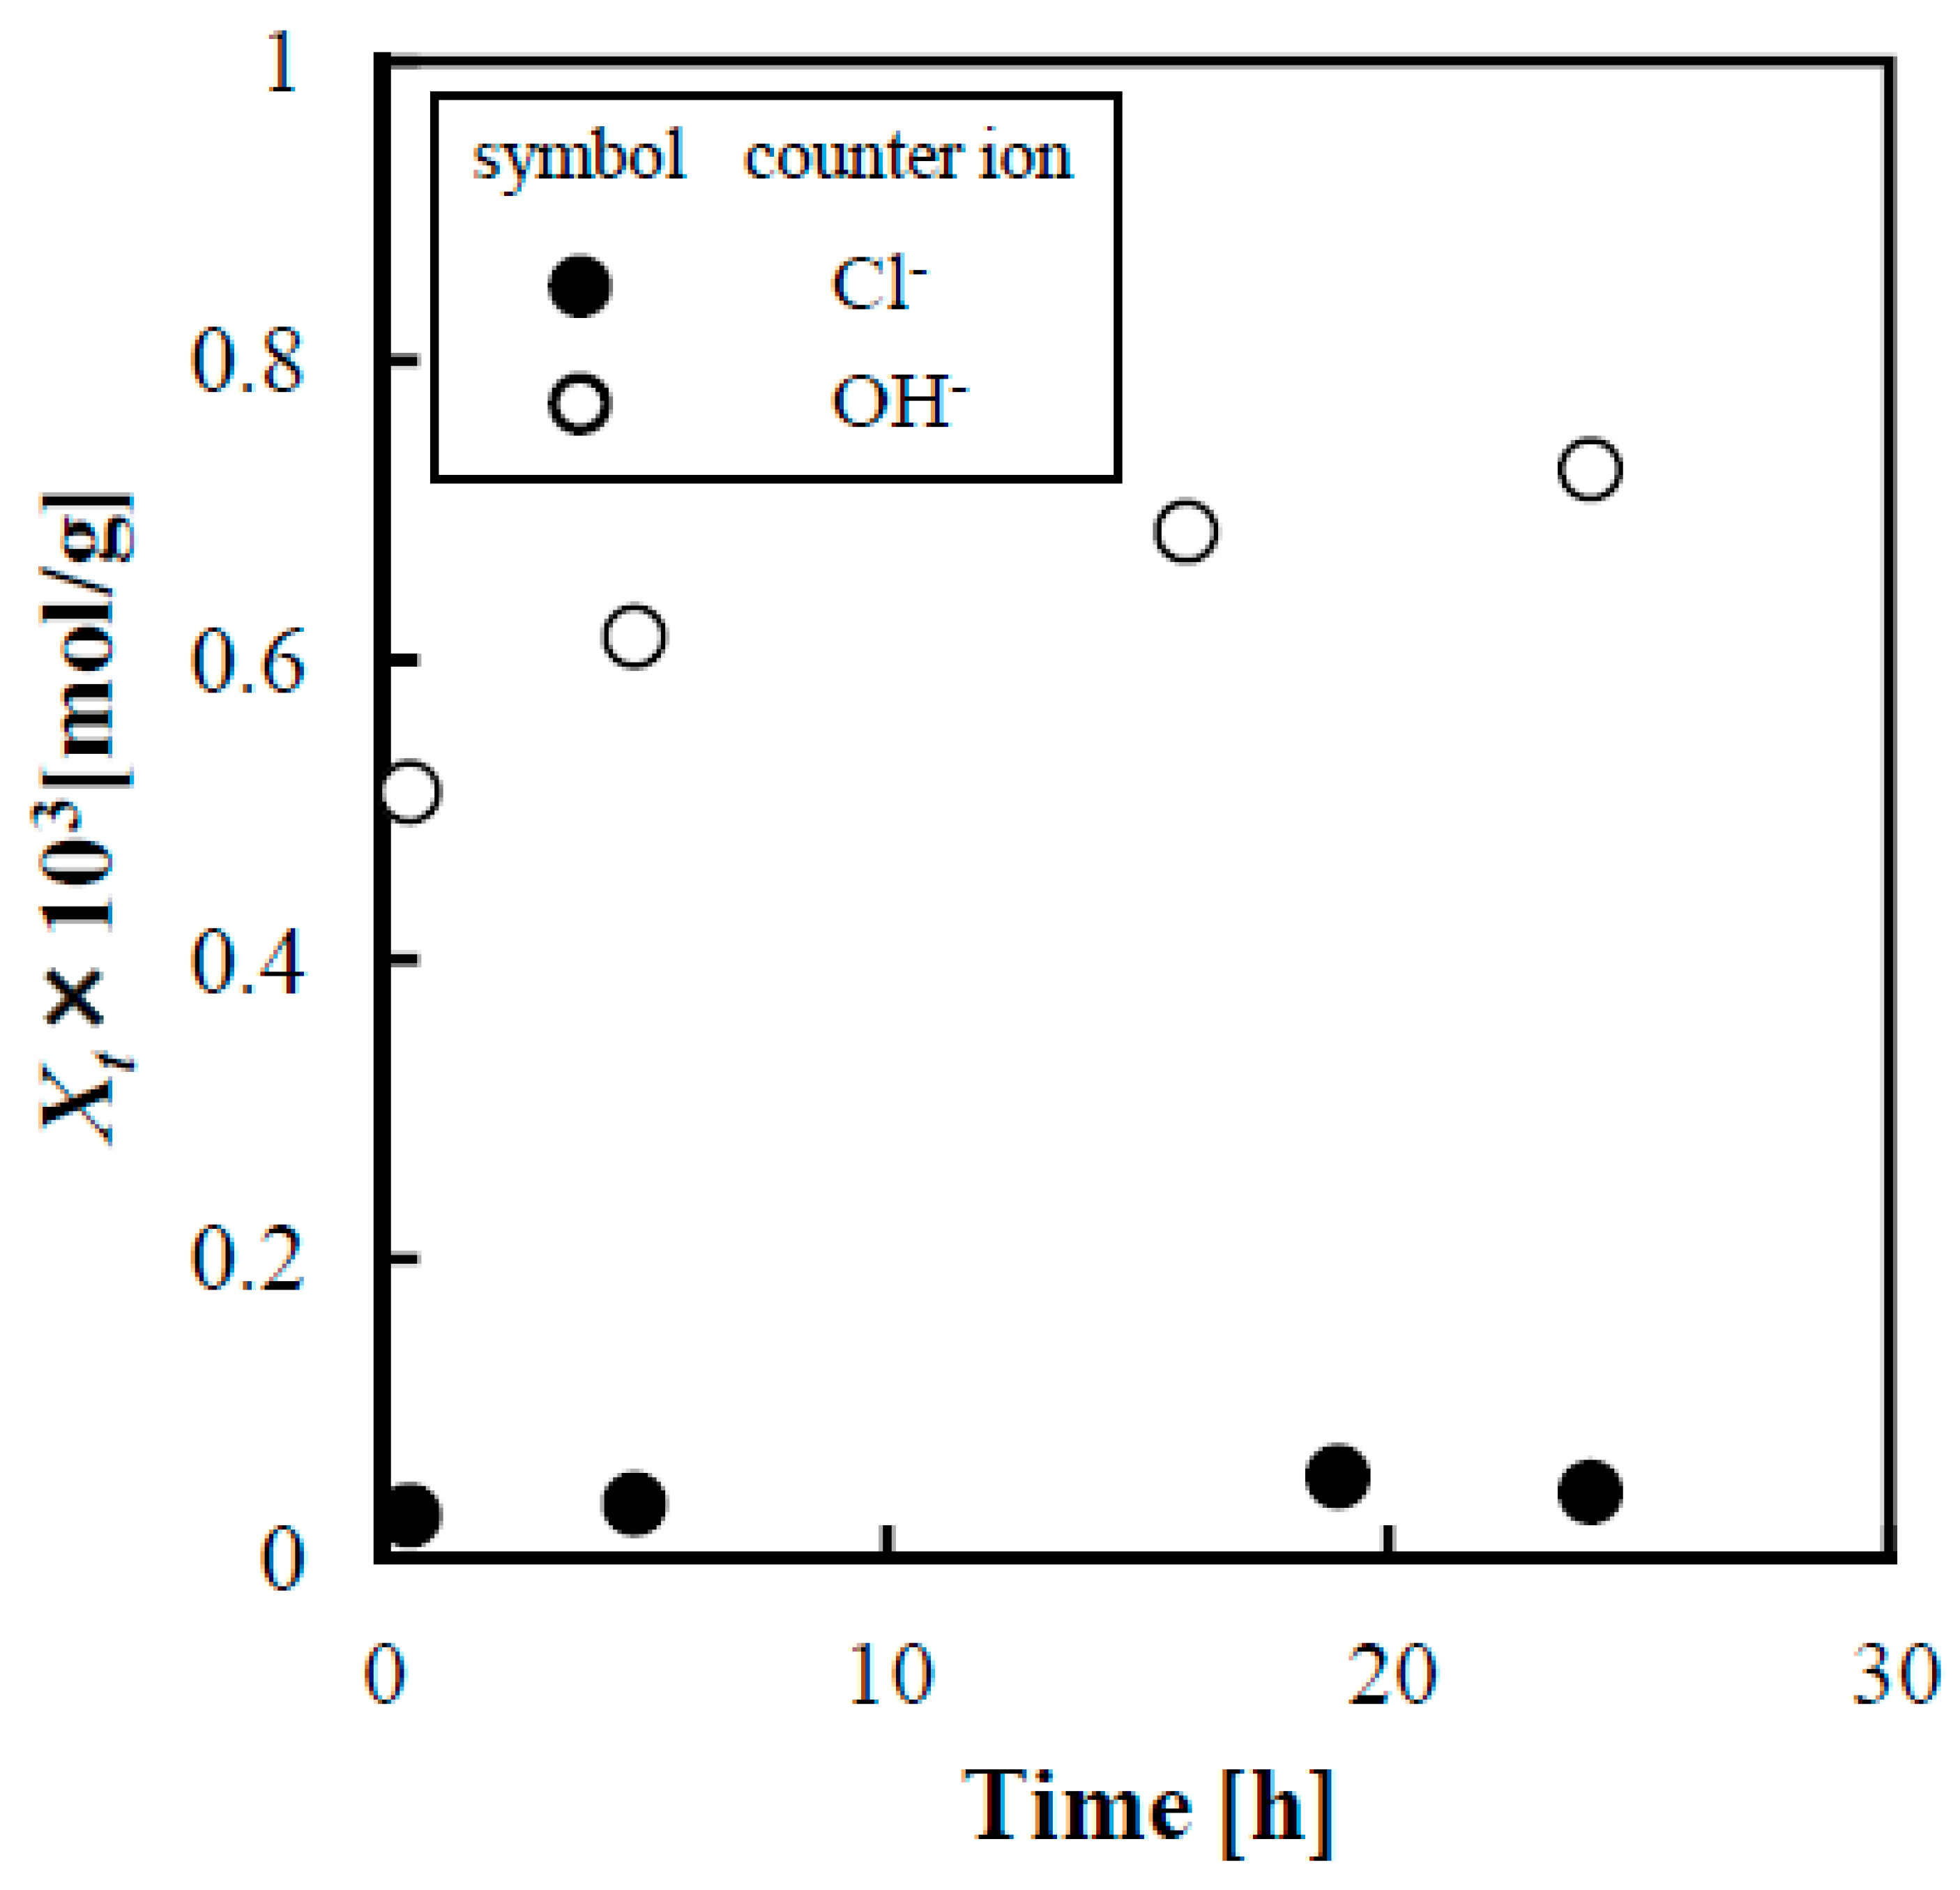
Figure 2.
Influence of boric acid on lactose adsorption onto IRA402 anion exchange resin. Experimental conditions: lactose 0.01 M; boric acid 0.01 M; solution volume 40 mL; IRA402 0.5 dry-g; initial pH 7.
Figure 2.
Influence of boric acid on lactose adsorption onto IRA402 anion exchange resin. Experimental conditions: lactose 0.01 M; boric acid 0.01 M; solution volume 40 mL; IRA402 0.5 dry-g; initial pH 7.

Figure 3.
Influence of boric acid on lactose desorption from anion exchange resin, IRA402 with 1 M NaCl solution. Experimental conditions: (desorption) solution volume 40 mL; IRA402 1.0 dry-g; initial pH 7; (adsorption) solution volume 80 mL; IRA402 1.0 dry-g; initial pH 7.
Figure 3.
Influence of boric acid on lactose desorption from anion exchange resin, IRA402 with 1 M NaCl solution. Experimental conditions: (desorption) solution volume 40 mL; IRA402 1.0 dry-g; initial pH 7; (adsorption) solution volume 80 mL; IRA402 1.0 dry-g; initial pH 7.
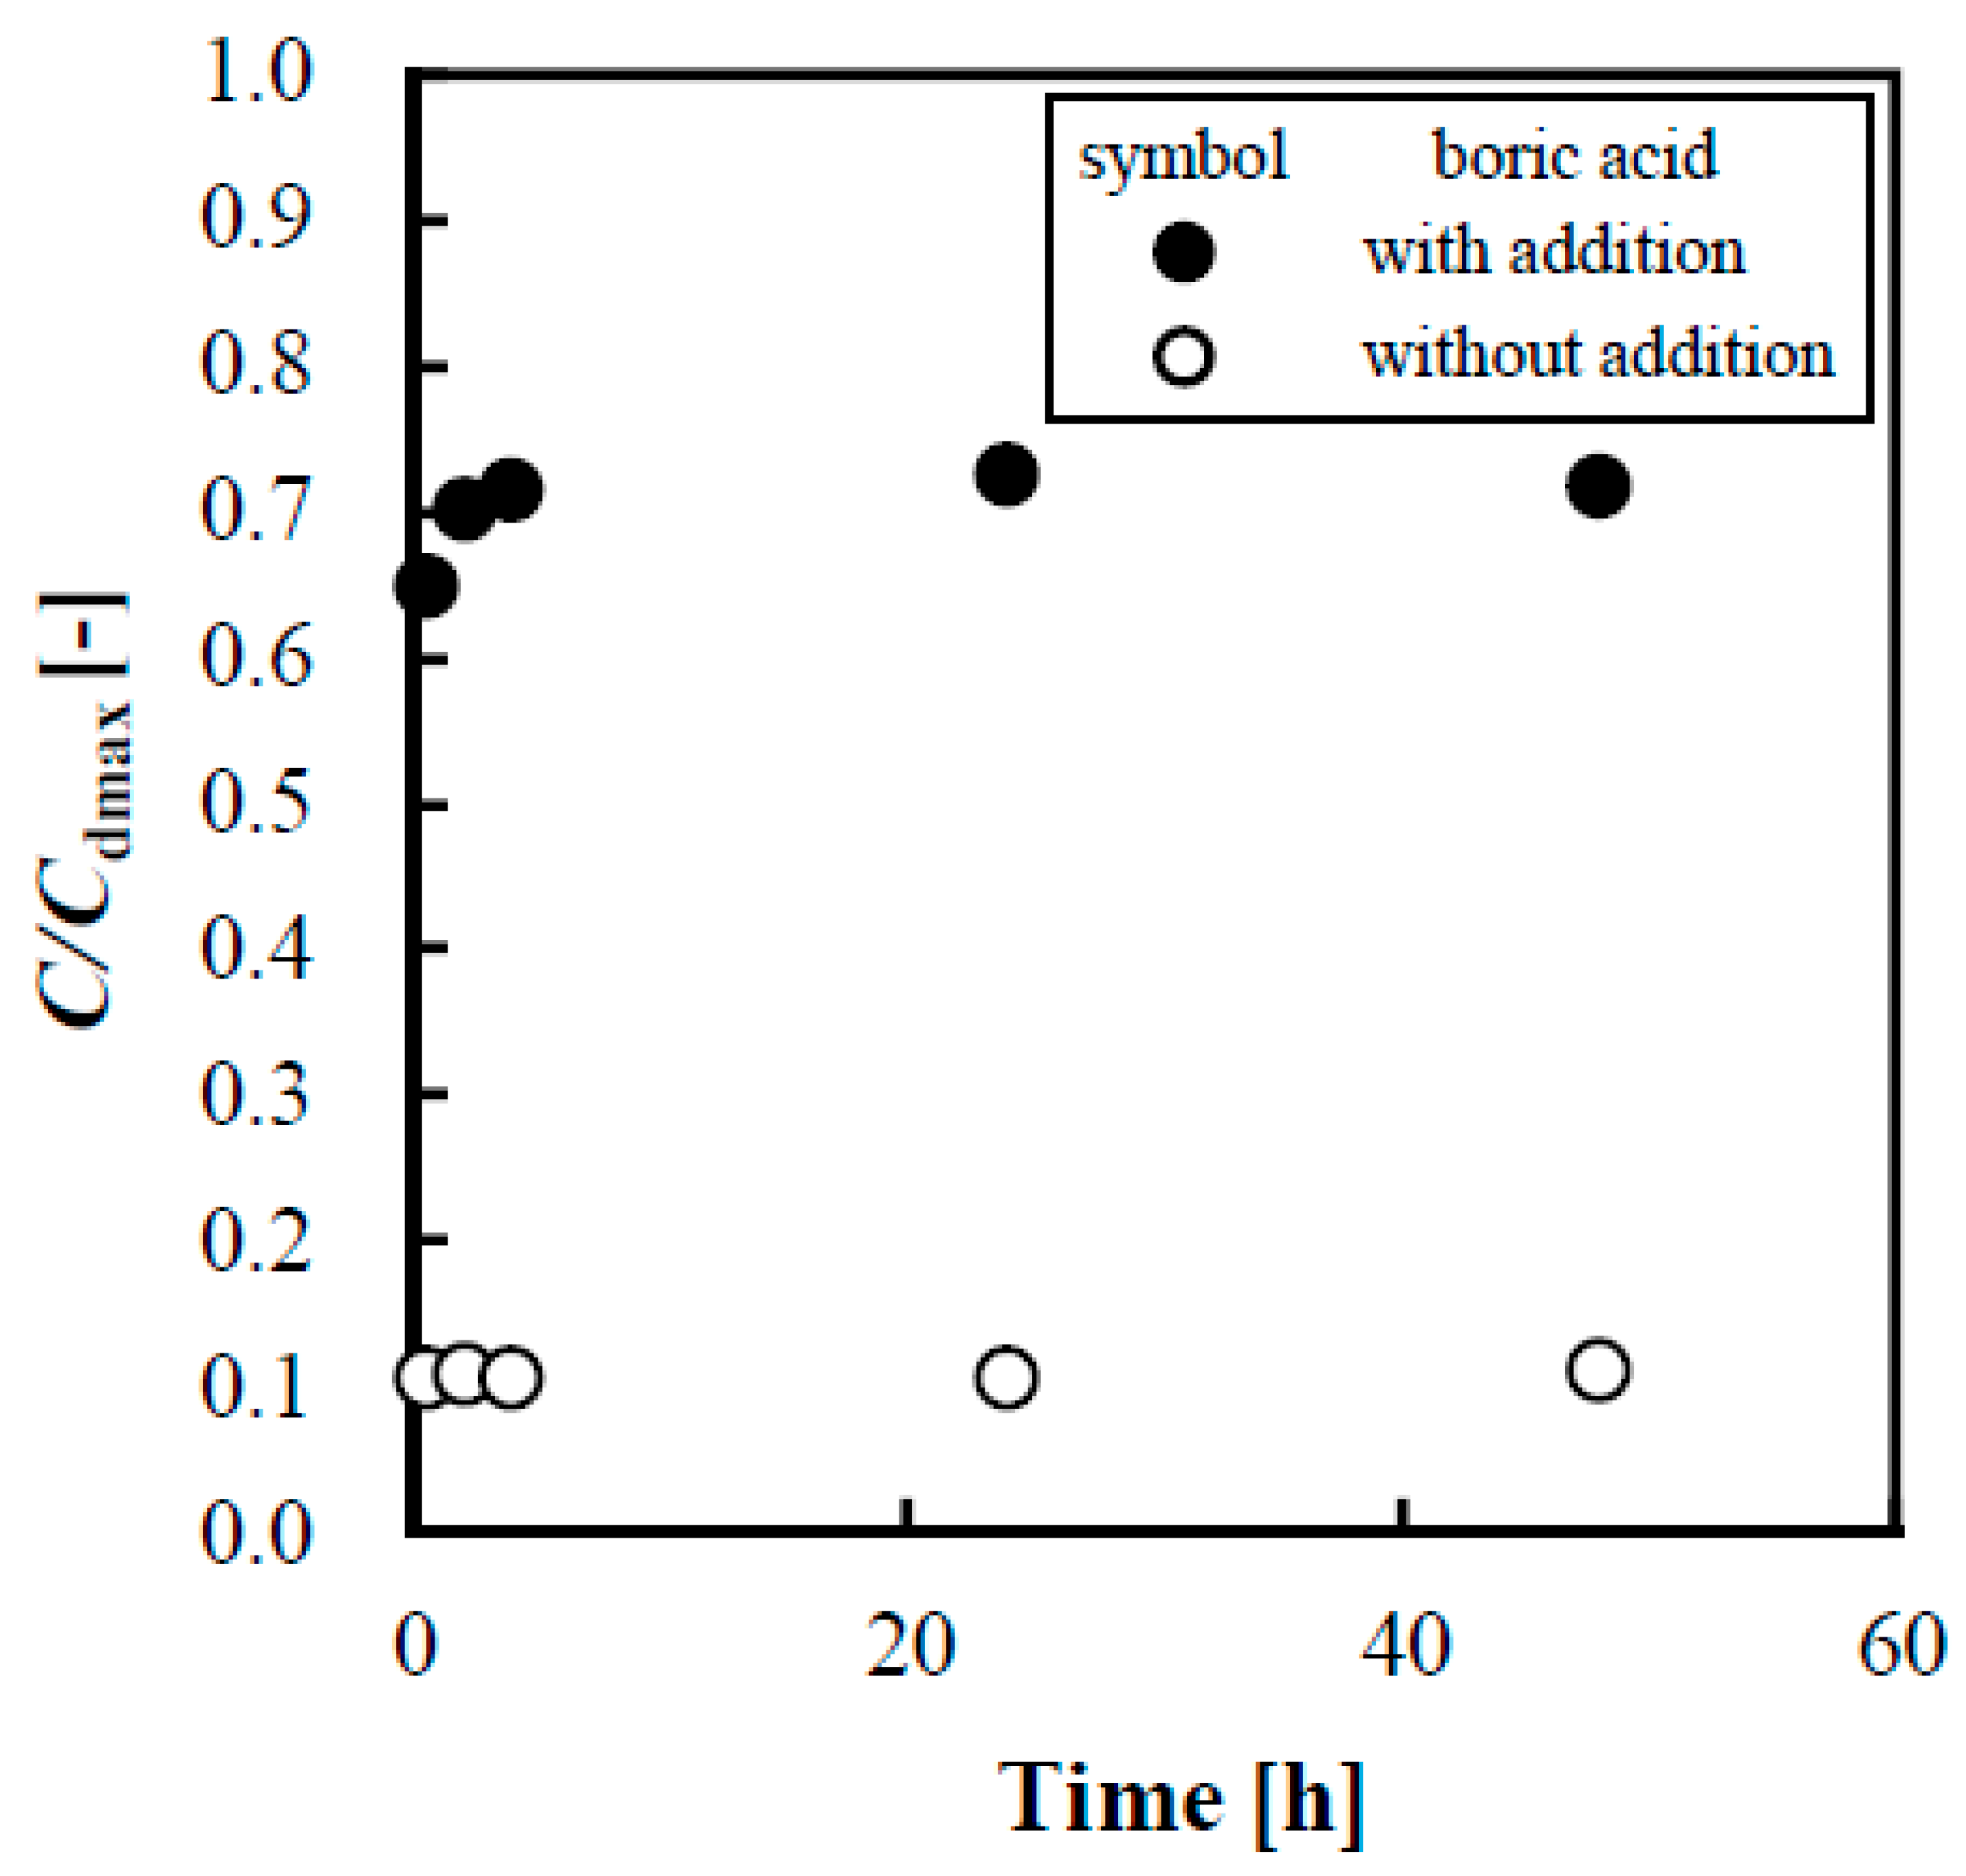
Figure 4.
Influence of the molar ratio of boric acid and lactose on the equilibrium adsorption density, Xe, onto anion exchange resin, IRA402, for initial pH 7 (●) and pH 9 (○), respectively. Experimental conditions: lactose 0.01 M; IRA402 0.5 dry-g; solution volume 40 mL.
Figure 4.
Influence of the molar ratio of boric acid and lactose on the equilibrium adsorption density, Xe, onto anion exchange resin, IRA402, for initial pH 7 (●) and pH 9 (○), respectively. Experimental conditions: lactose 0.01 M; IRA402 0.5 dry-g; solution volume 40 mL.
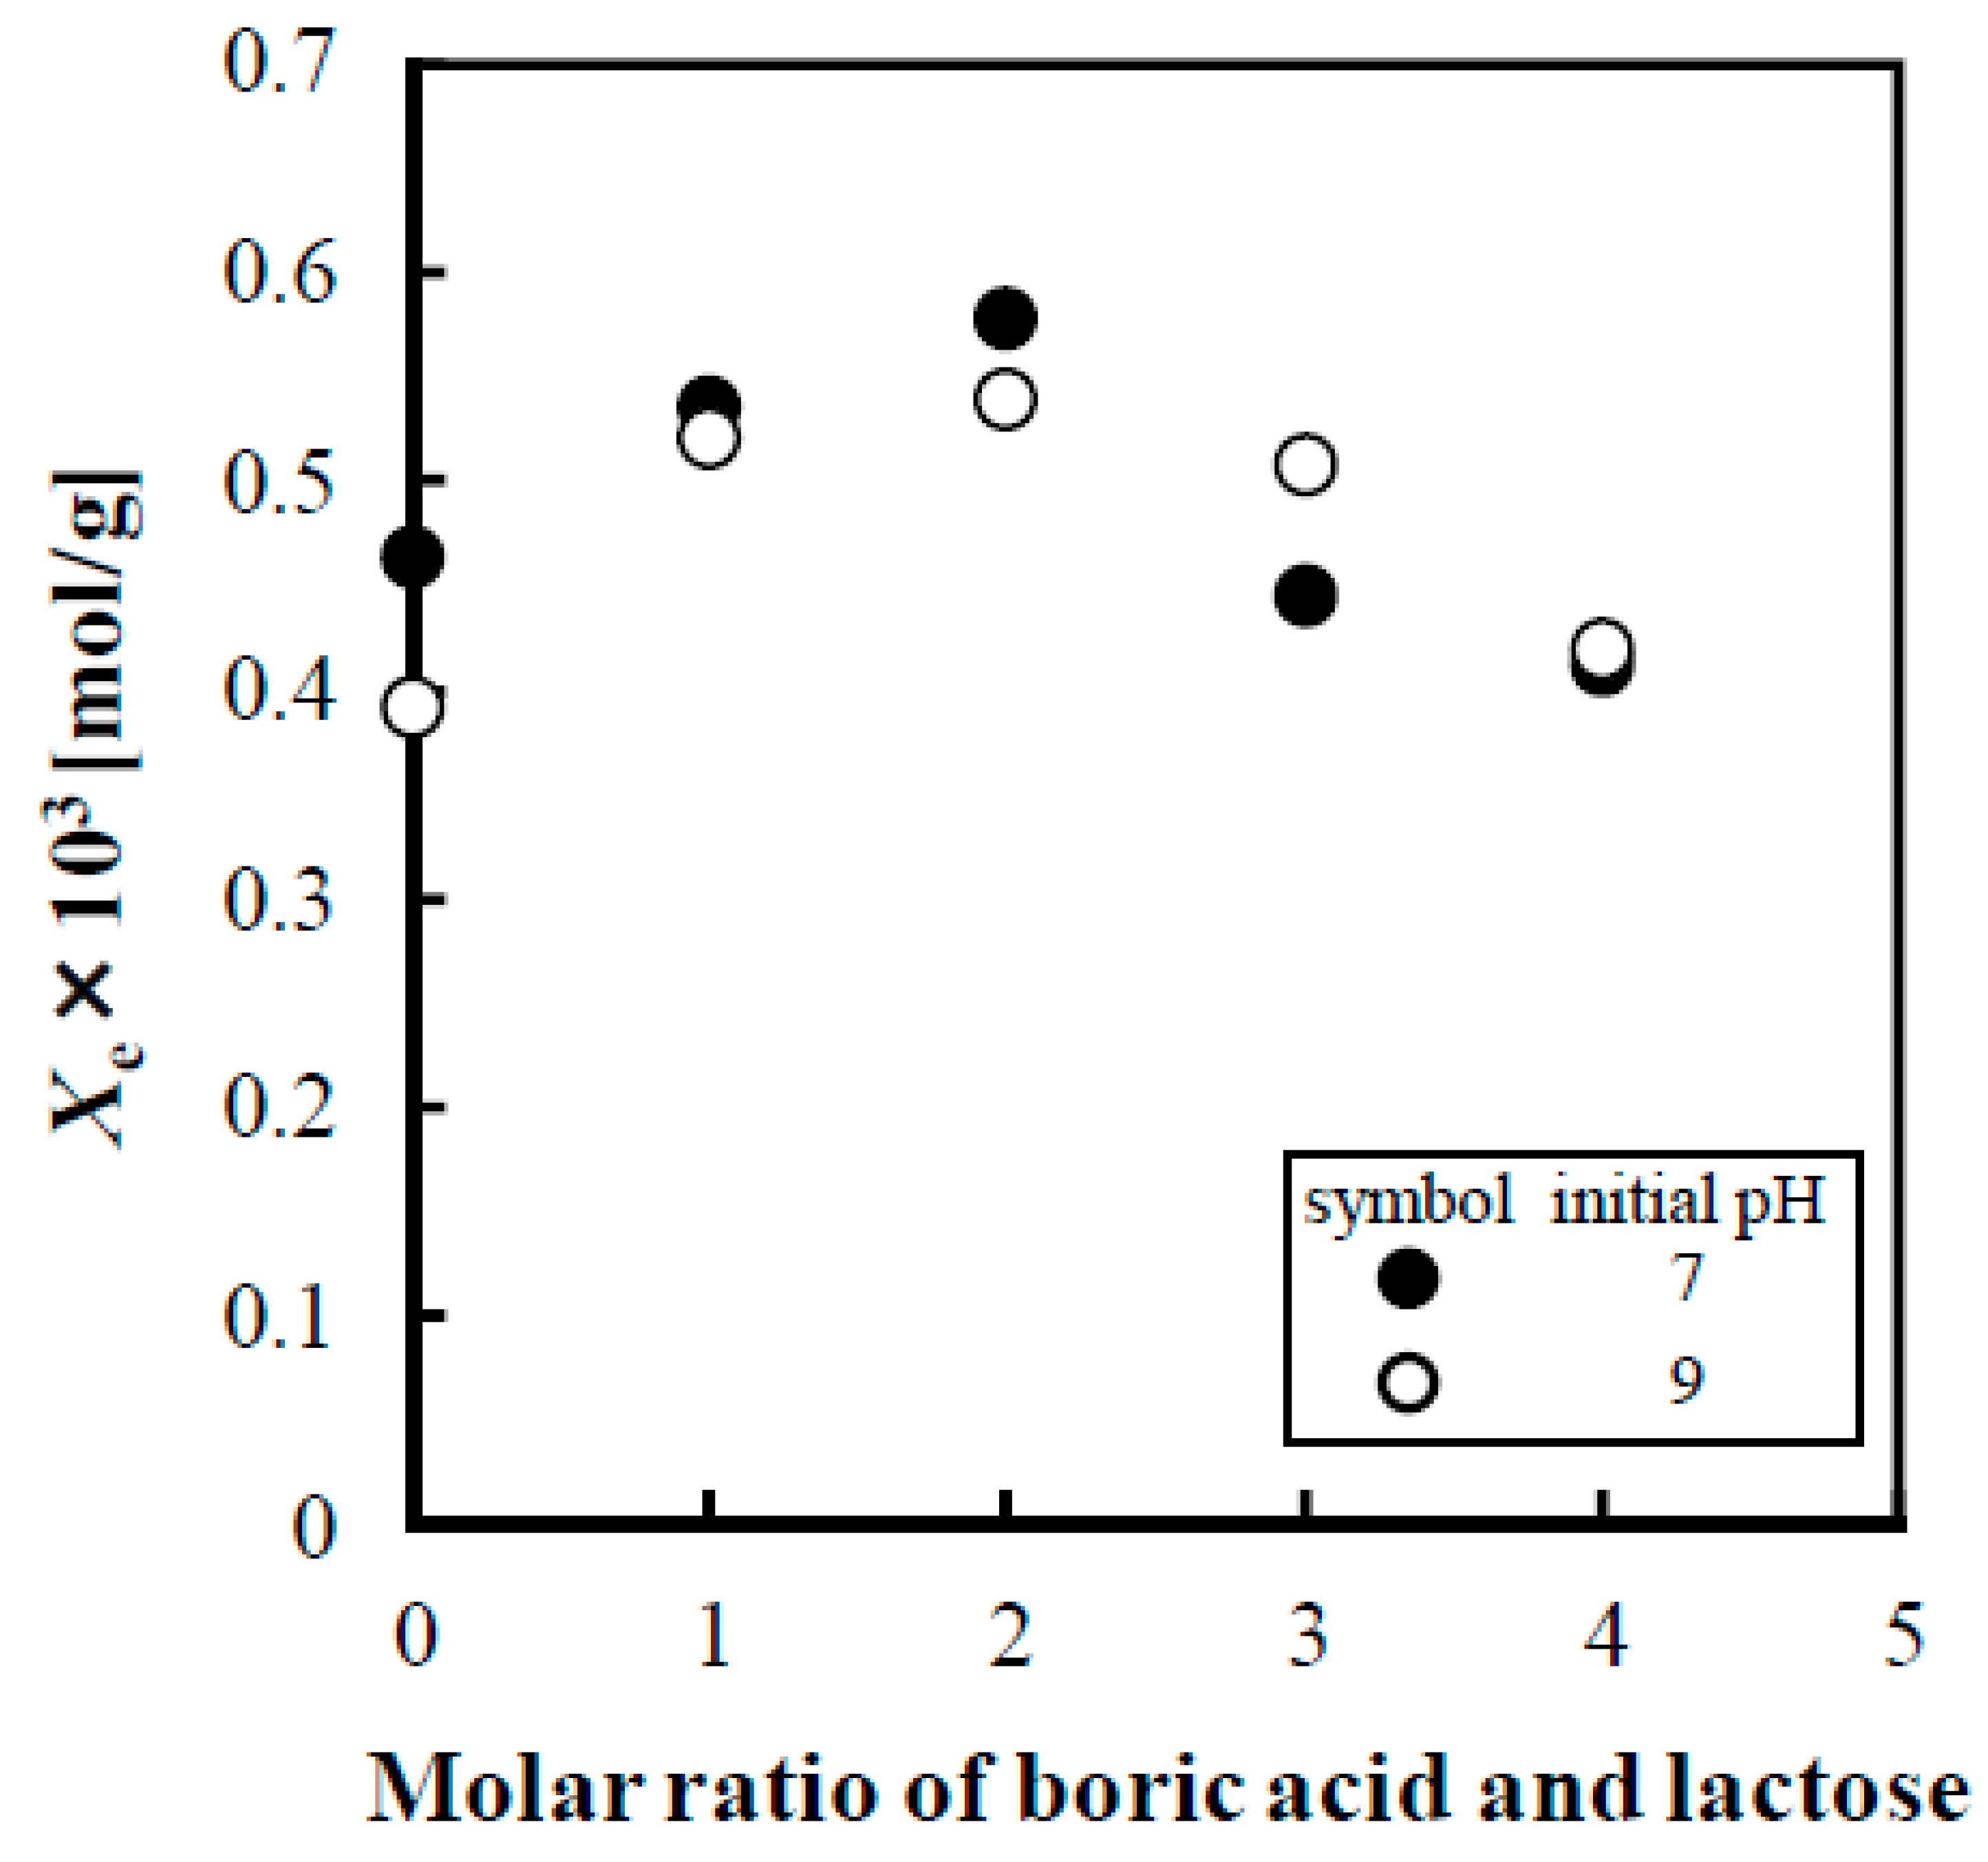
Figure 5.
Change in equilibrium adsorption density, Xe, of lactose onto anion exchange resin, IRA402, for the molar ratio 1 (○) and 2 (●), respectively. The other experimental conditions are same as Figure 4.
Figure 5.
Change in equilibrium adsorption density, Xe, of lactose onto anion exchange resin, IRA402, for the molar ratio 1 (○) and 2 (●), respectively. The other experimental conditions are same as Figure 4.

Figure 6.
Typical time course of the amount of adsorbed lactose onto IRA402. Fitting of the data to Equation (5) for the pseudo-second order adsorption kinetics (a) and Equation (6) for the Langmuir adsorption kinetics (b). The lines represent the calculated values using the estimated adsorption parameters (Table 1 and Table 2).
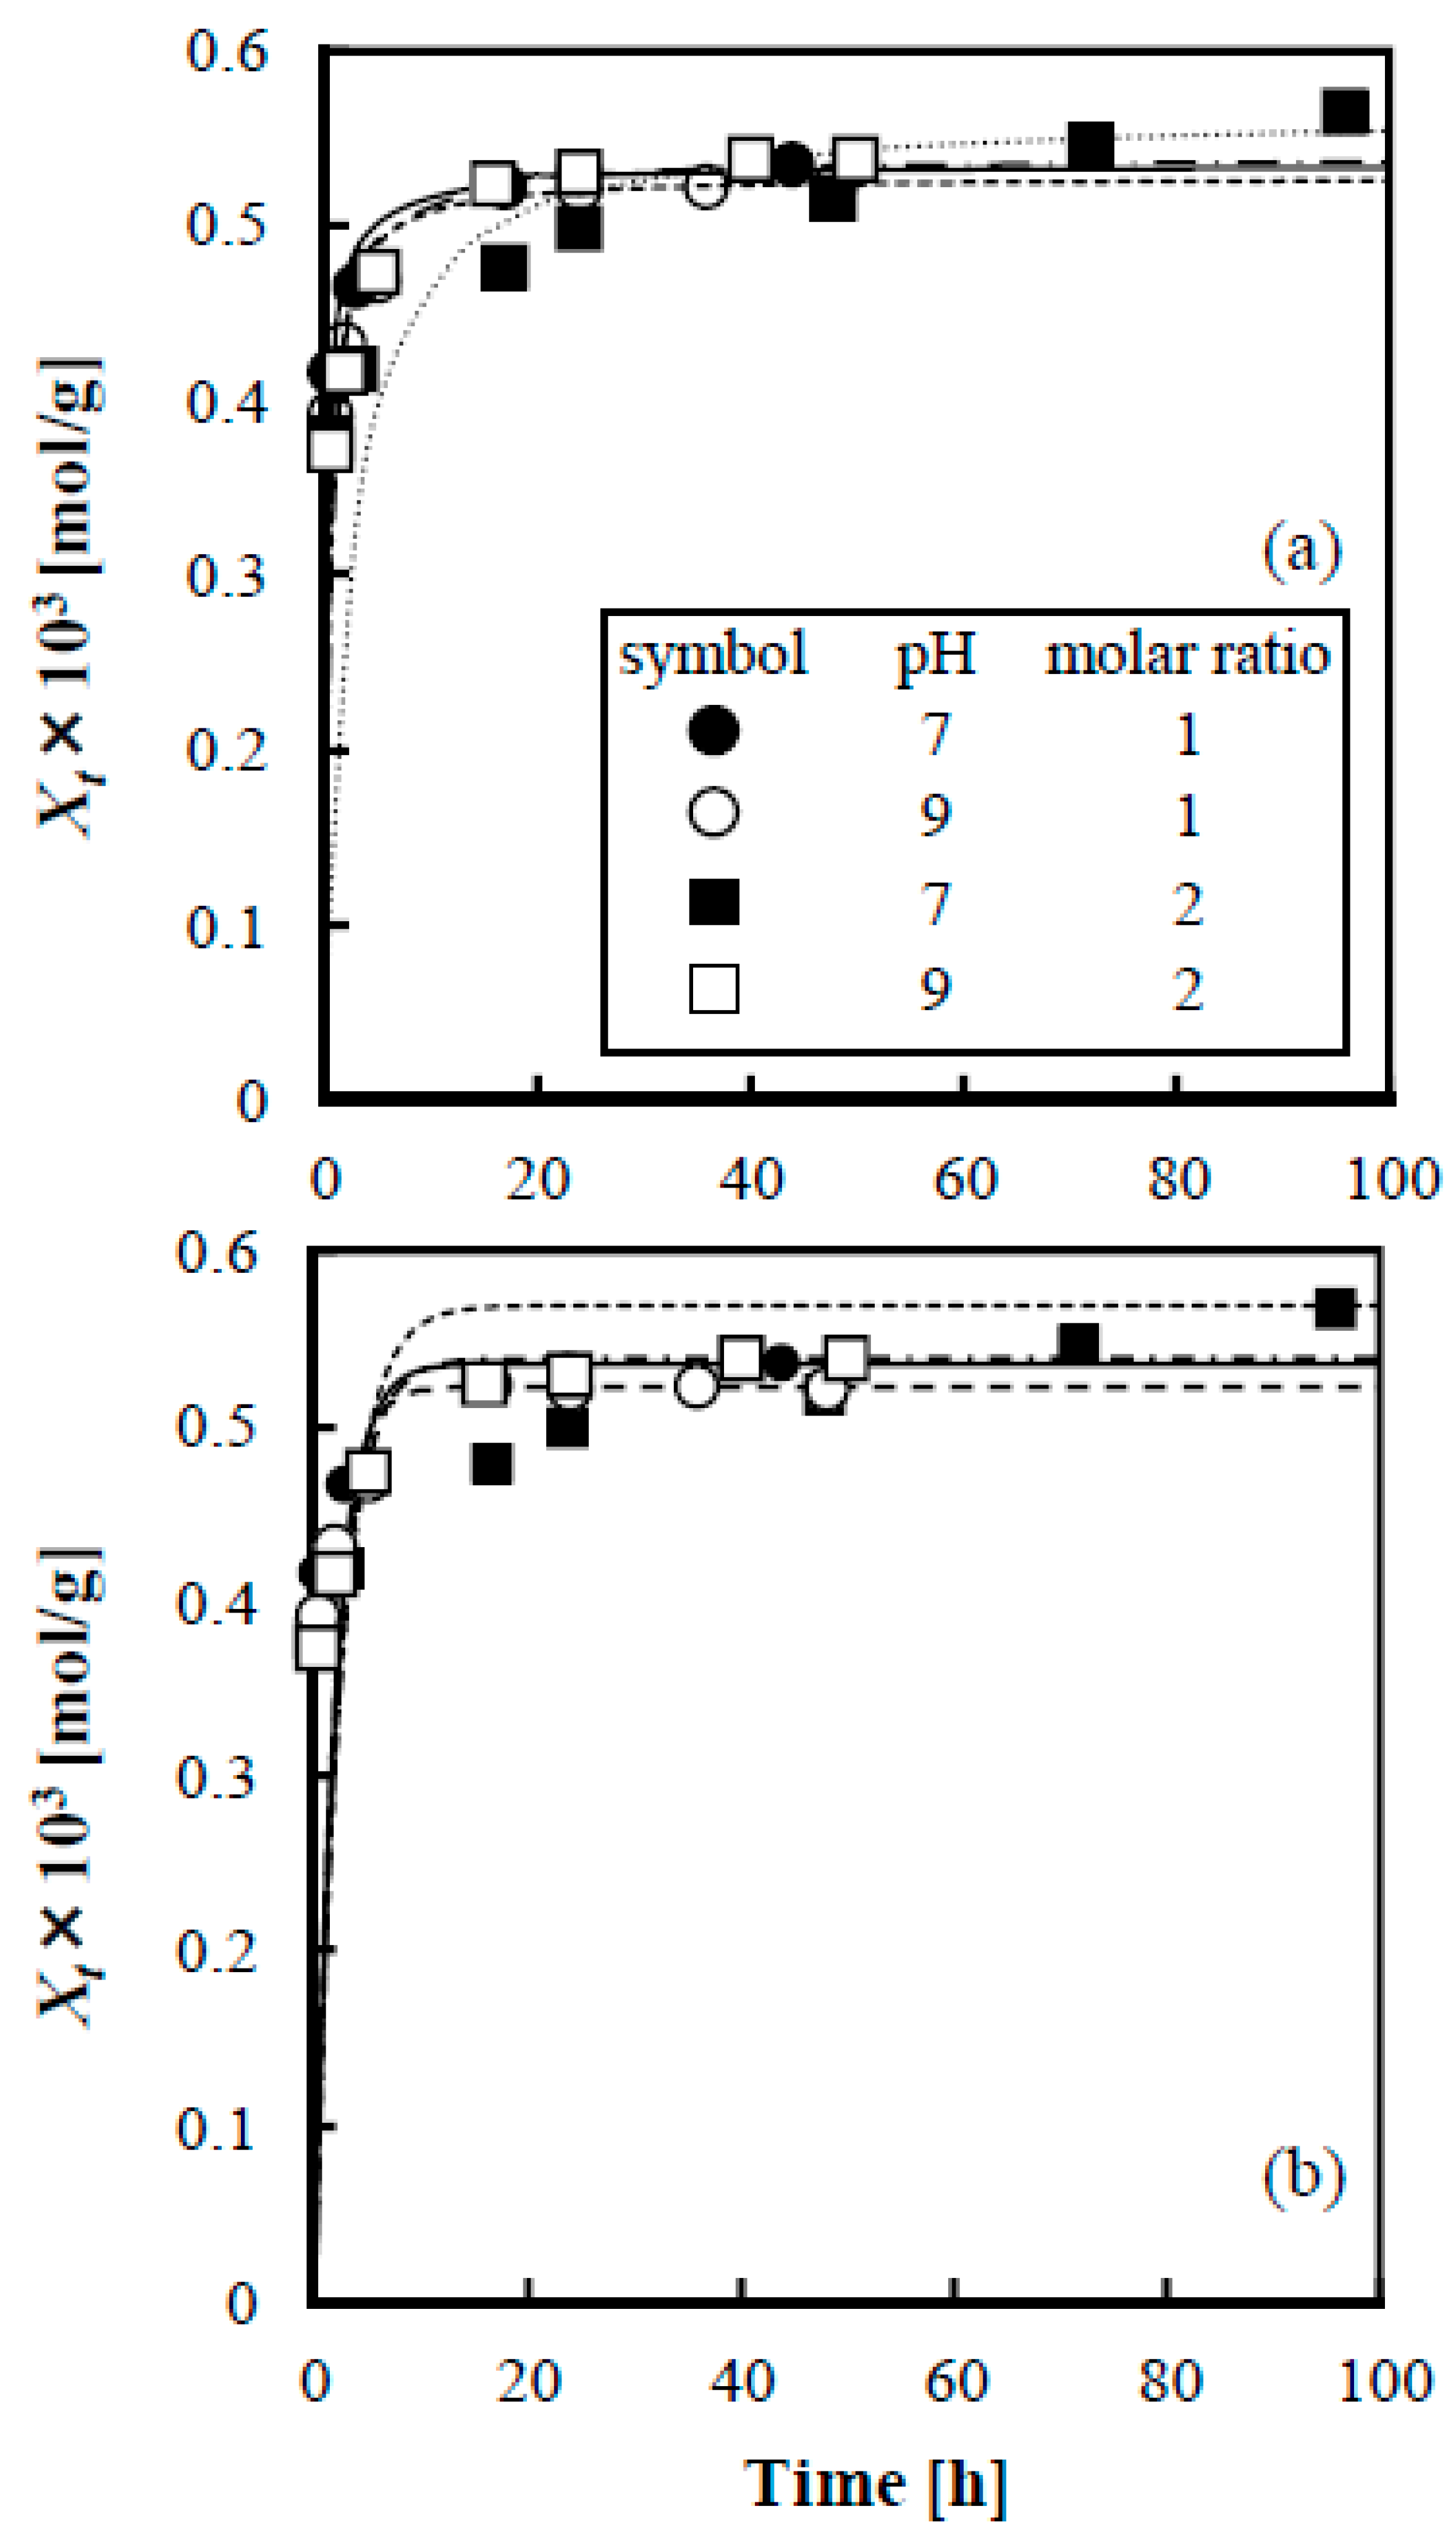
Figure 7.
Adsorption isotherms of lactose onto IRA402. Lines correspond to the calculated values using Equation (7) and the estimated adsorption parameters listed in Table 3. Experimental conditions: lactose 0.01 M; IRA402 0.5 dry-g; solution volume 40 mL.
Figure 7.
Adsorption isotherms of lactose onto IRA402. Lines correspond to the calculated values using Equation (7) and the estimated adsorption parameters listed in Table 3. Experimental conditions: lactose 0.01 M; IRA402 0.5 dry-g; solution volume 40 mL.

Figure 8.
(a) Influence of pH on concentration of phosphate ions in the milk whey solution after centrifugation and filtration. (b) Typical time course of the amount of lactose adsorbed from milk whey solution after reducing phosphate ions. Experimental conditions: lactose 0.015 M; boric acid 0.015 M; IRA402 1.0 dry-g; solution volume 80 mL; the initial pH 7.

Figure 9.
Typical time course of concentrations of milk whey protein and lactose within the foam separation column. The initial lactose and protein concentrations were 0.03 mol/L and 0.35 g/L, respectively.
Figure 9.
Typical time course of concentrations of milk whey protein and lactose within the foam separation column. The initial lactose and protein concentrations were 0.03 mol/L and 0.35 g/L, respectively.
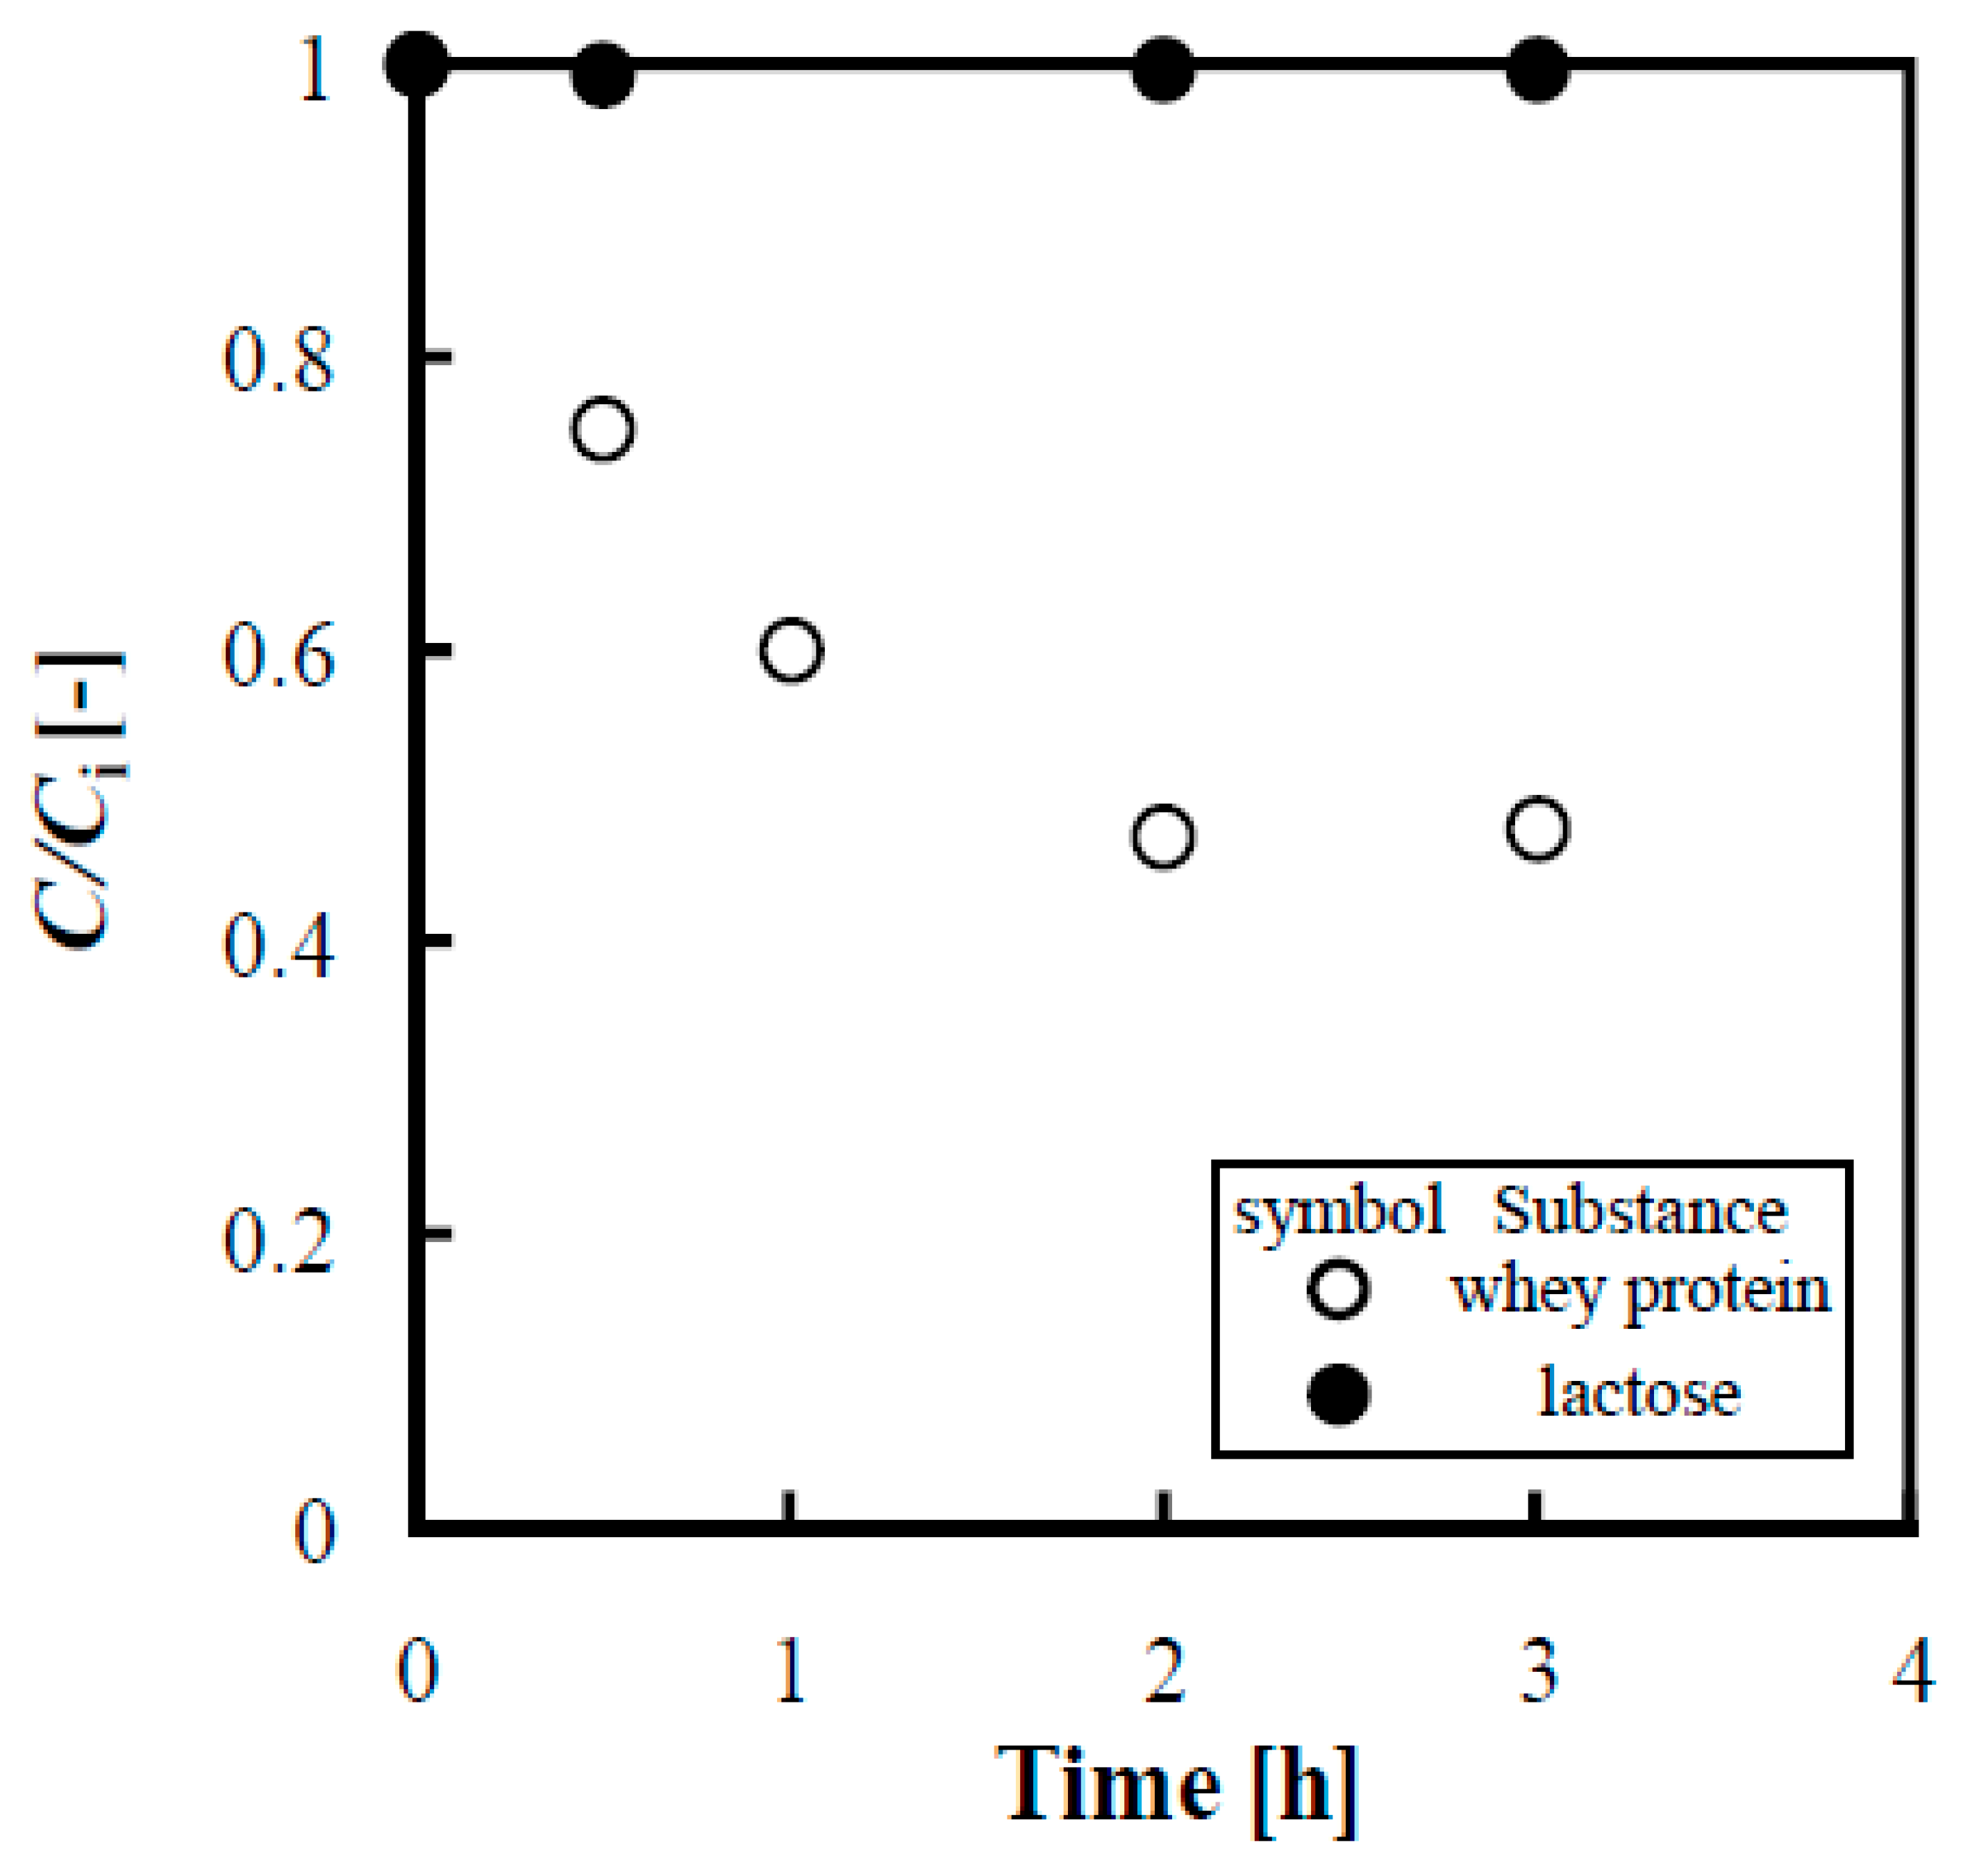
Figure 10.
Typical time course of the amount of lactose adsorbed from milk whey for different protein concentrations. Experimental conditions: lactose 0.015 M; boric acid 0.015 M; IRA402 1.0 dry-g; solution volume 80 mL; initial pH 7.
Figure 10.
Typical time course of the amount of lactose adsorbed from milk whey for different protein concentrations. Experimental conditions: lactose 0.015 M; boric acid 0.015 M; IRA402 1.0 dry-g; solution volume 80 mL; initial pH 7.
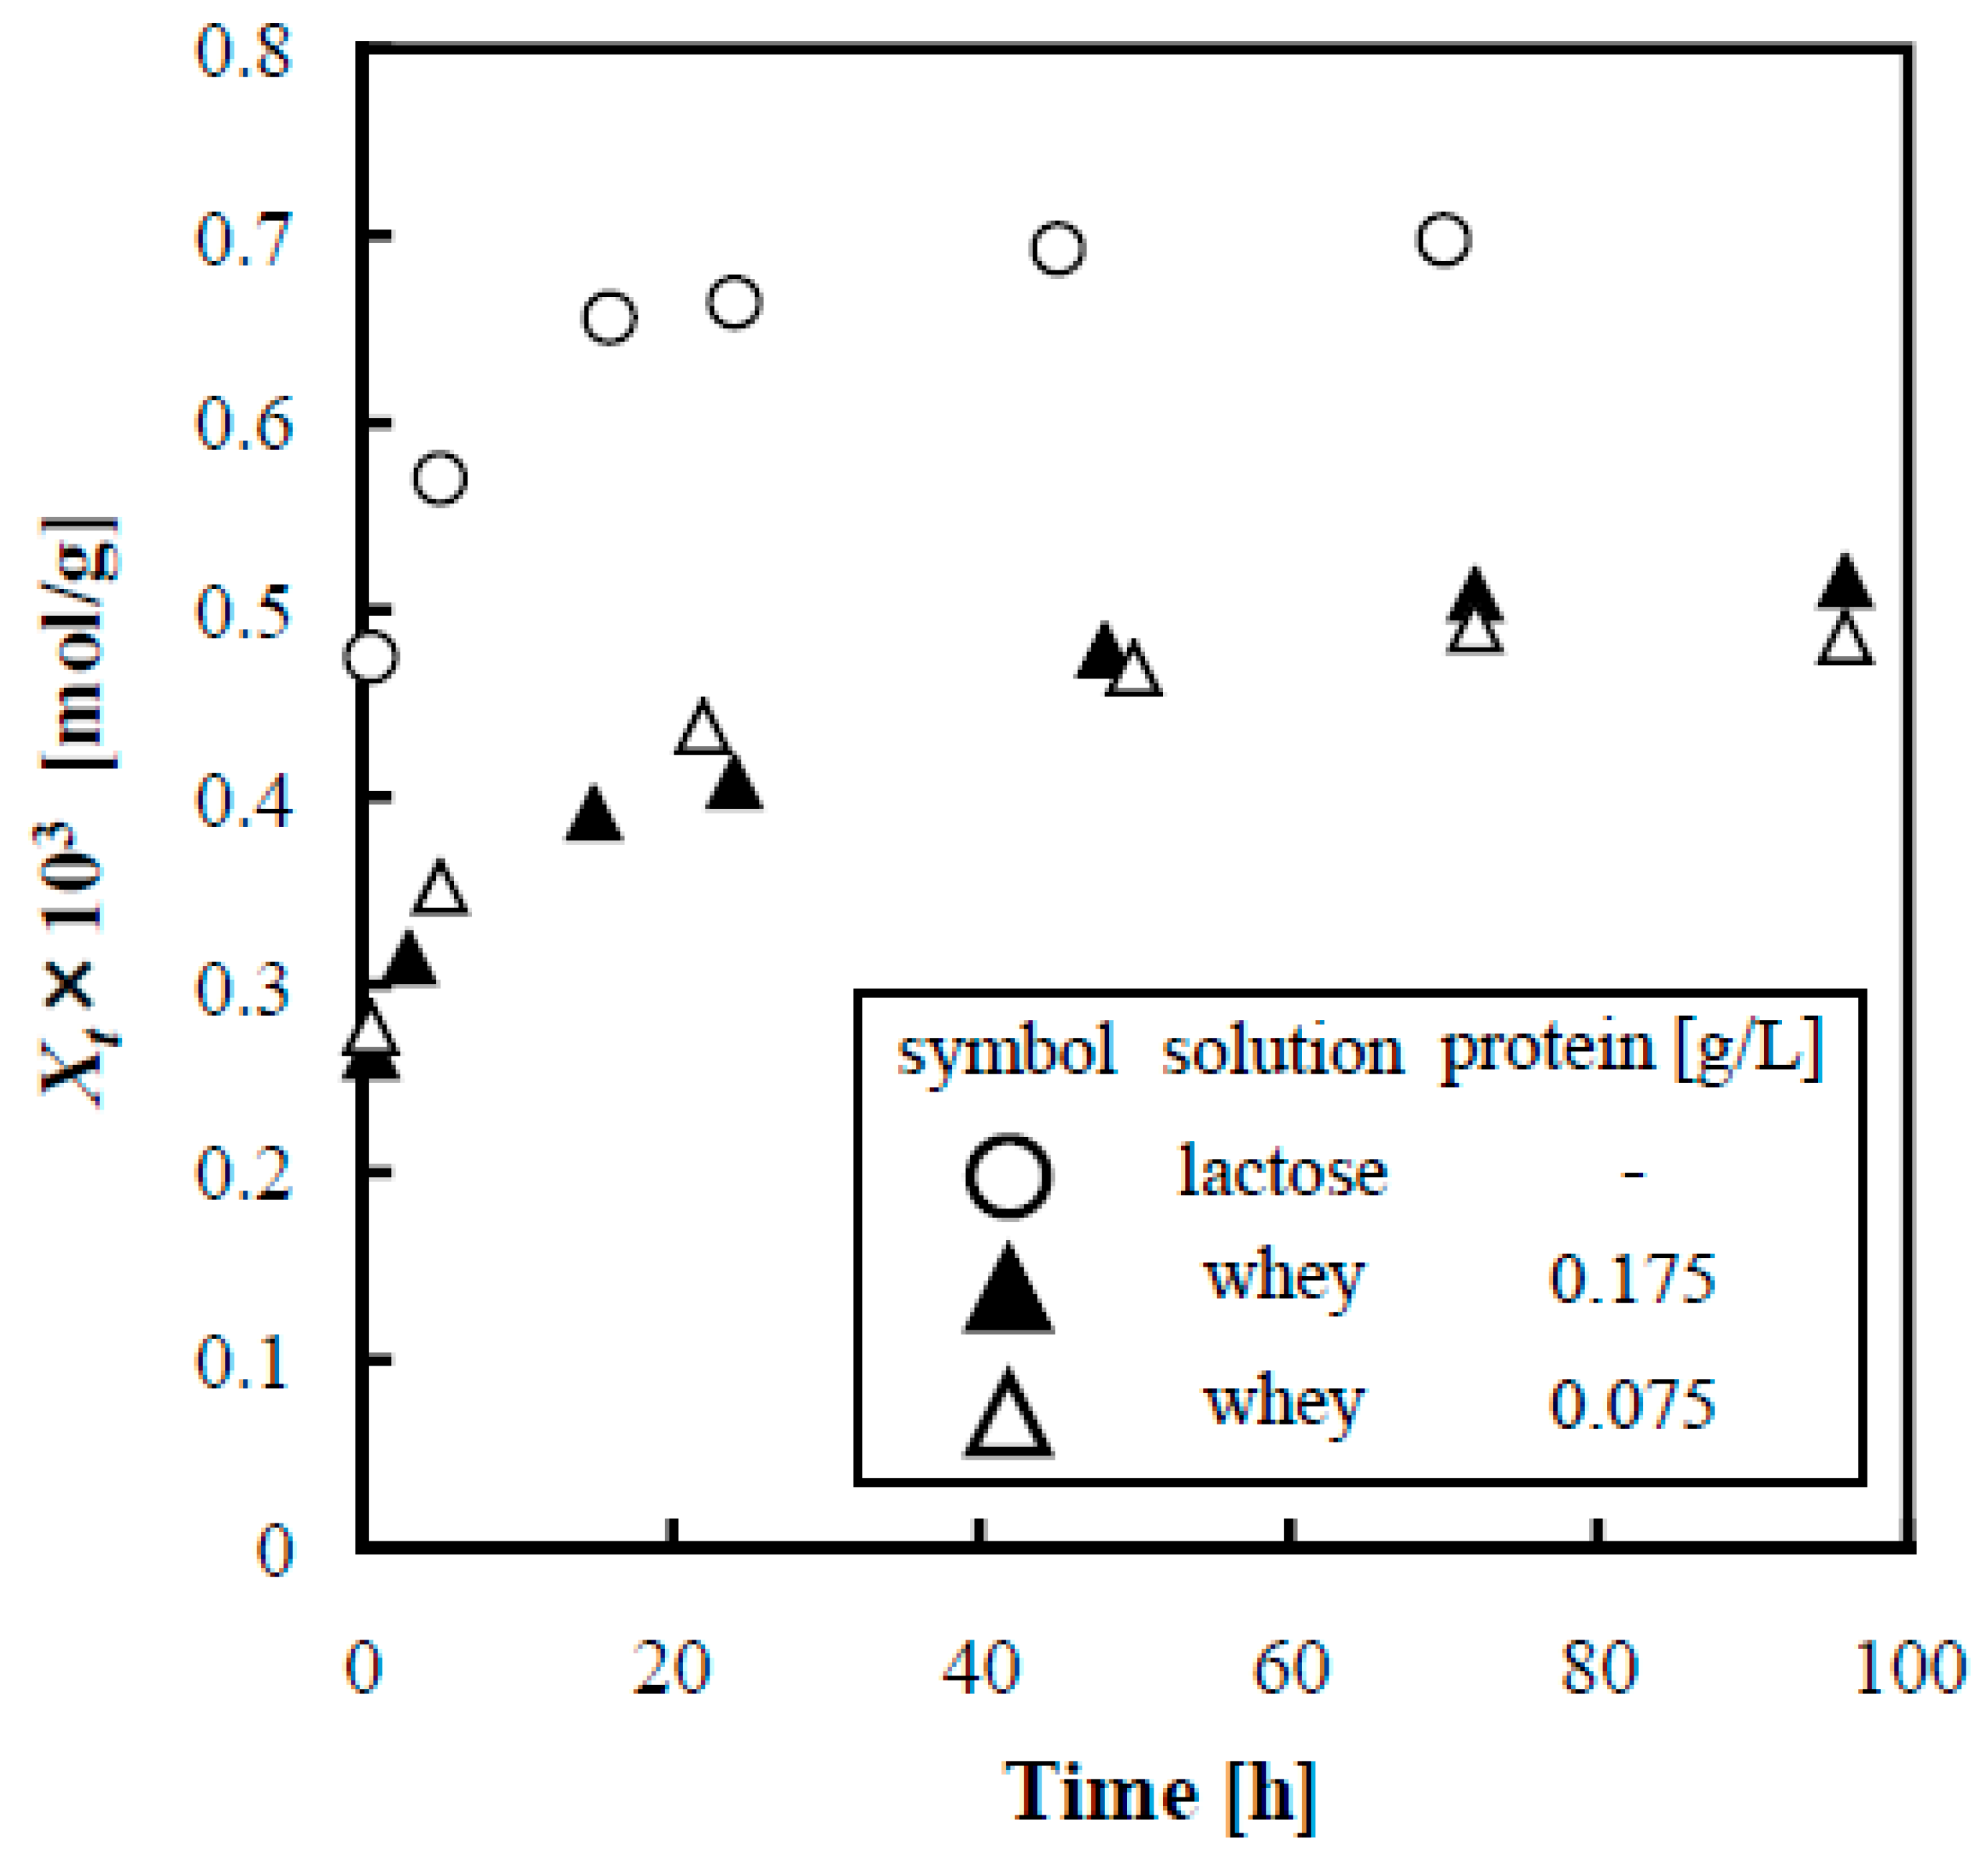
Figure 11.
Typical time course of the amount of lactose adsorbed from milk whey and the model solutions containing protein and amino acid. The experimental conditions: lactose 0.015 M; boric acid 0.015 M; IRA402 1.0 dry-g; solution volume 80 mL; initial pH 7.
Figure 11.
Typical time course of the amount of lactose adsorbed from milk whey and the model solutions containing protein and amino acid. The experimental conditions: lactose 0.015 M; boric acid 0.015 M; IRA402 1.0 dry-g; solution volume 80 mL; initial pH 7.

Table 1.
The adsorption parameters, k and Xe, estimated from fitting the data to Equation (5) for the pseudo–second order adsorption kinetics.
Table 1.
The adsorption parameters, k and Xe, estimated from fitting the data to Equation (5) for the pseudo–second order adsorption kinetics.
| pH | Molar Ratio | Xe × 103 | k × 10−3 | R2 |
|---|---|---|---|---|
| [mol/g] | [g/(mol h)] | |||
| 7 | 1 | 0.535 | 6.17 | 0.99 |
| 7 | 2 | 0.573 | 0.88 | 0.99 |
| 9 | 1 | 0.528 | 4.69 | 0.99 |
| 9 | 2 | 0.54 | 3.79 | 0.99 |
Table 2.
The adsorption parameters, ka, kd and K, estimated from fitting of the data to Equation (6) for Langmuir adsorption kinetics.
Table 2.
The adsorption parameters, ka, kd and K, estimated from fitting of the data to Equation (6) for Langmuir adsorption kinetics.
| pH | Molar Ratio | ka [L/(mol h)] | kd [h−1] | K [L/mol] | R2 |
|---|---|---|---|---|---|
| 7 | 1 | 104.4 | 0.169 | 617 | 0.925 |
| 7 | 2 | 97.6 | 0.103 | 1087 | 0.871 |
| 9 | 1 | 111.0 | 0.238 | 466 | 0.858 |
| 9 | 2 | 115.7 | 0.119 | 973 | 0.925 |
Table 3.
K and Xs estimated from fitting of the data to Equation (7) for the Langmuir isotherm.
| pH | Molar Ratio | K [L/mol] | Xs × 103 [mol/g] | R2 |
|---|---|---|---|---|
| 7 | 1:1 | 593 | 0.791 | 0.911 |
| 7 | 1:2 | 5869 | 0.615 | 0.911 |
| 9 | 1:1 | 547 | 0.846 | 0.924 |
| 9 | 1:2 | 760 | 0.706 | 0.924 |
Disclaimer/Publisher’s Note: The statements, opinions and data contained in all publications are solely those of the individual author(s) and contributor(s) and not of MDPI and/or the editor(s). MDPI and/or the editor(s) disclaim responsibility for any injury to people or property resulting from any ideas, methods, instructions or products referred to in the content. |
© 2023 by the authors. Licensee MDPI, Basel, Switzerland. This article is an open access article distributed under the terms and conditions of the Creative Commons Attribution (CC BY) license (https://creativecommons.org/licenses/by/4.0/).
Share and Cite
MDPI and ACS Style
Maruyama, H.; Seki, H. Adsorption of Lactose Using Anion Exchange Resin by Adding Boric Acid from Milk Whey. Separations 2023, 10, 530. https://doi.org/10.3390/separations10100530
AMA Style
Maruyama H, Seki H. Adsorption of Lactose Using Anion Exchange Resin by Adding Boric Acid from Milk Whey. Separations. 2023; 10(10):530. https://doi.org/10.3390/separations10100530
Chicago/Turabian StyleMaruyama, Hideo, and Hideshi Seki. 2023. "Adsorption of Lactose Using Anion Exchange Resin by Adding Boric Acid from Milk Whey" Separations 10, no. 10: 530. https://doi.org/10.3390/separations10100530
Note that from the first issue of 2016, this journal uses article numbers instead of page numbers. See further details here.