Article

Adsorption Performance of Zeolite for the Removal of Congo Red Dye: Factorial Design Experiments, Kinetic, and Equilibrium Studies

1
Département de Génie des Procédés, Faculté de Technologie, Université de Bejaia, Bejaia 06000, Algeria
2
Laboratoire de Gestion et Valorisation des Ressources Naturelles et Assurance Qualité, Faculté SNVST, Université de Bouira, Bouira 10000, Algeria
3
Laboratoire E2Lim (Eau Environnement Limoges), Université de Limoges, 123 Avenue Albert Thomas, 87060 Limoges, France
4
Univ Rennes, Ecole Nationale Supérieure de Chimie de Rennes, CNRS, ISCR—UMR 6226, 35000 Rennes, France
5
Laboratory of Biomaterials and Transport Phenomena (LBMPT), University of Médéa, Algeria, Nouveau Pôle Urbain, Médéa University, Médéa 26000, Algeria
6
Research Center of Semi-Conductor Technology for Energy, CRTSE-02, Bd. Dr. Frantz Fanon, B.P. 140 Algiers, 7 Merveilles 16038, Algeria
*
Authors to whom correspondence should be addressed.
Separations 2023, 10(1), 57; https://doi.org/10.3390/separations10010057
Submission received: 28 December 2022 / Revised: 13 January 2023 / Accepted: 14 January 2023 / Published: 15 January 2023

Abstract

:
In the present research, zeolite is used for the removal of toxic Congo red dye from water solution. The effects of different operating conditions such as hydrogen potential (pH), contact time (time), zeolite dose (D), initial dye concentration (C0), and ionic strength (I) are investigated for Congo red adsorption under batch mode. It was found that the adsorption process was greatly affected by the initial pH of the dye solution. The removal efficiency decreased from 97.68 to 5.22% when the pH varied from 3 to 5; thus, acidic conditions clearly improve Congo red adsorption on zeolite. At pH 3, an increase in C0 and I and decrease in D resulted in an increase in the adsorption capacity qe. The effects of these three parameters and their interactions were also investigated using the 23 full factorial design experiments approach where qe was chosen as the response. The results obtained from this method followed by the analysis of variance and the Student’s t-test show that, the influence of these parameters on dye adsorption process are in the order I < C0 < D. The kinetic studies revealed that adsorption follows a pseudo-second-order kinetic model. The adsorption isotherms experimental data were analyzed using the Langmuir, Freundlich, and Temkin isotherms models. The Freundlich isotherm was the best-fit model to the experimental data. The fitting of kinetics and isotherm models was evaluated by using non-linear modeling, R2, MSE, and RMSE.

1. Introduction

Considerable volumes of waste effluents containing synthetic dyes are generated by several industries such as textiles, paper, printing, cosmetics, plastics, leather, etc. [1]. Their release into the hydrosphere poses significant environmental risks, giving undesirable color to the receiving water media and inhibiting sunlight penetration, thus limiting photosynthetic activity and increasing the organic matter charge in water, thereby creating a severe imbalance in aquatic ecosystems [2]. In addition, synthetic dyes also have adverse effects on human health due to their mutagenic and carcinogenic nature [3]. Therefore, it is essential to treat these effluents at their point of origin prior to release them into the mainstream.
Currently, several conventional and advanced treatment processes have been proposed in the literature and some of them have been industrially implemented for the treatment of this type of effluent, such as biodegradation [4,5], coagulation-flocculation [6,7,8,9], electro-coagulation [10], membrane filtration [11,12], ion-exchange resin [13,14], Fenton oxidation [15], ozonation [16], photocatalysis [17], and adsorption [18]. Nonetheless, certain approaches have limitations in terms of bacterial growth inhibition, sludge production, not being appropriate for all dyes, short life of the applied technique, high operating cost, slow kinetics, and byproduct formation [19]. Over the past decade or so, research efforts have focused on dye removal adsorption technology [20]. This technique has several benefits owing to its simplicity, low cost, great efficacy, and ability to manage relatively large flow rates while generating high-quality effluent [2].
Activated carbon is the favored adsorbent in air [21,22,23] and wastewater treatment because of its large specific surface area and adsorption capacity; however, its poor selectivity, regeneration difficulties with a loss of adsorption capacity and high cost have prompted many researchers to test and develop new adsorbents with an improved cost ratio and for specific effluents [24]. In this regard, Crini in 2006 [25] identified in a seminal review a broad range of conventional and non-conventional adsorbents evaluated on some dyestuffs and their adsorption capacities. This effort has been extended by other authors to make this list more exhaustive [26]. Among low-cost adsorbent materials, zeolites are superior to activated carbon owing to their microporous solid state, well-defined crystalline structure, ion-exchange capacity, high specific surface area, selectivity, and, most importantly, their availability in large mineable deposits at relatively low costs [27,28,29].
In this study, the removal of Congo red (CR) from aqueous solution by zeolite was investigated. Initially, experimental and modeling methods were used to assess the adsorption behavior of CR on zeolites. To study the adsorption of CR, both kinetic and isotherm adsorption models were examined, and nonlinear fitting was employed. Furthermore, it was demonstrated in this study how adsorbent dosage (D), initial dye concentration C0, and ionic strength (I) interacted and ultimately influenced CR adsorption capacity. A 23 full factorial design experiments approach was used to study the removal of CR. Finally, within the parameters’ range of variation, a linear model yielding q = f (D, C0, I) was established.

2. Materials and Methods

2.1. Materials

Zeolite material was purchased from sigma Aldrich with commercial code 96096 and was utilized just as supplied. Congo red, an anionic diazo direct dye (C.I. 22120, MW = 696.68 g/mol) was of analytical grade and purchased from Merck Company (Darmstadt, Germany). The chemical structure of this dye is shown in Figure 1. The CR dye stock solution (1 g/l) was prepared in deionized water and the required pH value of the aqueous dye solutions was adjusted by using either 0.1 M HCl or NaOH solutions. These chemicals were purchased from sigma Aldrich Chemical Company, Burlington, MA, USA.

2.2. Analytical Measurements

CR concentrations in aqueous solution were measured using a UV–visible spectrophotometer (BECKMAN DU® 520), due to the color change of CR as a function of solution pH (Figure 2 and Figure 3), three calibration curves at pH = 2, pH = 3, and pH = 5 with respect to their λmax were constructed. After the solid–liquid separation and prior to the dye analysis, the samples are scanned in the visible spectrum region to determine which of the calibration curves to employ. In contrast, it is relevant to note that the pH of fresh solutions of the dye with initial concentrations such as those used in this work, is naturally around 8. A pH meter (hanna instruments, Portugal) supplied with a combined glass electrode was used for pH measurements. Separation of phases (solid/liquid) before dye analysis in aqueous solution was performed by centrifugation (EBA-20 Model, Andreas Hettich GmbH& Co, KG, Tuttlingen, Germany).

2.3. Adsorption Experiments

The aqueous CR solutions for adsorption tests were prepared by diluting the stock solution in deionized water to the required concentrations. Batch adsorption experiments were carried out in 100 mL conical flasks with glass stoppers placed in a C76 shaking water bath (New Brunswick Scientific, Edison, NJ, USA) operating at 200 rpm. A volume of 50 mL of dye solution with different initial concentrations were placed in the conical flasks and combined with a known amount of adsorbent at a constant temperature of 25 °C and a required pH value. The effect of initial pH on the removal of CR was investigated over the range of 2 to 11. The pH at equilibrium (pHeq or the final pH) was also measured in this stage, and for the experiments conducted at an initial pH of 3 and with the initial dye concentrations and zeolite dosages used, the final pH values are close to 5. The effect of the adsorbent dose (D) was studied throughout a 0.04 to 0.18 g/L range. To study the effect of the ionic strength on CR adsorption, experiments were performed by using varied concentrations (0 to 9.1 mg/L) of sodium sulfate salt (Na2SO4). Adsorption kinetics were investigated by measuring dye adsorption at various time intervals using CR solutions at initial concentrations of 25 and 30 mg/L. Based on the kinetic experiments, a time contact of 100 min was set for all subsequent isotherm tests to achieve a steady-state or pseudo-equilibrium, and dye solutions with initial concentrations ranging from 8 to 40 mg/L were used for this purpose at 25 °C. All assays were carried out in triplicate and the average values were presented. The maximum difference between the three values was less than 3% of the mean. The dye removal efficiency E (%), and the adsorption capacity qt (mg/g) at the time t (min), were calculated using the following equations
E   % = C 0 C t · 100 C 0
q t = C 0 C t · V m
where C0, Ct, m, and V are the initial and the actual CR concentration (mg/L), the used adsorbent dried amount (g), and the dye solution volume (L), respectively. At equilibrium (t = teq), Ct and qt are named Ceq and qeq, respectively.

2.4. The Factorial Design

Adsorbent dose (D), initial dye concentration (C0), and the ionic strength (I) were taken as independent variables (factors) and adsorption capacity qe as a response. A full 23 factorial design of experiments [30] was considered to evaluate the main effects and interactions in CR adsorption process. Three factors to be investigated at two levels of 23 factorial design having 8 experiments with all possible combinations of variables were conducted in duplicate which gives a total of 16 trials. Low (−1) and high (+1) levels of the factors are given in Table 1. The factorial design matrix and qe obtained are shown in Table 2. To avoid systematic errors, the order in which the experiments were conducted was randomized and the results were analyzed with Minitab17® software. In the range of parameter variation, it is useful to develop the response-factors relationship in terms of a mathematical model such as the response function. The use of variance analysis and factorial design of experiments allowed to express the adsorption capacity as a polynomial regression model. The codified model employed for full 23 factorial designs was as follows:
  Y ^ = a 0 + a 1 D + a 2 C 0 + a 3 I + a 12 D   C 0 + a 13 D   I + a 23 C 0   I + a 123 D   C 0   I + ε  
where     Y ^ , a0, and ai represent the model predicted response, the global mean, and the regression coefficient corresponding to the main factor effects and interactions, respectively. The term ε is the random error component. In this model, the factors are in codes terms and can take values from −1 or +1. To convert the real values of the parameter Xi to the coded values (or vice versa), the following equations can be used [31]:
x = X X m Δ X
where
X m = X + 1 + X 1 2
Δ X = X + 1 X 1 2  
x is the dimensionless coded value, X is the real value of the factor, and X+1 and X−1 are the maximum and minimum values of the factor Xi, in the range of variation studied. The effects, regression coefficients, and the associated standard errors for CR adsorption are shown in Table 3.

2.5. Kinetics and Isotherm Studies

Adsorption behavior of CR was also investigated by the isotherm and kinetic studies at a constant temperature of 25 °C. The fitting of the considered models was evaluated by using nonlinear modeling performed by OriginPro8® software, and same error functions were defined to establish the fit of the model to the experimental data. These error functions are calculated on the basis of three following functions: the sum of squared difference between the experimentally obtained adsorption capacities (Yi) to their mean (   Y ¯ ); the sum of squared deviation between the model-predicted capacities (   Y ¯ i ) to (   Y ¯ ); and finally, from the sum of the squared residual between experimental (Yi) and predicted (   Y ^ i ) capacities. The total sum of squares (TSS) calculates the variation between data points and the mean. In least-squares fitting, the TSS can be divided into two parts: the variation explained by regression (RSS) and that not explained by regression (SSE). From (n) number of the adsorption experiments, TSS, RSS, and SSE were computed as follows [32]:
T SS = i = 1 n Y i   Y ¯ 2
RSS = i = 1 n   Y ¯ i   Y ¯ 2
SSE = i = 1 n Y i   Y ^ i 2
The ratio of RSS to TSS can be used as one measure of the quality of the regression model. This quantity termed the coefficient of determination is computed as:
R 2 = RSS TSS = 1 SSE TSS
From the above equation, we can see that when using a good fitting model, R2 value should be close to 1.
The value of SSE averaged with the degree of freedom (DF) can measure the mean square error (MSE) which gives the variance of the random errors between the fitted model and the observed data according to the following equation [33,34]:
MSE = SSE DF
and
DF = n p
where n is the number of observed data Yi (i = 1 to n), and p is the number of parameters of the model. It should be noted that the models being compared in this part of the study have the same number of parameters. The last goodness of fit criteria is the root-MSE (root mean sum of square error) which can be calculated as:
RMSE = MSE = SSE DF
Small MSE and RMSE values, close to zero, and large R2 value, close to 1, indicate better agreement of experimental data with the model.

2.5.1. Adsorption Kinetics

During adsorption, investigations of the kinetics of the adsorption process give insight into the reaction rate and the sorption mechanism including mass transfer, diffusion, and reaction on the adsorbent surface [35]. They are also essential for determining the adsorbent–adsorbate minimum contact time required to reach the steady-state or pseudo-equilibrium for the system, which is of tremendous practical value to ultimately save time and energy. The most popular kinetic models applied in aqueous-phase adsorption are the pseudo-first order (PFO), pseudo-second-order (PSO), and the intraparticle diffusion (IPD) [36,37].
The pseudo-first-order kinetic rate equation (PFO) is expressed as follows:
q t = q e 1 e k 1 t
where qt and qe (mg/g) are the adsorption capacities at any contact time t (min) and at equilibrium, respectively; and k1 (min−1) is the rate constant of the PFO model.
The pseudo-second kinetic model (PSO) is:
q t = k 2 q e 2 t 1 + k 2 q e t
where k2 (g/mg min) is the pseudo-second order rate constant.
The intra-particle diffusion model (IPD) is presented as follows:
q t = k id   t 0.5 + C i
where kid (mg/g min) is the rate constant of the intra-particle diffusion model and Ci(mg/g) is a constant associated with the thickness of the boundary layer, where a higher value of Ci corresponds to a greater effect on the limiting boundary layer.
The kinetic parameters of the different models tested can be obtained by solving the nonlinear equations by iterative methods using the Gauss–Newton algorithm integrated in Origin Pro8® (OriginLab Corp, USA) software with a judicious choice of the initial vectors.

2.5.2. Adsorption Isotherm

The adsorption process continues until the adsorbate uptake amount on the adsorbent surface and the residual amount in the solution reach a dynamic equilibrium. The connection between these two values at a constant and defined temperature, known as the adsorption isotherm, is fundamental in describing the interactive behavior of solutes and adsorbents and is critical in the design of adsorption systems [38]. In this work, three extensively used adsorption isotherm models were employed to characterize the CR adsorption process onto zeolite [35,36,39].
The Langmuir isotherm assumes that the adsorbate molecules cover a monolayer on the homogeneous surface of adsorbent, without interaction between adsorbed molecules owing to constant enthalpies and sorption activation energy; the corresponding nonlinear equation is as follows:
q e = K L C e q max 1 + K L C e
where Ce is the equilibrium concentration of the adsorbate (mg/L), C0 the initial concentration of the adsorbate (mg/L), and qmax (mg/g) and KL (L/mg) are the maximum adsorption capacity and a constant related to the energy of adsorption, respectively. One can also introduce a separation factor (RL):
R L = 1 1 + K L C 0
This is a useful dimensionless constant which can determine the operating conditions:
RL > 1, unfavorable adsorption; RL = 1, linear adsorption; RL = 0, irreversible adsorption; 0 < RL < 1, favorable adsorption.
Freundlich’s adsorption isotherm is an empirical model that assumes a heterogeneous adsorption surface with molecular interaction. The applicable nonlinear equation is as follows:
q e = K F C e n
where KF (mg/g)/(mg/L)n is the Freundlich constant, which characterizes the strength of adsorption and n (dimensionless; 0 < n < 1) is a Freundlich intensity parameter that reflects the magnitude of the adsorption driving force or surface heterogeneity (the adsorption isotherm becomes linear when n =1, favorable when n < 1, and unfavorable when n > 1).
Unlike the two previous isotherms, Temkin isotherm considers that the decrease in the heat of adsorption of all molecules in the surface layer is linear with uniform distribution of binding energies. The corresponding nonlinear equation is:
q e = β T ln A T C e
where AT is an equilibrium binding constant and βT refers to a Temkin isotherm constant. If βT < 8 kJ mol−1, the adsorption is physical in nature.

3. Results and Discussion

3.1. Effect of Contact Time and Initial Dye Concentration
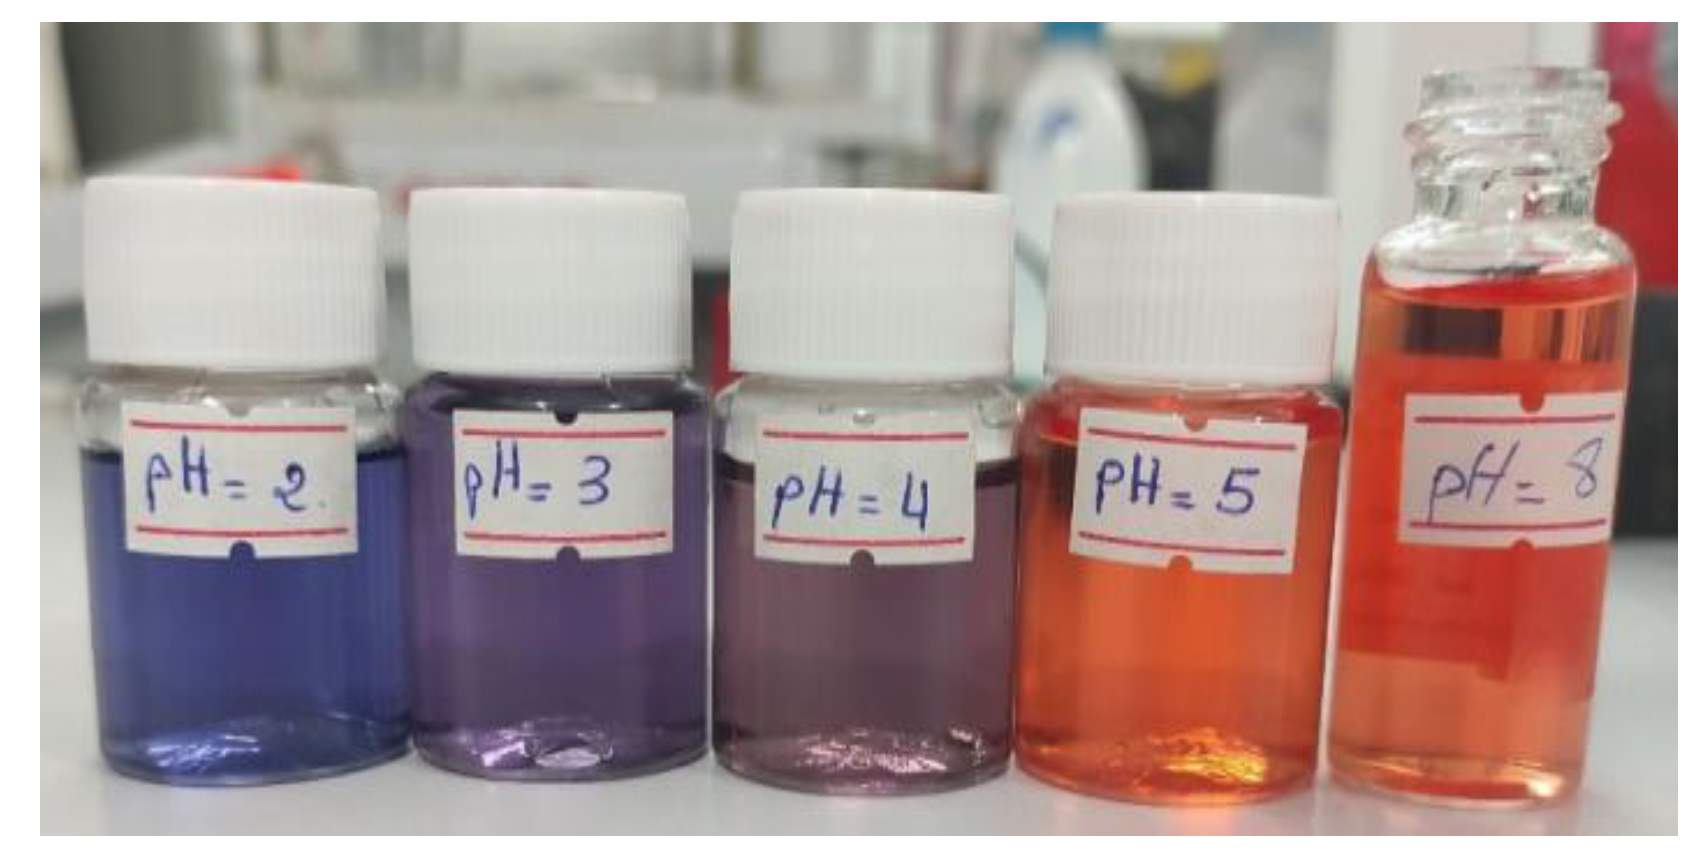
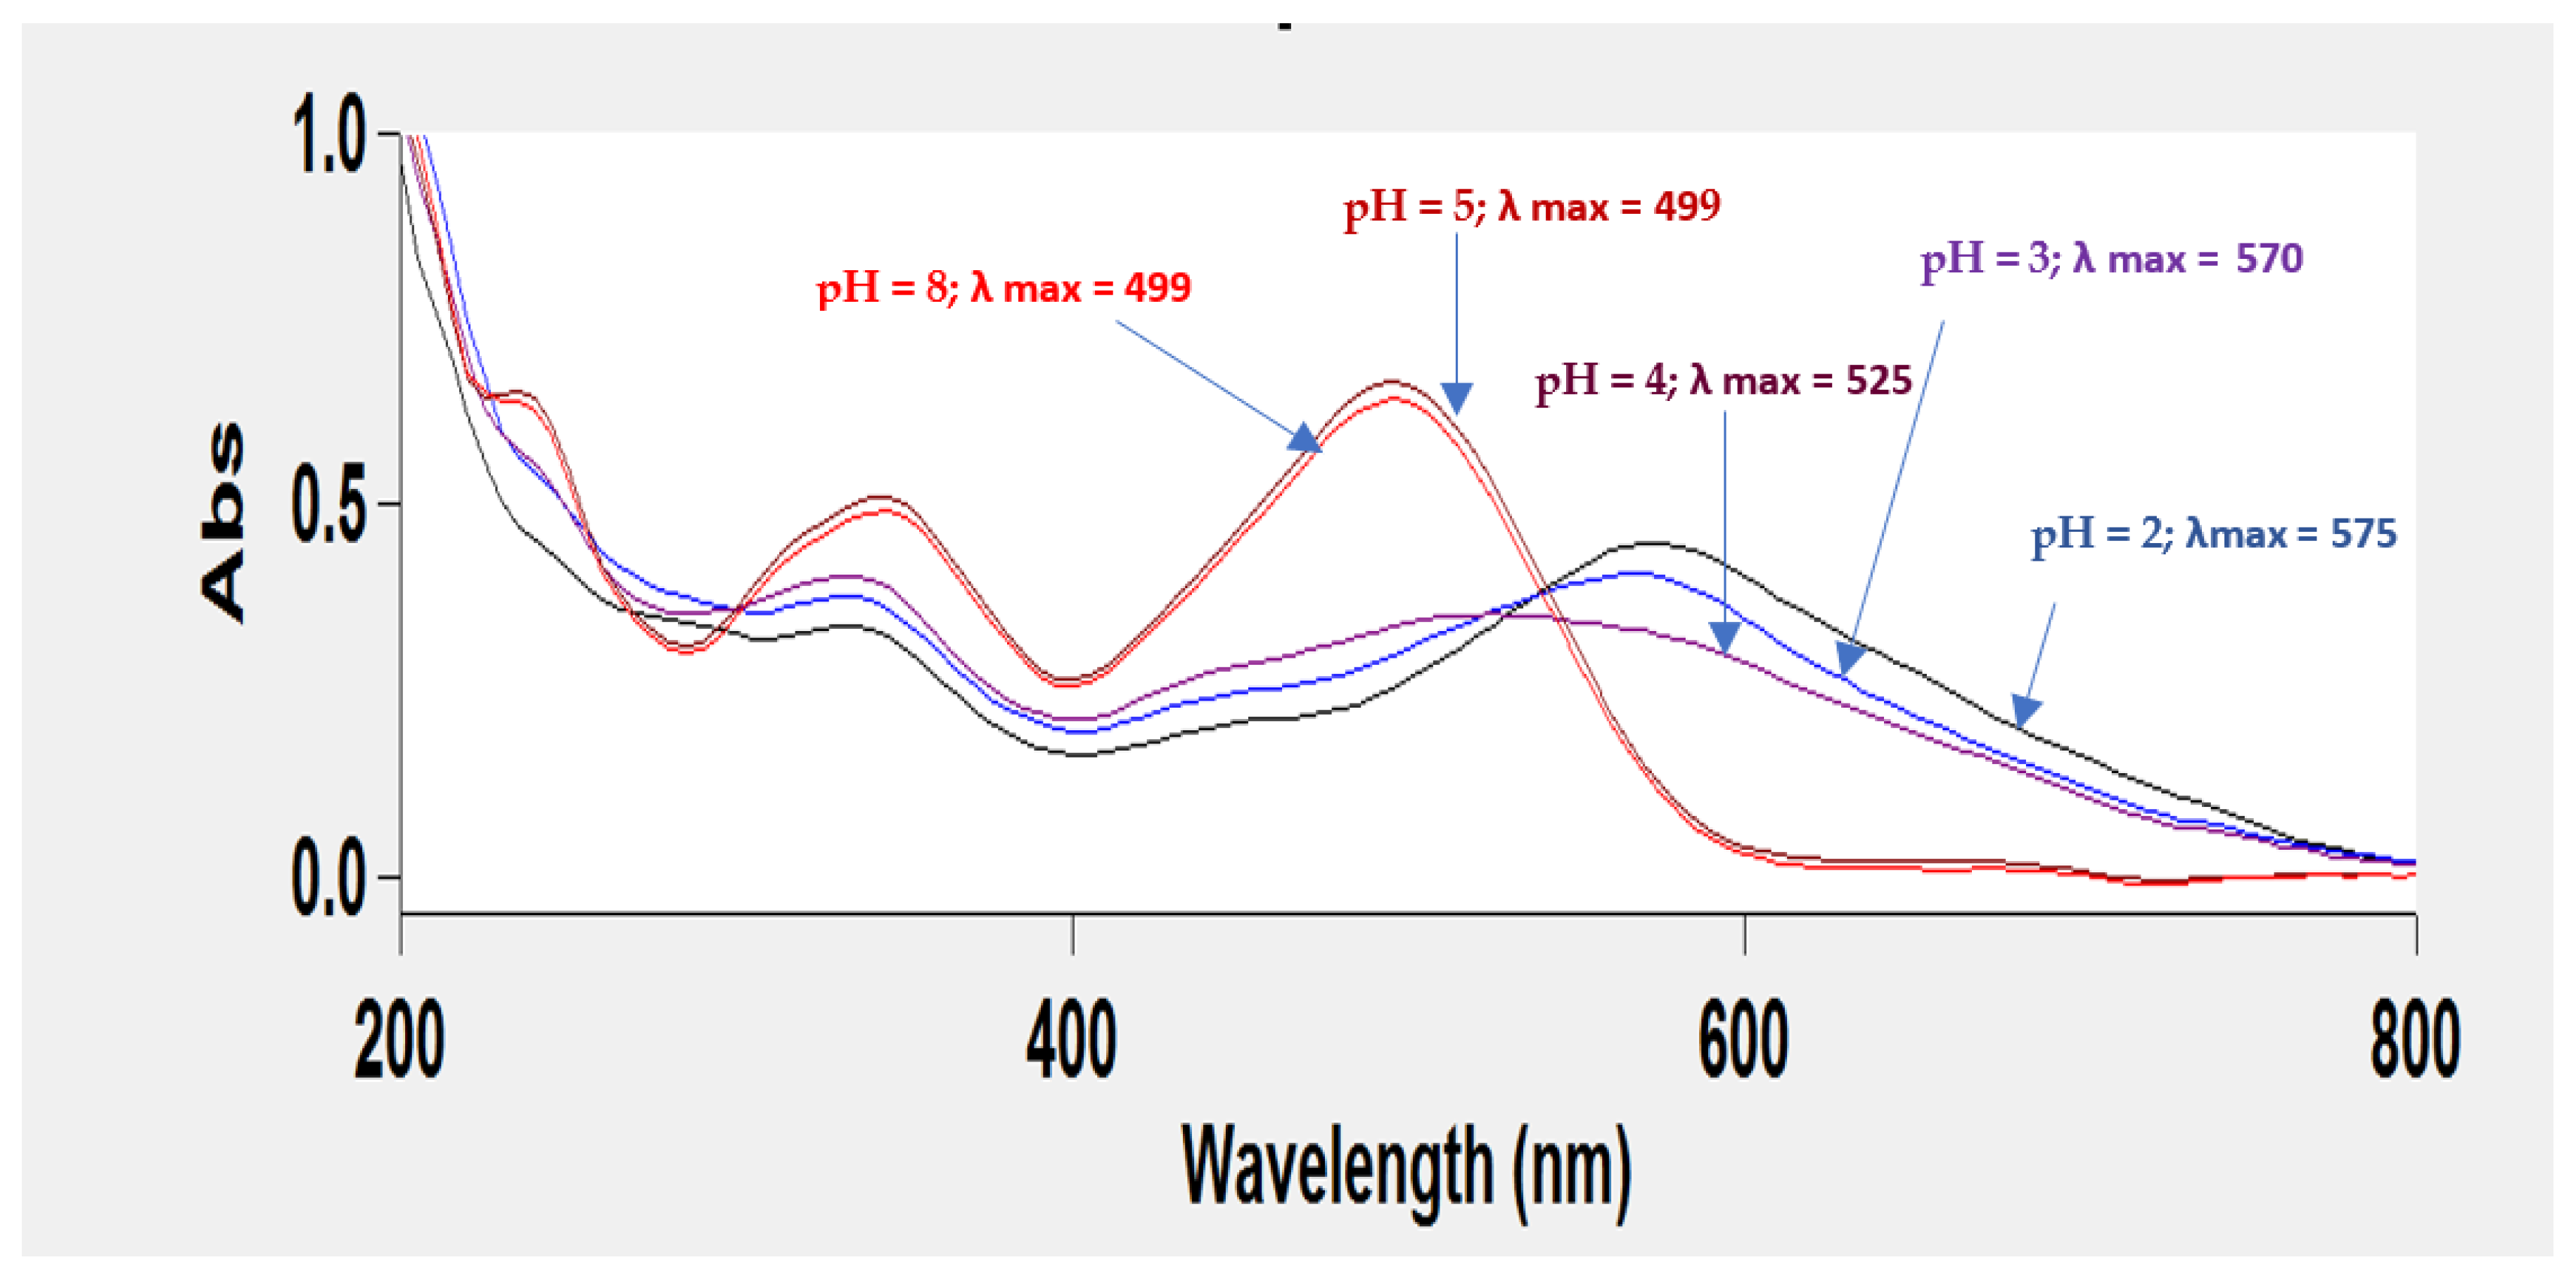
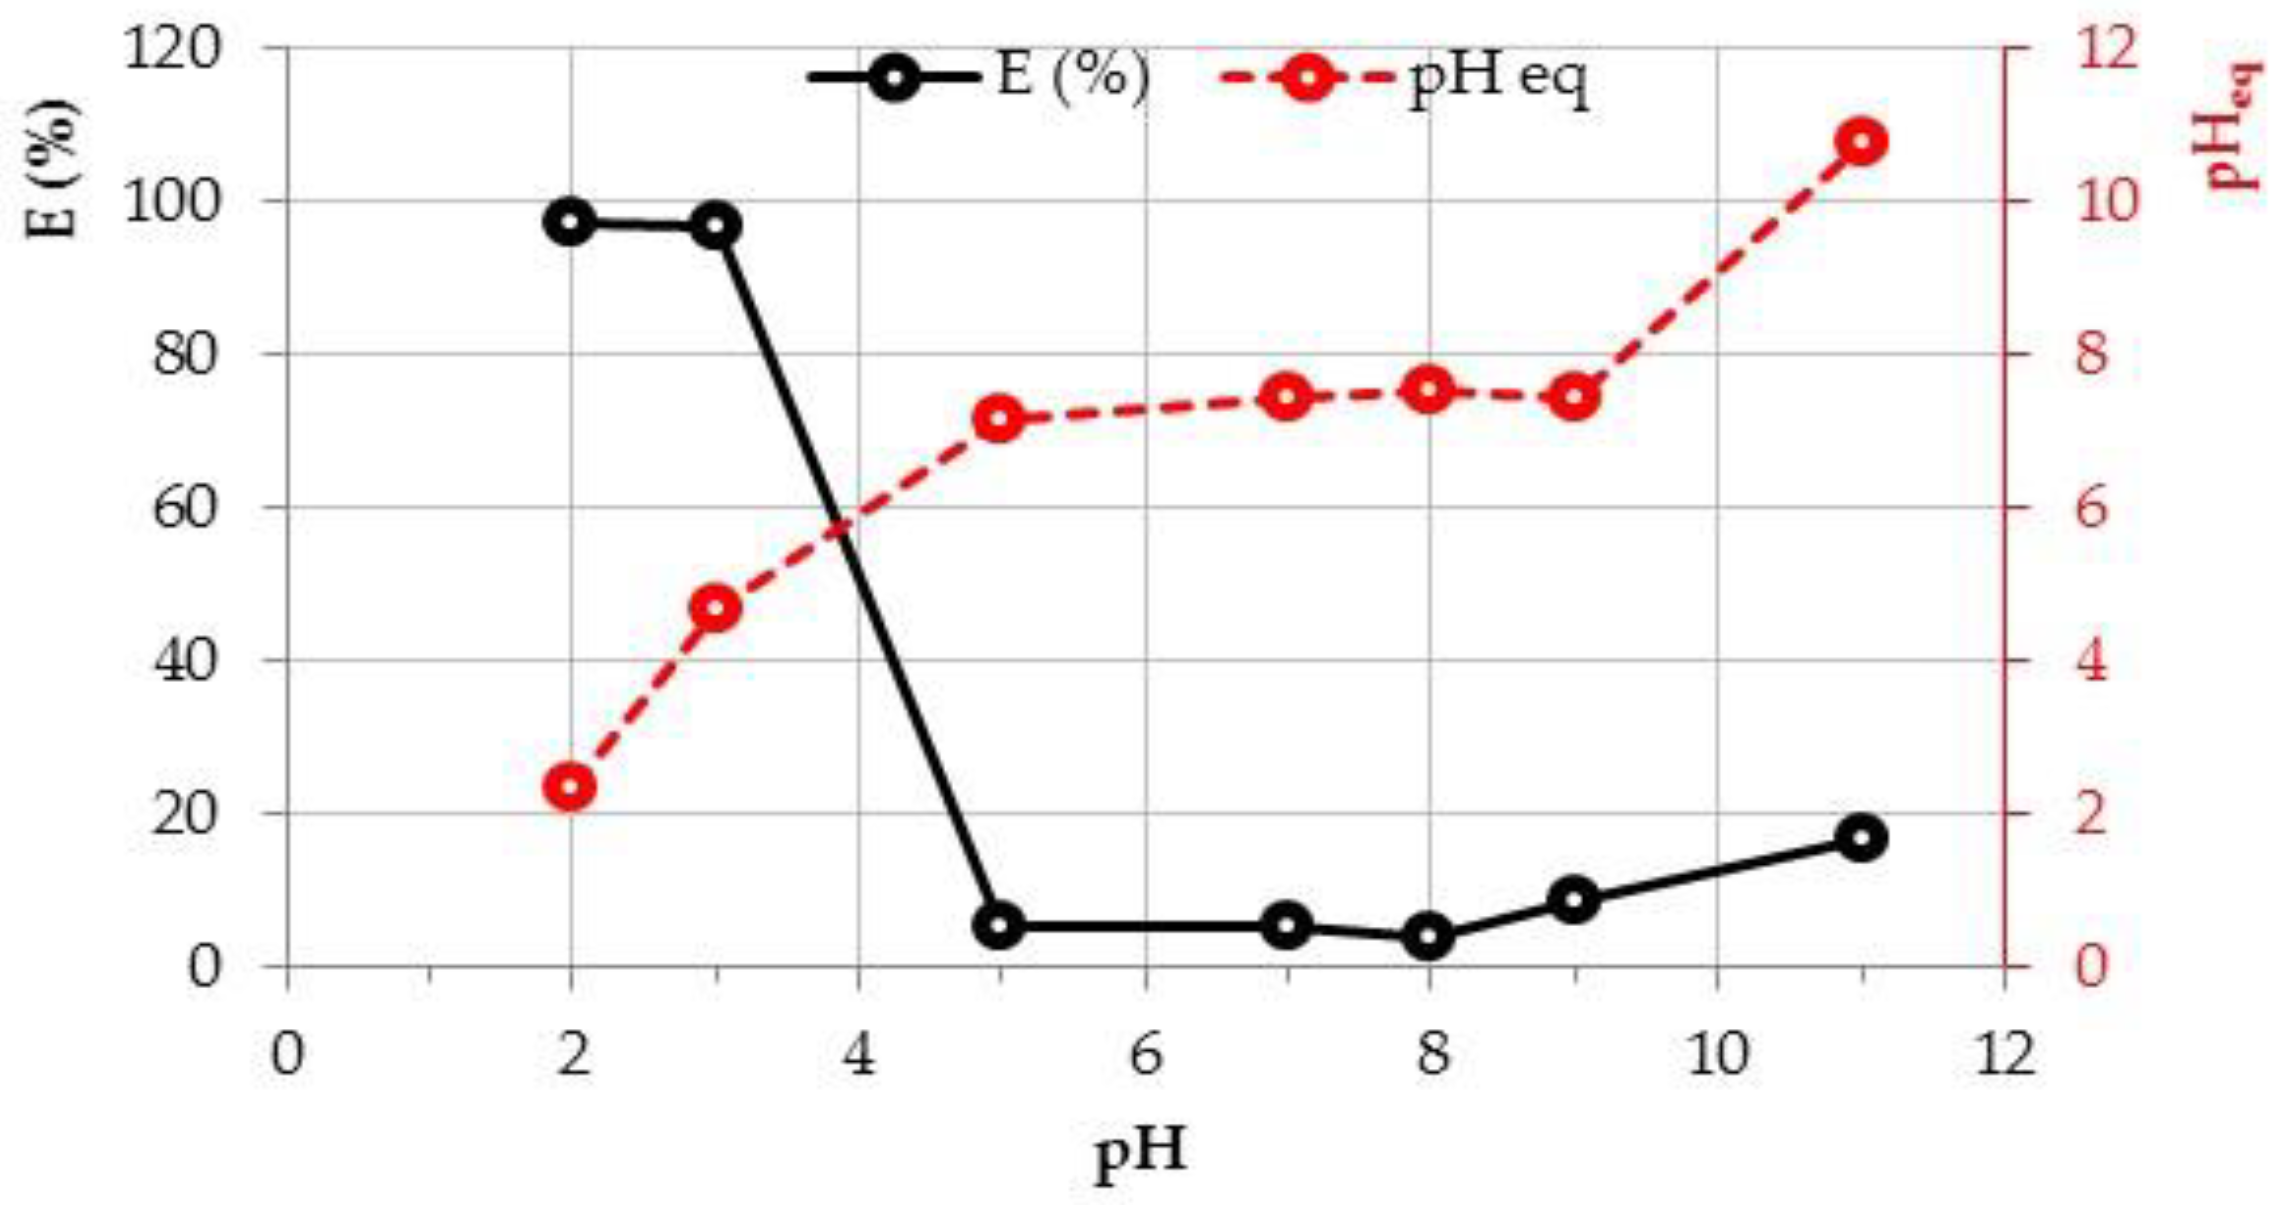
To determine the optimal shaking time to reach pseudo-equilibrium in the process, the adsorption of CR on zeolite as a function of time was performed with initial CR concentrations of 25 and 30 mg/L at pH 3. The corresponding data are shown in Figure 4, the qe value increased dramatically in the first six min where it attained 219.2 and 289.4 mg/g for the corresponding initial concentrations of 25 and 30 mg/L, respectively; this demonstrates that the adsorption rate was very fast in this time interval. This can be attributed to the abundant availability of the sorptive active sites on the zeolite surface at the beginning. After this time and as these sites are gradually occupied, adsorption slows and ultimately levels off, hence, the plateau becomes evident. The pseudo-equilibrium steady state was reached at about 100 min of contact time. As is evident, raising the initial concentration might provide the driving force necessary to overcome the mass transfer resistances between the aqueous and solid phases, resulting in an increase in the qe values [40]. Experiments involving CR adsorption on other adsorbents, such as activated carbon [41], zeolitic imidazolate framework–67 [42], and reduced graphene oxide [43], have previously demonstrated strong similarities.

3.2. Effect of pH

The efficiency of dye adsorption processes is greatly influenced by the pH of the solution. It affects the surface electrical charge of the adsorbent, the degree of ionization of adsorbate molecules in aqueous solution, and the dissociation of different functional groups on the active sites of the adsorbent, either independently or in conjunction [44]. In most cases, pH is termed as the ‘master variable’. The effect of initial solution pH on CR removal is shown in Figure 5. It can be observed that the maximum adsorption of CR took place at relatively very low initial solution pH (between pH 2 and 3). The removal efficiency E decreased significantly from 96.5 to 5.2% as the initial solution pH was increased from 3 to 5. It can be also noticed that, in the initial pH range from 5 to 8, the dye uptake was very weak and the E values began to rise after pH 9. This result can be explained by the following scenario:
CR is an anionic dye containing SO3 functional groups (see Figure 1), its dissociation in water gives its sulphonate groups (−SO3) that are negatively charged in aqueous solution as it is shown in Equation (21).
dye SO 3 , Na + Water dye SO 3   aq + Na aq +
At an acidic initial pH, the active surface functional groups of zeolite which are mainly the Silanol (Si-OH) and Aluminol groups (Al-OH) become protonated, as it is shown by the consecutive reactions provided in Equations (22) and (23) [45].
Ion exchange reaction:
S OM Z + H aq + S OH Z + M aq +
adsorption on neutral surface:
S OH Z Neutral   surface + H aq + S OH 2 + Z Protonated   surface
where S is surface central metal (Si, Al) of zeolite, and M is the metal cation balancing the charge of zeolitic framework. The adsorption of H+(aq) on the zeolite surface caused an increase in the solution pH as seen in this investigation and illustrated in Figure 5.
Under such conditions, the ionic attraction between (−SO3) and (SiOH2+, AlOH2+) is the possible adsorption mechanism of CR dye on the zeolite as it is shown in Equation (24).
S OH 2 + Z Protonated   surface + SO 3 dye aq S OH 2 + Z Protonated   surface . . SO 3 dye
Similar results have been reported by several studies about adsorption of anionic dyes on zeolite and clay materials [46,47].

3.3. Influence of Adsorbent Dose

In order to investigate the effect of zeolite dose on CR removal at pH 3, a series of experiments were undertaken with different adsorbent doses at initial dye concentration of 25 mg/L. The results obtained are depicted in Figure 6. Examination of this figure revealed that adsorbed amount of CR decreased with increasing adsorbent dose, while the removal efficiency E increased until the plateau is reached beyond the adsorbent dose of 0.1 g/L which corresponds to the value of 98.7%. At these conditions, further additional amount of adsorbent has little influence on the improvement of E. The highest value of qe obtained was 610.2 mg/g at adsorbent dose of 0.04 g/L.

3.4. Effect of Ionic Strength

Many electrolytes generated by the dissolution of sodium salts may occur in wastewater because they are often utilized as a stimulator in the dyeing industry. As can be observed in Figure 7, ionic strength has a positive effect on CR molecules uptake by adsorbent material. The adsorption capacity increased from 230 to 244.9 mg/g, as the concentration of Na2SO4 was increased from 0 to 9.1 mg/L. The enhanced removal of CR dye with an increase in Na2SO4 concentration can be attributed to the increase in surface positive charge of the adsorbents [48]. These results are in good agreement with those reported by other authors on removal of CR by reduced graphene oxide [43].

3.5. The Factorial Design

There are numerous significant issues with the conventional one-variable-at-a-time technique, in which we change one variable at a time while keeping all other variables in the experiment fixed. This type of experimentation requires substantial resources to obtain a limited amount of information about the process. In addition, this method’s trials are often inaccurate, inefficient, time-consuming, and may provide false optimal conditions for the process. An experiment is known as a factorial experiment if the treatments include every possible combination of several levels of factors. It displays the influence of process variable interactions and enhances process optimization. The impact of a factor is the change in the average value of the response caused by a shift from a lower (−1) to a higher (+1) level of a factor. According to the Yates algorithm, the effect ω can be calculated by the following expression [30,31].
ω i = q e   e x p n + 1 q e   e x p n 1
where ωi is the effect of the factor i, qe exp the measured response, and n is the number of experiments at each level (+1) or (−1). By replacing the response   Y ^ by q e ^ , and the coefficients ai in Equation (3) with their values given in Table 3, we obtain:
q e ^ mg g = 445.56 289.26   D + 252.12   C 0 + 9.92   I 172.28   D . C 0 7.43   D . I 2.45   C 0 . I + 3.76   D . C 0 . I  
According to the data reported in Table 3, we can observe that the main effects of factors C0 and I have a positive sign for CR adsorption. This indicates that qe increases as these factors’ levels rise throughout the adsorption process. In contrast, the effect of D is negative and high levels of this factor reduce qe values.
Statistical analysis of variance (ANOVA) was also performed to determine which process parameters are statistically significant. Fisher F-test is a tool for assessing which process factors have a significant impact on the value of CR adsorption capacity. The F-value for each process parameters is simply a ratio of mean of the squared deviations to the mean of the squared error. Usually, the larger the F-value, the greater the effect on qe value due to the change of the process parameter. The results of variance analysis are given in Table 4. From these data, one can observe that the main effects of the three factors studied as well as 2-way and 3-way interactions are statistically significant (p-values < 0.05) at 95% of confidence interval except C0–I interaction which has a p-value > 5%. According to the greatest F-value, the adsorbent dosage (D) has the most significant effect on CR adsorption compared to the other factors, the three parameters effect are listed in the following order: effect (D) > effect (C0) >> effect (I).
Pareto charts were used to determine the relative significance of the main effects and their interactions (Figure 8). A Student’s t-test was employed to determine whether the calculated effects were significantly different from zero and the values for each effect and interaction are represented by horizontal columns in Pareto chart [49,50]. It was observed that for a 95% confidence level and eight freedom degrees, the t-value is 2.306. The vertical line in the chart indicates the minimum statistically significant effect magnitude for 95% confidence level. According to the results of the statistical study given below, Equation (26) giving the response as a function of the terms that are statistically significant can be simplified to:
q e ^ mg g = 445.56 289.26   D + 252.12   C 0 + 9.92   I 172.28   D . C 0 7.43   D . I + 3.76   D . C 0 . I  

3.6. CR adsorption Kinetics and Isotherm Studies

3.6.1. Adsorption Kinetics

Table 5 shows the parameters obtained for the adsorption kinetics models examined. Based on the fitting criteria adopted, the IPD model is inadequate for representing the CR adsorption kinetics on our material at the two dye initial concentrations. The PFO model, on the other hand, does not describe the entire range of adsorption time and is only restricted to the initial time range. The experimental data fit the PSO model very well. The values of R2, MSE, and RMSE obtained are 0.98973, 2.19716, and 1.48228 for C0 = 24 ± 2 mg/L, and 0.99094, 1.01749, and 1.00871 for C0 = 31 ± 2 mg/L, respectively. On the other hand, the qe,cal values obtained are in agreement with qe,exp (see Table 5). This trend was also observed in other studies [42,46].

3.6.2. Adsorption Isotherm

The findings in Table 6 indicate that the adsorption of CR onto zeolite at 25 °C followed the Freundlich model since R2, MSE, and RMSE values found are better than those obtained for the Langmuir and Temkin isotherm models, thus, suggesting the heterogeneity of the zeolite particles’ adsorption sites. According to Table 6, the mean value of “n” obtained from the Freundlich isotherm is equal to 0.61, which is lower than unity and indicating favorable adsorption [36,51]. In addition, the value of Kf for Congo red adsorption is 126.31. These findings suggest that zeolite has a high capacity for adsorbing anionic Congo red dye in solution.

4. Conclusions

The analysis of variance and the 23 full factorial design of experiments for batch adsorption of Congo red dye using zeolite was studied. The effects of three factors, adsorbent dose D (0.02–0.1 g/L), initial dye concentration C0 (8.3–25.9 mg/L), and ionic strength expressed in terms of Na2SO4 salt solution I (0–9.1 mg/L) on adsorption capacity were identified. The main effects of factors C0 and I have a positive sign for CR adsorption, indicating that qe increases as these factors’ levels rise throughout the adsorption process. In contrast, the effect of D is negative, and high levels of this factor reduce qe values.
The statistical analysis confirmed that the one order polynomial equation gave a reasonably good fit with an R2 = 99.99% and adjusted R2 = 99.99%. According to the significance effect obtained in variance analysis and by means of Pareto charts, the adsorbent dose was the most significant factor in this process followed by C and I.
For all examined concentrations, the adsorption rate conformed to pseudo-second-order kinetics with a strong determination coefficient (R2 ≃ 0.99) and favorable MSE and RMSE values. The Freundlich isotherm better described the adsorption process occurring in this study. Moreover, it is shown that the planar shape of CR and the appropriate number of sulfonic groups are essential for its successful adsorption under acidic conditions (pH = 3).
All of the findings show that zeolite, which is an eco-friendly material, may be used efficiently to remove CR dye from aqueous solutions in a batch system.

Author Contributions

Conceptualization, A.I. and L.M.; methodology, A.I., L.M., S.C., and A.H.; validation, J.-C.B., A.A., and L.M.; formal analysis, A.I., S.C., and A.M.; investigation, A.I.; resources, L.M., H.T., and A.A.; data curation, A.I., L.M., N.H., and A.M.; writing—original draft preparation, A.I.; writing—review and editing, A.I., A.H., L.M., N.H., J.-C.B., H.T., and S.C.; visualization, A.I., L.M., J.-C.B., and A.A.; supervision, L.M., A.A., and J.-C.B.; project administration, L.M. and J.-C.B. All authors have read and agreed to the published version of the manuscript.

Funding

This research received no external funding.

Institutional Review Board Statement

Not applicable.

Informed Consent Statement

Not applicable.

Data Availability Statement

Not applicable.

Acknowledgments

The authors wish to thank all who assisted in conducting this work.

Conflicts of Interest

The authors declare no conflict of interest.

References

  1. de Luna, M.D.G.; Flores, E.D.; Genuino, D.A.D.; Futalan, C.M.; Wan, M.-W. Adsorption of Eriochrome Black T (EBT) dye using activated carbon prepared from waste rice hulls—Optimization, isotherm and kinetic studies. J. Taiwan Inst. Chem. Eng. 2013, 44, 646–653. [Google Scholar] [CrossRef]
  2. Gupta, V.; Kumar, R.; Nayak, A.; Saleh, T.; Barakat, M. Adsorptive Removal of Dyes from Aqueous Solution onto Carbon Nanotubes: A Review. Adv. Colloid Interface Sci. 2013, 193–194, 24–34. [Google Scholar] [CrossRef] [PubMed]
  3. Mittal, H.; Babu, R.; Dabbawala, A.; Stephen, S.; Alhassan, S. Zeolite-Y Incorporated Karaya Gum Hydrogel Composites for Highly Effective Removal of Cationic Dyes. Colloids Surf. Physicochem. Eng. Asp. 2019, 586, 124161. [Google Scholar] [CrossRef]
  4. van der Zee, F.; Villaverde, S. Combined Anaerobic–Aerobic Treatment of Azo Dyes—A Short Review of Bioreactor Studies. Water Res. 2005, 39, 1425–1440. [Google Scholar] [CrossRef]
  5. Franca, R.; Vieira, A.; Mata, A.M.T.; Carvalho, G.; Pinheiro, H.; Lourenco, N. Effect of an Azo Dye on the Performance of an Aerobic Granular Sludge Sequencing Batch Reactor Treating a Simulated Textile Wastewater. Water Res. 2015, 85, 327–336. [Google Scholar] [CrossRef]
  6. Gurses, A.; Yalçin, M.; Doğar, Ç. Removal of Remazol Red Rb by Using Al (III) as Coagulant-Flocculant: Effect of Some Variables on Settling Velocity. Water Air Soil Pollut. 2003, 146, 297–318. [Google Scholar] [CrossRef]
  7. Yang, Z.; Lu, X.; Gao, B.; Wang, Y.; Yue, Q.; Chen, T. Fabrication and Characterization of Poly(Ferric Chloride)-Polyamine Flocculant and Its Application to the Decolorization of Reactive Dyes. J. Mater. Sci. 2014, 49, 4962–4972. [Google Scholar] [CrossRef]
  8. Hadadi, A.; Imessaoudene, A.; Bollinger, J.-C.; Cheikh, S.; Assadi, A.A.; Amrane, A.; Kebir, M.; Mouni, L. Parametrical Study for the Effective Removal of Mordant Black 11 from Synthetic Solutions: Moringa oleifera Seeds’ Extracts Versus Alum. Water 2022, 14, 4109. [Google Scholar] [CrossRef]
  9. Hadadi, A.; Imessaoudene, A.; Bollinger, J.-C.; Assadi, A.A.; Amrane, A.; Mouni, L. Comparison of Four Plant-Based Bio-Coagulants Performances against Alum and Ferric Chloride in the Turbidity Improvement of Bentonite Synthetic Water. Water 2022, 14, 3324. [Google Scholar] [CrossRef]
  10. Hendaoui, K.; Ayari, F.; Ben Rayana, I.; Ben Amar, R.; Darragi, F.; Trabelsi-ayadi, M. Real Indigo Dyeing Effluent Decontamination Using Continuous Electrocoagulation Cell: Study and Optimization Using Response Surface Methodology. Process Saf. Environ. Prot. 2018, 116, 578–589. [Google Scholar] [CrossRef]
  11. Derouich, G.; Younssi, S.; Bennazha, J.; Cody, J.; Ouammou, M.; El Rhazi, M. Development of Low-Cost Polypyrrole/Sintered Pozzolan Ultrafiltration Membrane and Its Highly Efficient Performance for Congo Red Dye Removal. J. Environ. Chem. Eng. 2020, 8, 103809. [Google Scholar] [CrossRef]
  12. Tavangar, T.; Karimi, M.; Rezakazemi, M.; Reddy, R.; Aminabhavi, T. Textile Waste, Dyes/Inorganic Salts Separation of Cerium Oxide-Loaded Loose Nanofiltration Polyethersulfone Membranes. Chem. Eng. J. 2020, 385, 123787. [Google Scholar] [CrossRef]
  13. Wawrzkiewicz, M. Removal of C.I. Basic Blue 3 Dye by Sorption onto Cation Exchange Resin, Functionalized and Non-Functionalized Polymeric Sorbents from Aqueous Solutions and Wastewaters. Chem. Eng. J. 2013, 217, 414–425. [Google Scholar] [CrossRef]
  14. Wu, J.; Li, Q.; Li, W.; Li, Y.; Wang, G.; Li, A.; Li, H. Efficient Removal of Acid Dyes Using Permanent Magnetic Resin and Its Preliminary Investigation for Advanced Treatment of Dyeing Effluents. J. Clean. Prod. 2020, 251, 119694. [Google Scholar] [CrossRef]
  15. Torrades, F.; García-Montaño, J. Using Central Composite Experimental Design to Optimize the Degradation of Real Dye Wastewater by Fenton and Photo-Fenton Reactions. Dyes Pigments. 2014, 100, 184–189. [Google Scholar] [CrossRef] [Green Version]
  16. Muniyasamy, A.; Sivaporul, G.; Gopinath, A.; Lakshmanan, R.; Altaee, A.; Achary, A.; Chellam, P.V. Process Development for the Degradation of Textile Azo Dyes (Mono-, Di-, Poly-) by Advanced Oxidation Process-Ozonation: Experimental & Partial Derivative Modelling Approach. J. Environ. Manag. 2020, 265, 110397. [Google Scholar] [CrossRef]
  17. Lum, P.; Foo, K.Y.; Zakaria, N.; Palaniandy, P. Ash Based Nanocomposites for Photocatalytic Degradation of Textile Dye Pollutants: A Review. Mater. Chem. Phys. 2019, 241, 122405. [Google Scholar] [CrossRef]
  18. Mouni, L.; Belkhiri, L.; Bollinger, J.-C.; Bouzaza, A.; Assadi, A.; Tirri, A.; Dahmoune, F.; Madani, K.; Remini, H. Removal of Methylene Blue from Aqueous Solutions by Adsorption on Kaolin: Kinetic and Equilibrium Studies. Appl. Clay Sci. 2018, 153, 38–45. [Google Scholar] [CrossRef]
  19. Raman, C.; Kanmani, S. Textile Dye Degradation Using Nano Zero Valent Iron: A Review. J. Environ. Manag. 2016, 177, 341–355. [Google Scholar] [CrossRef]
  20. Khanday, W.; Asif, M.; Hameed, B. Cross-Linked Beads of Activated Oil Palm Ash Zeolite/Chitosan Composite as a Bio-Adsorbent for the Removal of Methylene Blue and Acid Blue 29 Dyes. Int. J. Biol. Macromol. 2016, 95, 895–902. [Google Scholar] [CrossRef]
  21. Ma, C.; Bai, J.; Hu, X.; Jiang, Z.; Wang, L. Nitrogen-doped porous carbons from polyacrylonitrile fiber as effective CO2 adsorbents. J. Environ. Sci. 2023, 125, 533–543. [Google Scholar] [CrossRef] [PubMed]
  22. Huang, J.; Bai, J.; Demir, M.; Hu, X.; Jiang, Z.; Wang, L. Efficient N-Doped Porous Carbonaceous CO2 Adsorbents Derived from Commercial Urea-Formaldehyde Resin. Energy Fuels. 2022, 36, 5825–5832. [Google Scholar] [CrossRef]
  23. Ma, C.; Bai, J.; Demir, M.; Hu, X.; Liu, S.; Wang, L. Water chestnut shell-derived N/S-doped porous carbons and their applications in CO2 adsorption and supercapacitor. Fuel 2022, 326, 125119. [Google Scholar] [CrossRef]
  24. Gupta, V.; Suhas, D. Application of Low-Cost Adsorbents for Dye Removal—A Review. J. Environ. Manag. 2009, 90, 2313–2342. [Google Scholar] [CrossRef] [PubMed]
  25. Crini, G. Non-Conventional Low-Cost Adsorbents for Dye Removal: A Review. Bioresour. Technol. 2006, 97, 1061–1085. [Google Scholar] [CrossRef] [PubMed]
  26. Moradi, O.; Sharma, G. Emerging novel polymeric adsorbents for removing dyes from wastewater: A comprehensive review and comparison with other adsorbents. Environ. Res. 2021, 201, 111534. [Google Scholar] [CrossRef]
  27. Humelnicu, I.; Baiceanu, A.; Ignat, M.-E.; Viorica, D. The Removal of Basic Blue 41 Textile Dye from Aqueous Solution by Adsorption onto Natural Zeolitic Tuff: Kinetics and Thermodynamics. Process Saf. Environ. Prot. 2016, 105, 274–287. [Google Scholar] [CrossRef]
  28. Ouki, S.; Cheeseman, C.R.; Perry, R. Natural Zeolite Utilisation in Pollution Control: A Review of Applications to Metals’ Effluents. J. Chem. Technol. Biotechnol. 1994, 59, 121–126. [Google Scholar] [CrossRef]
  29. Hernández-Beltrán, N.; Olguín, M.; Rosas Aburto, A. Effect of Acid Phosphate Media on the Stability of Clinoptilolite-Rich Tuff. J. Incl. Phenom. 2008, 61, 93–100. [Google Scholar] [CrossRef]
  30. Goupy, J. Plans D’expériences Pour Surfaces de Réponse; Dunod: Paris, France, 1999. [Google Scholar]
  31. Jiju Antony, J. Design of Experiments for Engineers and Scientists; Elsevier Ltd.: Amsterdam, The Netherlands, 2003. [Google Scholar]
  32. Zhang, K.; Cheung, W.H.; Valix, M. Roles of physical and chemical properties of activated carbon in the adsorption of lead ions. Chemosphere 2005, 60, 1129–1140. [Google Scholar] [CrossRef]
  33. Vuono, D.; Catizzone, E.; Aloise, A.; Policicchio, A.; Agostino, R.G.; Migliori, M.; Giordano, G. Modelling of adsorption of textile dyes over multi-walled carbon nanotubes: Equilibrium and kinetic. Chin. J. Chem. Eng. 2017, 25, 523–532. [Google Scholar] [CrossRef]
  34. Tanzifi, M.; Yaraki, M.T.; Karami, M.; Karimi, S.; Kiadehi, A.D.; Karimipour, K.; Wang, S. Modelling of dye adsorption from aqueous solution on polyaniline/carboxymethylcellulose/TiO2 nanocomposites. J. Colloid Interface Sci. 2018, 519, 154–173. [Google Scholar] [CrossRef] [PubMed]
  35. Krstic, V. Role of zeolite adsorbent in water treatment. Chapter 14. In Handbook of Nanomaterials for Wastewater Treatment; Elsevier: Amsterdam, The Netherlands, 2021; pp. 417–481. [Google Scholar]
  36. Tran, H.N.; You, S.J.; Hosseini-Bandegharaei, A.; Chao, H.P. Mistakes and inconsistencies regarding adsorption of contaminants from aqueous solutions: A critical review. Water Res. 2017, 120, 88–116. [Google Scholar] [CrossRef] [PubMed]
  37. Lima, E.C.; Sher, F.; Guleria, A.; Saeb, M.R.; Anastopoulos, I.; Tran, H.N.; Hosseini-Bandegharaei, A. Is one performing the treatment data of adsorption kinetics correctly? J. Environ. Chem. Eng. 2021, 9, 104813. [Google Scholar] [CrossRef]
  38. Chahkandi, M. Mechanism of Congo red adsorption on new sol-gel-derived hydroxyapatite nano-particle. Mater. Chem. Phys. 2017, 202, 340–351. [Google Scholar] [CrossRef]
  39. Tran, H.N.; Lima, E.C.; Juang, R.S.; Bollinger, J.C.; Chao, H.P. Thermodynamic parameters of liquid–phase adsorption process calculated from different equilibrium constants related to adsorption isotherms: A comparison study. J. Environ. Chem. Eng. 2021, 9, 106674. [Google Scholar] [CrossRef]
  40. Imessaoudene, A.; Cheikh, S.; Bollinger, J.-C.; Belkhiri, L.; Tiri, A.; Bouzaza, A.; El Jery, A.; Assadi, A.; Amrane, A.; Mouni, L. Zeolite Waste Characterization and Use as Low-Cost, Ecofriendly, and Sustainable Material for MalachiteGreen and Methylene Blue Dyes Removal: Box–Behnken Design, Kinetics, and Thermodynamics. Appl. Sci. 2022, 12, 7587. [Google Scholar] [CrossRef]
  41. Purkait, M.K.; Maiti, A.; DasGupta, S.; De, S. Removal of congo red using activated carbon and its regeneration. J. Hazard. Mater. 2007, 145, 287–295. [Google Scholar] [CrossRef]
  42. Tu, N.T.T.; Thien, T.V.; Du, P.D.; Chau, V.T.T.; Mau, T.X.; Khieu, D.Q. Adsorptive removal of congo red from aqueous solution using zeolitic imidazolateframework–67. J. Environ. Chem. Eng. 2018, 6, 2269–2280. [Google Scholar] [CrossRef]
  43. Wu, Z.; Yuan, X.; Zhong, H.; Wang, H.; Jiang, L.; Zeng, G.; Wang, H.; Liu, Z.; Li, Y. Highly efficient adsorption of Congo red in single and binary water with cationic dyes by reduced graphene oxide decorated NH2-MIL-68(Al). J. Mol. Liq. 2017, 247, 215–229. [Google Scholar] [CrossRef]
  44. Banerjee, S.; Chattopadhyaya, M.C. Adsorption characteristics for the removal of a toxic dye, tartrazine from aqueous solutions by a low cost agricultural by-product. Arab. J. Chem. 2017, 10, S1629–S1638. [Google Scholar] [CrossRef] [Green Version]
  45. Polatoglu, I.; Cakicioglu-Ozkan, F. Aqueous interactions of zeolitic material in acidic and basic solutions. Microporous Mesoporous Mater. 2010, 132, 219–225. [Google Scholar] [CrossRef] [Green Version]
  46. Vimonses, V.; Lei, S.; Jin, B.; Chow, C.W.K.; Saint, C. Kinetic study and equilibrium isotherm analysis of Congo Red adsorption by clay materials. J. Chem. Eng. 2009, 148, 354–364. [Google Scholar] [CrossRef]
  47. Djomgoue, P.; Siewe, M.; Djoufac, E.; Kenfack, P.; Njopwouo, D. Surface modification of Cameroonian magnetite rich clay with Eriochrome BlackT. Application for adsorption of nickel in aqueous solution. Appl. Surf. Sci. 2012, 258, 7470–7479. [Google Scholar] [CrossRef]
  48. Debnath, S.; Kitinya, J.; Onyango, M.S. Removal of Congo red from aqueous solution by two variants of calcium and iron based mixed oxide nano-particle agglomerates. J. Ind. Eng. Chem. 2014, 20, 2119–2129. [Google Scholar] [CrossRef]
  49. Carmona, M.E.R.; da Silva, M.A.P.; Ferreira Leite, S.G. Biosorption of chromium using factorial experimental design. Process Biochem. 2005, 40, 779–788. [Google Scholar] [CrossRef]
  50. Bingol, D.; Tekin, N.; Alkan, M. Brilliant Yellow dye adsorption onto sepiolite using a full factorial design. Appl. Clay Sci. 2010, 50, 315–321. [Google Scholar] [CrossRef]
  51. Tran, H.N.; You, S.J.; Chao, H.P. Fast and efficient adsorption of methylene green 5 on activated carbon prepared from new chemical activation method. J. Environ. Manag. 2017, 188, 322–336. [Google Scholar] [CrossRef]
Figure 1. Chemical structure of CR.
Separations 10 00057 g001
Figure 2. CR colors solutions at different initial pHs, C0 = 20 mg/L.
Separations 10 00057 g002
Figure 3. λmax (nm) values obtained at different initial dye solution pH, C0 = 20 mg/L.
Separations 10 00057 g003
Figure 4. Kinetic of CR adsorption on zeolite (pH = 3, D = 0.1 g/L, T = 25 °C, ……PSO model).
Separations 10 00057 g004
Figure 5. Effect of initial solution pH on CR removal efficiency (C0 = 26.9 mg/L, D = 0.1 g/L, T = 25 °C).
Separations 10 00057 g005
Figure 6. Effect of zeolite dose on CR removal efficiency and the adsorption capacity (C0 = 25 ± 2 mg/L, pH = 3, T = 25 °C).
Separations 10 00057 g006
Figure 7. Effect of Na2SO4 concentration on the adsorption of CR (C0 = 25 ± 2 mg/L, D = 0.1 g/L, pH = 3, T = 25 °C).
Separations 10 00057 g007
Figure 8. Pareto chart of the standardized effects (response is qe (mg/g), α = 0.05).
Separations 10 00057 g008
Table 1. Experimental parameters and their levels.
FactorsReal UnitLow Level (−1)High Level (+1)
Dg/L0.020.1
C0mg/L8.325.9
Img Na2SO4/L09.1
Table 2. 23 full factorial design matrix of experiments.
Coded Experiments Matrixqe (mg/g)
Std OrderRun OrderDC0IObserved PredictedResidual
161+1+1+1238.5239.93−1.43
42+1+1−1230.8232.34−1.56
73−1+1+11175.31170.345.00
104+1−1−173.775.28−1.56
15−1−1−1289.5286.862.60
96−1−1−1284.3286.86−2.60
127+1+1−1233.9232.341.56
68+1−1+177.477.65−0.29
59−1−1+1339.7333.985.71
210+1−1−176.875.281.56
811+1+1+1241.4239.931.43
312−1+1−11146.11148.08−1.95
1413+1−1+177.977.650.,29
1314−1−1+1328.3333.98−5.71
1515−1+1+11165.31170.34−5.00
1116−1+1−11150.01148.081.95
Table 3. Coded coefficients.
TermEffect (ωi)Coefficient (ai)Standard Error (SE)
Constant 445.561.08
D−578.51−289.261.08
C0504.23252.121.08
I19.839.921.08
D.C0−344.56−172.281.08
D.I−14.86−7.431.08
C0.I−4.91−2.451.08
D.C0.I7.523.761.08
Table 4. Analysis of variance (ANOVA) for fractional factorial experimental design.
SourceDegrees of Freedom (DF)Sum of Squares (SS)Mean Square (MS)F-Valuep-Value
D11,338,7171,338,71771,317.010.000
C011,016,9981,016,99854,178.170.000
I11573157383.800.000
D.C01474,895474,89525,298.920.000
D.I188388347.040.000
C0.I196965.140.053
D.C0.I122622612.050.008
Error815019
Total152,833,538
S = 4.33259; R2 = 99.99%; R2ajusted = 99.99%; R2predicted = 99.98%.
Table 5. Parameters of kinetic models tested for CR removal on zeolite at 25 °C using nonlinearized equations.
ModelC0 (mg/L)qe,exp (mg/g)qe,cal (mg/g)k1 (min−1)k2 (g/mg min)kid (mg/g min)Ci (mg/g)R2MSERMSE
PFO24 ± 2232.0228.2 ± 1.30.666 ± 0.044---0.86528.7355.360
PSO233.8 ± 0.4-0.006 ± 2 × 10⁻⁴--0.9892.1971.482
IPD---2.948 ± 0.752204.398 ± 5.7360.474112.37010.600
PFO31 ± 2311.2305.8 ± 1.40.694 ± 0.049---0.72530.8195.551
PSO310.9 ± 0.3-0.007 ± 2 × 10⁻⁴--0.9901.0171.008
IPD---2.668 ± 0.509285.737 ± 3.6720.64639.7116.301
Table 6. Non-linear isotherm models fitting to experimental data (D = 0.1 g/L, pH = 3, T = 25 °C).
Modelqmax (mg/g)KL (L/mg)KF (mg/g)/(mg/L)nnβTATR2MSERMSE
Langmuir666.5 ± 71.60.205 ± 0.039----0.985122.37411.062
Freundlich--126.319 ± 3.6040.613 ± 0.020--0.99629.6145.441
Temkin----138.942 ± 13.0312.160 ± 0.380.966285.50016.896
Disclaimer/Publisher’s Note: The statements, opinions and data contained in all publications are solely those of the individual author(s) and contributor(s) and not of MDPI and/or the editor(s). MDPI and/or the editor(s) disclaim responsibility for any injury to people or property resulting from any ideas, methods, instructions or products referred to in the content.

