
Synthesis, Characterization and Ecotoxicity Evaluation of Biochar-Derived Carbon Dots from Spruce Tree, Purple Moor-Grass and African Oil Palm

 ,
,  , , ,
, , ,
Abstract
:
1. Introduction
2. Materials and Methods
2.1. Reagents
2.2. Biochar Characterization
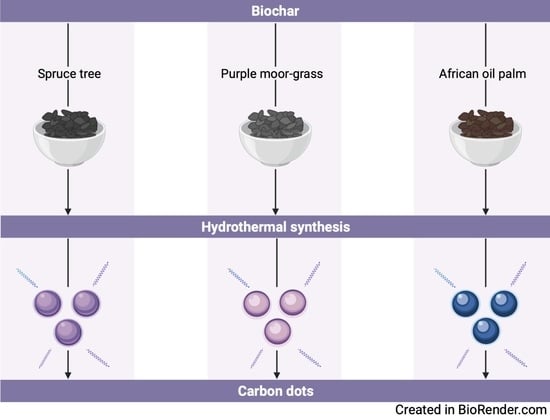
2.3. Synthesis of Biochar-Derived C-Dots
2.4. Characterization of Biochar-Derived C-Dots
2.5. Quantum Yield Measurement
2.6. Ecotoxicity Assay
3. Results and Discussion
3.1. Biochar Characterization
3.2. Carbon Dots Characterization
3.2.1. Chemical Characterization
3.2.2. Morphology and Stability
3.2.3. Optical Properties
3.2.4. Ecotoxicity
4. Conclusions
Supplementary Materials
Author Contributions
Funding
Institutional Review Board Statement
Informed Consent Statement
Data Availability Statement
Acknowledgments
Conflicts of Interest
References
- United Nations. The Sustainable Development Goals Report; United Nations: New York, NY, USA, 2020; ISSN 2521-6899. [Google Scholar]
- Benedetti, V.; Patuzzi, F.; Baratieri, M. Characterization of char from biomass gasification and its similarities with activated carbon in adsorption applications. Appl. Energy 2018, 227, 92–99. [Google Scholar] [CrossRef]
- Yao, Z.; You, S.; Ge, T.; Wang, C.-H. Biomass gasification for syngas and biochar co-production: Energy application and economic evaluation. Appl. Energy 2018, 209, 43–55. [Google Scholar] [CrossRef] [Green Version]
- Vamvuka, D.; Sfakiotakis, S.; Pantelaki, O. Evaluation of gaseous and solid products from the pyrolysis of waste biomass blends for energetic and environmental applications. Fuel 2019, 236, 574–582. [Google Scholar] [CrossRef]
- Kong, X.; Zhu, Y.; Lei, H.; Wang, C.; Zhao, Y.; Huo, E.; Lin, X.; Zhang, Q.; Qian, M.; Mateo, W.; et al. Synthesis of graphene-like carbon from biomass pyrolysis and its applications. Chem. Eng. J. 2020, 399, 125808. [Google Scholar] [CrossRef]
- Li, J.; Dai, J.; Liu, G.; Zhang, H.; Gao, Z.; Fu, J.; He, Y.; Huang, Y. Biochar from microwave pyrolysis of biomass: A review. Biomass Bioenergy 2016, 94, 228–244. [Google Scholar] [CrossRef]
- Chen, T.; Liu, R.; Scott, N.R. Characterization of energy carriers obtained from the pyrolysis of white ash, switchgrass and corn stover—Biochar, syngas and bio-oil. Fuel Process. Technol. 2016, 142, 124–134. [Google Scholar] [CrossRef]
- Muegue, L.C.D.; González, J.C.A.; Mesa, G.P. Characterization and Potential Use of Biochar for the Remediation of Coal Mine Waste Containing Efflorescent Salts. Sustainability 2017, 9, 2100. [Google Scholar] [CrossRef] [Green Version]
- Giri, B.S.; Goswami, M.; Singh, R. Review on Application of Agro-Waste Biomass Biochar for Adsorption and Bioremediation Dye. Biomed. J. Sci. Tech. Res. 2017, 1, 1928–1930. [Google Scholar]
- Aresta, M.; Dibenedetto, A.; Angelini, A. Catalysis for the Valorization of Exhaust Carbon: From CO2 to Chemicals, Materials, and Fuels. Technological Use of CO2. Chem. Rev. 2014, 114, 1709–1742. [Google Scholar] [CrossRef]
- Shalini, S.S.; Palanivelu, K.; Ramachandran, A.; Raghavan, V. Biochar from biomass waste as a renewable carbon material for climate change mitigation in reducing greenhouse gas emissions—A review. Biomass Convers. Biorefin. 2020, 1–21. [Google Scholar] [CrossRef] [Green Version]
- Tan, X.; Liu, S.-B.; Liu, Y.-G.; Gu, Y.-L.; Zeng, G.-M.; Hu, X.-J.; Wang, X.; Jiang, L.-H. Biochar as potential sustainable precursors for activated carbon production: Multiple applications in environmental protection and energy storage. Bioresour. Technol. 2017, 227, 359–372. [Google Scholar] [CrossRef]
- Plácido, J.; Bustamante-López, S.; Meissner, K.; Kelly, D.; Kelly, S. NanoRefinery of carbonaceous nanomaterials: Complementing dairy manure gasification and their applications in cellular imaging and heavy metal sensing. Sci. Total Environ. 2019, 689, 10–20. [Google Scholar] [CrossRef]
- Plácido, J.; López, S.B.; Meissner, K.; Kelly, D.; Kelly, S. Multivariate analysis of biochar-derived carbonaceous nanomaterials for detection of heavy metal ions in aqueous systems. Sci. Total Environ. 2019, 688, 751–761. [Google Scholar] [CrossRef]
- Pourreza, N.; Ghomi, M. Green synthesized carbon quantum dots from Prosopis juliflora leaves as a dual off-on fluorescence probe for sensing mercury (II) and chemet drug. Mater. Sci. Eng. C 2019, 98, 887–896. [Google Scholar] [CrossRef]
- Atchudan, R.; Edison, T.N.J.I.; Perumal, S.; Selvam, N.C.S.; Lee, Y.R. Green synthesized multiple fluorescent nitrogen-doped carbon quantum dots as an efficient label-free optical nanoprobe for in vivo live-cell imaging. J. Photochem. Photobiol. A Chem. 2019, 372, 99–107. [Google Scholar] [CrossRef]
- Vasimalai, N.; Vilas-Boas, V.; Gallo, J.; Cerqueira, M.D.F.; Menéndez-Miranda, M.; Costa-Fernández, J.M.; Diéguez, L.; Espiña, B.; Fernández-Argüelles, M.T. Green synthesis of fluorescent carbon dots from spices for in vitro imaging and tumour cell growth inhibition. Beilstein J. Nanotechnol. 2018, 9, 530–544. [Google Scholar] [CrossRef]
- Kang, C.; Huang, Y.; Yang, H.; Yan, X.F.; Chen, Z.P. A Review of Carbon Dots Produced from Biomass Wastes. Nanomaterials 2020, 10, 2316. [Google Scholar] [CrossRef] [PubMed]
- Campuzano, S.; Yáñez-Sedeño, P.; Pingarrón, J.M. Carbon Dots and Graphene Quantum Dots in Electrochemical Biosensing. Nanomaterials 2019, 9, 634. [Google Scholar] [CrossRef] [PubMed] [Green Version]
- Plácido, J.; Bustamante-López, S.; Meissner, K.; Kelly, D.; Kelly, S. Comparative study of the characteristics and fluorescent properties of three different biochar derived-carbonaceous nanomaterials for bioimaging and heavy metal ions sensing. Fuel Process. Technol. 2019, 196, 106163. [Google Scholar] [CrossRef]
- Plácido, J.; Bustamante-López, S.; Meissner, K.; Kelly, D.; Kelly, S. Microalgae biochar-derived carbon dots and their application in heavy metal sensing in aqueous systems. Sci. Total Environ. 2019, 656, 531–539. [Google Scholar] [CrossRef] [Green Version]
- Abdul, S.; Nor, R.; Zobir, M. Synthesis, Technology and Applications of Carbon Nanomaterials; Elsevier: Oxford, UK, 2019. [Google Scholar]
- Liu, M.L.; Bin Chen, B.; Li, C.M.; Huang, C.Z. Carbon dots: Synthesis, formation mechanism, fluorescence origin and sensing applications. Green Chem. 2019, 21, 449–471. [Google Scholar] [CrossRef]
- Wang, R.; Lu, K.-Q.; Tang, Z.-R.; Xu, Y.-J. Recent progress in carbon quantum dots: Synthesis, properties and applications in photocatalysis. J. Mater. Chem. A 2017, 5, 3717–3734. [Google Scholar] [CrossRef]
- Liu, W.; Li, C.; Ren, Y.; Sun, X.; Pan, W.; Li, Y.; Wang, J.; Wang, W. Carbon dots: Surface engineering and applications. J. Mater. Chem. B 2016, 4, 5772–5788. [Google Scholar] [CrossRef]
- Zheng, M.; Liu, S.; Li, J.; Qu, D.; Zhao, H.; Guan, X.; Hu, X.; Xie, Z.; Jing, X.; Sun, Z. Integrating Oxaliplatin with Highly Luminescent Carbon Dots: An Unprecedented Theranostic Agent for Personalized Medicine. Adv. Mater. 2014, 26, 3554–3560. [Google Scholar] [CrossRef]
- Yuan, Y.; Guo, B.; Hao, L.; Liu, N.; Lin, Y.; Guo, W.; Li, X. Doxorubicin-loaded environmentally friendly carbon dots as a novel drug delivery system for nucleus targeted cancer therapy. Colloids Surfaces B Biointerfaces 2017, 159, 349–359. [Google Scholar] [CrossRef]
- D’Souza, S.L.; Deshmukh, B.; Bhamore, J.R.; Rawat, K.A.; Lenka, N.; Kailasa, S.K. Synthesis of fluorescent nitrogen-doped carbon dots from dried shrimps for cell imaging and boldine drug delivery system. RSC Adv. 2016, 6, 12169–12179. [Google Scholar] [CrossRef]
- Mehta, V.N.; Chettiar, S.S.; Bhamore, J.R.; Kailasa, S.K.; Patel, R.M. Green Synthetic Approach for Synthesis of Fluorescent Carbon Dots for Lisinopril Drug Delivery System and their Confirmations in the Cells. J. Fluoresc. 2017, 27, 111–124. [Google Scholar] [CrossRef] [PubMed]
- Wang, C.; Pan, C.; Wei, X.; Yang, F.; Wu, W.; Mao, L. Emissive carbon dots derived from natural liquid fuels and its biological sensing for copper ions. Talanta 2020, 208, 120375. [Google Scholar] [CrossRef] [PubMed]
- Radhakrishnan, K.; Sivanesan, S.; Panneerselvam, P. Turn-On fluorescence sensor based detection of heavy metal ion using carbon dots@graphitic-carbon nitride nanocomposite probe. J. Photochem. Photobiol. A Chem. 2020, 389, 112204. [Google Scholar] [CrossRef]
- Brachi, P. Synthesis of fluorescent carbon quantum dots (CQDs) through the mild thermal treatment of agro-industrial residues assisted by γ-alumina. Biomass Convers. Biorefinery 2020, 10, 1301–1312. [Google Scholar] [CrossRef]
- Luo, X.; Han, Y.; Chen, X.; Tang, W.; Yue, T.; Li, Z. Carbon dots derived fluorescent nanosensors as versatile tools for food quality and safety assessment: A review. Trends Food Sci. Technol. 2020, 95, 149–161. [Google Scholar] [CrossRef]
- Bui, T.T.; Park, S.-Y. A carbon dot–hemoglobin complex-based biosensor for cholesterol detection. Green Chem. 2016, 18, 4245–4253. [Google Scholar] [CrossRef]
- Pirsaheb, M.; Mohammadi, S.; Salimi, A. Current advances of carbon dots based biosensors for tumor marker detection, cancer cells analysis and bioimaging. TrAC Trends Anal. Chem. 2019, 115, 83–99. [Google Scholar] [CrossRef]
- Chen, Z.-H.; Han, X.-Y.; Deng, L.-X.; Lin, Z.-Y.; Mu, F.-Y.; Zhang, S.; Shi, G.; Zhang, M. A self-calibrating logic system and oxidase-based biosensor using Tb3+-doped carbon dots/DNA conjugates. Talanta 2019, 191, 235–240. [Google Scholar] [CrossRef] [PubMed]
- Bhattacharyya, D.; Sarswat, P.K.; Free, M.L. Quantum dots and carbon dots based fluorescent sensors for TB biomarkers detection. Vacuum 2017, 146, 606–613. [Google Scholar] [CrossRef]
- He, L.; Yang, Y.; Kim, J.; Yao, L.; Dong, X.; Li, T.; Piao, Y. Multi-layered enzyme coating on highly conductive magnetic biochar nanoparticles for bisphenol A sensing in water. Chem. Eng. J. 2020, 384, 123276. [Google Scholar] [CrossRef]
- Liu, M.L.; Bin Chen, B.; He, J.H.; Li, C.M.; Li, Y.F.; Huang, C.Z. Anthrax biomarker: An ultrasensitive fluorescent ratiometry of dipicolinic acid by using terbium(III)-modified carbon dots. Talanta 2019, 191, 443–448. [Google Scholar] [CrossRef]
- Spanu, D.; Binda, G.; Dossi, C.; Monticelli, D. Biochar as an alternative sustainable platform for sensing applications: A review. Microchem. J. 2020, 159, 105506. [Google Scholar] [CrossRef]
- Liu, H.; Ding, J.; Zhang, K.; Ding, L. Construction of biomass carbon dots based fluorescence sensors and their applications in chemical and biological analysis. TrAC Trends Anal. Chem. 2019, 118, 315–337. [Google Scholar] [CrossRef]
- Brachi, P. Synthesis of carbon dots (CDs) through the fluidized bed thermal treatment of residual biomass assisted by γ-alumina. Appl. Catal. B Environ. 2020, 263, 118361. [Google Scholar] [CrossRef]
- Pooja, D.; Singh, L.; Thakur, A.; Kumar, P. Green synthesis of glowing carbon dots from Carica papaya waste pulp and their application as a label-freechemo probe for chromium detection in water. Sens. Actuators B Chem. 2019, 283, 363–372. [Google Scholar] [CrossRef]
- Hardman, R. A Toxicologic Review of Quantum Dots: Toxicity Depends on Physicochemical and Environmental Factors. Environ. Health Perspect. 2006, 114, 165–172. [Google Scholar] [CrossRef]
- Oberdörster, G.; Oberdörster, E.; Oberdörster, J. Nanotoxicology: An Emerging Discipline Evolving from Studies of Ultrafine Particles. Environ. Health Perspect. 2005, 113, 823–839. [Google Scholar] [CrossRef] [PubMed]
- Chunying, C.; Haifang, W. Biomedical Applications and Toxicology of Carbon Nanomaterials; John Wiley & Sons: Hoboken, NJ, USA, 2016. [Google Scholar]
- Wang, F.; Chen, P.; Feng, Y.; Xie, Z.; Liu, Y.; Su, Y.; Zhang, Q.; Wang, Y.; Yao, K.; Lv, W.; et al. Facile synthesis of N-doped carbon dots/g-C3N4 photocatalyst with enhanced visible-light photocatalytic activity for the degradation of indomethacin. Appl. Catal. B Environ. 2017, 207, 103–113. [Google Scholar] [CrossRef]
- Farre, M.; Gajda-Schrantz, K.; Kantiani, L.; Barceló, D. Ecotoxicity and analysis of nanomaterials in the aquatic environment. Anal. Bioanal. Chem. 2008, 393, 81–95. [Google Scholar] [CrossRef]
- Jahan, S.; Bin Yusoff, I.; Alias, Y.B.; Bin Abu Bakar, A.F. Reviews of the toxicity behavior of five potential engineered nanomaterials (ENMs) into the aquatic ecosystem. Toxicol. Rep. 2017, 4, 211–220. [Google Scholar] [CrossRef] [PubMed]
- Rana, S.; Kalaichelvan, P.T. Ecotoxicity of Nanoparticles. ISRN Toxicol. 2013, 2013, 574648. [Google Scholar] [CrossRef] [Green Version]
- Díaz, L.C.; Pino, N.; Peñuela, G. Biochar from oil palm waste as an amendment for the remediation of soil disturbed by open-cast coal mining. Glob. Adv. Res. J. Eng. Technol. Innov. 2016, 5, 17–22. [Google Scholar]
- Erzinger, G.S.; Schmoeller, F.; Pinto, L.H.; Américo, L.; Hemmersbach, R.; Hauslage, J.; Häder, D.-P. Bioluminescence systems in environmental biosensors. In Bioassays; Elsevier: Amsterdam, The Netherlands, 2017; pp. 242–262. [Google Scholar] [CrossRef]
- Environmental Technology Centre. Biological Test Method: Reference Method for Determining the Toxicity of Sediment using Luminescent Bacteria in a Solid-Phase Test; Report EPS 1/RM/42; Environmental Technology Centre: Ottawa, ON, Canada, 2002; ISBN 0-660-18911-9.
- ASTM (American Society for Testing and Materials). Standard Guide for Conducting Sediment Toxicity Tests with Luminescent Bacteria; Draft No. 8; ASTM: Philadelphia, PA, USA, 1995. [Google Scholar]
- Panahi, H.K.S.; Dehhaghi, M.; Ok, Y.S.; Nizami, A.-S.; Khoshnevisan, B.; Mussatto, S.I.; Aghbashlo, M.; Tabatabaei, M.; Lam, S.S. A comprehensive review of engineered biochar: Production, characteristics, and environmental applications. J. Clean. Prod. 2020, 270, 122462. [Google Scholar] [CrossRef]
- Zhao, B.; Xu, H.; Zhang, T.; Nan, X.; Ma, F. Effect of pyrolysis temperature on sulfur content, extractable fraction and release of sulfate in corn straw biochar. RSC Adv. 2018, 8, 35611–35617. [Google Scholar] [CrossRef] [Green Version]
- Zheng, H.; Wang, Z.; Deng, X.; Zhao, J.; Luo, Y.; Novak, J.; Herbert, S.; Xing, B. Characteristics and nutrient values of biochars produced from giant reed at different temperatures. Bioresour. Technol. 2013, 130, 463–471. [Google Scholar] [CrossRef]
- Cheah, S.; Malone, S.C.; Feik, C.J. Speciation of Sulfur in Biochar Produced from Pyrolysis and Gasification of Oak and Corn Stover. Environ. Sci. Technol. 2014, 48, 8474–8480. [Google Scholar] [CrossRef] [Green Version]
- Palviainen, M.; Berninger, F.; Bruckman, V.J.; Köster, K.; de Assumpção, C.R.M.; Aaltonen, H.; Makita, N.; Mishra, A.; Kulmala, L.; Adamczyk, B.; et al. Effects of biochar on carbon and nitrogen fluxes in boreal forest soil. Plant Soil 2018, 425, 71–85. [Google Scholar] [CrossRef] [Green Version]
- Cantrell, K.B.; Hunt, P.G.; Uchimiya, M.; Novak, J.M.; Ro, K. Impact of pyrolysis temperature and manure source on physicochemical characteristics of biochar. Bioresour. Technol. 2012, 107, 419–428. [Google Scholar] [CrossRef] [PubMed]
- Nguyen, T.T.N.; Wallace, H.; Xu, C.-Y.; van Zwieten, L.; Weng, Z.H.; Xu, Z.; Che, R.; Tahmasbian, I.; Hu, H.-W.; Bai, S.H. The effects of short term, long term and reapplication of biochar on soil bacteria. Sci. Total Environ. 2018, 636, 142–151. [Google Scholar] [CrossRef] [PubMed]
- Abujabhah, I.S.; Doyle, R.; Bound, S.A.; Bowman, J. The effect of biochar loading rates on soil fertility, soil biomass, potential nitrification, and soil community metabolic profiles in three different soils. J. Soils Sediments 2016, 16, 2211–2222. [Google Scholar] [CrossRef]
- Agegnehu, G.; Nelson, P.; Bird, M.I. Crop yield, plant nutrient uptake and soil physicochemical properties under organic soil amendments and nitrogen fertilization on Nitisols. Soil Tillage Res. 2016, 160. [Google Scholar] [CrossRef]
- Agegnehu, G.; Nelson, P.; Bird, M.I. The effects of biochar, compost and their mixture and nitrogen fertilizer on yield and nitrogen use efficiency of barley grown on a Nitisol in the highlands of Ethiopia. Sci. Total Environ. 2016, 569, 869–879. [Google Scholar] [CrossRef]
- Agegnehu, G.; Bass, A.M.; Nelson, P.; Bird, M.I. Benefits of biochar, compost and biochar–compost for soil quality, maize yield and greenhouse gas emissions in a tropical agricultural soil. Sci. Total Environ. 2016, 543, 295–306. [Google Scholar] [CrossRef] [PubMed]
- Prakongkep, N.; Gilkes, R.J.; Wiriyakitnateekul, W. Forms and solubility of plant nutrient elements in tropical plant waste biochars. J. Plant Nutr. Soil Sci. 2015, 178, 732–740. [Google Scholar] [CrossRef]
- Hossain, Z.; Bahar, M.; Sarkar, B.; Donne, S.W.; Ok, Y.S.; Palansooriya, K.N.; Kirkham, M.B.; Chowdhury, S.; Bolan, N. Biochar and its importance on nutrient dynamics in soil and plant. Biochar 2020, 2, 379–420. [Google Scholar] [CrossRef]
- Brennan, J.K.; Bandosz, T.J.; Thomson, K.T.; Gubbins, K.E. Water in porous carbons. Colloids Surfaces A Physicochem. Eng. Asp. 2001, 187, 539–568. [Google Scholar] [CrossRef]
- Liu, G.; Li, S.; Cheng, M.; Zhao, L.; Zhang, B.; Gao, Y.; Xu, Y.; Liu, F.; Lu, G. Facile synthesis of nitrogen and sulfur co-doped carbon dots for multiple sensing capacities: Alkaline fluorescence enhancement effect, temperature sensing, and selective detection of Fe3+ ions. New J. Chem. 2018, 42, 13147–13156. [Google Scholar] [CrossRef]
- Xu, Q.; Kuang, T.; Liu, Y.; Cai, L.; Peng, X.; Sreeprasad, T.S.; Zhao, P.; Yu, Z.; Li, N. Heteroatom-doped carbon dots: Synthesis, characterization, properties, photoluminescence mechanism and biological applications. J. Mater. Chem. B 2016, 4, 7204–7219. [Google Scholar] [CrossRef]
- Suárez-Hernández, L.; Barrera-Zapata, R. Morphological and physicochemical characterization of biochar produced by gasification of selected forestry species. Rev. Fac. Ing. 2017, 26, 123–130. [Google Scholar] [CrossRef] [Green Version]
- Shaaban, A.; Se, S.M.; Dimin, M.F.; Juoi, J.M.; Husin, M.H.M.; Mitan, N.M.M. Influence of heating temperature and holding time on biochars derived from rubber wood sawdust via slow pyrolysis. J. Anal. Appl. Pyrolysis. 2014, 107, 31–39. [Google Scholar] [CrossRef]
- Zhao, S.X.; Ta, N.; Wang, X.D. Effect of temperature on the structural and physicochemical properties of biochar with apple tree branches as feedstock material. Energies 2017, 10, 1293. [Google Scholar] [CrossRef] [Green Version]
- Gámiz, B.; Hall, K.; Spokas, K.A.; Cox, L. Understanding activation effects on low-temperature biochar for optimization of herbicide sorption. Agronomy 2019, 9, 588. [Google Scholar] [CrossRef] [Green Version]
- Brewer, C.E. Biochar Characterization and Engineering. Ph.D. Thesis, Digital Repository, Iowa State University, Ames, IA, USA, 2012. [Google Scholar] [CrossRef]
- Liu, Q.; Wang, S.; Zheng, Y.; Luo, Z.; Cen, K. Mechanism study of wood lignin pyrolysis by using TG-FTIR analysis. J. Anal. Appl. Pyrolysis. 2008, 82, 170–177. [Google Scholar] [CrossRef]
- Yang, T.; Lua, A.C. Characteristics of activated carbons prepared from pistachio-nut shells by physical activation. J. Colloid Interface Sci. 2003, 267, 408–417. [Google Scholar] [CrossRef]
- Chemerys, V.; Baltrėnaitė, E. Influence of Intrinsic Properties of Lignocellulosic Feedstock on Adsorptive Properties of Biochar. J. Environ. Eng. 2018, 144. [Google Scholar] [CrossRef]
- Kołodyńska, D.; Bąk, J.; Kozioł, M.; Pylypchuk, L.V. Investigations of Heavy Metal Ion Sorption Using Nanocomposites of Iron-Modified Biochar. Nanoscale Res. Lett. 2017, 12. [Google Scholar] [CrossRef] [Green Version]
- Jouiad, M.; Al-Nofeli, N.; Khalifa, N.; Benyettou, F.; Yousef, L.F. Characteristics of slow pyrolysis biochars produced from rhodes grass and fronds of edible date palm. J. Anal. Appl. Pyrolysis. 2015, 111, 183–190. [Google Scholar] [CrossRef] [Green Version]
- Tang, Y.; Alam, M.S.; Konhauser, K.O.; Alessi, D.S.; Xu, S.; Tian, W.J.; Liu, Y. Influence of pyrolysis temperature on production of digested sludge biochar and its application for ammonium removal from municipal wastewater. J. Clean. Prod. 2019, 209, 927–936. [Google Scholar] [CrossRef]
- Zuo, P.; Lu, X.; Sun, Z.; Guo, Y.; He, H. A review on syntheses, properties, characterization and bioanalytical applications of fluorescent carbon dots. Microchim. Acta 2016, 183, 519–542. [Google Scholar] [CrossRef]
- Mei, S.; Wei, X.; Hu, Z.; Wei, C.; Su, D.; Yang, D.; Zhang, G.; Zhang, W.; Guo, R. Amphipathic carbon dots with solvent-dependent optical properties and sensing application. Opt. Mater. 2019, 89, 224–230. [Google Scholar] [CrossRef]
- Wei, X.; Mei, S.; Yang, D.; Zhang, G.; Xie, F.; Zhang, W.; Guo, R. Surface States Induced Photoluminescence Enhancement of Nitrogen-Doped Carbon Dots via Post-Treatments. Nanoscale Res. Lett. 2019, 14, 172. [Google Scholar] [CrossRef]
- Chao, D.; Lyu, W.; Liu, Y.; Zhou, L.; Zhang, Q.; Deng, R.; Zhang, H. Solvent-dependent carbon dots and their applications in the detection of water in organic solvents. J. Mater. Chem. C 2018, 6, 7527–7532. [Google Scholar] [CrossRef]
- Zhang, L.; Liu, W.; Zhuang, H.; Zhang, J.; Chen, C.; Wang, Y.; Shan, S. Environmentally friendly synthesis of photoluminescent biochar dots from waste soy residues for rapid monitoring of potentially toxic elements. RSC Adv. 2019, 9, 21653–21659. [Google Scholar] [CrossRef] [Green Version]
- Prekodravac, J.; Vasiljević, B.; Marković, Z.; Jovanović, D.; Kleut, D.; Špitalský, Z.; Mičušik, M.; Danko, M.; Bajuk-Bogdanović, D.; Todorović-Marković, B. Green and facile microwave assisted synthesis of (metal-free) N-doped carbon quantum dots for catalytic applications. Ceram. Int. 2019, 45, 17006–17013. [Google Scholar] [CrossRef]
- Ju, J.; Zhang, R.; He, S.; Chen, W. Nitrogen-doped graphene quantum dots-based fluorescent probe for the sensitive turn-on detection of glutathione and its cellular imaging. RSC Adv. 2014, 4, 52583–52589. [Google Scholar] [CrossRef]
- Villanueva, F.Y.; Manioudakis, J.; Naccache, R.; Majewski, M.B. Carbon Dot-Sensitized Photoanodes for Visible Light-Driven Organic Transformations. ACS Appl. Nano Mater. 2020, 3, 2756–2765. [Google Scholar] [CrossRef]
- Dastidar, D.G.; Mukherjee, P.; Ghosh, D.; Banerjee, D. Carbon quantum dots prepared from onion extract as fluorescence turn-on probes for selective estimation of Zn2+ in blood plasma. Colloids Surfaces A Physicochem. Eng. Asp. 2021, 611, 125781. [Google Scholar] [CrossRef]
- Dager, A.; Uchida, T.; Maekawa, T.; Tachibana, M. Synthesis and characterization of Mono-disperse Carbon Quantum Dots from Fennel Seeds: Photoluminescence analysis using Machine Learning. Sci. Rep. 2019, 9. [Google Scholar] [CrossRef] [PubMed]
- Ţucureanu, V.; Matei, A.; Avram, A.M. FTIR Spectroscopy for Carbon Family Study. Crit. Rev. Anal. Chem. 2016, 46, 502–520. [Google Scholar] [CrossRef]
- Kuo, T.R.; Sung, S.Y.; Hsu, C.W.; Chang, C.J.; Chiu, T.C.; Hu, C.C. One-pot green hydrothermal synthesis of fluorescent nitrogen-doped carbon nanodots for in vivo bioimaging. Anal. Bioanal. Chem. 2016, 408, 77–82. [Google Scholar] [CrossRef] [PubMed]
- Pham-Truong, T.N.; Ranjan, C.; Randriamahazaka, H.; Ghilane, J. Nitrogen doped carbon dots embedded in poly(ionic liquid) as high efficient metal-free electrocatalyst for oxygen reduction reaction. Catal. Today 2019, 335, 381–387. [Google Scholar] [CrossRef]
- Mehta, V.N.; Jha, S.; Kumar, S. One-pot green synthesis of carbon dots by using Saccharum of fi cinarum juice for fl uorescent imaging of bacteria (Escherichia coli) and yeast (Saccharomyces cerevisiae) cells. Mater. Sci. Eng. C 2014, 38, 20–27. [Google Scholar] [CrossRef]
- Thambiraj, S.; Shankaran, D.R. Green synthesis of highly fluorescent carbon quantum dots from sugarcane bagasse pulp. Appl. Surf. Sci. 2016, 390, 435–443. [Google Scholar] [CrossRef]
- Liu, H.; He, Z.; Jiang, L.P.; Zhu, J.J. Microwave-assisted synthesis of wavelength-tunable photoluminescent carbon nanodots and their potential applications. ACS Appl. Mater. Interfaces 2015, 7, 4913–4920. [Google Scholar] [CrossRef] [PubMed]
- Liu, M.L.; Yang, L.; Li, R.S.; Chen, B.B.; Liu, H.; Huang, C.Z. Large-scale simultaneous synthesis of highly photoluminescent green amorphous carbon nanodots and yellow crystalline graphene quantum dots at room temperature. Green Chem. 2017, 19, 3611–3617. [Google Scholar] [CrossRef]
- Zhu, S.; Meng, Q.; Wang, L.; Zhang, J.; Song, Y.; Jin, H.; Zhang, K.; Sun, H.; Wang, H.; Yang, B. Highly photoluminescent carbon dots for multicolor patterning, sensors, and bioimaging. Angew. Chem. Int. Ed. 2013, 52, 3953–3957. [Google Scholar] [CrossRef] [PubMed]
- Shen, D.; Long, Y.; Wang, J.; Yu, Y.; Pi, J.; Yang, L.; Zheng, H. Tuning the fluorescence performance of carbon dots with a reduction pathway. Nanoscale 2019, 11, 5998–6003. [Google Scholar] [CrossRef]
- Zhang, Y.; Yuan, R.; He, M.; Hu, G.; Jiang, J.; Xu, T.; Zhou, L.; Chen, W.; Xiang, W.; Liang, X. Multicolour nitrogen-doped carbon dots: Tunable photoluminescence and sandwich fluorescent glass-based light-emitting diodes. Nanoscale 2017, 9, 17849–17858. [Google Scholar] [CrossRef] [PubMed]
- Wang, L.; Zhu, S.J.; Wang, H.Y.; Qu, S.N.; Zhang, Y.L.; Zhang, J.H.; Chen, Q.D.; Xu, H.L.; Han, W.; Yang, B.; et al. Common origin of green luminescence in carbon nanodots and graphene quantum dots. ACS Nano 2014, 8, 2541–2547. [Google Scholar] [CrossRef] [PubMed]
- Moradi, S.; Sadrjavadi, K.; Farhadian, N.; Hosseinzadeh, L.; Shahlaei, M. Easy synthesis, characterization and cell cytotoxicity of green nano carbon dots using hydrothermal carbonization of Gum Tragacanth and chitosan bio-polymers for bioimaging. J. Mol. Liq. 2018, 259, 284–290. [Google Scholar] [CrossRef]
- Zhang, Q.; Xie, S.; Yang, Y.; Wu, Y.; Wang, X.; Wu, J.; Zhang, L.; Chen, J.; Wang, Y. A facile synthesis of highly nitrogen-doped carbon dots for imaging and detection in biological samples. J. Anal. Methods Chem. 2018, 2018. [Google Scholar] [CrossRef] [Green Version]
- Zhang, J.; Yang, L.; Yuan, Y.; Jiang, J.; Yu, S.H. One-Pot Gram-Scale Synthesis of Nitrogen and Sulfur Embedded Organic Dots with Distinctive Fluorescence Behaviors in Free and Aggregated States. Chem. Mater. 2016, 28, 4367–4374. [Google Scholar] [CrossRef]
- Chen, W.; Li, D.; Tian, L.; Xiang, W.; Wang, T.; Hu, W.; Hu, Y.; Chen, S.; Chen, J.; Dai, Z. Synthesis of graphene quantum dots from natural polymer starch for cell imaging. Green Chem. 2018, 20, 4438–4442. [Google Scholar] [CrossRef]
- Ramanan, V.; Thiyagarajan, S.K.; Raji, K.; Suresh, R.; Sekar, R.; Ramamurthy, P. Outright green synthesis of fluorescent carbon dots from eutrophic algal blooms for in vitro imaging. ACS Sustain. Chem. Eng. 2016, 4, 4724–4731. [Google Scholar] [CrossRef]
- Zhang, J.; Liu, X.; Zhou, J.; Huang, X.; Xie, D.; Ni, J.; Ni, C. Carbon dots derived from algae as H2O2 sensors: The importance of nutrients in biomass. Nanoscale Adv. 2019, 1, 2151–2156. [Google Scholar] [CrossRef] [Green Version]
- Liu, H.; Li, Z.; Sun, Y.; Geng, X.; Hu, Y.; Meng, H.; Ge, J.; Qu, L. Synthesis of Luminescent Carbon Dots with Ultrahigh Quantum Yield and Inherent Folate Receptor-Positive Cancer Cell Targetability. Sci. Rep. 2018, 8. [Google Scholar] [CrossRef] [Green Version]
- Shen, L.; Zhang, L.; Chen, M.; Chen, X.; Wang, J. The production of pH-sensitive photoluminescent carbon nanoparticles by the carbonization of polyethylenimine and their use for bioimaging. Carbon 2013, 55, 343–349. [Google Scholar] [CrossRef]
- Wang, S.; Niu, H.; He, S.; Cai, Y. One-step fabrication of high quantum yield sulfur- and nitrogen-doped carbon dots for sensitive and selective detection of Cr(vi). RSC Adv. 2016, 6, 107717–107722. [Google Scholar] [CrossRef]
- Huang, Q.; Li, Q.; Chen, Y.; Tong, L.; Lin, X.; Zhu, J.; Tong, Q. High quantum yield nitrogen-doped carbon dots: Green synthesis and application as “off-on” fluorescent sensors for the determination of Fe3+ and adenosine triphosphate in biological samples. Sensors Actuators B Chem. 2018, 276, 82–88. [Google Scholar] [CrossRef]
- Li, M.; Yu, C.; Hu, C.; Yang, W.; Zhao, C.; Wang, S.; Zhang, M.; Zhao, J.; Wang, X.; Qiu, J. Solvothermal conversion of coal into nitrogen-doped carbon dots with singlet oxygen generation and high quantum yield. Chem. Eng. J. 2017, 320, 570–575. [Google Scholar] [CrossRef]
- Wang, Y.; Xia, Y. Optical, electrochemical and catalytic methods for in-vitro diagnosis using carbonaceous nanoparticles: A review. Microchim. Acta 2019, 186, 50. [Google Scholar] [CrossRef]
- Xu, Q.; Li, B.; Ye, Y.; Cai, W.; Li, W.; Yang, C.; Chen, Y.; Xu, M.; Li, N.; Zheng, X.; et al. Synthesis, mechanical investigation, and application of nitrogen and phosphorus co-doped carbon dots with a high photoluminescent quantum yield. Nano Res. 2018, 11, 3691–3701. [Google Scholar] [CrossRef]
- Dong, Y.; Pang, H.; Bin Yang, H.; Guo, C.; Shao, J.; Chi, Y.; Li, C.M.; Yu, T. Carbon-Based Dots Co-doped with Nitrogen and Sulfur for High Quantum Yield and Excitation-Independent Emission. Angew. Chem. Int. Ed. 2013, 52, 7800–7804. [Google Scholar] [CrossRef]
- Ding, H.; Wei, J.-S.; Xiong, H.-M. Nitrogen and sulfur co-doped carbon dots with strong blue luminescence. Nanoscale 2014, 6, 13817–13823. [Google Scholar] [CrossRef] [PubMed]
- Qin, X.; Lu, W.; Asiri, A.M.; Al-Youbi, A.O.; Sun, X. Green, low-cost synthesis of photoluminescent carbon dots by hydrothermal treatment of willow bark and their application as an effective photocatalyst for fabricating Au nanoparticles–reduced graphene oxide nanocomposites for glucose detection. Catal. Sci. Technol. 2013, 3, 1027. [Google Scholar] [CrossRef]
- Lu, W.; Qin, X.; Liu, S.; Chang, G.; Zhang, Y.; Luo, Y.; Asiri, A.M.; Al-Youbi, A.O.; Sun, X. Economical, Green Synthesis of Fluorescent Carbon Nanoparticles and Their Use as Probes for Sensitive and Selective Detection of Mercury(II) Ions. Anal. Chem. 2012, 84, 5351–5357. [Google Scholar] [CrossRef] [PubMed]
- Zhao, X.J.; Zhang, W.L.; Zhou, Z.Q. Sodium hydroxide-mediated hydrogel of citrus pectin for preparation of fluorescent carbon dots for bioimaging. Colloids Surfaces B Biointerfaces 2014, 123, 493–497. [Google Scholar] [CrossRef] [PubMed]
- Feng, X.; Jiang, Y.; Zhao, J.; Miao, M.; Cao, S.; Fang, J.; Shi, L. Easy synthesis of photoluminescent N-doped carbon dots from winter melon for bio-imaging. RSC Adv. 2015, 5, 31250–31254. [Google Scholar] [CrossRef]
- Hsu, P.-C.; Shih, Z.-Y.; Lee, C.-H.; Chang, H.-T. Synthesis and analytical applications of photoluminescent carbon nanodots. Green Chem. 2012, 14, 917–920. [Google Scholar] [CrossRef]
- Niemirycz, E.; Nichthauser, J.; Staniszewska, M.; Nałęcz-Jawecki, G.; Bolałek, J. The Microtox® biological test: Application in toxicity evaluation of surface waters and sediments in Poland. Oceanol. Hydrobiol. Stud. 2007, 36, 151–163. [Google Scholar] [CrossRef]
- EPA’s Science Policy Council. Nanotechnology White Paper. EPA 100/B-07/001; EPA’s Science Policy Council: Washington, DC, USA, 2007. Available online: www.epa.gov/osa (accessed on 11 June 2021).
- Savolainen, K.; Backman, U.; Brouwer, D.; Fadeel, B.; Fernandes, T.; Kuhlbusch, T.; Landsiedel, R.; Lynch, I.; Pylkkanen, L. Nanosafety in Europe 2015–2025: Towards Safe and Sustainable Nanomaterials and Nanotechnology Innovations; Finnish Institute of Occupational Health: Helsinki, Finland, 2013.
- Saleh, T.A. Nanomaterials: Classification, properties, and environmental toxicities. Environ. Technol. Innov. 2020, 20, 101067. [Google Scholar] [CrossRef]
- Alas, M.O.; Alkas, F.B.; Sukuroglu, A.A.; Alturk, R.G.; Battal, D. Fluorescent carbon dots are the new quantum dots: An overview of their potential in emerging technologies and nanosafety. J. Mater. Sci. 2020, 55, 15074–15105. [Google Scholar] [CrossRef]
- Yao, K.; Lv, X.; Zheng, G.; Chen, Z.; Jiang, Y.; Zhu, X.; Wang, Z.; Cai, Z. Effects of Carbon Quantum Dots on Aquatic Environments: Comparison of Toxicity to Organisms at Different Trophic Levels. Environ. Sci. Technol. 2018, 52, 14445–14451. [Google Scholar] [CrossRef]


| Parameter | Picea | Molinia caerulea | Elaeis guineensis |
|---|---|---|---|
| pH | 8.9 | 9.58 | 8.26 |
| % N (total organic) | 0.29 | 3.42 | 0.2 |
| % S (total) | 0.43 | 1.46 | 1.5 |
| % Ash | - | 6.80 | 11.1 |
| Source | [59] | This work | This work |
| Carbon Precursor | (nm) | QY% | Reference |
|---|---|---|---|
| Willow Bark | 360 | 6 | [118] |
| Pomelo peel | 360 | 6.9 | [119] |
| Citrus pectin | 360 | 1.1 | [120] |
| Sugarcane juice | 390 | 5.67 | [95] |
| Winter melon | 360 | 7.51 | [121] |
| Coffee beans | 365 | 3.80 | [122] |
| Picea | 310 | 5.44 | This work |
| Molinia caerulea | 320 | 8.39 | This work |
| Elaeis guineensis | 310 | 2.31 | This work |
Publisher’s Note: MDPI stays neutral with regard to jurisdictional claims in published maps and institutional affiliations. |
© 2021 by the authors. Licensee MDPI, Basel, Switzerland. This article is an open access article distributed under the terms and conditions of the Creative Commons Attribution (CC BY) license (https://creativecommons.org/licenses/by/4.0/).
Share and Cite
Barrientos, K.; Gaviria, M.I.; Arango, J.P.; Placido, J.; Bustamante, S.; Londoño, M.E.; Jaramillo, M. Synthesis, Characterization and Ecotoxicity Evaluation of Biochar-Derived Carbon Dots from Spruce Tree, Purple Moor-Grass and African Oil Palm. Processes 2021, 9, 1095. https://doi.org/10.3390/pr9071095
Barrientos K, Gaviria MI, Arango JP, Placido J, Bustamante S, Londoño ME, Jaramillo M. Synthesis, Characterization and Ecotoxicity Evaluation of Biochar-Derived Carbon Dots from Spruce Tree, Purple Moor-Grass and African Oil Palm. Processes. 2021; 9(7):1095. https://doi.org/10.3390/pr9071095
Chicago/Turabian StyleBarrientos, Kaory, Maria I. Gaviria, Juan Pablo Arango, Jersson Placido, Sandra Bustamante, Martha E. Londoño, and Marisol Jaramillo. 2021. "Synthesis, Characterization and Ecotoxicity Evaluation of Biochar-Derived Carbon Dots from Spruce Tree, Purple Moor-Grass and African Oil Palm" Processes 9, no. 7: 1095. https://doi.org/10.3390/pr9071095