
R-CNN-Based Large-Scale Object-Defect Inspection System for Laser Cutting in the Automotive Industry


Department of Smart Factory Convergence, Sungkyunkwan University, 2066 Seobu-ro, Jangan-gu, Suwon 16419, Korea
*
Author to whom correspondence should be addressed.
Processes 2021, 9(11), 2043; https://doi.org/10.3390/pr9112043
Submission received: 15 October 2021
/
Revised: 8 November 2021
/
Accepted: 10 November 2021
/
Published: 15 November 2021
(This article belongs to the Special Issue Process Monitoring and Fault Diagnosis)
Abstract
:A car side-outer is an iron mold that is applied in the design and safety of the side of a vehicle, and is subjected to a complicated and detailed molding process. The side-outer has three features that make its quality inspection difficult to automate: (1) it is large; (2) there are many objects to inspect; and (3) it must fulfil high-quality requirements. Given these characteristics, the industrial vision system for the side-outer is nearly impossible to apply, and indeed there is no reference for an automated defect-inspection system for the side-outer. Manual inspection of the side-outer worsens the quality and cost competitiveness of the metal-cutting companies. To address these problems, we propose a large-scale Object-Defect Inspection System based on Regional Convolutional Neural Network (R-CNN; RODIS) using Artificial Intelligence (AI) technology. In this paper, we introduce the framework, including the hardware composition and the inspection method of RODIS. We mainly focus on creating the proper dataset on-site, which should be prepared for data analysis and model development. Additionally, we share the trial-and-error experiences gained from the actual installation of RODIS on-site. We explored and compared various R-CNN backbone networks for object detection using actual data provided by a laser-cutting company. The Mask R-CNN models using Res-net-50-FPN show Average Precision (AP) of 71.63 (Object Detection) and 86.21 (Object Seg-mentation), which indicates a better performance than that of other models.
1. Introduction
In the automotive industry, a side-outer is an iron mold that is applied to a vehicle’s design and safety by means of a complicated and detailed molding process. A side collision is the type of car accident that most significantly threatens drivers’ safety. The Insurance Institute for Highway Safety (IIHS) statistics indicate that 5350 deaths were caused by side collisions in 2018 alone, accounting for 23% of all automobile deaths that year [1]. To protect drivers from the side collisions, the side-outer uses a hot stamping of Press Hardened Steel (PHS). Hot stamping is a technique that makes light and strong parts by placing steel materials heated to more than 950 °C into the press and then cooling them rapidly with a hot stamping technique of more than 1500 MPa or more [2]. Thus, the side-outer is not processed by the commonly used press manufacturing, but by three-dimensional (3D) laser-cutting. “Telstar”, a laser-cutting company located in Gyeongju City, Republic of Korea, uses 3D laser-cutting machines to pierce and trim the side-outer. The side-outer has three characteristics that make it challenging to automate its defect inspection. First, the size of the product is large. The side-outer is about 1.6 m wide and about 1.4 m deep. Large products limit the use of vision systems that are conventionally applied in manufacturing-defect inspections. The biggest challenge is the image distortion that grows proportionally with size. Typical lens distortions are both radial and tangential [3]. Although a large side-outer requires a wide field of view (FoV) to be filmed, lenses with a wide field of view typically have severe distortion because of their Cubic Field Dependency [4]. This image distortion can be improved by expanding the Working Distance (WD) between the target object and the lens to increase the focal distance and eliminate the perspective by using a telecentric lens [5]. However, telecentric lenses are more expensive than regular lenses. The lenses’ size also increases proportionally to the object, resulting in huge investment costs. Second, the side-outer has numerous inspection points. The side-outer is pierced and trimmed by a 3D laser-cutting machine. There are 50 processing points for the side-outer. At Telstar, the entire process for manufacturing the side-outer is automated. It takes 120 s to transport, process, and inspect a single product. Considering the cycle-time, it takes roughly 30 s for the inspection, which means that only 0.6 s of inspection time can be allocated to inspect each point. Third, the quality required for the side-outer is high and differs from point to point. Some processing points, such as the path for wire cables, require only relatively low quality. However, some machining points play a vital role in assembly, and require a high machining quality up to 20 μm.
Because of the three characteristics of the side-outer mentioned above, the application of automated defects inspection by means of the commonly used industrial vision system is nearly impossible. A vision system in a factory automates production work by analyzing images obtained from cameras. A stand-alone vision system is commonly used in the manufacturing industry. This includes components (cameras, lenses, software, controllers, lighting, etc.) necessary for vision inspection. It has the advantage of being able to be easily activated and applied by adjusting some parameters, but it has limited hardware and software specifications in use. The requirements for the design and development of a successful machine vision system depends on the application domain [6]. For the side-outer, it is nearly impossible to apply a stand-alone vision system because of its characteristics, as mentioned above. At Telstar, the full precise inspection of the side-outer is conducted by operators with the help of an inspection jig. The sampling quality control restricts Telstar from tracking and tracing every product, undermining the quality and cost competitiveness.
The side-outer is a steel mold and has the defects of the steel product, which are often caused by the poor quality of materials, external forces, and equipment abnormalities [7]. Steel surface-defect inspection has been actively researched, and the conducted studies mainly focus on regional proposals and classification. One of the conventional regional proposal methods is the Ostu threshold segmentation based on the watershed algorithm [8]. By comparison, for extracting features, such as the wavelet transform feature [9], the traditional machine-learning algorithm, such as the Support Vector Machine (SVM), has been studied for defect classification [9]. Recently, machine-learning methodologies, including decision-tree algorithms, have been introduced [10]. Deep-learning-based surface-defect inspection methods have been proposed to overcome the shortcomings of traditional machine-learning methods. To achieve a balance between inspection performance and inference efficiency, a deformable convolution is applied to extract the features of multi-shape defects [7]. Defect inspection using a Computer Aided Design (CAD) model has also been actively researched. Viana et al. [11] used a CAD model to generate a theoretical image of the inspected object, which was further matched with the sensed image acquired with a 2D camera. Berndt et al. [12] introduced the digital comparison of assembled products with CAD data. After the finishing assembly, a camera takes a picture of the product, and the software compares it with the CAD data. Abdallah et al. [13] examined aeronautical mechanical assemblies by comparing and analyzing 3D CAD models with real 2D images.
To develop an automated inspection, this paper proposes a large-scale Object-Defect Inspection System based on a Regional Convolutional Neural Network (R-CNN; RODIS). In this paper, we suggest the RODIS framework, including a defect-inspection method and hardware compositions. The various R-CNN backbone networks for object detection were compared using actual data provided by Telstar. We found that the Mask R-CNN model using Resnet-50-FPN showed an Average Precision (AP) of 71.63 (Object Detection) and 86.21 (Object Segmentation), which exceeded other models in performance.
The paper is organized as follows. Section 2 introduces the theoretical background of the proposed system. The section focuses on AI technology as a breakthrough that improves the conventional vision system. Section 3 explains the RODIS framework, including the hardware components and inspection workflow. Section 4 describes the experimental setup, including Detectron2 Software System for object detection and data pre-processing, such as data annotation and augmentation. This section also describes the computational experiment environment. Section 5 introduces the results of the system implementation on-site. Both the lessons learned from the installation of RODIS in the field and the result of the experiment for exploring the optimal backbone network for object detection are also highlighted in this section. In Section 6, the experimental results are critically discussed. The final section summarizes the experiment and suggests future research.
2. Theoretical Background
Computer-based machine vision imports images from cameras into a computer to be analyzed and processed. It can be customized by means of programming. For side-outer defect inspection, the application of high-level computer-based machine vision must be considered. The machine-vision process is conventionally divided into (1) image acquisition, (2) digitalization, (3) processing, (4) analysis, and (5) interpretation [14]. Image analysis is then divided into image segmentation and feature extraction tasks. Image analysis, along with Artificial Intelligence (AI) technology, is evolving in many ways. In particular, as a result of Convolutional Neural Networks (CNNs), the image analysis tasks’ performance and efficiency have been improved significantly. A CNN uses locality, shares weight, and has multiple layers with pooling operations. This allows the CNN to automatically learn features from the data and classify images without separate manual feature-extraction tasks. Because of these characteristics, the application of CNN and its derived models are being studied for quality inspection in various industries. In fact, research that applies AI technology for quality inspection in the manufacturing industries is actively being conducted, especially with R-CNN. CNN can classify objects well but shows its limitation in locating objects. R-CNN is a model with the addition of a box-offset regressor that improves the accuracy and localization [15]. Fast R-CNN is a model derived from R-CNN that applies Region of Interest (RoI) pooling and softmax classification to compensate for R-CNN’s shortcomings. Fast R-CNN enables Single Stage Training and backpropagation to improve object detection performance [16].
Faster R-CNN uses a Region Proposal Network (RPN) to diversify the anchor-box size based on a feature map to independently detect objects. Furthermore, Faster R-CNN leverages a Feature Pyramid Network (FPN) to detect small objects by rescaling feature maps to different sizes. The algorithm proposed by Ren et al. [17] has been tested on Common Objects in Context (COCO) and Pascal Visual Object Classes (VOC) datasets, and requires complements to be used for manufacturing inspection. Ren et al. [17] suggests the operation of the Faster R-CNN as follows:
- Features are extracted from images via a Feature Extraction Network (FEN) that includes the convolutional layers, Batch Normalization (BN) layers, and pooling layers.
- Create high-quality proposals by means of RPN.
- Create feature map based on proposals.
- Use RoI pooling to fix the size of each proposal.
- Using classification layers and border regulation layers, perform classification and regression analysis for boundaries.
- Map the original image again.
The Mask R-CNN proposed by He et al. [18] added a Fully Convolutional Network (FCN) to Faster R-CNN, complementing the shortcoming of location information disappearing from the Fully Connected layers (FC). Mask R-CNN also applies RoI alignment to improve the problem with the discrepancy that Faster R-CNN with RoI pooling forces objects of different sizes to specific values. The mask prediction and class prediction work separately. The operation of Mask R-CNN proposed by He et al. [18] is as follows:
- Resize the image by means of bilinear interpolation.
- Adjust the image size to 1024 × 1024 by means of padding to use the backbone network.
- Create feature maps at each layer via ResNet-101.
- An additional feature map is generated from the feature map previously generated by means of the FPN.
- Classification and bounding-box regression outputs are derived by applying each RPN to the final feature map.
- Produce an anchor box by projecting the bounding box regression value obtained from the output to the original image.
- Delete all of the anchor boxes generated by Non-Max-Suppression except for the anchor box with the highest score.
- Size different anchor boxes with RoI alignment.
- Pass the anchor-box value to the Mask branch along with the classification and bounding-box regression branch in Fast R-CNN.
The object-detection algorithm is actively being studied for inspecting defects. Faster R-CNN is a model that boasts high accuracy among object-detection algorithms and is being studied in the industrial field. For example, the defects of the body, heads, and turbo blades of car engines were inspected by Faster R-CNN [19,20]. Oh et al. [21] used Faster R-CNN to automatically detect welding defects. By comparison, Mask R-CNN is used for inspecting cracks in building and cable brackets of aircraft [22,23]. Other object detection and instance segmentation models, such as YOLO and YOLACT, are also applied for surface detection [24].
3. RODIS: R-CNN-Based Large-Scale Object-Defect Inspection System
This paper proposes RODIS for the side-outer. We propose the RODIS framework, including a method for defect-inspection, which uses the digital comparison between a 3D CAD model and the detected object from R-CNN. The various R-CNN backbone networks for object detection were analyzed and compared using actual data provided by Telstar. For the side-outer, various quality inspection objects and geometric characteristics should be considered for the defect inspection. Therefore, in this paper, the various backbone networks based on the Mask R-CNN were applied.
3.1. System Framework
RODIS uses sophisticated AI inference geometric data for defect inspection. RODIS consists of an aluminum frame, an inspection table, four high-resolution vision cameras, a network hub, two computers for AI inference, and backup data storage. The ground workflow for RODIS is as follows: When the four high-resolution (12 megapixel) vision cameras, fixed on the defect inspection table, acquire data, the data goes through a hub and enters an AI inference computer equipped with defect detection AI. The edge AI computer decides in real time whether a side-outer is defective or not. The acquired raw data is then sent to the Network Attached Server (NAS) and stored for a week. The inspection results are sent to the Manufacturing Execution System (MES) as the Boolean data type. Figure 1 shows the framework of RODIS.
RODIS’s aluminum frame is designed to maximize the WD to secure the FoV needed for side-outer photography and minimize image distortion. Considering the height of the site where the RODIS is installed, the overall RODIS was designed to be 2.25 m (width) × 2.225 m (length) × 4.96 m (height), and the distance between the inspection-jig and the camera vision was set to 2.9 m to provide sufficient WD.
We selected the cameras and lenses for RODIS by considering the size of the side-outer, FoV, WD, and the quality level demanded by Telstar. To achieve the quality level of 20 μm, ten high-resolution (31.4 MP) cameras are required. However, the price of a high-resolution camera is USD 6000, which means that the total investment sum is USD 60,000. Therefore, Telstar suggested to present a Proof of Concept (PoC) for the system which can inspect the defect level of 500 μm. Although the performance of the system is insufficient to replace the manual inspection, it can increase the cost competitiveness of Telstar, for the following reason. Currently, the side-outers are precisely inspected by the operator three times a day by sampling. This inspection method has the disadvantage that the operator cannot recognize the defects between sampling inspections. Thus, sometimes production continues without acknowledging the defects, which leads to the production of large amounts of defective products, causing additional costs. This unnecessary production of defective products can be avoided if obvious defects in the product can be identified automatically and quickly through the system.
Accordingly, we selected both the Tri120s and Tri122s cameras from Lucid Vision Labs. Both cameras use the Sony IMX304 sensor and offer the desired high resolution of 12 MP but differ in shutter type. The Tri120s has the global shutter type, for which each pixel in the sensor array starts and ends the exposure simultaneously, and all pixels of the image will obtain information from the sensor at once [25]. The Tri122s has a rolling shutter type. The pixels of the image captured by the rolling-shutter camera are processed row by row, so that different lines of the array image are exposed at various times to read the light intensity by means of the sensor [25]. For the lens, we selected the V1228-MPY2 model from Computar. Considering the size of the side-outer, WD, and the Angle of View (AoV) of the lens, we regarded this lens as suitable for our research. However, as the installation on-site progressed, the lens was replaced with another model (AZURE-1623ML12M), which is precisely described in Section 5.
RODIS has a table with a grid pattern to measure the degree of image distortion and to correct it, which is a burden for comparing the data detected by R-CNN with the CAD model. RODIS has a total of three fine height adjustment devices for sophisticated image capture. As a result, one can fine-tune the table’s height with the grid pattern, the vision camera, and the entire frame. Four lamps are fixed to the aluminum frame to maintain constant brightness during image shooting. Finally, in order to keep the side-outer stable when being photographed, the aluminum frame is fastened to the floor with four anchors, and the inspection jig is fixed by the fastening units.
3.2. Inspection Workflow
As shown in Figure 2, the specific method of side-outer defect inspection using RODIS is as follows:
- The shooting of the side-outer with the four high-resolution cameras;
- Data generation by merging of the split images;
- Objects (processed holes) detected from images acquired by means of AI technology to obtain detailed geometric information;
- Calculate the error after comparing the 3D CAD data with the obtained information acquired by the object detection;
- Inspection based on the error range.
4. Experimental Setup
As mentioned in Section 3, this paper explored different object-detection networks to identify the optimal object-detection model for defect inspection of side-outers. In our research, we applied the Detectron2 Software System by Facebook Artificial Intelligence Research (FAIR). Detectron2 provides various backbone network combinations, which differ in FEN and layer depth. The overall composition of Detectron2 is similar to the concept suggested by He et al. [18], which was precisely explained in Section 2.
We applied ResNet-50, ResNet-101, and ResNext-101 from ImageNet pretrained models as FEN. ResNet is a convolutional neural network with 50 layers that uses the concept of skip connection and residual learning to solve the gradient vanishing problem [26]. ResNext is a model derived from ResNet and uses the concept of group convolution to solve the problems caused by the deep layer in ResNet [27]. Both ResNet and ResNext models used Batch Normalization (BN) to improve performance and prevent overfitting. Each layer used Rectified Linear Units (ReLU) as a neuron activation function and was connected to the previous layer. The applied backbone combinations were ResNet-FPN, ResNet-C4, and ResNet-DC5. ResNet-FPN does masking and boxing using general convolutional layers and fully connected layers. FPN is a technology that rescales an image without loss of information while deconvolving information accumulated by means of a convolution process at the last stage of convolution. FPN is used in many studies that require the detection of high-resolution objects [28,29]. ResNet-FPN showed the best speed/accuracy tradeoff in previous studies. ResNet-C4 is the baseline of Faster R-CNN presented by Ren et al. [17], using the conv4 backbone and conv5 head, which means that the fourth layer is applied as a feature map. ResNet-DC5 (Dilted-C5) is a model introduced by Dai et al. [30], using the fifth-stage layer of ResNet as the backbone and dilating by means of standard convolutional layers and FC. The blocks of ResNet-50 and ResNet-101 used in this paper are three layers deep.
The experiment was conducted on an Ubuntu 18.04 32-bit operating system, and the deep learning framework used PyTorch. The equipment’s hardware was an Intel®® Core TMi9-10900X, 2080ti GPU, with 32 GB of memory. Telstar provided images of the side-outer that were collected manually. There are four types of processing holes required for object detection: (1) key, (2) square, (3) circle, and (4) doghouse, depending on their shape as shown in Figure 3. To improve the object detection performance, first the background of the provided data was removed, as shown in Figure 4. The COCO Annotator was utilized to annotate it in a COCO format, as shown in Figure 5.
Table 1 shows the information contained in the annotated data in json format, and the data format for each item of information.
In order to improve overfitting problems and performance, we performed data augmentation. Specific methods included ResizeShortestEdge and RandomFlip provided by Detectron2. For ResizeShortestEdge, we undertook the rescaling without adjusting the image ratio, increasing the shortest edge to the set value, and then resizing the longest edge and checking whether it had exceeded the limit. For Random Flip, the image was flipped vertically or horizontally for augmenting the data. Table 2 shows the data type and the actual input data that we used in this paper for each method. The input values of ResizeShortestEdge are the list of the short edge lengths, which is used for resizing the longest edge.
5. Experiment and Results
5.1. Implementation
Telstar, a laser-cutting company located in Gyeongju City, Republic of Korea, uses 3D laser cutting machines to pierce and trim the side-outer. In the research, RODIS was installed at the Telstar plant, which is equipped with three automated and one manual laser-cutting systems. RODIS was installed close to the existing precise-quality inspection station as shown in Figure 6. Figure 7 shows RODIS at the site after the installation, and the components including the visions, the network devices, the inspection jig, the anchors, and the table with a grid pattern.
The layout and components of RODIS, which were planned initially, were supplemented by trial and error at the site. For example, we considered using the camera with the global shutter method (Tri120s), which provides a higher pixel size than the method using a rolling shutter type. However, after discussions on the site, there was a dominant opinion that the rolling shutter has advantages that the global shutter type does not have, such as lower noise, and lower price for fixed-object photography, such as for side-outer inspection. Thus, we decided to change the cameras from the global to the rolling-shutter type (Tri122s). The detailed information about the specification is shown in Table 3 and Table 4.
However, the corresponding machine vision did not provide the desired FoV, because even though the same lens was applied, the AoV differed depending on the camera’s shutter type. The AoV specifications of the lens considered in the initial application were 71.1° (D), 60.5° (H), and 46.2° (V) for the global-shutter type, and 66.4° (D), 55.5° (H), and 42.9° (V) for the rolling-shutter type, as shown in Table 2. To solve this, the lens was replaced with RMA’s AZURE-1623ML12M lenses, which have the AoV of 54.39° (D), 34.45° (V), and 44.56° (H) for the 1.1” format, and 35.67° (D), 21.33° (V), and 28.85° (H) for the 2/3” format. Because the sensor size of the selected camera is 1”, the combination of the camera and lens was assumed to provide an AoV between 21.33° and 34.45° (V). The actual implementation proved that the selection of camera and lens is appropriate for the side-outer inspection. The calculation of the FoV with the changed equipment based on the required FoV for each vision system, and the size of the inspection table, is shown in Figure 8.
In addition, trial and error was needed because of the installation of multiple vision cameras. After installing the vision cameras, when individual camera power conditions were checked, they all operated normally, and the image storage became stable. However, when four cameras were operated simultaneously, it was impossible to recognize them, because of screen noise. Figure 9 shows image noise, which is represented by colored horizontal lines crossing the image.
The same symptoms were repeated when three cameras were operated. Although lowering the number of cameras to two reduced the degree of noise, the image remained difficult to recognize. The cause of the noise was the excessive amount of data transmitted from the camera. Thus, the applied Category 5E (Cat.5E) Local Area Network (LAN) for connecting the computer with the hub was changed to Category 6 (Cat.6), which has up to 250 MHz bandwidth. After this change, a significant improvement was seen in the image noise.
5.2. Results
The RODIS on-site succeeded in reliably collecting data. Figure 10 illustrates the results of the data collected using the RODIS. Each of the four cameras filmed their responsible territory. The filming areas are divided into four parts as followed: (1) left-bottom, (2) left-top, (3) right-bottom, and (4) right-top. The lamp was on because the image was taken during nighttime without natural light.
At the same time as creating a data-acquisition environment by means of the field installation of RODIS, the various R-CNN models were explored based on data provided by Telstar. The research aimed to find the optimal backbone network for the defect inspection. Table 5 explains the various backbone networks applied in our research.
The results of training the object-detection model for quality inspection of RODIS are shown in Figure 11. The X-axis represents the number of iterations which indicates how many times the model has been learnt. The Y-axis represents the loss value. The loss value is used for a relative comparison among various models based on the same loss function.
As training progressed, the loss value decreased drastically. Given the rapid decrease in loss, we inferred that the learning rate was appropriate. Among the five different models, the loss value of ResNeXt-101-FPN was 0.477, showing better training than ResNet-50-FPN (0.5174). During the training, the ResNeXt-101-FPN model had a better accuracy rate than did the other four models, as represented in Figure 12.
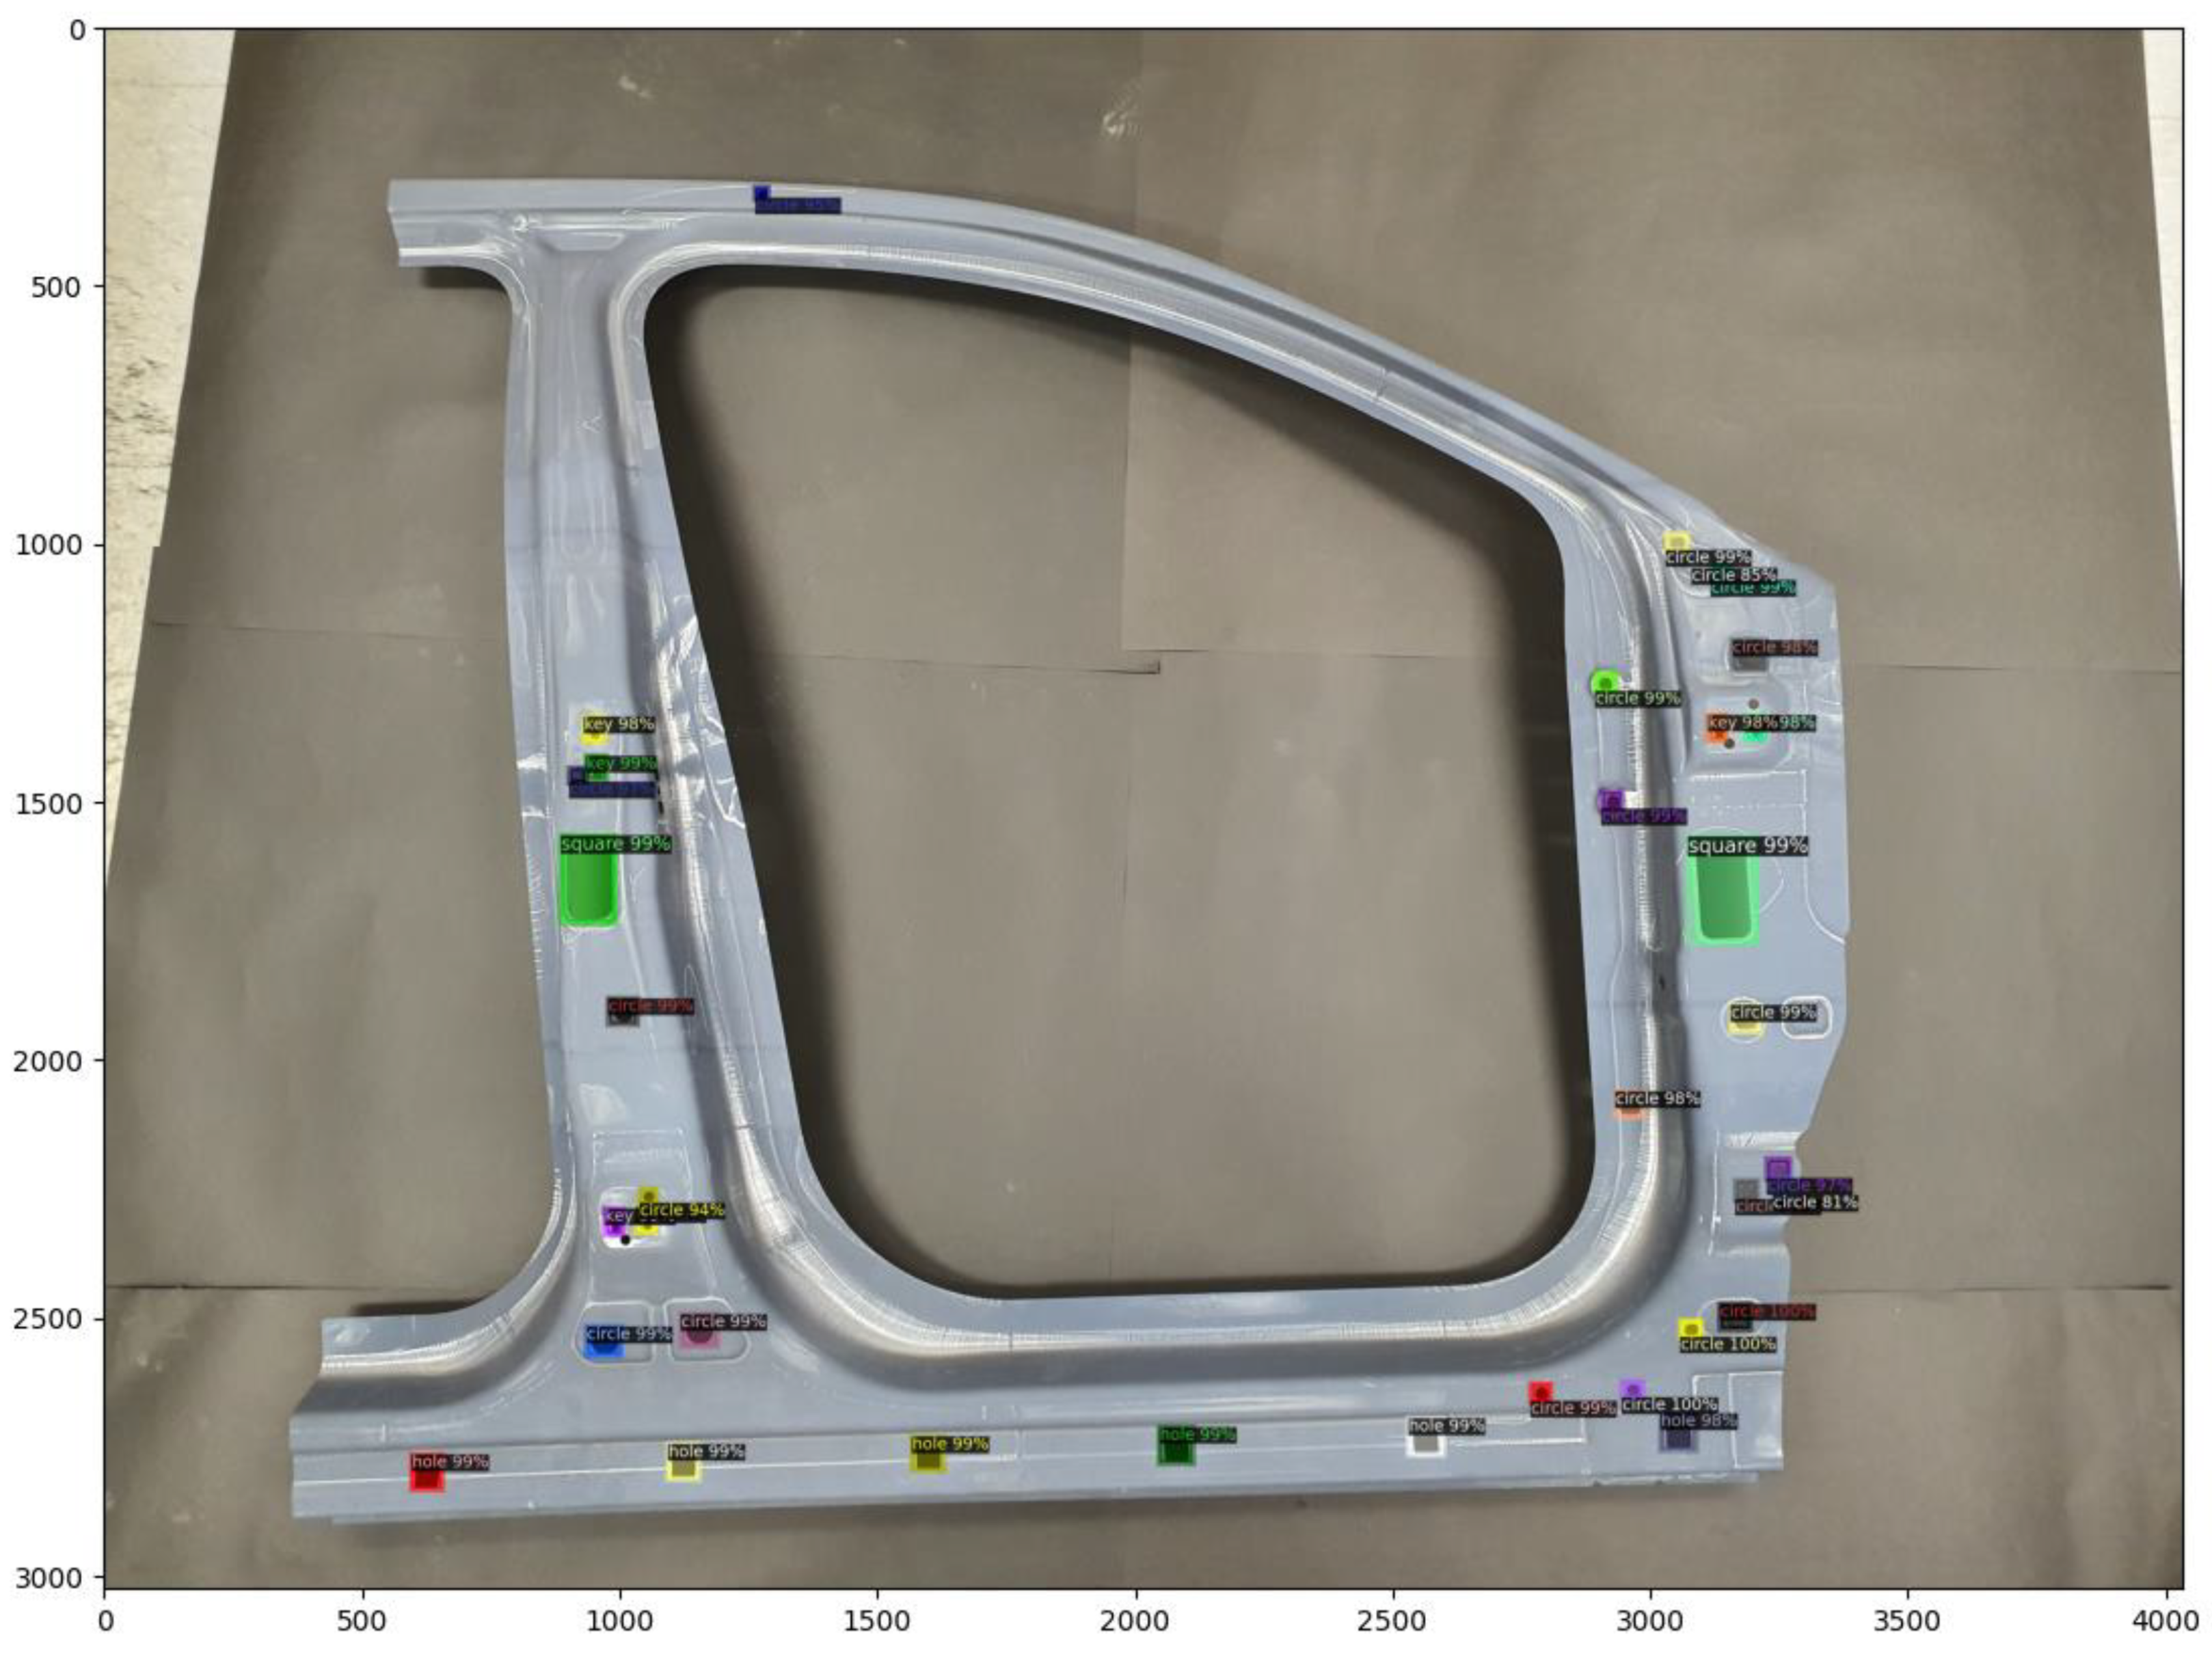
Figure 13 and Figure 14 show the result for bounding-box prediction and object segmentation, respectively. The numbers in the figures indicate the confidence for hole classification.
Both bounding-box prescription and masking showed a probability of more than an 80% for all processing holes, and most showed a probability of more than 90%. To measure the algorithm’s performance, we used Average Precision (AP), which is used as a performance indicator for object detection. Higher AP implies that the model works better to detect specific classes of objects. AP is the area under the Precision-versus-Recall (PvR) curve [31].
As shown in Table 6, the most commonly used ResNet-50-FPN worked fairly well for both bounding-box and masking prediction. The AP of ResNeXt-101-FPN, which produced the best training results, was lower than that of ResNet-50-FPN, suggesting that the ResNeXt-101-FPN model may have overfitting issues. The AP is affected by various factors. Specifically, the key is the choice of Feature Extraction method to be applied. FPN is known as being effective compared to C4 and DC5 for detecting small objects. The size of the detected holes is relatively small compared to the image. Therefore, the result that FPN has the best effect among the methods seems to be reasonable. These results are consistent with those presented in many of the prior studies described in Section 2, indicating that ResNet-50-FPN is highly likely to be the best alternative for defect inspection.
6. Discussions
Although data was successfully generated by RODIS, hardware, especially the vision systems, must be upgraded to meet the quality requirements that would allow Telstar to eliminate the manual inspection. For processing the high-resolution images, the network and computational devices also must be improved. In addition, automating the integration of the split images for quality inspection will be also challenging. The method currently under consideration is as follows: (1) merging images with the heuristic method, (2) improving the quality by comparing the merged image with the CAD drawing, (3) making a reference model, and (4) automating the merging process based on the comparison with the reference model. However, the development of the automation process must be researched and experimented with based on the existing literature. Regarding object detection, FPN is considered the most effective feature extraction model because the holes are relatively small in comparison to the whole image. However, there are no significant differences among ResNet-50-FPN, ResNet-101-FPN, and ResNeXT-101-FPN. Based on the accumulated data generated by RODIS, further studies must be conducted to more precisely compare the performance of these three models. However, the other backbone networks (C4, DC5) are not considered to be efficient for extracting features for the side-outer.
7. Conclusions
This paper presents RODIS to perform defect inspection of large objects, such as side-outers. We introduced the RODIS framework, hardware layout, and compositions, and described the trial and error experienced in the actual site deployment. In particular, the lack of FoVs that resulted from the inappropriate combination of camera shutter types and lenses, and the image noise that occurs when multiple cameras are operated simultaneously, should be considered during similar research tasks. In this paper, the optimal algorithms were explored by reviewing and implementing various object-detection models. Based on the dataset provided by Telstar, we compared various backbone networks based on the Mask R-CNN. The Resnet-50-FPN-based model showed the highest Average Precision (AP), representing good object-detection performance. Following the completion of the installation and prior research on various backbone networks, further research and development on RODIS has become possible. Future research subjects for RODIS are as follows: (1) extraction of geometric data using R-CNN; (2) digital comparison of extracted geometric data with a 3D CAD model for defect inspection; and (3) performance improvement by comparing the inspection result from RODIS with the result of inspections conducted manually by operators.
Author Contributions
The contribution of each author is as follows. Conceptualization: D.I. and J.J.; Methodologies: D.I. is the major contributor to the framework of RODIS; D.I. is the major contributor to the implementation of RODIS on-site; AI Training: D.I.; Writing—original draft preparation: D.I.; Writing—review and editing: D.I., J.J. All authors have read and agreed to the published version of the manuscript.
Funding
This research was supported by the AI-based high value-added new product technology development R&D Program S2924501 funded by Ministry of SMEs and Startups (MSS, Korea).
Institutional Review Board Statement
Not applicable.
Informed Consent Statement
Not applicable.
Data Availability Statement
Not applicable.
Acknowledgments
This research was supported by the SungKyunKwan University and the BK21 FOUR (Graduate School Innovation) funded by the Ministry of Education (MOE, Korea) and National Research Foundation of Korea (NRF).
Conflicts of Interest
The authors declare no conflict of interest.
References
- IIHS HLDI, Fatality Facts 2018 Passenger Vehicle Occupants. Available online: https://www.iihs.org/topics/fatality-statistics/detail/passenger-vehicle-occupants (accessed on 25 March 2021).
- Karbasian, H.; Tekkaya, A. A review on hot stamping. J. Mater. Process. Technol. 2010, 210, 2103–2118. [Google Scholar] [CrossRef]
- Weng, J.; Cohen, P.; Herniou, M. Camera calibration with distortion models and accuracy evaluation. IEEE Trans. Pattern Anal. Mach. Intell. 1992, 14, 965–980. [Google Scholar] [CrossRef] [Green Version]
- Edmund Optics. “Distortion”, Edmund Optics Knowledge Center. Available online: https://www.edmundoptics.co.kr/knowledge-center/application-notes/imaging/distortion/ (accessed on 25 March 2021).
- Opto Engineering, Telecentric Lenses Tutorial, Opto Engineering. Available online: https://www.opto-e.com/resources/telecentric-lenses-tutorial (accessed on 25 March 2021).
- Malamas, E.N.; Petrakis, E.G.; Zervakis, M.; Petit, L.; Legat, J.-D. A survey on industrial vision systems, applications and tools. Image Vis. Comput. 2002, 21, 171–188. [Google Scholar] [CrossRef]
- Hao, R.; Lu, B.; Cheng, Y.; Li, X.; Huang, B. A steel surface defect inspection approach towards smart industrial monitoring. J. Intell. Manuf. 2020, 32, 1833–1843. [Google Scholar] [CrossRef]
- Zhang, C.; Xie, Y.; Liu, D.; Wang, L. Fast threshold image segmentation based on 2D fuzzy fisher and random local optimized QPSO. IEEE Trans. Image Process. 2016, 26, 1355–1362. [Google Scholar] [CrossRef]
- Ghorai, S.; Mukherjee, A.; Gangadaran, M.; Dutta, P.K. Automatic defect detection on hot-rolled flat steel products. IEEE Trans. Instrum. Meas. 2012, 62, 612–621. [Google Scholar] [CrossRef]
- Sun, J.; Li, C.; Wu, X.-J.; Palade, V.; Fang, W. An effective method of weld defect detection and classification based on machine vision. IEEE Trans. Ind. Informatics 2019, 15, 6322–6333. [Google Scholar] [CrossRef]
- Viana, I.; Orteu, J.-J.; Cornille, N.; Bugarin, F. Inspection of aeronautical mechanical parts with a pan-tilt-zoom camera: An approach guided by the computer-aided design model. J. Electron. Imaging 2015, 24, 061118. [Google Scholar] [CrossRef] [Green Version]
- Berndt, D. Digital Assembly Inspection: Automatic Quality Control even for Small Quantities. Available online: https://idw-online.de/de/news532655 (accessed on 25 March 2021).
- Ben Abdallah, H.; Jovančević, I.; Orteu, J.-J.; Brèthes, L. Automatic inspection of aeronautical mechanical assemblies by matching the 3D CAD model and real 2D images. J. Imaging 2019, 5, 81. [Google Scholar] [CrossRef] [PubMed] [Green Version]
- James, G.K. Robot Technology Fundamentals, 1st ed.; Cengage Learning: Boston, MA, USA, 1999; pp. 187–207. [Google Scholar]
- Girshick, R.; Donahue, J.; Darrell, T.; Malik, J. Region-Based convolutional networks for accurate object detection and segmentation. IEEE Trans. Pattern Anal. Mach. Intell. 2015, 38, 142–158. [Google Scholar] [CrossRef] [PubMed]
- Girshick, R. Fast R-CNN. In Proceedings of the IEEE International Conference on Computer Vision (ICCV), Santiago, Chile, 7–13 December 2015; pp. 1440–1448. [Google Scholar]
- Ren, S.; He, K.; Girshick, R.; Sun, J. Faster R-CNN: Towards real-time object detection with region proposal networks. Adv. Neural Inf. Process. Syst. 2015, 28, 91–99. [Google Scholar] [CrossRef] [PubMed] [Green Version]
- He, K.; Gkioxari, G.; Dollar, P.; Girshick, R. Mask R-CNN. IEEE Trans. Pattern Anal. Mach. Intell. 2020, 42, 386–397. [Google Scholar] [CrossRef] [PubMed]
- Liyun, X.; Boyu, L.; Hong, M.; Xingzhong, L. Improved Faster R-CNN algorithm for defect detection in powertrain assembly line. Procedia CIRP 2020, 93, 479–484. [Google Scholar] [CrossRef]
- Wang, Y.; Liu, M.; Zheng, P.; Yang, H.; Zou, J. A smart surface inspection system using faster R-CNN in cloud-edge computing environment. Adv. Eng. Inform. 2020, 43, 101037. [Google Scholar] [CrossRef]
- Oh, S.-J.; Jung, M.-J.; Lim, C.; Shin, S.-C. Automatic detection of welding defects using faster R-CNN. Appl. Sci. 2020, 10, 8629. [Google Scholar] [CrossRef]
- Attard, L.; Debono, C.J.; Valentino, G.; Castro, M.; Masi, A.; Scibile, L. Automatic crack detection using mask R-CNN. In Proceedings of the 11th International Symposium on Image and Signal Processing and Analysis (ISPA), Dubrovnik, Croatia, 23 September 2019; pp. 152–157. [Google Scholar]
- Zhao, G.; Hu, J.; Xiao, W.; Zou, J. A mask R-CNN based method for inspecting cable brackets in aircraft. Chin. J. Aeronaut. 2020. [Google Scholar] [CrossRef]
- Im, D.; Lee, S.; Lee, H.; Yoon, B.; So, F.; Jeong, J. A data-centric approach to design and analysis of a surface-inspection system based on deep learning in the plastic injection molding industry. Processes 2021, 9, 1895. [Google Scholar] [CrossRef]
- Le, T.; Le, N.-T.; Jang, Y.M.; Thithanhnhan, L.; Nam-Tuan, L.; Min, J.Y. Performance of rolling shutter and global shutter camera in optical camera communications. In Proceedings of the 2015 International Conference on Information and Communication Technology Convergence (ICTC), Jeju, Korea, 28–30 October 2015; pp. 124–128. [Google Scholar] [CrossRef]
- He, K.; Zhang, X.; Ren, S.; Sun, J. Deep Residual Learning for Image Recognition. In Proceedings of the 2016 IEEE Conference on Computer Vision and Pattern Recognition (CVPR), Las Vegas, NV, USA, 12 December 2016; pp. 770–778. [Google Scholar]
- Xie, S.; Girshick, R.; Dollar, P.; Tu, Z.; He, K. Aggregated Residual Transformations for Deep Neural Networks. In Proceedings of the 30th IEEE Conference on Computer Vision and Pattern Recognition, Honolulu, HI, USA, 21–26 July 2017; pp. 5987–5995. [Google Scholar]
- Zhang, X.; Zhu, K.; Chen, G.; Tan, X.; Zhang, L.; Dai, F.; Liao, P.; Gong, Y. Geospatial object detection on high resolution remote sensing imagery based on double multi-scale feature pyramid network. Remote Sens. 2019, 11, 755. [Google Scholar] [CrossRef] [Green Version]
- Tayara, H.; Chong, K.T. Object Detection in Very High-Resolution Aerial Images Using One-Stage Densely Connected Feature Pyramid Network. Sensors 2018, 18, 3341. [Google Scholar] [CrossRef] [PubMed] [Green Version]
- Dai, J.; Qi, H.; Xiong, Y.; Li, Y.; Zhang, G.; Hu, H.; Wei, Y. Deformable Convolutional Networks. In Proceedings of the IEEE International Conference on Computer Vision (ICCV), Venice, Italy, 22–29 October 2017; pp. 764–773. [Google Scholar] [CrossRef] [Green Version]
- Su, W.; Yuan, Y.; Zhu, M. A Relationship between the Average Precision and the Area Under the ROC Curve. In Proceedings of the 2015 International Conference on The Theory of Information Retrieval (ICTIR‘ 15). Association for Computing Machinery, New York, NY, USA, 27–30 September 2015; pp. 349–352. [Google Scholar]
Figure 1.
RODIS Framework.
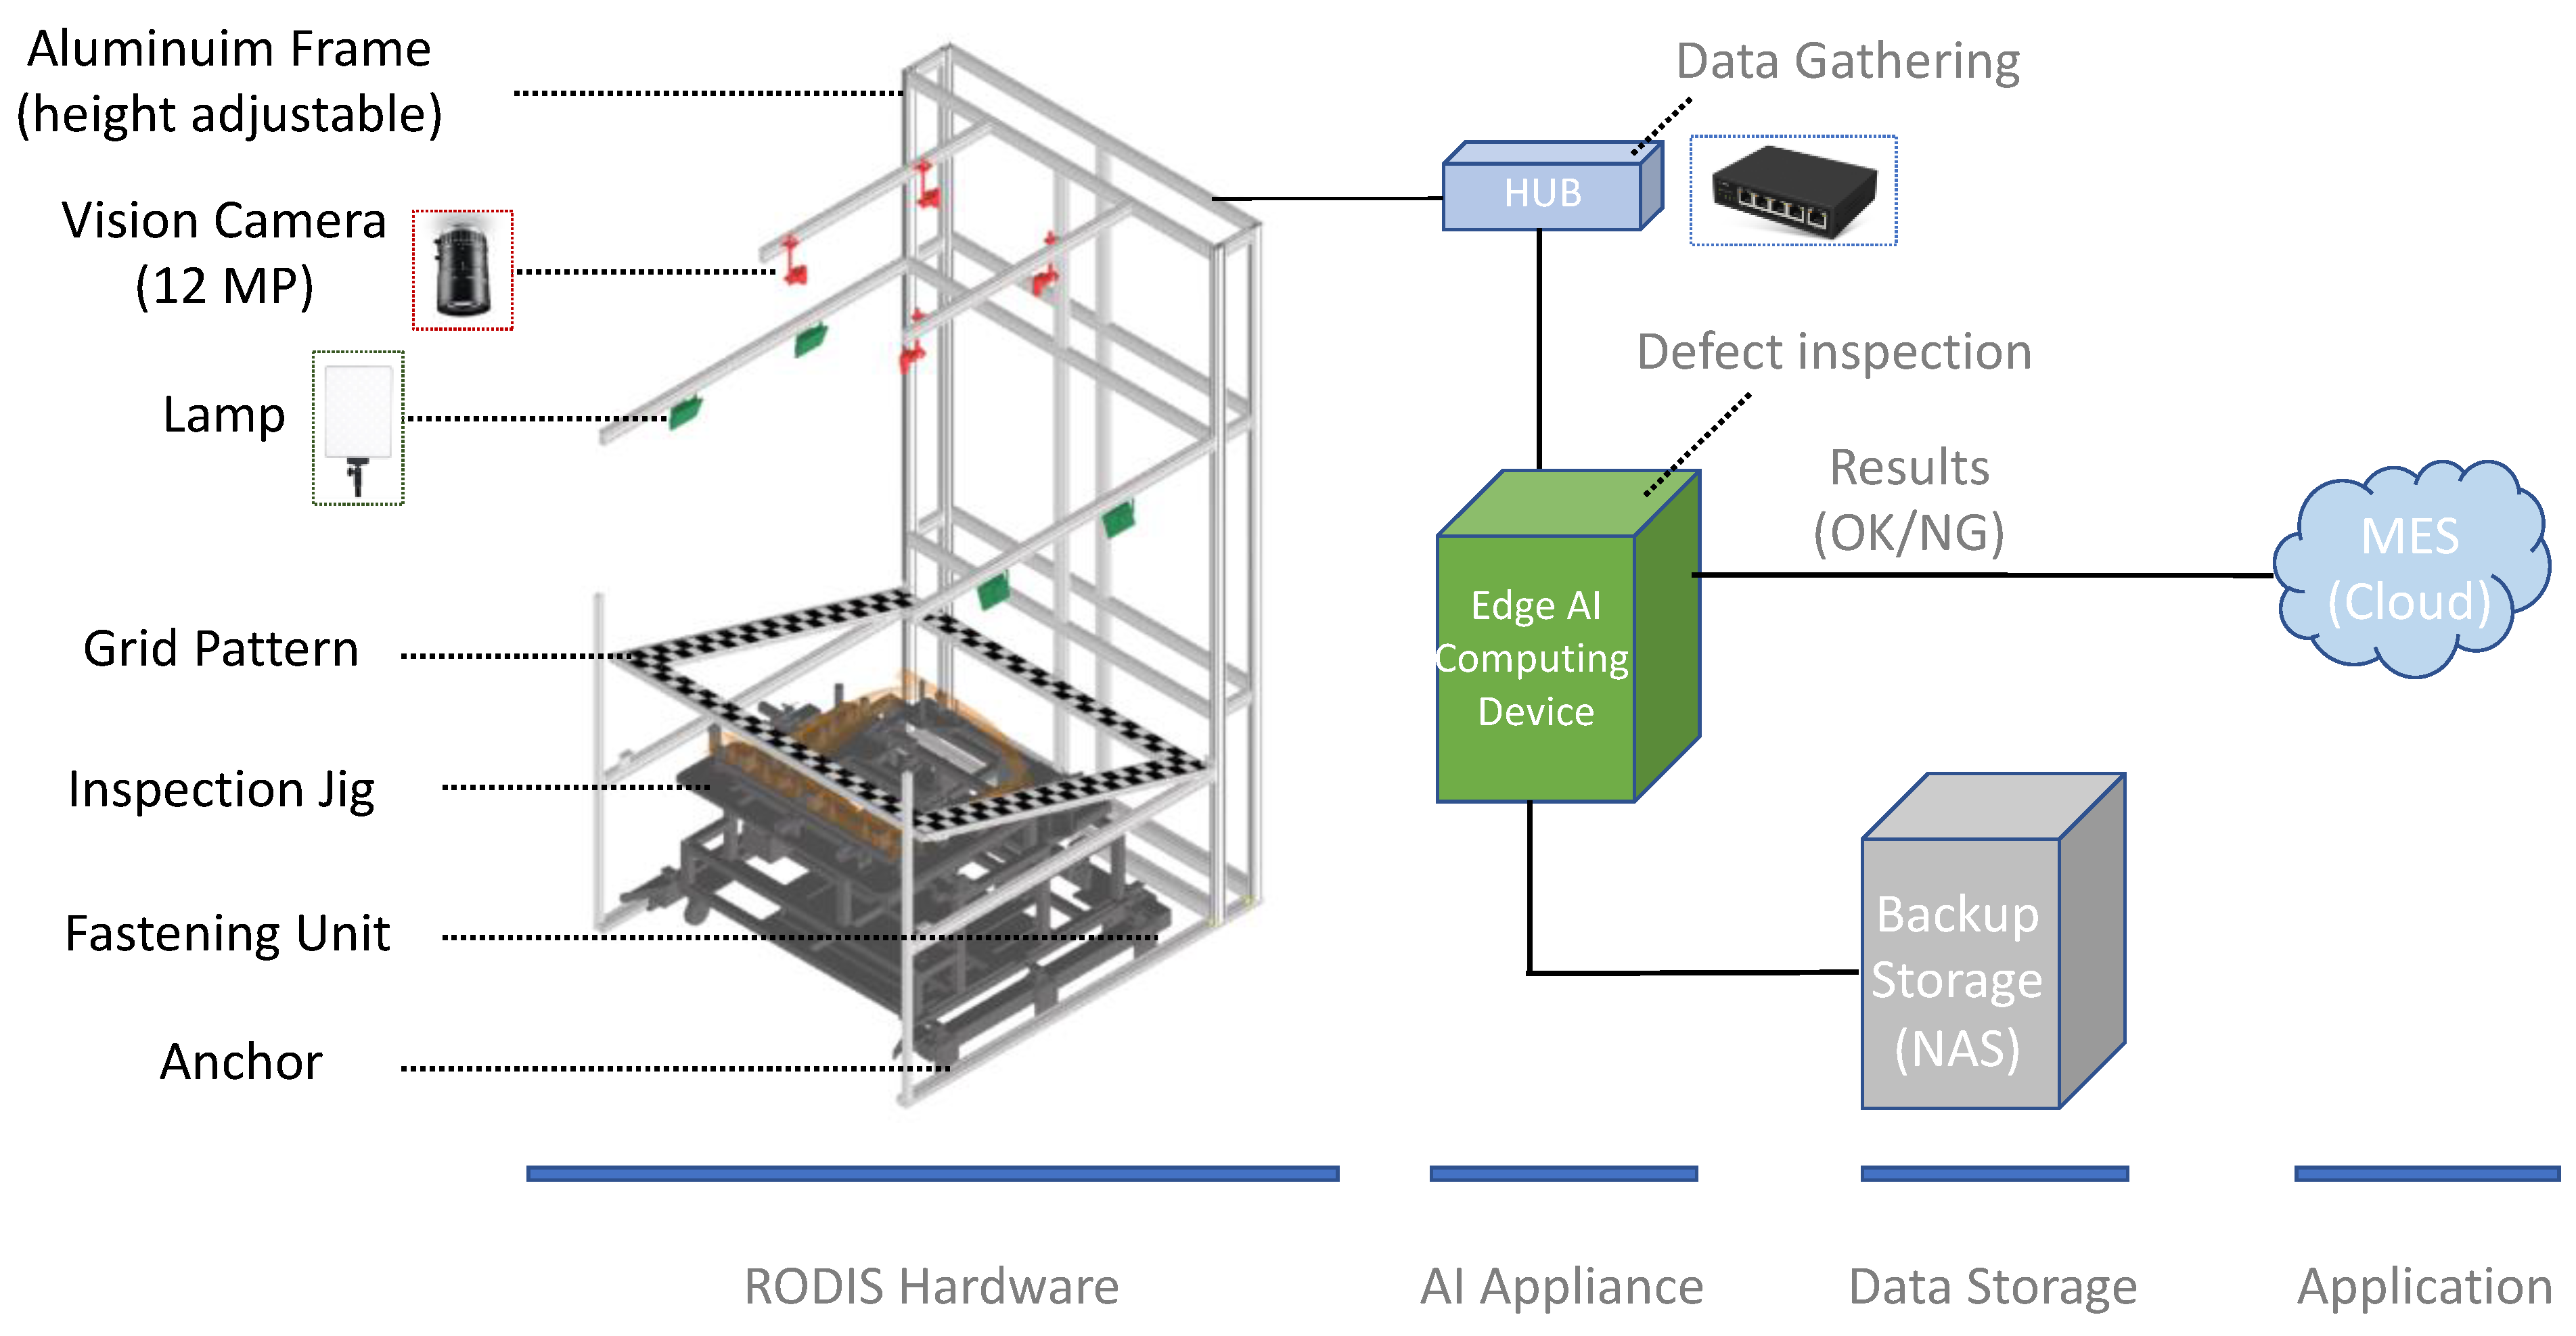
Figure 2.
RODIS inspection workflow.
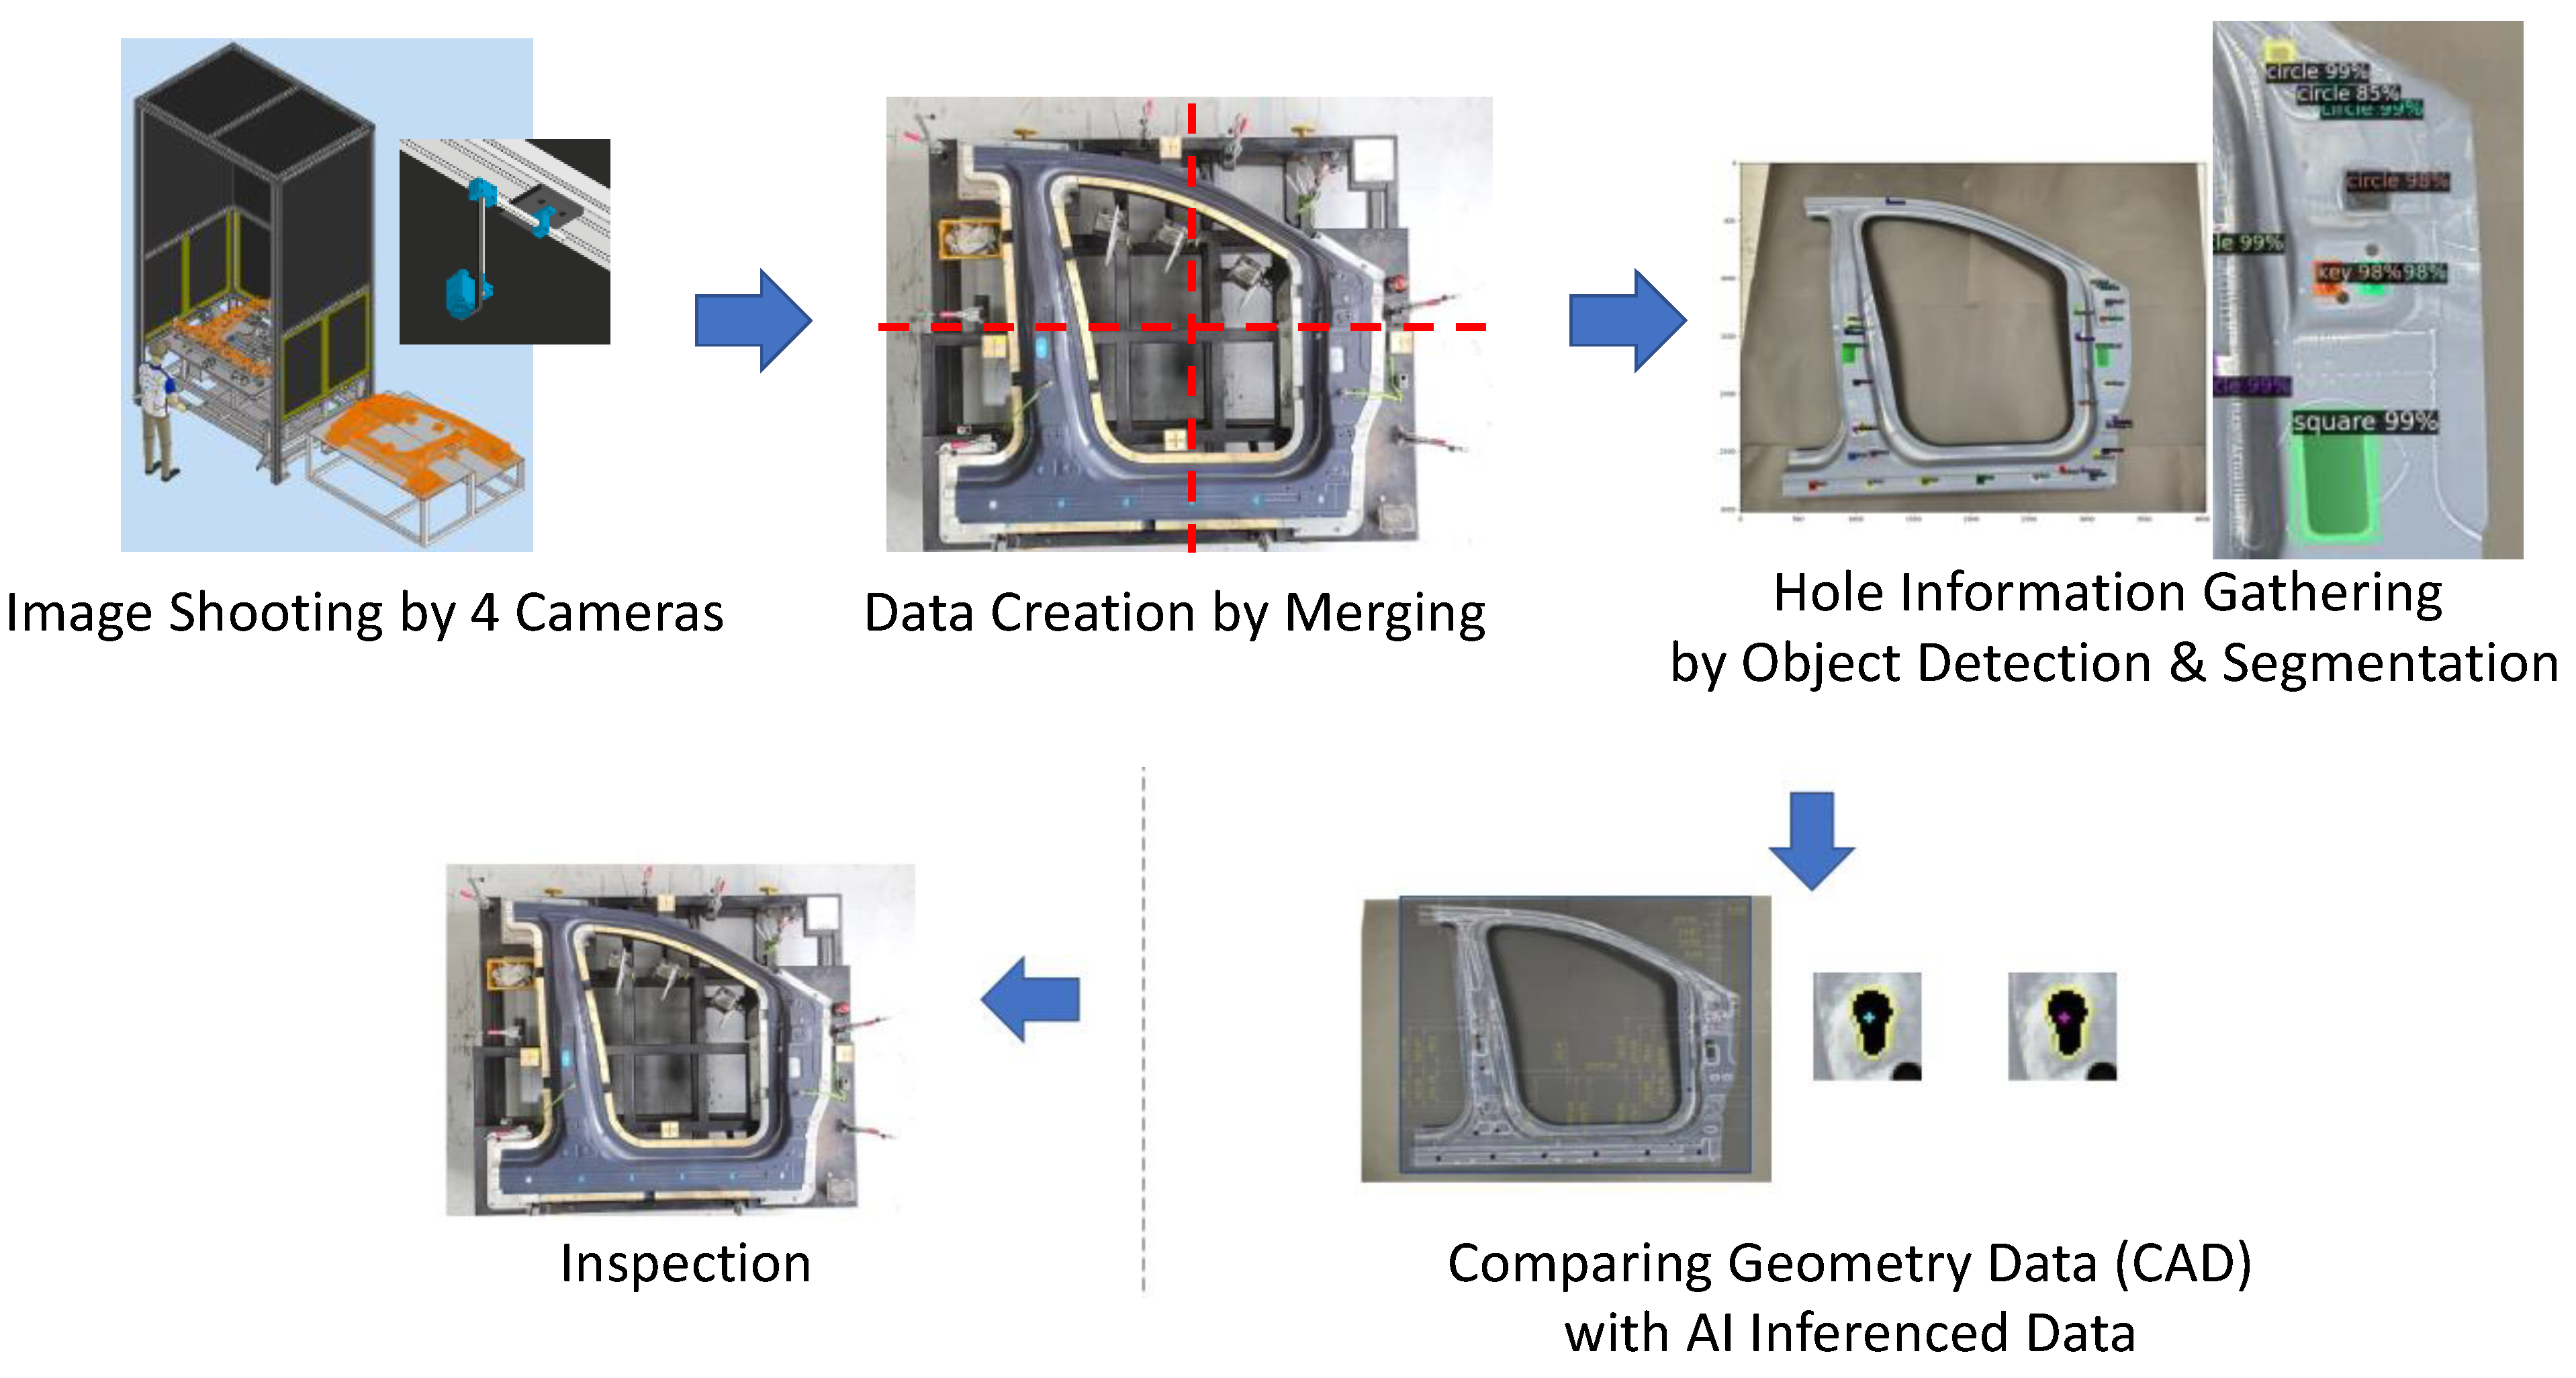
Figure 3.
Example of Plain Data.
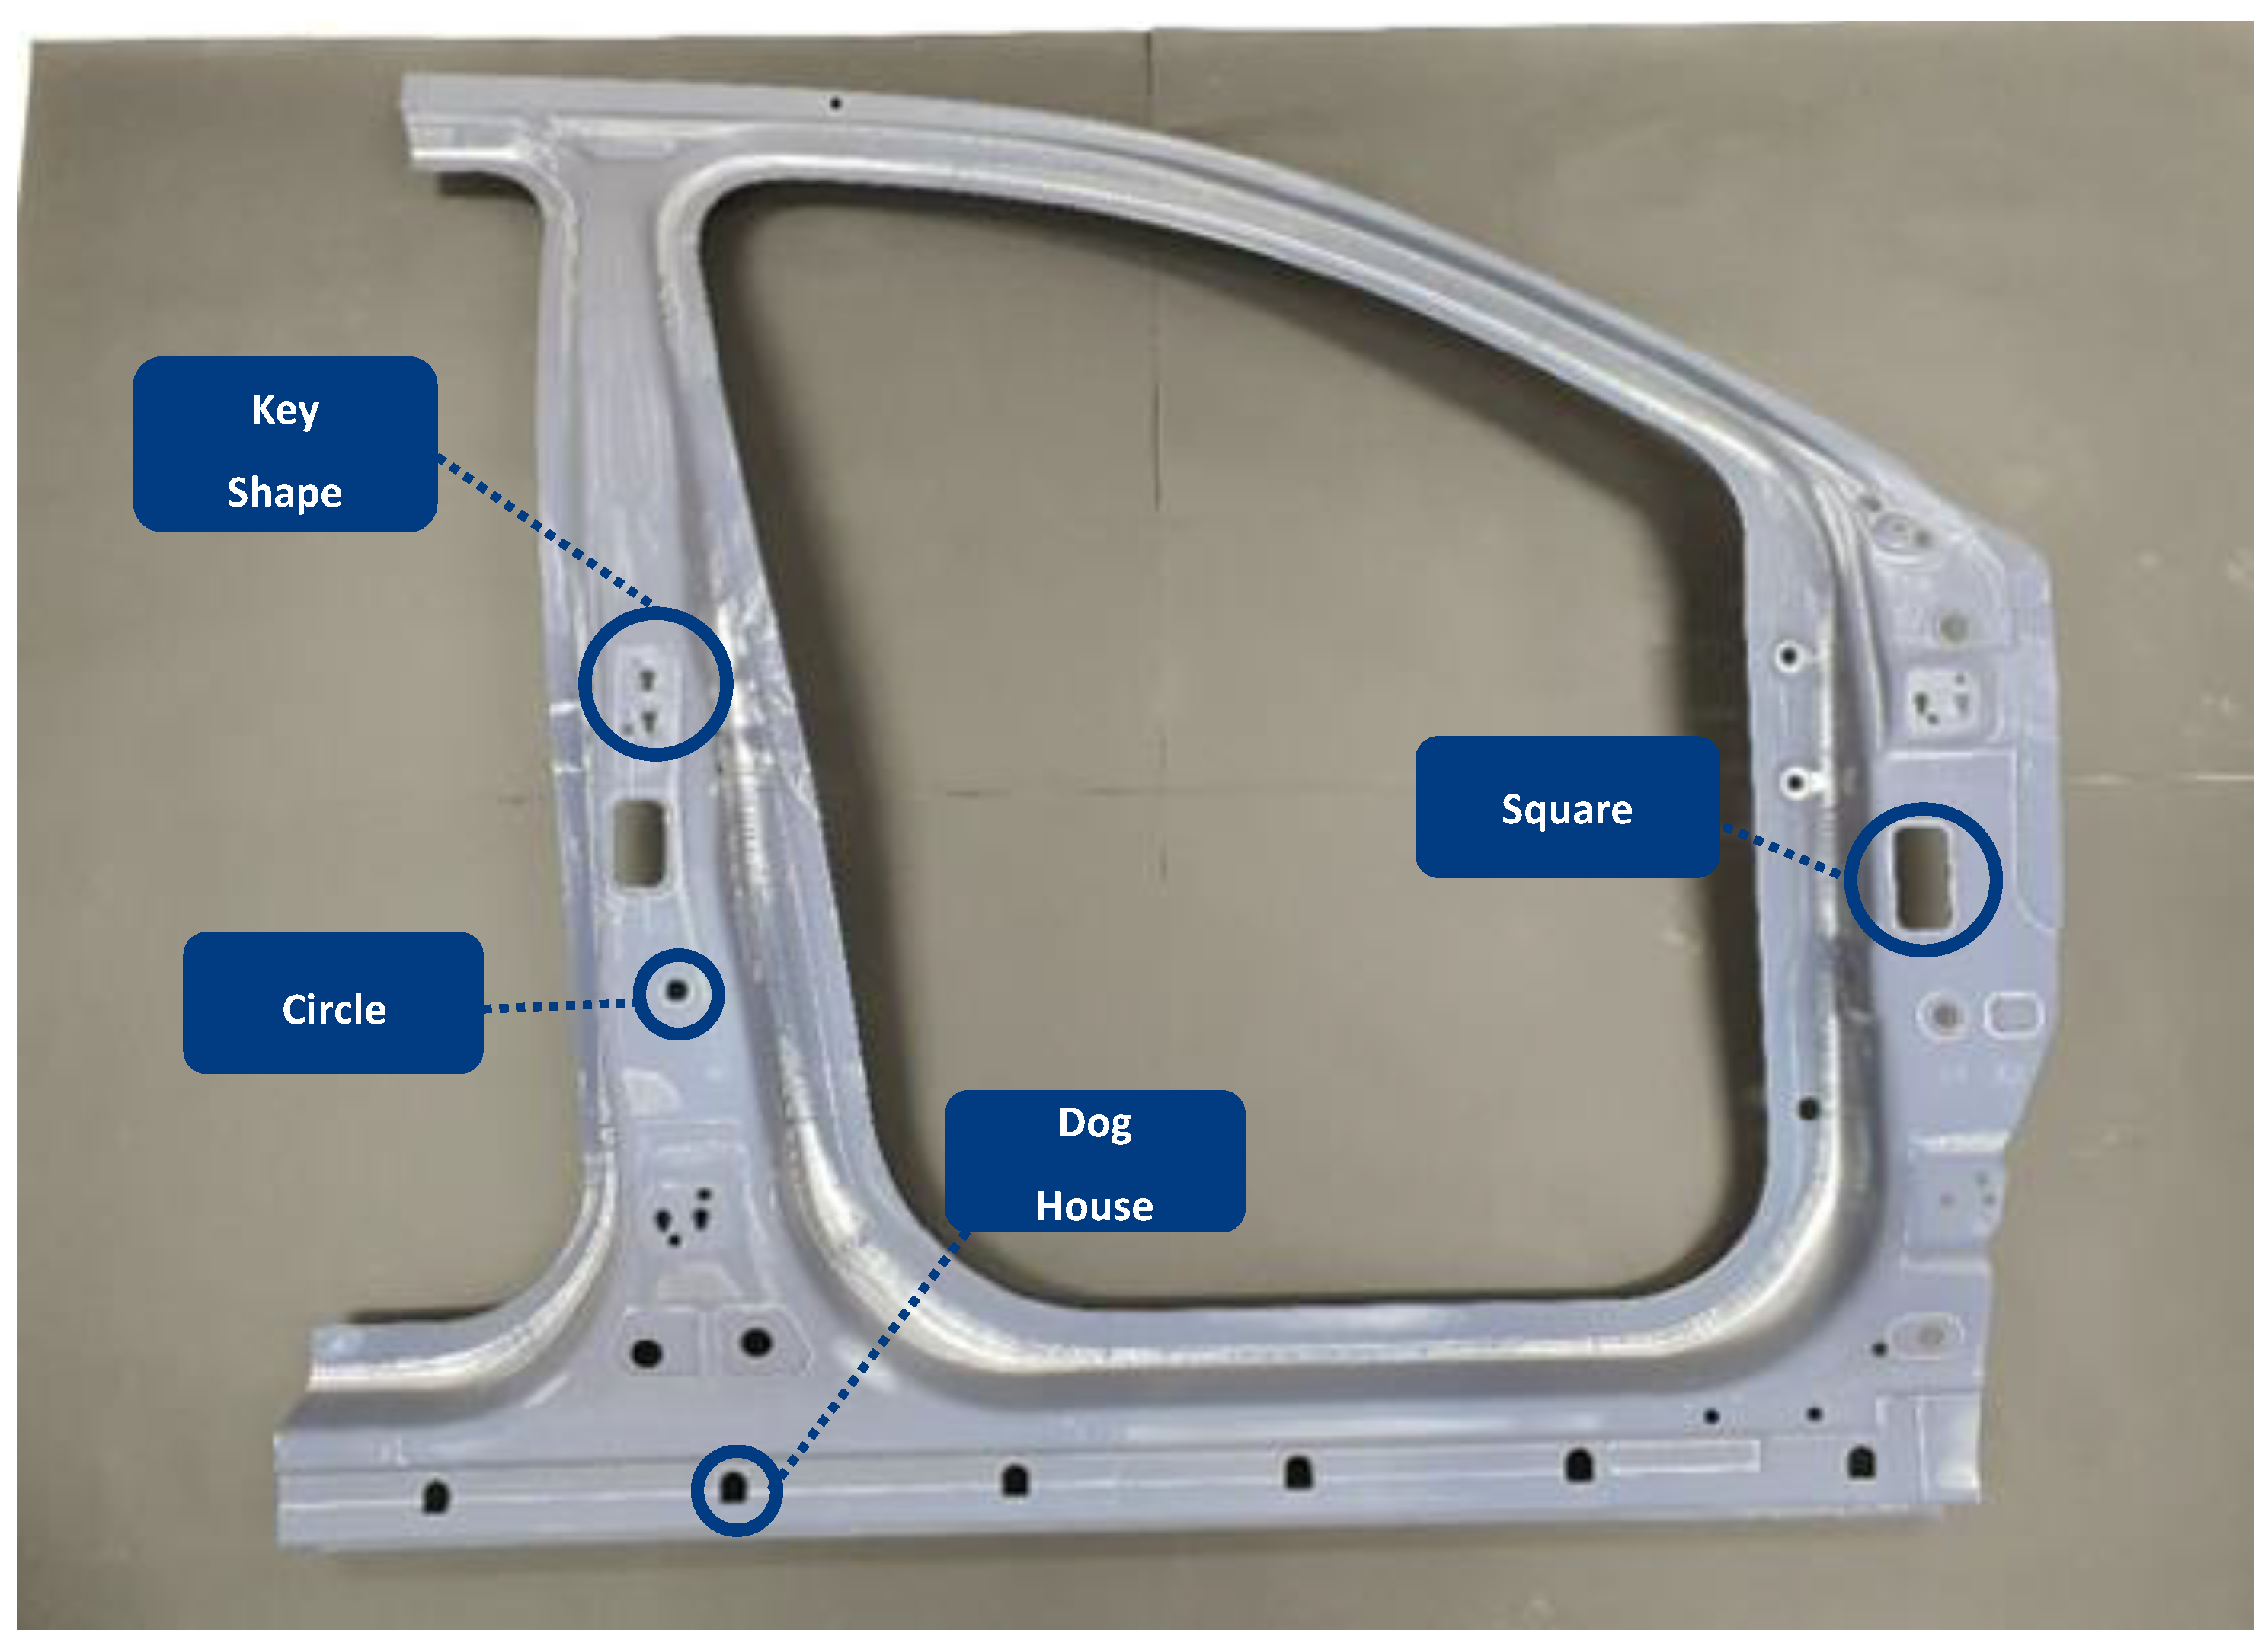
Figure 4.
Pre-processed data: background elimination and contouring.

Figure 5.
Example of labeled data.
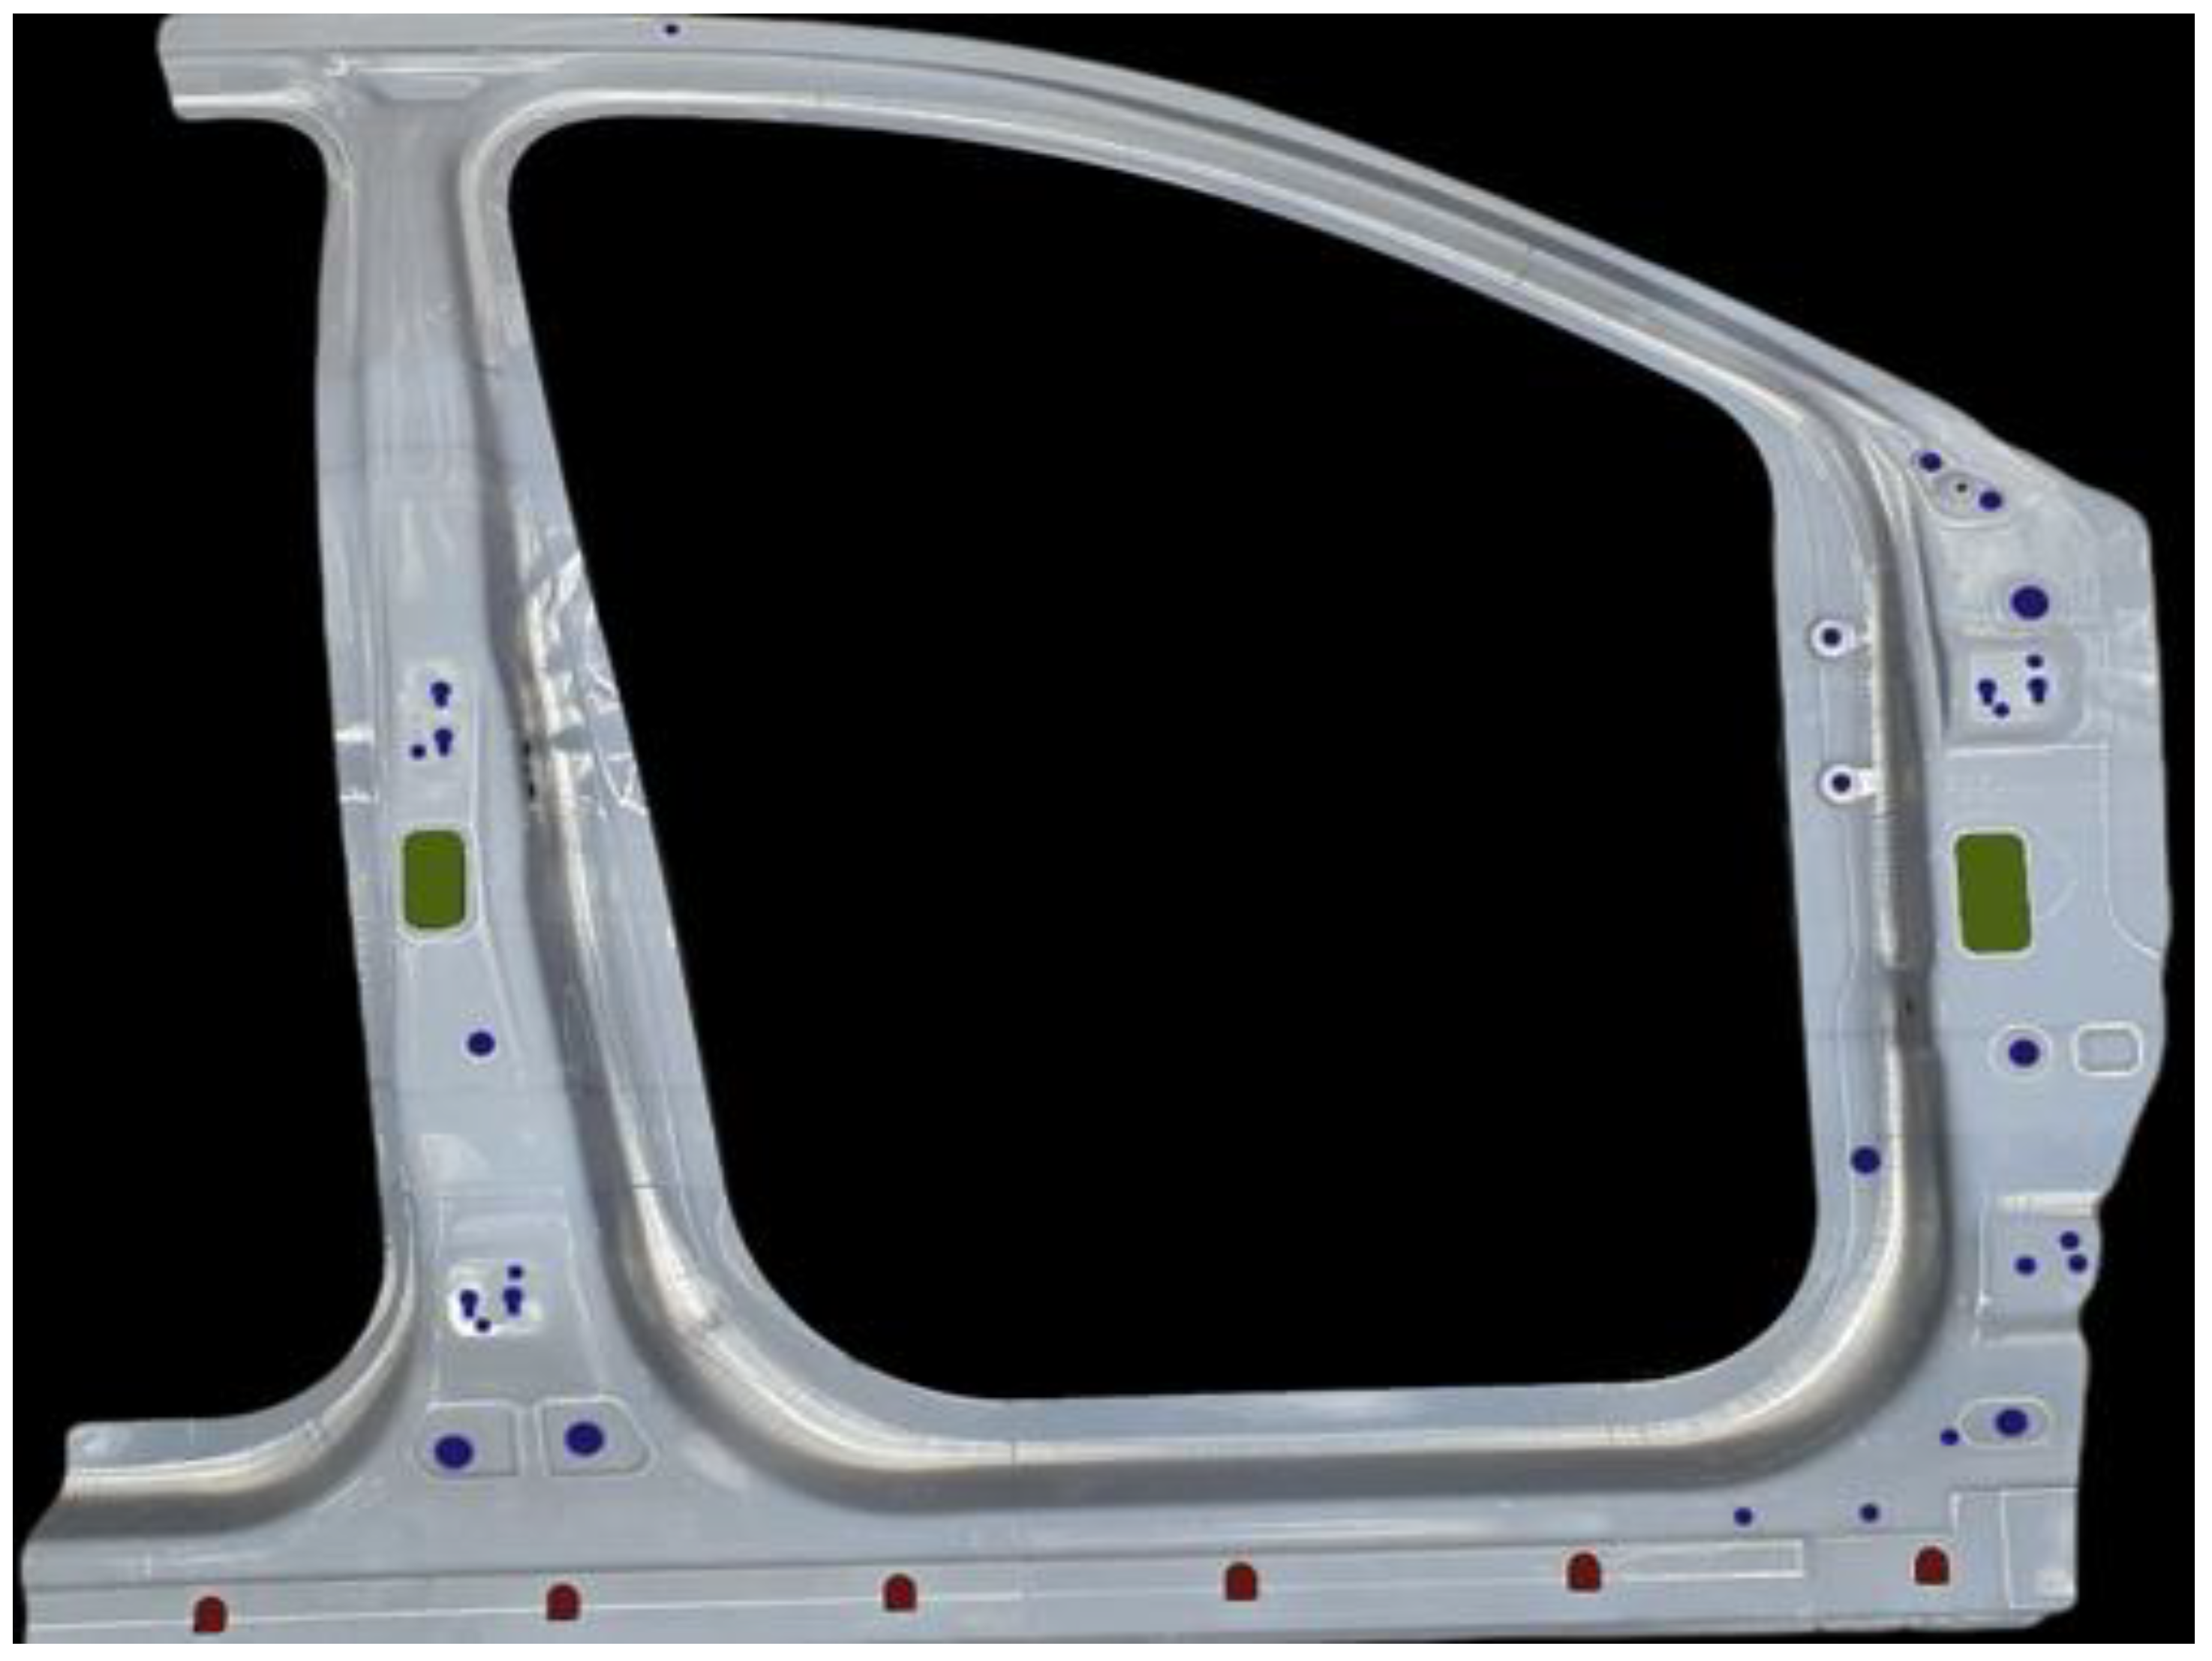
Figure 6.
Telstar plant 3D layout and RODIS location.
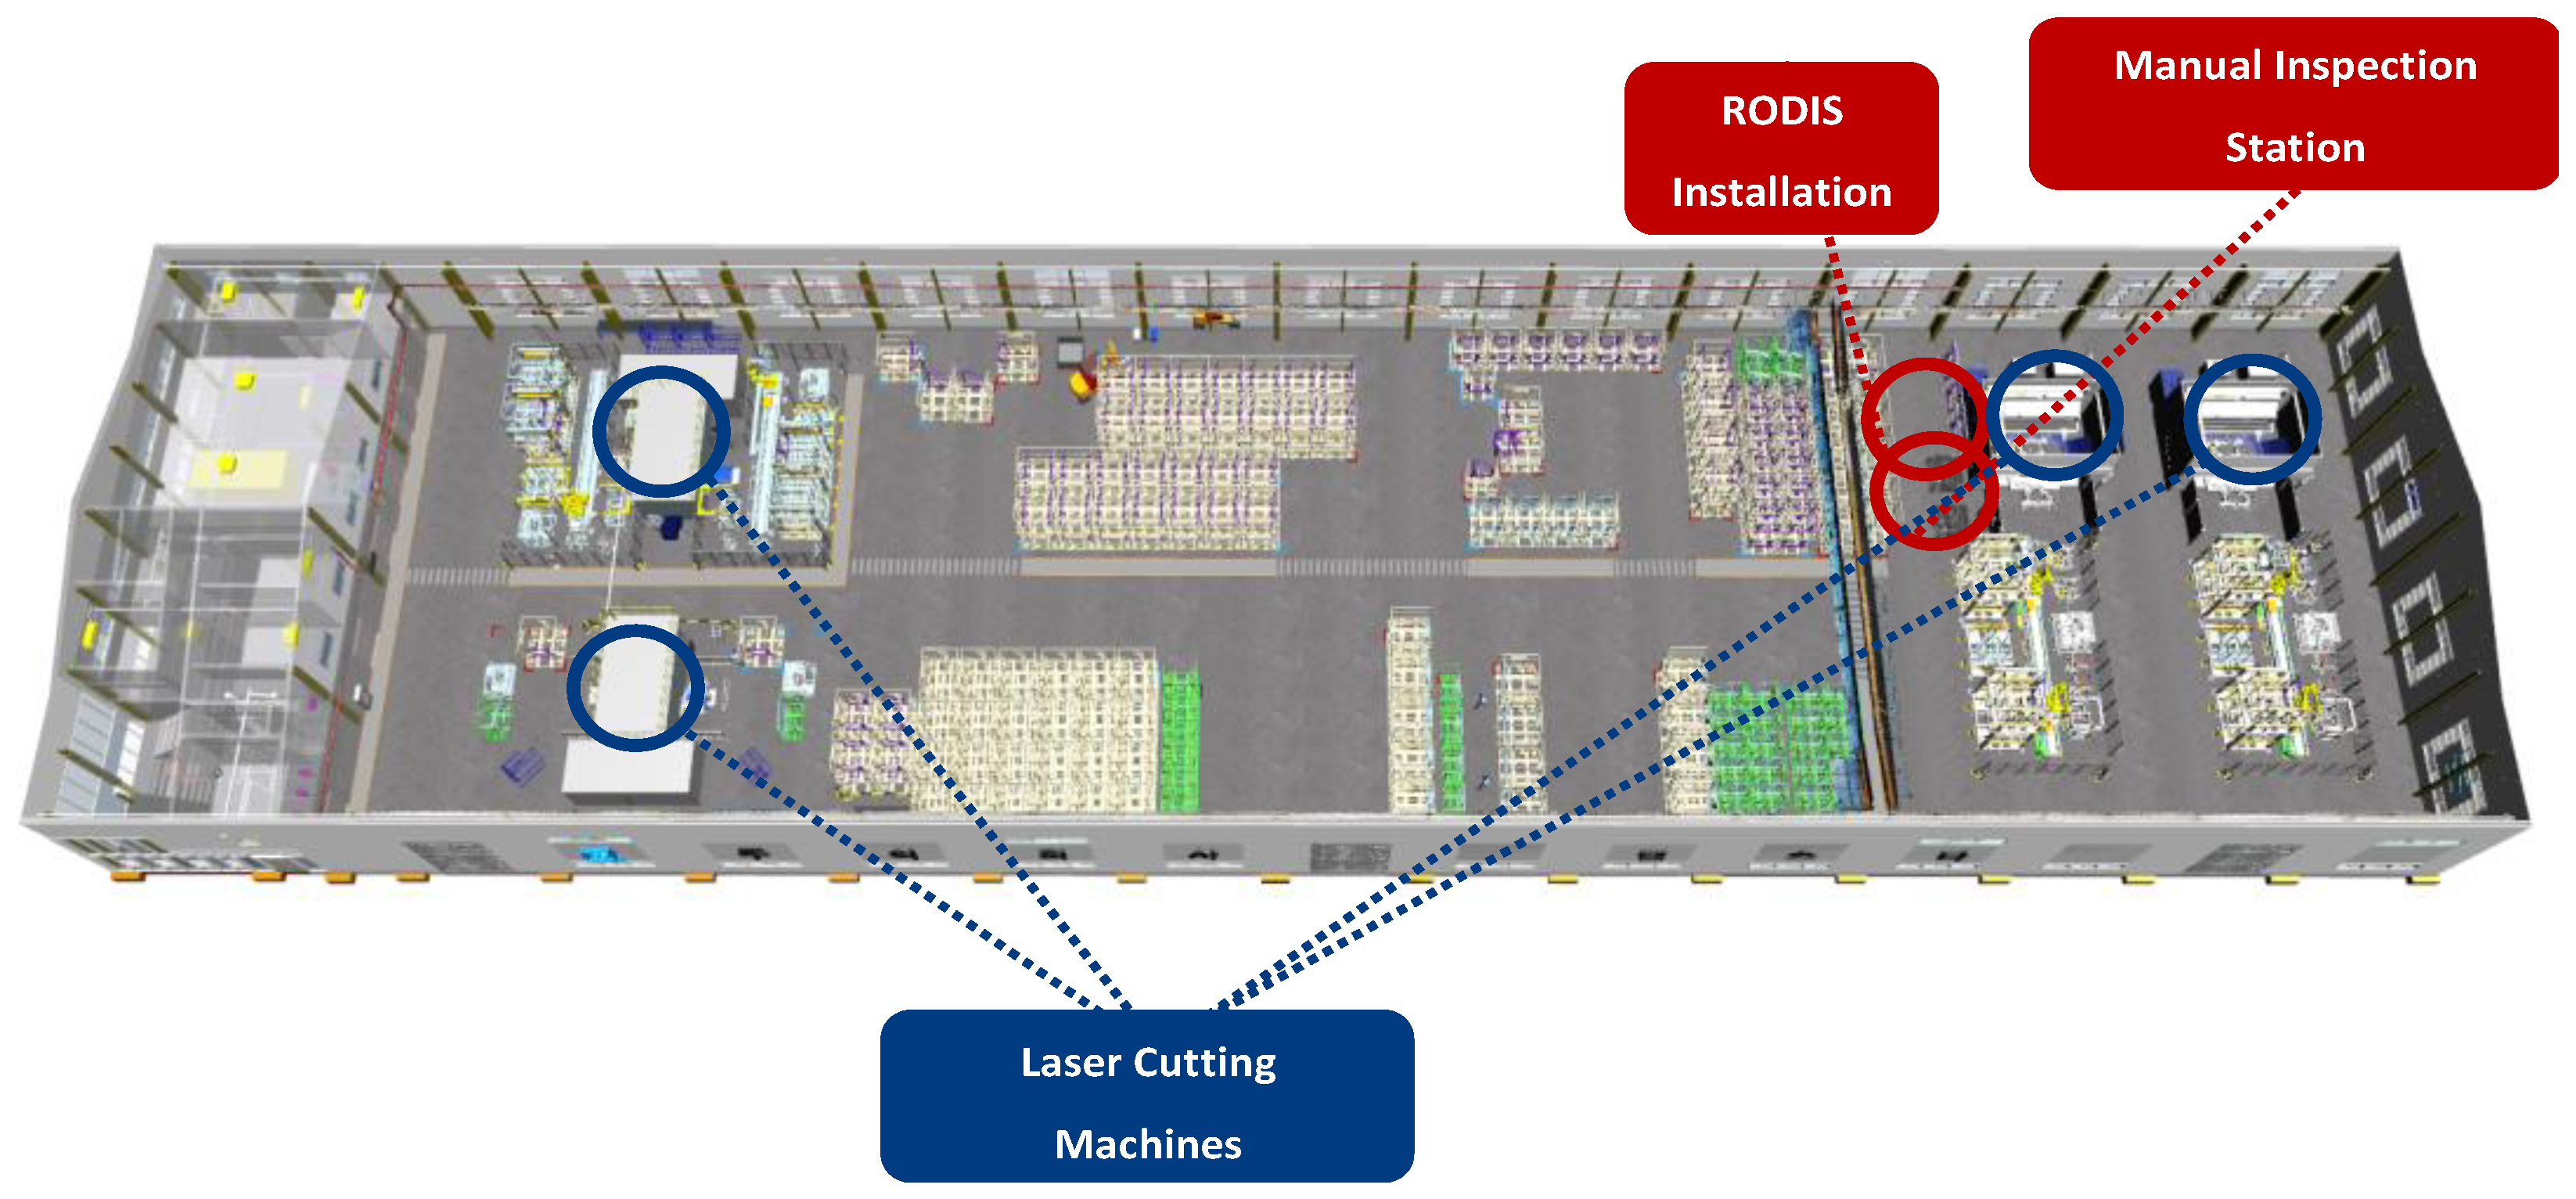
Figure 7.
RODIS implementation on site.

Figure 8.
Calculation of FoV with the adjusted lens specification.
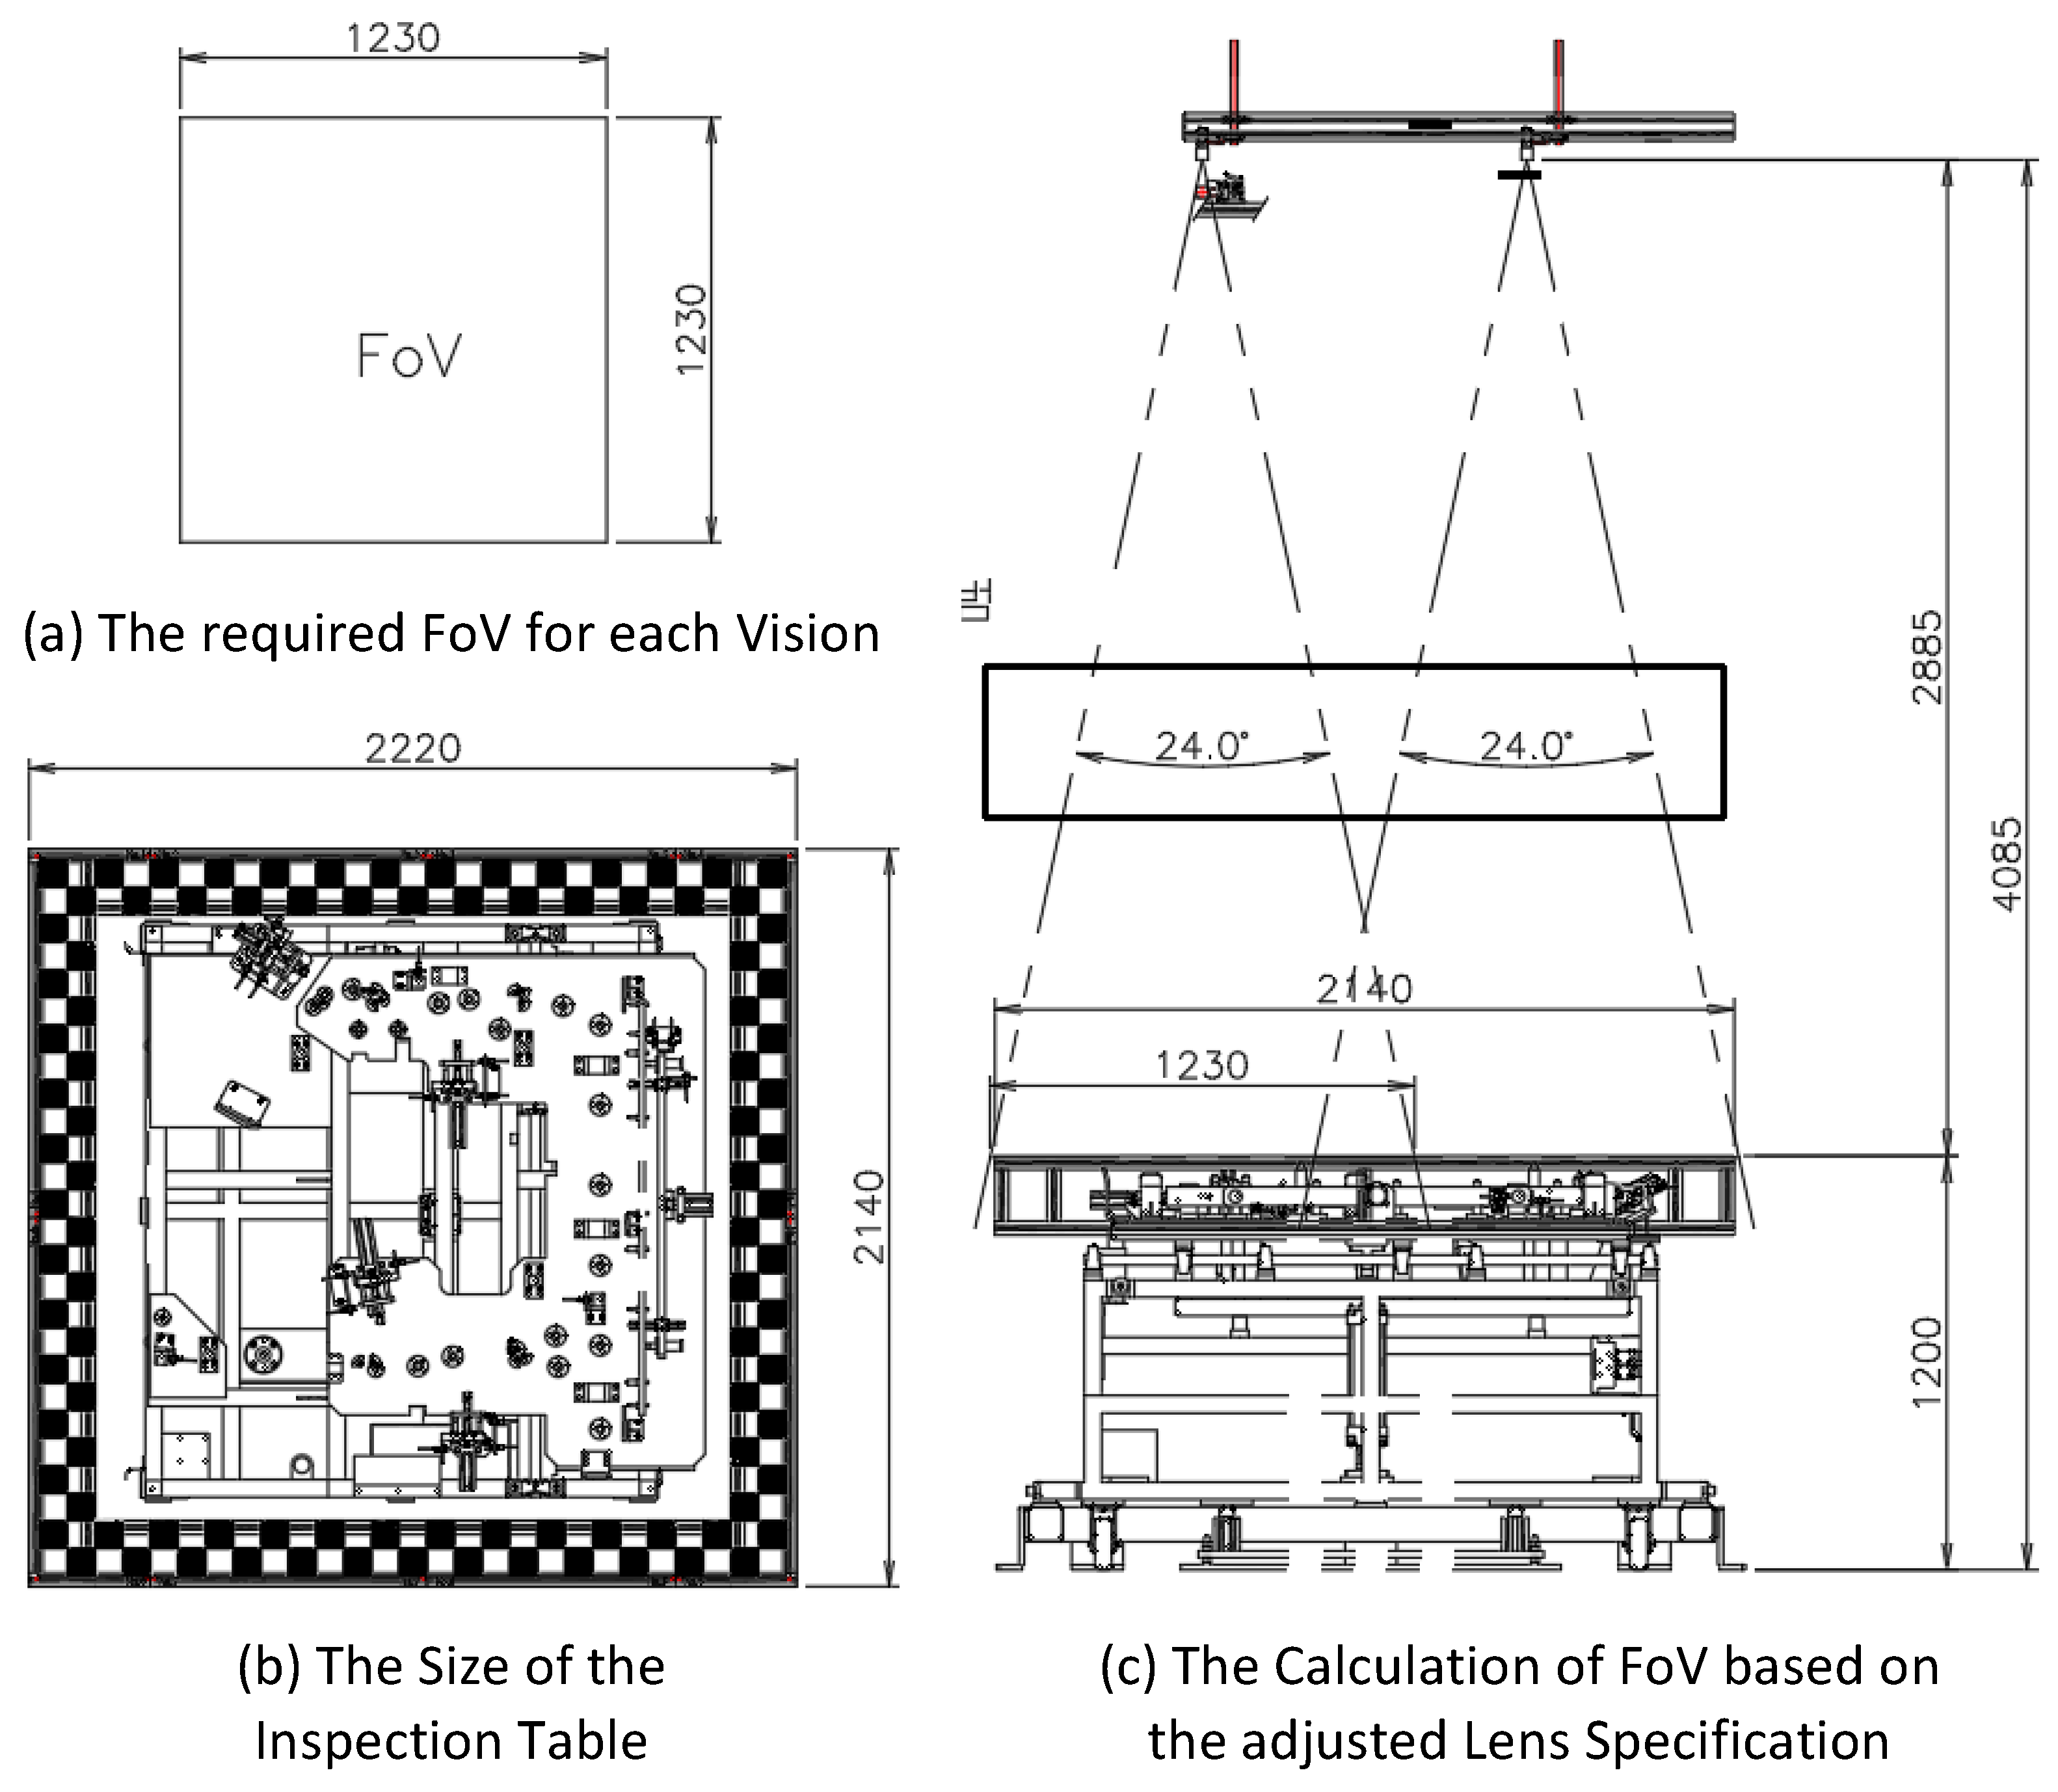
Figure 9.
Image noise.

Figure 10.
Image captured by RODIS.
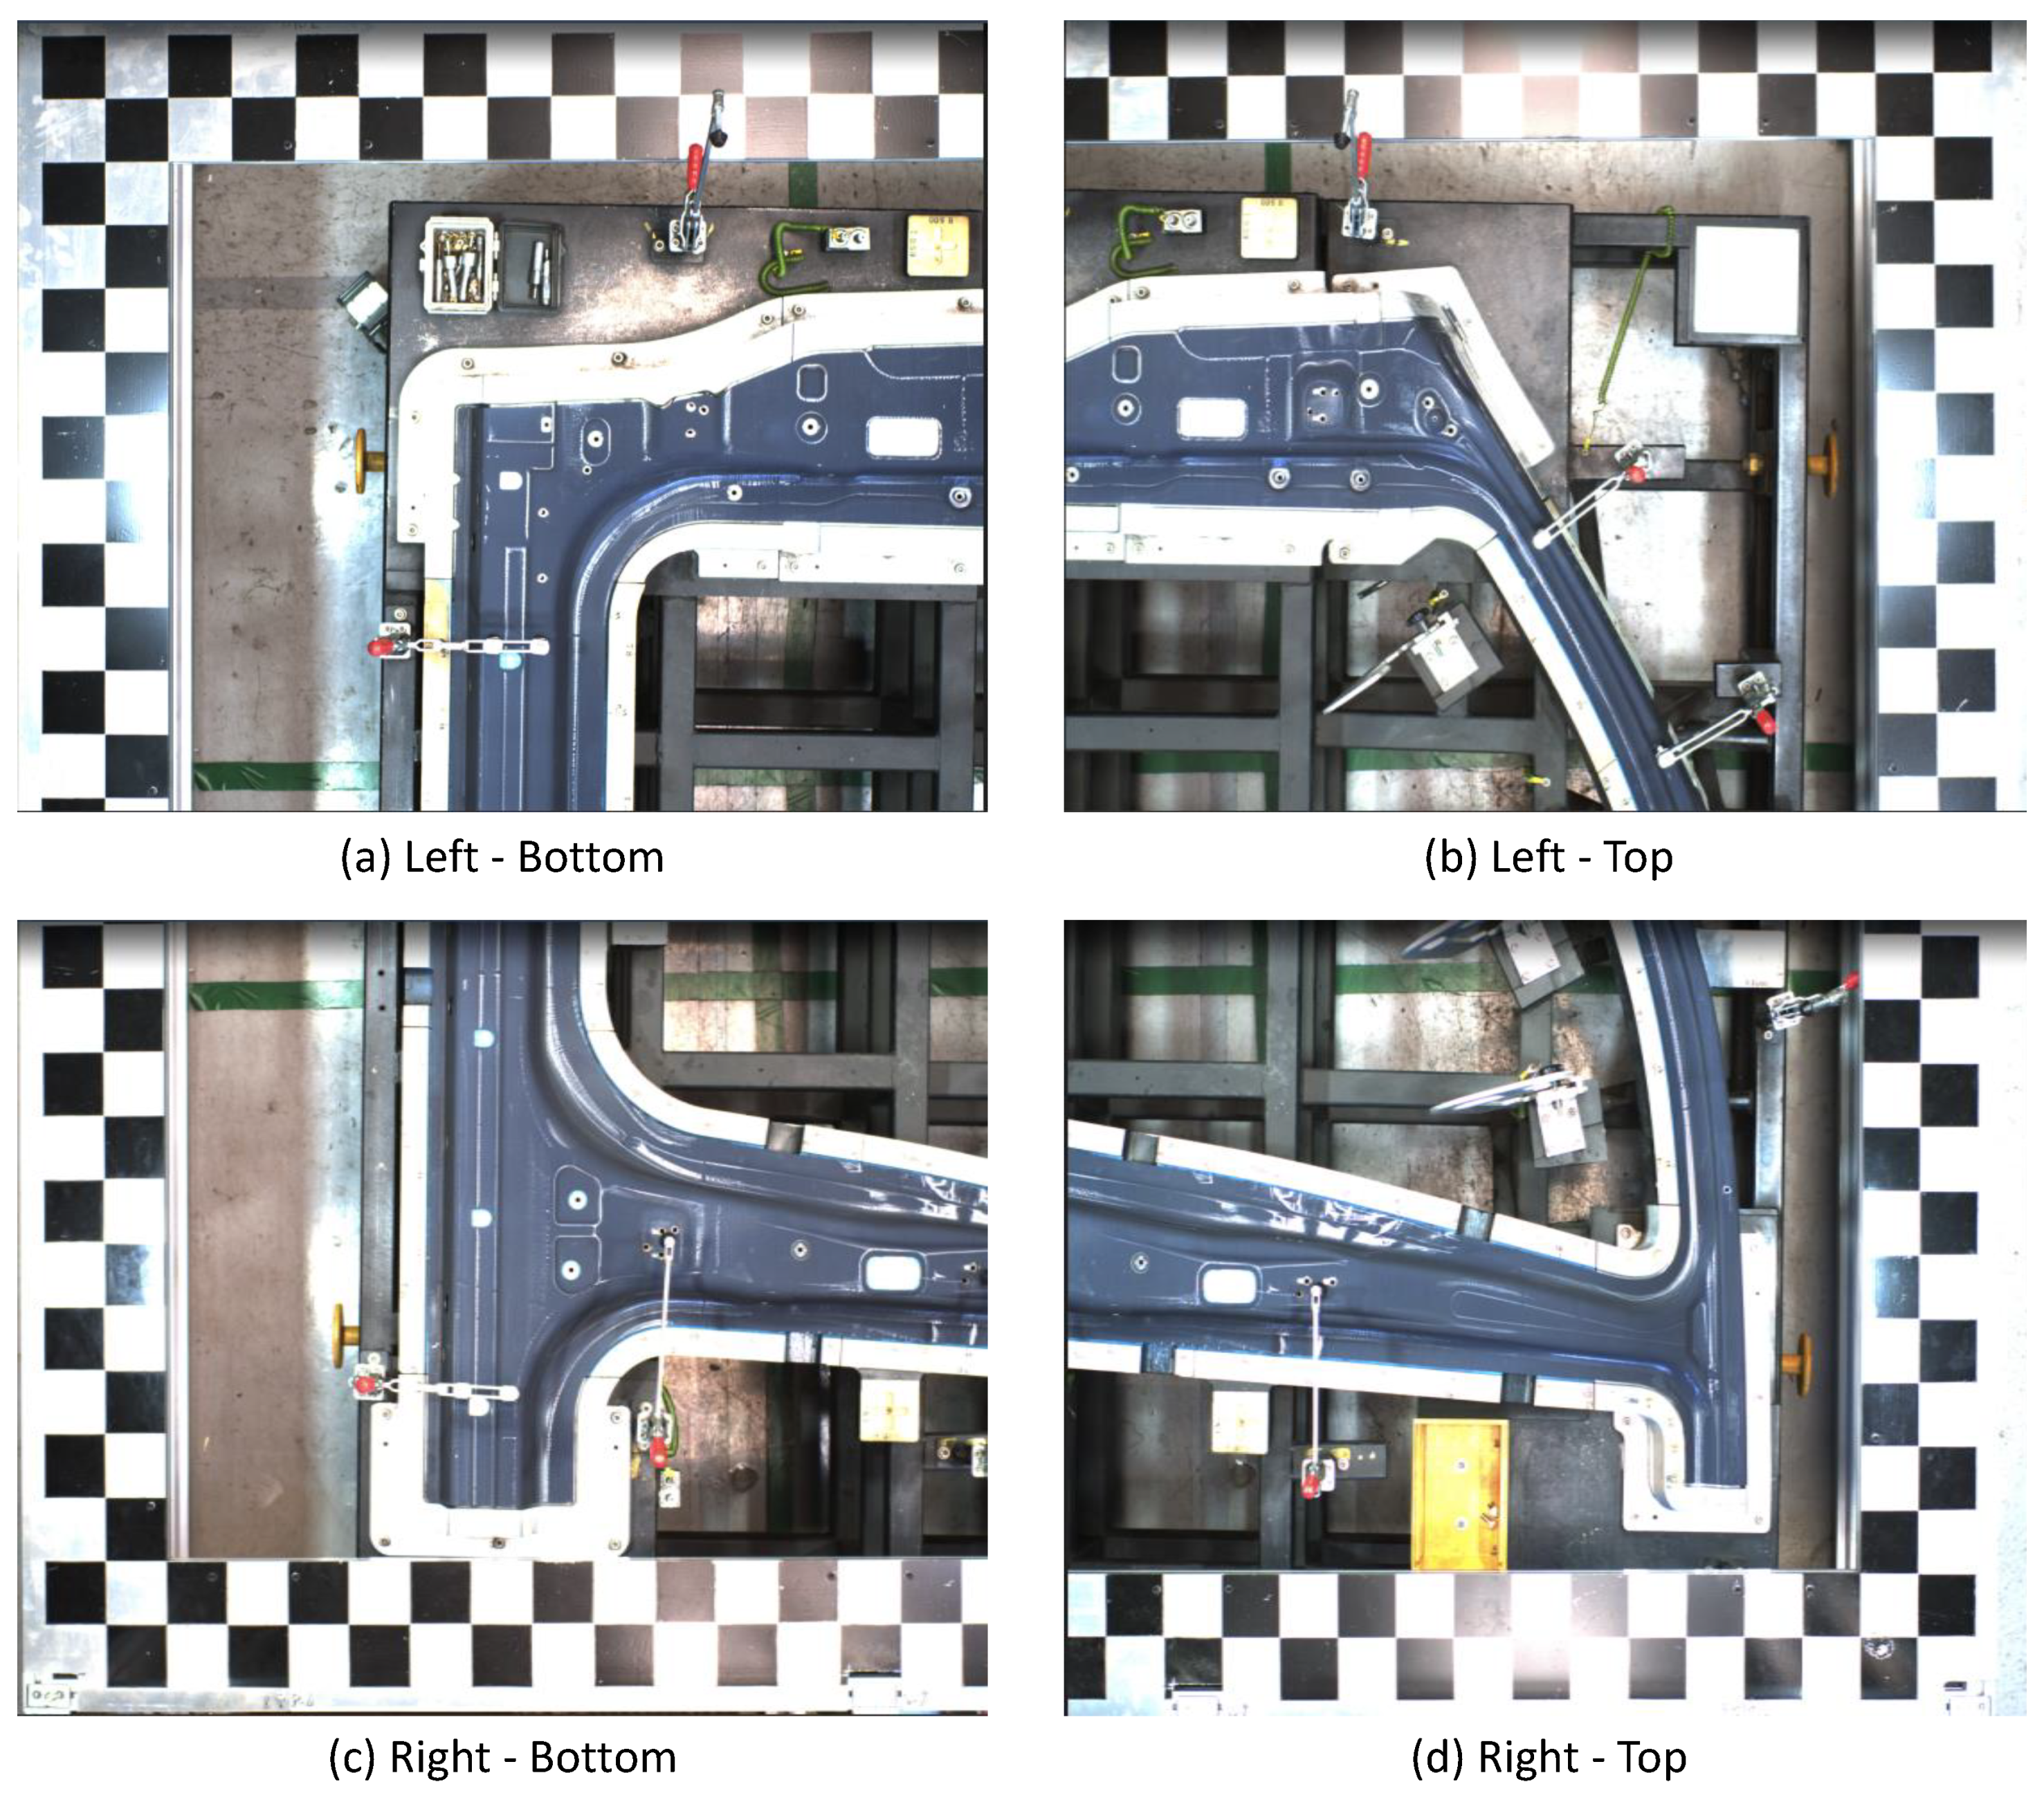
Figure 11.
Loss rate.
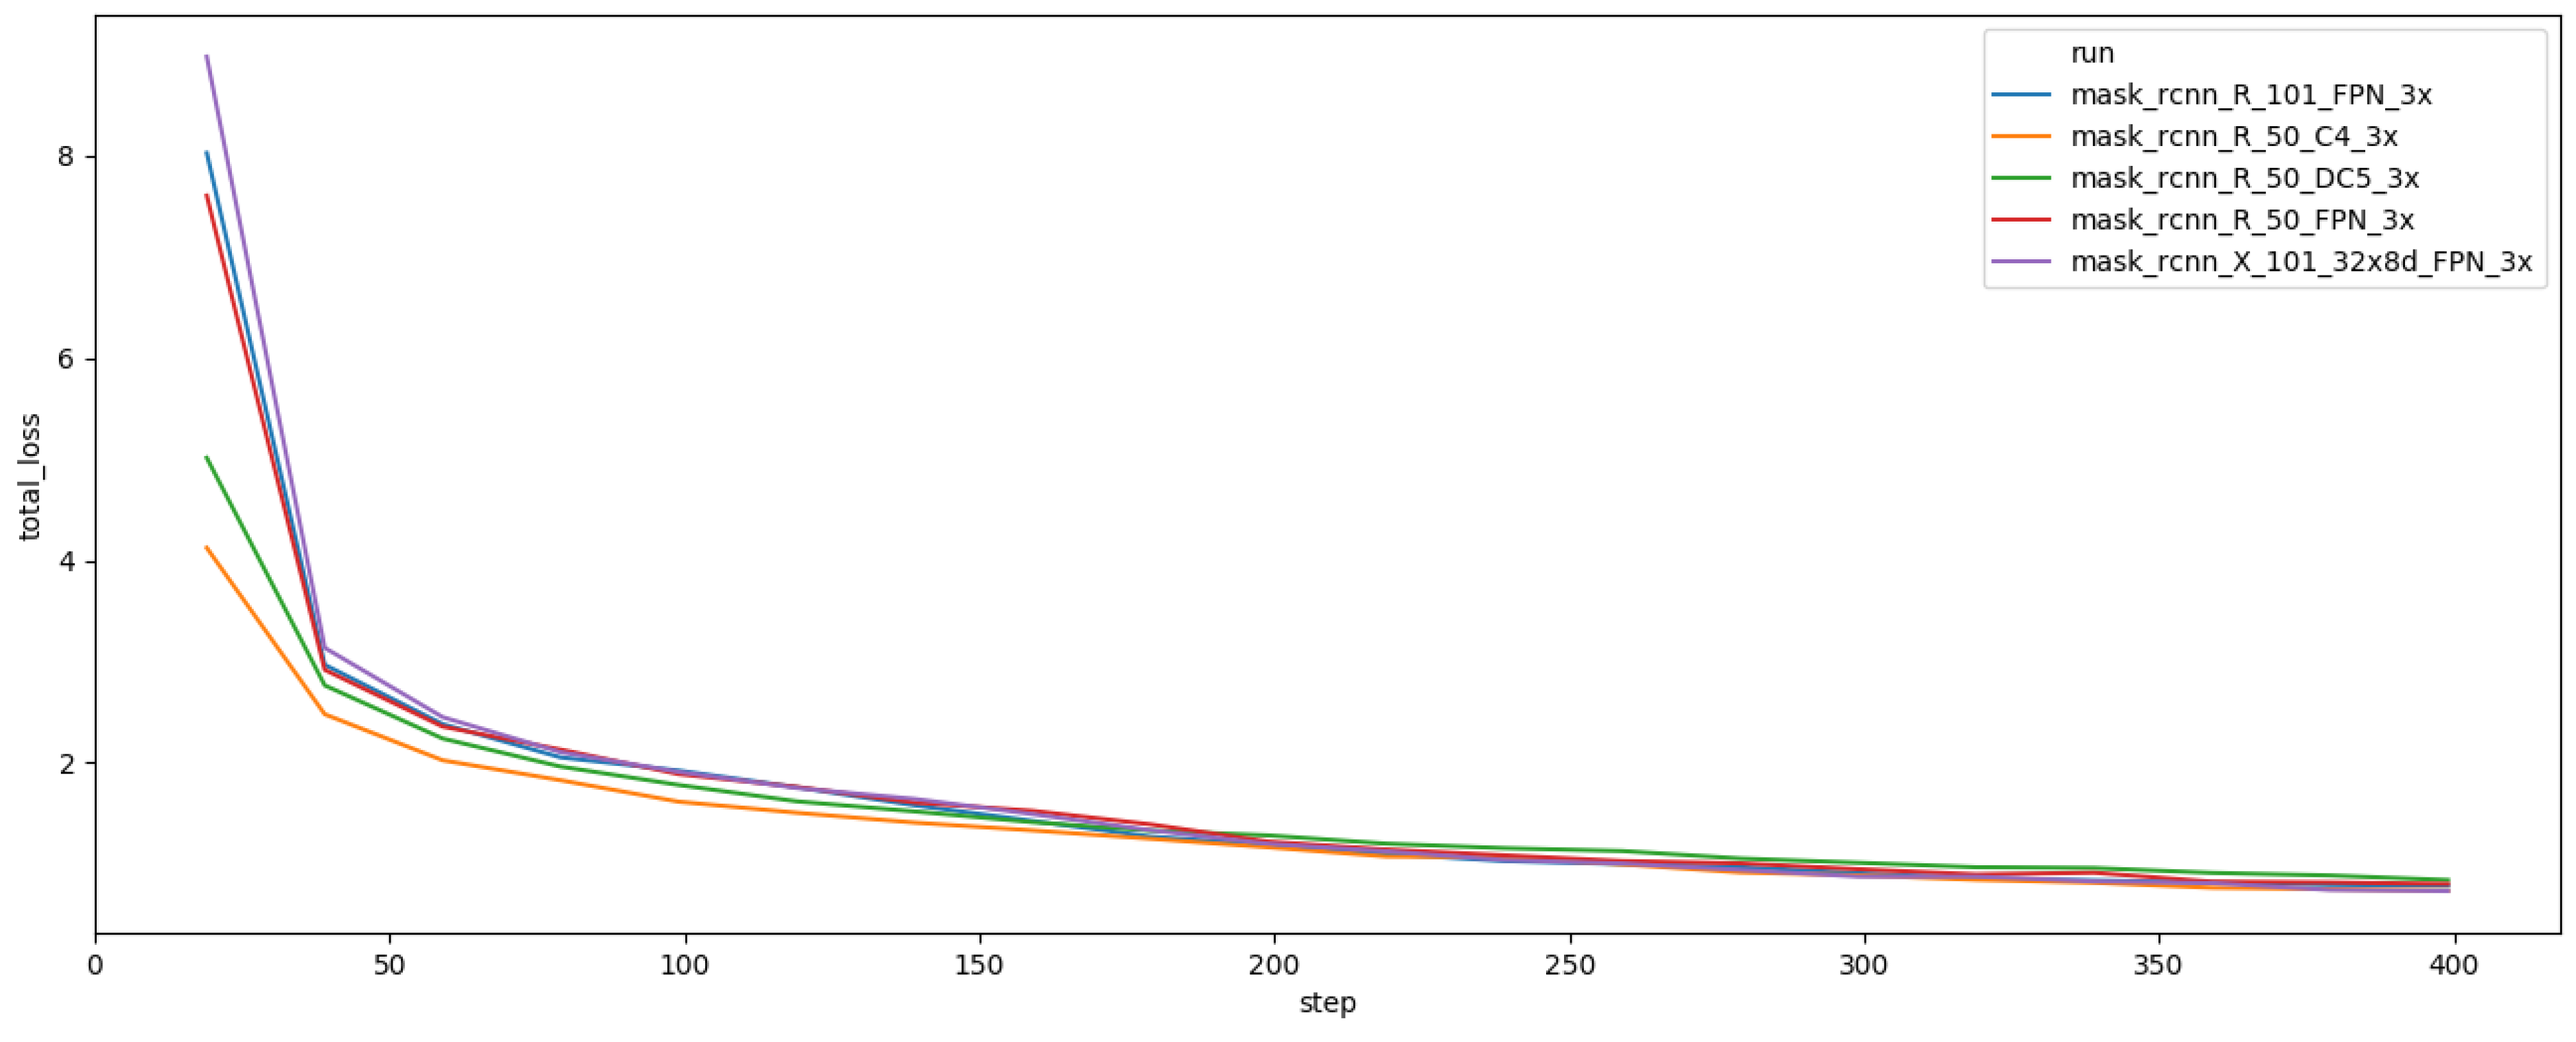
Figure 12.
Accuracy rate.
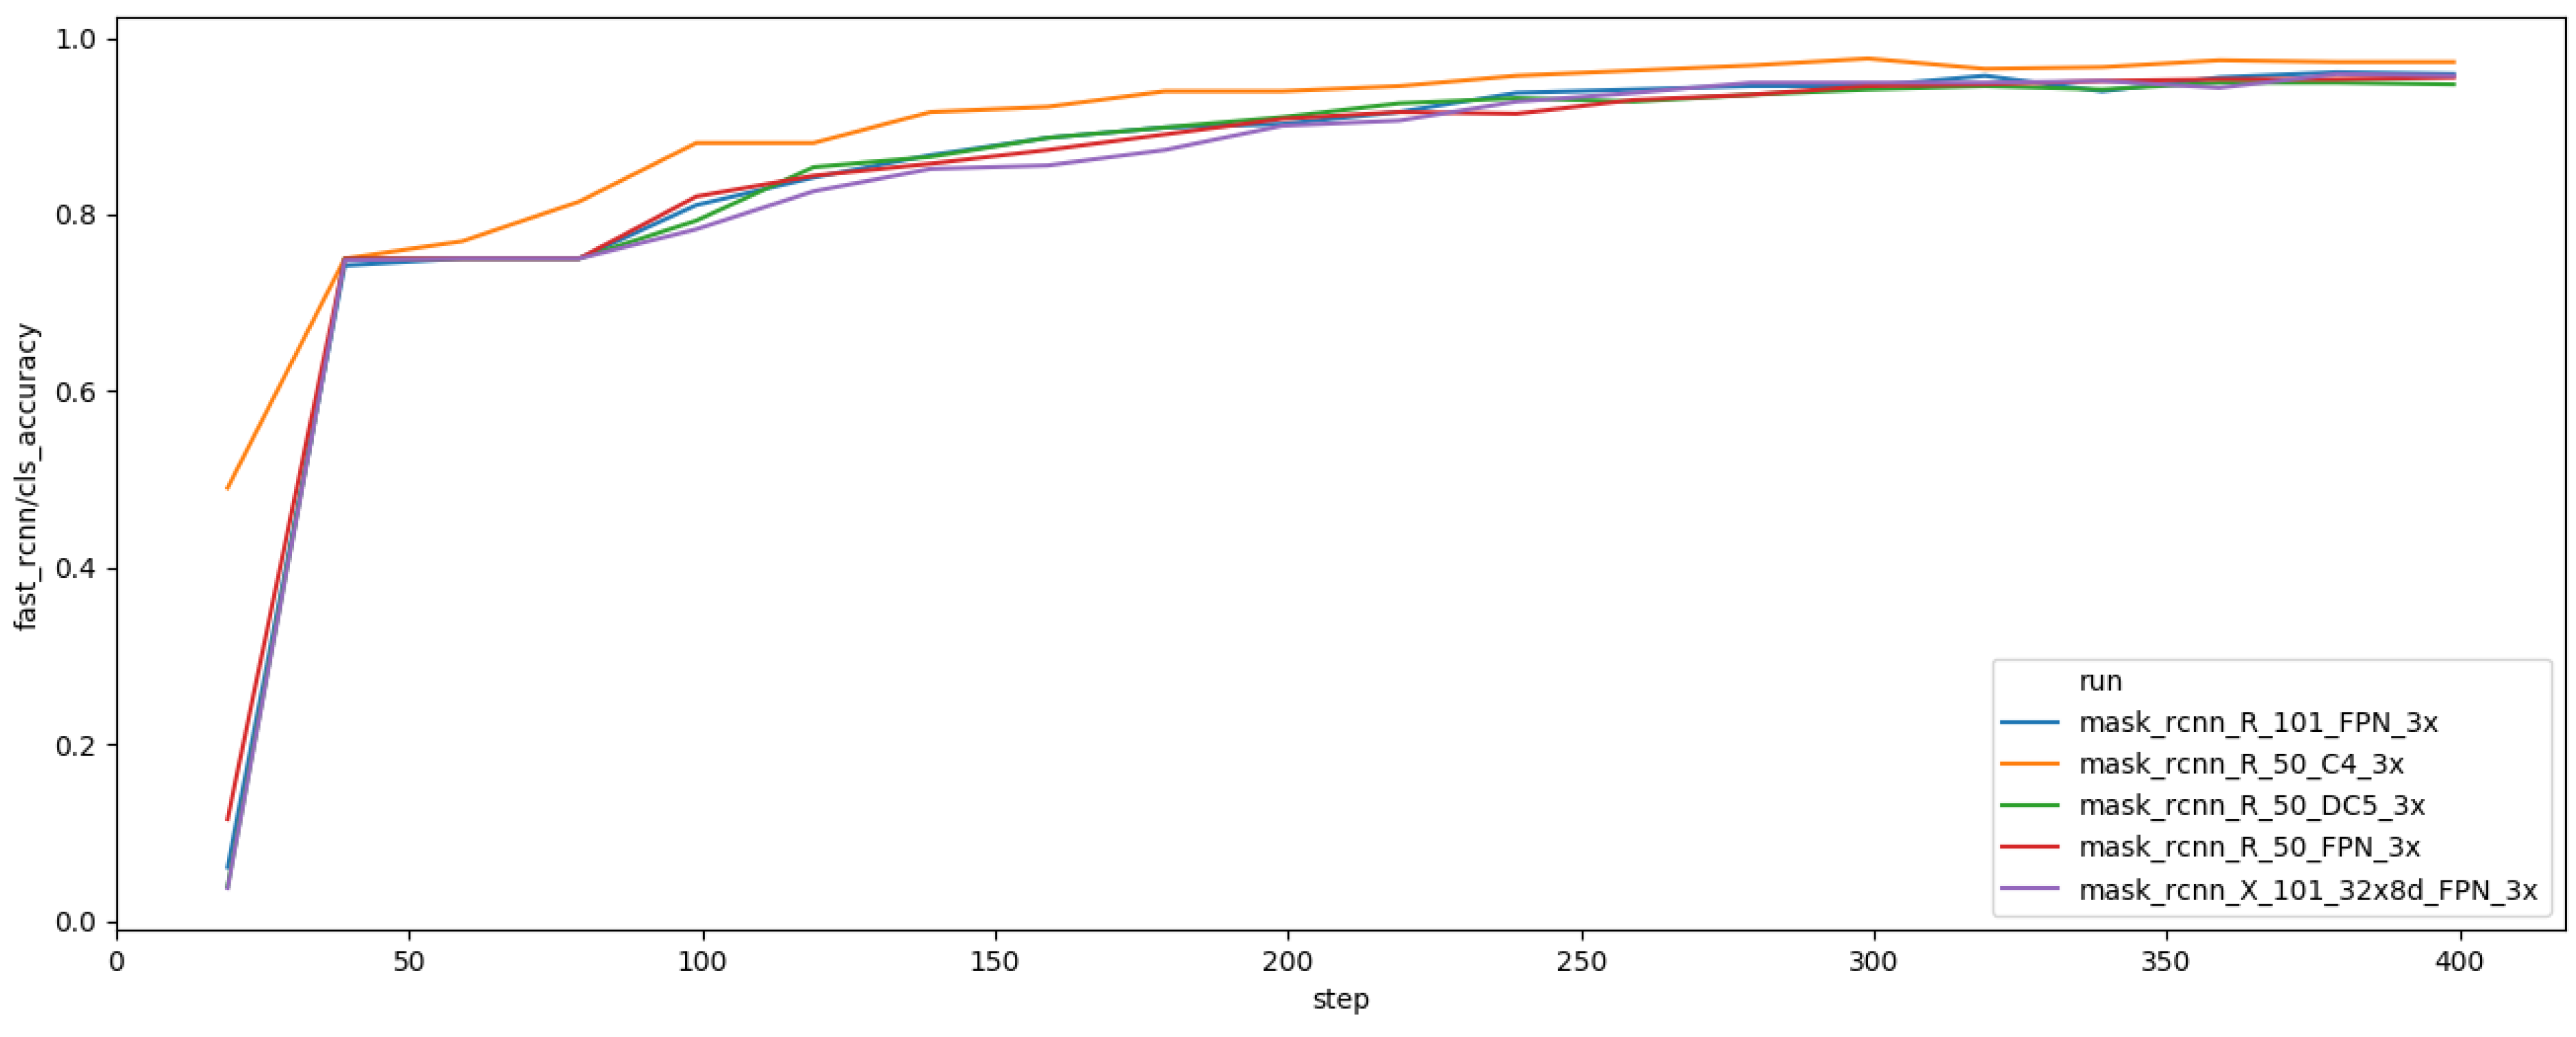
Figure 13.
Bounding-box prediction result.
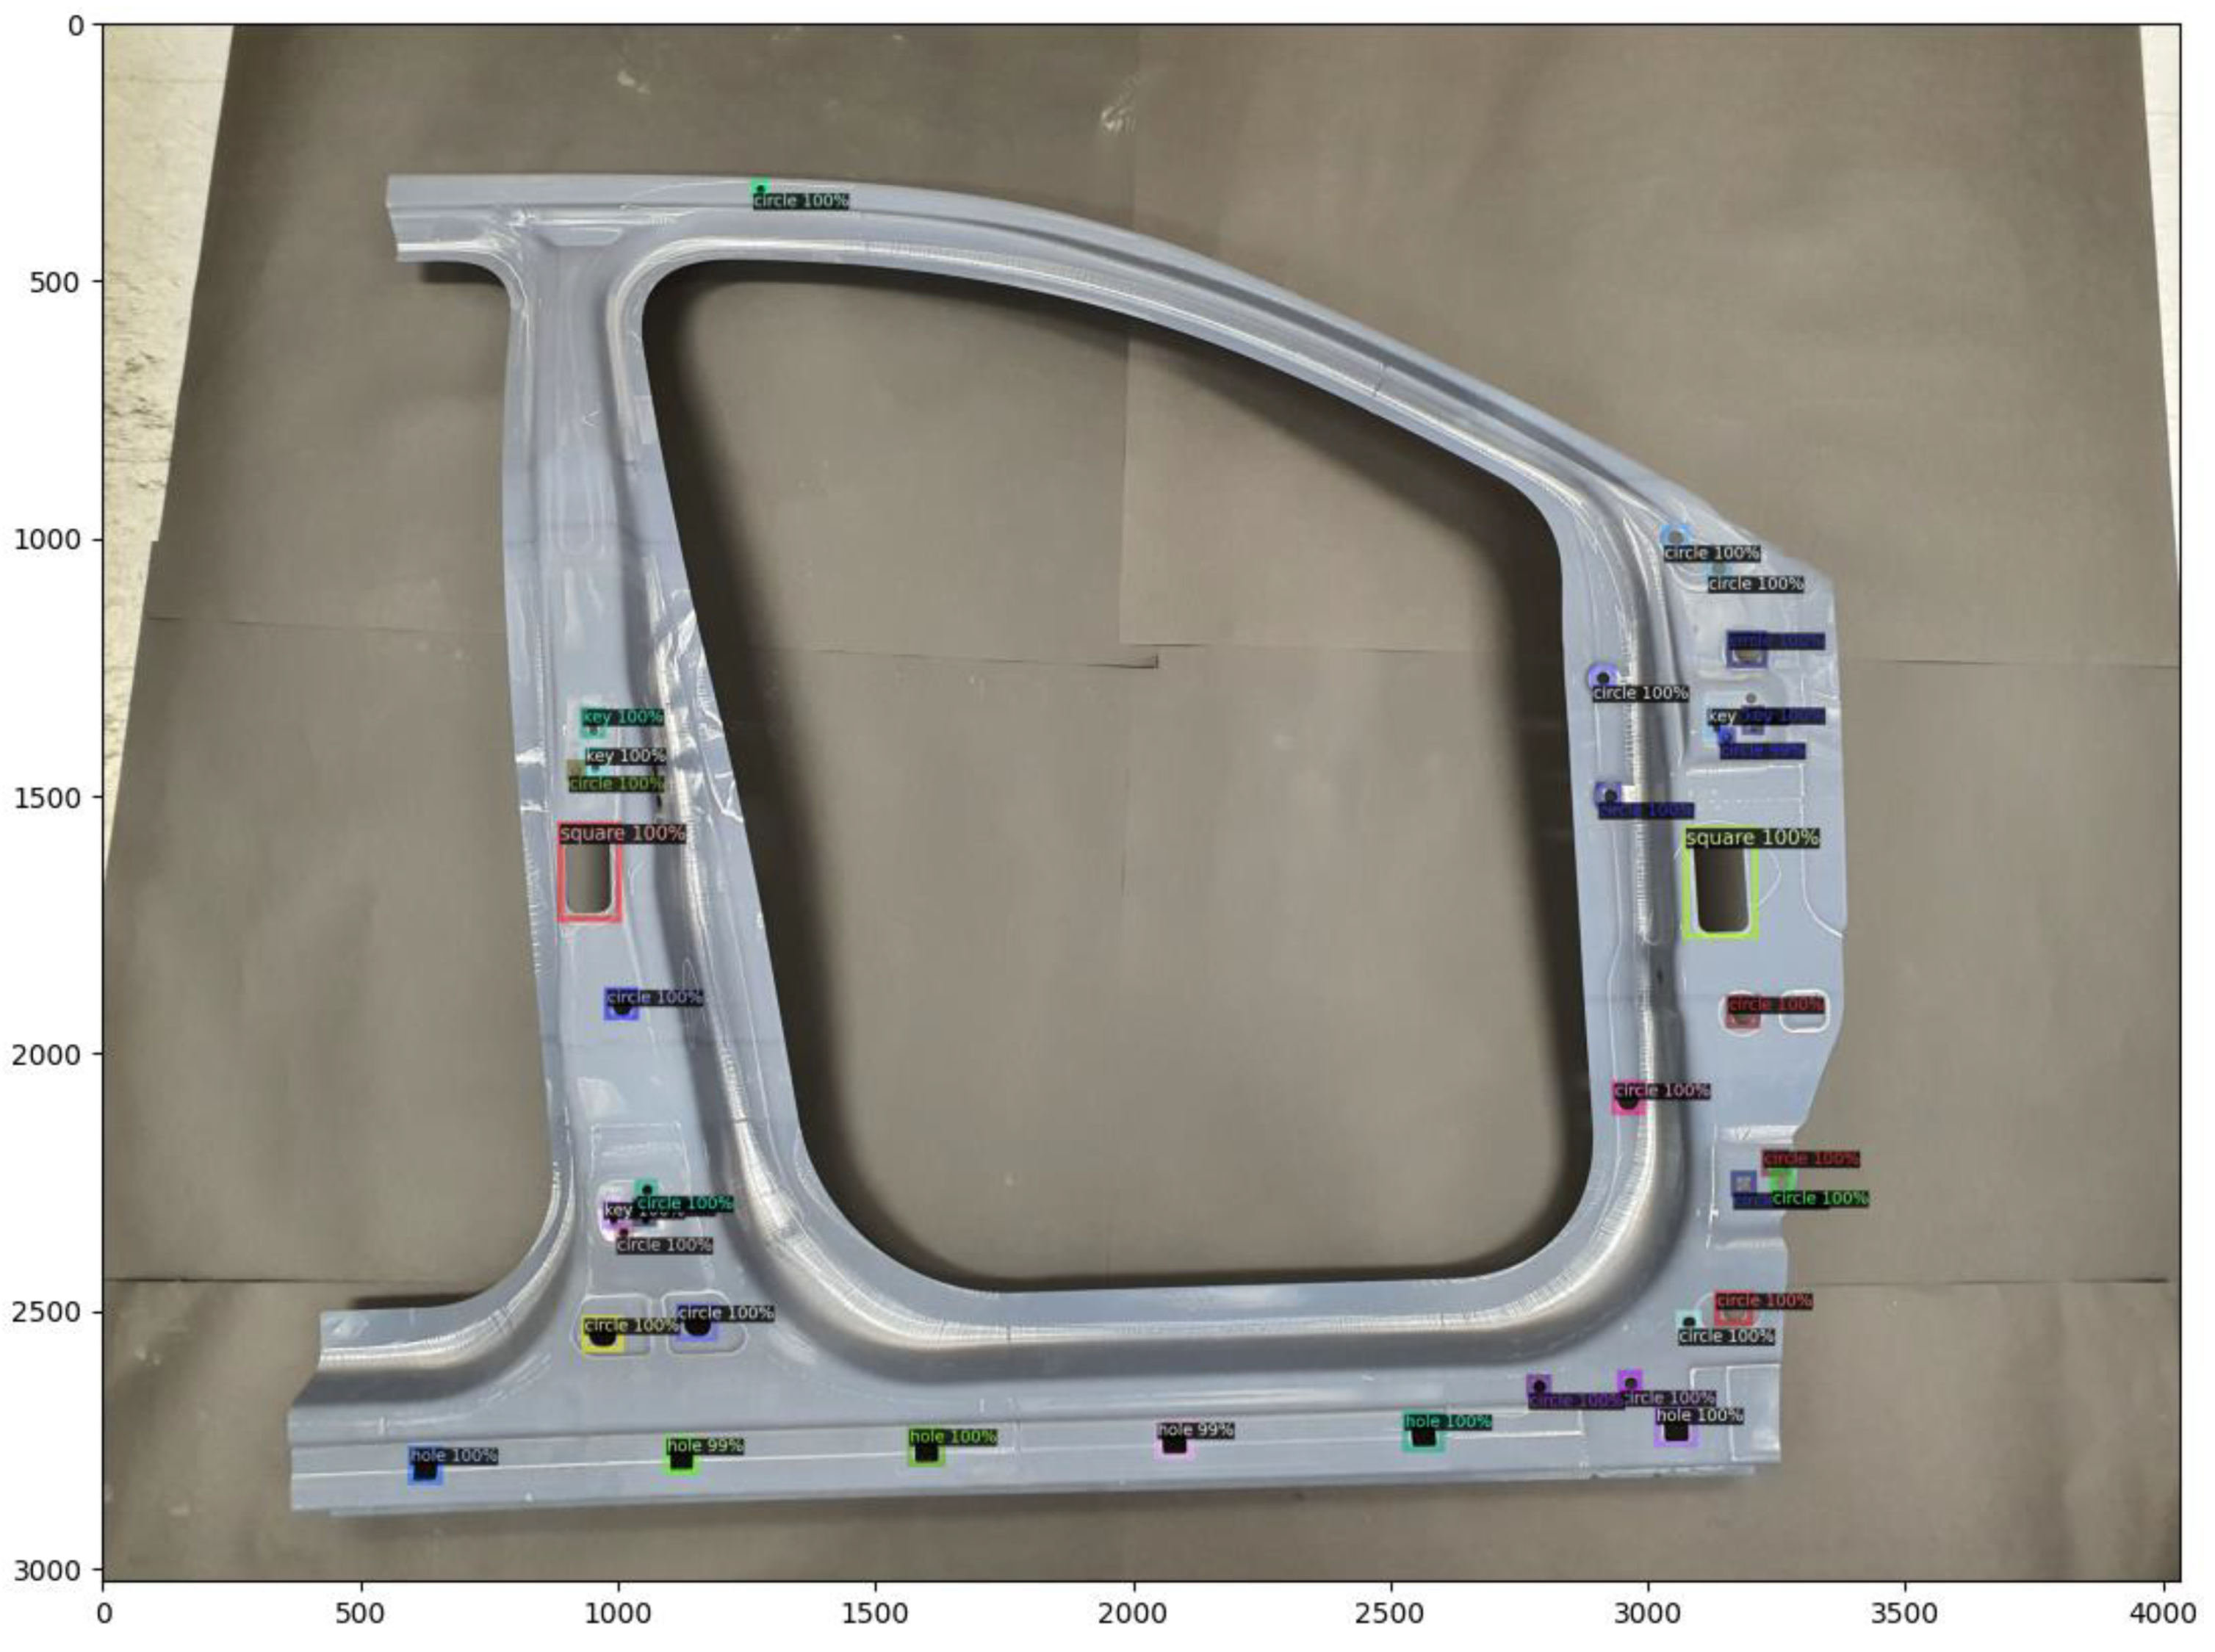
Figure 14.
Object segmentation result.

Table 1.
Labeled data in json format.
| Information | Data Type |
|---|---|
| Area | Int [Scalar] |
| Coordinate | Int [Vector] |
| Category_ID | Int [Scalar] |
| Color | String [Scalar] |
| Height | Int [Scalar] |
| ID | Int [Scalar] |
| Image_ID | Int [Scalar] |
| Bounding Box | Boolean [Scalar] |
| Width | Int [Scalar] |
Table 2.
Data augmentation method.
| Method | Data Type | Input |
|---|---|---|
| ResizeShortestEdge | Int [Vector] | [640, 672, 704, 736, 768, 800] |
| RandomFlip | Boolean | True |
Table 3.
Inspection camera specifications.
| Specification | Tri120s | Tri122s |
|---|---|---|
| Frame rate | 10 FPS | 9.7 FPS |
| Shutter Type | Global | Rolling |
| Resolution (h × v) | 4096 × 3000 px | 4024 × 3036 px |
| Resolution | 12.3 MP | 12.2 MP |
| Pixel Size (h × v) | 3.45 μm × 3.45 μm | 1.85 μm × 1.85 μm |
| Sensor Size | 17.6 mm | 9.33 mm |
Table 4.
Inspection lens specifications.
| Specification | V1228-MPY2 | AZURE-1623ML12M |
|---|---|---|
| Focal Length | 12 mm | 16 mm |
| Angle of View (1.1 type, d × h × v) | 71.1° × 60.5° × 46.2° | 54.39° × 44.56° × 34.45° |
| Angle of View (2/3 type, d × h × v) | 48.6° × 39.6° × 30.1° | 35.67° × 28.85° × 21.83° |
| Distortion | <0.5% | <0.4% |
Table 5.
Different types of backbone network.
| Labeled Name | Baseline | Feature Extraction | Dataset Size |
|---|---|---|---|
| mask_rcnn_R_101_FPN_3x | ResNet-101 | FPN | 37 epochs |
| mask_rcnn_R_50_C4_3x | ResNet-50 | Conv4 * | 37 epochs |
| mask_rcnn_R_50_DC5_3x | ResNet-50 | Conv5 ** | 37 epochs |
| mask_rcnn_R_50_FPN_3x | ResNet-50 | FPN | 37 epochs |
| mask_rcnn_X_101_32xBd_FPN_3x | ResNeXt-101 | FPN | 37 epochs |
Table 6.
Average Precision.
| Backbone Network | AP(BBox) 1 | AP(Mask) 2 |
|---|---|---|
| ResNet-50-FPN | 71.6339 | 86.2131 |
| ResNet-50-C4 | 58.9034 | 64.0677 |
| ResNet-50-DC5 | 64.3613 | 66.3074 |
| ResNet-101-FPN | 71.8172 | 84.8889 |
| ResNeXt-101-FPN | 70.4178 | 85.4494 |
1 Average Precision for bounding box prediction (object detection). 2 Average Precision for masking (object segmentation).
Publisher’s Note: MDPI stays neutral with regard to jurisdictional claims in published maps and institutional affiliations. |
© 2021 by the authors. Licensee MDPI, Basel, Switzerland. This article is an open access article distributed under the terms and conditions of the Creative Commons Attribution (CC BY) license (https://creativecommons.org/licenses/by/4.0/).
Share and Cite
MDPI and ACS Style
Im, D.; Jeong, J. R-CNN-Based Large-Scale Object-Defect Inspection System for Laser Cutting in the Automotive Industry. Processes 2021, 9, 2043. https://doi.org/10.3390/pr9112043
AMA Style
Im D, Jeong J. R-CNN-Based Large-Scale Object-Defect Inspection System for Laser Cutting in the Automotive Industry. Processes. 2021; 9(11):2043. https://doi.org/10.3390/pr9112043
Chicago/Turabian StyleIm, Donggyun, and Jongpil Jeong. 2021. "R-CNN-Based Large-Scale Object-Defect Inspection System for Laser Cutting in the Automotive Industry" Processes 9, no. 11: 2043. https://doi.org/10.3390/pr9112043
Note that from the first issue of 2016, this journal uses article numbers instead of page numbers. See further details here.