Investigation of Ni–Fe–Cu-Layered Double Hydroxide Catalysts in Steam Reforming of Toluene as a Model Compound of Biomass Tar


1
CARTIF Centre of Technology, Parque Tecnológico de Boecillo, 205, Boecillo, 47151 Valladolid, Spain
2
ITAP Institute, University of Valladolid, P del Cauce 59, 47011 Valladolid, Spain
*
Author to whom correspondence should be addressed.
Processes 2021, 9(1), 76; https://doi.org/10.3390/pr9010076
Submission received: 30 September 2020
/
Revised: 23 December 2020
/
Accepted: 28 December 2020
/
Published: 31 December 2020
(This article belongs to the Special Issue Production of Biofuels and Numerical Modeling of Chemical Combustion Systems)
Abstract
:This work focused on the synthesis of a catalyst based on layered double hydroxides with a molar cation concentration Ni/Cu/Fe/Mg/Al of 30/5/5/40/20 and its performance in the steam reforming of toluene as a model compound of biomass tar. Its performance at different temperatures (500, 600, 700, 800, and 900 °C) and steam/carbon molar ratios (S/C ratios) (1, 2, 4, 6, 8) was studied. The contact time used was 0.32 g h mol−1. The catalyst obtained allowed us to reach 98–99.87% gas conversion of toluene with a low carbon deposition on catalyst surface (1.4 wt %) at 800 °C and S/C = 4. In addition, conversions in the range of 600–700 °C were higher than 80% and 90%, respectively, and the type of carbon deposited on the catalyst was found to be filamentous, which did not significantly reduce the performance of the catalyst.
1. Introduction
The increase in demand for energy from fossil fuels that has taken place in recent decades is mainly due to the increase in population and living standards. In order to mitigate this situation, efforts are being made to encourage the substitution of fossil fuels by other renewable energy sources.
Among these alternatives, gasification is presented as a promising technology, in which syngas can be obtained from biomass as a renewable energy source. Gasification of biomass into syngas is expected to be used in various fields such as power generation and the production of hydrogen and liquid fuels (e.g., methanol and Fischer–Tropsch fuel) [1].
However, this syngas also contains some impurities, such as organic tars, which need to be removed before its application. Tars are the main contaminants in the syngas, and its content varies with the type of raw material and gasifier from 5 to 100 g/Nm3. Their maximum allowable content depends on the end use, usually being 5 mg/Nm3 in gas turbines and 100 mg/Nm3 in internal combustion engines [2]. Tars are a complex mixture of aromatic and oxygenated hydrocarbons that may cause several operational problems. Within the compounds that constitute the tar, toluene is among the most important, besides naphthalene, indene, and acenaphthylene [3]. The requirement to remove tars introduces significant cost and complexity into the overall gasification process. Among the different strategies to remove tars from the gas, catalytic steam reforming is a useful technic.
By the other hand, layered double hydroxides (LDHs) are anionic clays that represent a class of layered materials with chemical composition expressed by the general formula
where [(M2+)1−x (M3+)x (OH)2]x+ represents the metal layer and [(An−)x/n · mH2O], the interlayer region [4]; M2+ represents a divalent cation (i.e., Ca2+, Mg2+, Zn2+, Co2+, Ni2+, Cu2+, Mn2+); and M3+ represents a trivalent cation (i.e., Al3+, Cr3+, Fe3+, Co3+, Ni3+, Mn3+); whereas An− is the interlayer anions such as inorganic anions (i.e., Cl−, NO3−, ClO4−, CO32−, SO42−) or complex organic molecules [5]. Moreover, x represents the fraction of the trivalent cation and at the same time determines the electrostatic charge of the sheets. Its value is given by the molar ratio of the valence III and II metals, as follows:
Some natural minerals contain a fixed value of x = 0.33, although the generally accepted range as suitable for the synthesis of LDH compounds is 0.2 ≤ x ≤ 0.33, i.e., an M2+/M3+ ratio between 2:1 and 4:1, in which the structure may be stable [6,7].
LDHs have received special attention due to their relatively simple synthesis, low cost, and excellent catalytic properties. LDHs can be calcined to give a stable and homogeneous mixture of oxides with a very small crystal size. These materials when reduced favor a high dispersion of metals, which contributes to avoid the deactivation of the catalyst [8,9].
On the other hand, nickel-based catalysts have been widely used in tar reforming because of is very effective in reforming of tars [10], whose performance can be improved by the addition of promoters such as Fe, Ce, Cu, Pd, Zn, and Ca [1,5,6,8,9].
In this context, the objective of this work is to study steam reforming of toluene as a tar model compound over nickel-based LDH catalysts.
2. Materials and Methods
2.1. Catalyst Preparation
Ni–Fe–Cu/LDH was prepared by coprecipitation from aqueous solutions at room temperature. Two solutions were prepared—solution A containing metal precursors, and prepared from their respective nitrates: Ni(NO3)2 6H2O, Cu(NO3)2 3H2O, Fe(NO3)3 9H2O, Mg(NO3)2 6 H2O, and Al(NO3)3 9 H2O. Solution A was 4M NO3−2, and was prepared to get the following molar cation concentration: Ni/Fe/Cu/Mg/Al: 30/5/5/40/20. Solution B contained Na2CO3 (0.22 M) and NaOH (3.56 M). Then, 100 mL of solution A and B was slowly dropped by HPLC pumps under vigorous stirring over 100 mL deionized water. To ensure a good mix and dispersion, we used a homogenizer (Model IKA magic, IKA-Werke GmbH & Co. KG, Staufen, Germany) as the reactor. The temperature of the solution was kept constant at 60 °C by means a thermostatic bath. The pH of the solution was also maintained constant during all test by means of a control system that added solution NaOH 1 M to obtain the pH at 10 to ensure the co-precipitation of the metallic salts.
The gel formed was aged for 20 h at 100 °C under reflux in order to improve its crystalline characteristics. The solid obtained was then filtered and washed with distilled water at 90 °C until the solution was a conductivity bellow 30 µS cm−1 [11]. The LDH formed was dried at 105 °C overnight, and then finally crushed and calcined using a heating rate of 5 °C min−1, from room temperature to 800 °C and keeping at this temperature for 3 h.
In order to obtain a greater understanding of the structure of the catalyst, we synthesized three additional LDHs following the same procedure. Table 1 shows the composition of all synthesized LDHs.
2.2. Catalyst Characterization
2.2.1. Chemical Element Analysis
The chemical element analysis of as-synthesized catalysts was performed using the inductively coupled plasma-optical emission spectroscopy (ICP-OES) on the Optima 4300 DV (Perkin Elmer, Waltham, MA, USA). Prior to the analysis, the solid (0.05 g) was dissolved in 4 mL HNO3 and then was heated to 100 °C for 5 min, to 170 for 15 min, and to 240 °C for 10 min; kept in isothermal condition for 15 min; and finally filtered and diluted.
2.2.2. Characterization of the Calcination Process
In order to analyze the calcination, process, we conducted a thermogravimetric analysis (TGA).
Thermogravimetric analysis was performed on a DTG-60H TG-DTA analyzer (Shimadzu Co. Ltd., Kyoto, Japan). The analyses were carried out using air with a flow rate of 50 mL min−1, and a heating rate of 10 °C min−1, from room temperature to 900 °C. The amount of sample analyzed was ≈3 mg. This analysis allowed us to determine the weight loss of a sample as a function of temperature and time (TG curve). In addition, the derivative of the TG signal (DTG curve) helped to determine the number of main thermal processes that took place, as well as their temperature intervals.
2.2.3. Temperature-Programmed Reduction (TPR) Analysis
TPR analyses were performed on Auto Chem II 2920 analyzers (Micromeritics Instrument Corporation, Norcross, GA, USA) with a thermal conductivity detector (TCD) used to quantify the amount of H2 consumed during the analysis.
TPR was used to determine the reducible species and the corresponding reduction temperatures. Before measurement, a 0.20 g sample was dried by passing 50 mL min-1 of Ar up to 150 °C at a heating rate of 10 °C min−1, and holding time under these conditions 30 min. Then, the reduction of the sample was carried out by means of 50 mL min−1 of 5% H2/Ar to 950 °C min−1, heating rate 10 °C min−1, and holding time of 30 min.
2.2.4. X-Ray Diffraction (XRD) Analysis
Powder X-ray diffraction (XRD) measurements were performed on a D8 Discover (Bruker, Billerica, MA, USA) using Cu Kα radiation (λ = 0.154 nm) generated at 40 kV and 40 mA. The identification of the diffraction patterns was performed using the Joint Committee of Powder Diffraction Standards (JCPDS) database.
XRD analyses are suitable for determining lattice parameters and particle diameter. Thus, for example, LDHs are a hexagonal system whose most significant lattice parameters are a and c—a represents the average cation-cation distance within the layers and c represents the distance between the brucite-like layer and the inter-layer [12,13]. The relationship between lattice parameter and interplanar spacing dhkl is given by
where (h, k, l) are Miller indices, a and c are the lattice parameters, and d is interplanar spacing [14]. Lattice parameter a and c are calculated from the (110) and (003) plane, respectively obtained from Equations (4) and (5).
The interplanar spacing of the (110) and (003) crystal planes was estimated by Bragg’s law, which can be represented by Equation (6).
where n, λ, and θ are the order, X-ray wavelength, and diffraction angle, respectively.
Using Equations (4)–(6) and the diffraction angle obtained from the XRD pattern, we can obtain the lattice parameters a and c.
The crystallite size (D) was calculated by Scherrer Equation (7)
where K is the shape factor (K = 0.89), β is the full width at half maximum (FWHM) of the analyzed diffraction peak in radians, and θ is the Bragg angle.
A similar procedure was used to determine the lattice parameters of calcined and reduced LDHs, but using Equation (8), which is characteristic of a face-centered cubic (fcc) structure such as that of NiO and metallic Ni.
2.2.5. Textural Properties
Specific surface area (BET) pore volume and average pore diameter of both as-synthesized and calcined catalysts were measured via N2 adsorption at 198 °C using a surface area analyzer Autosorb-1C (Quantachrome Instruments, Boynton Beach, FL, USA). Surface area (SBET) was analyzed using Brunauer–Emmett–Teller (BET) theory, and average pore diameter by Barrett–Joiner–Halenda (BJH) procedure.
2.2.6. Scanning Electron Microscopy (SEM)
A high-resolution scanning electron microscope (SEM) FEI ESEM Quanta 200 (FELMI-ZFE, Graz, Austria) was used to analyze the surface morphology of the as-synthetized and used catalyst.
2.2.7. Type and Amount of Carbonaceous Species Deposited on the Catalyst
The type of carbonaceous material deposited on the surface of the catalyst at the end of the steam reforming reaction was performed on a DTG-60H TG-DTA analyzer (Shimadzu Co. Ltd., Kyoto, Japan). The analyses were carried out using air with a flow rate of 50 mL min−1, and a heating rate of 20 °C min−1, from room temperature to 1000 °C. The amount of sample analyzed was ≈3 mg. This method was used to determine the type of carbon deposited by its relationship to its oxidation temperature [15].
The amount of carbon formed on the surface of the catalyst after reaction was measured using an elemental TruSpec CHN analyzer (Leco, St. Joseph, MI, USA).
2.3. Catalytic Tests
Steam reforming of toluene used as a model compound of tar was carried out using a fixed-bed reactor made of Hastelloy alloy steel, with an inner diameter of 10 mm and a length of 500 mm (Figure 1). The reactor was heated by a tubular electric furnace coupled to the reactor. The process temperature was measured by a K-type thermocouple placed in the center of the bed and controlled using a controller in closed loop (DEMEDE, Spain).
In each test, 250 mg of calcined catalyst was placed in the middle of the reactor on a 316 stainless steel sintered porous metal filter disc with an internal pore size of 40 µm. Quartz wool was used above and below the bed to help catalyst inside the reactor.
Prior to each test, the system was purged with 50 mL min−1 N2 for 15 min, and then the catalyst was reduced with a flow of H2 and N2 (H2/N2 = 50/20 mL min−1) at 900 °C for 2 h to transform Mg(Ni,Al)O periclase species of Ni2+ into well-dispersed Ni particles [16]. After reduction, the system was purged again with 50 mL min−1 N2 for 15 min while the temperature was kept at the desired temperature of the steam reforming 500–900 °C.
Once the system was purged, the steam reforming reaction was started, with the duration of each test being 1 h. To do this, the water and the toluene were fed into a preheater by means of a HPLC pump and syringe pump, respectively. Moreover, to ensure a concentration of toluene in the gas phase of 1.50 vol %, we fed a current of N2 into the preheater through a mass flow controller. This preheater was maintained at 250 °C in order to ensure a complete vaporization of the feedstock before entering the fixed bed reactor containing the catalyst. To prevent condensation and to ensure that feedstock was maintained in a homogeneous vapor phase, we placed the preheater and the reactor in a chamber that was kept warm at 200 °C.
The reaction products were then passed through a cold trap to condense unreacted toluene and water in the effluent stream. All the non-condensed gases (H2, N2, CO, CO2, and CH4) were analyzed online by gas chromatography using a chromatograph MicroGC CP4900 (Varian Inc., Palo Alto, CA, USA) with two channels, one equipped with a molecular sieve column and another one with a Polar Plot Q column, and both coupled to a thermal conductivity detector (TCD). The unreacted toluene and benzene produced were collected at the end of each test and analyzed offline by gas chromatography, using a 6890 N gas chromatograph coupled with mass spectrometer 5973 Network (Agilent, Santa Clara, CA, USA).
Different tests were developed using reaction temperatures of 500, 600, 700, 800, and 900 °C and steam/carbon molar ratios (S/C ratios) of 1, 2, 4, 6, and 8. The total flow rate of the product gases was calculated by means of a mass balance to the nitrogen stream. The contact time in the steam reforming reaction was calculated in all tests to be W/F = 0.32 g h mol−1. F is the total molar flow of the feedstock (toluene, water, and nitrogen) and W represents the weight of the catalyst.
Table 2 summarizes the operating conditions for each S/C ratio. As can be seen in Table 2, the toluene flow rate was kept at 0.2 mmol min−1, the water flow rate was adjusted to obtain the desired S/C, and the nitrogen flow rate was adjusted to ensure the same concentration of toluene in the feedstock and the same contact time.
Benzene yield was evaluated by a carbon balance between the carbon from the benzene formed and the carbon from the toluene at the feed, as shown in Equation (9).
In the same way, the conversion of toluene to gases was calculated by a carbon balance between the carbon from the gaseous products formed (CO, CO2, and CH4), and the carbon from the toluene at the feed.
where nCO, nCO2, nCH4, and nC7H8 represent the molar flow rate of CO, CO2, CH4, and toluene, respectively.
The molar gas composition of each gas (H2, CO, CO2, and CH4) was calculated as Equation (11).
3. Results and Discussion
3.1. Catalyst Characterization
3.1.1. Chemical Element Analysis Results
The chemical element analysis of as-synthesized and calcined catalysts is showed in Table 3.
The results showed that the LDH obtained corresponded to the one initially synthesized, although a slightly higher substitution of Mg2+ by M2+ cations (Ni2+ and Cu2+) was observed. These results also showed that the precipitation of the compounds took place almost in its totality, without important loss of reagent. After calcination at 800 °C, it was also observed that the composition remained almost constant.
3.1.2. TGA of the As-Synthesized Ni–Fe–Cu/LDH
The calcination process of the as-synthesized Ni–Fe–Cu/LDH was studied by performing TGA analysis (Figure 2).
The TG curve (Figure 2) showed three main regions of mass loss. The first region was observed between ambient temperature up to 210 °C, which was related with the first two peaks in the DTG signal with maximum values at 100 and 180 °C. The first peak of the DTG curve (peak I) was related with a mass loss of 2.2% from the TG curve and occurring from ambient temperature up to around 100 °C, and was associated with the elimination of water, physically adsorbed on the external surface of the particle. The peak II at about 180 °C presented a mass of 8.7% in the interval 100–210 °C of the TG curve, and may be attributed to the removal of –OH and water from the brucite-like layer [17]. The second region in the TG curve was located between 210 and 400 °C and it corresponded to the second DTG peak, with maximum temperature of 360 °C. The average mass loss in this second region was around 18.5% and was attributed to the dehydroxylation of the brucite type layers, with decomposition of carbonate anions (decarbonization). From this temperature, called the collapse of the layers up to 800 °C, occurred the rearrangement of the structure with the formation of aluminum oxides, magnesia (periclase phase), and the formation of other metal and mixed oxides reaching the structure a great thermal stability, characteristic of oxides [17,18].
3.1.3. TPR Analysis Results
The reducibility of the calcined LDHs was investigated by TPR measurement; the obtained profiles are shown in Figure 3.
The TPR analysis of the different LDHs showed the presence of two peaks depending on whether the sample contained Cu in its composition or not. Thus, the Ni–Cu/LDH and Ni–Fe–Cu/LDH samples both showed one peak above 210 °C (peak I), which was associated to the reduction of bulk CuO [20].
In addition, Figure 3 shows a second peak (II) in the range of 680–800 °C, which was attributed to the reduction of Ni2+ species in thermally stable phases such as Mg(Ni, Al)O solid solution [12,21].
The addition of precursors reduces the maximum reduction temperature, promoting the reduction of Ni+2 species by weakening the bond between the Ni species and the support [21]. In the same way, the substitution of Mg by Ni helps to reduce the NiO–MgO interaction, leading to a decrease in the reduction temperature and a low dispersion of the metals [12].
In this way, Figure 3 shows a displacement of the maximum of peak II with respect to Ni–LDH (797 °C) towards lower temperatures when Fe or Cu was added. Thus, it can be seen how the addition of Fe caused a displacement of the maximum up to 776 °C, while the addition of Cu caused a more pronounced displacement up to 680 °C. This meant that the addition of Cu caused a further weakening of the Ni species in the support.
The total H2 consumption during TPR analysis of the different calcined LDHs is shown in Table 4. It can be seen that the substitution of 5 mol % of Ni for Fe or Cu proved an increase in H2 consumption. This increase was more pronounced in the case of Fe. As a result, calcined Ni–Fe–Cu/LDH was the HDL with the highest consumption of H2.
3.1.4. SEM Analysis Results
Figure 4 show SEM micrographs at different magnifications of the as-synthetized Ni–Fe–Cu/LDH. The synthesized LDH showed a homogeneous structure formed by small spheres of about 680 nm in diameter.
As seen in Figure 4, as the magnification became larger, it became possible to observe how the synthesized catalyst was formed by small spherical and homogeneous particles, which suggests that the reaction device used was quite suitable in terms of carrying out the synthesis of LDHs.
The determination of the particle diameter was performed using the image analysis program ImageJ, which allowed us to calculate the histogram of the particle size distribution observed by SEM.
The average diameter of the as-synthetized LDH particles observed by SEM was 618.1 nm. After the calcination process, the catalyst lost its hydrotalcite structure, which caused a reduction in size of the particles to 414.2 nm (Figure 5).
3.1.5. XRD Analysis Results
The XRD patterns of as-synthesized, calcined, and hydrogenated Ni–Fe–Cu/LDH are reported in the Figure 6a–c, respectively.
XRD pattern of as-synthesized Ni–Fe–Cu/LDH (Figure 6a) showed several diffraction peaks at 11.5°, 23.0°, 34.6, 38.8°, 46.2, 60.5, 61.8°, and 65.5° indexed to (003), (006), (012), (015), (018), (110), (113), and (116) reflections, respectively. All of them were related to hydrotalcite (JCPDS 22e0700), indicating the formation of a pure hydrotalcite phase. This structure was in agreement with the results obtained by other authors who have studied LDHs [22,23,24]. No diffraction peaks were observed for any species of nickel, copper, or iron, which may have been due to their integration into the structure or their high dispersion in the LDH [25].
The smaller the size of the crystalline particles, the more defects they have and the wider the diffraction peaks [26]. Therefore, the wide peak (003) indicates the formation of highly crystalline material with a small particle size.
Lattice parameters a and c were calculated following the Equations (4)–(6) and the diffraction angle obtained from the XRD pattern (Figure 6a). Moreover, crystallite size (D) was calculated by Equation (7) on the basis of (003) reflections at 11.5°. These parameters are summarized in Table 5.
The values of as-synthesized Ni–Fe–Cu/LDH were similar to those calculated by other authors that have synthesized Ni-based catalyst from LDHs. For example, Zhou et al. [27] synthesized a Ni–Fe/LDH, finding a crystallite size of 9.1 and lattice parameter values of a = 3.06 and c = 23.2.
Lattice parameter c is related to the electrostatic interactions between the brucite-like sheet and the interlayer, and is strongly dependent on the M2+/M3+ ratio that has a value of 3 in the Ni–Fe–Cu/LDH synthetized [16]. As as-synthesized Ni–Fe–Cu/LDH was calcined up to 900 °C, and the loss of the hydrotalcite structure progressively took place, resulting in a mixture of metal oxides that can be observed in Figure 6b.
As seen in Figure 6b, the XRD pattern for calcined sample showed reflections at around 37°, 43.5°, and 62.5°. These reflections were related to the planes (111), (200), and (220), respectively, which could correspond to the cubic structure of MgO and NiO. Ni2+ has an ionic radius similar to that of Mg2+, and thus it is likely that it was incorporated into the structure, forming the mixed oxide Mg(Ni,Al)O, as described by several authors [22,28,29], without significant modifications in the network parameter. On the other hand, Ni(Fe)Ox also has a similar cubic structure to NiO, and thus it is possible that Ni(Fe)Ox was also present due to Fe3+ substitution in the nickel oxide lattice [27]. In relation to Cu, no patterns were observed regarding this metal, which may have been because it is highly dispersed or forms an amorphous phase. Table 5 also includes the crystallite size (D) of particles calculated by Equation (7) on the basis of (200) reflections and lattice parameters by Equation (8). A reduction of the particle size was obtained after calcination, which improved the characteristics of the catalyst.
After the reduction with H2, the reduced Ni–Fe–Cu/LDH was obtained, whose XRD pattern can be seen in Figure 6c. The nickel particles were mostly found as Ni metal, as shown by the reflections at 44.2°, 51.7°, and 75.8°, corresponding to the crystallographic planes (111), (200), and (220). To a lesser extent, NiFe alloy and NiO reflections can also be observed.
3.1.6. Textural Properties Analysis Results
Specific surface area (BET), pore volume, and average pore diameter (BJH) of both as-synthesized and calcined catalysts were obtained, and their results are summarized in Table 6.
After calcination, an increase in surface area and pore volume was observed, which may have been due to the removal of carbonate anions in the form of CO2 as the sample was calcined. Moreover, calcination results in an increase in pore volume and pore diameter, which allowed for improved textural properties of the catalyst. Comparing the textural properties obtained from calcined Ni–Fe–Cu/LDH with respect to commercial catalysts, we could see, for example, that calcined catalyst showed a SBET of 136.70 m2 g−1 larger than the commercial Raney nickel catalyst that had an average Ni surface area of 100 m2 g−1 [30].
Figure 7 shows the pore diameter distribution curves of as-synthesized and calcined catalyst, obtained from nitrogen adsorption–desorption isotherm measured at 77 K.
For as-synthesized catalyst, we observed that the pore size distribution was very narrow, presenting a very sharp maximum over 3 nm, and most of the pore diameters were between 3 and 10 nm (mesopores).
After calcination of fresh LDH at 800 °C for 4 h, the calcined catalyst showed a wider pore size distribution than as-synthetized catalyst. The most part of the pores were between 3 and 21 nm, with a maximum over 13 nm. This may have been due to the fact that the calcination at high temperatures improved the textural properties, especially in the case where the catalyst contained Fe, as demonstrated by Zhou et al. [27].
3.2. Effect of Temperature and S/C Ratio on Catalytic Performance of Ni–Fe–Cu/LDH Catalyst over Steam Reforming of Toluene
Steam reforming:
C7H8 + 7H2O⇄7CO + 11H2 ΔH = 868.23 kJ
C7H8 + 14 H2O⇄7CO2 + 18H2 ΔH = 578.78 kJ
Water gas shift:
CO + H2O⇄CO2 + H2 ΔH = −41.35 kJ
Dry reforming:
C7H8 + 7CO2⇄14CO + 4H2 ΔH = 1157.68 kJ
Hydroalkylation:
C7H8 + H2⇄C6H6 + CH4 ΔH = −41.91 kJ
Benzene hydrocracking:
C6H6 + 9H2⇄6CH4 ΔH = −532.14 kJ
Benzene steam reforming:
C6H6 + 6H2O⇄6CO + 9H2 ΔH = 704.1 kJ
Methane steam reforming:
CH4 + H2O⇄CO + 3H2 ΔH = 206.04 kJ
Boudouard reaction:
2CO⇄CO2 + C ΔH = −172.53 kJ
Most of the reactions involved in toluene steam reforming are endothermic, and thus the process is favored both thermodynamically and kinetically at high temperatures.
Steam reforming of toluene can occur through reactions (12) and (13), depending on the amount of water available, producing H2, and CO and CO2, respectively.
Water gas shift (WGS) reaction (14) is an equilibrium reaction that is thermodynamically favored at low temperatures and kinetically favored at high temperatures [33].
In addition, toluene can react with CO2 through the dry reforming reaction (15), forming CO and H2, and it also can react through the reaction of hydroalkylation (16) with H2 to produce benzene and methane, although this reaction, because it is exothermic, will be less favorable at high temperatures. On the other hand, benzene can react with H2 through a hydrocracking reaction (17) to produce methane. Methane in turn can produce CO and H2 through a steam reforming reaction (19). The Boudouard reaction (20) is an exothermic reaction that transforms CO into CO2 and C.
Finally, it can be observed that in all the reactions except (18) and (20), there was an increase in the volume from reactants to products, and thus the process was favored at low pressure.
3.2.1. Effect of Temperature on Gas Yield and Gas Composition
Figure 8 shows the conversion of toluene to gases as a function of temperature and S/C ratio.
It can be noticed how as the temperature increased, the conversion increased. At temperatures below 500 °C, the steam reforming reaction did not take place. However, from 500 °C, the conversion increased sharply with temperature until temperature in the range 700–800 °C was reached, where conversion was highest. For temperatures above 800 °C, the conversion remained constant and no longer increased with temperature. The highest conversion (99.87%) was achieved for an S/C of 4 at a temperature of 800 °C. This could have been due to the fact that for higher S/C values, the water could compete for the active centers of the catalyst.
Regarding the evolution of CO with temperature (Figure 9a), as the temperature increased, the concentration of CO increased, progressively reaching the maximum value at 900 °C, while the concentration of CO2 (Figure 9b) increased until reaching its maximum value at 600 °C and then decreased slightly. This development may have been due to the fact that the WGS reaction is an exothermic reaction, and thus as the temperature increased, the equilibrium progressively shifted towards the formation of CO [34].
The concentration of H2 (Figure 9c) was the largest during steam reforming with toluene. The concentration of hydrogen decreased strongly at temperatures above 500 °C; from this temperature, a slight decrease was observed as the temperature increased. This behavior has been observed by different authors [35] and can be explained again by the endothermic nature of the WGS reverse reaction, which reduces the concentration of H2 as the temperature increases.
The hydroalkylation (12) and benzene hydrocracking (17) are exothermic reactions and therefore not favored by increasing temperature. As a consequence, the concentration of CH4 (Figure 9d), after reaching a maximum at 600 °C, decreased sharply with increasing temperature. This means that the concentration of toluene occurred preferably through the reaction (12) as the temperature increased.
In the same way, the formation of benzene (Figure 9e) through reaction (16) decreased as the temperature increased due to its exothermic behavior. Benzene yield reached a maximum value at 500 °C of around 8–10%; from this temperature, the concentration of benzene decreased very quickly. This may also have been due to the fact that the catalyst can promote the steam reforming of benzene (18) in the range 600–900 °C.
3.2.2. Effect of S/C Ratio on Gas Yield and Gas Composition
Regarding the influence of the S/C ratio on conversion of toluene to gases (Figure 8), we observed that the maximum differences were reached in the range of temperatures 500–700 °C. The main tendency was that as the S/C ratio increased, the conversion increased up to S/C ratios of 6. S/C values higher than 6 did not encourage an increase in conversion. This fact was especially noticed at 600 °C, where conversions of 56% were reached for S/C values of 1, while for S/C ratios higher than 6, the conversion was higher than 95%.
With respect to the evolution of the concentration of CO (Figure 9a) and CO2 (Figure 9b), both concentrations were very dependent on the value of S/C. Thus, for example, the concentration of CO was observed to increase when the S/C ratio decreased, and thus the maximum values (17%) were reached for S/C = 1 at 900 °C, while for the same temperature of 900 °C and an S/C = 8, the concentration of CO was around 7%. The evolution of the concentration of CO2 moved in an inverse way; it increased when the S/C ratio increased, reaching maximum values at S/C = 8. This was evidence that increasing the S/C ratio promotes reaction (13).
In respect to the influence of the S/C ratio on the concentration of H2 (Figure 9c), the S/C had much less influence than temperature. Moreover, it was possible to observe that at low temperature, the concentration of H2 decreased as the S/C ratio increased; this effect may have been due to an increase in the basicity. Thus, for example, Ahmed et al. [36] developed a Ni–Fe–Mg/zeolite catalyst and studied its performance in steam reforming reaction of toluene, finding that for S/C ratios higher than 1:1, the amount of H2 decreased, which they related to a decrease in the basicity of the support. This effect occurred mainly at low temperatures, where the degree of conversion was low in these conditions an increase in the S/C ratio can cause an oxidation of the catalyst. At higher temperatures, there was no clear trend because there was very little variation in the concentration of H2 with S/C.
3.3. Catalyst Characterization after Reaction
To investigate the characteristics of the catalyst after the steam reforming of toluene, we used an experience using S/C = 4 at 800 °C for 2 h as a reference.
The concentration of the gases remained relatively constant during the development of the test (Figure 10a), reaching an average conversion to gases of 98% (Figure 10b). Throughout the development of the test, no deactivation of the catalyst was observed, and thus the concentration of the gas was quite constant with the following average molar concentration: 76.6% H2, 12.1% CO, and 11.3% CO2.
The results obtained show that the conversion achieved with the developed catalyst allowed us to reach comparable and even higher results to other catalysts on the basis of La or Ce (Table 7). Therefore, the Ni–Fe–Cu/LDH catalyst can be considered as an effective catalyst with a promising toluene conversion capacity.
3.3.1. XRD Analysis Results
The Figure 11 shows the XRD patterns after reduction and after reaction of the catalyst by comparison.
After reduction at 900 °C (Figure 11a), the diffraction lines resulting from the formation of the nickel metal phase and Ni–Fe alloy were observed, together with weaker lines of NiO and MgO. The same lines were observed in the XRD profile after reaction (Figure 11b), but longer and narrower, which meant the formation of larger particles.
In this way, the mean diameter of the Ni particles was calculated by the Scherrer Equation (7), using the peak at 2θ = 51.2°, which corresponded to the (200) plane of Ni fcc [31] and lattice parameter by Equation (8); all are shown in Table 8.
After the reaction, we observed that there was an increase in the size of the Ni particles, which may be attributed to the fact that as the reaction progressed, the sintering of the Ni particles took place. In addition, a slight increase in the lattice parameter took place, which was in line with the fcc structure of the metal nanoparticles, which generally expand with increasing particle size [41].
3.3.2. Amount and Type of Carbon Deposited on the Surface of Catalyst
The amounts of carbon at the end of different tests were analyzed by means of an elemental analyzer. The lowest values were obtained for high temperatures. Thus, for instance, for an S/C = 4 at 800 °C, the amount of carbon deposited after 2 h of reaction was only 1.4 wt %.
In order to determine the influence of the S/C ratio on the amount of carbon deposited, we analyzed the amount of carbon formed at 600 °C for 1 h for different S/C values. The results are shown in Figure 12.
From Figure 12, it can be seen that as the S/C ratio increased, the amount of carbon deposited decreased. For example, when the S/C ratio was 1, the amount of carbon formed was 49.34%, while for an S/C = 2, the amount was drastically reduced to 20.82%. The lowest amount of carbon was obtained by using high S/C ratios of 8.
These amounts of carbon deposited were even less than those detected by other authors; for instance, Josuinkas et al. [31] determined that for a Ni LDH-based catalyst, the amount of carbon deposited was 78.3–83.1 wt % at 800 °C and S/C = 1.5.
To identify the type of carbon formed, we carried out an analysis of the TG derivative by means of a TGA analysis. TGA analysis allows us to distinguish between amorphous carbon, which is detected by a peak in the range 450–500 °C, and filamentous carbon, which decomposes in the range 600–650 °C [30]. It is well known that amorphous carbon affects the degree of conversion of the catalyst since it blocks the active centers. On the contrary, filamentous carbon affects the conversion to a lesser extent, since it had less serious effect on the deactivation than the amorphous carbon [30].
Figure 13 shows the nature of the carbon deposited on the catalyst over the steam reforming of toluene. Only one peak was appreciated in the thermograms in the range 600–650 °C, which indicates that most of the carbon formed was filamentous, which means it did not affect the activity of the catalyst.
In addition, the effects of the S/C ratio on the amount and type of carbon formed can be observed in Figure 13. Here, the type of carbon formed did not vary with the S/C ratio, being predominantly filamentous carbon in all cases. Moreover, when the S/C ratio increased, the signal of the filamentous carbon decreased, which can be explained by a lower formation of carbon when the amount of water was added.
3.3.3. SEM Analysis of the Catalyst after Reaction
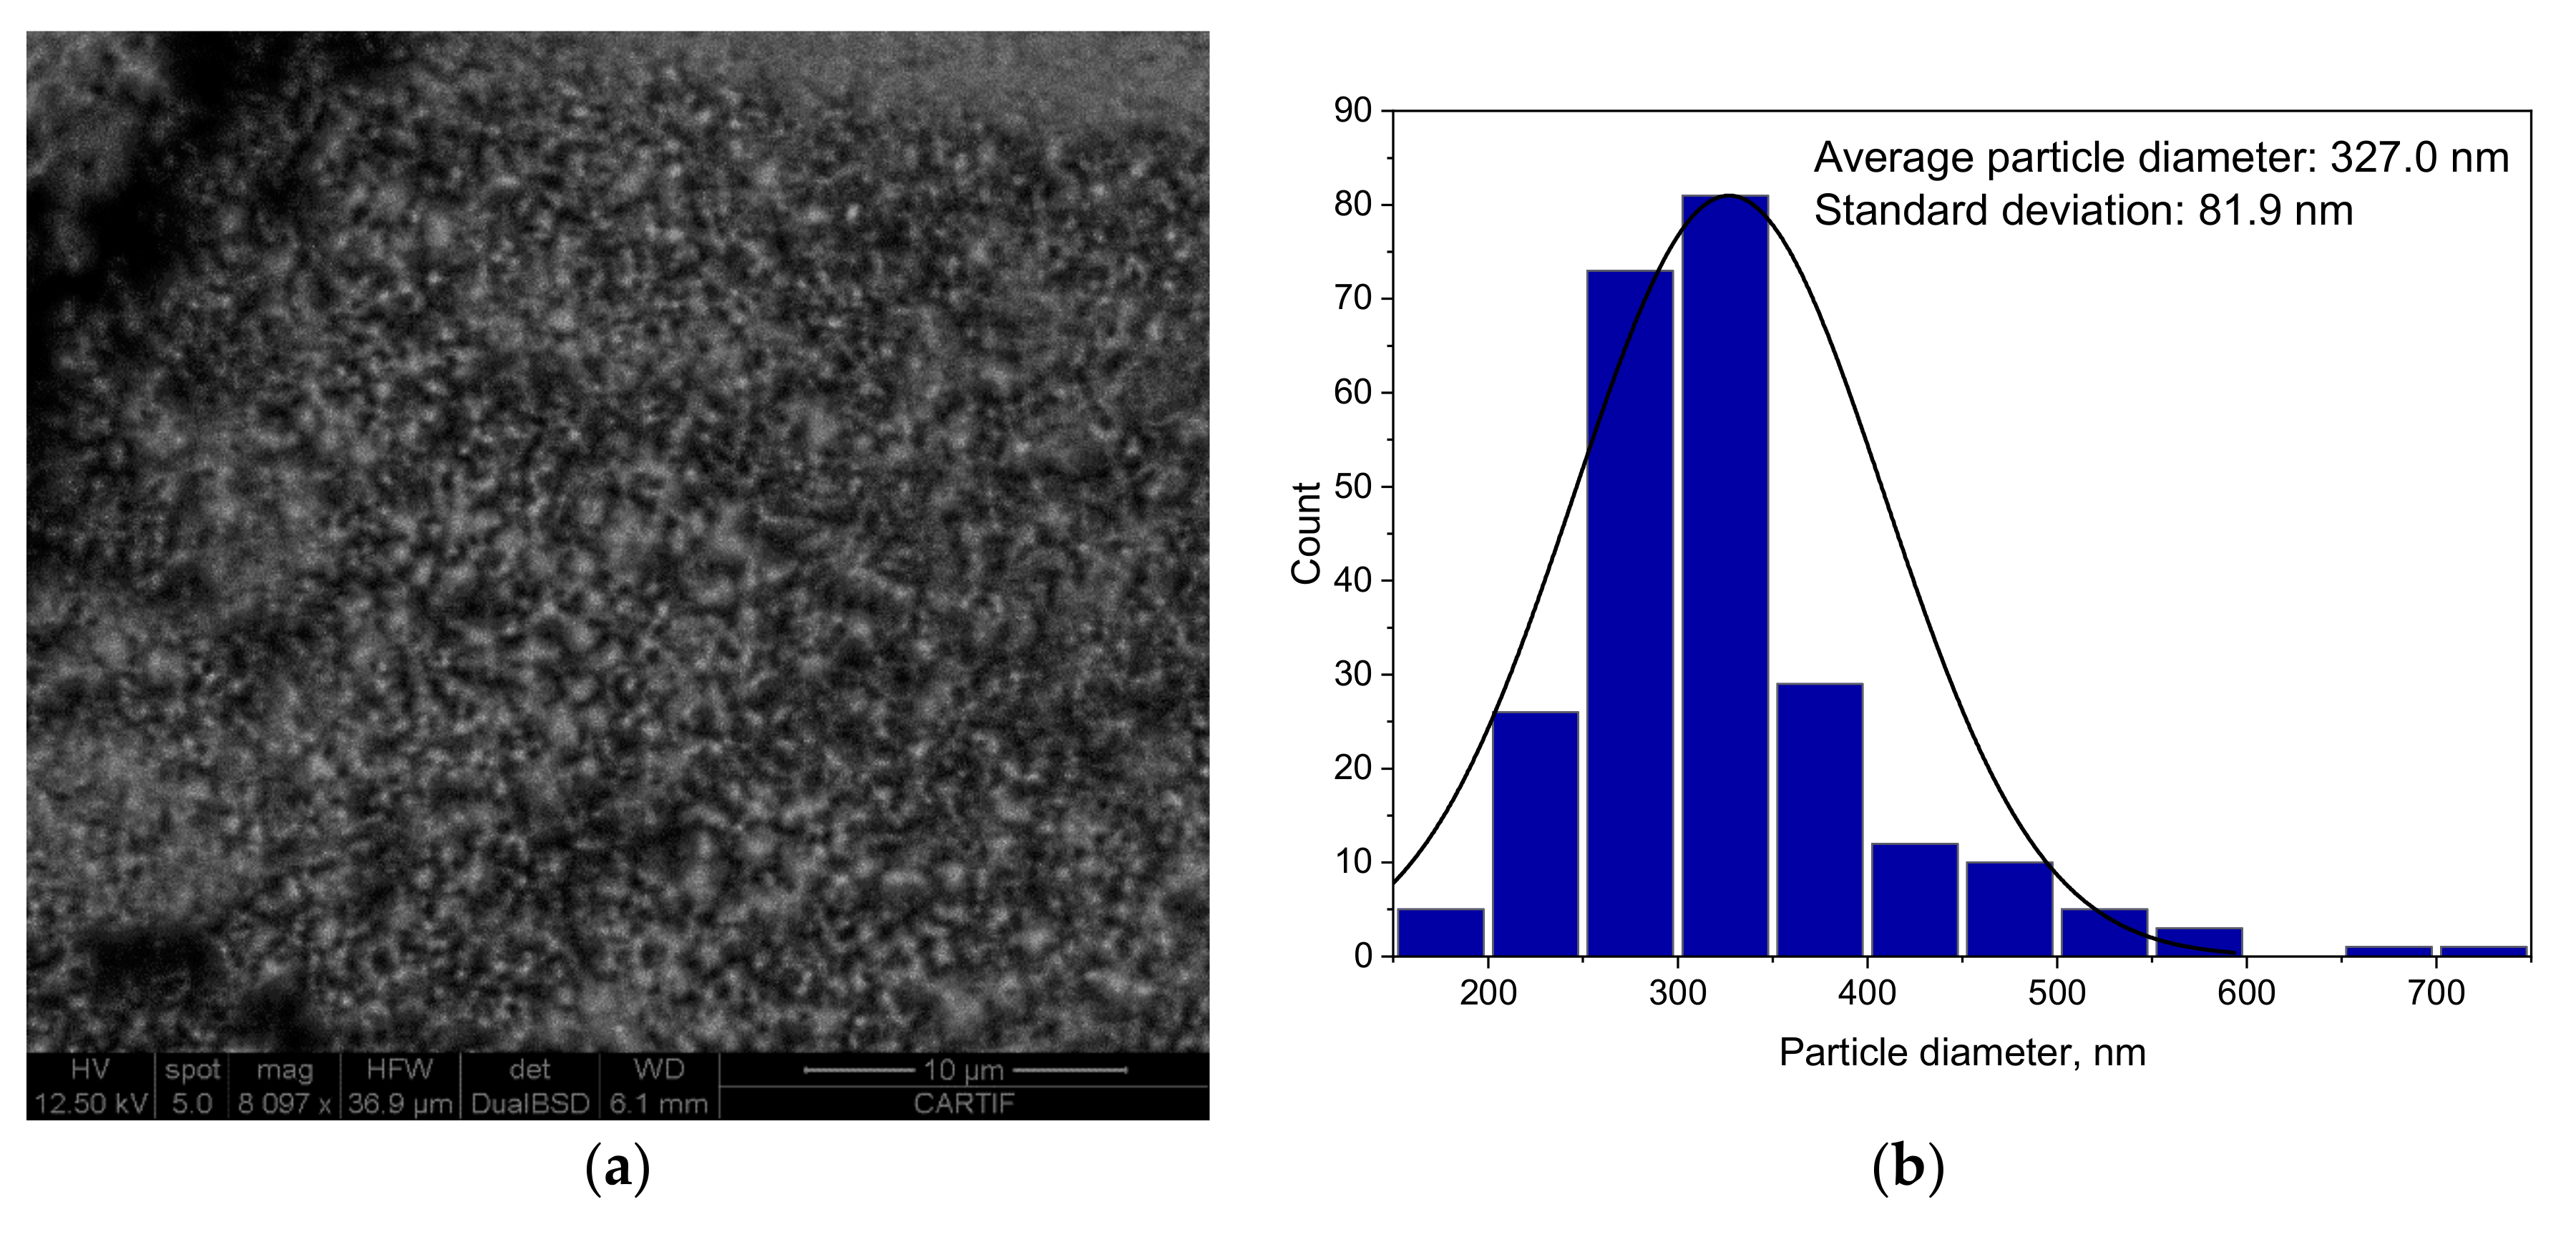
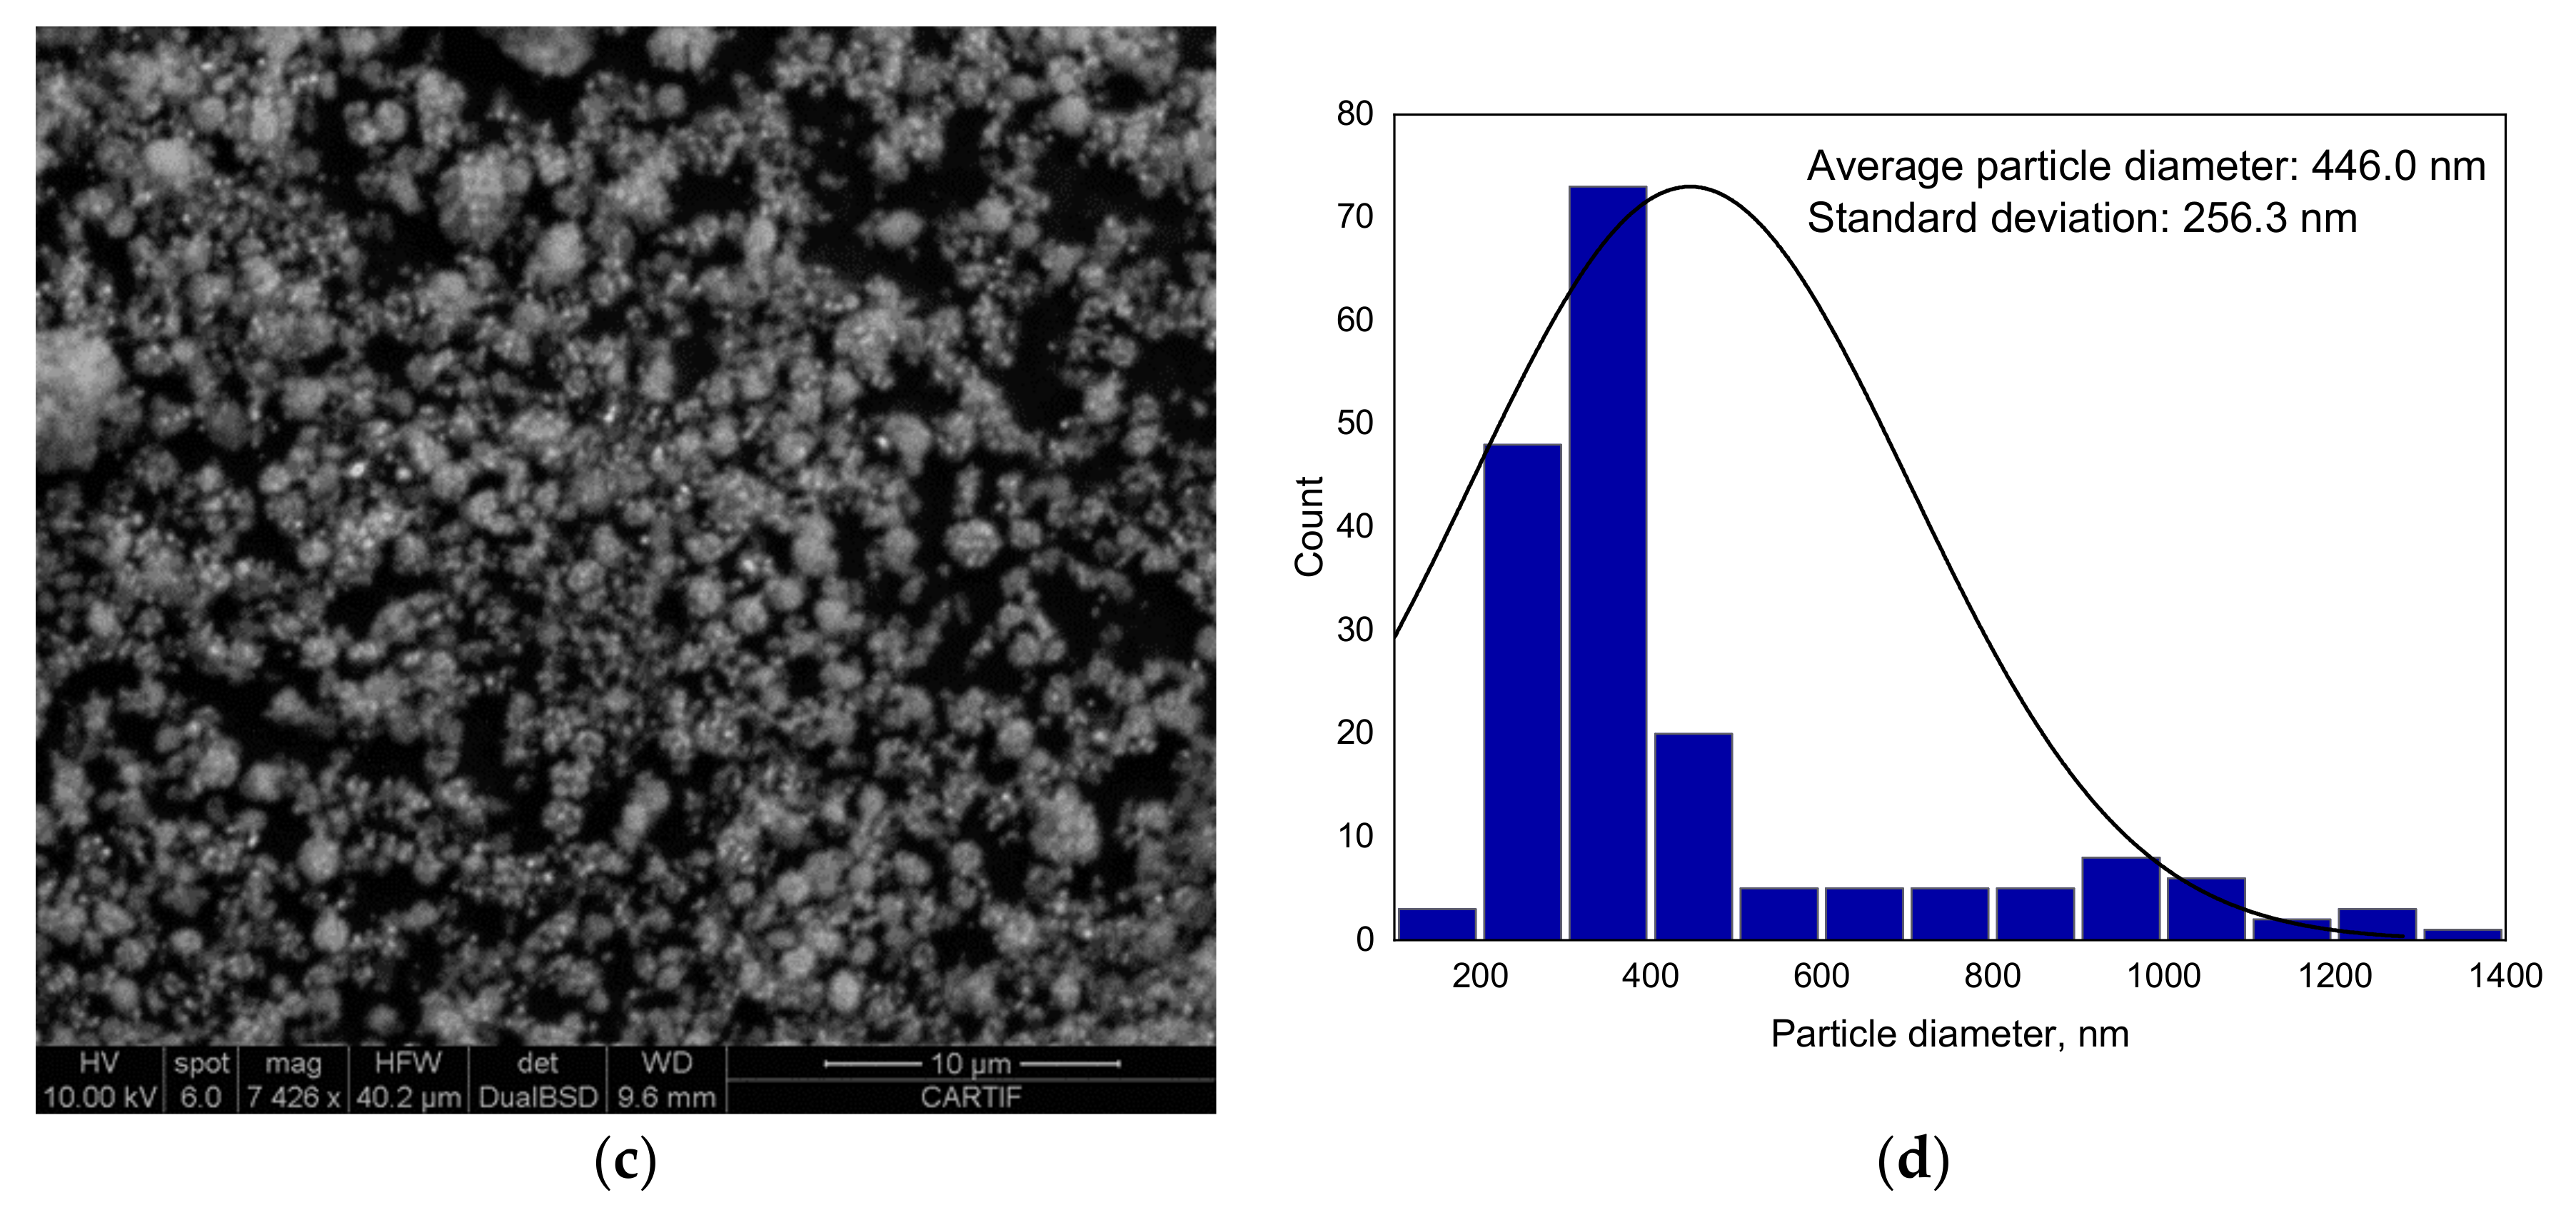
Figure 14 shows the morphological changes of the reduced catalyst (Figure 14a,b) and after 2 h of reaction at 800 °C and S/C of 4 (Figure 14c,d) by scanning electron microscopy. Non-structured carbon was observed in the SEM micrographs after reaction, which confirmed the low content of the carbon analyzed, making it potentially difficult to visualize by SEM.
After reduction of the catalyst, a powder formed by particles with an average diameter of 327 nm was obtained. We observed that the particles of the catalyst were well dispersed and uniformly distributed, but after the reaction, aggregates of smaller particles were formed, resulting in an increase in particle size up to 446 nm.
4. Conclusions
A study of the behavior of catalyst Ni–Fe–Cu/LDH during the steam reforming of toluene was carried out. The results suggest that for low temperatures at 600 °C, it is necessary to use S/C ratios higher than 6 to achieve gas conversions higher than 90%. On the other hand, at high temperatures above 800 °C, an S/C ratio of 2 was found to be sufficient to achieve high gas conversions. In addition, the use of low S/C ratios allowed for increased concentration of CO. S/C ratio of 4 allowed us to obtain the maximum conversion reached at 800 °C (99.87%) and low values of carbon deposited on the catalyst (1.4 wt %), along with good conversions in the range 600–700 °C above 80% and 90%, respectively. Furthermore, the type of carbon deposited on the catalyst was determined to be mainly filamentous, which, as is known, reduces conversion to a much lesser extent than amorphous carbon.
Moreover, the use of relatively cheap promoters such as Fe and Cu allowed us to obtain a competitive and more affordable catalyst than the catalysts based on expensive metals such as La and Ce. Therefore, the catalyst developed from Ni–Fe–Cu/LDH can be considered as an effective catalyst with a promising toluene conversion capacity, yielding high concentrations of H2.
Author Contributions
Conceptualization, D.D., A.U. and G.A.; methodology, D.D. and A.U.; software, D.D. and A.U.; validation, D.D., A.U. and G.A.; formal analysis, D.D. and A.U.; investigation, D.D. and A.U.; resources, D.D. and A.U.; data curation, D.D. and A.U.; writing (original draft preparation), D.D.; writing (review and editing), D.D., A.U. and G.A.; visualization, D.D. and A.U.; supervision, G.A.; project administration, D.D. and G.A.; funding acquisition, D.D., A.U. and G.A. All authors have read and agreed to the published version of the manuscript.
Funding
This research received no external funding.
Data Availability Statement
Data is in agreement with the MDPI Research Data Policies.
Conflicts of Interest
The authors declare no conflict of interest.
References
- Chen, J.; Tamura, M.; Nakagawa, Y.; Okumura, K.; Tomishige, K. Promoting effect of trace Pd on hydrotalcite-derived Ni/Mg/Al catalyst in oxidative steam reforming of biomass tar. Appl. Catal. B Environ. 2015, 179, 412–421. [Google Scholar] [CrossRef]
- Artetxe, M.; Alvarez, J.; Nahil, M.A.; Olazar, M.; Williams, P.T. Steam reforming of different biomass tar model compounds over Ni/Al2O3 catalysts. Energy Convers. Manag. 2017, 136, 119–126. [Google Scholar] [CrossRef]
- Chen, Y.H.; Schmid, M.; Kertthong, T.; Scheffknecht, G. Reforming of toluene as a tar model compound over straw char containing fly ash. Biomass Bioenergy 2020, 141, 105657. [Google Scholar] [CrossRef]
- Satyanarayana, K.G. Clay Surfaces: Fundamentals and Applications; Elsevier: Amsterdam, The Netherlands, 2004. [Google Scholar]
- Theiss, F.L.; Ayoko, G.A.; Frost, R.L. Synthesis of layered double hydroxides containing Mg2+, Zn2+, Ca2+ and Al3+ layer cations by co-precipitation methods—A review. Appl. Surf. Sci. 2016, 383, 200–213. [Google Scholar] [CrossRef]
- Mishra, G.; Dash, B.; Pandey, S. Layered double hydroxides: A brief review from fundamentals to application as evolving biomaterials. Appl. Clay Sci. 2018, 153, 172–186. [Google Scholar] [CrossRef]
- Duan, X.; Evans, D.G. (Eds.) Layered Double Hydroxides; Springer Science & Business Media: Berlin/Heidelberg, Germany, 2006; Volume 119. [Google Scholar]
- Liu, H.; Wierzbicki, D.; Debek, R.; Motak, M.; Grzybek, T.; da Costa, P.; Gálvez, M.E. La-promoted Ni-hydrotalcite-derived catalysts for dry reforming of methane at low temperatures. Fuel 2016, 182, 8–16. [Google Scholar] [CrossRef]
- Świrk, K.; Galvez, M.E.; Motak, M.; Grzybek, T.; Rønning, M.; da Costa, P. Yttrium promoted Ni-based double-layered hydroxides for dry methane reforming. J. Co2 Util. 2018, 27, 247–258. [Google Scholar] [CrossRef]
- Shen, Y.; Yoshikawa, K. Recent progresses in catalytic tar elimination during biomass gasification or pyrolysis—A review. Renew. Sustain. Energy Rev. 2013, 21, 371–392. [Google Scholar] [CrossRef]
- Mette, K.; Ressler, T.; Muhler, M. Development of Hydrotalcite-Derived Ni Catalysts for the Dry Reforming of Methane at High Temperatures. Ph.D. Thesis, Technische Universität, Berlin, Germany, 2015. [Google Scholar]
- Rached, A.J.; Dahdah, E.; Gennequin, C.; Tidahy, H.L.; Aboukais, A.; Abi-Aad, E.; Nsouli, B. Steam reforming of toluene for hydrogen production over NiMgALCe catalysts prepared via hydrotalcite route. In Proceedings of the 2016 7th International Renewable Energy Congress (IREC), Hammamet, Tunisia, 22–24 March 2016; IEEE: New York, NY, USA, 2016; pp. 1–6. [Google Scholar]
- Yu, X.; Wang, N.; Chu, W.; Liu, M. Carbon dioxide reforming of methane for syngas production over La-promoted NiMgAl catalysts derived from hydrotalcites. Chem. Eng. J. 2012, 209, 623–632. [Google Scholar] [CrossRef]
- Choi, S.C.; Lee, D.K.; Sohn, S.H. Morphological and Optical Properties of Cobalt Ion-Modified ZnO Nanowires. Catalysts 2020, 10, 614. [Google Scholar] [CrossRef]
- Koike, M.; Li, D.; Watanabe, H.; Nakagawa, Y.; Tomishige, K. Comparative study on steam reforming of model aromatic compounds of biomass tar over Ni and Ni–Fe alloy nanoparticles. Appl. Catal. A Gen. 2015, 506, 151–162. [Google Scholar] [CrossRef]
- Li, D.; Koike, M.; Wang, L.; Nakagawa, Y.; Xu, Y.; Tomishige, K. Regenerability of hydrotalcite-derived nickel–iron alloy nanoparticles for syngas production from biomass tar. ChemSusChem 2014, 7, 510–522. [Google Scholar] [CrossRef] [PubMed]
- Touahra, F.; Sehailia, M.; Ketir, W.; Bachari, K.; Chebout, R.; Trari, M.; Halliche, D. Effect of the Ni/Al ratio of hydrotalcite-type catalysts on their performance in the methane dry reforming process. Appl. Petrochem. Res. 2016, 6, 1–13. [Google Scholar] [CrossRef] [Green Version]
- Ferreira, R.A.R.; Ávila-Neto, C.N.; Noronha, F.B.; Hori, C.E. Study of LPG steam reform using Ni/Mg/Al hydrotalcite-type precursors. Int. J. Hydrog. Energy 2019, 44, 24471–24484. [Google Scholar] [CrossRef]
- Lu, P.; Huang, Q.; Bourtsalas, A.C.; Chi, Y.; Yan, J. Effect of operating conditions on the carbon formation and nickel catalyst performance during cracking of tar. Waste Biomass Valorization 2019, 10, 155–165. [Google Scholar] [CrossRef]
- Labaki, M.; Lamonier, J.F.; Siffert, S.; Aboukaïs, A. Thermal analysis and temperature-programmed reduction studies of copper–zirconium and copper–zirconium–yttrium compounds. Thermochim. Acta 2005, 427, 193–200. [Google Scholar] [CrossRef]
- Li, D.; Wang, L.; Koike, M.; Nakagawa, Y.; Tomishige, K. Steam reforming of tar from pyrolysis of biomass over Ni/Mg/Al catalysts prepared from hydrotalcite-like precursors. Appl. Catal. B Environ. 2011, 102, 528–538. [Google Scholar] [CrossRef]
- Cavani, F.; Trifiro, F.; Vaccari, A. Hydrotalcite-type anionic clays: Preparation, properties and applications. Catal. Today 1991, 11, 173–301. [Google Scholar] [CrossRef]
- Casenave, S.; Martinez, H.; Guimon, C.; Auroux, A.; Hulea, V.; Cordoneanu, A.; Dumitriu, E. Acid–base properties of Mg–Ni–Al mixed oxides using LDH as precursors. Thermochim. Acta 2001, 379, 85–93. [Google Scholar] [CrossRef]
- Silva, C.C.C.; Ribeiro, N.F.; Souza, M.M.; Aranda, D.A. Biodiesel production from soybean oil and methanol using hydrotalcites as catalyst. Fuel Process. Technol. 2010, 91, 205–210. [Google Scholar] [CrossRef]
- Serrano-Lotina, A.M. Obtención de Hidrógeno a Partir de Biogás Mediante Catalizadores Derivados de Hidrotalcita; Universidad Autónoma de Madrid: Madrid, Spain, 2012. [Google Scholar]
- Morlanés, N.; Melo, F. Obtención de Hidrógeno Mediante Reformado Catalítico de Nafta con Vapor de Agua; Universidad Politécnica de Valencia: Valencia, Spain, 2007. [Google Scholar]
- Zhou, F.; Pan, N.; Chen, H.; Xu, X.; Wang, C.; Du, Y.; Li, L. Hydrogen production through steam reforming of toluene over Ce, Zr or Fe promoted Ni-Mg-Al hydrotalcite-derived catalysts at low temperature. Energy Convers. Manag. 2019, 196, 677–687. [Google Scholar] [CrossRef]
- Bîrjega, R.; Pavel, O.D.; Costentin, G.; Che, M.; Angelescu, E. Rare-earth elements modified hydrotalcites and corresponding mesoporous mixed oxides as basic solid catalysts. Appl. Catal. A Gen. 2005, 288, 185–193. [Google Scholar] [CrossRef]
- Tsyganok, A.I.; Inaba, M.; Tsunoda, T.; Uchida, K.; Suzuki, K.; Takehira, K.; Hayakawa, T. Rational design of Mg–Al mixed oxide-supported bimetallic catalysts for dry reforming of methane. Appl. Catal. A Gen. 2005, 292, 328–343. [Google Scholar] [CrossRef]
- Ertl, G.; Knözinger, H.; Weitkamp, J. (Eds.) Preparation of Solid Catalysts; John Wiley & Sons: Hoboken, NJ, USA, 2008. [Google Scholar]
- Josuinkas, F.M.; Quitete, C.P.; Ribeiro, N.F.; Souza, M.M. Steam reforming of model gasification tar compounds over nickel catalysts prepared from hydrotalcite precursors. Fuel Process. Technol. 2014, 121, 76–82. [Google Scholar] [CrossRef]
- Qian, K.; Kumar, A. Catalytic reforming of toluene and naphthalene (model tar) by char supported nickel catalyst. Fuel 2017, 187, 128–136. [Google Scholar] [CrossRef] [Green Version]
- RJ, B.S.; Loganathan, M.; Shantha, M.S. A review of the water gas shift reaction kinetics. Int. J. Chem. React. Eng. 2010, 8. [Google Scholar] [CrossRef]
- Demirel, E.; Azcan, N. Thermodynamic modeling of water-gas shift reaction in supercritical water. In Proceedings of the World Congress on Engineering and Computer Science, San Francisco, CA, USA, 24–26 October 2012; Volume 2012. [Google Scholar]
- Zhu, H.L.; Pastor-Pérez, L.; Millan, M. Catalytic Steam Reforming of Toluene: Understanding the Influence of the Main Reaction Parameters over a Reference Catalyst. Energies 2020, 13, 813. [Google Scholar] [CrossRef] [Green Version]
- Ahmed, T.; Xiu, S.; Wang, L.; Shahbazi, A. Investigation of Ni/Fe/Mg zeolite-supported catalysts in steam reforming of tar using simulated-toluene as model compound. Fuel 2018, 211, 566–571. [Google Scholar] [CrossRef]
- Zhang, R.; Wang, H.; Hou, X. Catalytic reforming of toluene as tar model compound: Effect of Ce and Ce–Mg promoter using Ni/olivine catalyst. Chemosphere 2014, 97, 40–46. [Google Scholar] [CrossRef]
- Bona, S.; Guillén, P.; Alcalde, J.G.; García, L.; Bilbao, R. Toluene steam reforming using coprecipitated Ni/Al catalysts modified with lanthanum or cobalt. Chem. Eng. J. 2008, 137, 587–597. [Google Scholar] [CrossRef]
- Świerczyński, D.; Libs, S.; Courson, C.; Kiennemann, A. Steam reforming of tar from a biomass gasification process over Ni/olivine catalyst using toluene as a model compound. Appl. Catal. B Environ. 2007, 74, 211–222. [Google Scholar] [CrossRef]
- Soongprasit, K.; Aht-Ong, D.; Sricharoenchaikul, V.; Atong, D. Synthesis and catalytic activity of sol-gel derived La–Ce–Ni perovskite mixed oxide on steam reforming of toluene. Curr. Appl. Phys. 2012, 12, S80–S88. [Google Scholar] [CrossRef]
- Nafday, D.; Sarkar, S.; Ayyub, P.; Saha-Dasgupta, T. A reduction in particle size generally causes body-centered-cubic metals to expand but face-centered-cubic metals to contract. ACS Nano 2018, 12, 7246–7252. [Google Scholar] [CrossRef] [PubMed]
Figure 1.
Schematic diagram of the experimental system.
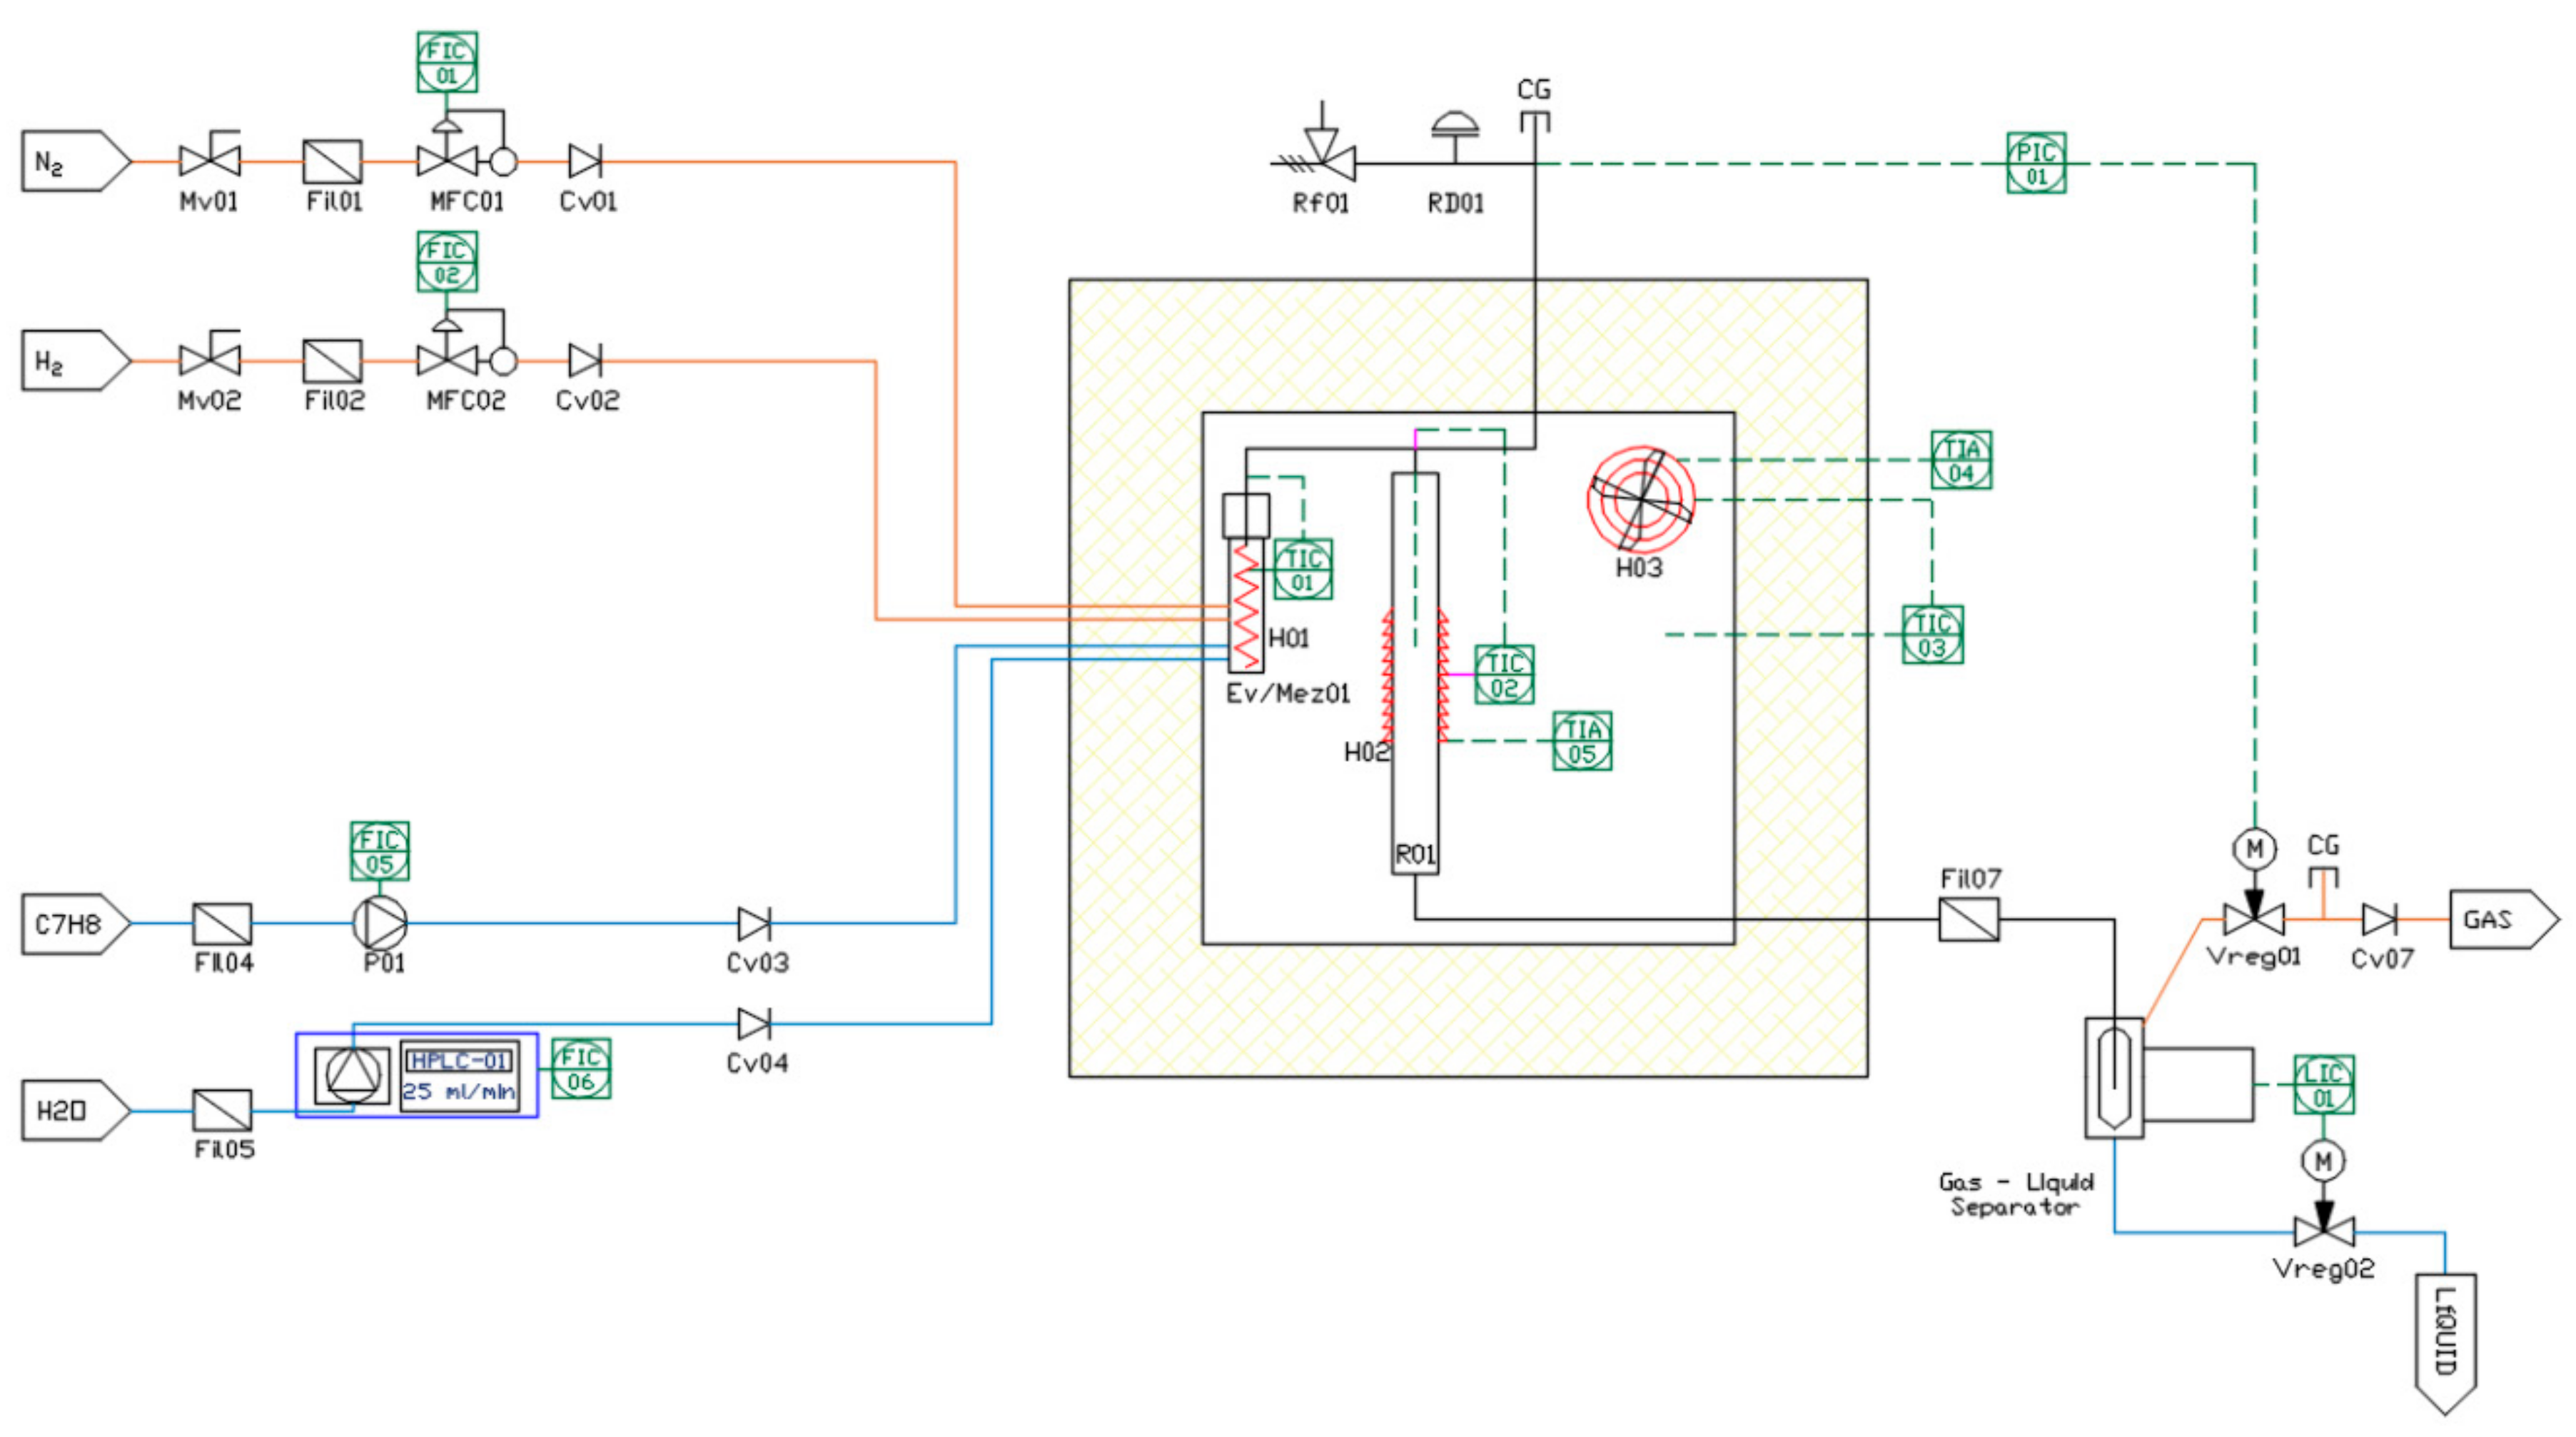
Figure 2.
Thermogravimetric analysis (TGA) and differential thermal analysis (DTG) from as-synthesized Ni–Fe–Cu/LDH.
Figure 2.
Thermogravimetric analysis (TGA) and differential thermal analysis (DTG) from as-synthesized Ni–Fe–Cu/LDH.
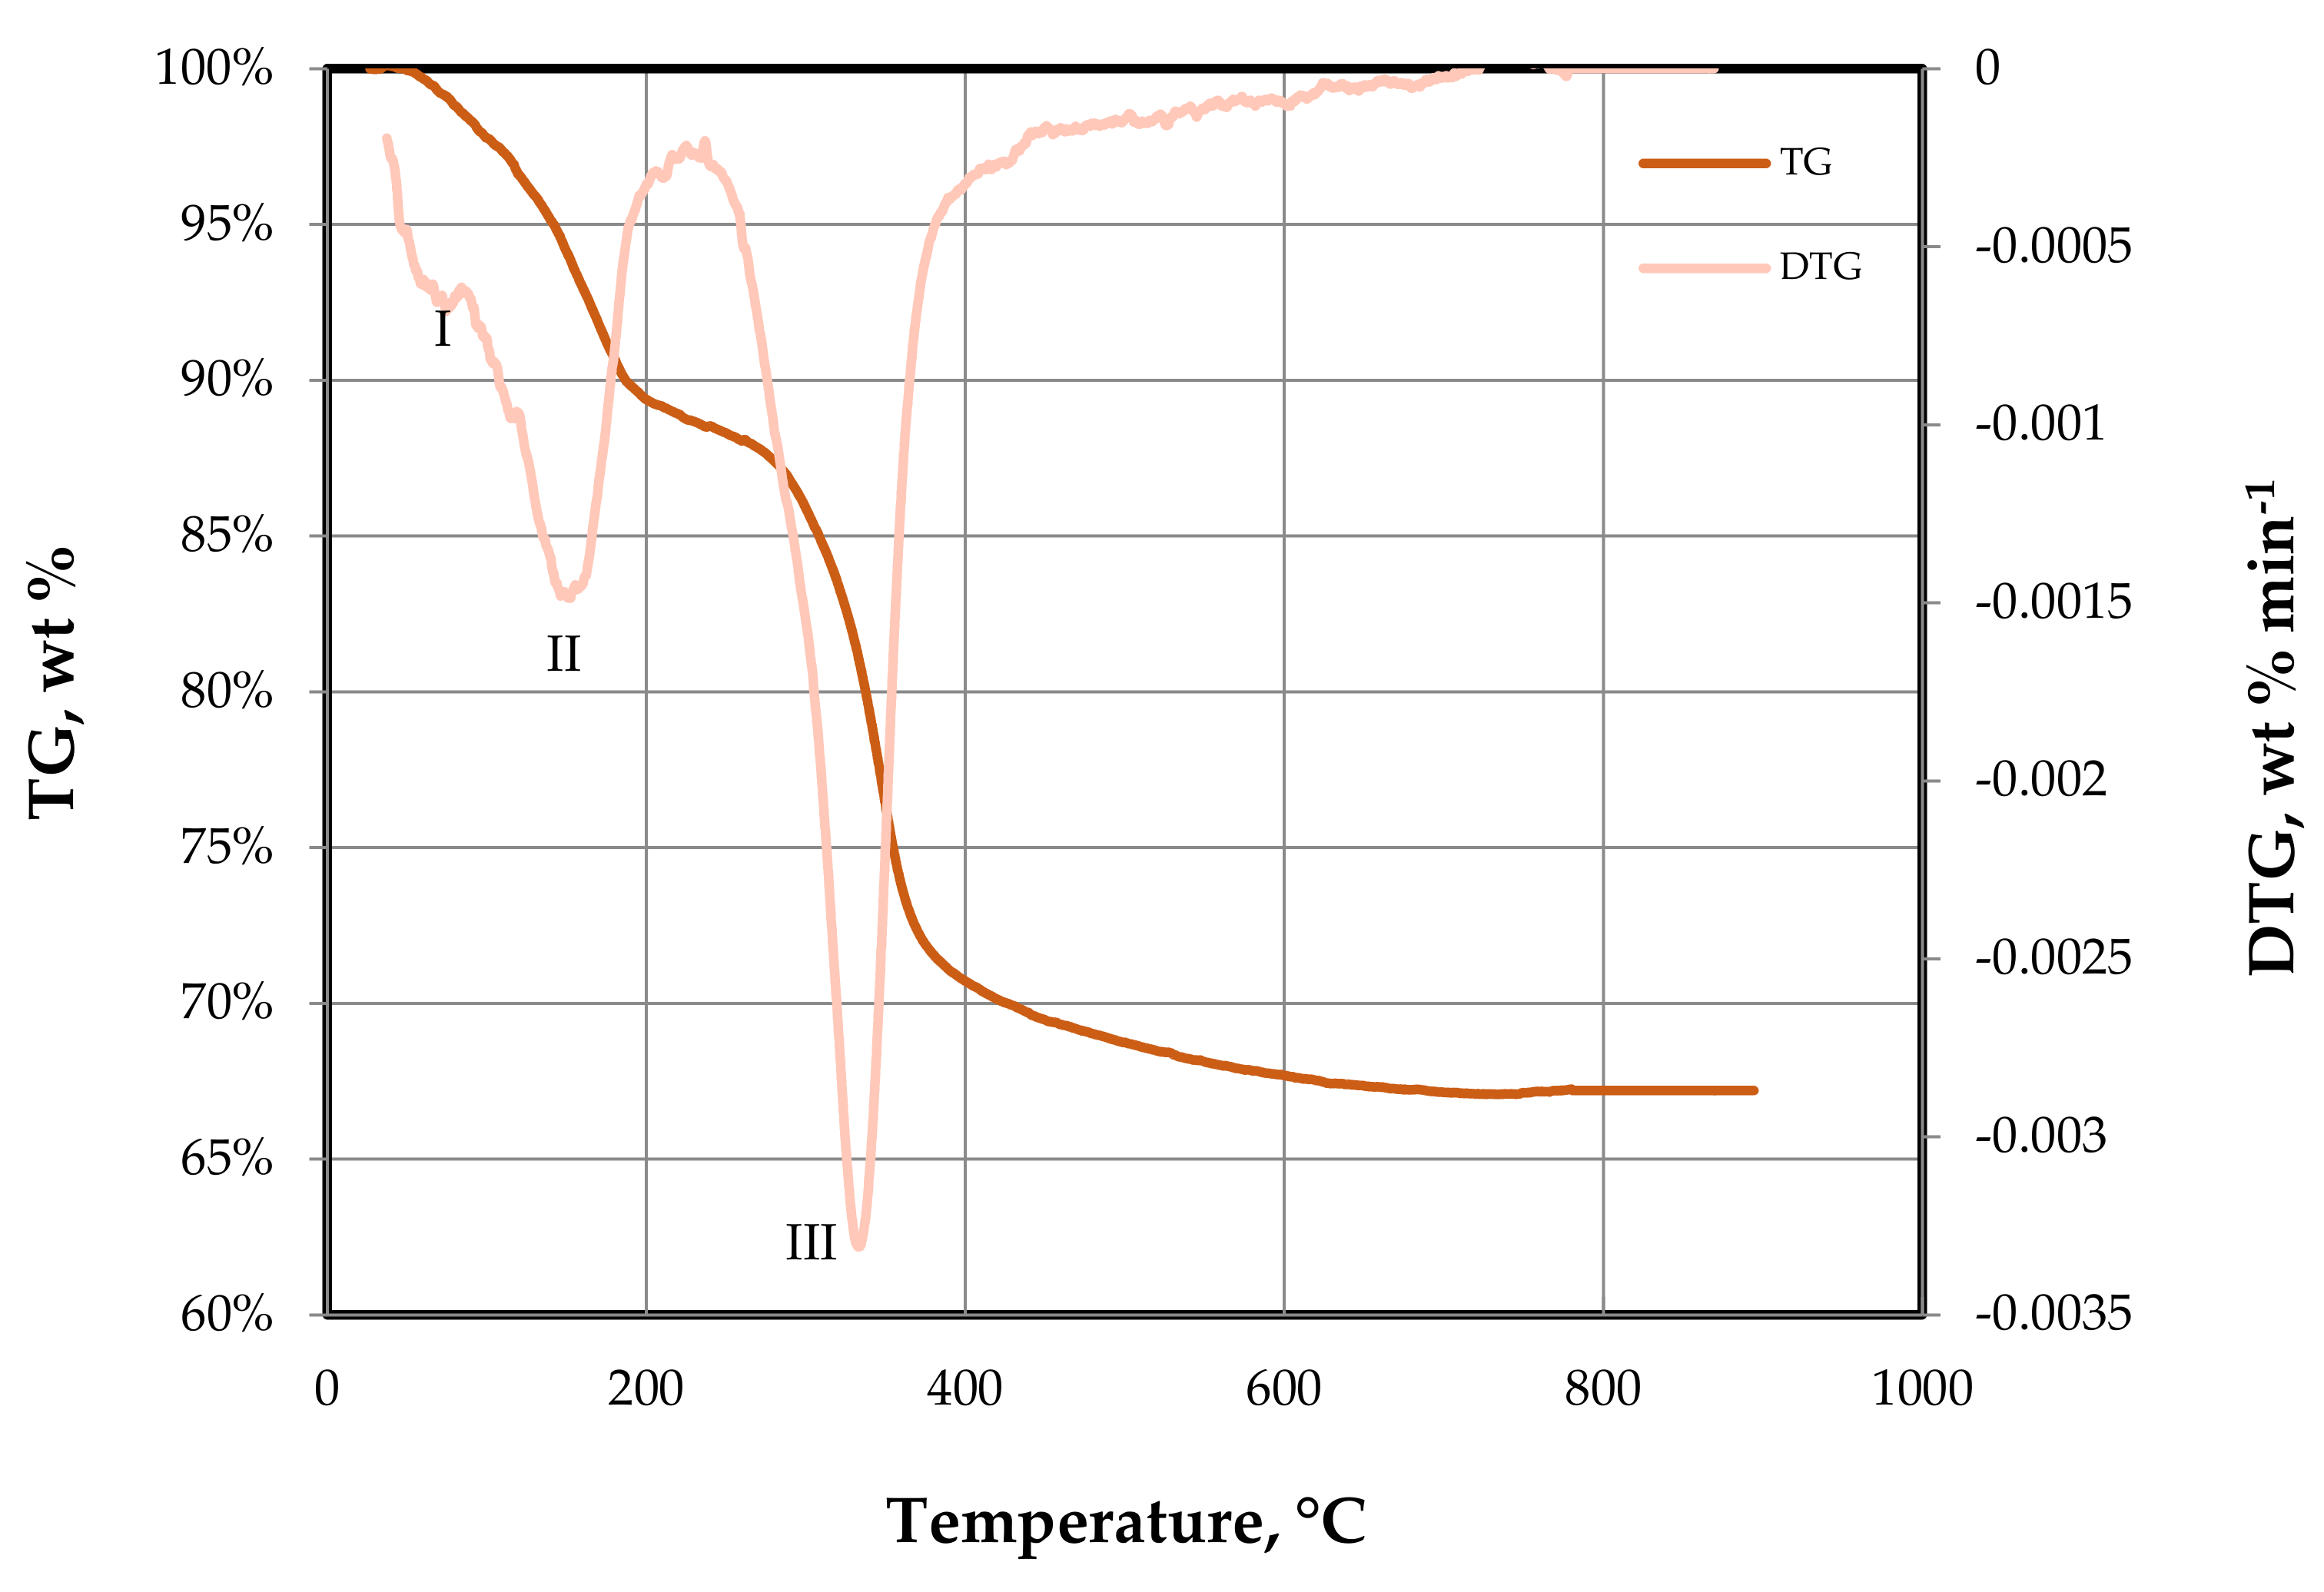
Figure 3.
Temperature-programmed reduction (TPR) profile for calcined LDHs.
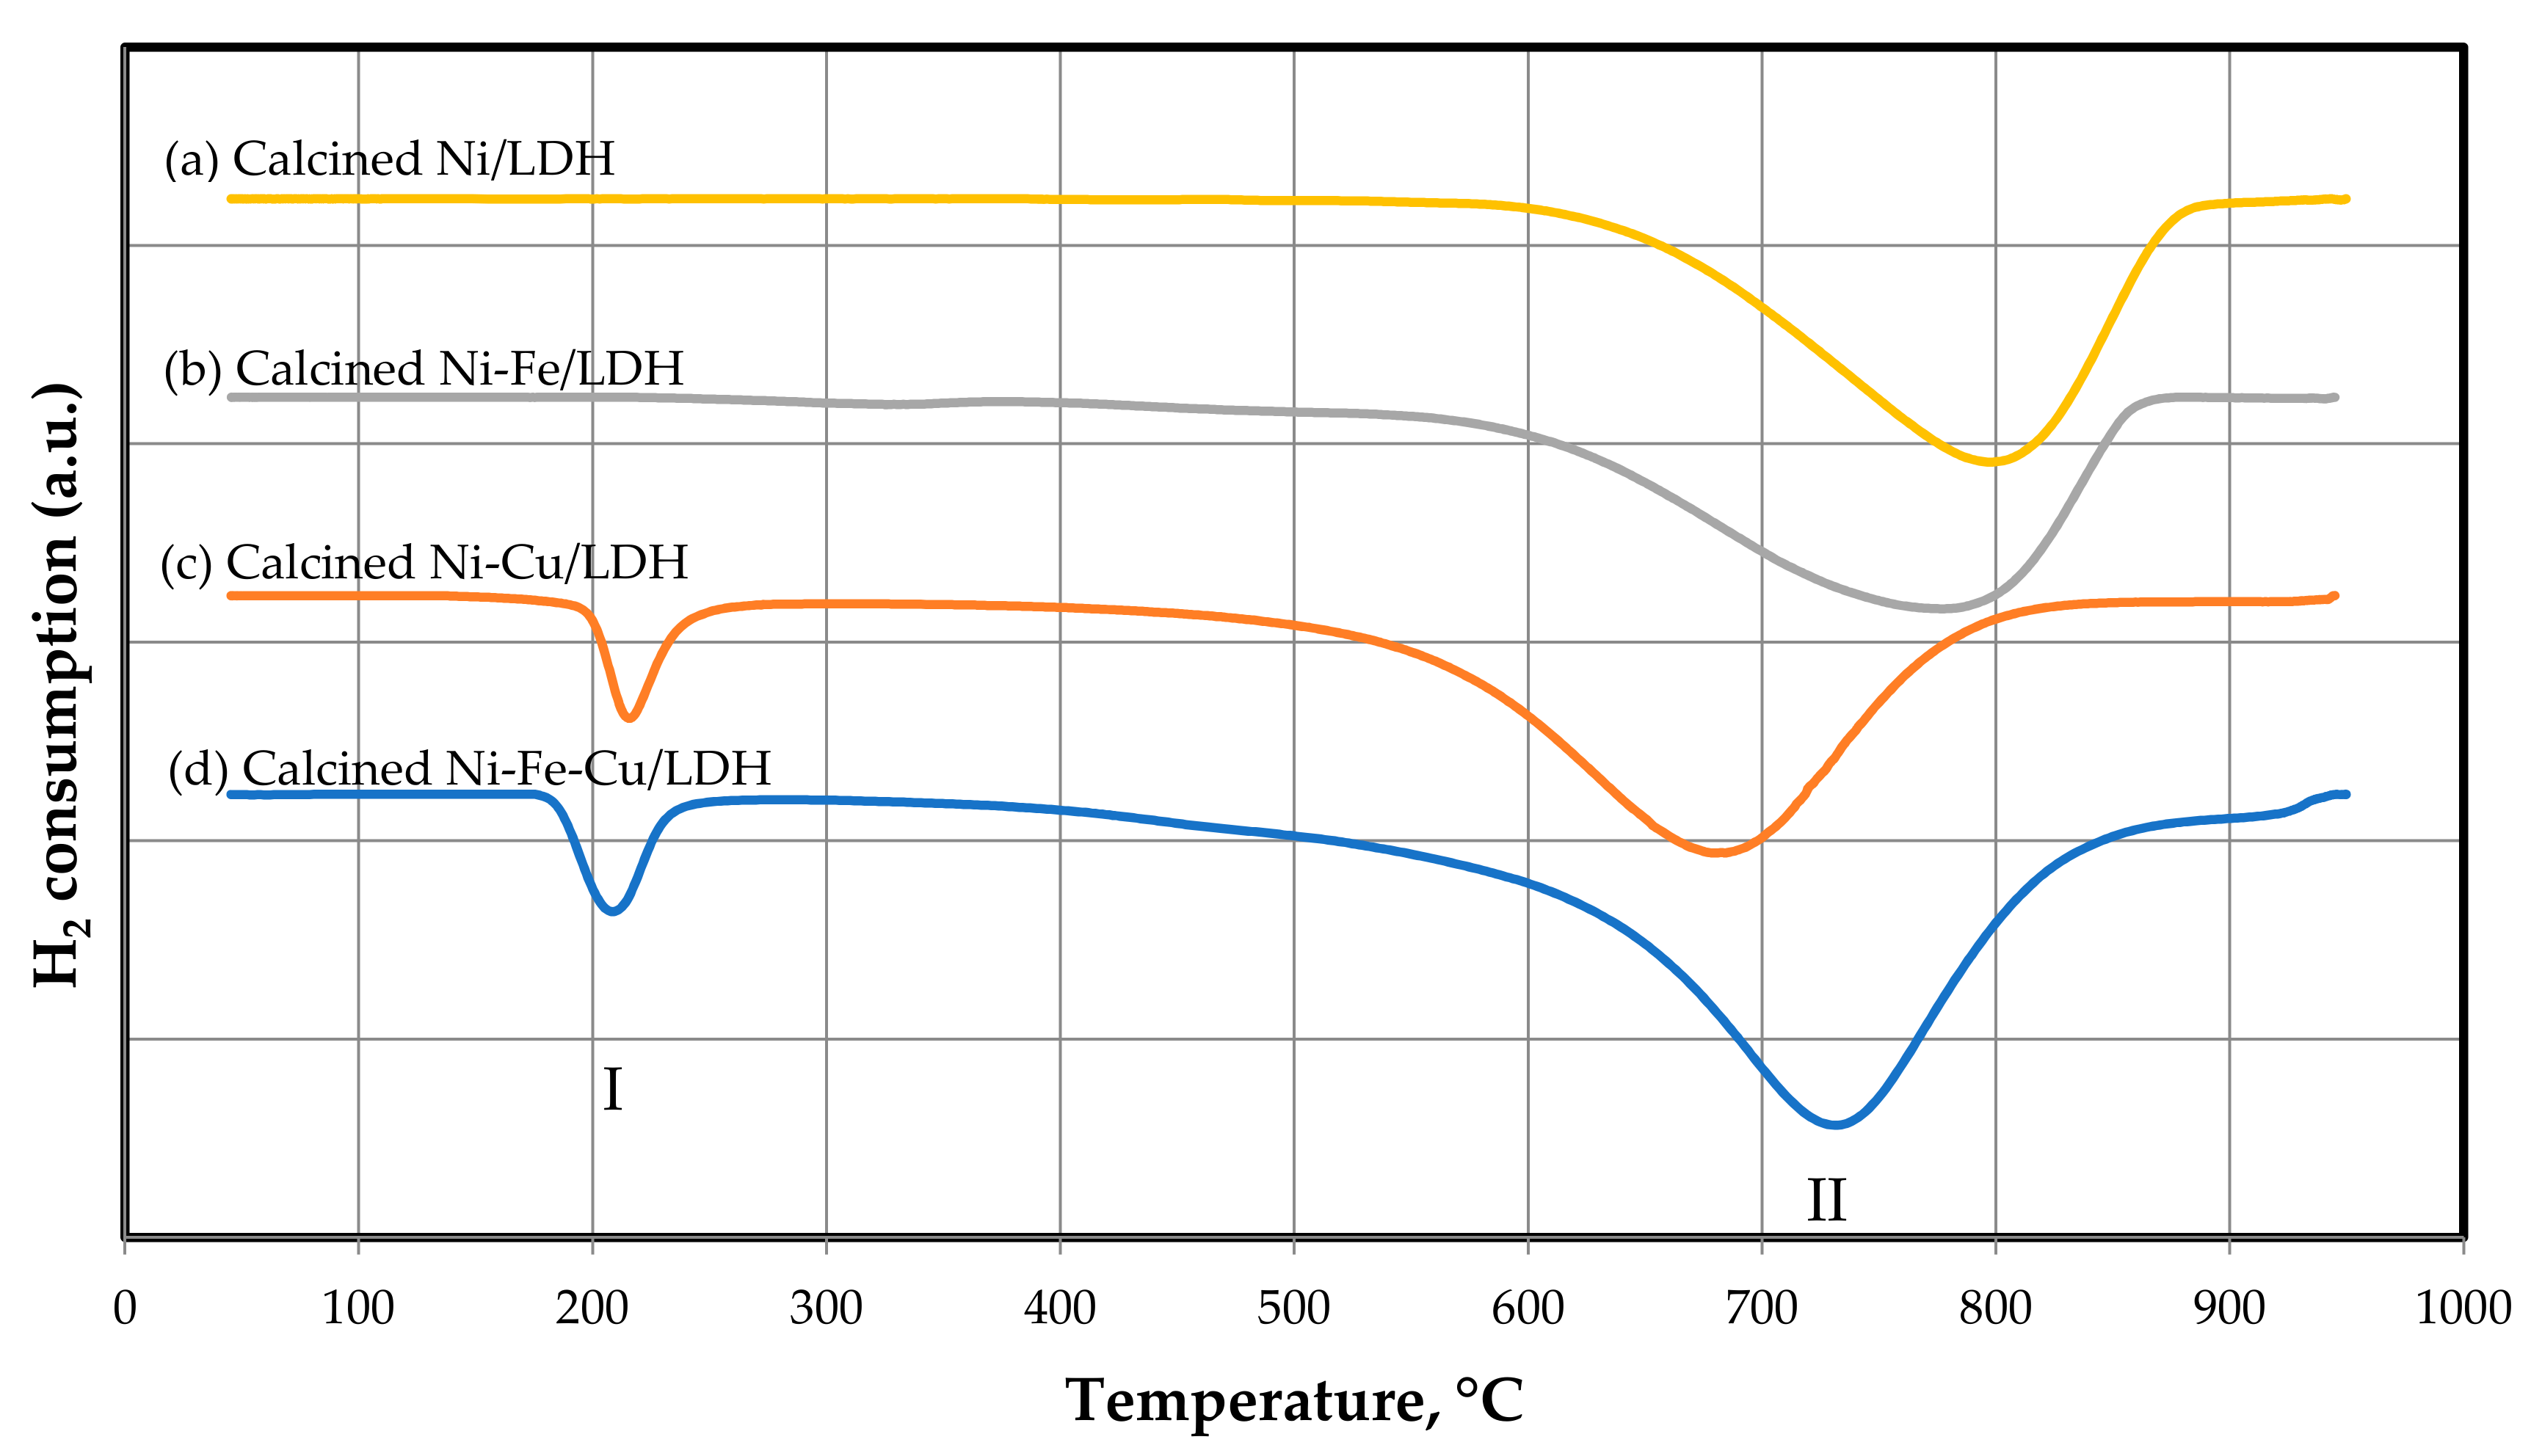
Figure 4.
Scanning electron microscopy (SEM) micrographs at different magnifications of the as-synthetized Ni–Fe–Cu/LDH at different horizontal field widths (HFWs): (a) 95.7 µm, (b) 54.6 µm, (c) 39.2 µm, and (d) histogram.
Figure 4.
Scanning electron microscopy (SEM) micrographs at different magnifications of the as-synthetized Ni–Fe–Cu/LDH at different horizontal field widths (HFWs): (a) 95.7 µm, (b) 54.6 µm, (c) 39.2 µm, and (d) histogram.
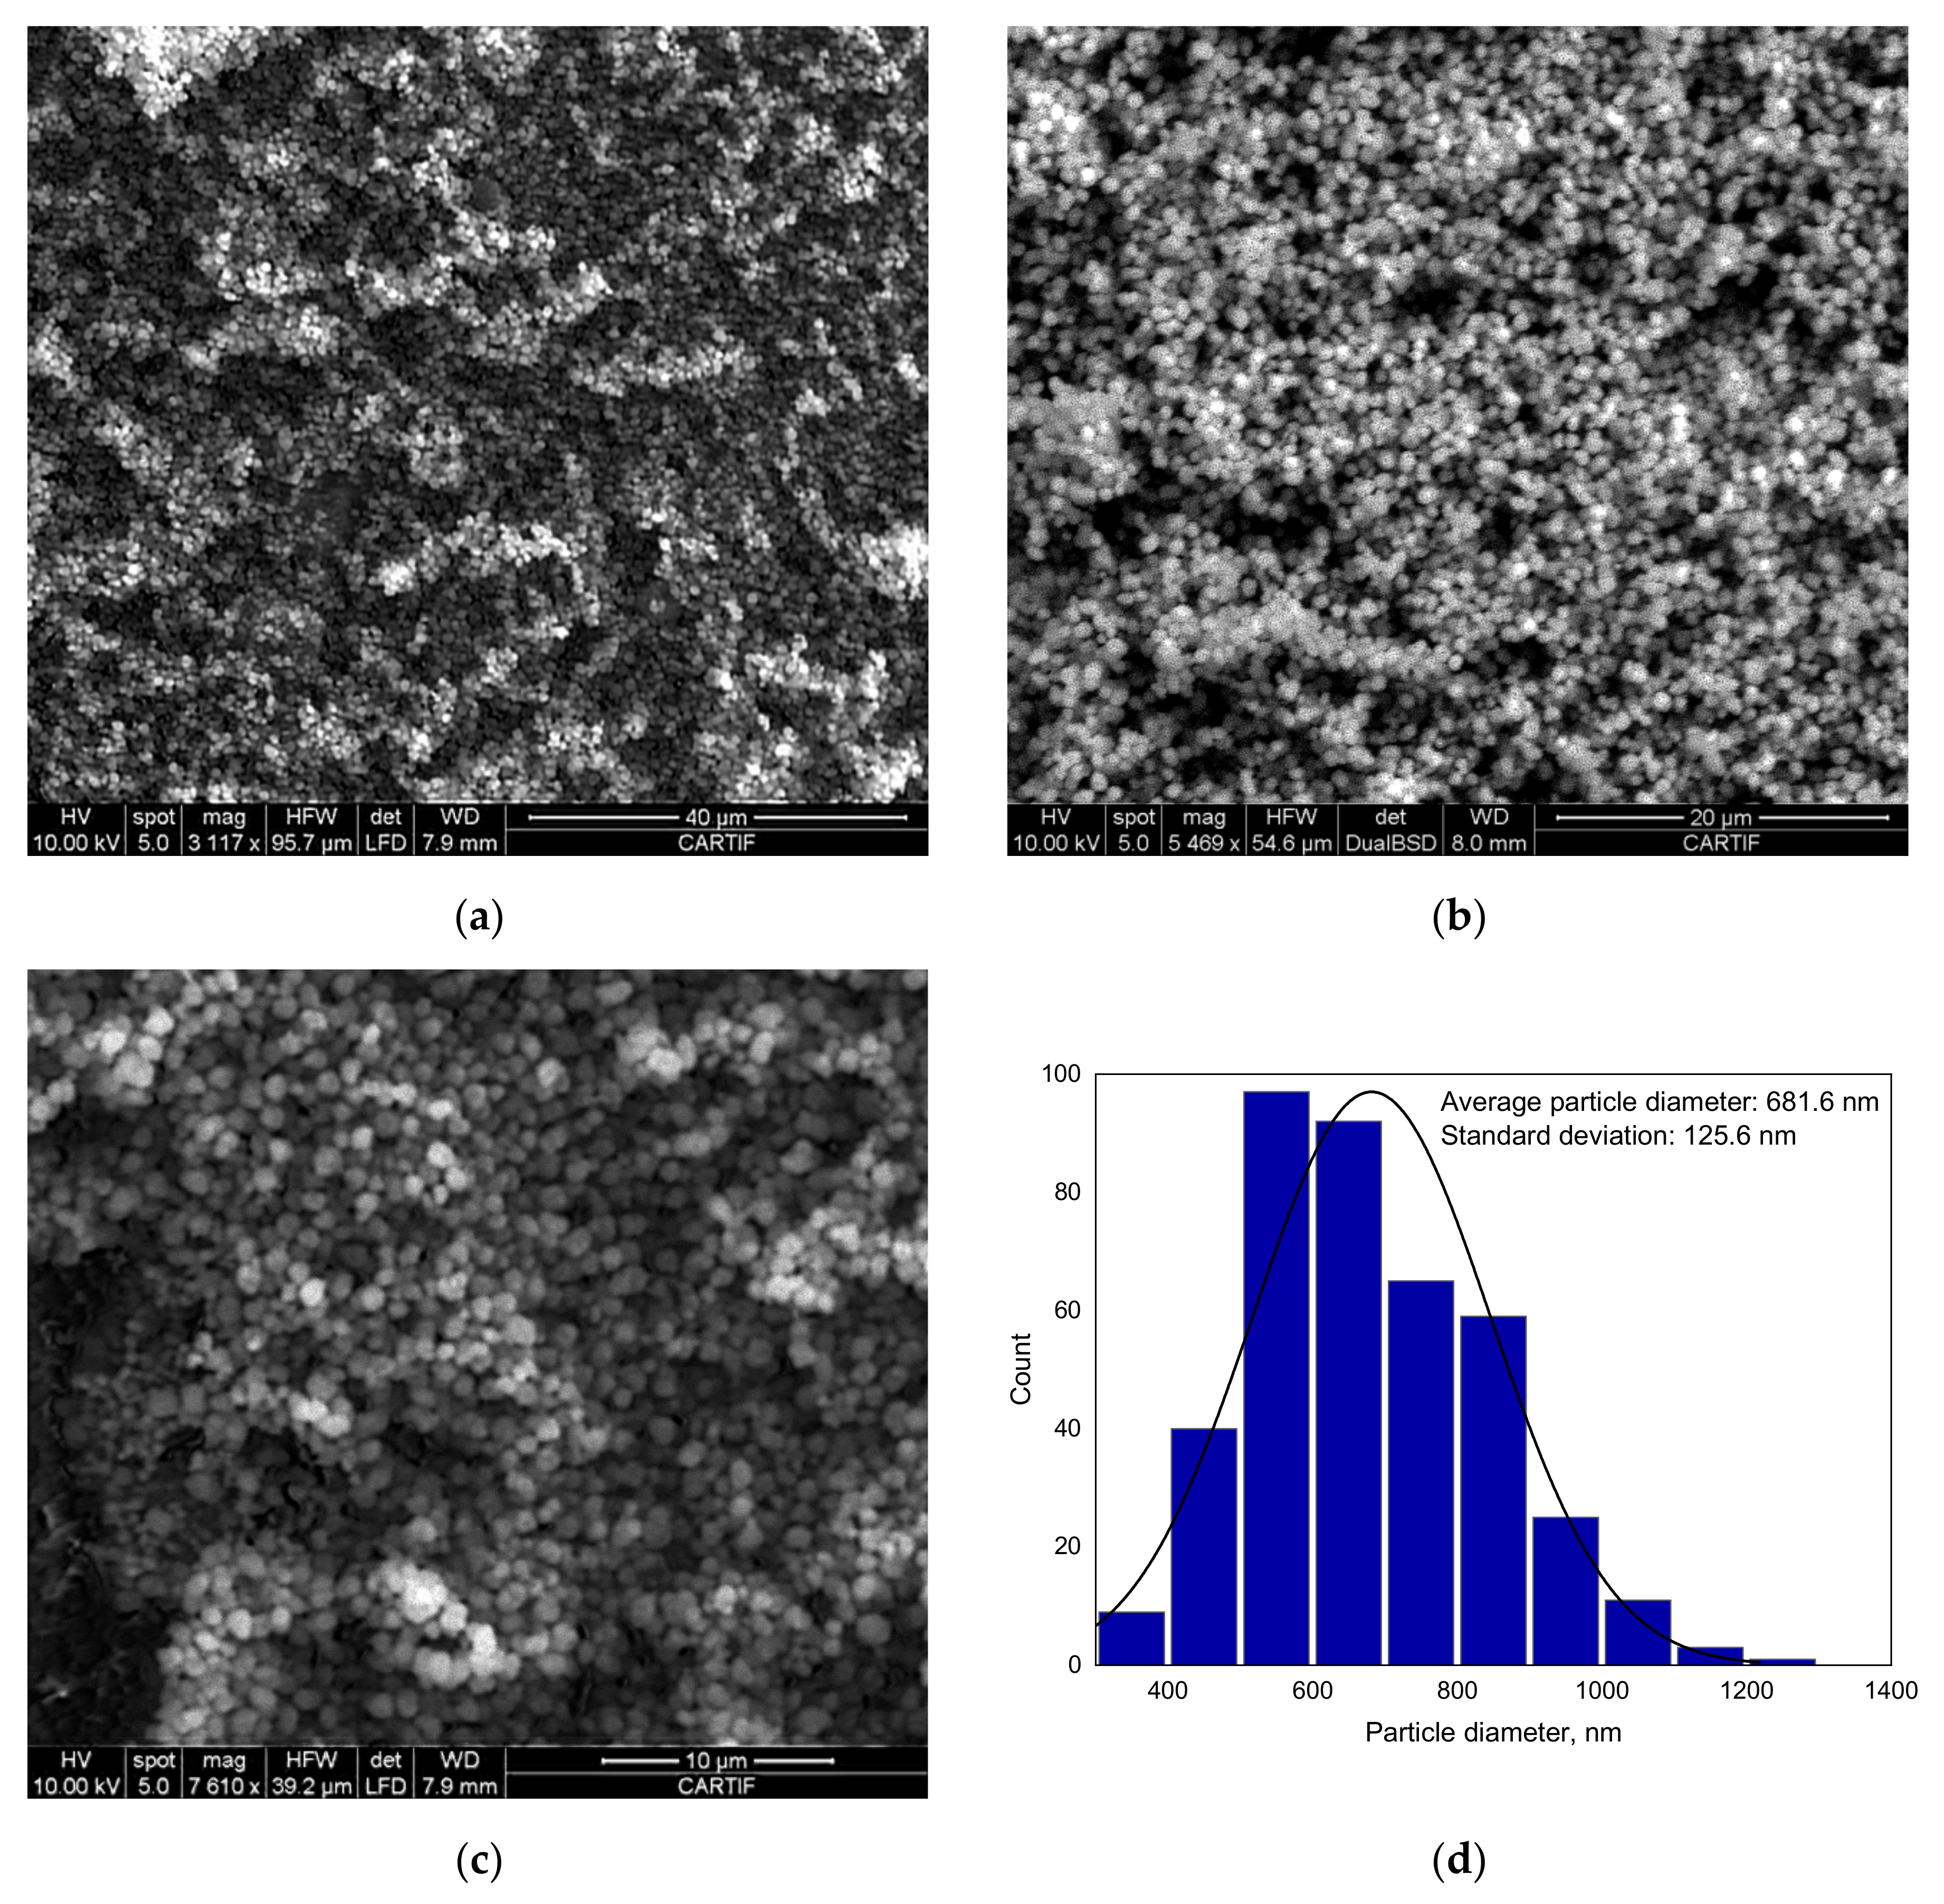
Figure 5.
SEM micrograph (a) and histogram (b) of the calcined Ni–Fe–Cu/LDH at 40.1 µm (HFW).

Figure 6.
Ni-Fe-Cu/LDH XRD profiles (a) as-synthesized, (b) calcined, and (c) after reduction: ( ![Processes 09 00076 i001]() ) hydrotalcite, (
) hydrotalcite, ( ![Processes 09 00076 i002]() ) MgO-like phase, (•) NiO, (
) MgO-like phase, (•) NiO, ( ![Processes 09 00076 i003]() ) Ni(Fe)Ox, (
) Ni(Fe)Ox, ( ![Processes 09 00076 i004]() ) Ni metal, (
) Ni metal, ( ![Processes 09 00076 i005]() ) Ni–Fe alloy.
) Ni–Fe alloy.
 ) hydrotalcite, (
  ) MgO-like phase, (•) NiO, (
  ) Ni(Fe)Ox, (
  ) Ni metal, (
  ) Ni–Fe alloy.
Figure 6.
Ni-Fe-Cu/LDH XRD profiles (a) as-synthesized, (b) calcined, and (c) after reduction: ( ![Processes 09 00076 i001]() ) hydrotalcite, (
) hydrotalcite, ( ![Processes 09 00076 i002]() ) MgO-like phase, (•) NiO, (
) MgO-like phase, (•) NiO, ( ![Processes 09 00076 i003]() ) Ni(Fe)Ox, (
) Ni(Fe)Ox, ( ![Processes 09 00076 i004]() ) Ni metal, (
) Ni metal, ( ![Processes 09 00076 i005]() ) Ni–Fe alloy.
) Ni–Fe alloy.
) hydrotalcite, ( ) MgO-like phase, (•) NiO, ( ) Ni(Fe)Ox, ( ) Ni metal, ( ) Ni–Fe alloy.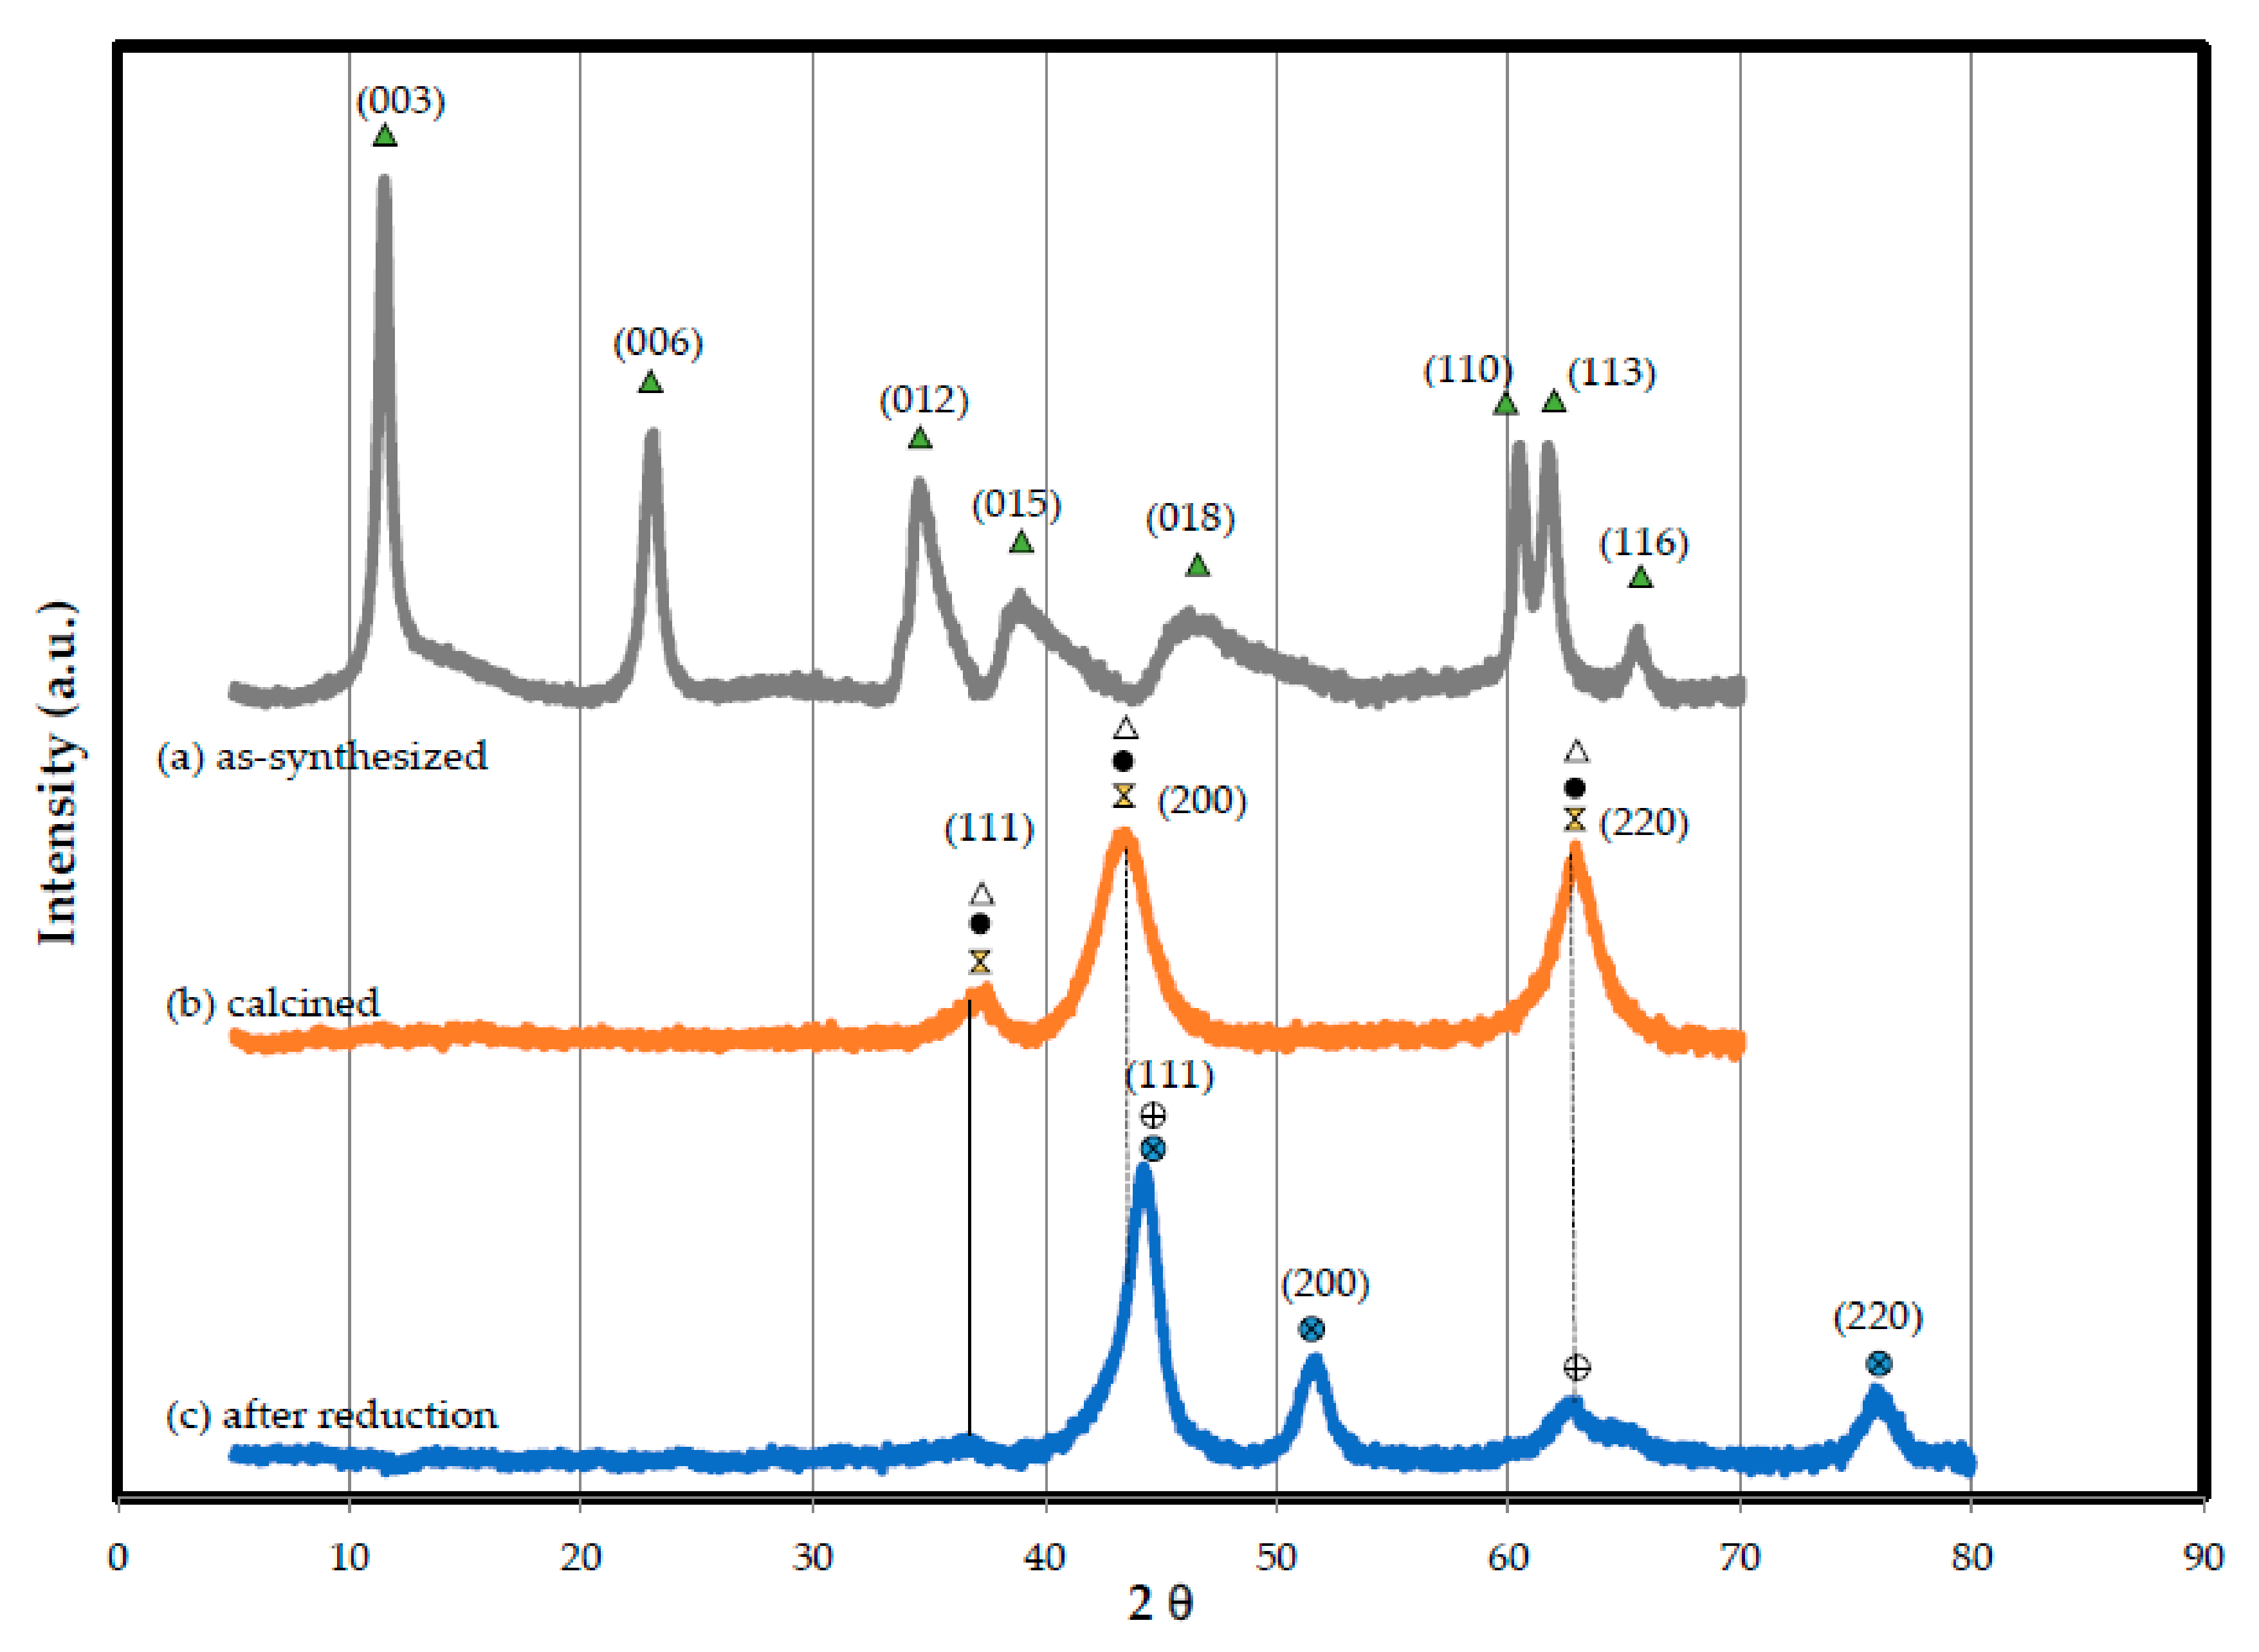
Figure 7.
Pore size distributions of the catalyst ( ![Processes 09 00076 i006]() ) as-synthesized; (
) as-synthesized; ( ![Processes 09 00076 i007]() ) calcined.
) calcined.
 ) as-synthesized; (
  ) calcined.
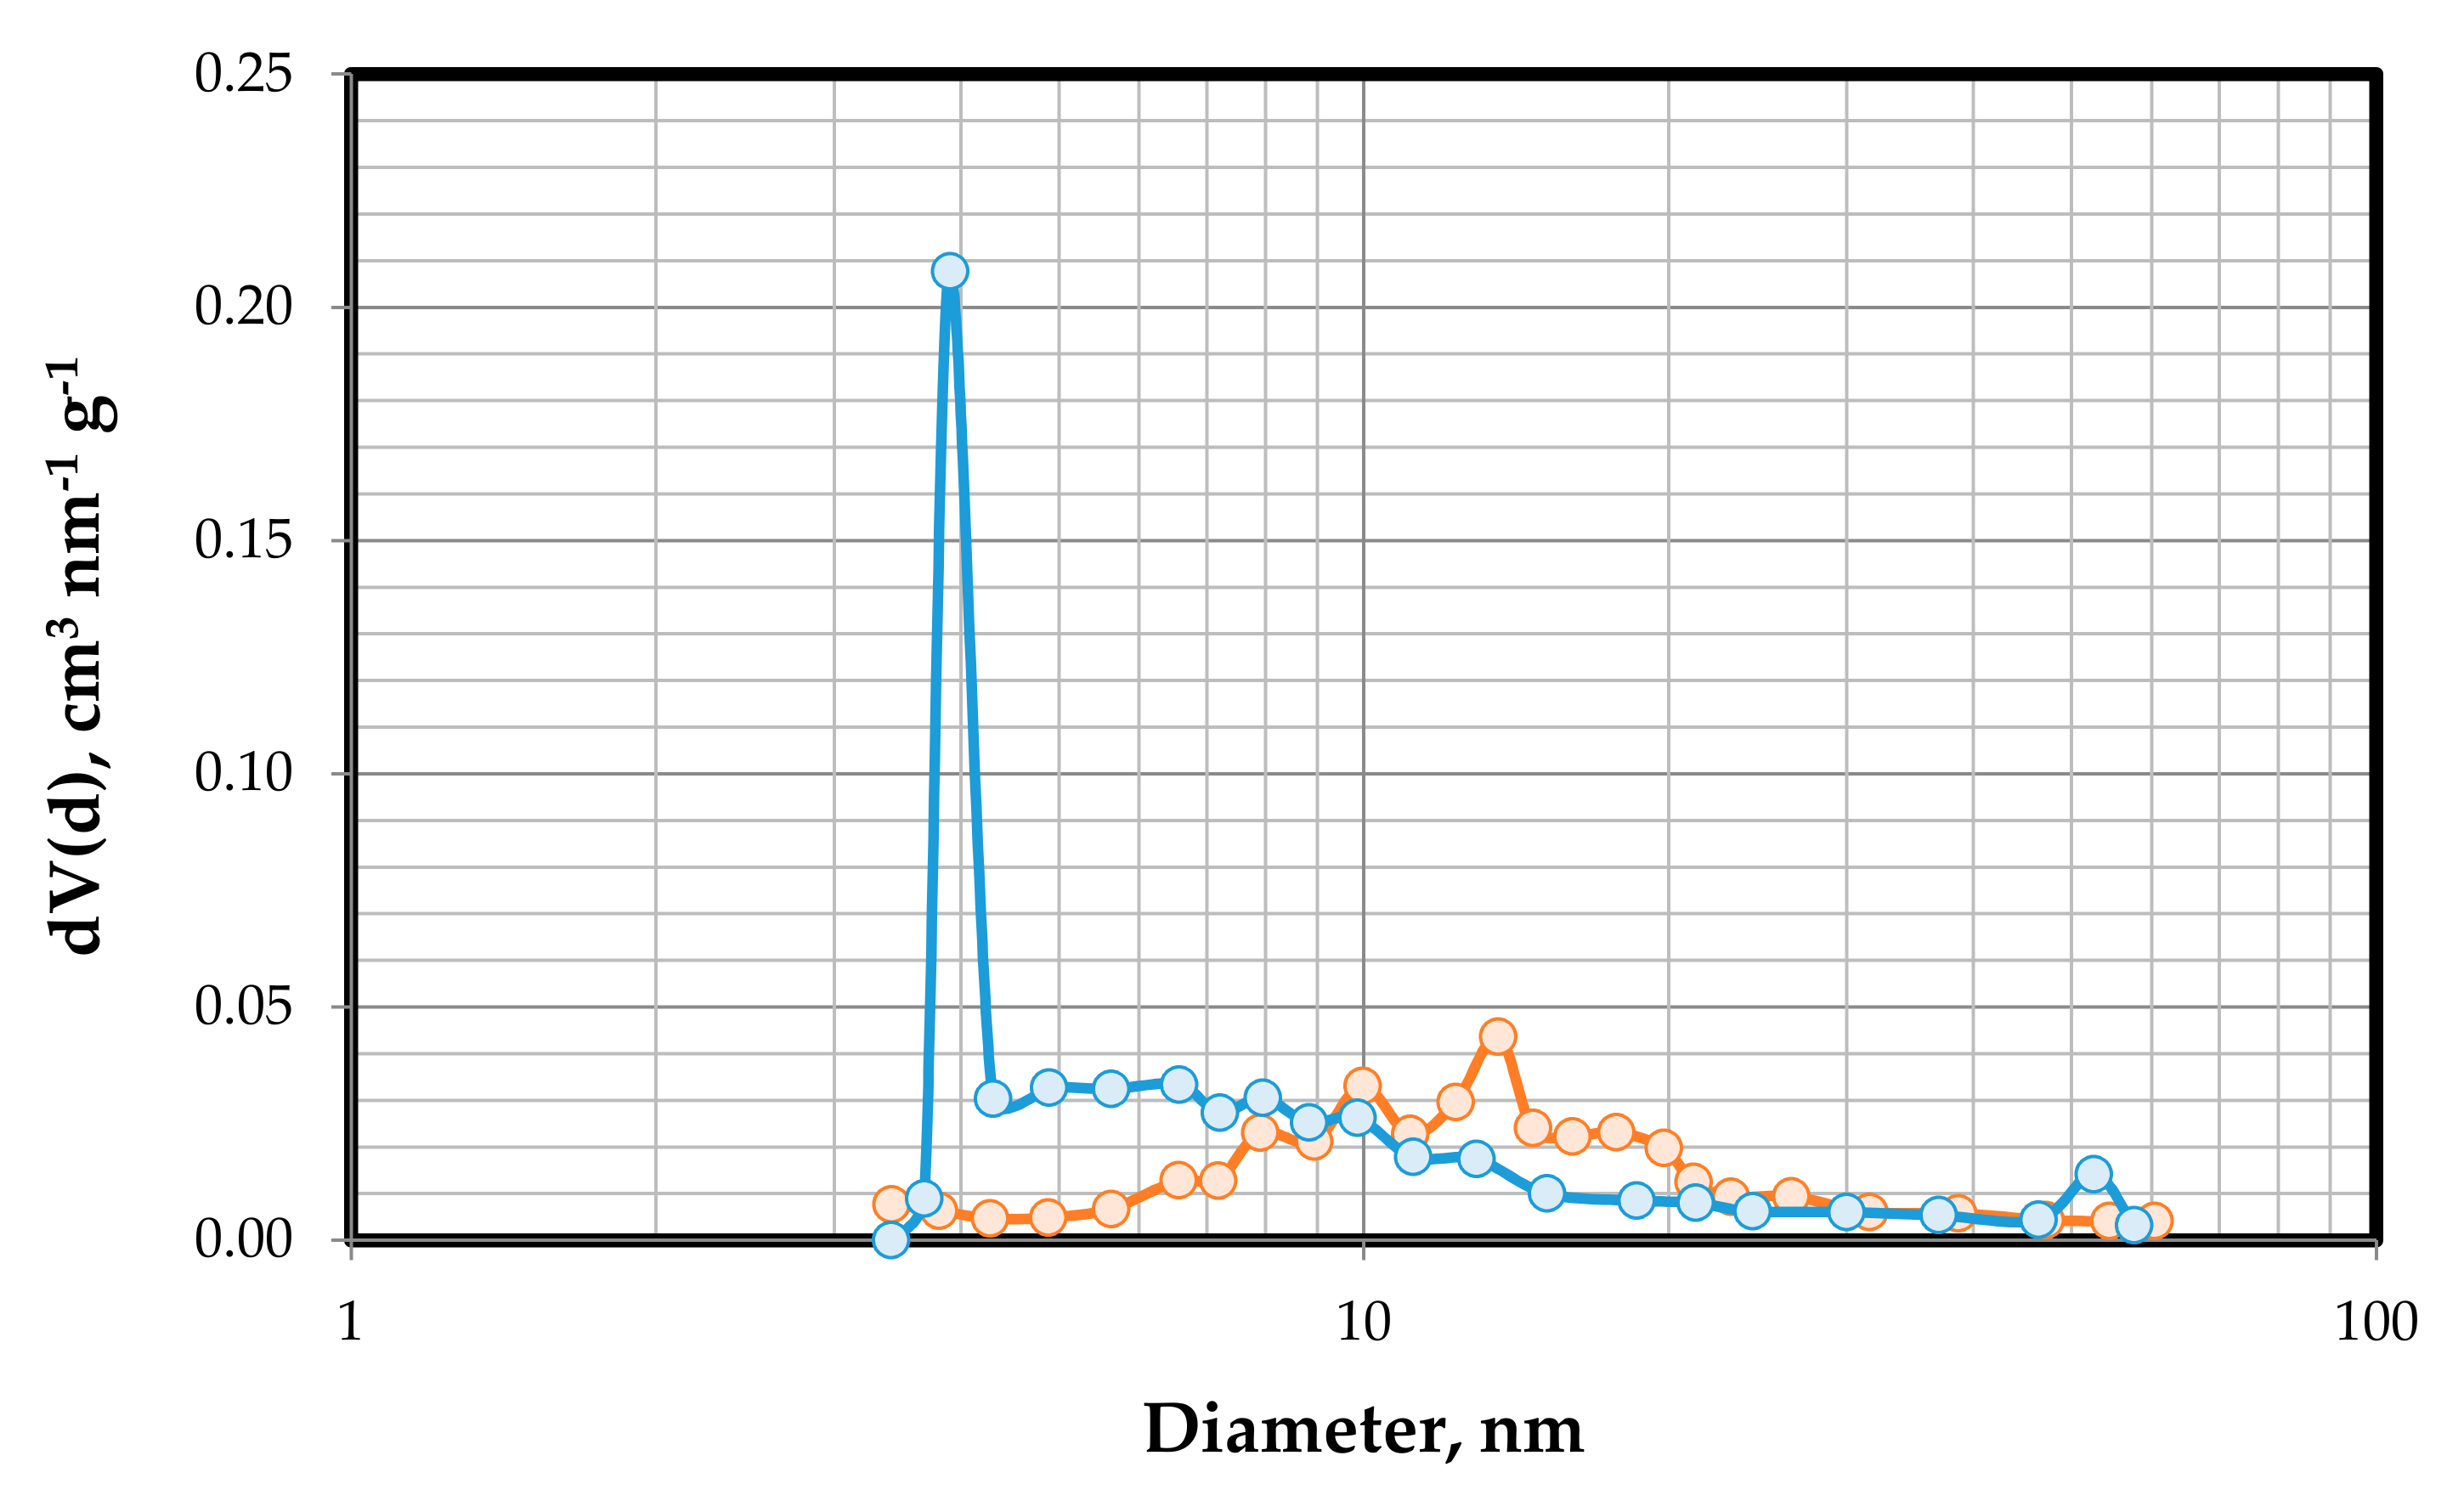
Figure 8.
Conversion of toluene to gases as a function of temperature and S/C ratio.
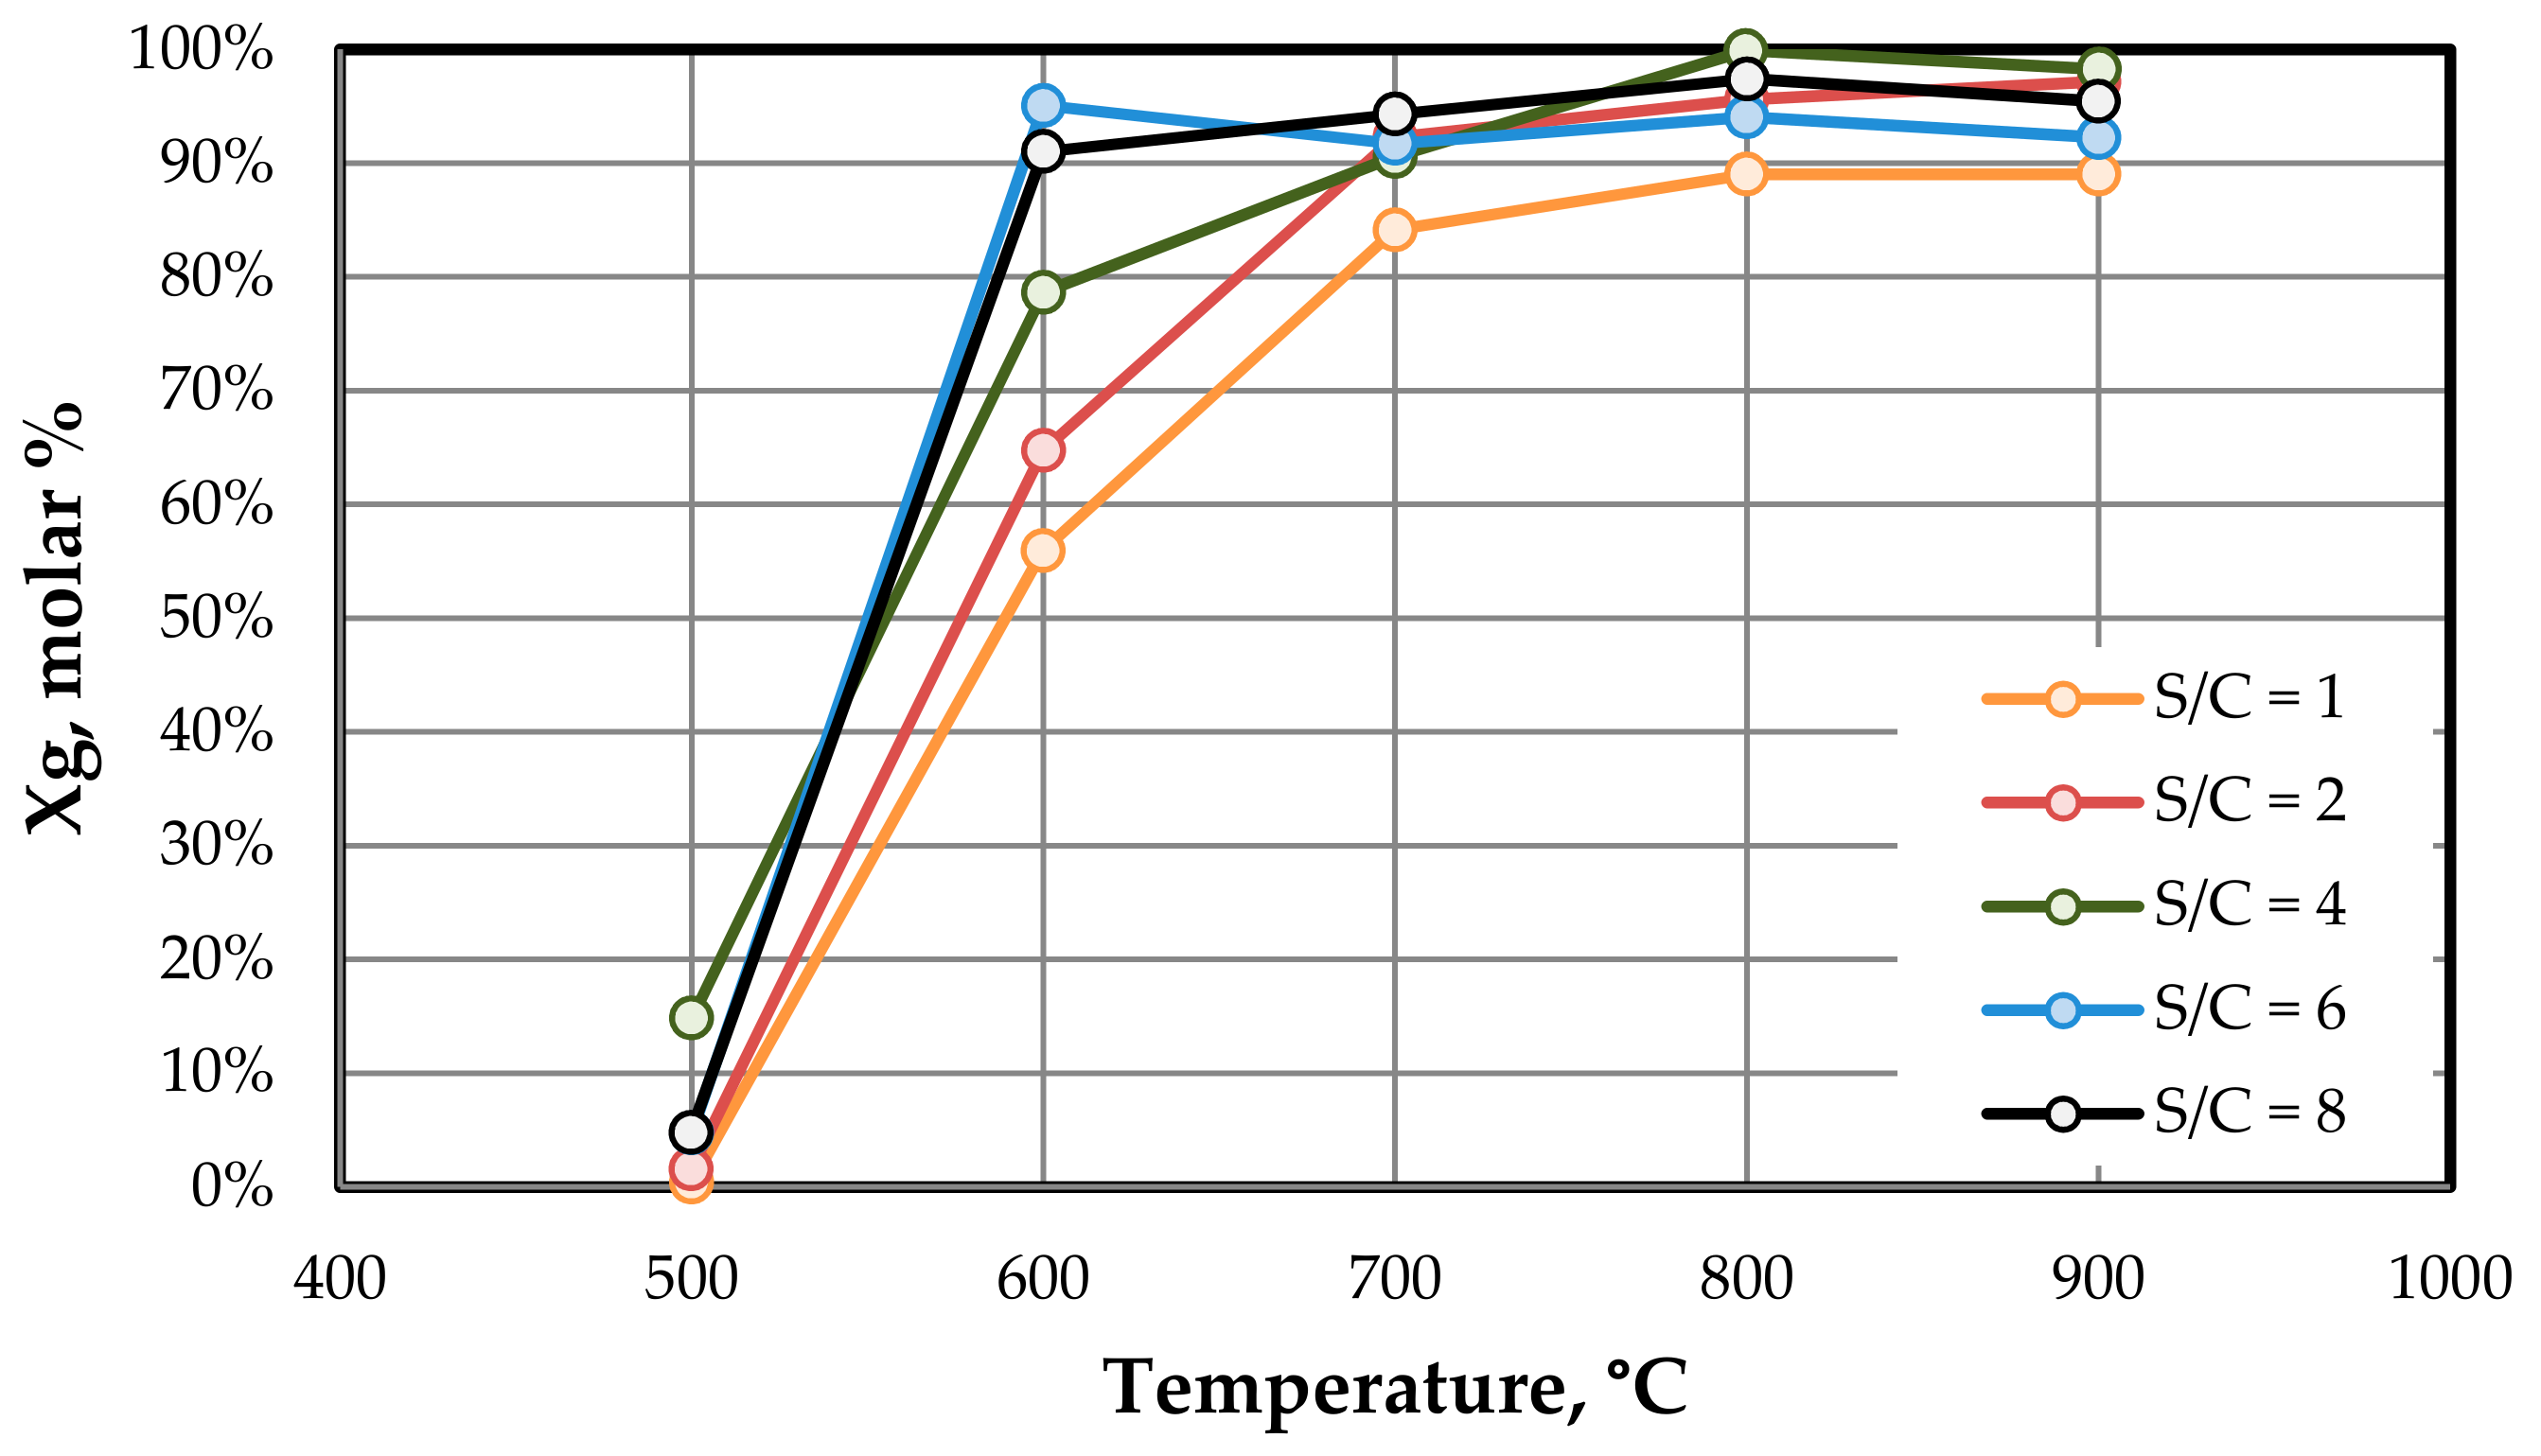
Figure 9.
Molar gas composition as function of temperature and S/C ratio: (a) CO, (b) CO2, (c) H2, (d) CH4. (e) Benzene yield. S/C = 1 ( ![Processes 09 00076 i008]() ), S/C = 2 (
), S/C = 2 ( ![Processes 09 00076 i009]() ), S/C = 4(
), S/C = 4( ![Processes 09 00076 i010]() ), S/C = 6 (
), S/C = 6 ( ![Processes 09 00076 i011]() ), S/C = 8 (
), S/C = 8 ( ![Processes 09 00076 i012]() ).
).
 ), S/C = 2 (
  ), S/C = 4(
  ), S/C = 6 (
  ), S/C = 8 (
  ).
).
Figure 9.
Molar gas composition as function of temperature and S/C ratio: (a) CO, (b) CO2, (c) H2, (d) CH4. (e) Benzene yield. S/C = 1 ( ![Processes 09 00076 i008]() ), S/C = 2 (
), S/C = 2 ( ![Processes 09 00076 i009]() ), S/C = 4(
), S/C = 4( ![Processes 09 00076 i010]() ), S/C = 6 (
), S/C = 6 ( ![Processes 09 00076 i011]() ), S/C = 8 (
), S/C = 8 ( ![Processes 09 00076 i012]() ).
).
), S/C = 2 ( ), S/C = 4( ), S/C = 6 ( ), S/C = 8 ( ).

Figure 10.
Gas composition (a) and gas conversion (b) during catalytic steam reforming of toluene at 800 °C and S/C = 4.
Figure 10.
Gas composition (a) and gas conversion (b) during catalytic steam reforming of toluene at 800 °C and S/C = 4.
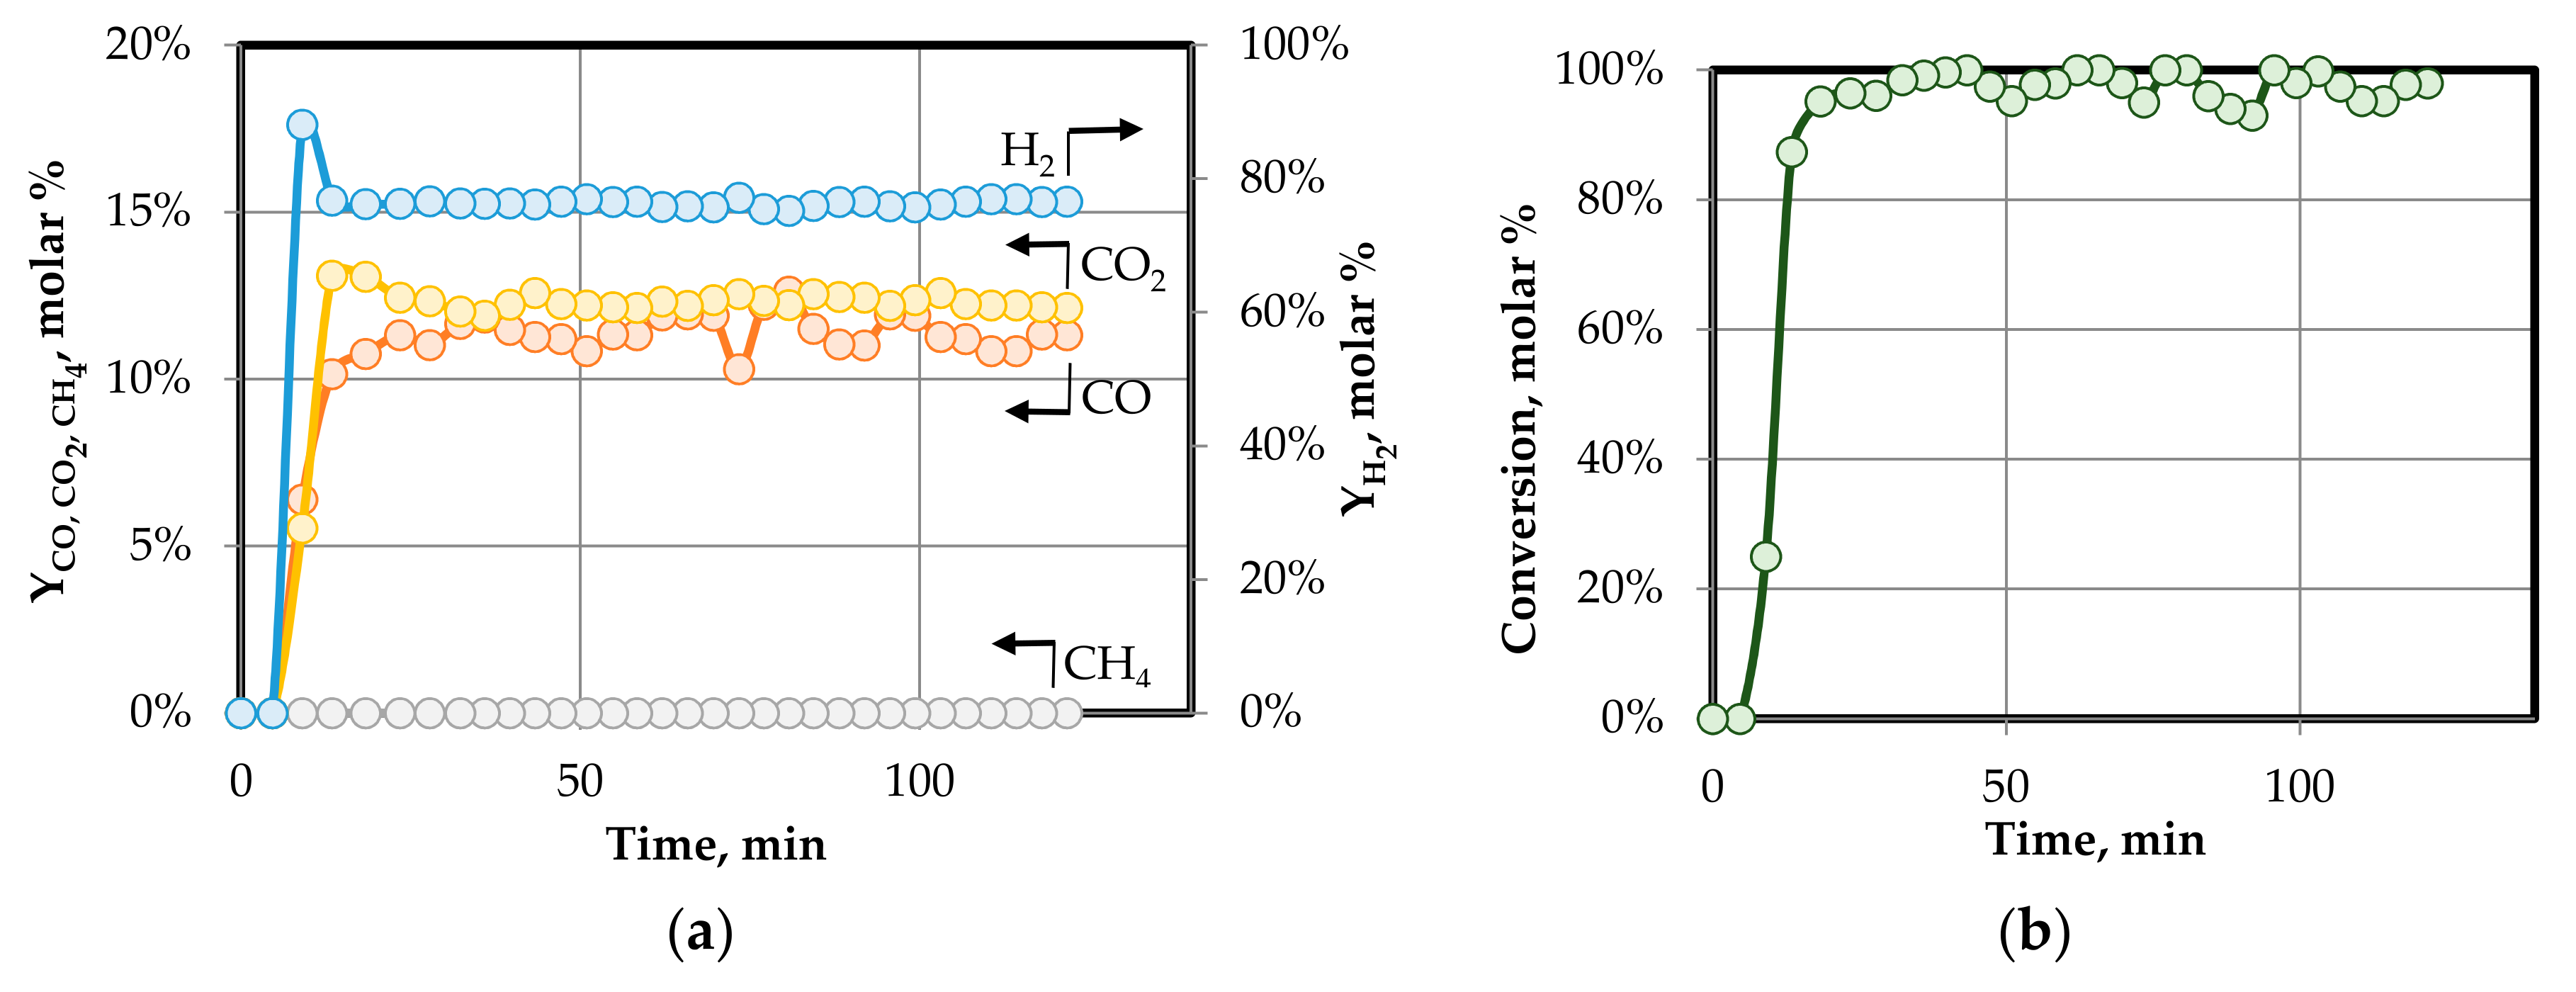
Figure 11.
XRD profile of Ni–Fe–Cu/LDH (a) after reduction and (b) after reaction: ( ![Processes 09 00076 i013]() ) Ni metal, (
) Ni metal, ( ![Processes 09 00076 i014]() ) Ni–Fe alloy, (
) Ni–Fe alloy, ( ![Processes 09 00076 i015]() ) MgO-like phase, (•) NiO.
) MgO-like phase, (•) NiO.
 ) Ni metal, (
  ) Ni–Fe alloy, (
  ) MgO-like phase, (•) NiO.
Figure 11.
XRD profile of Ni–Fe–Cu/LDH (a) after reduction and (b) after reaction: ( ![Processes 09 00076 i013]() ) Ni metal, (
) Ni metal, ( ![Processes 09 00076 i014]() ) Ni–Fe alloy, (
) Ni–Fe alloy, ( ![Processes 09 00076 i015]() ) MgO-like phase, (•) NiO.
) MgO-like phase, (•) NiO.
) Ni metal, ( ) Ni–Fe alloy, ( ) MgO-like phase, (•) NiO.
Figure 12.
Amount of carbon deposited on the surface of the catalyst during the steam reforming reaction of toluene at 600 °C for different values of the S/C ratio.
Figure 12.
Amount of carbon deposited on the surface of the catalyst during the steam reforming reaction of toluene at 600 °C for different values of the S/C ratio.

Figure 13.
DTG signals of the carbon formed at 700 °C and S/C: 2 ( ![Processes 09 00076 i016]() ), 4 (
), 4 ( ![Processes 09 00076 i017]() ), and 6 (
), and 6 ( ![Processes 09 00076 i018]() ).
).
 ), 4 (
  ), and 6 (
  ).
).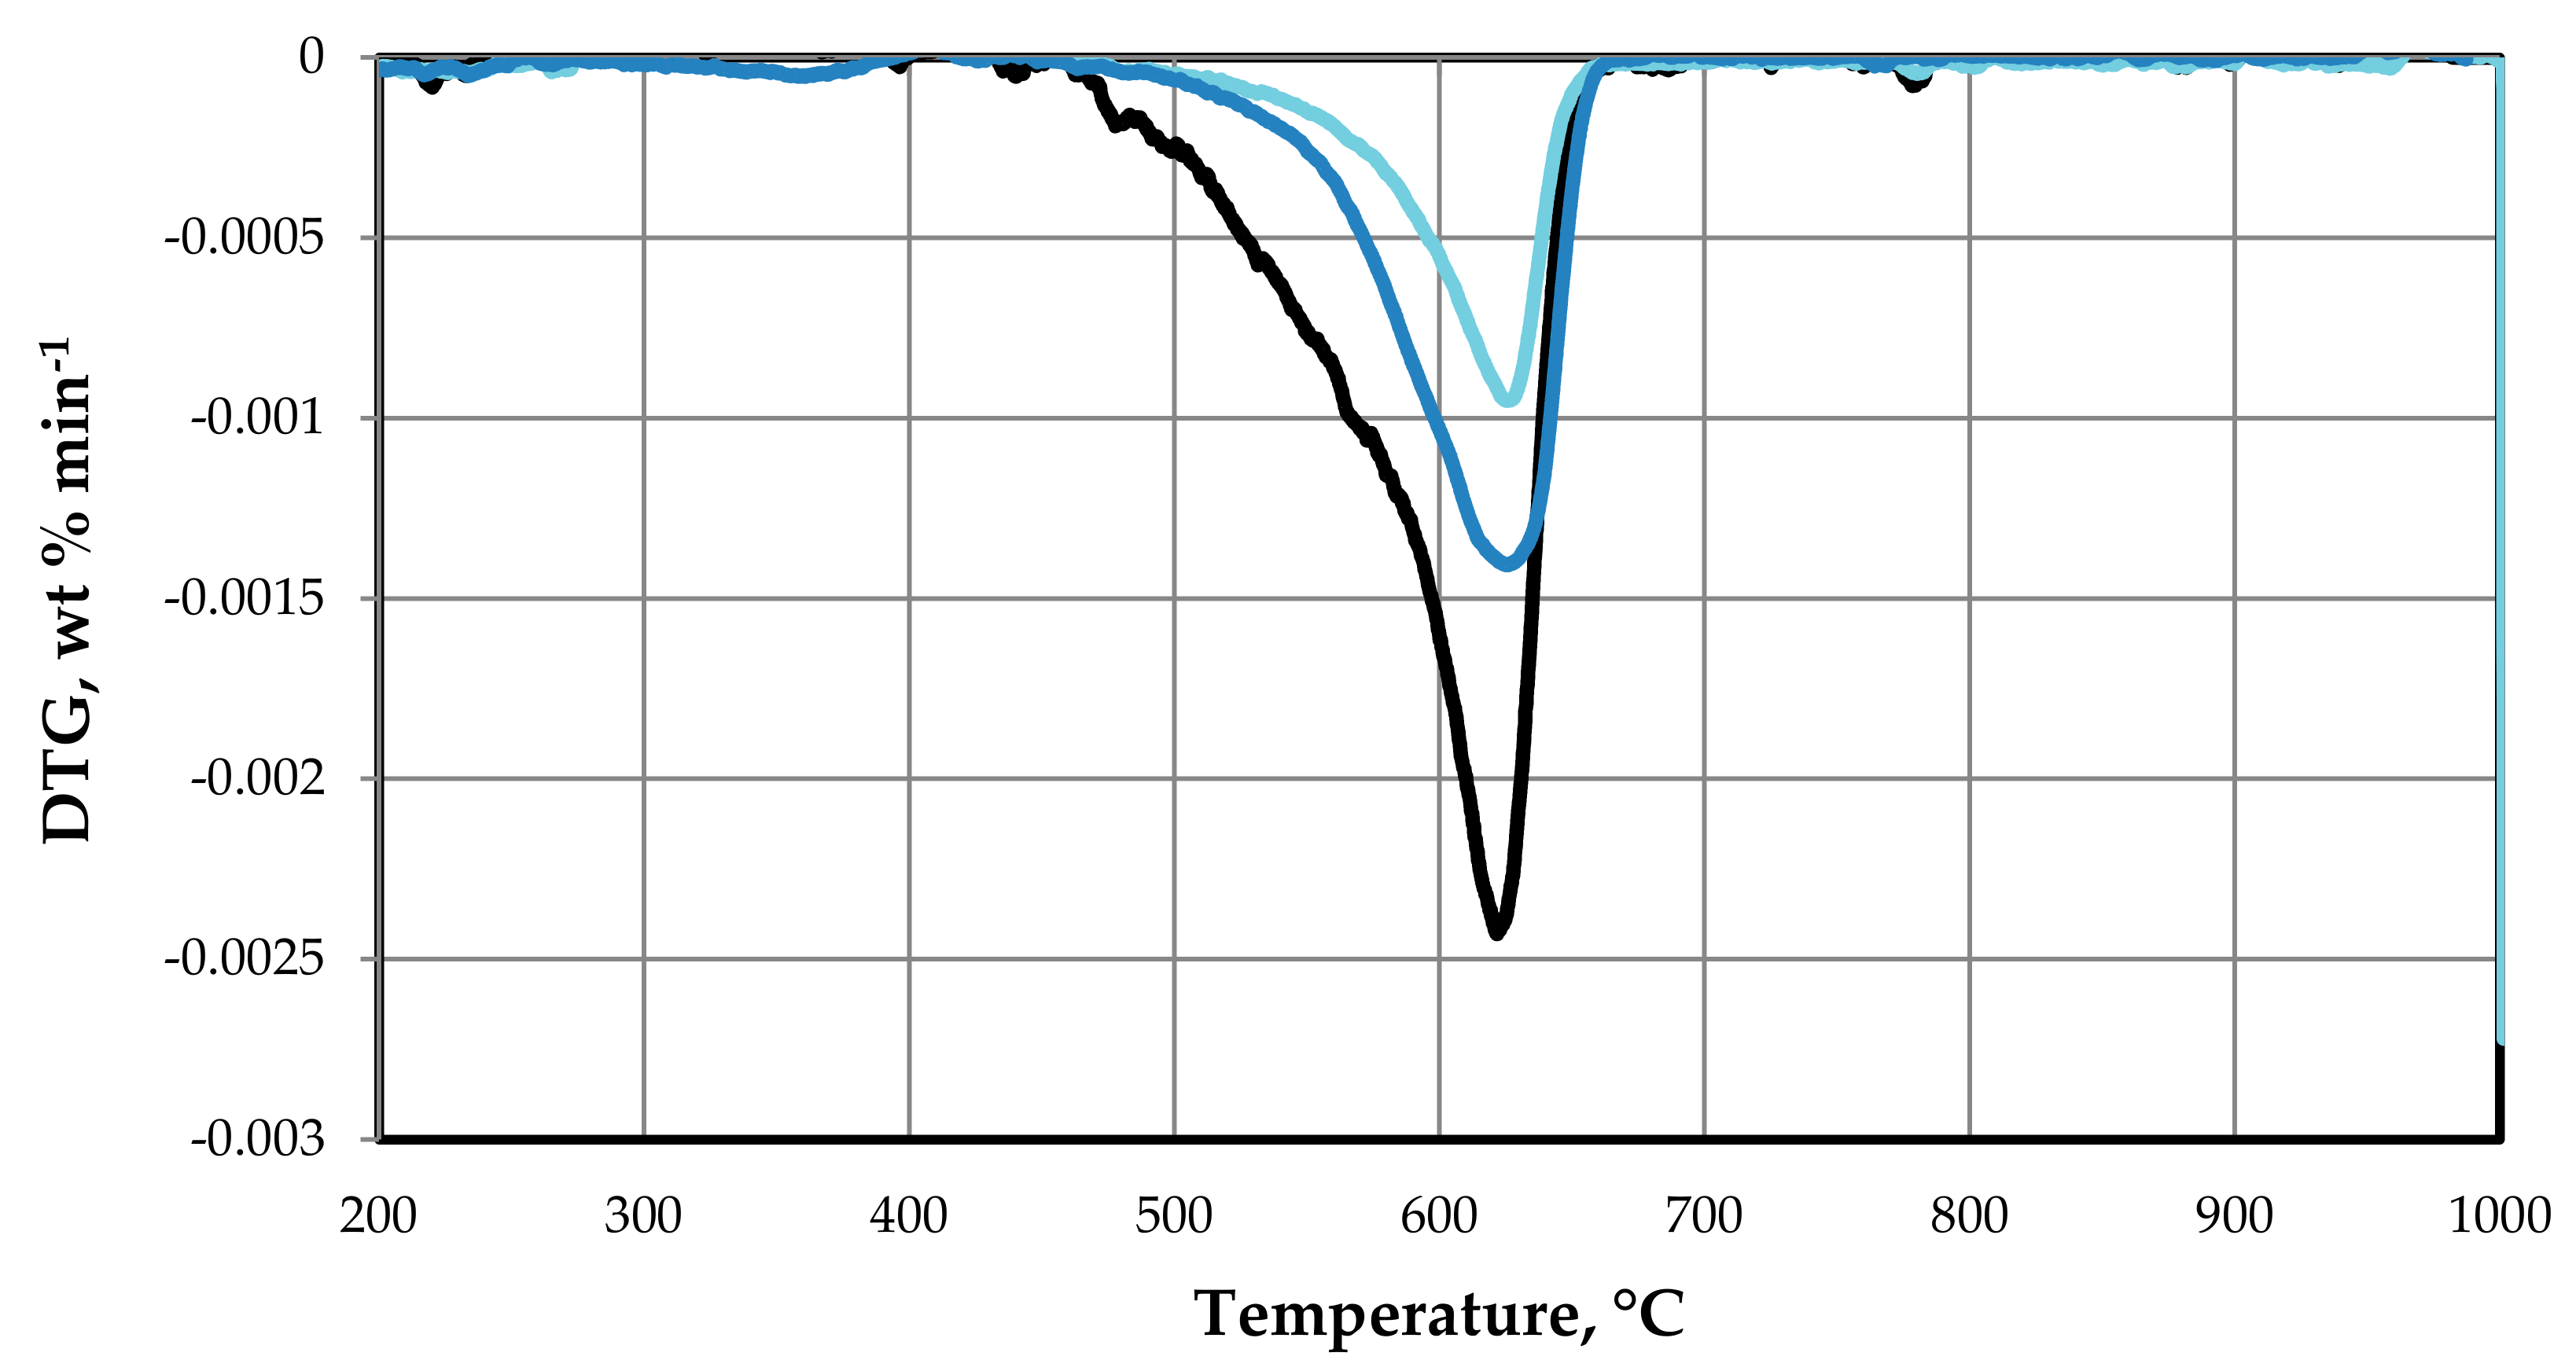
Figure 14.
SEM micrograph and histogram of the reduced Ni–Fe–Cu/LDH at 36.9 µm (HFW) (a,b) and after the steam reforming of toluene at 40.2 µm (HFW) (c,d).
Figure 14.
SEM micrograph and histogram of the reduced Ni–Fe–Cu/LDH at 36.9 µm (HFW) (a,b) and after the steam reforming of toluene at 40.2 µm (HFW) (c,d).

Table 1.
Molar cation concentration of the synthesized layered double hydroxides (LDHs).
| LDH | Molar Cation Concentration Ni/Fe/Cu/Mg/Al |
|---|---|
| Ni−Fe−Cu/LDH | 30/5/5/40/20 |
| Ni−Fe/LDH | 35/5/0/40/20 |
| Ni−Cu/LDH | 35/0/5/40/20 |
| Ni/LDH | 40/0/0/40/20 |
Table 2.
Operating conditions for each steam/carbon molar ratio (S/C ratio) and for W/F = 0.32 g h mol−1.
Table 2.
Operating conditions for each steam/carbon molar ratio (S/C ratio) and for W/F = 0.32 g h mol−1.
| S/C | Reactant | Flow Rate, mmol min−1 | Feedstock Concentration, vol % |
|---|---|---|---|
| Toluene | 0.20 | 1.5% | |
| 1 | Water | 1.38 | 10.5% |
| Nitrogen | 11.59 | 88.0% | |
| Toluene | 0.20 | 1.5% | |
| 2 | Water | 2.77 | 21.0% |
| Nitrogen | 10.21 | 77.5% | |
| Toluene | 0.20 | 1.5% | |
| 4 | Water | 5.53 | 42.0% |
| Nitrogen | 7.45 | 56.5% | |
| Toluene | 0.20 | 1.5% | |
| 6 | Water | 8.30 | 63.0% |
| Nitrogen | 4.68 | 35.5% | |
| Toluene | 0.20 | 1.5% | |
| 8 | Water | 11.07 | 84.0% |
| Nitrogen | 1.91 | 14.5% |
Table 3.
Chemical element analysis of as-synthesized and calcined Ni–Fe–Cu/LDH.
| LDH | Al | Cu | Mg | Fe | Ni |
|---|---|---|---|---|---|
| As-synthesized Ni–Fe–Cu/LDH | 18.86% | 5.87% | 38.70% | 4.75% | 31.82% |
| Calcined Ni–Fe–Cu/LDH | 18.90% | 5.92% | 38.54% | 4.70% | 31.94% |
Table 4.
Total consumption of H2.
| LDH Calcined | Mmol H2/g |
|---|---|
| Ni/LDH | 6.68 |
| Ni–Fe/LDH | 7.30 |
| Ni–Cu/LDH | 7.22 |
| Ni–Fe–Cu/LDH | 7.84 |
Table 5.
Crystallite size and lattice parameters of as-synthesized and calcinated Ni–Fe–Cu/LDH.
| LDH | Crystallite Size | Lattice Parameters | |
|---|---|---|---|
| D, nm | a, Å | c, Å | |
| As-synthesized Ni–Fe–Cu/LDH | 12.83 | 3.06 | 23.06 |
| Calcined Ni–Fe–Cu/LDH | 4.32 | 4.20 | |
Table 6.
Textural characteristics of the as-synthesized and calcined samples.
| Samples | SBET | Vpore | Average Pore Diameter |
|---|---|---|---|
| m2 g−1 | cm3 g−1 | nm | |
| As-synthesized Ni-Fe-Cu/LDH | 131.10 | 0.509 | 3.90 |
| Calcined Ni-Fe-Cu/LDH | 136.70 | 0.556 | 13.57 |
Table 7.
Comparison of the catalytic performances of previously reported catalysts.
| Reference | Catalyst | Toluene Conversion, % | Temperature, °C | S/C |
|---|---|---|---|---|
| [37] | Ni–Ce–Mg/olivine | 93 | 790 | 3.5 |
| [2] | Ni/Al2O3 | 64 | 750 | 3 |
| [38] | Ni/Al/La | 94.53 | 650 | 5.7 |
| [39] | Ni/olivine | 100 | 650–850 | 2.3 |
| [40] | La0.6Ce0.4NiO3 | 80 | 800 | 2 |
Table 8.
Crystallite size and lattice parameters of Ni particles of Ni–Fe–Cu/LDH after reduction and after reaction.
Table 8.
Crystallite size and lattice parameters of Ni particles of Ni–Fe–Cu/LDH after reduction and after reaction.
| Samples | Crystallite Size | Lattice Parameter |
|---|---|---|
| D, nm | a, Å | |
| Ni–Fe–Cu/LDH after reduction | 6.11 | 3.53 |
| Ni–Fe–Cu/LDH after reaction | 15.44 | 3.54 |
Publisher’s Note: MDPI stays neutral with regard to jurisdictional claims in published maps and institutional affiliations. |
© 2020 by the authors. Licensee MDPI, Basel, Switzerland. This article is an open access article distributed under the terms and conditions of the Creative Commons Attribution (CC BY) license (http://creativecommons.org/licenses/by/4.0/).
Share and Cite
MDPI and ACS Style
Díez, D.; Urueña, A.; Antolín, G. Investigation of Ni–Fe–Cu-Layered Double Hydroxide Catalysts in Steam Reforming of Toluene as a Model Compound of Biomass Tar. Processes 2021, 9, 76. https://doi.org/10.3390/pr9010076
AMA Style
Díez D, Urueña A, Antolín G. Investigation of Ni–Fe–Cu-Layered Double Hydroxide Catalysts in Steam Reforming of Toluene as a Model Compound of Biomass Tar. Processes. 2021; 9(1):76. https://doi.org/10.3390/pr9010076
Chicago/Turabian StyleDíez, David, Ana Urueña, and Gregorio Antolín. 2021. "Investigation of Ni–Fe–Cu-Layered Double Hydroxide Catalysts in Steam Reforming of Toluene as a Model Compound of Biomass Tar" Processes 9, no. 1: 76. https://doi.org/10.3390/pr9010076
Note that from the first issue of 2016, this journal uses article numbers instead of page numbers. See further details here.