Article

High Yield Super-Hydrophobic Carbon Nanomaterials Using Cobalt/Iron Co-Catalyst Impregnated on Powder Activated Carbon

by
Bashir O. Betar
1,
Mohammed A. Alsaadi
1,2,3,*,
Zaira Z. Chowdhury
1,*,
Mohamed K. Aroua
4,5,
Farouq S. Mjalli
6 and
MD Mourad Niazi
7
1
Nanotechnology & Catalysis Research Centre (NANOCAT), IPS Building, University of Malaya, Kuala Lumpur 50603, Malaysia
2
National Chair of Materials Science and Metallurgy, University of Nizwa, Birkat Almawz 616, Oman
3
Department of Mechanical Engineering, Al-Maaref University College, Ramadi 31001, Iraq
4
Research Centre for Carbon Dioxide Capture and Utilization, School of Science and Technology, Sunway University, Bandar Sunway, Petaling Jaya 47500, Malaysia
5
Department of Engineering, Lancaster University, Lancaster LA1 4YW, UK
6
Petroleum and Chemical Engineering Department, Sultan Qaboos University, P.O. Box 33, Muscat 123, Oman
7
General and Laparoscopic, Department of Surgery, Aleppo University Hospital, University of Aleppo, Aleppo, Syria
*
Authors to whom correspondence should be addressed.
Processes 2021, 9(1), 134; https://doi.org/10.3390/pr9010134
Submission received: 18 December 2019 / Revised: 10 January 2020 / Accepted: 13 January 2020 / Published: 11 January 2021
(This article belongs to the Special Issue Advances in Supported Nanoparticle Catalysts)

Abstract

:
Synthesis of super-hydrophobic carbonaceous materials is gaining a broader interest by the research community due to its versatile application in separation processes, special coating technologies, and membrane distillation. Carbon nanomaterials (CNMs) may exhibit stable super-hydrophobic character due to their unique physio-chemical features which can be further controlled based on customer requirements by optimizing the process variables. This study deals with the application of a bimetallic catalyst composed of iron (Fe) and cobalt (Co) to synthesize CNMs from powder activated carbon as a precursor. The process parameters were optimized to ensure super-hydrophobic surfaces. Chemical vapor deposition was utilized for the growth of carbon nanomaterials. The impact of input variables on the desired output of yield and contact angle was analyzed. The chemical vapor deposition process was optimized using the response surface methodology based on Box-Behnken design. The proportion of the catalysts and reaction time were the three input explanatory variables whereas the desired response variables were selected as the carbon yield (CY) and contact angle (CA). The synthesized super-hydrophobic materials were characterized using field emission scanning electron microscopy (FESEM), transmission electron microscopy (TEM), Raman spectroscopy, thermogravimetric analysis (TGA), and contact angle analysis. The comprehensive statistical study of the results led to a significant model and optimization. The highest CY (351%) and CA (173°) were obtained at the optimal loading of 2.5% Fe and 2% Mo with a reaction time of 60 min. The images obtained from FESEM and TEM revealed the presence of two types of CNMs including carbon nanofibers and multiwall carbon nanotubes. Thermogravimetric analysis was carried out to observe the temperature degradation profile of the synthesized sample. Raman spectroscopic analysis was also used to observe the proportion of ordered and disordered carbon content inside the synthesized samples. The improved catalytic super-hydrophobic carbon nanostructured materials production process proposed by this study assures the stability and high yield of the product.

1. Introduction

Production and applications of carbon-based nanomaterials (CNMs) occupies a very important place in nanotechnology research and development. CNMs with different forms including carbon nanotubes (CNTs), carbon nanofibers (CNFs), etc., with their unique physical and chemical properties are still believed to offer solutions for environmental and technical challenges [1,2,3,4].
Super-hydrophobic CNMs, which exhibit contact angles (CA) > 150°, played serious roles in tackling many technical problems related to chemical and physical natures of surfaces and contacts. Therefore, super-hydrophobic CNMs have been implemented in various applications, including drug delivery materials [5], adsorbents [6], antifouling and self-healing membranes [7], and others [8,9]. The hydrophobicity of carbonaceous materials is mainly dependent on the roughness and surface chemistry of the synthesized samples [8]. CNMs’ growth over other materials can influence the chemistry and roughness of the surface of the synthesized nanomaterial [9]. Thus, emphasis should be given to synthesize the carbon superstructures containing different types of hybrids to ensure super-hydrophobic characteristics by optimizing its roughness and physiochemical properties.
Until recently, several methods have been used to synthesize CNMs including chemical vapor deposition method (CVD) [10], carbon arc discharge method (CA) [11], high-pressure carbon monoxide conversion (HiPco) process [12], and pulsed laser vaporization technique (PLV) [13]. The superior quality of produced nanomaterials can be assured using CA and PLV methods. However, the application of CA method is restricted due to the high processing temperature of around 2700 °C needed to evaporate the carbon atoms from solid carbon sources; while the PLV method requires vacuum conditions and continuous graphite target replacement [14]. Thus, the scale-up of these production processes for commercialization purposes is difficult. Hence, for larger-scale production, the CVD method has gained much more attention than the others [15]. The CVD method is considered the most suitable synthesis method as it can ensure the product’s high quality and quantity simultaneously [16]. Materials like silica [17,18], alumina [19,20], zeolite [21], and recently MgO [22,23] were used as supports for active metals to develop different types of nanostructured carbons like single walled nanotubes (SWNTs), multi walled nanotube (MWNTs), and nanofibers. Nevertheless, powder activated carbon (PAC) is considered to be the most suitable precursor in this regard due to its economic feasibility and unique features, including high thermal stability, high surface area, and prospect for chemical modifications by simple means [24,25]. Nano to micro dimensional carbon having different proportions of graphitic or disordered regions in carbon–carbon composites can induce superior properties based on the usage of suitable catalysts and process parameter optimization [26]. PAC has been used to synthesize carbon nanofibers (CNFs) using acetylene (C2H2) and iron (Fe) catalysts in the CVD process [27,28]. On the other hand, modification of CNMs structure has been done by other researchers to achieve artificial super-hydrophobic surfaces. Optimization of the super-hydrophobic CNMs synthesis process could be hampered due to the aggregation nature of CNMs and usually, it comprises impurities [29]. The hybrid PAC–CNMs maintains the chemical compatibility between these two materials and combines the favorable characteristics of both.
Catalysts commonly used for CNTs growth are some transition metals like iron (Fe), cobalt (Co), and nickel (Ni) [27]. Lots of literature was already devoted to the CNT growth using different metals and their alloys [30]. Transition metals have empty ‘d’ shells which enable them to interact with hydrocarbons resulting in greater catalytic activity. The metallic particles used in the CVD process serve as seeding agents for the nanotubes, subsequently, they robustly control the configuration and quality of the finally developed materials. For the decomposition of hydrocarbons, transition metals require support for the successful growth of nanotubes. It was found that not only growth rate and diameter are highly influenced by the catalyst type and composition, but also the microstructure and morphology [31]. Moreover, the synthesis of CNMs from hydrocarbons is affected by the bimetallic catalysts’ synergistic effects [32,33,34]. For example, the growth of CNMs was improved by using bimetallic catalysts such as Fe–Co, Co–Mo, and Fe–Ni [35,36,37,38,39]. All the above-mentioned catalysts (single or bimetallic catalysts) were successfully used with substrates other than PAC in most cases due to the difficulties in forming metallic nanoclusters on the surface of PAC with conventional methods.
Combining more than one catalyst at the same time affects the characteristics of the grown CNMs due to the interaction between the substrate surface and different metal clusters. In this study, the combination of bi-catalyst (Fe/Co), which deposited on PAC as a substrate, is considered to produce super-hydrophobic CNMs with high yield and effective performance. Moreover, the reaction is also investigated as an effective process parameter in thermal CVD to decompose acetylene as a carbon source at 650 °C. The optimum carbon yield (CY) and contact angle (CA) were the objective functions used for the production process while the catalyst’s composition and reaction time were regarded as the explanatory variables in the response surface method (RSM) approach. The ultimate goal of this study is to produce super-hydrophobic CNMs to be utilized as material composites for several applications such as sorption [6], membrane distillation [40], separation of organic mixtures, purification of water by adsorption techniques, and catalysis [41].

2. Materials and Methods

2.1. Materials and Reagents

Iron nitrate Fe (NO3)3·9H2O, cobaltous nitrate hexahydrate Co(NO3)26H2O, PAC, and acetone were purchased from Sigma Aldrich, Kuala Lumpur, Malaysia. Acetylene gas (C2H2), hydrogen gas (H2), and nitrogen gas (N2) were purchased from GasLink Industrial Gases SDN BHD, Selangor, Malaysia. Analytical grade reagents and chemicals were used in this research. Thus, no additional purification step was necessary for conducting the experiments.

2.2. Synthesis of Binary Metal Catalyst

The bimetallic catalysts (iron and cobalt) were first dissolved in acetone using their salts. Then the incipient wetness method was used to deposit the catalyst over the surface of the PAC. Based on Table 1, different weight percent (w/w%) of catalyst samples were prepared. The ratios between PAC and catalysts were calculated based on the experimental design matrix provided by the Box-Behnken design (BBD). According to Table 1, the catalyst solution was prepared by dissolving the desired amount of the catalysts in 5 mL of acetone solution. The mixture was kept inside the universal glass bottle and stirred until all the catalysts salts were completely dissolved.

2.3. Powdered Activated Carbon Impregnation

The metallic catalysts (iron and cobalt) were impregnated on PAC. After the catalysts were dissolved in acetone, PAC (2 g) was mixed with that catalyst–solvent mixture in a glass bottle. The glass bottles containing catalyst dissolved in acetone and PAC were sonicated at 40 kHz and 60 °C to evaporate the solvent. The mixture was further dried at 100 °C overnight using a conventional drying oven. After drying, the mixture was crushed to powder. The powder mixture thus obtained was stored using a desiccator to prevent moisture adsorption and sent for further characterization and application.

2.4. Synthesis of Carbon Nanostructured Materials (CNMs)

The catalysts of desired ratio was mixed with PAC and transferred to a ceramic boat (50 mm OD, 40 mm ID, 1500 mm L). This boat was then inserted inside the CVD reaction tube. The inert atmosphere was created by the flow of nitrogen (N2) gas at a flow rate of 200 mL/min inside the CVD reactor. The sample was first heated at 350 °C for 2 h under this inert blanket condition to prevent burning and ash formation. Hydrogen gas (200 mL/min) was passed at 450 °C for 2 h inside the CVD reactor to ensure the reduction process of the calcined sample. The sample then was cooled down to room temperature. At this stage, the amount of moisture present in the sample was determined by weighing the sample (WC).
Under atmospheric pressure, the reduced catalyst mixture was placed inside the tubular ceramic reactor. Inside the reactor, a mixture of acetylene (50 mL/min) and hydrogen (200 mL/min) gas was flown. For facilitating the growth of CNMs, acetylene to hydrogen gas ratio was kept at 1:4 and the reaction was carried out at 650 °C for different reaction time as provided by the design matrix. After the reaction was completed, the reactor was cooled down using N2 gas flow (200 mL/min). The weight (WP) of the synthesized CNMs was taken. The carbon yield was calculated using Equation (1).
CY% = (Wp − Wc)/Wc
where Wp and Wc are the weight of the sample after and before the reaction, respectively.

2.5. Equipment and Measurements

All the weighing measurements were recorded by using four digits weighing balance (HR-202i, Japan) with a measurement range between 0.001 and 220 g. PAC was mixed with the catalyst solution and the resultant mixture was placed inside the ultrasonic bath model (JAC 2010 P, Gyeonggi-Do, Korea) to ensure proper impregnation of metal catalysts onto the PAC substrate. The path is equipped with three levels of sonication, timer up to 99 min, and heater up to 90 °C. The drying of the PAC and CNMs samples was carried out in a drying oven (Model 600-Memmert, Büchenbach, Germany), where the maximum temperature can be set up to 220 °C. The CVD process was carried out in situ using an OTF-1200-80 mm dual-zone tube furnace for the CNMs growth. The tube furnace contains a fused quartz tube having the dimensions (OD: 80 mm; ID: 72 mm; length: 1000 mm). The heating area was covered with a resistance heating glass wool procured from Isolite Ceramic Fiber Sdn. Bhd., Johor, Malaysia.
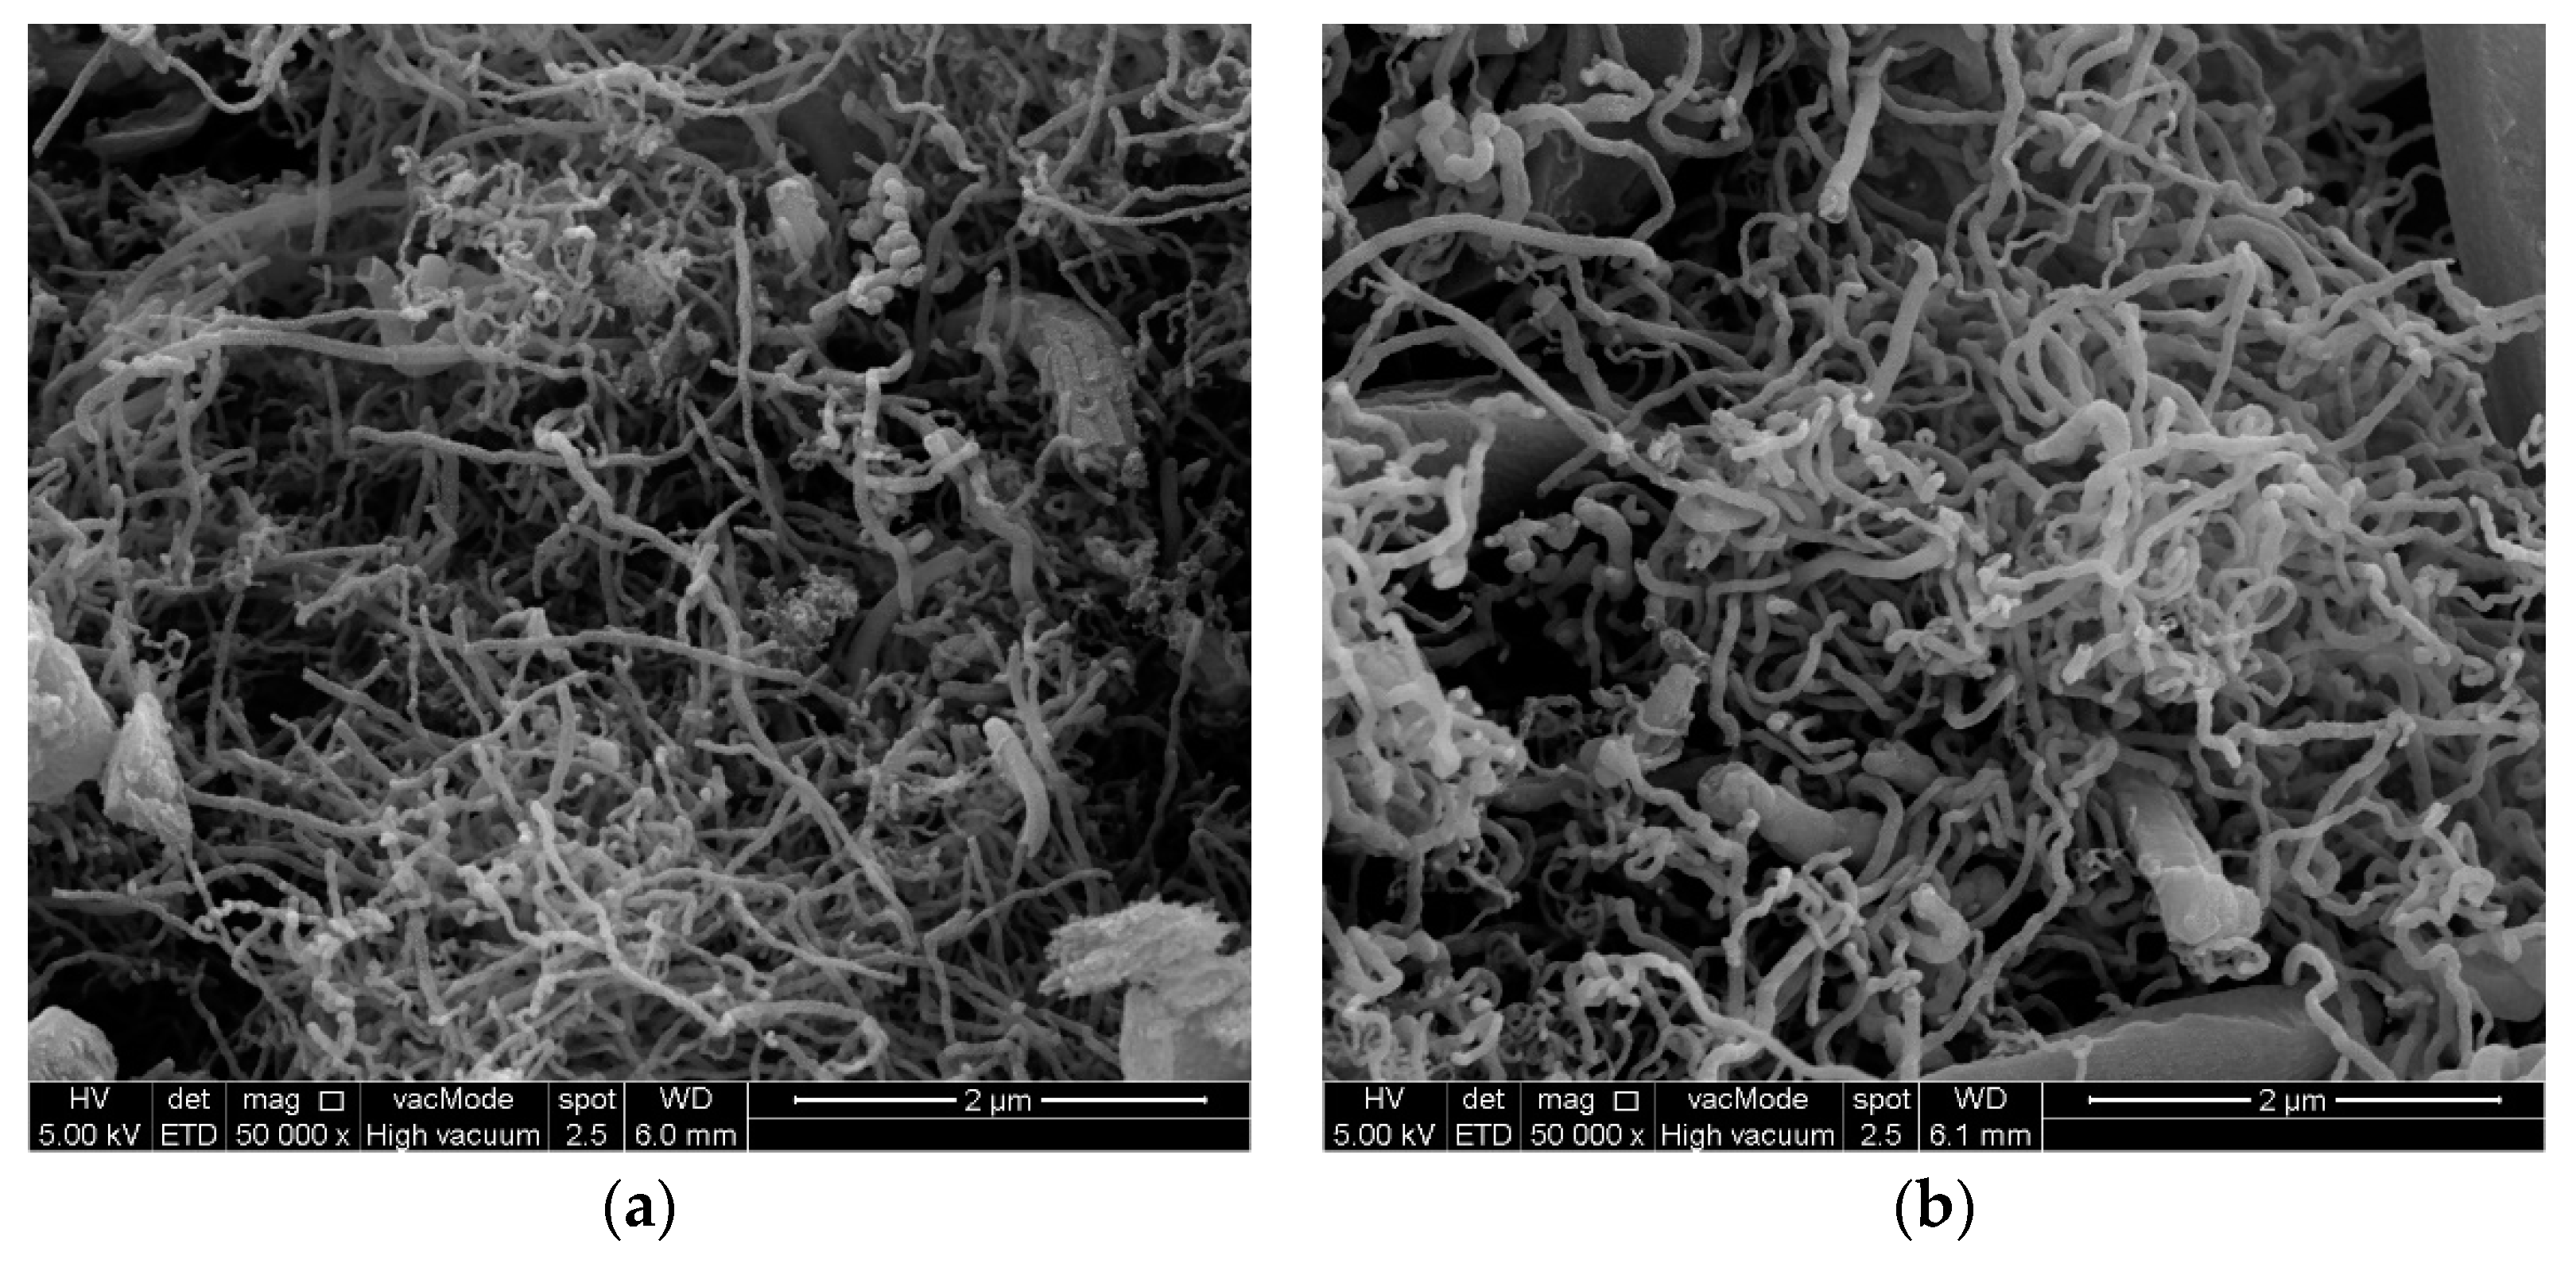
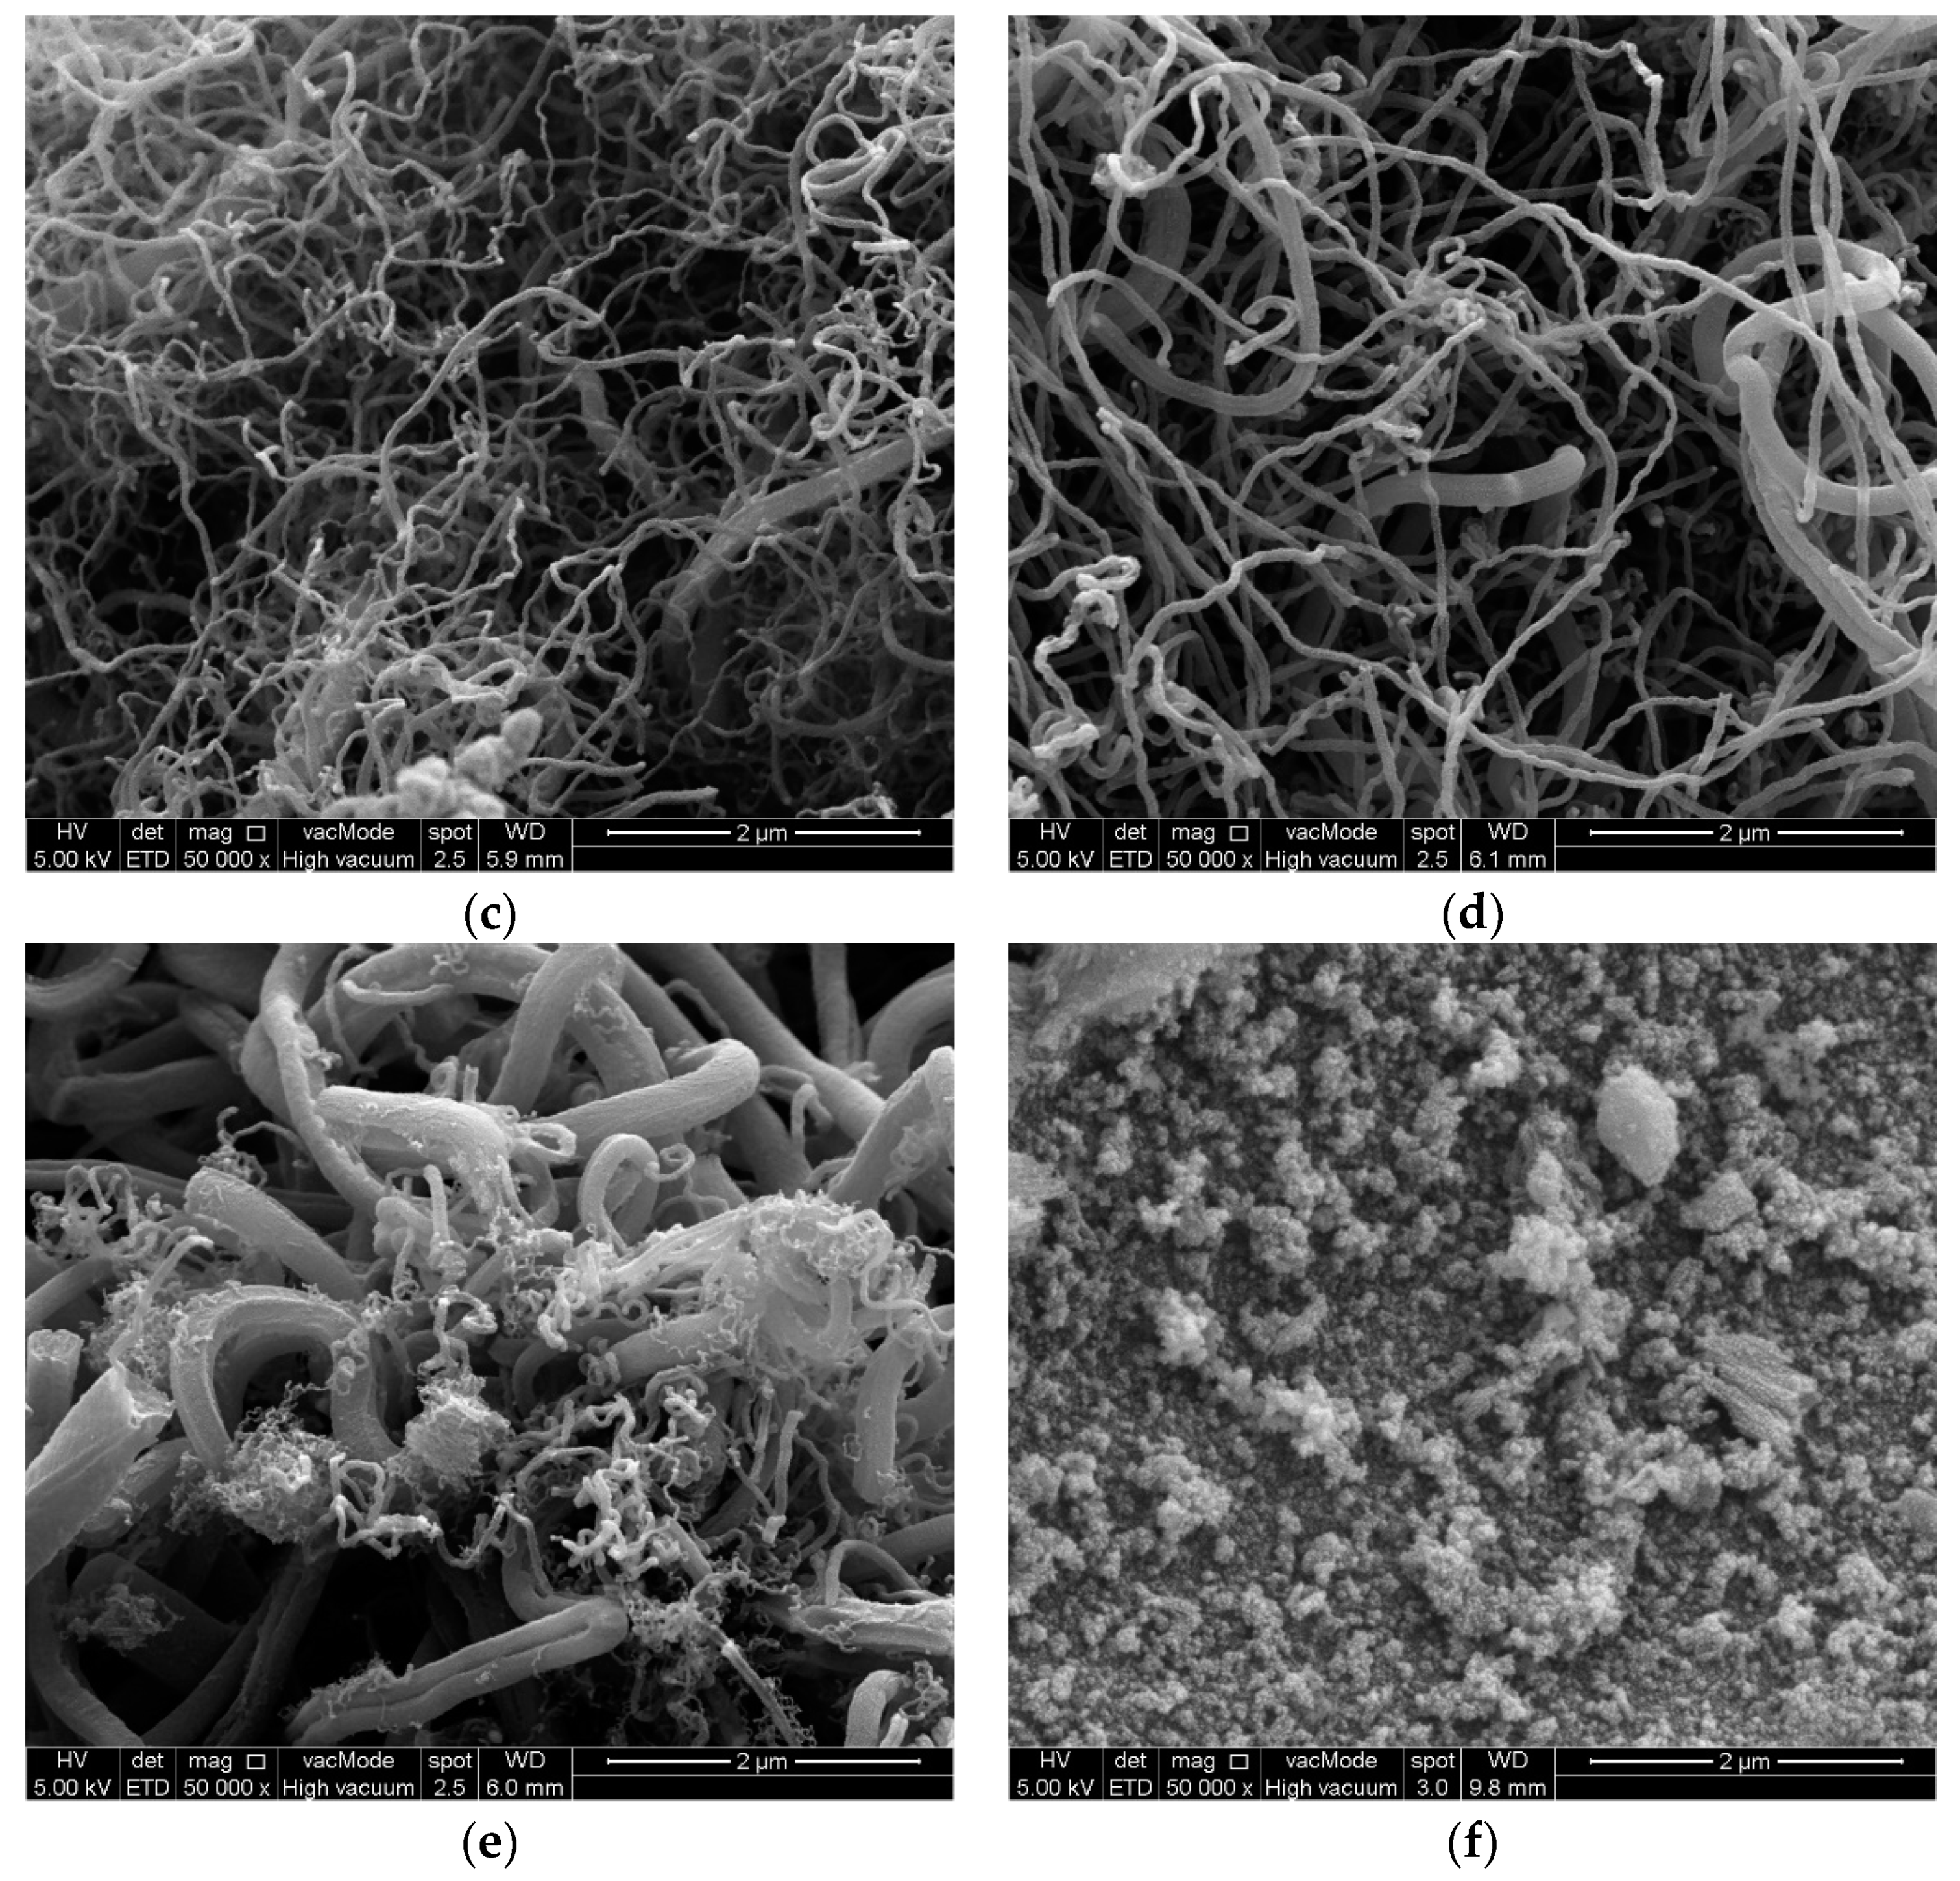
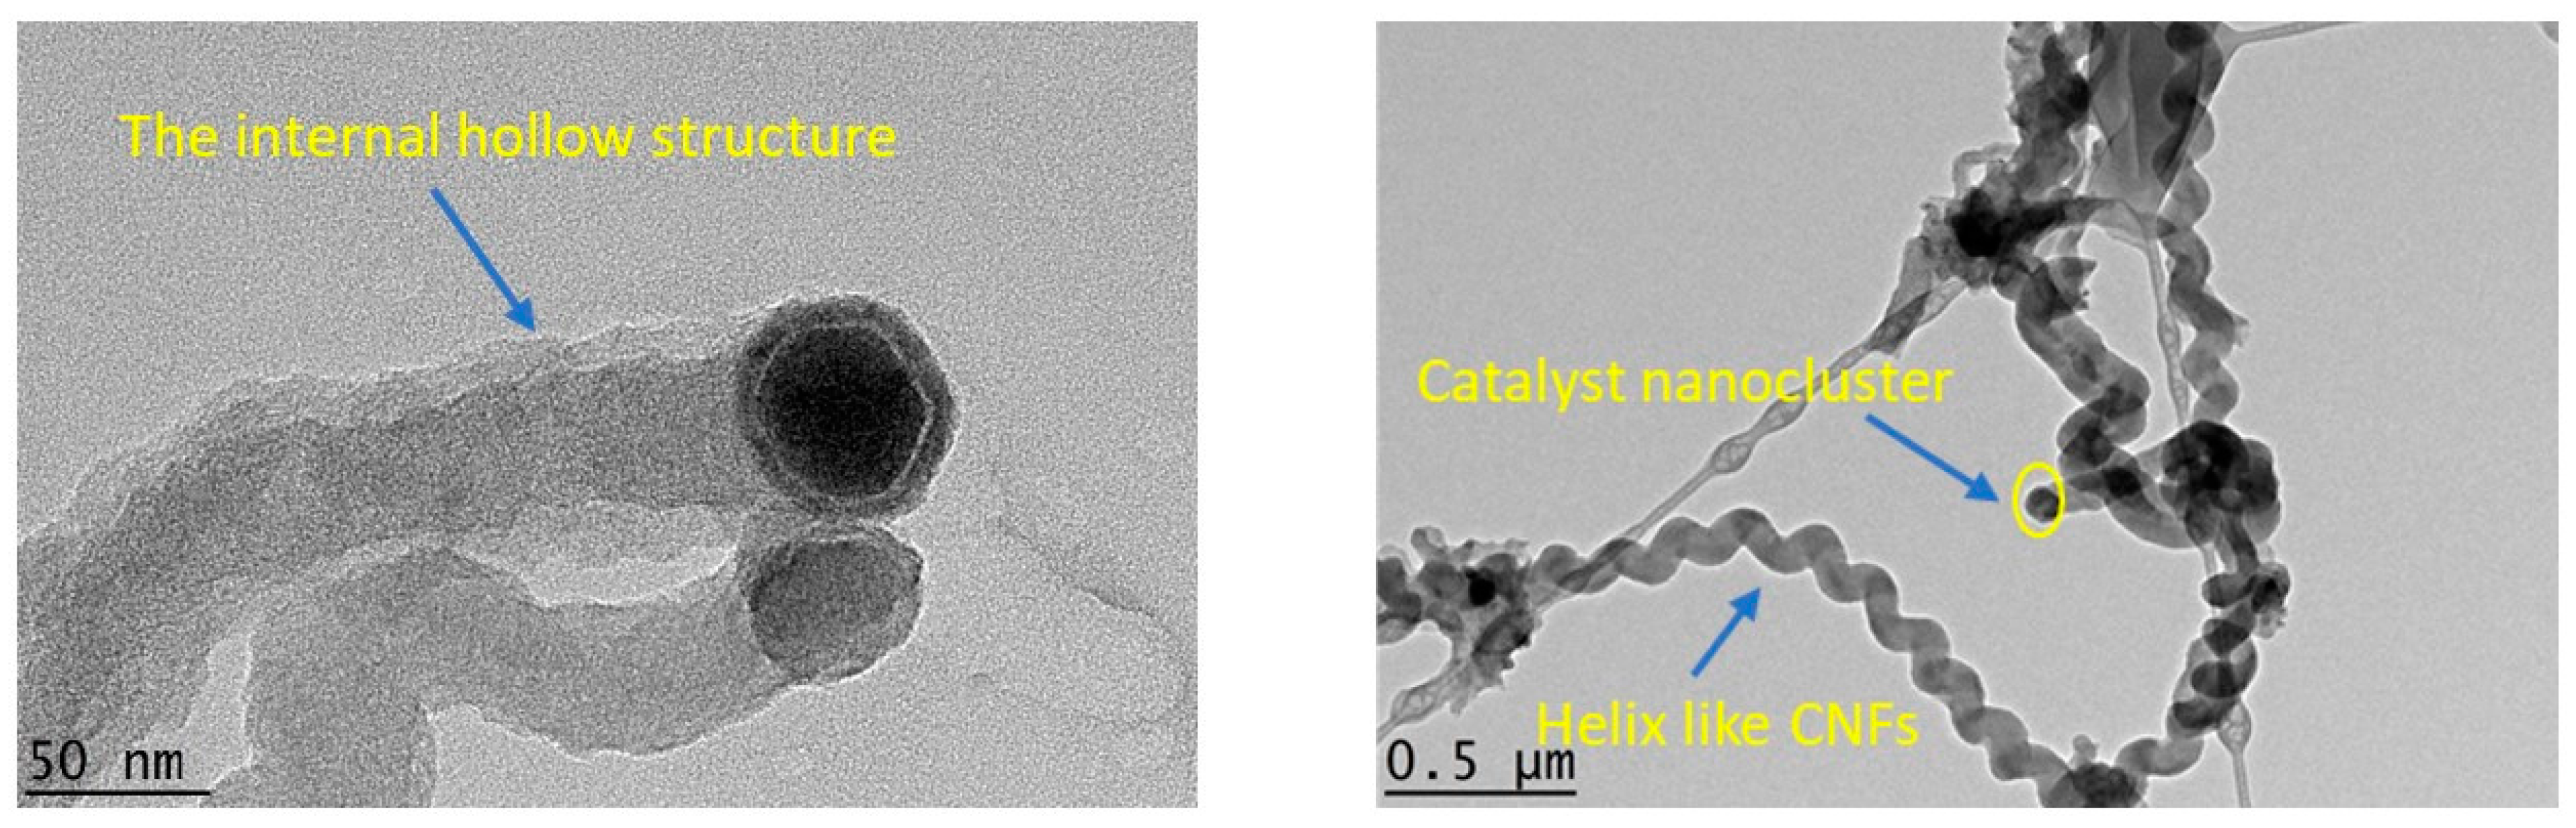
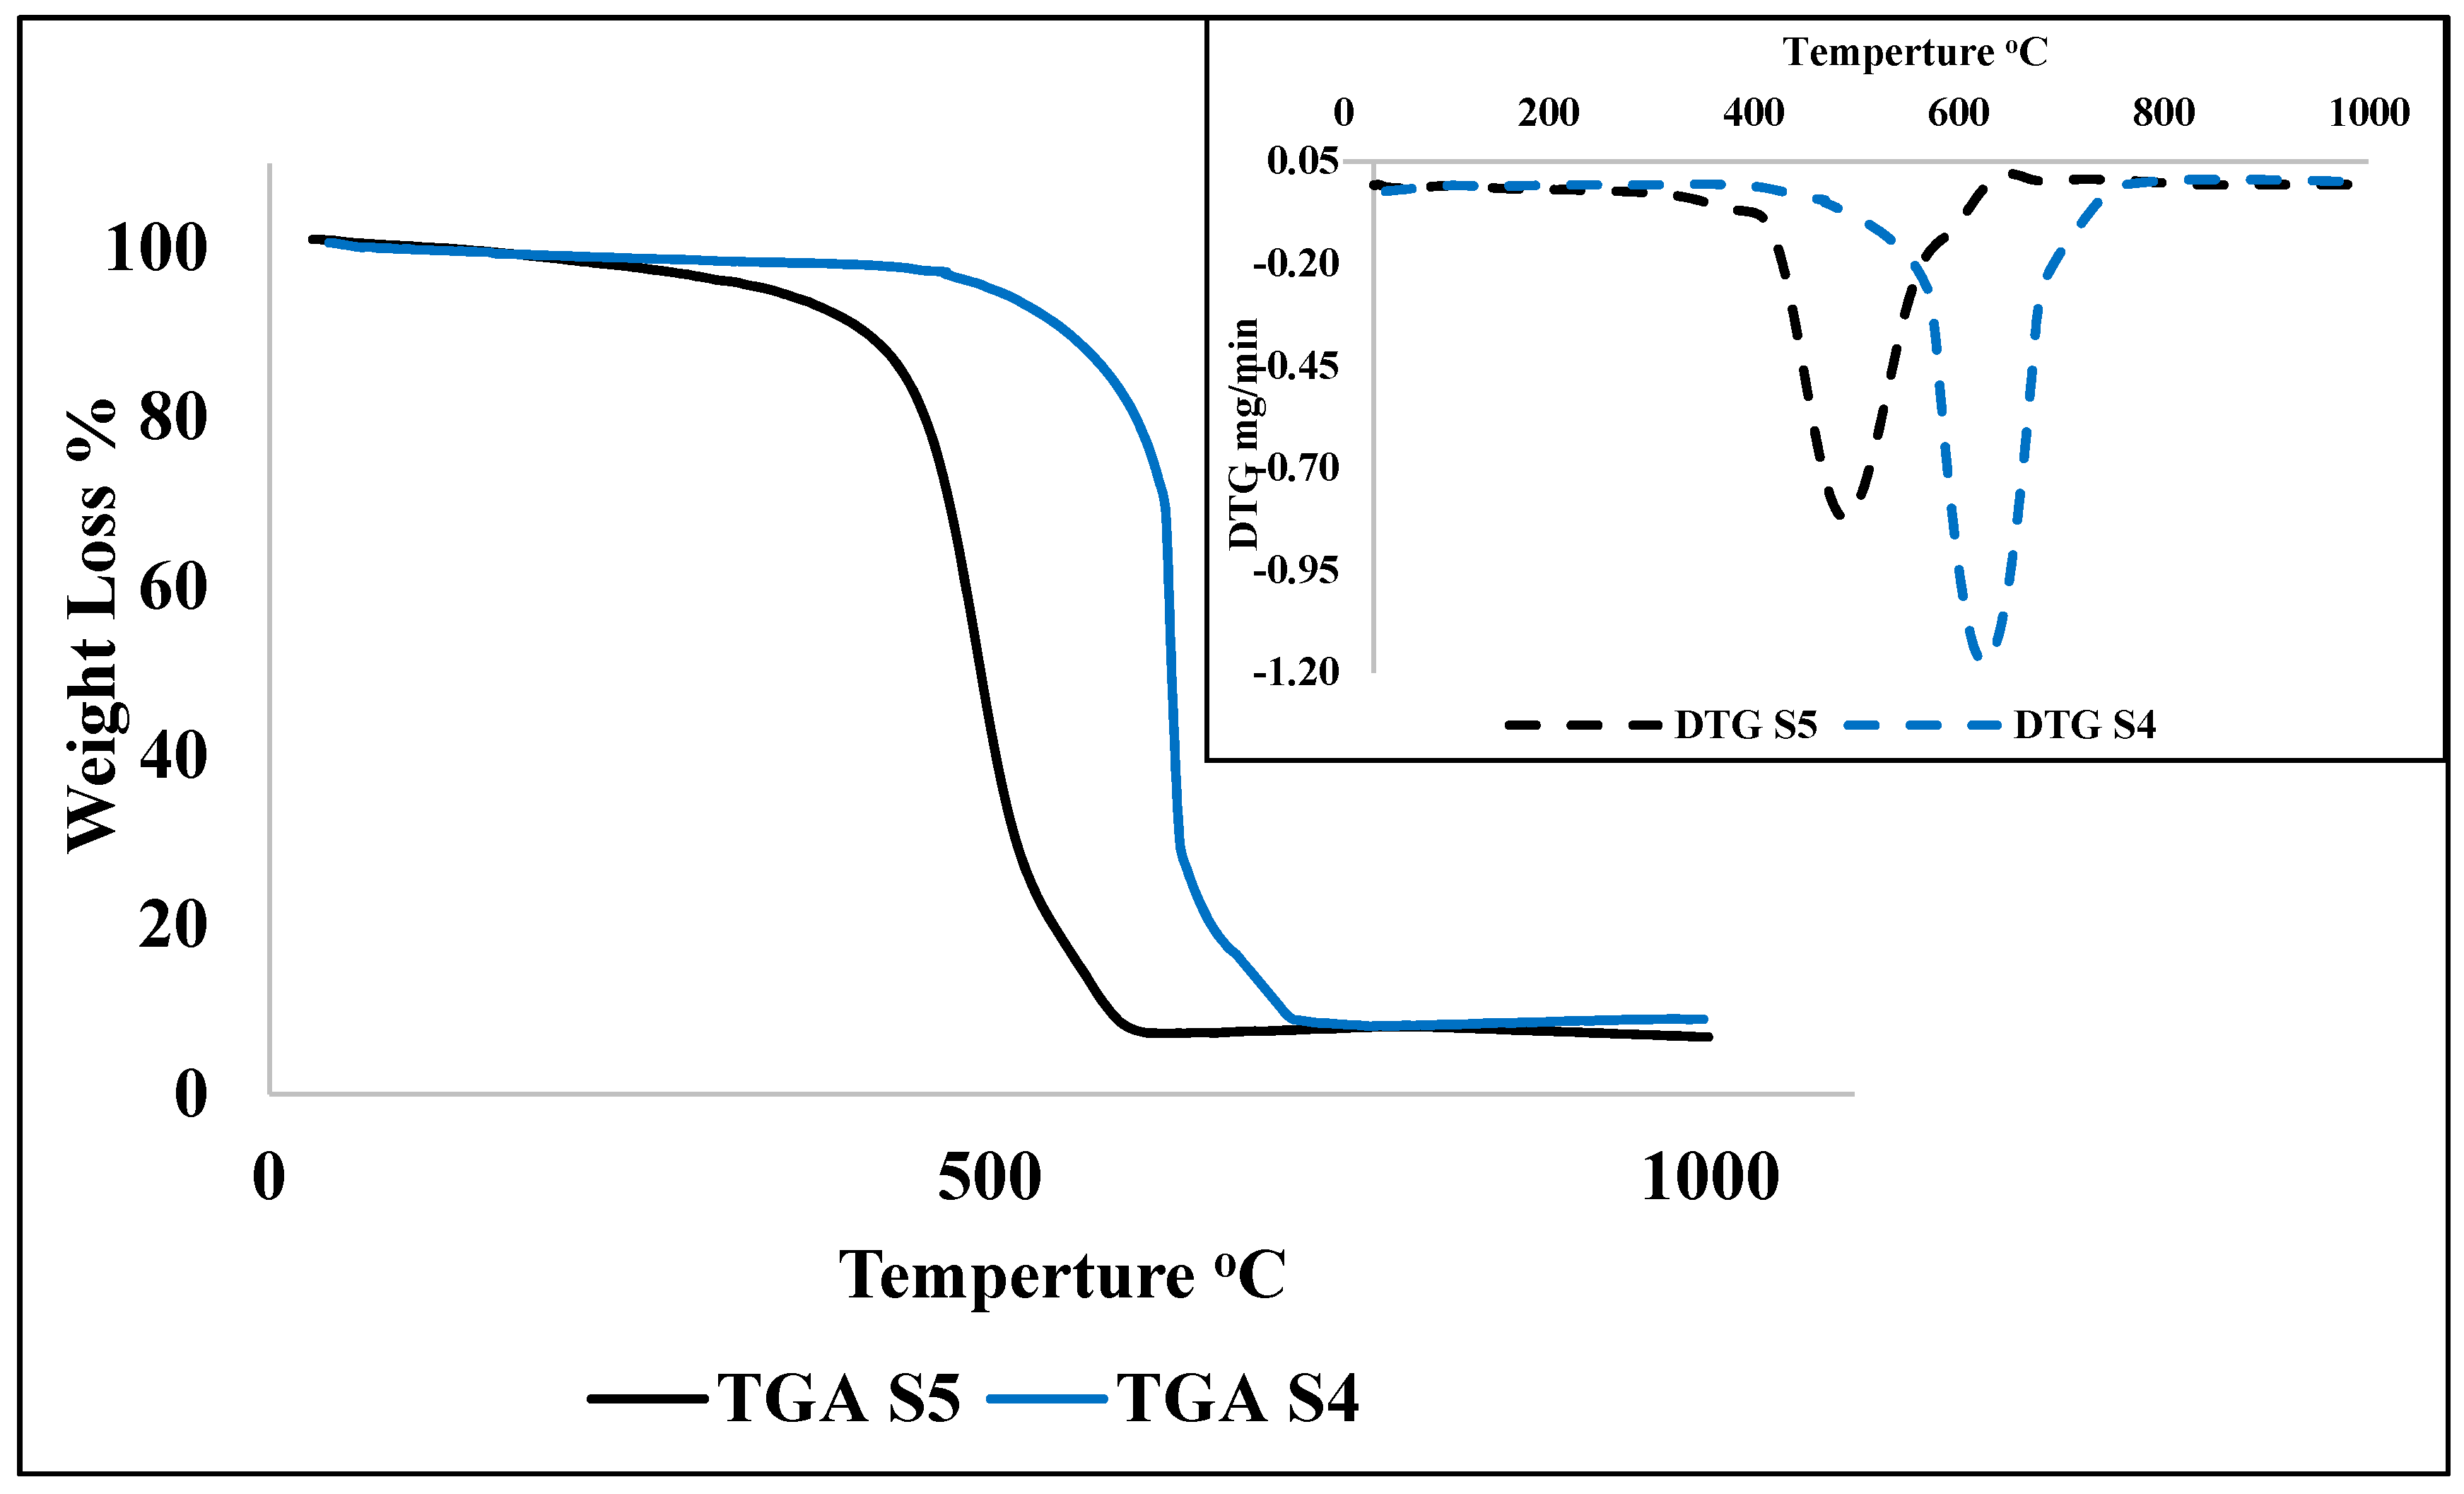
Characterization of the synthesized samples was carried out to classify the type and shape of nanomaterials. Field emission scanning electron microscopic analysis (FESEM-Hitachi-SU8000, Ibaraki, Japan) was used to observe the morphology of the prepared samples. The aluminum stubs were coated by a platinum layer by sputtering and the synthesized sample was placed over it for FESEM analysis. Transmission electron microscopy (TEM) observations were made with a Hitachi-HT7700, Ibaraki, Japan microscope at 120 kV. Synthesized samples were mixed with acetone and the mixture was ultrasonicated. After ultrasonication, a drop of the sample was deposited over the copper grid supported perforated carbon film. The average diameter and particle size distribution of the nanomaterials were calculated using ImageJ software 1.8.0_112. Contact angle (CA) measurement was carried out by KRUSS Goniometer (DSA100). A glass microscope slide (76 × 26 × 1.2 mm) covered with double-sided adhesive tape was used to measure the CA between the nanomaterials and water, wherein a water drop (4 μL) was placed onto the CNMs surface pasted on a tape. The average of triplicate measurements for each sample was taken. The oxidation behavior of the prepared nanomaterials was examined by thermal gravimetric analysis (STA-851, Mettler Toledo, Polaris Parkway Columbus, USA) at a temperature range of 25–800 °C, a heating rate of 10 °C/min, and an oxygen flow rate of 20 mL/min. The Raman spectra of the CNMs were obtained, where the laser power was kept constant at 100 using an Ar + laser (514 nm) and it was focused (50× objective) over the spot having a size of around 1.5–2.0 μm (Renishaw in Via, Sheffield, UK).

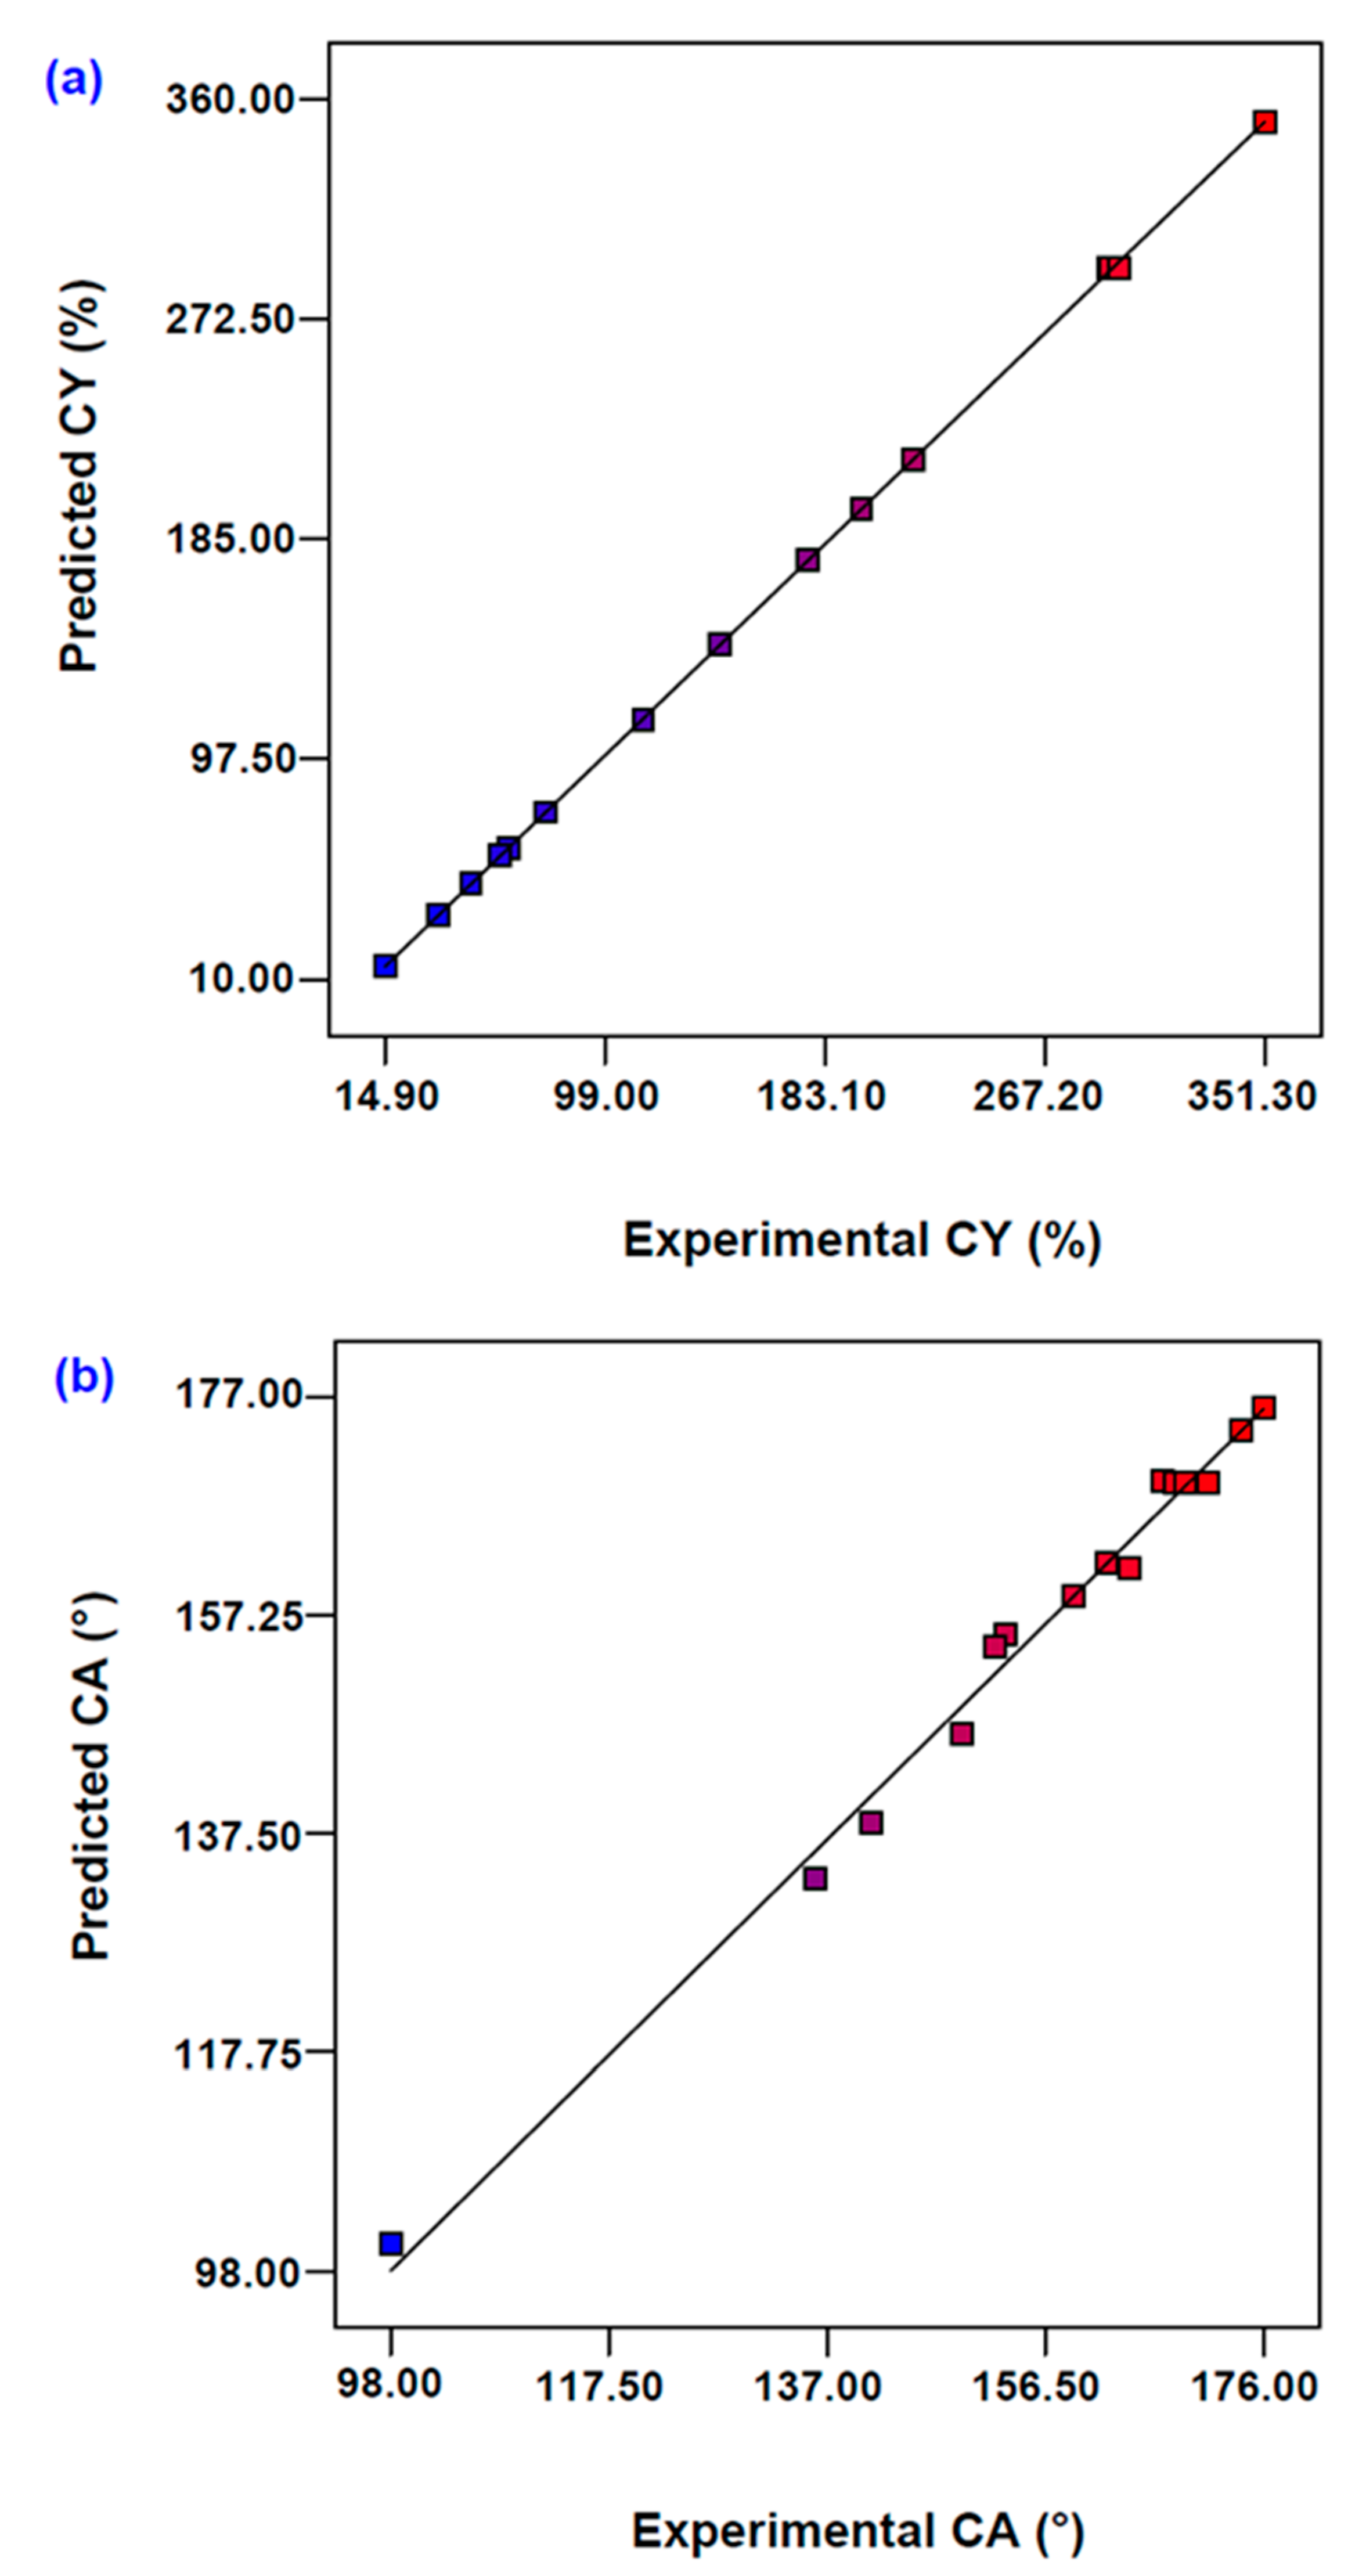
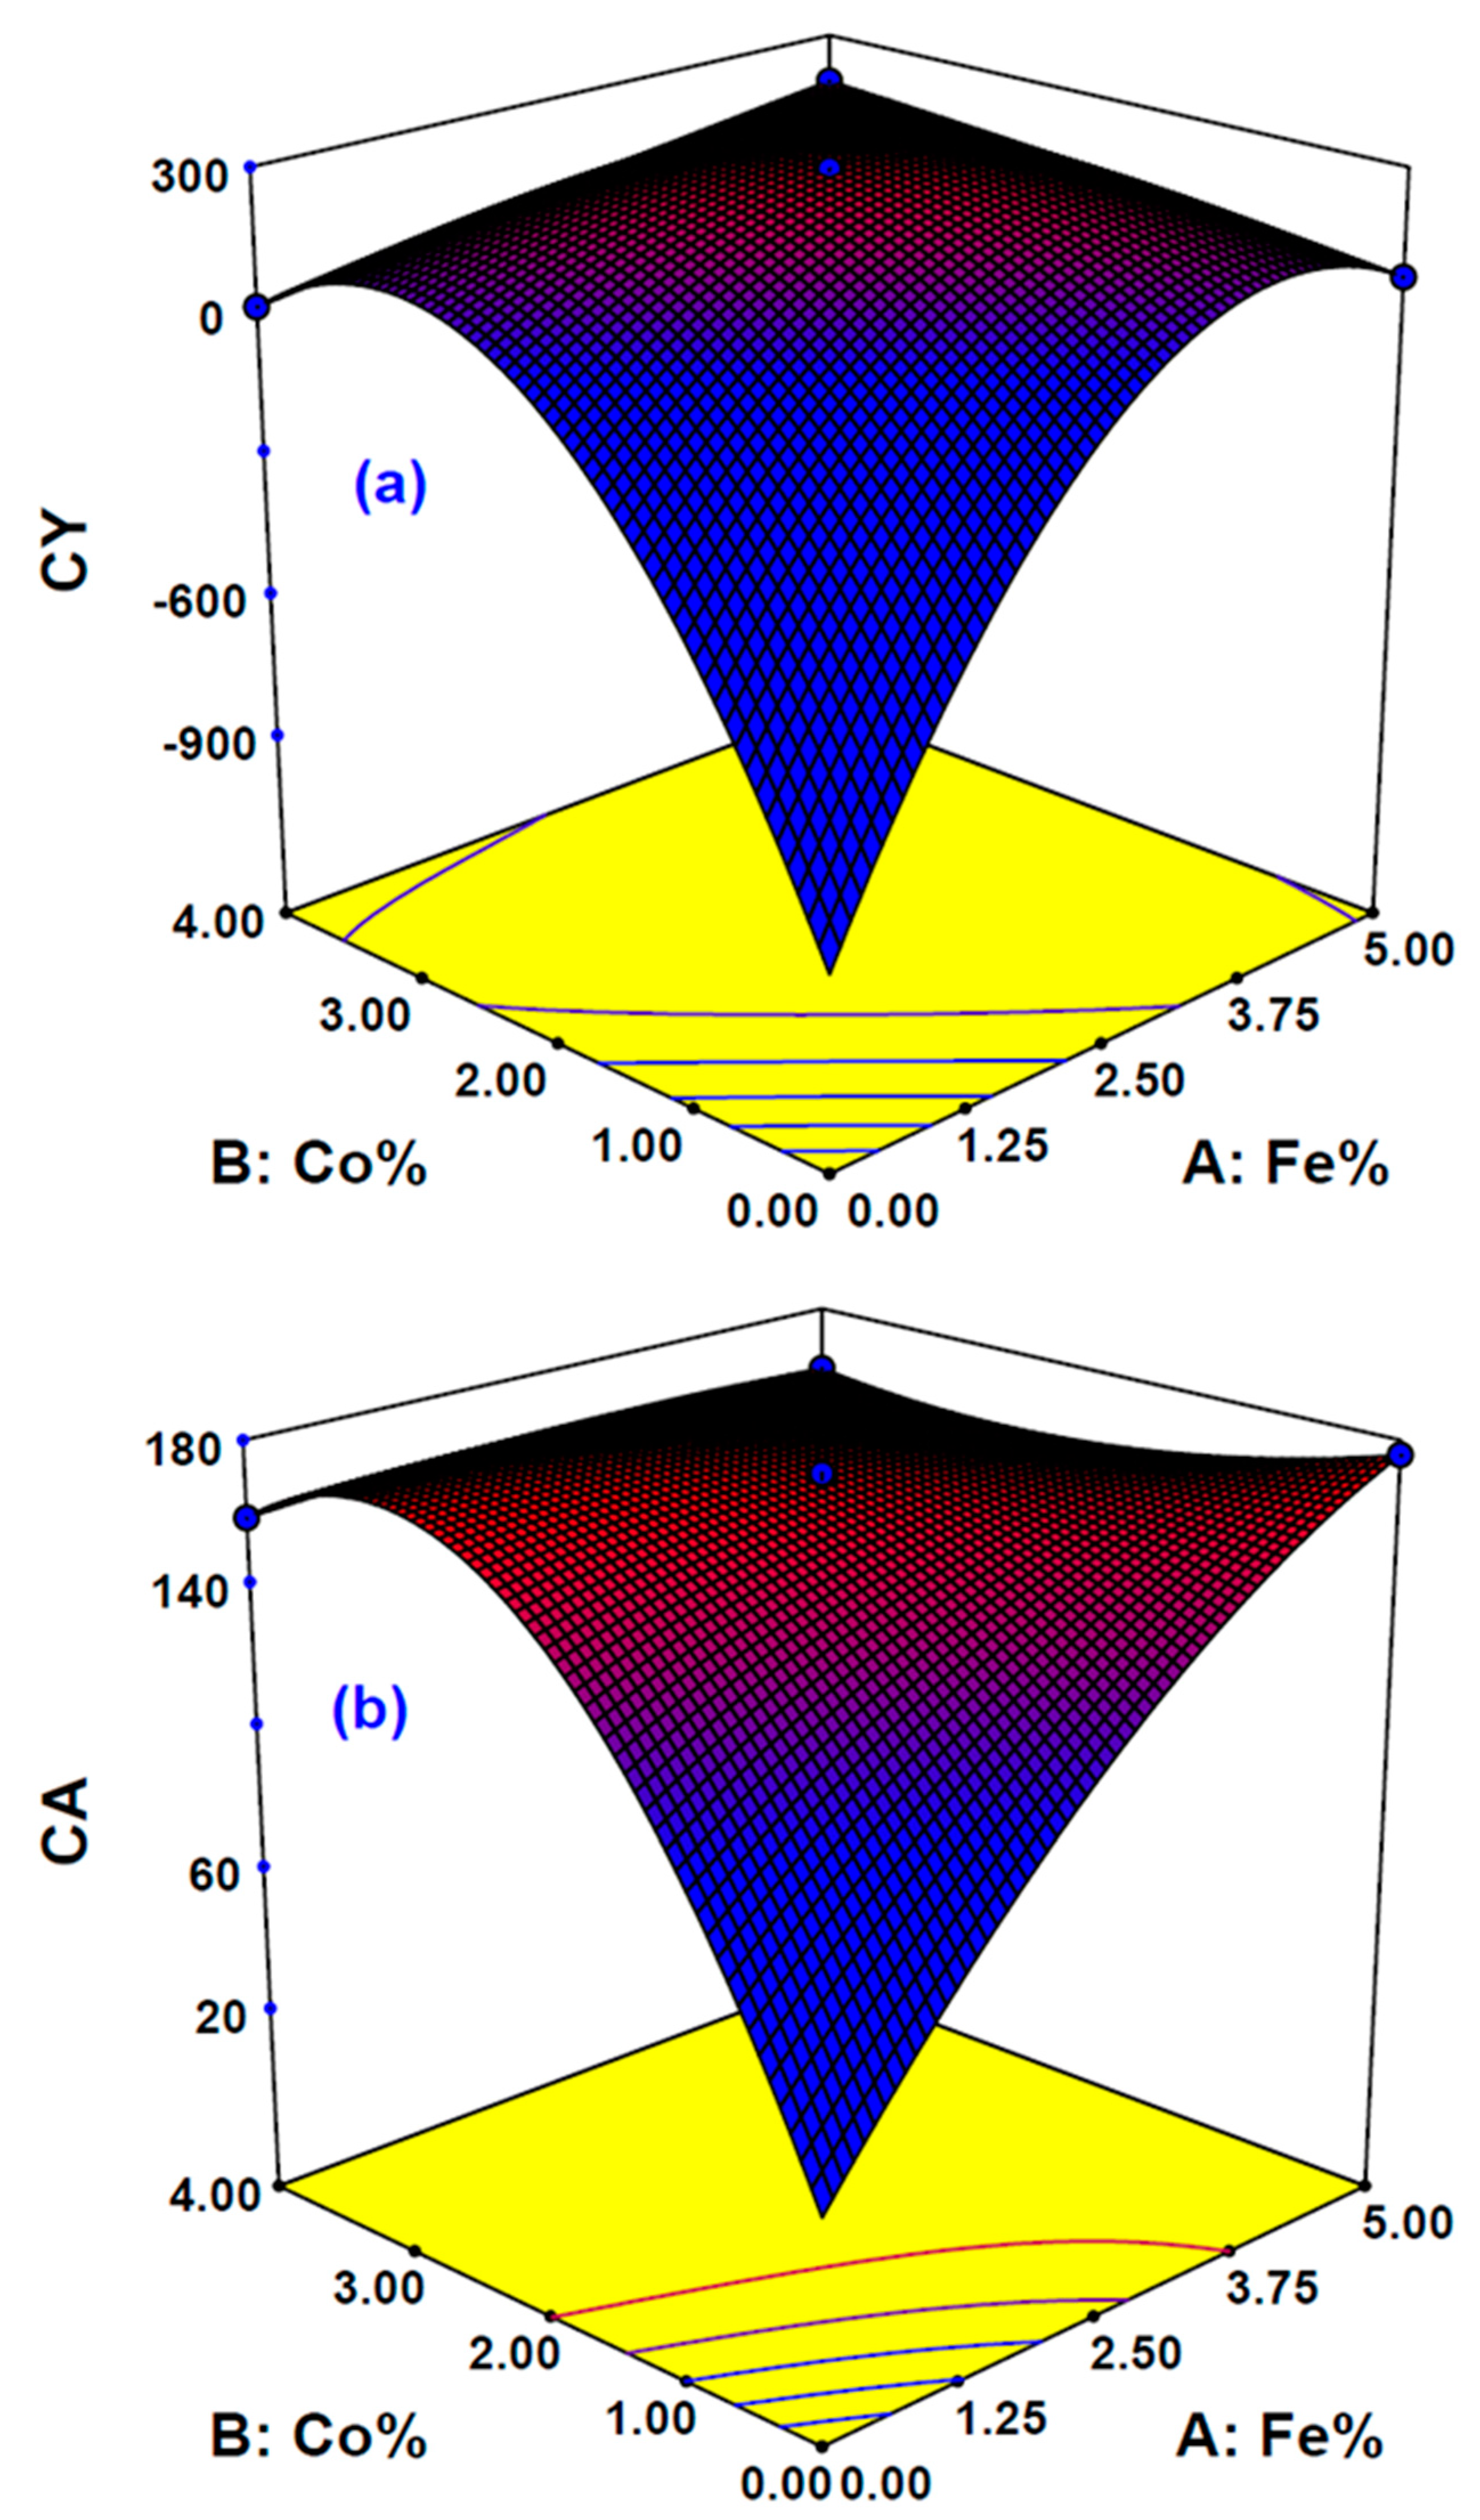
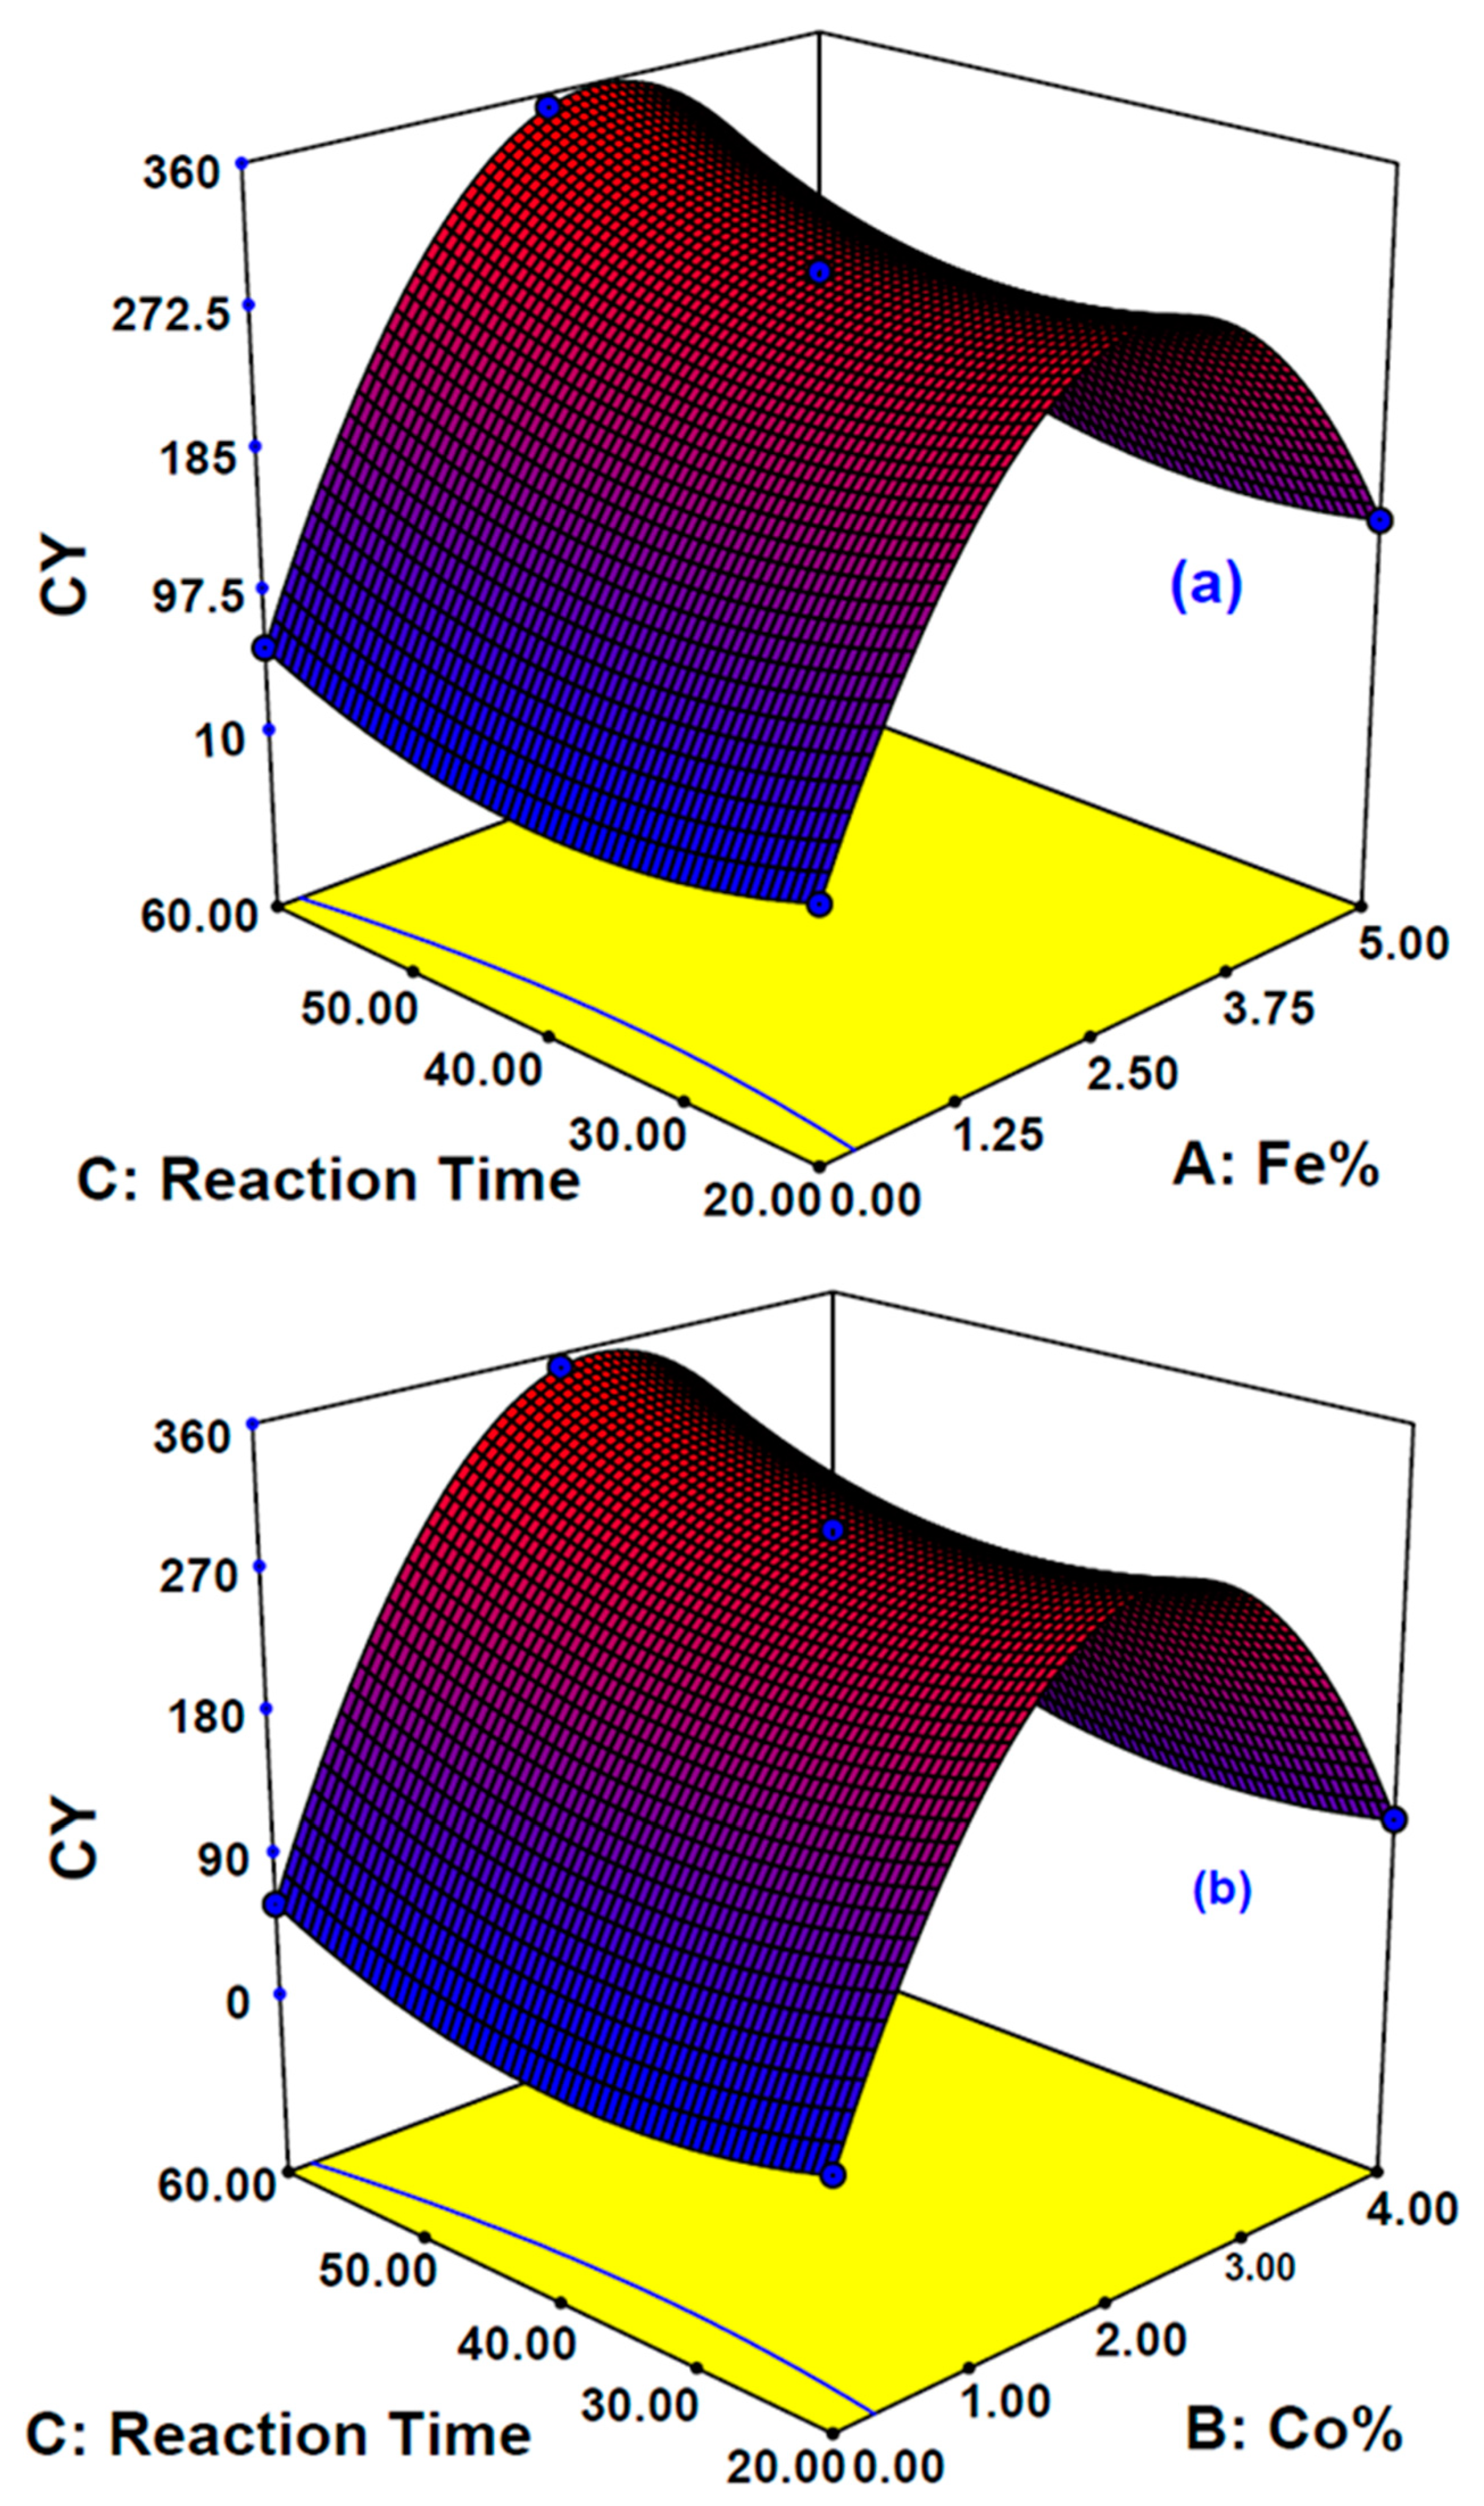
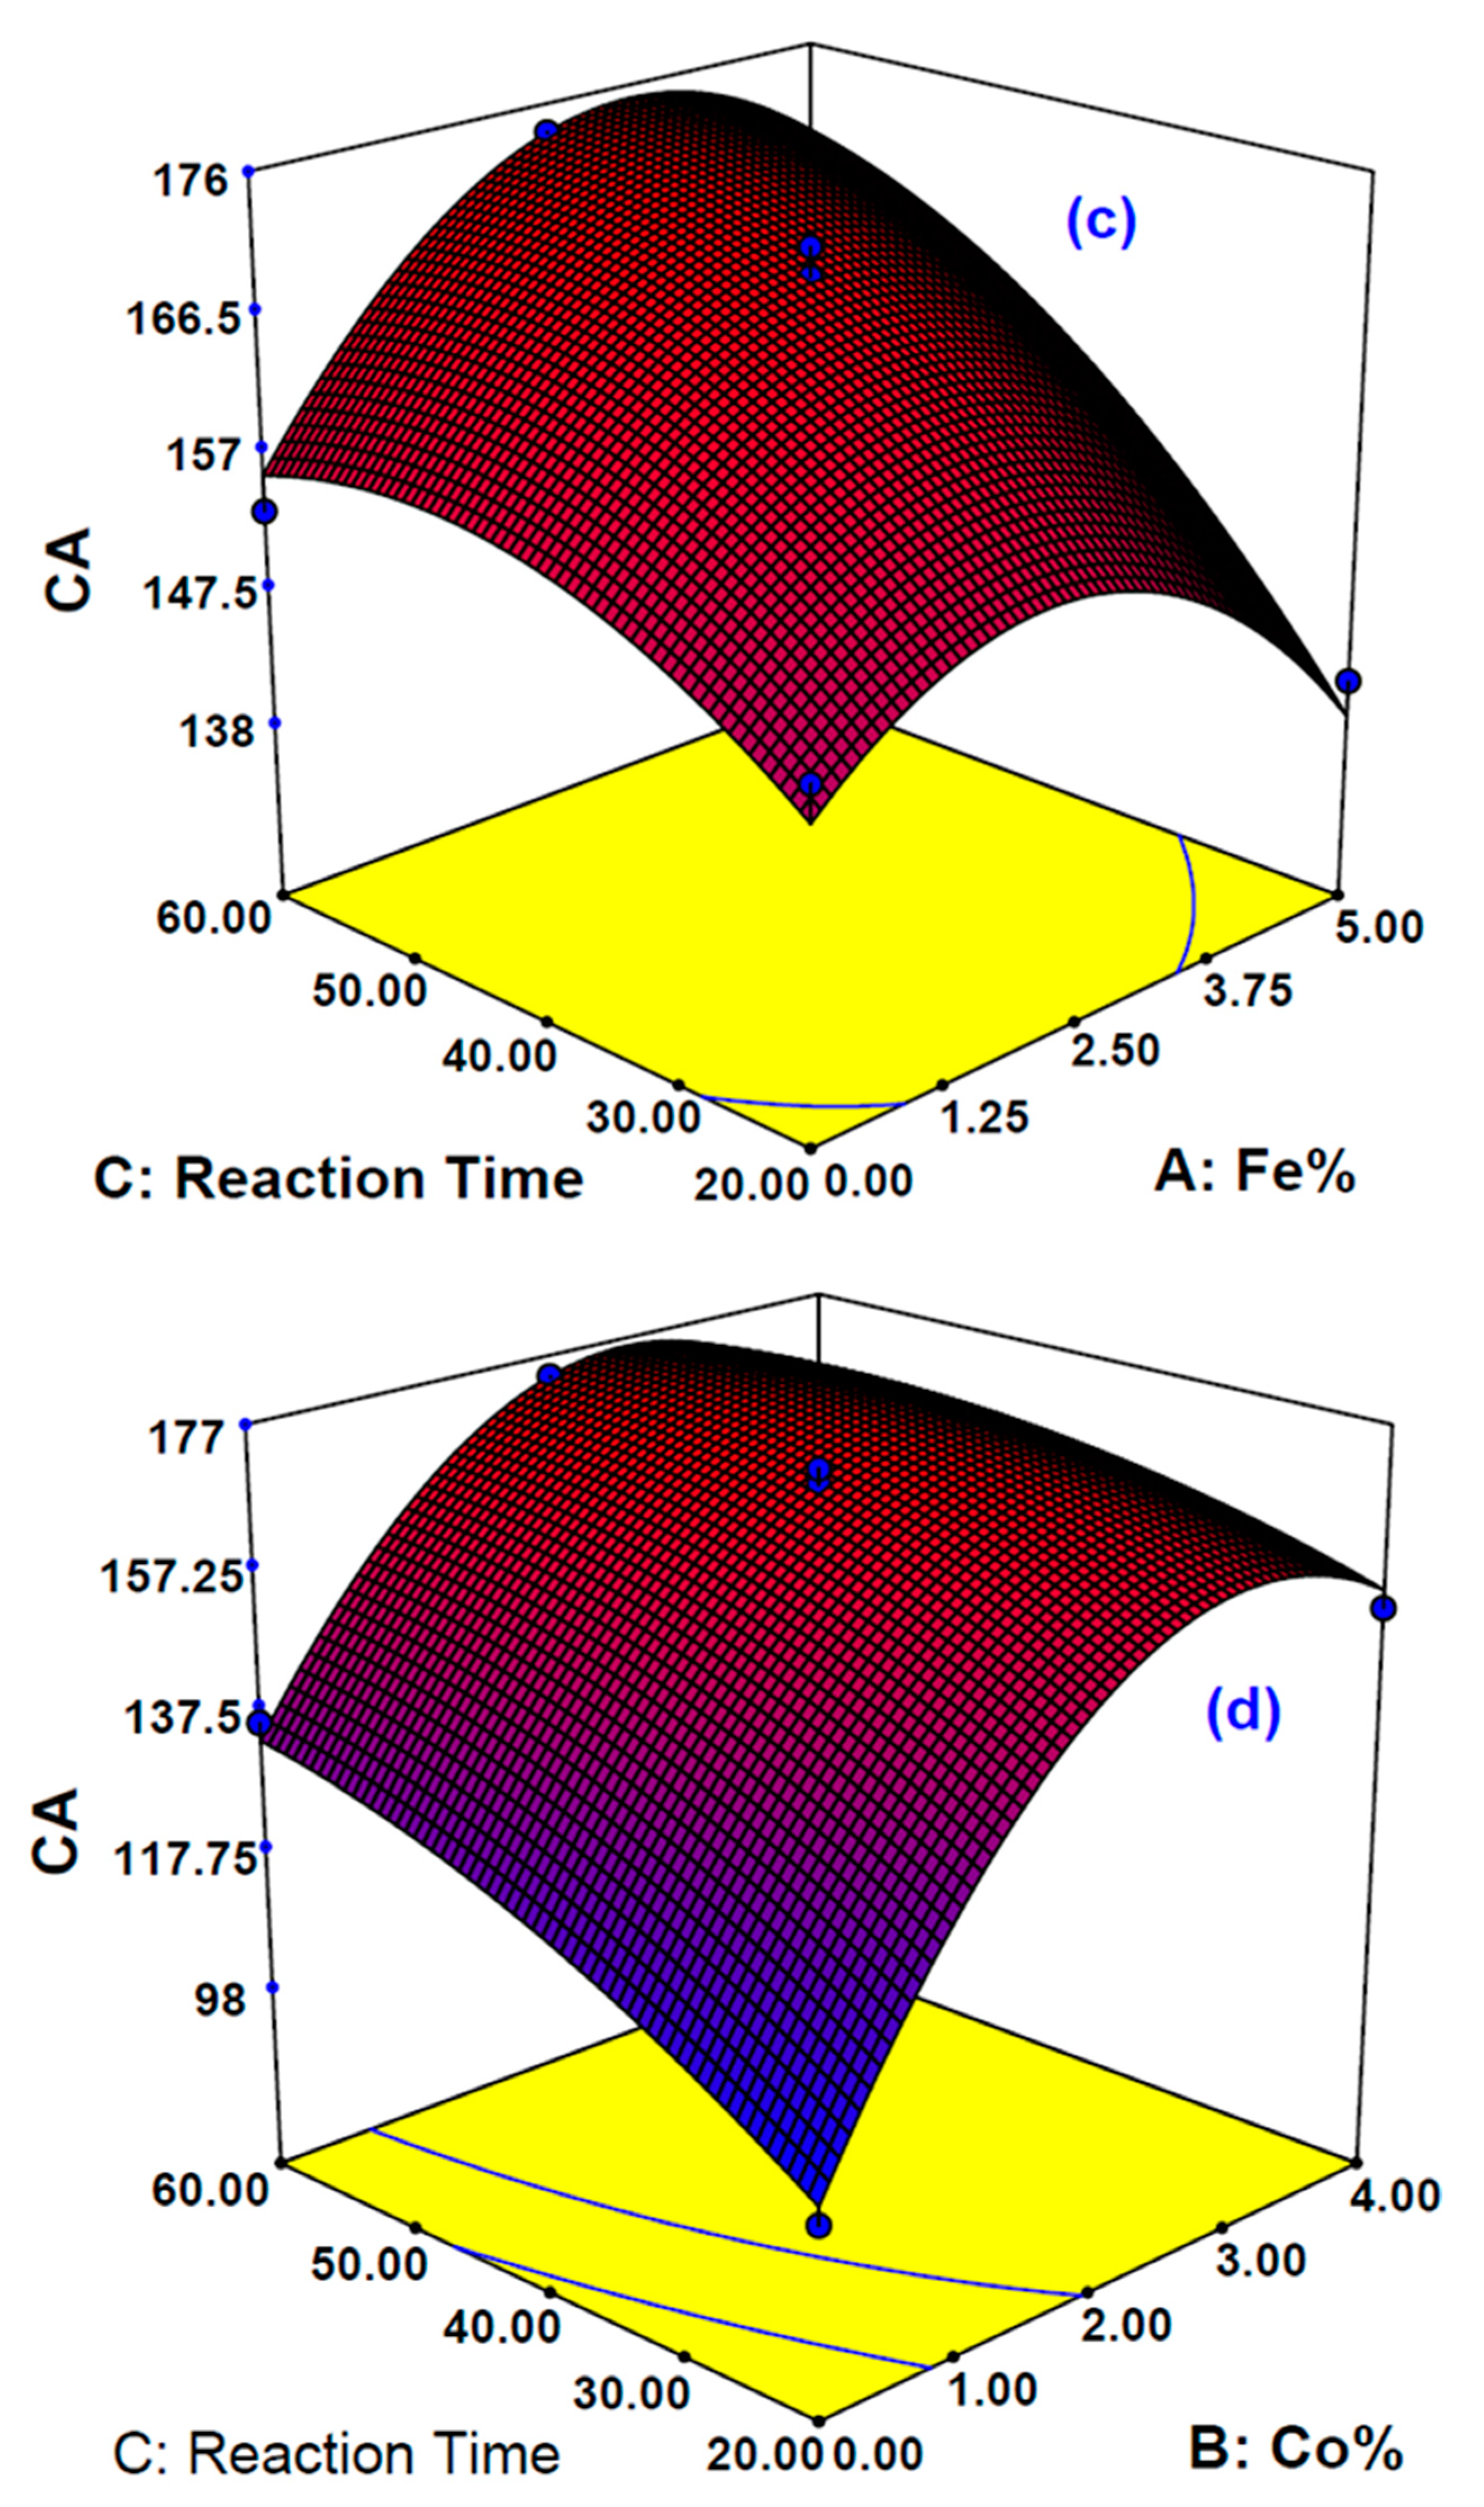
2.6. Response Surface Methodology and Process

The influence of three sovereign variables, Fe%, Co%, and reaction time on the two responses, carbon yield (CY) and contact angle (CA), were determined. Design-Expert V7.0 software was used and the Box-Behnken design (BBD) was employed by using the response surface methodology (RSM) approach. The influence of the main and combined variables on the desired responses chosen here was examined. A total of 17 experimental runs were proposed by DOE based on BBD with three center points. The independent variable ranges studied were Fe% (0–5%), Co% (0–4%), and reaction time (20–60 min), while gas ratios, temperature, and gas type were fixed at acetylene to hydrogen ratio of 1:4, 650 °C, acetylene gas, respectively. The complete design matrix conforming the actual experimental design and the responses are illustrated by Table 1. The accuracy of the developed models with data reproducibility was observed using the analysis of variance (ANOVA) test. The coefficient of determination (R2) values was calculated to observe the competency level of the proposed model.

3. Results and Discussion

CA was selected mainly as an objective function response for the modeling and optimization process to investigate the effects of synthesis conditions (catalysts compositions and reaction time). This technique is unusual in such kinds of reactions where other researchers usually focus on the yield or the geometry of the nanoproducts, which has also been covered in the current work. In a previous study reported by our research group, an optimum Fe catalyst percentage weight of 5% was found to give a high CY when Fe was impregnated as a mono-catalyst on PAC [24].

3.1. Modeling and Statistical Analysis

After conducting the 17 experimental runs, the responses (CY and CA) (as shown in Table 1) were fitted to different statistical models. The models, including mean, linear, two-factor interaction (2FI), quadratic, and cubic polynomial models, are presented in Table 2 and Table 3, respectively. It was evident that R2 of the quadratic model, as well as its smallest F-value showed the closest correlation and the model was significant for CY and CA analyses as compared to that of the other models, as its p-value probability, Prob > F, was estimated to be less than 0.05. Thus, the quadratic model was chosen.
Table 4 illustrates the ANOVA results obtained for CY% responses. As noticed from Table 4, the main effects on CY namely, Fe% (A), Co%(B), the reaction duration or time(C), the combined effect of Fe% and Co% (AB), the combined effect of Fe% and reaction time (AC), the combined effect of Co% and reaction time (BC), the quadratic effects of Fe% (A2), the quadratic effects of Co% (B2), and the quadratic effects of the reaction time (C2), the interaction of the quadratic effects of the amount of Fe% and the amount of Co% (A2B), and the interaction of the quadratic effects of the amount of Co% and the amount of Fe% (B2A), were significant, as their Prob > F values were less than 0.05. Therefore, we can infer that the A, B, C, AB, AC, BC, A2, B2, C2, A2B, and B2A were the main determinants for CY. The polynomial equation for yield is given by Equation (2).
Y1 = +293.82 + 62.45 A + 48.90 B + 21.82 C – 196.98 AB + 14.75 AC + 9.85 BC − 211.88 A2 − 233.27 B2 + 35.66 C2 + 208.43 A2B + 225.63 AB2
Figure 1a depicts a simulation model as an assessment pictorial representation between model values of CY predicted from the above Equation (2) and the experimental results. This figure demonstrates an excellent consolidation between the predicted and experimental values of CY.
The ANOVA results obtained for contact angles (CA) are illustrated in Table 5. It was observed that the major effects on CA, namely A, B, C, AB, AC, BC, A2, B2, C2, A2B, and B2A, were significant as their Prob > F values were less than 0.05. Thus, these effects were selected as the CA polynomial model parameters as given by Equation (3).
Y2 = +169.80 + 1.50 A + 20.50 B + 10.00 C − 33.70 AB + 5.50 AC − 6.50 BC − 10.50 A2 − 25.50 B2 − 6.80 C2 + 6.20 A2B + 33.70 AB2
Figure 1b shows a simulation model as an assessment pictorial representation between model values of CA predicted from the above Equation (3) and the experimental results, which demonstrates a good correspondence between the predicted and experimental values of CA.

3.2. Effect of Catalysts Composition on CNMs Yield and Contact Angle

The effect of catalysts loading on CNT yield and hydrophobicity was investigated. 3D-surface contour plots with surface mesh were plotted to observe the cumulative effects of the process parameters on CY and CA using Figure 2a,b, respectively. Figure 2 shows the effects of the catalyst loading on CY and CA at constant reaction time (40 min). Five percent loading of Fe as a single catalyst was reported in previous work to produce an optimum yield of CNMs with a minimum average diameter [42]. Using the same Fe loading in the reported work gave a CY of 76.38% which is in agreement with the previously mentioned published work [42]. However, in the current study, it was found that combining 2% of Co with 2.5% of Fe catalysts gave higher CY of CNMs. This was observed in sample S4 which recorded the best CY of 351.3%. Catalyst loading higher than 2% of Co gave less CY, and this is attributed to the possible agglomeration of Co metal rather than the small amount of Co which increased the chance of the growth of CNMs, while further increase in Co led to decreasing in CY.
Table 1 shows that the CY values do not follow any definite trend with the change of weight ratio of the catalyst. The two catalysts demonstrated distinct activities and tendencies with varying reaction conditions. The magnitude of CY depends on certain factors including particle size and capability of the catalyst to decompose C2H2, the solubility of carbon, rate of diffusion of carbon, the chemistry of the catalyst, and also on the consistent distribution of the metallic particles over the PAC surface [43,44]. Combination of Fe and Co as a bimetallic catalyst resulting in reducing the melting point of Fe–Co to much lower values compared to the particular melting points of Fe and Co alone [45]. In other words, this combination of metals could form an alloy with eutectic behavior. This is the reason for which the CY of Fe–Co bimetallic catalysts is much higher than the CY of the metal catalysts individually. The addition of Co to Fe catalyst plays an important role as it can increase the initial conversion of C2H2 and restrain the fast catalyst deactivation. In addition, the formation of Fe–Co eutectic mixture, results in a reduction of melting point which affects the absorption of Fe on the surface of Co which consequently affects the shape of the catalyst, leading to the variation of the CNMs shape.
The hydrophobicity of the prepared CNM samples is expressed in terms of CA and presented in Table 1 and Figure 3. PAC is known to be a hydrophilic material, as PAC cast film shows a CA of 65°, but the presence of CNMs which grew using 5% Fe as a catalyst shows an apparent CA of 176°. By using Fe–Co as a bimetallic catalyst, the CA value started to increase following similar trends of CY, and for the best CY, the apparent CA is 173° (Figure 3b). This suggests that the formation of more CNMs is the main reason for the high hydrophobicity. The main two factors affecting the surface wettability of CNMs are the surface roughness and surface chemistry [46,47]. The CNMs growth imparts a rougher surface area and reduces the gaps available for the droplets of water. Meanwhile, the higher CNMs growth leads to denser unfunctionalized stable carbon atoms which have a minimum affinity to attract water molecules.

3.3. Effect of Reaction Time on Yield and Contact Angle

The impact of the time duration for the CVD process on CY and CA was examined. The cumulative effects of the reaction time and catalyst composition on CY and CA were explicitly illustrated by 3D mesh diagrams. These diagrams were plotted based on the empirical model developed earlier, and are shown for CY (in Figure 4a,c) and for CA (in Figure 4b,d). Figure 4a,c show the response surface plots for the effects of the reaction time at a fixed 2% of Co on: (a) CY and (c) CA, and at fixed 2.5% of Fe% on: (b) CY and (d) CA. There was a significant increment in CY with increasing reaction time, from 20 to 40 min and then to 60 min, as shown in Figure 4a,c. The reaction time is the dominating parameter for CY and the highest CY was obtained at a reaction time of 60 min. The increased CY with increasing the reaction time can be considered as an indication for the catalyst stability which remains constantly active in performing mixed with that catalyst-solvent mixture C2H2 decomposition. Eventually, the constant activity of the catalysts and high carbon moieties diffusion on the PAC resulted in more accumulative CNMs production. This reveals the general understanding of the interaction between the most effective parameters in the process, namely catalysts composition and reaction time. The constant catalysts activity which resulted in constant increasing of CNMs production can open a window for contentious CNMs mass production.
The effects of the reaction time on CA at a fixed amount Fe% (2.5%) and Co% (2%) are shown in Figure 4b and Figure 4d, respectively. There was a noteworthy enhancement of CA with enhancing reaction time, starting from 20 to 60 min, as reflected by both plots. Although CA increases with increasing reaction time, CA has a limitation of 180° maximum. As such it is not expected to have a CA beyond the maximum limit even though the reaction time is increased.

3.4. Optimization of Chemical Vapor Deposition (CVD) Process

After obtaining the significant empirical statistical model, it is possible to optimize the conditions which enable designing the desired combination of all factors. From the DoE software, a numerical optimization algorithm was selected and used to optimize the unconstrained variables and desired responses. All the factors and responses corresponding to the upper and lower limits of the experimental range had to satisfy the optimization criteria which defines the desired limitations and constraints. In this study, C2H2 decomposition into CNMs was maximized to obtain the CY and CA values with the importance of five out of five, while the other parameters were kept in the chosen experimental range. Some sets of predicted solutions were obtained as potential optimization conditions, which were additionally classified by desirability as listed in Table 6. The highest desirability for the optimum process conditions solution was 2.73% of Fe, 2.42% of Co, and 60 min reaction time, which predicted to give CY of 351.30% and CA of 175.88°. For experimental verification, an experiment was conducted at the suggested optimized conditions. These results show that the experimental values were CY of 349.54% and CA of 173°, which are consistent with the model predicted values.

3.5. Surface Morphology Analysis

The morphological features of the synthesized samples were analyzed using FESEM technique. Figure 5a–f showed the images of the prepared CNMs for six selected samples (S1, S4–S6, S10, and S11, respectively) with 50,000× magnification. Figure 5c displayed the FESM image of S5 which was found to have the highest CY and CA by using 5% of Fe as a mono-catalyst and reaction time of 40 min. Two types of carbon nanomaterials were found in this sample as carbon nanofibers (CNFs) and multiwall carbon nanotubes (MWCNTs). Figure 5f displayed the FESEM image of S11 which was prepared by using 4% of Co as a mono-catalyst and reaction time of 40 min. It was found that using a high amount of Co only as a catalyst gave very poor CY which indicates very poor growth of CNMs. Figure 5e displays the FESEM image of S10 which was prepared by using 5% of Fe and 4% of Co as bimetallic catalysts and reaction time 40 min. This image revealed that using a high amount of Co and Fe produced mainly aggregated CNMs and CNFs, as such experiment conditions are not preferred. Figure 5a,b, and d displayed the FESM image of S1, S4, and S6, respectively. These images show three different types of CNMs as helix-like CNFs, CNFs, and MWCNTs. It was noticed that increment of reaction time did not alter the shape of the CNMs and it affected only the CY of the CNMs.
Figure 6 shows the TEM images of S4. The images revealed the MWCNTs internal structure and helix-like CNFs as well as CNFs, which were attached over the surface of amorphous PAC. The internal cavity or hollow places represent the development of MWCNTs, while the other CNMs were observed as a solid structure. Some darker spots observed inside the TEM images represent the bimetallic nanocluster which initiates the buildup of carbon atoms resulting in CNTs and other CNMs formation. It is also clear from the position of the catalyst nanocluster on the top end of the CNMs that the growth mechanism could be following the top-down model. This is in agreement with our findings that CY showed an increasing trend with increasing reaction time. In that case, the bimetallic catalyst nanoclusters were not covered. Thus, their exposure enables them to be catalytically active and decompose C2H2 into CNMs. In addition, TEM images exhibited a crooked or twisted CNMs layout. According to the proposed catalytic growth mechanism, the crooked, or twisted CNMs may be the result of a variety of clusters of catalyst crystallization and morphology when conjugated with carbon segregation on the active sites around the catalyst periphery during CNMs growth.
The ImageJ® image processing software was used to determine the average diameter and particle size distribution of CNMs to perform statistically reliable measurements; several micrographs have been processed for each sample. The minimum number of investigated particles was 200. It was found that the average size diameter (as shown in Table 7) was the smallest when using Fe as a mono-catalyst as in S5. Using bimetallic catalysts of Fe and Co tends to increase the average size diameter as Co catalyst percentage weight and reaction time increased.
The particle size distribution test result is depicted in Table 7. It was found that using Fe as a mono-catalyst gave around 64% and 20% in the range between 0–50 and 50–100 nm, respectively. However, adding a small amount percentage weight of Co increased the size of CNMs. For example, S4 gave around 21% and 47% in the range between 0–50 and 50–100 nm, respectively. It is worth mentioning that the best samples satisfying the definition of CNMs (<100 nm) are those with 2% Co and 2.5% Fe.

3.6. Raman Analysis

Raman spectroscopy was used to characterize the nature of the prepared CNMs as shown in Figure 7 for S4 and S5. There was an observation for two well-unattached peaks at ~1590 cm−1 for G peaks which corresponds to the movement of the two adjacent carbon atoms moving in opposite directions inside the graphite sheet [48], and at ~1350 cm−1 for D peaks which corresponds to sp3- hybridization of carbon atoms at the sidewalls of CNTs [49]. These peaks usually appear in multiwall CNTs, while the radial breathing mode (RBM) can be spotted in the range of 100–400 cm−1 in SWCNTs. No (RBM) peaks were observed for the samples which indicates that no SWCNT was produced. The ID/IG ratios were calculated to estimate the variation of CNMs crystallinity with Fe and Fe–Co catalysts. The ID/IG for the S5 sample is 0.63 which was lower than those using Fe–Co bimetallic catalysts for the S4 sample (0.96). This suggests that the use of the Fe–Co bi-catalysts system will provide the sample containing well developed graphitic structure than that of the sample using the Fe catalyst only [50].

3.7. Thermal Stability Analyses

Thermal stability, quality, and purity of the synthesized CNMs were analyzed using TGA analysis. The curve obtained for TGA and derivative thermogravimetric (DTG) analysis of samples S4 and S5 are illustrated by Figure 8. TGA analysis demonstrates the weight loss at different temperatures which reflects the thermal stability of the finally obtained CNMs. The first observation of weight loss was at a temperature of around 100 °C for both samples which can be attributed to the adsorbed moisture and hydrocarbons over the surface of synthesized CNMs [51]. Oxidation began at approximately 400 °C and 500 °C for sample S5 and S4, respectively which resulted in a loss of nearly 85 wt%. The oxidation temperature of different carbon structures is not the same and varies according to the inter-atom bonds’ strength and their network uniformity. The TGA profile of S4 showed more thermal stability due to the presence of more CNMs. It was also noticed that no further weight loss after a temperature of 600 and 667 °C for sample S5 and S4, respectively. The residual materials obtained for the sample contain ash residues and it was estimated to be 6.5% and 8% for sample S5 and S4, respectively. This might be due to the catalytic impregnation of PAC earlier in the CVD process for CNMs growth.

4. Conclusions

This research deals with the dense growth of CNMs from abundantly available activated carbon using a binary metal mixture in a certain proportion using the CVD process. The RSM statistical method was successfully used to show the interactions of different input variables for CNMs growth on PAC. The output responses including CY and CA were determined and significant regression models were obtained. Eventually, this led to the successful optimization of the CVD process. The proportion of Fe and Co catalysts, as well as reaction time, plays a crucial role in obtaining the highest CY and CA values. Process parameter optimization revealed that the mixture of 2.5% Fe and 2% Co is the best catalyst for CNMs growth when the CVD process is carried out for 60 min to have the highest magnitude of CY around 351% with CA values of 173°. Surface morphological features observed by using SEM and TEM analyses demonstrated that mixtures of CNMs such as helix-like CNFs, CNFs, and CNTs were produced under optimum conditions. High degrees of graphitization with some defects inside the nanocarbon matrix was detected during Raman analysis. Thus, a stable, super-hydrophobic nanostructured carbon having different shapes had been successfully synthesized in this study from powdered activated carbon. The catalytic approach used here ensured high yield, CY% making the overall process economically feasible.

Author Contributions

Idea of research stated by M.A.A. and B.O.B.; design of Experiment by M.A.A., B.O.B., Z.Z.C., and F.S.M.; conducting experiments and collecting data by B.O.B., M.A.A.; interpreting the results by M.A.A., B.O.B., Z.Z.C., M.K.A., F.S.M., M.M.N.; writing up the manuscript and revising by B.O.B., Z.Z.C., and M.A.A. All authors have read and agreed to the published version of the manuscript.

Funding

The research was also conducted under 17AET-RP44C and RU grant ST028-2019 under Z.Z.C. as Principal Investigator from the University of Malaya, Malaysia. The authors would like to acknowledge the Sultan Qaboos University’s internal grant number IG/ENG/PCED/19/02 for funding this research.

Conflicts of Interest

The authors declare no conflict of interest.

References

  1. Dillon, A.C.; Jones, K.M.; Bekkedahl, T.A.; Kiang, C.H.; Bethune, D.S.; Heben, M.J. Storage of hydrogen in single-walled carbon nanotubes. Nature 1997, 386, 377–379. [Google Scholar] [CrossRef]
  2. Odom, T.W.; Huang, J.L.; Kim, P.; Lieber, C.M. Atomic structure and electronic properties of single-Walled carbon nanotubes. Nature 1998, 391, 62–64. [Google Scholar] [CrossRef]
  3. Treacy, M.M.J.; Ebbesen, T.W.; Gibson, J.M. Exceptionally high Young’s modulus observed for individual carbon nanotubes. Nature 1996, 381, 678–680. [Google Scholar] [CrossRef]
  4. Lu, J.P. Novel magnetic properties of carbon nanotubes. Phys. Rev. Lett. 1995, 74, 1123–1126. [Google Scholar] [CrossRef] [PubMed] [Green Version]
  5. Yohe, S.T.; Colson, Y.L.; Grinstaff, M.W. Superhydrophobic materials for tunable drug release: Using displacement of air to control delivery rates. J. Am. Chem. Soc. 2012, 134, 2016–2019. [Google Scholar] [CrossRef] [PubMed] [Green Version]
  6. Chowdhury, Z.Z.; Hamid, S.B.A.; Das, R.; Hasan, M.R.; Zain, S.M.; Khalid, K.; Uddin, M.N. Preparation of carbonaceous adsorbents from lignocellulosic biomass and their use in removal of contaminants from aqueous solution. Bioresource 2013, 8, 6523–6555. [Google Scholar] [CrossRef]
  7. Das, R.; Ali, M.E.; Hamid, S.B.A.; Ramakrishna, S.; Chowdhury, Z.Z. Carbon nanotube membranes for water purification: A bright future in water desalination. Desalination 2014, 336, 97–109. [Google Scholar] [CrossRef]
  8. Nakajima, A.; Hashimoto, K.; Watanabe, T. Recent studies on super-hydrophobic films. Monatsh. Chem. 2001, 132, 31–41. [Google Scholar] [CrossRef]
  9. Ma, M.; Mao, Y.; Gupta, M.; Gleason, K.K.; Rutledge, G.C. Superhydrophobic fabrics produced by electrospinning and chemical vapor deposition. Macromolecules 2005, 38, 9742–9748. [Google Scholar] [CrossRef]
  10. Endo, M.; Takeuchi, K.; Igarashi, S.; Kobori, K.; Shiraishi, M.; Kroto, H.W. The production and structure of pyrolytic carbon nanotubes (PCNTs). J. Phys. Chem. Solids 1993, 54, 1841–1848. [Google Scholar] [CrossRef]
  11. Iijima, S. Helical microtubules of graphitic carbon. Nature 1991, 354, 56–58. [Google Scholar] [CrossRef]
  12. Nikolaev, P.; Bronikowski, M.J.; Bradley, R.K.; Rohmund, F.; Colbert, D.T.; Smith, K.A.; Smalley, R.E. Gasphase catalytic growth of single-walled carbon nanotubes from carbon monoxide. Chem. Phys. Lett. 1999, 313, 91–97. [Google Scholar] [CrossRef]
  13. Guo, T.; Nikolaev, P.; Thess, A.; Colbert, D.T.; Smalley, R.E. Catalytic growth of single-walled nanotubes by laser vaporization. Chem. Phys. Lett. 1995, 243, 49–54. [Google Scholar] [CrossRef]
  14. Saifuddin, N.; Raziah, A.Z.; Junizah, A.R. Carbon Nanotubes: A Review on Structure and Their Interaction with Proteins. J. Chem. 2013, 2013. [Google Scholar] [CrossRef]
  15. Ward, J.W.; Wei, B.Q.; Ajayan, P.M. Substrate effects on the growth of carbon nanotubes by thermal decomposition of methane. Chem. Phys. Lett. 2003, 376, 717–725. [Google Scholar] [CrossRef]
  16. Zheng, B.; Li, Y.; Liu, J. CVD synthesis and purification of single-Walled carbon nanotubes on aerogel-Supported catalyst. Appl. Phys. A 2002, 74, 345–348. [Google Scholar] [CrossRef]
  17. Hernadi, K.; Fonseca, A.; Nagy, J.B.; Bernaerts, D.; Fudala, A.; Lucas, A.A. Catalytic synthesis of carbon nanotubes using zeolite support. Zeolites 1996, 17, 416–423. [Google Scholar] [CrossRef]
  18. Wang, R.; Xu, H.; Guo, L.; Liang, J. Growth of single-Walled carbon nanotubes on porous silicon. Appl. Surf. Sci. 2006, 252, 7347–7351. [Google Scholar] [CrossRef]
  19. Amama, P.B.; Pint, C.L.; Kim, S.M.; McJilton, L.; Eyink, K.G.; Stach, E.A.; Hauge, R.H.; Maruyama, B. Influence of Alumina Type on the Evolution and Activity of Alumina-Supported Fe Catalysts in Single-Walled Carbon Nanotube Carpet Growth. ACS Nano 2010, 4, 895–904. [Google Scholar] [CrossRef]
  20. He, C.; Zhao, N.; Shi, C.; Du, X.; Li, J. Synthesis of binary and triple carbon nanotubes over Ni/Cu/Al2O3 catalyst by chemical vapor deposition. Mater. Lett. 2007, 61, 4940–4943. [Google Scholar] [CrossRef]
  21. Yang, Y.; Hu, Z.; Lü, Y.N.; Chen, Y. Growth of carbon nanotubes with metal-Loading mesoporous molecular sieves catalysts. Mater. Chem. Phys. 2003, 82, 440–443. [Google Scholar] [CrossRef]
  22. Ni, L.; Kuroda, K.; Zhou, L.-P.; Kizuka, T.; Ohta, K.; Matsuishi, K.; Nakamura, J. Kinetic study of carbon nanotube synthesis over Mo/Co/MgO catalysts. Carbon 2006, 44, 2265–2272. [Google Scholar] [CrossRef] [Green Version]
  23. Yu, H.; Zhang, Q.; Zhang, Q.; Wang, Q.; Ning, G.; Luo, G.; Wei, F. Effect of the reaction atmosphere on the diameter of single-Walled carbon nanotubes produced by chemical vapor deposition. Carbon 2006, 44, 1706–1712. [Google Scholar] [CrossRef]
  24. Betar, B.O.; Alsaadi, M.A.; Chowdhury, Z.Z.; Aroua, M.K.; Mjalli, F.S.; Dimyati, K.; Hindia, M.N.; Elfghi, F.M. Bimetallic Mo-Fe Co-Catalyst Based Nano-Carbon Impregnated on PAC for Optimum Super-Hydrophobicity. Symmetry 2020, 12, 1242. [Google Scholar] [CrossRef]
  25. Rinaldi, A.; Abdullah, N.; Ali, M.; Furche, A.; Hamid, S.B.A.; Su, D.S.; Schlögl, R. Controlling the yield and structure of carbon nanofibers grown on a nickel/activated carbon catalyst. Carbon 2009, 47, 3023–3033. [Google Scholar] [CrossRef] [Green Version]
  26. AlSaadi, M.A.; Al-Mamun, A.; Muyibi, S.A.; Alam, M.Z.; Sopyan, I.; Atieh, M.A.; Ahmed, Y.M. Synthesis of various carbon nanomaterials (CNMs) on powdered activated carbon. Afr. J. Biotechnol. 2011, 10, 18892–18905. [Google Scholar]
  27. Dupuis, A.-C. The catalyst in the CCVD of carbon nanotubes-A review. Prog. Mater. Sci. 2005, 50, 929–961. [Google Scholar] [CrossRef]
  28. Alayan, H.M.; Alsaadi, M.A.; Das, R.; Abo-Hamad, A.; Ibrahim, R.K.; AlOmar, M.K.; Hashim, M.A. The formation of hybrid carbon nanomaterial by chemical vapor deposition: An efficient adsorbent for enhanced removal of methylene blue from aqueous solution. Water. Sci. Technol. 2018, 77, 1714–1723. [Google Scholar] [CrossRef] [Green Version]
  29. Das, R.; Ali, M.E.; Hamid, S.B.A.; Annuar, M.; Ramakrishna, S. Common wet chemical agents for purifying multiwalled carbon nanotubes. J. Nanomater. 2014, 2014, 237–245. [Google Scholar] [CrossRef]
  30. Vesselényi, I.; Niesz, K.; Siska, A.; Kónya, Z.; Hernadi, K.; Nagy, J.B.; Kiricsi, I. Production of carbon nanotubes on different metal supported catalysts. React. Kinet. Catal. Lett. 2001, 74, 329–336. [Google Scholar] [CrossRef]
  31. Huang, Z.P.; Wang, D.Z.; Wen, J.G.; Sennett, M.; Gibson, H.; Ren, Z.F. Effect of nickel, iron and cobalt on growth of aligned carbon nanotubes. Appl. Phys. A 2002, 74, 387–391. [Google Scholar] [CrossRef]
  32. Kiang, C.H.; Goddard III, W.A.; Beyers, R.; Salem, J.S.; Bethune, D.S. Catalytic effects of heavy metals on the growth of carbon nanotubes and nanoparticles. J. Phys. Chem. Solids. 1996, 57, 35–39. [Google Scholar] [CrossRef]
  33. Flahaut, E.; Govindaraj, A.; Peigney, A.; Laurent, C.H.; Rousset, A.; Rao, C.N.R. Synthesis of single-Walled carbon nanotubes using binary (Fe, Co, Ni) alloy nanoparticles prepared in situ by the reduction of oxide solid solutions. Chem. Phys. Lett. 1999, 300, 236–242. [Google Scholar] [CrossRef] [Green Version]
  34. Cassell, A.M.; Raymakers, J.A.; Kong, J.; Dai, H. Large Scale CVD Synthesis of Single-Walled Carbon Nanotubes. J. Phys. Chem. B 1999, 103, 6484–6492. [Google Scholar] [CrossRef]
  35. Biris, A.R.; Li, Z.; Dervishi, E.; Lupu, D.; Xu, Y.; Saini, V.; Watanabe, F.; Biris, A.S. Effect of hydrogen on the growth and morphology of single wall carbon nanotubes synthesized on a Fe–Mo/MgO catalytic system. Phys. Lett. A 2008, 372, 3051–3057. [Google Scholar] [CrossRef]
  36. Cui, Y.; Wu, X.; Wu, H.; Tian, Y.; Chen, Y. Optimization of synthesis condition for carbon nanotubes by chemical vapor deposition on Fe–Ni–Mo/MgO catalyst. Mater. Lett. 2008, 62, 3878–3880. [Google Scholar] [CrossRef]
  37. Niu, Z.; Fang, Y. Effect of temperature for synthesizing single-walled carbon nanotubes by catalytic chemical vapor deposition over Mo–Co–MgO catalyst. Mater. Res. Bull. 2008, 43, 1393–1400. [Google Scholar] [CrossRef]
  38. Saito, T.; Ohshima, S.; Xu, W.-C.; Ago, H.; Yumura, M.; Iijima, S. Size control of metal nanoparticle catalysts for the gas-phase synthesis of single-Walled carbon nanotubes. J. Phys. Chem. B 2005, 109, 10647–10652. [Google Scholar] [CrossRef]
  39. Sugime, H.; Noda, S.; Maruyama, S.; Yamaguchi, Y. Multiple “optimum” conditions for Co–Mo catalyzed growth of vertically aligned single-walled carbon nanotube forests. Carbon 2009, 47, 234–241. [Google Scholar] [CrossRef]
  40. Aljumaily, M.M.; Alsaadi, M.A.; Hashim, N.A.; Alsalhy, Q.F.; Mjalli, F.S.; Atieh, M.A.; Al-Harrasi, A. PVDF-co-HFP/superhydrophobic acetylene-based nanocarbon hybrid membrane for seawater desalination via DCMD. Chem. Eng. Res. Des. 2018, 138, 248–259. [Google Scholar] [CrossRef]
  41. Das, R.; Hamid, S.B.A.; Annuar, M.S.M. Highly efficient and stable novel nanobiohybrid catalyst to avert 3,4-dihydroxybenzoic acid pollutant in water. Sci. Rep. 2016, 6. [Google Scholar] [CrossRef] [PubMed] [Green Version]
  42. Rümmeli, M.H.; Kramberger, C.; Schäffel, F.; Borowiak-Palen, E.; Gemming, T.; Rellinghaus, B.; Jost, O.; Löffler, M.; Ayala, P.; Pichler, T.; et al. Catalyst size dependencies for carbon nanotube synthesis. Phys. Status. Solidi B 2007, 244, 3911–3915. [Google Scholar] [CrossRef]
  43. Nagaraju, N.; Fonseca, A.; Konya, Z.; Nagy, J.B. Alumina and silica supported metal catalysts for the production of carbon nanotubes. J. Mol. Catal. A Chem. 2002, 181, 57–62. [Google Scholar] [CrossRef]
  44. Maccallini, E.; Tsoufis, T.; Policicchio, A.; La Rosa, S.; Caruso, T.; Chiarello, G.; Colavita, E.; Formoso, V.; Gournis, D.; Agostino, R.G. A spectro-Microscopic investigation of Fe–Co bimetallic catalysts supported on MgO for the production of thin carbon nanotubes. Carbon 2010, 48, 3434–3445. [Google Scholar] [CrossRef]
  45. Kumar, M.; Ando, Y. Chemical Vapor Deposition of Carbon Nanotubes: A Review on Growth Mechanism and Mass Production. J. Nanosci. Nanotechnol. 2010, 10, 3739–3758. [Google Scholar] [CrossRef] [PubMed] [Green Version]
  46. Lu, Z.; Sun, M.; Xu, T.; Li, Y.; Xu, W.; Chang, Z.; Ding, Y.; Sun, X.; Jiang, L. Superaerophobic electrodes for direct hydrazine fuel cells. Adv. Mater. 2015, 27, 2361–2366. [Google Scholar] [CrossRef] [PubMed]
  47. Wenzel, R.N. Surface Roughness and Contact Angle. J. Phys. Chem. 1949, 53, 1466–1467. [Google Scholar] [CrossRef]
  48. Hiura, H.; Ebbesen, T.W.; Tanigaki, K.; Takahashi, H. Raman studies of carbon nanotubes. Chem. Phys. Lett. 1993, 202, 509–512. [Google Scholar] [CrossRef]
  49. Bahr, J.L.; Yang, J.; Kosynkin, D.V.; Bronikowski, M.J.; Smalley, R.E.; Tour, J.M. Functionalization of Carbon Nanotubes by Electrochemical Reduction of Aryl Diazonium Salts: A Bucky Paper Electrode. J. Am. Chem. Soc. 2001, 123, 6536–6542. [Google Scholar] [CrossRef] [PubMed]
  50. Eckmann, A.; Felten, A.; Mishchenko, A.; Britnell, L.; Krupke, R.; Novoselov, K.S.; Casiraghi, C. Probing the nature of defects in graphene by Raman spectroscopy. Nano Lett. 2012, 12, 3925–3930. [Google Scholar] [CrossRef] [PubMed] [Green Version]
  51. Maroto-Valer, M.M.; Dranca, I.; Lupascu, T.; Nastas, R. Effect of adsorbate polarity on thermodesorption profiles from oxidized and metal-Impregnated activated carbons. Carbon 2004, 42, 2655–2659. [Google Scholar] [CrossRef]
Figure 1. Parity plot of experimental and predicted values of (a) CY (%) and (b) CA (°).
Processes 09 00134 g001
Figure 2. Response surface plots for the effects of the catalyst amount at fixed reaction time 40 min on: (a) Yield and (b) CA.
Processes 09 00134 g002
Figure 3. CA (°) of carbon nanostructured materials (CNMs): (a) S5, (b) S4.
Processes 09 00134 g003
Figure 4. Response surface plots for the effects of the reaction time at fixed Co% amount (2%) on: (a) CY (%) and (c) CA (°), and at fixed Fe% amount (2.5%) on: (b) CY (%) and (d) CA (°).
Processes 09 00134 g004aProcesses 09 00134 g004b
Figure 5. Field emission scanning electron microscopy (FESEM) images of CNMs: (a) S1, (b) S4, (c) S5, (d) S6, (e) S10, (f) S11.
Processes 09 00134 g005aProcesses 09 00134 g005b
Figure 6. Transmission electron microscopic (TEM) images of S4.
Processes 09 00134 g006
Figure 7. Raman spectra of S4 and S5.
Processes 09 00134 g007
Figure 8. Thermogravimetric analysis (TGA) and derivative thermogravimetric (DTG) curves of S4 and S5.
Processes 09 00134 g008
Table 1. Box-Behnken experimental design matrix for 17 experimental runs.
SampleAmount of Fe% (A)Amount of Co% (B)Time (min) (C)CY (%) (Y1)CA (°) (Y2)
S12.502.0040.00291.7168
S22.502.0040.00295.4171
S32.502.0040.00292.2169
S42.502.0060.00351.3173
S55.000.0040.0076.4176
S65.002.0060.00216.9167
S72.500.0060.0059136
S80.002.0060.0062.5153
S90.002.0020.0047.8149
S105.004.0040.00197.1162
S110.004.0040.0014.9159
S122.504.0060.00176.5164
S132.504.0020.00113.7152
S145.002.0020.00143.2141
S152.500.0020.0035.698
S162.502.0040.00293.8170
S172.502.0040.00296171
Table 2. Carbon yield (CY) fitted models’ statistical characteristics.
SourceSum of SquaresDFMean SquareF ValueProb > FR2
Linear1.691 × 105918,789.005230.790.00010.1781
2FI1.539 × 105625,657.327142.910.00010.2518
Quadratic8559.9632853.32794.350.00010.9853
Cubic0.0000----
Table 3. Contact angle (CA) fitted models’ statistical characteristics.
SourceSum of SquaresDFMean SquareF ValueProb > FR2
Linear3945.169438.35257.850.00010.2367
2FI3211.346535.22314.840.00010.3060
Quadratic876.073292.02171.780.00010.9912
Cubic0.0000----
Table 4. ANOVA analysis for CY% surface model.
SourceSum of SquaresDFMean SquareF ValueProb > F
A15,600.01115,600.015209.380.0001
B9564.8419564.843194.030.0001
C3810.6413810.641272.510.0001
AB6807.2116807.212273.160.0001
AC870.251870.25290.610.0001
BC388.091388.09129.600.0001
A232,648.01132,648.0110,902.290.0001
B239,576.16139,576.1613,215.840.0001
C2959.461959.46320.400.0001
A2B7301.3617301.362438.170.0001
AB28556.1218556.122857.180.0001
Table 5. ANOVA analysis for CA surface model.
SourceSum of SquaresDFMean SquareF ValueProb > F
A9.0019.000.790.4142
B1681.0011681.00147.980.0001
C800.001800.0070.420.0004
AB199.241199.2417.540.0086
AC121.001121.0010.650.0224
BC169.001169.0014.880.0119
A280.18180.187.060.0451
B2472.911472.9141.630.0013
C234.90134.903.070.1400
A2B6.4616.460.570.4848
AB2190.871190.8716.800.0094
Table 6. Solutions for CNMs production.
No.Amount of Fe%Amount of Co%Time (min)CYCA (°)Desirability
12.732.4260.00351.30175.881.000
22.592.4759.56351.35175.480.999
33.192.1960.00356.78175.350.995
Table 7. Average size and particle size distribution of the prepared CNMs.
SampleAverage Size (nm)Particles Size Distribution (%)
0–50 nm50–100 nm100–150 nm150–200 nm
S175.452043298
S472.5721472210
S556.69642088
S691.3819363312
S10146.453175624
Publisher’s Note: MDPI stays neutral with regard to jurisdictional claims in published maps and institutional affiliations.

