Comparison of Dimethylformamide with Dimethylsulfoxide for Quality Improvement of Distillate Recovered from Waste Plastic Pyrolysis Oil

Department of Chemical Engineering, Chungwoon University, Incheon 22100, Korea
Processes 2020, 8(9), 1024; https://doi.org/10.3390/pr8091024
Submission received: 4 April 2020
/
Revised: 14 August 2020
/
Accepted: 19 August 2020
/
Published: 21 August 2020
(This article belongs to the Special Issue Recycling of Waste Oils: Technology and Application)
Abstract
:As a part of improving the quality of the distillate (distilling temperature 120–350 °C) recovered from waste plastic pyrolysis oil (WPPO) by simple distillation, the enrichment of paraffin components present in the distillate was compared by the equilibrium extraction of dimethylformamide (DMF) and dimethylsulfoxide (DMSO). Regardless of the solvent used, the concentration increase rate of the paraffin component in the raffinate relative to the raw material was reduced by increasing the mass fraction of water in the solvent in an initial state. On the other hand, it increased by increasing the mass ratio of the solvent to the raw material in an initial state. The enrichment performance of paraffin component in raffinate recovered by DMF was higher than that by DMSO under the same experimental conditions. Furthermore, the two solvents were compared by adding color and the waxing phenomena of recovered raffinate to assess the enrichment performance of paraffin components.
1. Introduction
The effective treatment of plastic waste products is extremely valuable in that it can solve the problems of serious environmental pollution and resource depletion occurring all over the world. Currently, the most common method of treating waste plastics is landfilling and incineration, but it is recognized that treatment through landfill and incineration is not the ultimate method for treating waste plastics because it causes various environmental problems [1]. Therefore, in recent years, research on the high-temperature thermal decomposition method as one of the efficient treatment of waste plastic products has been actively conducted from the point of view that it is eco-friendly and, at the same time, can be used in the recycling of resources [2].
A large amount of paraffin, olefin, aromatic and acid components are contained in mixed waste plastic pyrolysis oil (WPPO) such as polyethylene (PE), polypropylene (PP), polyvinyl chloride (PVC) and polyethylene terephthalate (PET). Until now, many studies, such as reaction by pyrolysis [2,3,4,5,6,7,8] only and pyrolysis reactions [1,9,10,11,12,13] using a catalyst to produce high quality WPPO for use as fuel, have been reported. Moreover, many studies have been reported that examine the possibility of using WPPO as a renewable energy by comparing with commercial fuels [14,15,16], but few studies have been conducted to improve the quality of the distillate recovered through a distillation operation for low-grade WPPO.
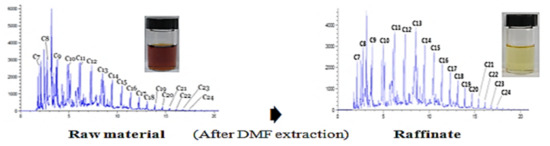
To investigate the quality improvement of the distillate recovered from WPPO for the purpose of producing products similar to commercial light oil, as shown in Figure 1a, it is necessary to examine the separation between paraffin components C7–C24 contained in the distillate and other components using methods such as solvent extraction [17,18,19,20,21,22,23] and emulsion liquid [24,25,26,27], which are widely used for the dearomatizing of petroleum and coal tar systems.
This study investigates the quality improvement of distillate (distilling temperature 120–350 °C) recovered by the simple distillation of WPPO produced from four kinds of mixed waste plastics (PE, PP, PVC, PET). Using an aqueous solution of dimethylformamide (DMF) and dimethylsulfoxide (DMSO) as a solvent, the effects of liquid–liquid contacting time (t), the mass fraction of water in solvent of an initial state (yw,0) and the mass ratio of solvent to the raw material of an initial state (S/F)0 on the enrichment of paraffin components contained in the raw material (WPPO distillate) were examined. The comparison of the two solvents took into account the ease of phase separation, the enrichment performance of the paraffin components, their color, and the waxing phenomena of the recovered raffinate. Based on these results, I examined whether the final product (solvent-free raffinate) recovered in this study could be applied as commercial light oil.
2. Material and Methods
2.1. Material
WPPO (pyrolysis raw material: mixed waste plastic of PE, PP, PVC and PET, reactor: batch pyrolysis furnace, reaction temperature: 430–550 °C) was supplied by Omega Energy Environmental Technology Co., Ltd. (Incheon, Korea). DMF (Anhydrous, ≥99.8% purity), paraffin component C8 (octane, ≥99.7% purity), C9 (n-nonane, ≥99% purity), C10 (n-decane, ≥99.8% purity), C12 (n-dodecane, ≥99.8% purity), C14 (n-tetradecane, ≥99.5% purity) and C16 (n-hexadecane, ≥99.8% purity) were purchased from Sigma-Aldrich Korea (Seoul, Korea).
2.2. Method
A certain concentration of solvent was prepared by the addition of distilled water. A 500 mL Erlenmeyer flask containing a certain amount of the raw material and solvent was placed in a shaking water bath maintained at an experimental temperature and vibrated for 12–72 h to reach liquid–liquid equilibrium. After the equilibrium was reached, the vibration was stopped and settled. The raffinate phase and the extract phase were separated using a 500 mL separatory funnel, and the mass of each phase was measured. The two phases were analyzed by adding acetone, and their compositions were determined. An analysis of two phases recovered was performed using a gas chromatograph (GC, Agilent Technologies Korea Co. (Seoul, Korea), 6890N) equipped with a flame ionization detector (FID) and column (J & W Co., DB–1HT (length: 30 m, inner diameter: 0.32 mm, film: 0.1 μm)). The analysis conditions of samples were as follows: carrier gas, N2; flow rate, 2.2 mL; injection port temperature, 300 °C; sample size, 2 μL; splitting ratio, 20:1; initial temperature, 40 °C; retention time, 1 min; rising temperature speed, 12 °C and final temperature, 350 °C.
2.3. Material System and Conditions
Table 1 shows the material system and experimental conditions used in this study. Low-grade distillate (distilling temperature: 120–350 °C), which recovered by simple distillation of WPPO supplied from the company mentioned above, was used as the raw material. Aqueous solutions of DMF and DMSO were used as the solvents. The operating temperature of an initial state (T0) was fixed constantly and t, yw,0 and (S/F)0 were changed. In this study, commercial reagent grade DMF, DMSO, n-octane, n-nonane, n-decane, n-dodecane, n-tetradecane, and n-hexadecane were used without further purification.
3. Results and Discussion
3.1. Gas Chromatogram of Raw Material (WPPO Distillate)
The raw material, which is composed of more than 100 components, contains paraffin, olefin, aromatic and acid components. Figure 1b shows a gas chromatogram of the raw material analyzed using capillary column DB–1HT and the carbon number of the 18 kinds of paraffin components (C7–C24) identified. The above-mentioned 18 kinds of paraffin components corresponded with peak patterns shown in the gas chromatogram, the result of GC mass analysis of the raw material and result analyzed by adding a small amount of the standard reagents of 6 kinds of paraffin components (C8, C9, C10, C12, C14, C16) purchased from Sigma-Aldrich Korea (Seoul, Korea).
The concentration of C7–C20 paraffin components present in the raw material were in the range of about 0.04–2.77%, except for the concentration for the paraffin components of C21–C24, which were very small.
In this study, it was difficult to accurately quantify each paraffin component contained in the raw material, so the area % of the peak in the gas chromatogram was treated as the concentration of each paraffin component [28]. As shown in Figure 1a, the paraffin components (C7–C24) contained in the raw material of this study were almost identical to those contained in the commercial light oil (C8–C24).
3.2. Equilibrium Extraction
To confirm the time to reach equilibrium, the raffinate phases and the extract phases obtained through contacting (liquid–liquid contacting time: 12, 24, 48, 72 h) the solvent and the raw material under the same conditions [yw,0 = 0.03, (S/F)0 = 3, T0 = 28 °C] were analyzed. The compositions of the raffinate phases and the extract phases obtained by contact for 48 and 72 h were identical to one another regardless of the contact time. The equilibrium arrival time was found to be less than 48 h. Therefore, equilibrium extraction was performed under the fixed condition of t = 72 h.
Figure 2a–d, respectively, show the effect of yw,0 on the recovery rate of paraffin component i (Yi,P, i = C12, C16), the recovery rate of the raffinate (YR), the concentration increase rate of the paraffin component i (xi,P) and the densities (ρ) of the raffinate and extract phase when using DMF and DMSO. Yi,P, YR and xi,P, respectively, are defined as:
where R and R0, respectively, represent the mass of the extract phase after the liquid–liquid contact run and that of the raw material. xi,0 and xi denote the mass fraction of the paraffin component i in the raw material and that in raffinate recovered after a liquid–liquid contact run, respectively.
Regardless of the solvent used, an increase in yw,0 was found to increase Yi,P, as shown in Figure 2a. It is believed that this is the result of the increase in the extract phase polarity as yw,0 increases. At the same yw,0, the larger the carbon number of the paraffin component, the lower the solubility in the solvent, so the Yi,P increases. In addition, Yi,P in DMSO extraction showed a much higher value than that of DMF extraction in the entire range of yw,0 in this study. The results showed that the DMF extraction method had better a solubility in paraffin components than the DMSO extraction method. In the case of DMF at yw,0 = 0, the Yi,P values of paraffin components C12 and C16 were about 42.7% and 60.5%, respectively, whereas DMSO showed about 79% and 93.2%, respectively. In the case of DMSO, considering that the Yi,P of the C16 paraffin component is 97.8% at yw,0 = 0.06, it is found that the paraffin components greater than the C16 paraffin component contained in the raw material remain at almost 100% in the raffinate recovered at yw,0 = 0.06.
Figure 2b shows that YR increases as yw,0 increases, regardless of the solvent used. It is considered that this is caused by decreasing the solubility of all the components such as paraffin, aromatic components, etc., contained in the raw material. In the entire range of yw,0 in this study, DMSO extraction showed a much higher YR than DMF extraction. From this, it is considered that DMF extraction is superior to DMSO extraction in the solubility of paraffin components. For DMF, the YR values at yw,0 = 0 and 0.06 were approximately 38% and 72.2%, respectively. However, DMSO was about 81% and 86.5%, much larger than DHF. From this tendency, it was predicted that the polarity of the solvent changed much more with the increase in yw,0 in the case of DMF than DMSO.
Figure 1c,d, respectively, show the results of analysis of the raffinate recovered under constant conditions (yw,0 = 0.03, (S/F)0 = 10, T0 = 28 °C) using DMF and DMSO. The gas chromatogram of raffinate is very different from that of the raw material (Figure 1b). It was found that the components, other than the paraffin components in the raw material, were extracted in large amounts by the extraction operation, and the peak of the paraffin component was remarkably increased, so that the concentration of the paraffin component in the raffinate increased. The concentrations of C12 and C16 paraffin components in the raffinate from xi,P of yw,0 = 0 shown in Figure 2c increased approximately 1.12 and 1.56 times for DMF and about 0.98 and 1.15 times for DMSO, respectively, compared to their concentration in the raw material.
In the gas chromatogram of the raw material (distillate of WPPO) and the raffinate, each olefin component peak was positioned immediately before each paraffin component. It was expected that it would be difficult to separate the paraffin–olefin components by equilibrium extraction by comparing the gas chromatogram of the raw material (distillate of WPPO) in Figure 1b and the raffinate of Figure 1c.
Although this study only mentions the separation of paraffin components among raw materials by equilibrium extraction, we plan to conduct a detailed review of the separation of olefin components among raw materials by equilibrium extraction in the future.
In the extraction operation, the difference in density between two phases (raffinate phase, extract phase) is an important factor that determines the extraction processing speed. Figure 2d shows the density (ρ) of the two phases recovered after the extraction operation using DMF and DMSO. The effect of yw,0 on the density of the raffinate and extraction phases was not recognized regardless of the solvent. The difference in the density of the two phases due to DMSO extraction was greater than that of DMF extraction. From this result, it was found that DMSO is more advantageous than DMF in terms of extraction processing speed.
When referring to the change in the color of the raffinate according to yw,0 and the solvent, as shown in Figure 3, the color of the raffinate became lighter as the yw,0 decreased regardless of solvent, and changed to very light yellow at yw,0 = 0 (raw material: dark brown). At the same yw,0, the color of the raffinate recovered using DMF was lighter than that of DMSO. In particular, the raffinate recovered at yw,0 = 0 using DMF showed a pale yellow color, almost similar to the color of commercial light oil. Considering that the paraffin component is almost colorless, it can be confirmed that the concentration of paraffin components in the raffinate increases with decreasing yw,0 in the case of DMF rather than DMSO.
Furthermore, because the waxing phenomenon of commercial light oil can occur at a very low temperature, the raw material of this study and the raffinate recovered by DMF and DMSO extraction at yw,0 = 0 were left at −25 °C for 24 h. The occurrence of a waxing phenomenon was confirmed throughout this process. The waxing phenomenon was observed in the raw material and the raffinate recovered from DMSO, but not in the raffinate recovered from DMF.
Figure 4a shows that the extraction amount of paraffinic component i, which is extracted in the extraction phase, increased as (S/F)0 increased regardless of the solvent used, while Yi,P decreased. In the case of (S/F)0 = 1 for DMF, Yi,P of paraffin components C12 and C16 were about 84.9% and 100%, respectively, whereas those of DMSO were about 88.8% and 100%, respectively. Regardless of solvent, considering that the Yi,P of the C16 paraffin component is 100% at (S/F)0 = 1, it was found that the paraffin components with a carbon number higher than 16 contained in the raw material remained at 100% in the raffinate recovered from (S/F)0 = 1.
The YR values at (S/F)0 = 1 for DMF and DMSO were about 81% and 88.6%, respectively (Figure 4b). YR decreased sharply as (S/F)0 increased due to an increase in the extraction amount of all the components other than the paraffin components and the paraffin components contained in the raw material. At (S/F)0 = 10, the YR values of DMF and DMSO were about 23.8% and 76.2%, respectively.
Figure 4c shows that xi,P increases with increasing (S/F)0, regardless of the solvent used. This is considered to be a phenomenon caused by an increase in the selectivity of all the paraffin components compared to all other components such as aromatic components contained in the raw material by the increase in (S/F)0. The concentration of C12 and C16 paraffin components in raffinate recovered at (S/F)0 = 10 increased by about 1.37 and 2.46 times for DMF, 1.05 and 1.26 times for DMSO, respectively, compared to the concentration in the raw material. It is predicted that when DMF is used rather than DMSO, the selectivity of all the paraffin components to all the components other than the paraffin components contained in the raw material is large.
Figure 4d shows the density (ρ) of two phases recovered after the extraction operation using DMF and DMSO. Regardless of the solvent used, the effects of (S/F)0 on the densities of the raffinate phase and the extract phase were not acceptable.
Regardless of the solvent in Figure 5, it was found that the color of the raffinate becomes thinner as the (S/F)0 increases, and becomes very pale yellow at (S/F)0 = 10. DMF showed a color lighter than DMSO in the color of raffinate recovered at the same (S/F)0 and, in particular, the raffinate recovered at (S/F)0 = 10 using DMF showed a pale yellow color almost similar to the color of commercial light oil. As described above, when the raffinate obtained at (S/F)0 = 10 was left at −25 °C for 24 h, a waxing phenomenon was observed in the raffinate recovered from DMSO, but not in that recovered from DMF.
To confirm the reproducibility of all the experimental data obtained using two solvents in this study, the experiments were conducted under the same experimental conditions two or three times. The range of the reproducibility for the measured experimental value was within ± 5%.
Considering the effects according to yw,0 and (S/F)0 for the enrichment performance of paraffin components present in the raffinate, the color of the raffinate compared to commercial light oil and the waxing phenomena of the raffinate, DMF extraction was thought to be more advantageous from the point of view of the quality improvement of the distillate of WPPO than DMSO extraction. Of course, it is believed that the final evaluation of the products (raffinate) obtained from this study should be carried out in more detail through a quality evaluation according to the Petroleum Quality Inspection Method, as well as a review of the possibility of the separation of the olefin components contained in the distillate recovered from WPPO by DMF equilibrium extraction, which will be performed later.
Figure 6 shows the enrichment process of paraffin components from the distillate of WPPO, which is considered to be possible using the equilibrium extraction data of DMF. The proposed process was composed of one extraction tower (tower 1) to recover the paraffin components in the distillate of WPPO, one stripping tower (tower 2) to recover the extract in the extract phase, one washing tower (tower 3) to recover DMF in the raffinate and one distillation tower (tower 4) to recover the extraction solvent (DMF). This process is considered to be a valuable process for the enrichment of paraffin components contained in the distillate of WPPO.
4. Conclusions
As part of the upgrading of the distillate (distilling temperature 120–350 °C.) of WPPO, this study examined the enrichment of paraffin components in the distillate by the equilibrium extraction of DMF and DMSO. Considering the effects according to yw,0 and (S/F)0 for the enrichment performance of paraffin components present in the raffinate, the color of the raffinate compared to commercial light oil and the waxing phenomena of the raffinate, DMF extraction was thought to be more advantageous from the point of view of the quality improvement of the distillate of WPPO than DMSO extraction. The process proposed using the results of DMF equilibrium extraction in this study, which comprised of one extraction tower, one stripping tower, one washing tower and one distillation tower, is a valuable process to enrich of the paraffin compounds contained in the distillate of WPPO.
Funding
This research received no external funding.
Conflicts of Interest
The author declare no conflict of interest.
References
- Syamsiro:, M.; Saptoadi, H.; Norsujianto, T.; Noviasri, P.; Cheng, S.; Alimuddin, Z.; Yoshikawa, K. Fuel oil production from municipal plastic wastes in sequential pyrolysis and catalytic reforming reactors. Energy Procedia 2014, 47, 180–188. [Google Scholar] [CrossRef] [Green Version]
- Kalargaris, I.; Tian, G.; Gu, S. The utilization of oils produced from plastic waste at different pyrolysis temperatures in a DI diesel engine. Energy 2017, 131, 179–185. [Google Scholar] [CrossRef]
- Hartulistiyosoa, E.; Sigiroa, F.A.; Yuliantoa, M. Temperature distribution of the plastics pyrolysis process to produce fuel at 450 °C. Procedia Environ. Sci. 2015, 28, 234–241. [Google Scholar] [CrossRef] [Green Version]
- Santaweesuk, C.; Janyalertadun, A. The production of fuel oil by conventional slow pyrolysis using plastic waste from a municipal landfill. IJESD 2017, 8, 168–173. [Google Scholar] [CrossRef] [Green Version]
- Olufemi, A.S.; Olagboye, S.A. Thermal conversion of waste plastics into fuel oil. Int. J. Petrochem. Sci. Eng. 2017, 2, 252–257. [Google Scholar] [CrossRef] [Green Version]
- Kalargaris, I.; Tian, G.; Gu, S. Experimental evaluation of a diesel engine fuelled by pyrolysis oils produced from low-density polyethylene and ethylene–vinyl acetate plastics. Fuel Process. Technol. 2017, 161, 125–131. [Google Scholar] [CrossRef]
- Frigo, S.; Seggiani, M.; Puccini, M.; Vitolo, S. Liquid fuel production from waste tyre pyrolysis and its utilization in a diesel engine. Fuel 2014, 116, 399–408. [Google Scholar] [CrossRef]
- Hamidi, N.; Tebyanian, F.; Massoudi, R.; Whitesides, L. Pyrolysis of household plastic wastes. Br. J. Appl. Sci. Technol. 2013, 3, 417–439. [Google Scholar] [CrossRef]
- Ratnasari, D.K.; Nahil, M.A.; Williams, P.T. Catalytic pyrolysis of waste plastics using staged catalysis for production of gasoline range hydrocarbon oils. J. Anal. Appl. Pyrolysis 2017, 124, 631–637. [Google Scholar] [CrossRef]
- Sharratt, P.N.; Lin, Y.H.; Garforth, A.A.; Dwyer, J. Investigation of the catalytic pyrolysis of high-density polyethylene over a HZSM-5 catalyst in a laboratory fluidized-bed reactor. Ind. Eng. Chem. Res. 1997, 36, 5118–5124. [Google Scholar] [CrossRef]
- Bagri, R.; Williams, P.T. Catalytic pyrolysis of polyethylene. J. Anal. Appl. Pyrolysis 2002, 63, 29–41. [Google Scholar] [CrossRef]
- Lee, K.H.; Shin, D.H. A comparative study of liquid product on non-catalytic and catalytic degradation of waste plastics using spent FCC catalyst. Korean J. Chem. Eng. 2006, 23, 209–215. [Google Scholar] [CrossRef]
- Koca, A.; Bilgesub, A.Y. Catalytic and thermal oxidative pyrolysis of LDPE in a continuous reactor system. J. Anal. Appl. Pyrolysis 2007, 78, 7–13. [Google Scholar] [CrossRef]
- Wiriyaumpaiwong, S.; Jamradloedluk, J. Fast pyrolysis of plastic wastes. Energy Procedia 2017, 138, 111–115. [Google Scholar] [CrossRef]
- Murugan, S.; Ramaswamy, M.C.; Nagarajan, G. The use of tyre pyrolysis oil in diesel engines. Waste Manag. 2008, 28, 2743–2749. [Google Scholar] [CrossRef]
- Kumar, R.; Mishra, M.K.; Singh, S.K.; Kumar, A. Experimental evaluation of waste plastic oil and its blends on a single cylinder diesel engine. J. Mech. Sci. Technol. 2016, 30, 4781–4789. [Google Scholar] [CrossRef]
- Kim, S.J.; Kim, S.C. Separation and recovery of dimethylnaphthalene isomers from light cycle oil by distillation-extraction combination. Sep. Sci. Technol. 2003, 38, 4095–4116. [Google Scholar] [CrossRef]
- Kim, S.J. Purification of 2,6-dimethylnaphthalene containing in light cycle oil by distillation-solvent extraction-solute crystallization combination. J. Ind. Eng. Chem. 2019, 79, 146–153. [Google Scholar] [CrossRef]
- Jiao, T.T.; Zhuang, X.L.; He, H.Y.; Li, C.S.; Chen, H.N.; Zhang, S.J. Separation of phenolic compounds from coal tar via liquid liquid extraction using amide compounds. Ind. Eng. Chem. Res. 2015, 54, 2573–2579. [Google Scholar] [CrossRef]
- Jiao, T.T.; Li, C.S.; Zhuang, X.L.; Cao, S.S.; Chen, H.N.; Zhang, S.J. The new liquid-liquid extraction method for separation of phenolic compounds from coal tar. Chem. Eng. J. 2015, 266, 148–155. [Google Scholar] [CrossRef]
- Kang, H.C.; Kim, S.J. Comparison of methanol with formamide on separation of nitrogen heterocyclic compounds from model coal tar fraction by batch cocurrent multistage equilibrium extraction. Polycycl. Aromat. Compd. 2016, 36, 745–757. [Google Scholar] [CrossRef]
- Kim, S.J.; Chun, Y.J. Separation of nitrogen heterocyclic compounds from model coal tar fraction by solvent extraction. Sep. Sci. Technol. 2005, 40, 2095–2109. [Google Scholar]
- Kim, S.J. Separation and purification of indole in model coal tar fraction of 9 compounds system. Polycycl. Aromat. Compd. 2019, 39, 60–72. [Google Scholar] [CrossRef]
- Kim, S.J.; Kim, S.C. Separation of valuable bicyclic aromatic components from light cycle oil by an emulsion liquid membrane. Sep. Sci. Technol. 2004, 39, 1093–1109. [Google Scholar] [CrossRef]
- Egashira, R.; Habaki, H.; Kawasaki, J. Decrease in aromatics content in motor gasoline by O/W/O emulsion liquid membrane process. J. Jpn. Pet. Inst. 1997, 40, 107–114. [Google Scholar] [CrossRef] [Green Version]
- Kim, S.J.; Kang, H.C.; Kim, Y.S.; Jeong, H.J. Liquid membrane permeation of nitrogen heterocyclic compounds contained in model coal tar fraction. Bull. Korean Chem. Soc. 2010, 31, 1143–1148. [Google Scholar] [CrossRef] [Green Version]
- Sharma, A.; Goswami, A.N.; Rawat, B.S.; Krishina, R. Effect of surfactant type on the selectivity for separation of 1–methyl naphthalene and dodecane using liquid membranes. J. Membr. Sci. 1987, 42, 19–30. [Google Scholar] [CrossRef]
- Kang, H.C.; Shin, S.S.; Kim, D.H.; Kim, S.J. Recovery of paraffin components from pyrolysis oil fraction of waste plastic by batch cocurrent 4 stages equilibrium extraction. Appl. Chem. Eng. 2018, 29, 630–634. [Google Scholar]
Figure 1.
Gas chromatogram of (a) commercial light oil, (b) raw material (distillate recovered from WPPO through simple distillation), (c) raffinate (solvent-free) recovered using dimethylformamide (DMF), and (d) raffinate (solvent-free) recovered using dimethylsulfoxide (DMSO). Experimental conditions of (c) and (d): t = 72 h, yw,0 = 0.03, (S/F)0 = 10, T0 = 28 °C.
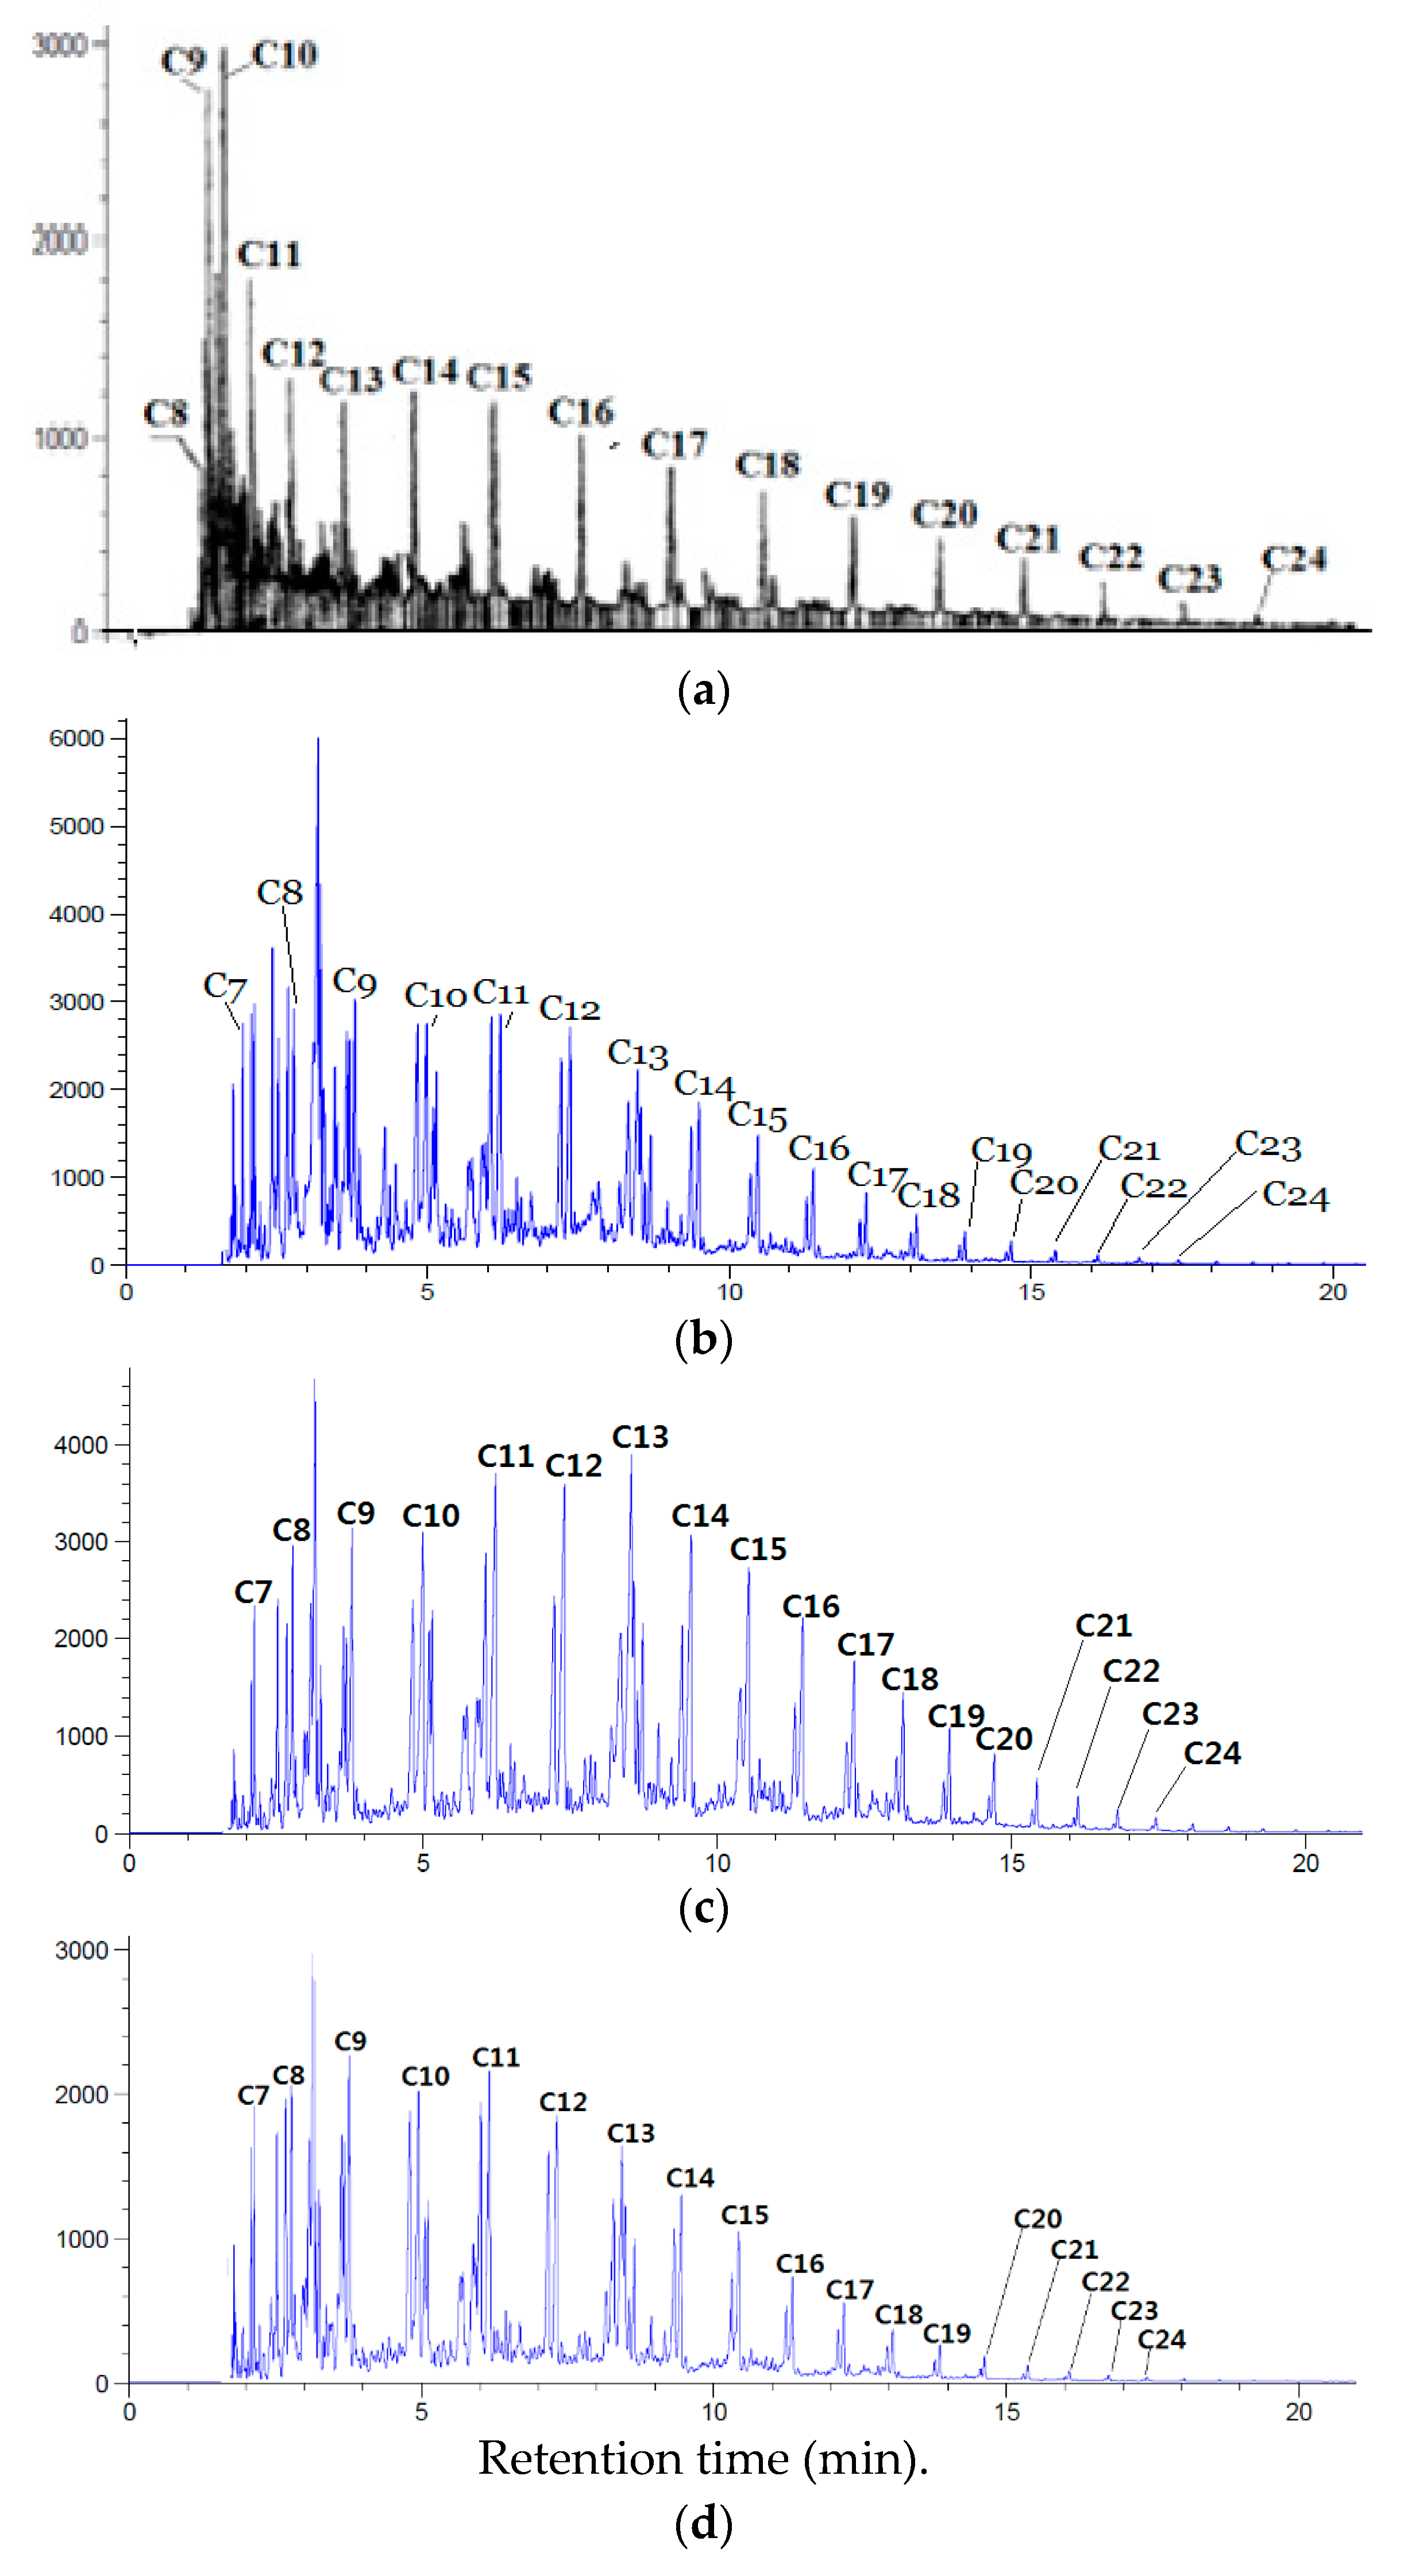
Figure 2.
Comparison of solvent for (a) recovery rate of paraffin component i (Yi,P) present in raffinate, (b) recovery rate of raffinate (YR), (c) the concentration increase rate of the paraffin component i (xi,P) present in raffinate to that present in raw material (WPPO distillate), and (d) density (ρ) of raffinate and extract phase according to mass fraction of water in solvent of initial state (yw,0). Experimental conditions: t = 72 h, (S/F)0 = 3, T0 = 28 °C. Keys of (a) and (c): ● C12 (DMF), ▲ C16 (DMF), ○ C12 (DMSO), △ C16 (DMSO). Keys of (d): ● raffinate phase (DMF), ○ raffinate phase (DMSO), ▲ extract phase (DMF), △ extract phase (DMSO).

Figure 3.
Comparison of solvent for color change in raffinate according to yw,0. Solvent used: (a) DMF, (b) DMSO. Experimental condition: t = 72 h, (S/F)0 = 3, T0 = 28 °C. (I) raw material, (II) yw,0 = 0, (III) yw,0 = 0.03, and (IV) yw,0 = 0.06.
Figure 3.
Comparison of solvent for color change in raffinate according to yw,0. Solvent used: (a) DMF, (b) DMSO. Experimental condition: t = 72 h, (S/F)0 = 3, T0 = 28 °C. (I) raw material, (II) yw,0 = 0, (III) yw,0 = 0.03, and (IV) yw,0 = 0.06.
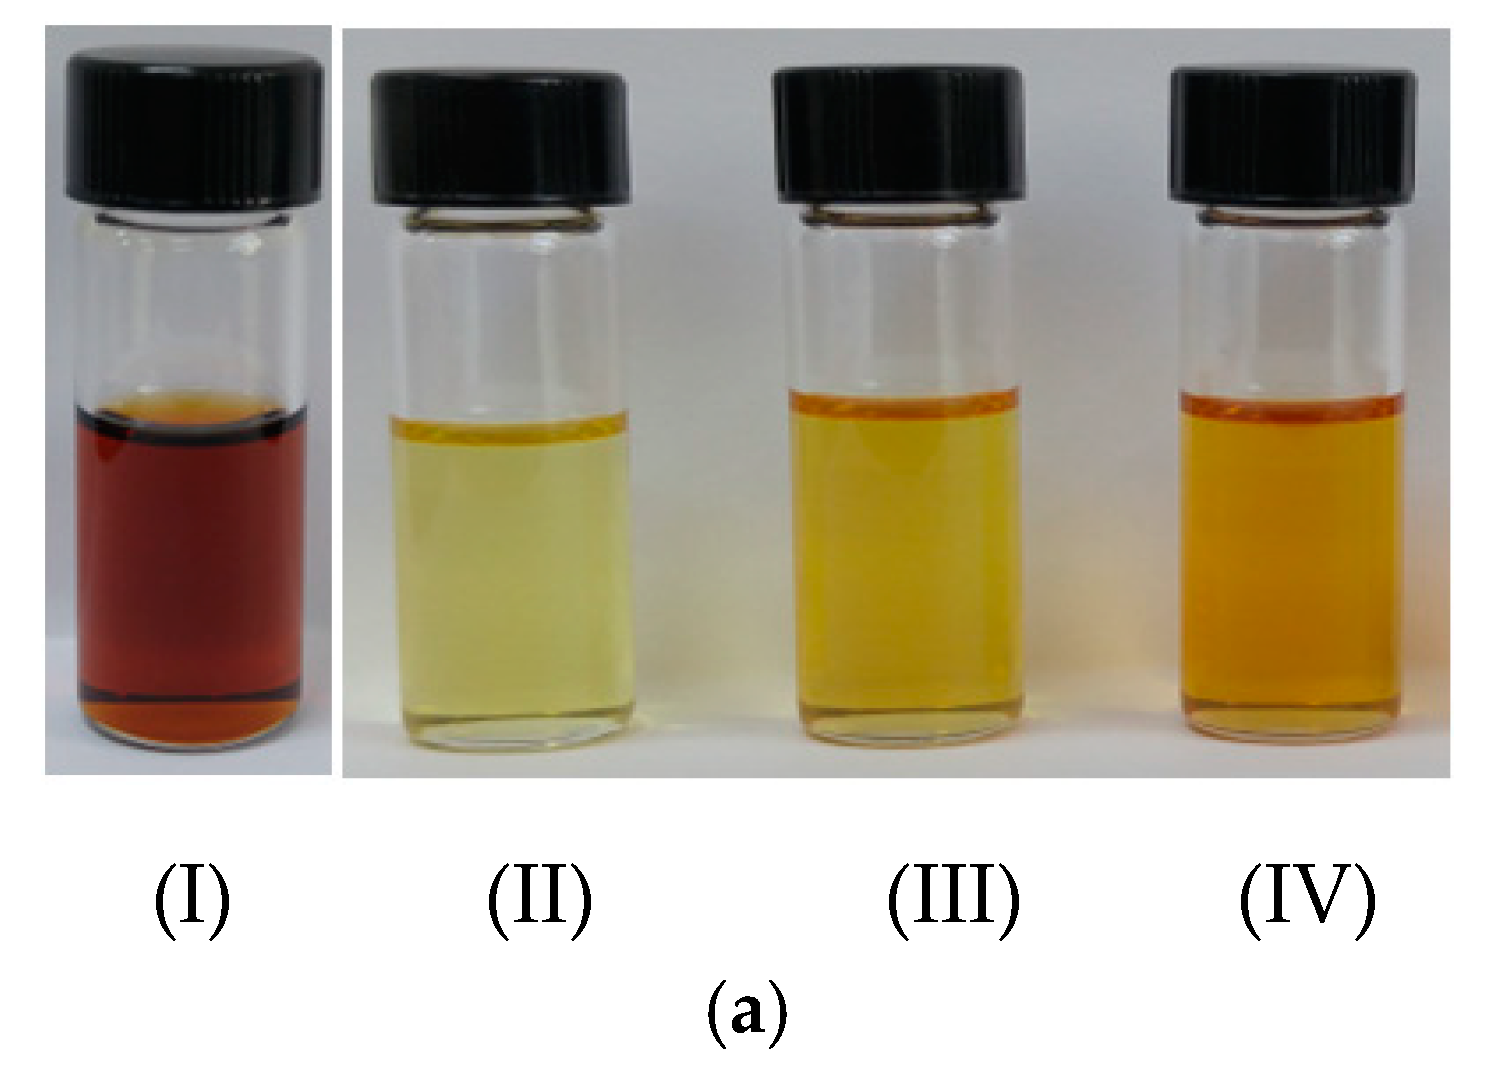
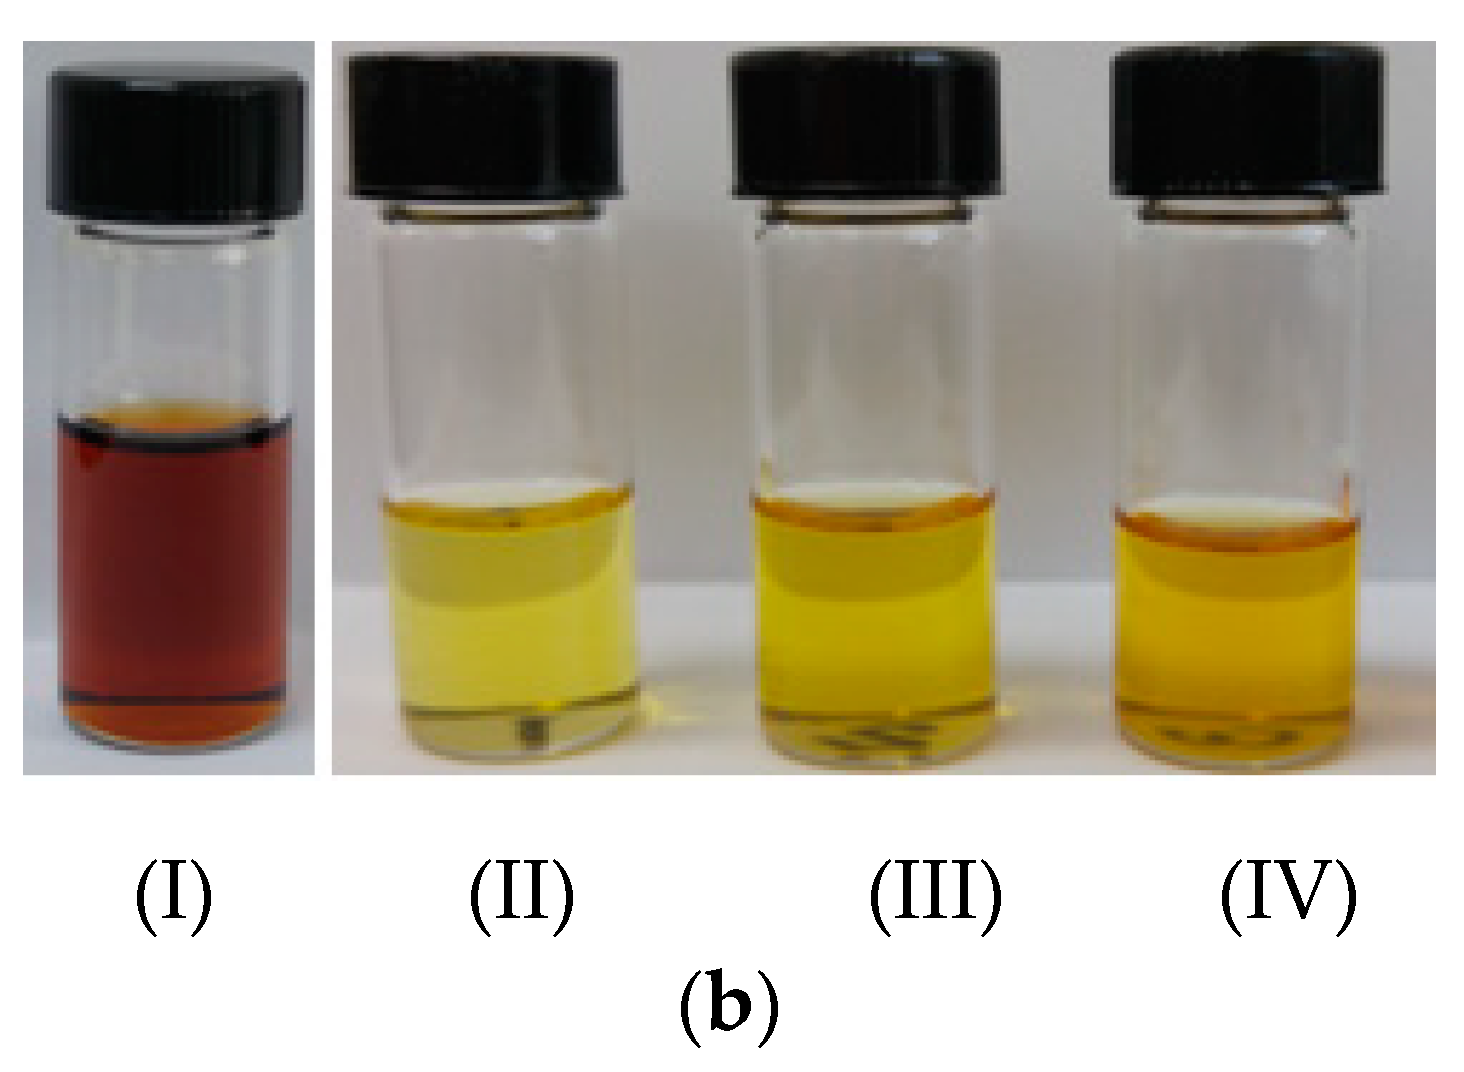
Figure 4.
Comparison of solvent for (a) Yi,P, (b) YR, (c) xi,P, and (d) ρ according to mass ratio of solvent to raw material in initial state (S/F)0. Experimental conditions: t = 72 h, yw,0 = 0.03, T0 = 28 °C. Keys are shown in Figure 2.
Figure 4.
Comparison of solvent for (a) Yi,P, (b) YR, (c) xi,P, and (d) ρ according to mass ratio of solvent to raw material in initial state (S/F)0. Experimental conditions: t = 72 h, yw,0 = 0.03, T0 = 28 °C. Keys are shown in Figure 2.
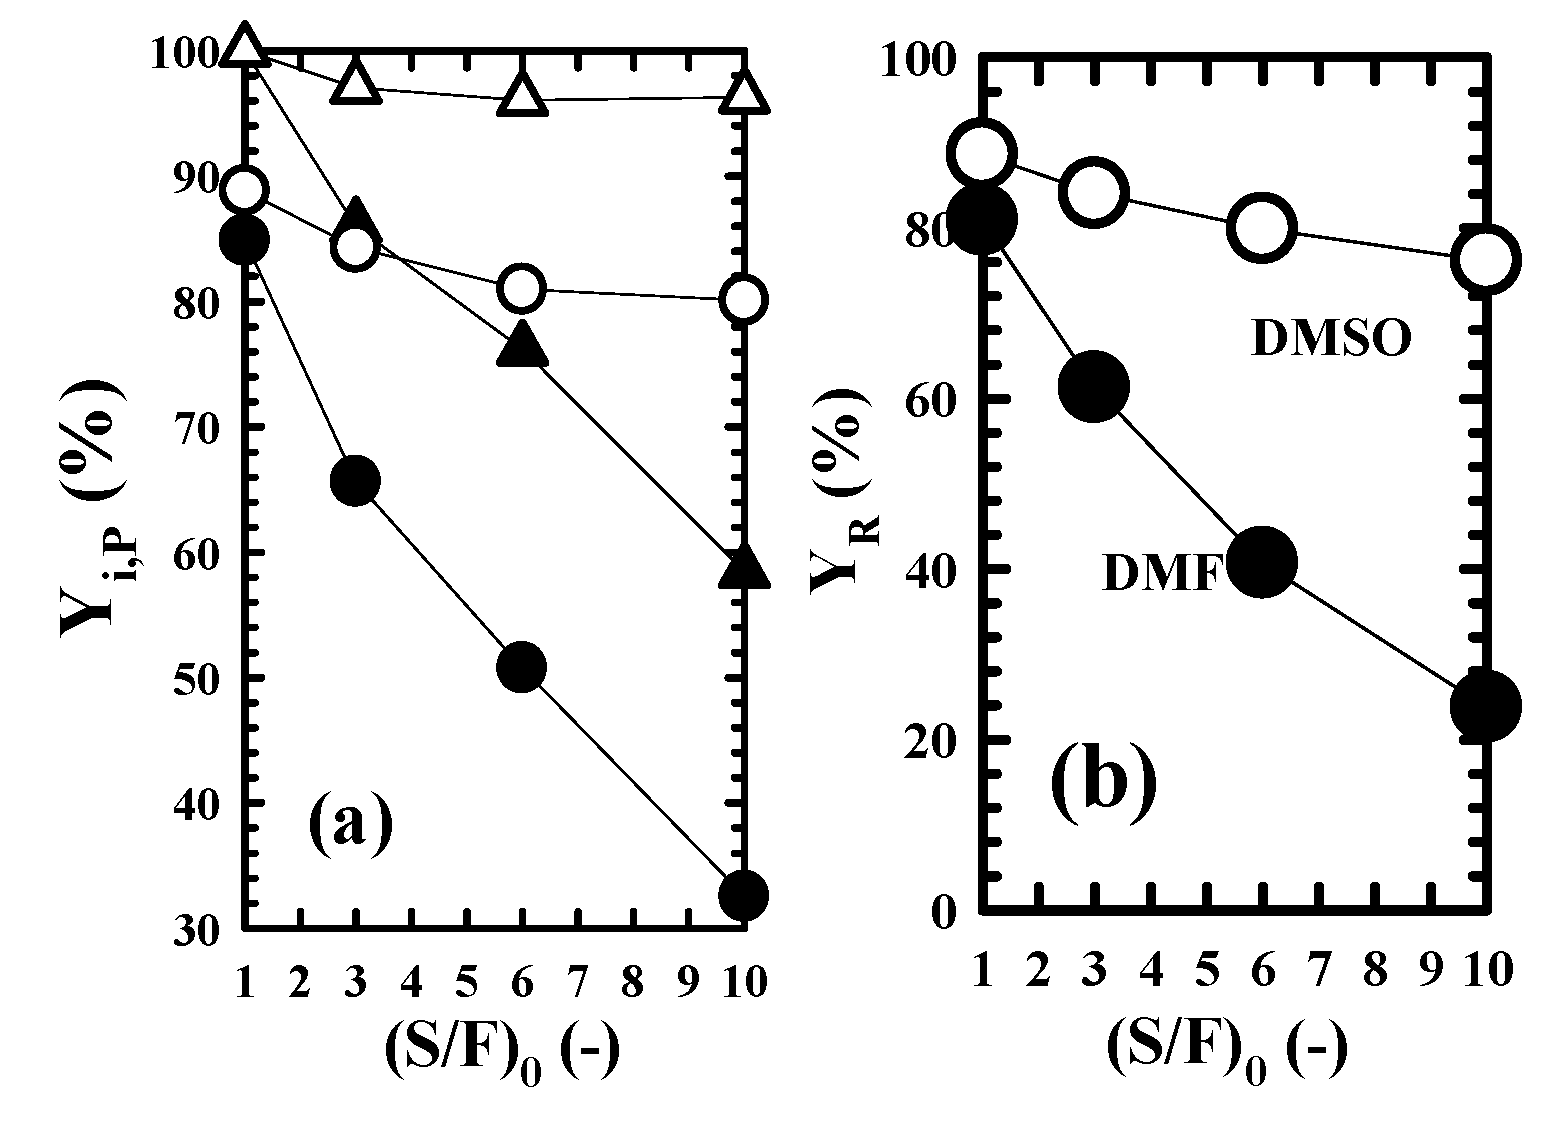
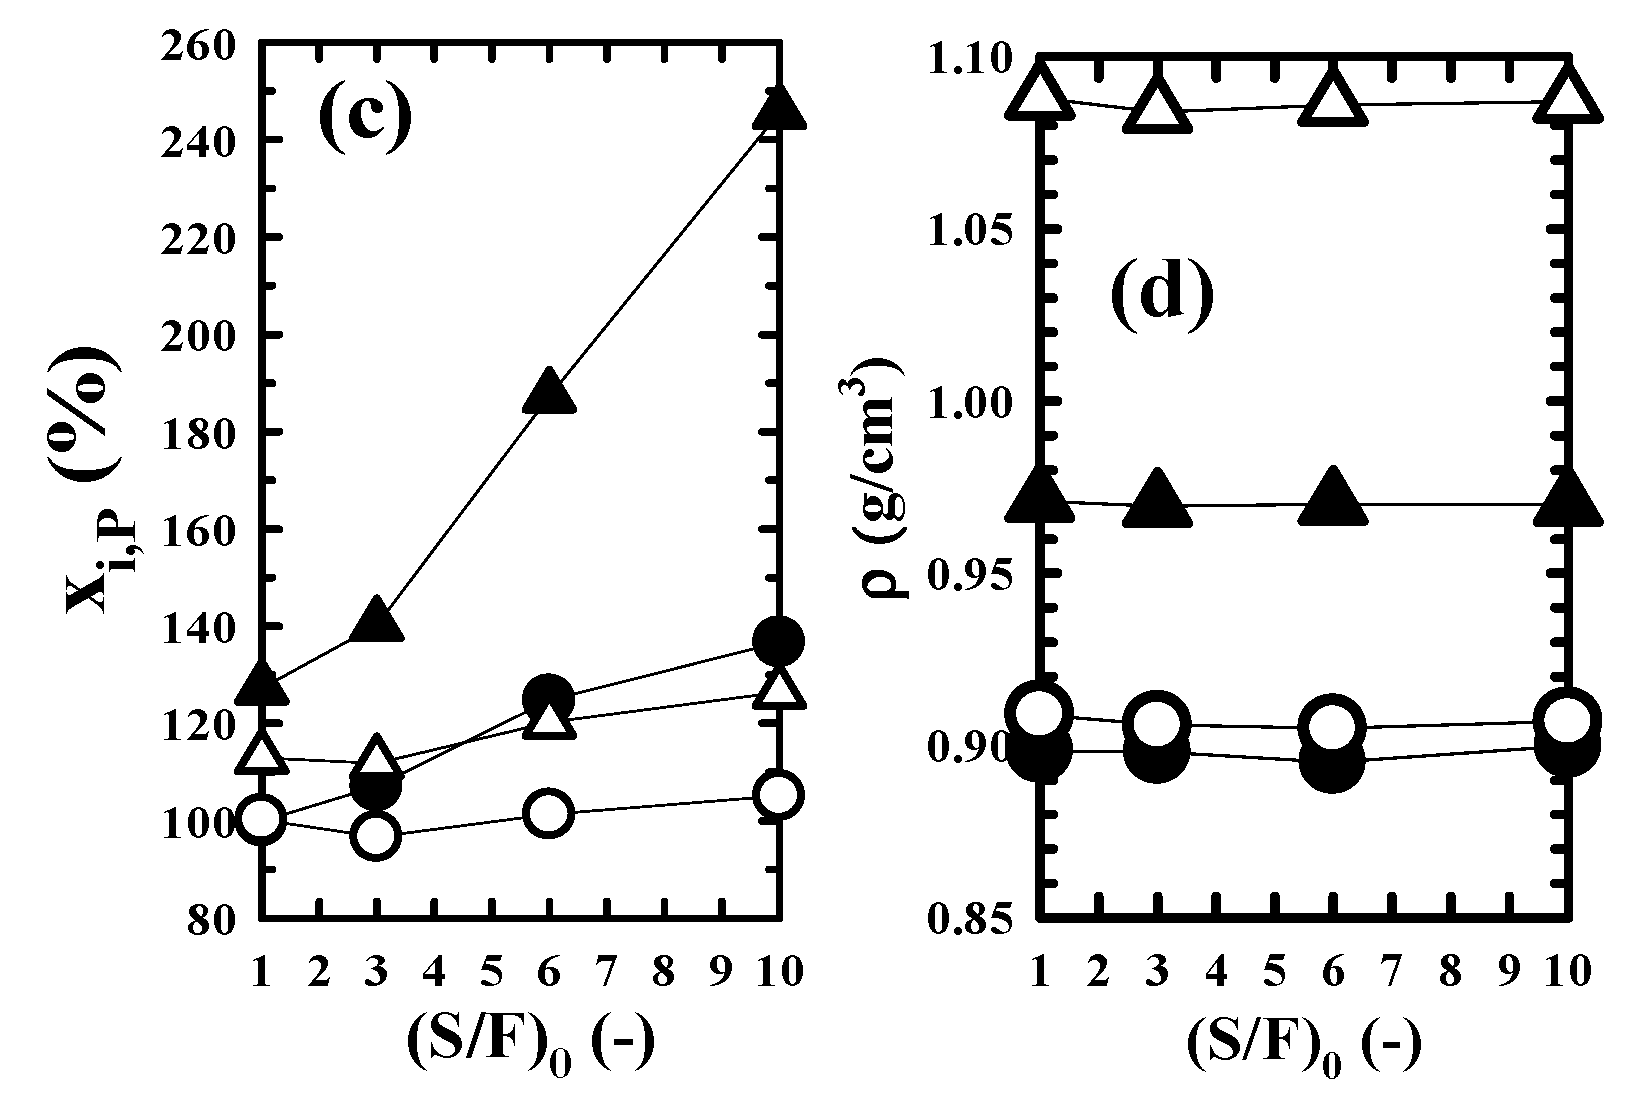
Figure 5.
Comparison of solvent for color change in raffinate according to (S/F)0. Solvent used: (a) DMF, (b) DMSO. Experimental conditions: t = 72 h, yw,0 = 0.03, T0 = 28 ℃. (I) raw material, (II) (S/F)0 = 1, (III) (S/F)0 = 3, (IV) (S/F)0 = 6 and (V) (S/F)0 = 10.
Figure 5.
Comparison of solvent for color change in raffinate according to (S/F)0. Solvent used: (a) DMF, (b) DMSO. Experimental conditions: t = 72 h, yw,0 = 0.03, T0 = 28 ℃. (I) raw material, (II) (S/F)0 = 1, (III) (S/F)0 = 3, (IV) (S/F)0 = 6 and (V) (S/F)0 = 10.

Figure 6.
Enrichment process of paraffin components in distillate of WPPO. Tower no. 1: extraction tower, Tower no. 2: stripping tower, Tower no. 3: washing tower, Tower no. 4: distillation tower.
Figure 6.
Enrichment process of paraffin components in distillate of WPPO. Tower no. 1: extraction tower, Tower no. 2: stripping tower, Tower no. 3: washing tower, Tower no. 4: distillation tower.


Table 1.
Material system and experimental conditions.
| System | |
| Raw material | Distillate a of Waste Plastic Pyrolysis Oil (WPPO) |
| Solvent | (1) aqueous solution of dimethylformamide (DMF) |
| (2) aqueous solution of dimethylsulfoxide (DMSO) | |
| Experimental Conditions | |
| Liquid-liquid contacting time, t (h) | 12–72 |
| Mass fraction of water in solvent of initial state, yw,0 (–) | 0–0.06 |
| Mass ratio of solvent to raw material of initial state, (S/F)0 (–) | 1–10 |
| Operating temperature of initial state, T0 (°C) | 28 |
a disatillate (distilling temperature: 120–350 °C) recovered by simple distillation of waste plastic pyrolysis oil (WPPO).
© 2020 by the author. Licensee MDPI, Basel, Switzerland. This article is an open access article distributed under the terms and conditions of the Creative Commons Attribution (CC BY) license (http://creativecommons.org/licenses/by/4.0/).
Share and Cite
MDPI and ACS Style
Kim, S.J. Comparison of Dimethylformamide with Dimethylsulfoxide for Quality Improvement of Distillate Recovered from Waste Plastic Pyrolysis Oil. Processes 2020, 8, 1024. https://doi.org/10.3390/pr8091024
AMA Style
Kim SJ. Comparison of Dimethylformamide with Dimethylsulfoxide for Quality Improvement of Distillate Recovered from Waste Plastic Pyrolysis Oil. Processes. 2020; 8(9):1024. https://doi.org/10.3390/pr8091024
Chicago/Turabian StyleKim, Su Jin. 2020. "Comparison of Dimethylformamide with Dimethylsulfoxide for Quality Improvement of Distillate Recovered from Waste Plastic Pyrolysis Oil" Processes 8, no. 9: 1024. https://doi.org/10.3390/pr8091024
Note that from the first issue of 2016, this journal uses article numbers instead of page numbers. See further details here.