Optimization of Synthesizing Upright ZnO Rod Arrays with Large Diameters through Response Surface Methodology


1
School of Materials Science and Engineering, Hubei University of Automotive Technology, Shiyan 442002, China
2
School of Mechanical and Automotive Engineering, Zhejiang University of Water Resources and Electric Power, Hangzhou 310018, China
3
Key Laboratory of Organic Synthesis of Jiangsu Province and the State and Local Joint Engineering Laboratory for Novel Functional Polymeric Materials, College of Chemistry, Chemical Engineering and Materials Science, Soochow University, Suzhou 215123, China
4
Department of Materials Science and Engineering, KTH Royal Institute of Technology, SE-100 44 Stockholm, Sweden
5
Department of Materials Science and Engineering, Shanghai Institute of Technology, Shanghai 201418, China
*
Authors to whom correspondence should be addressed.
Processes 2020, 8(6), 655; https://doi.org/10.3390/pr8060655
Submission received: 16 April 2020
/
Revised: 27 May 2020
/
Accepted: 29 May 2020
/
Published: 31 May 2020
(This article belongs to the Special Issue Materials Processing for Production of Nanostructured Thin Films)
Abstract
:The deposition parameters involved in chemical bath deposition were optimized by a response surface methodology to synthesize upright ZnO rod arrays with large diameters. The effects of the factors on the preferential orientation, aspect ratio, and diameter were determined systematically and efficiently. The results demonstrated that an increased concentration, elevated reaction temperature, prolonged reaction time, and reduced molar ratio of Zn2+ to tri-sodium citrate could increase the diameter and promote the preferential oriented growth along the [002] direction. With the optimized parameters, the ZnO rods were grown almost perfectly vertically with the texture coefficient of 99.62. In the meanwhile, the largest diameter could reach 1.77 μm. The obtained rods were merged together on this condition, and a dense ZnO thin film was formed.
1. Introduction
The application of nanomaterials has been extended to many fields with the development of new synthesis methods [1,2] and has brought many exciting achievements [3]. Vertically aligned ZnO rod arrays have attracted more and more research interest over the past few years because of their remarkable exhibition or unique properties and exciting potential applications, such as solar cells [4,5,6], piezoelectric nanogenerators [7,8], light emitting diodes [9,10], thermoelectrics [11,12,13,14,15], and sensors [16,17]. With tremendous applications for vertically aligned ZnO rod arrays, searching a method to control their morphologies and properties is crucial to optimize the arrays for specific tasks. In order to satisfy the demands of various applications, it is necessary to both understand the growth mechanisms of the vertically aligned ZnO rod arrays and to find a method to control the properties with the guidance of those mechanisms. In particular, certain applications require thin rods with high aspect ratios, while others necessitate thick rods with low aspect ratios. Moreover, if the rods are perfectly upright to the substrate and the rods are coarsened, the rods may merge together to form a dense ZnO thin film.
Based on the above consideration, efforts were taken to increase the diameter of the obtained ZnO rods. Moreover, the aspect ratios were also lowered by increasing the diameters. In our previous studies [18,19], ZnO rod arrays with high aspect ratios were successfully synthesized. By combining these works, the aspect ratio can be systematically and precisely controlled to meet various demands. Tri-sodium citrate has been reported as an effective surface modifier to promote the lateral growth of ZnO rods [20,21,22,23,24]. Das et al. explored ZnO morphologies’ evolution with increased citrate concentrations [20] and found that growth with excess citrate obtained spherical particles with very low crystallinity instead of rods or plates. In this work, the boundary value of the citrate concentration to get ZnO plates in Das’s work was used as the highest value of the citrate concentration, and the impact of the citrate concentration on the diameter was studied systematically in a low range. Chemical bath deposition was employed to synthesize ZnO rods arrays in this work due to its cost-efficiency, simple process, and ease to scale-up. In solution growth, the changing of other growth parameters (precursor concentration, reaction temperature, and reaction time) also contributes to the increase of the diameters. Therefore, the influences of these parameters were also investigated. Since various precursor concentrations were employed, the molar ratio of the zinc ion to the tri-sodium citrate instead of the citrate concentration was used in this work to more accurately study the impact of the citrate.
In this study, four factors, including the precursor concentration, reaction temperature, reaction time, and the molar ratio of zinc ion to the citrate, were investigated. If the conventional ‘changing one separate factor at a time’ (COST) approach was applied to optimize the parameters, plenty of experiments along with a large amount of time and money would be required. Moreover, the interactions between the factors could not be investigated, and the optimal settings of factors would be possible to miss. Therefore, it was essential to find an approach to efficiently identify the optimal parameters and to comprehensively and thoroughly guide the investigation. As a result, a powerful statistical method called the response surface methodology was employed in this work. Through this technique, multiple process variables could be varied simultaneously, and only a few experimental trials were required to identify the influence of each factor. Additionally, the interactions between variables could also be identified and quantified. Moreover, a mathematical model could be proposed to describe the synthesis processes and predict the response with specific parameters. Furthermore, a response surface plot and a 4D contour plot as a function of the independent parameters could be obtained to determine the optimal points.
In this work, vertically aligned ZnO rods arrays with large diameters were successfully synthesized. The influence of each factor on the growth quality was investigated through a comprehensive study. With the assistance of response surface methodology in this work, maps of the changing tendency were also created to predict the growth quality of the ZnO rod arrays.
2. Experimental Sections
2.1. The Pre-Treatment of the Substrates
Small pieces C-plane (0001) sapphire (Guangdong Orient Zirconic Ind Sci & Tech Co., Ltd., Shantou, China) with dimensions of 12.5 × 12.5 mm were used as the substrates in this work. A cleaning sequence developed by Kern et al. [25] was employed to pretreat the substrates. This aimed to ensure that the surface of the substrates was completely clean and hydrophilic, and then seeds could be homogenously coated onto the whole substrates during the next step. The cleaning sequence included four steps with, intermediate rinsing steps separating each chemical step. Firstly, the substrates were ultrasonicated in ethanol for 3 min to remove some of the organic contamination. Subsequently, the substrates were heated in a piranha solution (1:3, 30% H2O2/H2SO4) (Sigma–Aldrich China, Shanghai, China) at 120 °C for 30 min to remove relatively heavy organic contaminations. Thirdly, the substrates were immersed into an SC-1 solution (1:1:5 25% NH4OH/30% H2O2/Milli-Q H2O) (Sigma–Aldrich China, Shanghai, China) at 75 °C for 15 min to remove particles and metals. Finally, an SC-2 solution (1:1:6 35% HCl, VWR/30% H2O2/Milli-Q H2O) (Sigma–Aldrich China, Shanghai, China) was employed to remove the residual metals, including metals that may have been deposited in the SC-1 solution. The substrates were immersed in the SC-2 solution and heated at 75 °C for 15 min. The substrates were flash-air dried at room temperature before the seeding step.
2.2. Deposition of Seed Layers on the Substrates
The preparation procedure was done in the same manner as reported in our previous study [18]. Firstly, a droplet of a 40 µL solution of 0.01 M zinc acetate dihydrate (98%, Sigma–Aldrich China, Shanghai, China) ethanol solution was uniformly spin-coated on the pre-cleaned substrates. The spin coating parameters were set as: v = 400 rpm and t = 60 s. After the substrate was dried, the coating was repeated two additional times. This aimed to ensure that a complete and uniform layer of zinc acetate crystallites was obtained on all of the substrates. Subsequently, the coated substrates were annealed in a furnace at 500 °C for 2 h. Through the decomposition of the zinc acetate, a zinc oxide layer was yielded.
2.3. Pre-Growth of ZnO Nanorods
ZnO nanorods were grown by suspending the seeded substrates upside-down in a sealed bottle (as shown in Figure 1). In the bottle, 30 mL of a 0.05 M zinc nitrate hydrate solution (Shanghai Aladdin Biochemical Technology Co., Ltd., Shanghai, China) and 30 mL of a 0.05 M hexamethylenetetramine (HMT) aqueous solution (Shanghai Aladdin Biochemical Technology Co., Ltd., Shanghai, China) were mixed homogenously. The bottle was heated at 90 °C for 2 h. After it was cooled down, the substrates were removed and cleaned with ethanol.
2.4. Preparation of Dense ZnO Films
After the pre-growth of the ZnO nanorods, a fresh equimolar mixed solution consisting of 30 mL of zinc nitrate hydrate and 30 mL of hexamethylenetetramine (HMT) was filled into the bottles. To promote the growth along the lateral direction, a specific amount of tri-sodium citrate (Shanghai Aladdin Biochemical Technology Co., Ltd., Shanghai, China) was added into the mixed solution. Then, the substrates were mounted upside down in the bottle. Subsequently, the bottle was capped tightly and heated at a specific temperature for a certain duration. After the bottle was cooled down naturally, the samples were taken out and rinsed by ethanol.
2.5. Characterization of the Obtained ZnO Rods Arrays
The crystal structure and orientation of the obtained samples were analyzed by a powder X-ray diffractometer (XRD, PANalytical powder X-ray diffractometer with a Cu Kα1 radiation, λ = 0.15406 nm) (PANalytical, Holland). In order to characterize the degree of preferential orientation of the nanorods along the (002) plane, the relative texture coefficient (denoted as TC002) was calculated for each sample. This was the ratio of diffraction peaks (002) over (100) and (101) in XRD patterns, and it was calculated as follows:
where , and are the measured diffraction intensities of the (100), (002), and (101) planes, respectively. , , and are the corresponding values of the standard data (JCPDS 00-036-1451).
The morphologies of the obtained samples were explored by using a field emission scanning electron microscope (JEOL, JSM-7000F, Japan). The mean diameter of the obtained ZnO rods was determined as an average of ten measured rods of the top view of the SEM images. The aspect ratio was calculated as the ratio of the rod length to the mean diameter. Photoluminescence was tested by a Photoluminescence spectrophotometer (Varian CaryEclipse, US). The spectra were examined by using a He–Cd laser with an excitation wavelength of 279 nm at room temperature.
2.6. Experimental Design
The design of the experiments and the analysis of the obtained results were guided by the commercial software MODDE (version 10, Umetrics, Umeå, Sweden, 2015). The response surface methodology (RSM) was employed to build models, to assess the effect of factors, and to identify the optimal conditions. The significance and adequacy of the model was tested by ANOVA. Additionally, response surface plots and 4D contour plots were also created to find the optimal parameters. Moreover, a one-pair-at-a-time main effect analysis was also applied to investigate the impact of the factors on the responses.
3. Results and Discussion
3.1. Optimization of the Experimental Parameters
In this work, the following four experimental factors were studied: (i) the concentration of Zn2+ (c), (ii) reaction temperature (T), (iii) reaction time (t), and (iv) the molar ratio of Zn2+ to tri-sodium citrate (R). A central composite face (CCF) design composed of a full factorial design and star points placed on the faces of the sides was employed in this stage. The detailed parameters of the design and the achieved results are listed in Table 1. Obviously, most of achieved texture coefficients were above 90, indicating a good oriented growth along the [0002] direction. Most of the aspect ratios were limited in the range of 1–3, which was largely decreased compared to the results reported in our previous work [18]. Moreover, the values of diameters were varied in a broad range, which would meet various demands for different applications [26,27].
The outputs of the responses were analyzed by the MODDE software, and a model was built. Several evaluating tools were employed to investigate the adequacy of the model and to determine the changing tendency of the response with the factors. Firstly, the ANOVA was conducted to evaluate the adequacy of the model. The tabulated output is presented in Table 2. As mentioned in our previous study [28], a regression model is significant and has no lack of fit if the first p value is smaller than 0.05. Therefore, the model for the diameter was valid and adequate, while the other two models were insignificant. This was because that most values of the obtained texture coefficients and most of aspect ratios were limited in a narrow range, while only a few values were scattered away from the region. Thus, the effect of the reaction parameters was not significant enough to be detected in the selected range of the parameters. In other words, good alignment could be obtained in most cases within the selected ranges in Table 1. In our previous work [18], ZnO rods with texture coefficient higher than 0.95 were always obtained on condition of c = 0.06 − 0.1 M, T ≥ 70 °C, and t ≥ 6 h. In comparison, there was a slight decrease for most values of texture coefficient in this work, and several values were even far away from 90%. This suggests that the tri-sodium citrate may have had a slight effect on the preferential oriented growth. With respect to the aspect ratio, most of the values were limited in a narrow range 1–3 μm, which was reduced to a large extent compared to the previous results [18]. This reflects that the aspect ratio could be efficiently controlled by the addition of tri-sodium citrate.
Since the model of diameters was valid, a fitted regression equation was established by using partial least squares projections to investigate the relationship between the diameter and the independent parameters:
where D presents diameter, c is the concentration of the precursor, T is the reaction temperature, t is the reaction time, and R is the molar ratio of Zn2+ to tri-sodium citrate.
Figure 2 shows the plot of the observed against predicted diameters. More specifically, the observed values were from the experimental diameters, while the predicted ones were calculated from the above equation. It was obvious that almost all of the observed values were very close to the predicted ones in Figure 2. This means that the model was adequate and it had a good prediction power. Moreover, as the R2 value 0.89 was close to the ideal value 1, the regression model fit the raw data well. Therefore, the model of diameter could be regarded to be an adequate model for the prediction of diameters.
A scaled and centered coefficients plot, as shown in Figure 3, was applied to investigate the effects of the parameters. If the confidence interval of the factor did not cross the horizontal axis, the corresponding factor could be determined as a significant parameter for the response. To illustrate, the linear terms (c, t, and R), the square term t2, and the interaction terms (c*T, T*t, T*R, and t*R) were identified as significant parameters for the diameters. In addition, the diameters is increased with an increased concentration (c), reaction time (t), and interactions between the concentration and reaction temperature (c*T). On the other hand, the increase of the molar ratio (R), the quadratic of reaction time (t2), and the interaction terms T*t, T*R, and t*R decreased the diameters. What should be noted is that there was one optimal point for the reaction time to achieve the largest diameter due to the negative effect of t2 and the positive effect of t.
To further understand the changing tendency of the response with the parameters, the response surface plots and response 4D contour plot are depicted. In the response surface plot, two parameters were used as two axes, while the other two parameters were kept at their middle levels. Figure 4 shows the response surface plots of the diameters. Since the interaction terms c*T, T*t, T*R, and t*R were detected in Figure 3, the response surface plots using them as axes are depicted in Figure 4a–d, respectively. It can be seen from Figure 4a that an increased precursor concentration and elevated reaction temperature were advantageous to the coarsening of the rods. The curved surface in Figure 4b shows that there was an optimal region at 11–16 h for the reaction time to achieve the biggest diameters. This was in a good agreement with the conclusion obtained from the scaled and centered coefficients plot. Both of the surfaces in Figure 4c,d show that diameters were increased with a reduced molar ratio, which certified the conclusion achieved in Figure 3. Additionally, Figure 4d shows that the biggest diameter could always be obtained in an optimal region of 11–16 h for the reaction time. This certificated the existence of the optimal region for reaction time again.
Figure 5 displays the response 4D contour plot of the diameters, which gives an overall view of the changing tendency of the response. Similar to the conclusion from Figure 3, an optimal region for reaction time to achieve the largest diameter could also be detected but with a narrow range of 11–13 h. The comparison among the three columns certified again that the diameter increases with an increased concentration. Moreover, the interactions between the factors could also be clearly observed from the curved lines in Figure 5. Apparently, when both the concentration and reaction temperature were set as their high level, ZnO rods with large diameters could always be obtained. This was consistent with the results obtained from Figure 4a. Furthermore, the required process parameters for the specific diameter could be easily found, which made the practical process efficient.
Since the models of the texture coefficients and aspect rations had a lack of fit, they could not be fitted by MODDE. On this condition, a one-pair-at-a-time main effect analysis was instead applied to identify good factor settings. With this method, the experiments were grouped into pairs where only one factor was varied. The first sixteen experiments were selected to illustrate this method, and the plots for texture coefficients and aspect ratios are shown in Figure 6 and Figure 7, respectively. In these two figures, it is evident that the changing tendency of the response with the factors was complicated. However, the general tendency could still be identified. For instance, in Figure 6, the texture coefficient can be seen to have increased with an increased concentration, an elevated reaction temperature, and a prolonged reaction time in most cases. The preference for molar ratio was not obvious. Moreover, the texture coefficient could always reach the value larger than 90% when the reaction temperature was set to 16 h. In the meantime, the value of texture coefficient was always below 85% when the parameters were set as c = 0.06 M, T = 70 °C, and t = 6 h. In terms of aspect ratio, there was no obvious preference for precursor concentration and reaction temperature. However, the decrease of reaction time and increase of molar ratio favored the increase of aspect ratio in most cases. Furthermore, aspect ratio higher than 8 could always be obtained with the parameters c = 0.06 M, T = 80 °C, and R = 1500.
In summary, the preferential growth along the [0002] direction was favored when the concentration, reaction temperature, and reaction time were set at the high level while the molar ratio was set at the low level. Moreover, the aspect ratio was increased by shortening the reaction time and increasing the molar ratio. Furthermore, the diameters of the obtained ZnO rods were increased with the increased concentration and reduced molar ratio. There was an optimal region of reaction time of 11–13 h to get the largest diameter. On the condition of high reaction temperature and high precursor concentration, a large diameter could always be obtained. In combining the above results to achieve ZnO rods with high preferential orientation and big diameter, the precursor concentration, reaction temperature, reaction time, and molar ratio should be set as 0.1 M, 90 °C, 16 h, and 500, respectively. The optimal condition was exact the experimental setup of sample No. 8, where both the texture coefficient and the diameter got the largest values.
The mechanism for the effect of the significant factors including concentration, reaction time, and molar ratio can be elucidated as follows: Due to the addition of tri-sodium citrate, the growth rate of the (0001) facets was suppressed. The narrow distribution of the length of 1–3 μm directly reflected this suppression. On this condition, the increase of the concentration promoted the thickening of the rods. Similarly, when R was reduced, the amount of the tri-sodium citrate was correspondingly increased. Consequently, the suppression of the growth along the [0001] direction was stronger and the diameter was increased. Compared to the obtained diameters of 100–150 nm in our previous study [18] without the addition of tri-sodium citrate, the diameter was increased to a large extent in this work. With respect to the reaction time, the rods got thickening before 12 h. This was reasonable because a prolonged reaction time was favorable for the lateral growth. However, the slight reduction after 12 h is difficult to explain. More investigation needs to carry out.
3.2. Structure and Morphologies of the Obtained ZnO Rod Arrays
The synthetic approach in this work enabled the production of dense microstructures for all of samples. The morphologies evolved with an increased diameter. Figure 8a–d shows the typical SEM images of these structures. For all the samples, since the ZnO seeds may have been spanned off at the edge of the sample and rod arrays were formed through spatially confined oriented growth, the rods on edges were randomly oriented. The corresponding SEM images are shown in Figure S1 in the Supplemental Information. However, the obtained ZnO rods were vertically and homogenously aligned in the center. Therefore, all the SEM images in this work were taken in the center of each sample, and the lengths and diameters were averaged over 20 randomly picked rods. Apparently, the obtained structures were denser with an increased diameter. In Figure 8a, the mean diameter can be seen to be 0.29 μm, and the rods are individual. When the mean diameter was increased to 0.43 μm in Figure 8b, the rods started to merge with each other. In Figure 8c, the diameter was further increased to 0.66 μm, all the rods were merged into each other and a dense thin film was formed according to the corresponding cross-sectional SEM images. However, further increasing the diameter caused secondary growth, as shown in Figure 8d. Layered structures were produced on top of the rod arrays on this condition. The corresponding XRD patterns of the samples are also shown in Figure 8e for the investigation the crystal structures. It is evident that all of the samples had a dominated preferential orientation along the [002] direction. More specifically, for samples 24 and 8, the (100) and (101) peaks were almost invisible, and perfectly (002) oriented growth was obtained. This was consistent with the morphologies observed from the corresponding cross sectional SEM images in Figure 8c,d. In contrast, the observation of the (100) and (101) peaks in the patterns of samples 11 and 21 indicated the slight inclining of the obtained rods.
3.3. Photoluminescence Spectra of the Obtained ZnO Rod Arrays
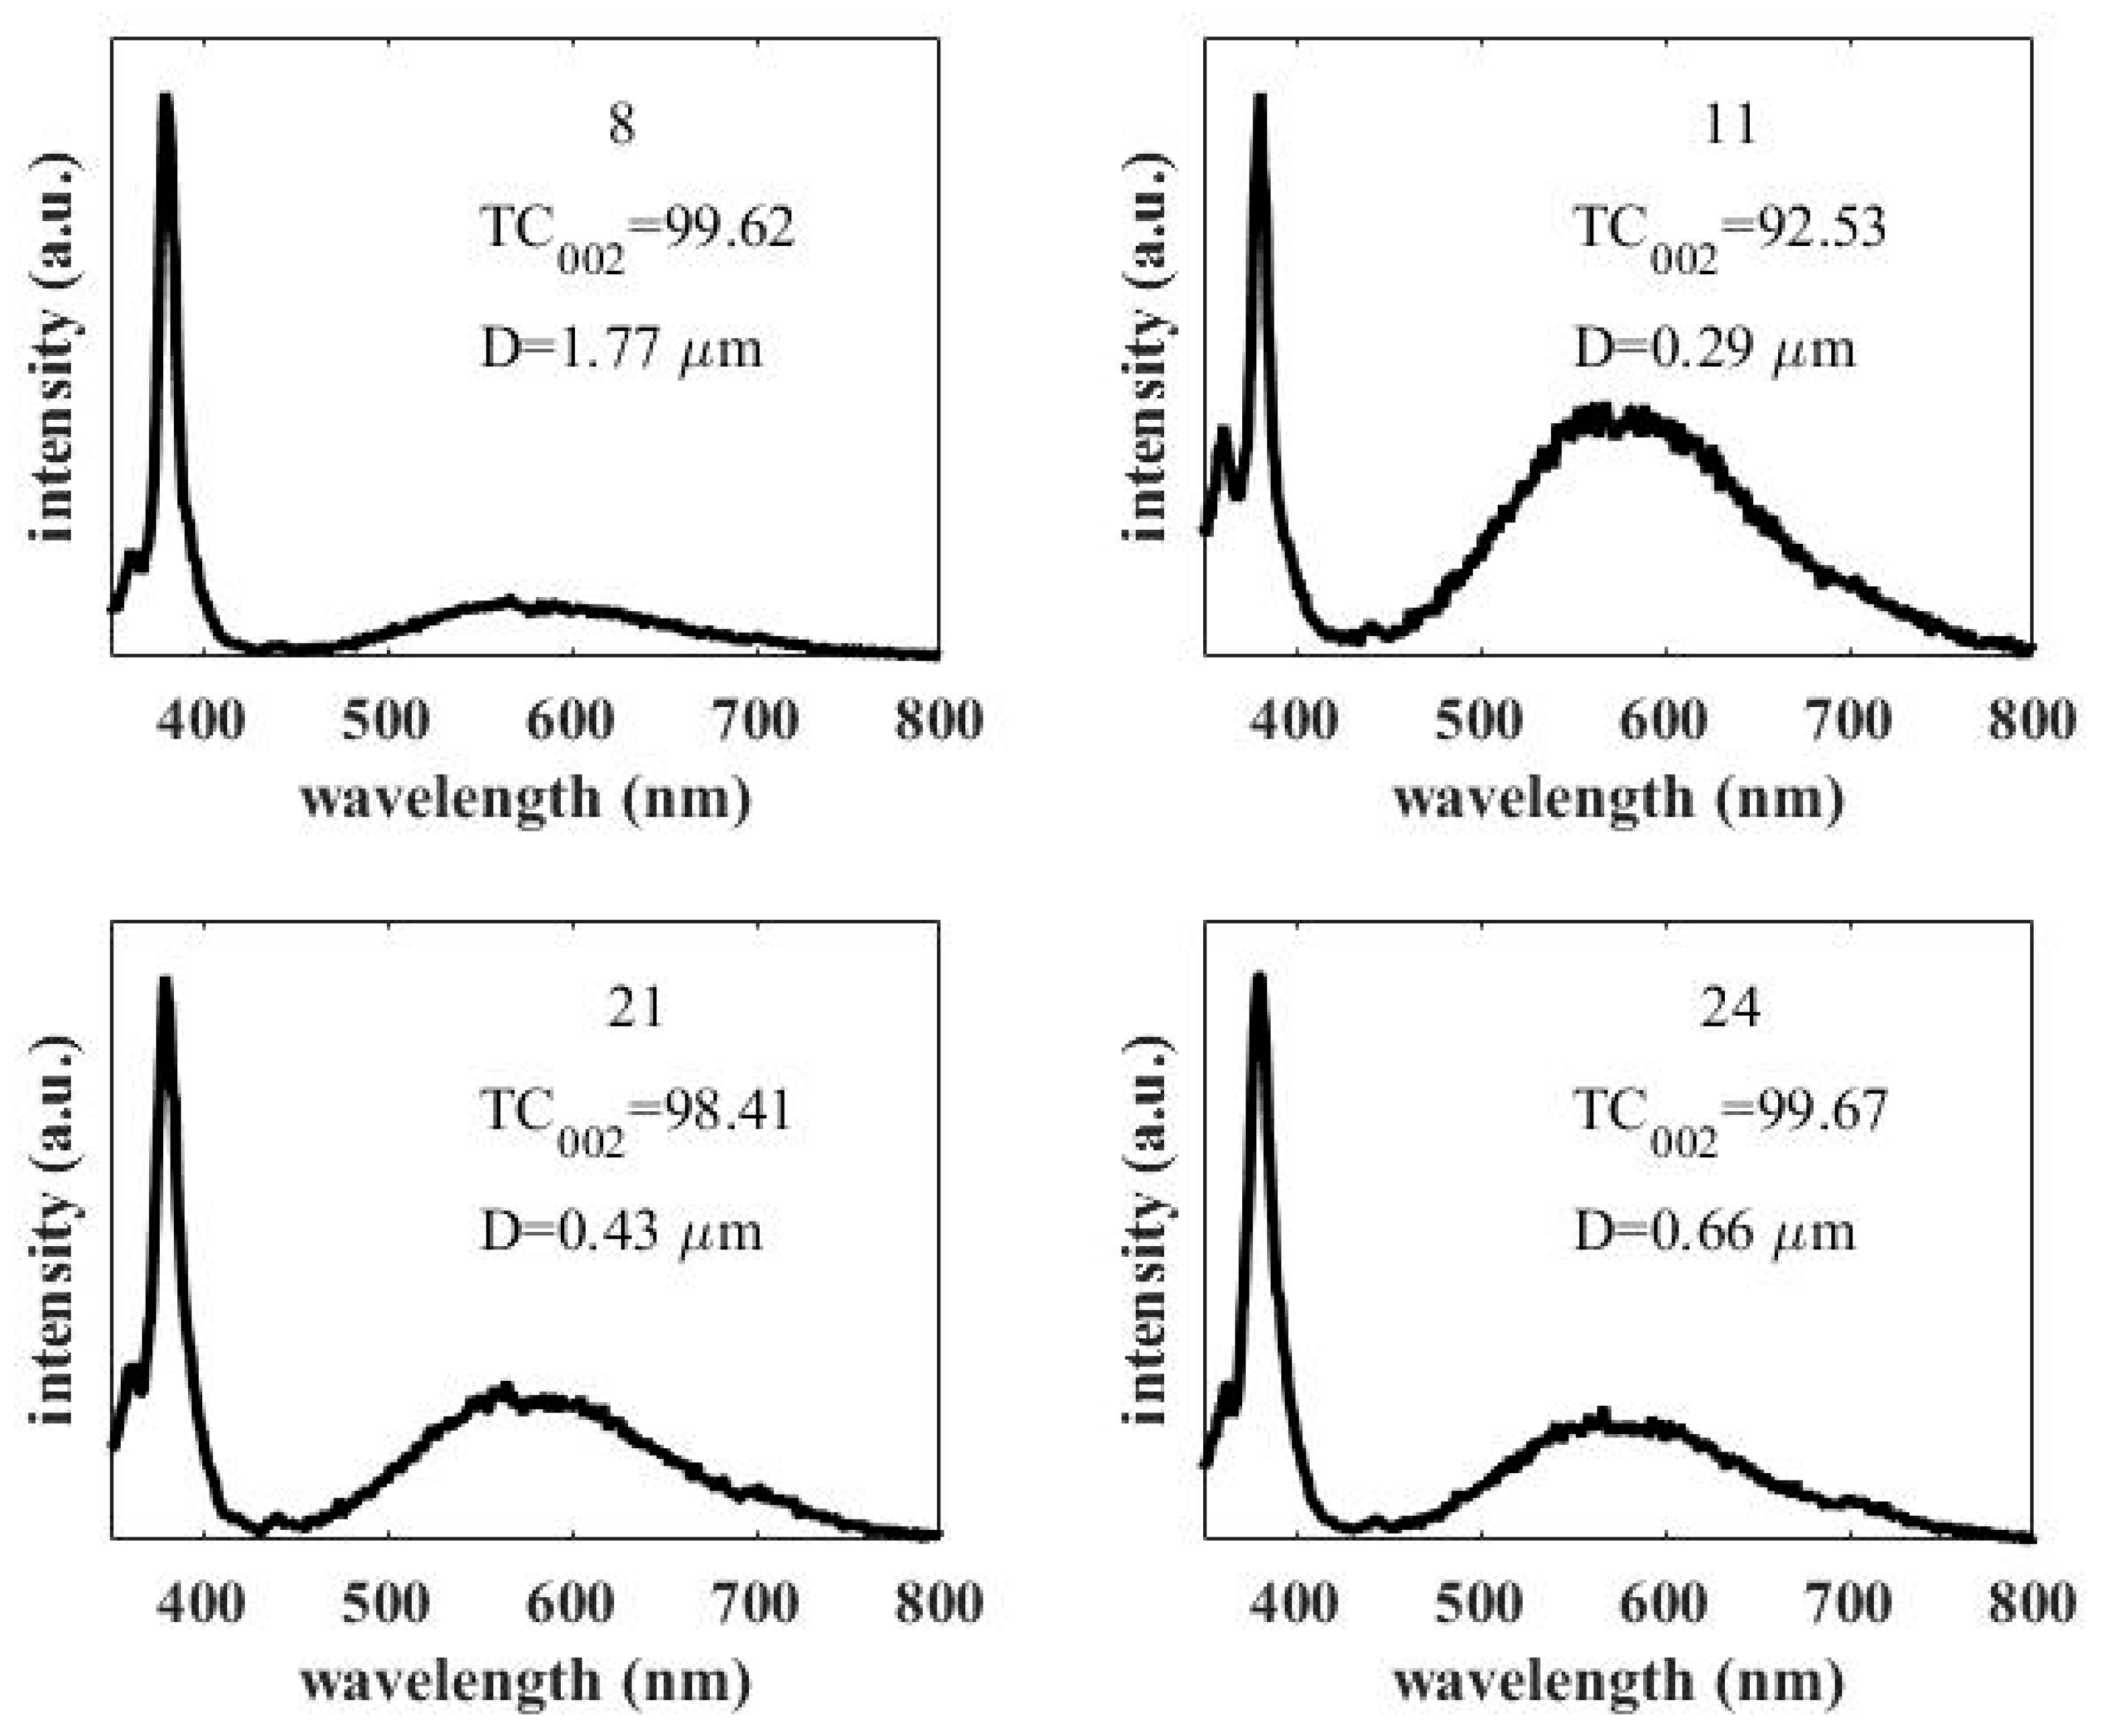
The room temperature PL spectra of the obtained ZnO rods were measured to investigate the optical properties of the obtained ZnO rod arrays. If the spectra of all the samples are depicted and discussed here, the paper would be too long. Therefore, only the PL spectra of the four samples selected in Figure 8 are presented here, as shown in Figure 9. There were two peaks in the spectra. One was a strong near-band edge UV emission peak located at ~379 nm which originated from the recombination of the electrons from conduction bands to valence bands. The other was a broad visible band ranging between 500 and 650 nm. This was a defect related deep level emission induced by the defects of O vacancies, Zn interstitials, or their complexes. It was evident that the photoluminescence properties of the obtained ZnO rod arrays were related to the texture coefficient and the diameter. Apparently, the higher the texture coefficient, the lower the intensity of the broad-band emission. This indicated that the sample with higher texture coefficient had fewer defects and better crystal quality. Comparing the spectra of sample 8 and 24, which had almost the same texture coefficient, the crystal quality was better when the diameter was larger. This can be explained as follows: ZnO rod arrays were obtained by spatially confined oriented growth (as explained in our previous work [19]), so less random orientation close to the substrate appeared when the diameter was larger. Therefore, fewer boundaries were obtained when the rods merged together and the crystal quality was better. What should be noted is that the decrease of the intensity of the broad visible band may also have been related to the location of defects. It has been suggested that defects that are optically active are situated at the near surface of ZnO nanowires [29], while the NBE peak could be attributed to the whole volume of the nanowire. Therefore, larger diameter rods had a smaller surface area to volume ratio that could have caused the reduced DLE peak relative to the NBE peak. Both the above two mechanisms were related to the fewer surfaces of rods with larger diameters, i.e., increased crystal qualities.
4. Conclusions
In this study, vertically aligned ZnO rods arrays with large diameters were successfully synthesized by using a chemical bath deposition method. With the assistance of response surface methodology, the oriented growth, aspect ratio, and diameter could be systematically controlled. The changing tendency of the three responses with the involved factors was mapped, and the required parameters to achieve the specific values of response could be efficiently found. With the optimized parameters, the maximum value of texture coefficient and diameter could reach 99.62 and 1.77 μm, respectively. On this condition, the rods were merged together, and a dense ZnO thin film was formed.
Supplementary Materials
The following are available online at https://www.mdpi.com/2227-9717/8/6/655/s1, Figure S1: The SEM image of obtained ZnO rods in the edge of the samples. Figure S2: The enlarged cross-sectional images of the obtained ZnO rod arrays, corresponding to Figure 8 in the manuscript. All authors have read and agreed to the published version of the manuscript
Author Contributions
Conceptualization, Y.C.; data curation, X.S. and Y.C.; formal analysis, X.S. and Z.Z.; investigation, X.S.; methodology, Y.C., Y.Y. and Z.Z.; project administration, Y.C.; writing—original draft, X.S.; writing—review and editing, Y.C., Y.Y., and Z.Z. All authors have read and agreed to the published version of the manuscript.
Funding
The APC was funded by the China Postdoctoral Science Foundation (Grant No. 2019M651945); Research Project of Hubei Provincial Education Department (Q20191802); Doctoral Research Startup Fund in Hubei University of Automotive Technology (K201802); Hubei Provincial Natural Science Foundation of China (2020CFBXXX).
Conflicts of Interest
The authors declare no conflict of interest.
References
- Xiong, S.; Ma, J.; Volz, S.; Dumitrică, T. Thermally-Active Screw Dislocations in Si Nanowires and Nanotubes. Small 2014, 10, 1756–1760. [Google Scholar] [CrossRef] [PubMed]
- Zhou, Y.; Xiong, S.; Zhang, X.; Volz, S.; Hu, M. Thermal transport crossover from crystalline to partial-crystalline partial-liquid state. Nat. Commun. 2018, 9, 4712. [Google Scholar] [CrossRef] [PubMed] [Green Version]
- Xiong, S.; Selli, D.; Neogi, S.; Donadio, D. Native surface oxide turns alloyed silicon membranes into nanophononic metamaterials with ultralow thermal conductivity. Phys. Rev. B 2017, 95, 180301. [Google Scholar] [CrossRef] [Green Version]
- Liang, Z.; Gao, R.; Lan, J.-L.; Wiranwetchayan, O.; Zhang, Q.; Li, C.; Cao, G. Growth of vertically aligned ZnO nanowalls for inverted polymer solar cells. Sol. Energy Mater. Sol. Cells 2013, 117, 34–40. [Google Scholar] [CrossRef]
- Lai, F.-I.; Yang, J.-F.; Hsu, Y.-C.; Kuo, S.-Y. Omnidirectional light harvesting enhancement of dye-sensitized solar cells decorated with two-dimensional ZnO nanoflowers. J. Alloy. Compd. 2020, 815, 152287. [Google Scholar] [CrossRef]
- Chandrasekhar, P.; Dubey, A.; Qiao, Q. High efficiency perovskite solar cells using nitrogen-doped graphene/ZnO nanorod composite as an electron transport layer. Sol. Energy 2020, 197, 78–83. [Google Scholar] [CrossRef]
- Wang, Z.L.; Zhu, G.; Yang, Y.; Wang, S.; Pan, C. Progress in nanogenerators for portable electronics. Mater. Today 2012, 15, 532–543. [Google Scholar] [CrossRef]
- Jin, C.; Hao, N.; Xu, Z.; Trase, I.; Nie, Y.; Dong, L.; Closson, A.; Chen, Z.; Zhang, J.X. Flexible piezoelectric nanogenerators using metal-doped ZnO-PVDF films. Sensors Actuators A Phys. 2020, 305, 111912. [Google Scholar] [CrossRef]
- Chen, M.-T.; Lu, M.-P.; Wu, Y.-J.; Song, J.; Lee, C.-Y.; Lu, M.-Y.; Chang, Y.-C.; Chou, L.-J.; Wang, Z.L.; Chen, L.J. Near UV LEDs Made with in Situ Doped p-n Homojunction ZnO Nanowire Arrays. Nano Lett. 2010, 10, 4387–4393. [Google Scholar] [CrossRef]
- Deng, G.; Zhang, Y.; Yu, Y.; Han, X.; Wang, Y.; Shi, Z.; Dong, X.; Zhang, B.; Du, G.; Liu, Y. High-Performance Ultraviolet Light-Emitting Diodes Using n-ZnO/p-hBN/p-GaN Contact Heterojunctions. ACS Appl. Mater. Interfaces 2020, 12, 6788–6792. [Google Scholar] [CrossRef]
- Jood, P.; Mehta, R.J.; Zhang, Y.; Peleckis, G.; Wang, X.; Siegel, R.W.; Borca-Tasciuc, T.; Dou, S.; Ramanath, G. Al-Doped Zinc Oxide Nanocomposites with Enhanced Thermoelectric Properties. Nano Lett. 2011, 11, 4337–4342. [Google Scholar] [CrossRef] [PubMed]
- Ong, K.; Singh, D.J.; Wu, P. Analysis of the thermoelectric properties ofn-type ZnO. Phys. Rev. B 2011, 83, 115110. [Google Scholar] [CrossRef]
- Xiong, S.; Sääskilahti, K.; Kosevich, Y.A.; Han, H.; Donadio, D.; Volz, S. Blocking Phonon Transport by Structural Resonances in Alloy-Based Nanophononic Metamaterials Leads to Ultralow Thermal Conductivity. Phys. Rev. Lett. 2016, 117, 025503. [Google Scholar] [CrossRef] [PubMed]
- Xiong, S.; Latour, B.; Ni, Y.; Volz, S.; Chalopin, Y. Efficient phonon blocking in SiC antiphase superlattice nanowires. Phys. Rev. B 2015, 91, 224307. [Google Scholar] [CrossRef]
- Sheng, X.; Li, Z.; Cheng, Y. Electronic and Thermoelectric Properties of V2O5, MgV2O5, and CaV2O5. Coatings 2020, 10, 453. [Google Scholar] [CrossRef]
- Menzel, A.; Subannajui, K.; Güder, F.; Moser, D.; Paul, O.; Zacharias, M. Multifunctional ZnO-Nanowire-Based Sensor. Adv. Funct. Mater. 2011, 21, 4342–4348. [Google Scholar] [CrossRef]
- Vinoth, E.; Gopalakrishnan, N. Fabrication of interdigitated electrode (IDE) based ZnO sensors for room temperature ammonia detection. J. Alloy. Compd. 2020, 824, 153900. [Google Scholar] [CrossRef]
- Cheng, Y.; Wang, J.; Jönsson, P.G.; Zhao, Z. Optimization of high-quality vertically aligned ZnO rod arrays by the response surface methodology. J. Alloy. Compd. 2015, 626, 180–188. [Google Scholar] [CrossRef]
- Cheng, Y.; Wang, J.; Jönsson, P.G.; Zhao, Z. Improvement and optimization of the growth quality of upright ZnO rod arrays by the response surface methodology. Appl. Surf. Sci. 2015, 351, 451–459. [Google Scholar] [CrossRef]
- Das, S.; Dutta, K.; Pramanik, A. Morphology control of ZnO with citrate: A time and concentration dependent mechanistic insight. CrystEngComm 2013, 15, 6349. [Google Scholar] [CrossRef]
- Nicholas, N.J.; Franks, G.; Ducker, W.A. Selective Adsorption to Particular Crystal Faces of ZnO. Langmuir 2012, 28, 7189–7196. [Google Scholar] [CrossRef] [PubMed]
- Lifson, M.L.; Levey, C.; Gibson, U.J. Diameter and location control of ZnO nanowires using electrodeposition and sodium citrate. Appl. Phys. A 2013, 113, 243–247. [Google Scholar] [CrossRef]
- Suwanboon, S.; Somraksa, W.; Amornpitoksuk, P.; Randorn, C. Effect of trisodium citrate on the formation and structural, optical and photocatalytic properties of Sr-doped ZnO. J. Alloy. Compd. 2020, 832, 154963. [Google Scholar] [CrossRef]
- Li, Z.; Zhang, L.; He, X.; Bensong, C.; Chen, B. Urchin-like ZnO-nanorod arrays templated growth of ordered hierarchical Ag/ZnO hybrid arrays for surface-enhanced Raman scattering. Nanotechnology 2020, 31, 165301. [Google Scholar] [CrossRef] [PubMed]
- Reinhardt, K.A.; Reidy, R.F. Handbook for Cleaning for Semiconductor Manufacturing: Fundamentals and Applications; John Wiley & Sons: Hoboken, NJ, USA, 2011; Volume 67. [Google Scholar]
- Xiong, S.; Yang, K.; Kosevich, Y.A.; Chalopin, Y.; D’Agosta, R.; Cortona, P.; Volz, S. Classical to Quantum Transition of Heat Transfer between Two Silica Clusters. Phys. Rev. Lett. 2014, 112, 114301. [Google Scholar] [CrossRef] [PubMed] [Green Version]
- Ouyang, B.; Xiong, S.; Yang, Z.; Jing, Y.; Wang, Y. MoS 2 heterostructure with tunable phase stability: Strain induced interlayer covalent bond formation. Nanoscale 2017, 9, 8126–8132. [Google Scholar] [CrossRef] [PubMed] [Green Version]
- Cheng, Y.; Jönsson, P.G.; Zhao, Z. Controllable fabrication of large-area 2D colloidal crystal masks with large size defect-free domains based on statistical experimental design. Appl. Surf. Sci. 2014, 313, 144–151. [Google Scholar] [CrossRef]
- Liao, Z.-M.; Zhang, H.; Zhou, Y.; Xu, J.; Zhang, J.-M.; Yu, D. Surface effects on photoluminescence of single ZnO nanowires. Phys. Lett. A 2008, 372, 4505–4509. [Google Scholar] [CrossRef]
Figure 1.
The scheme of the reactor.
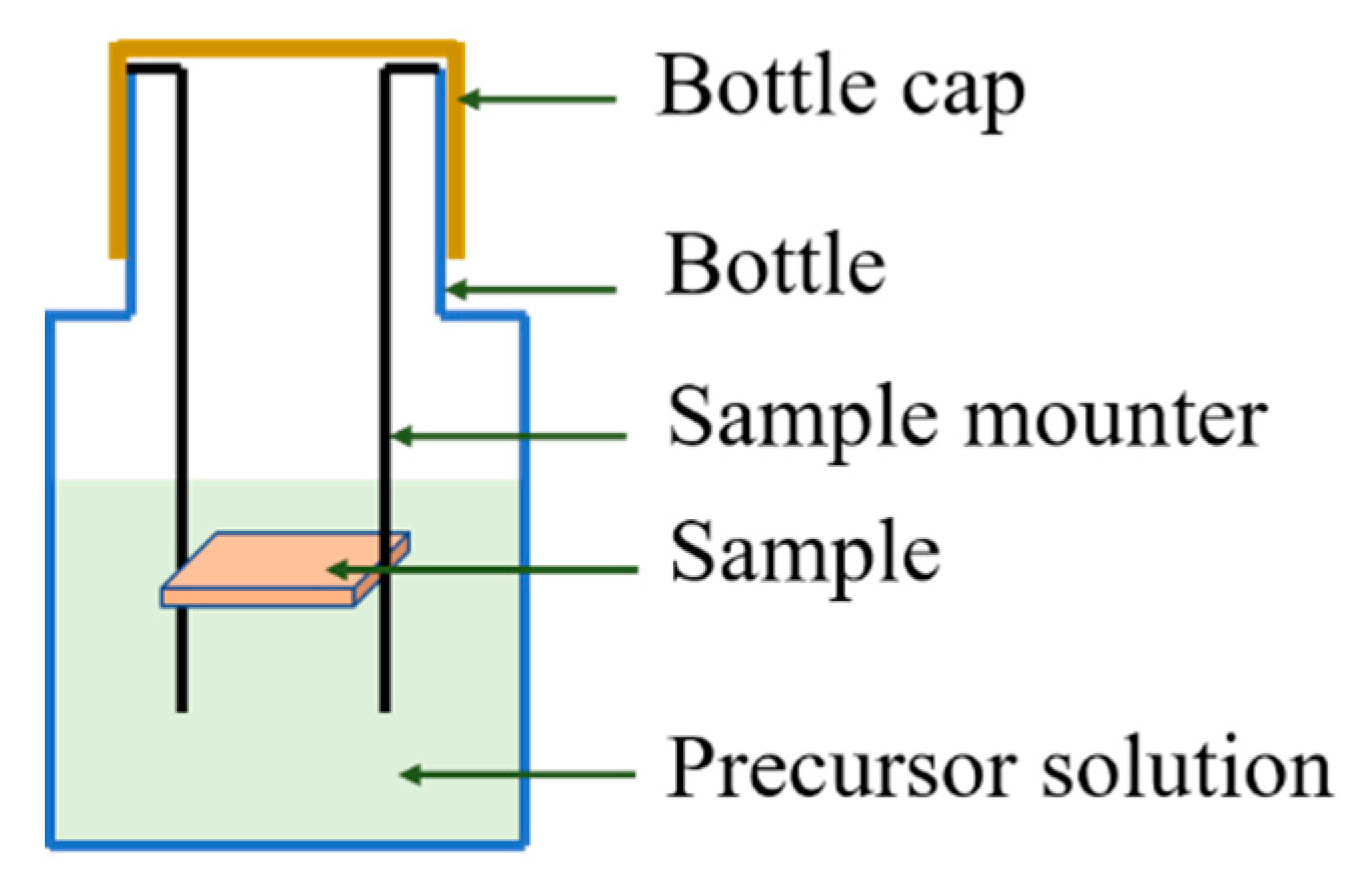
Figure 2.
The observed versus predicted values of the diameters.
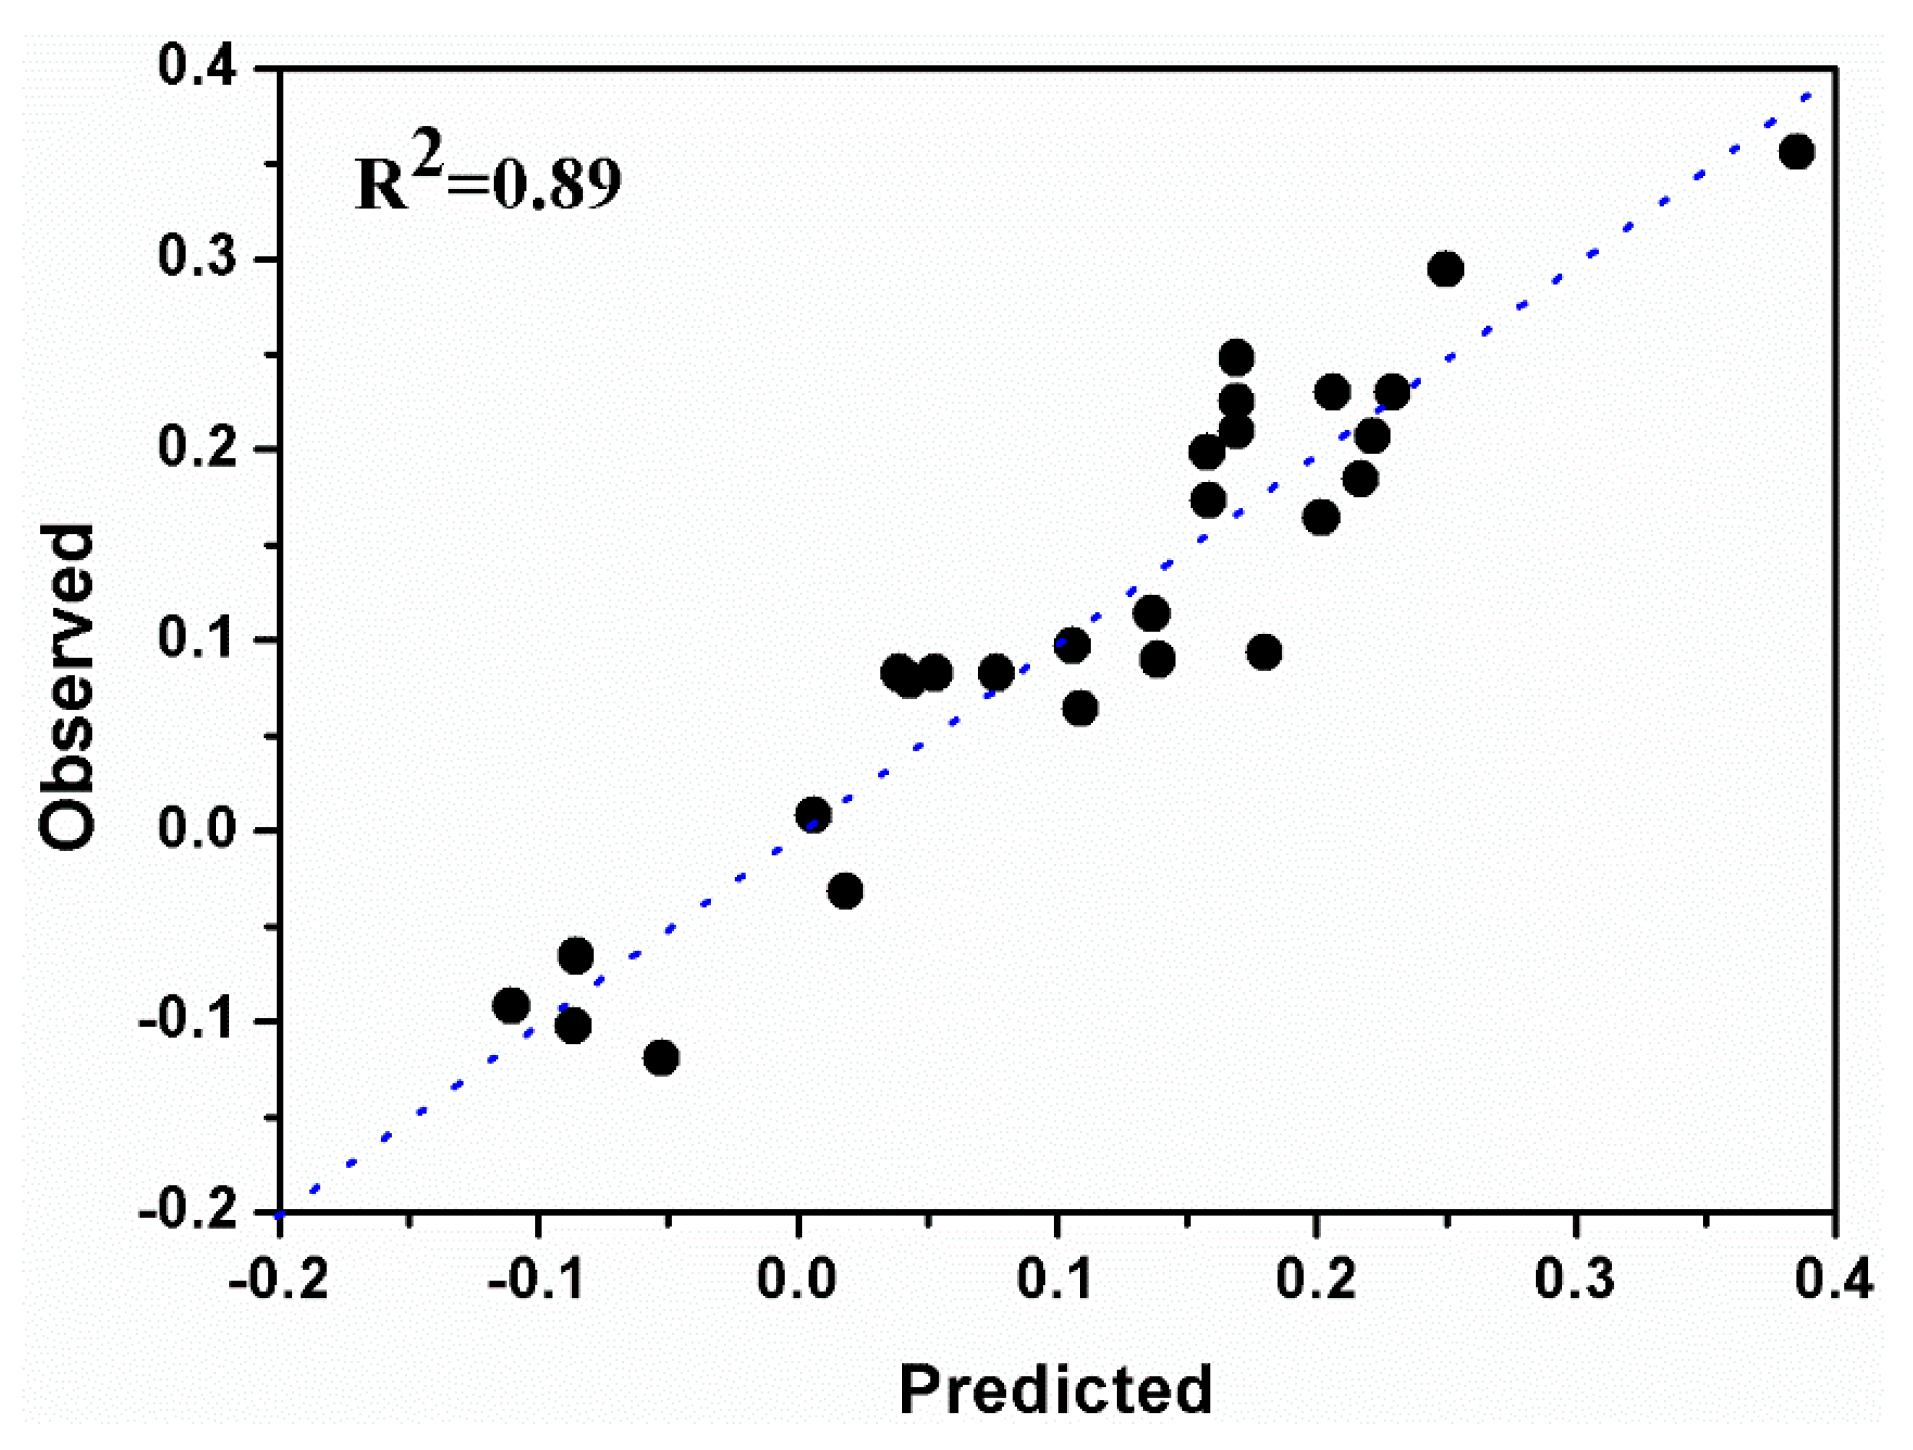
Figure 3.
The scaled and centered coefficients plot of the diameters.

Figure 4.
The response surface plots of the diameters with varied parameters while the other two parameters were fixed: (a) varied the concentration of Zn2+ (c) and reaction temperature (T), while reaction time (t) = 11h and the molar ratio of Zn2+ to tri-sodium citrate (R) = 1000; (b) varied t and T while c = 0.08 M and R = 1000; (c) varied R and T while c = 0.08 M and t = 11 h; and (d) varied R and t, while c = 0.08 M and T = 80 °C.

Figure 5.
The response 4D contour plot of the diameters. The three columns of images represent the changing tendency of diameter with varied reaction temperatures and molar ratios of Zn2+ to tri-sodium citrate when c = 0.06, 0.08, and 0.1 M, and the three rows of images represent the changing tendency of diameter with varied reaction temperatures and molar ratios of Zn2+ to tri-sodium citrate when T = 70, 80, and 90 °C.
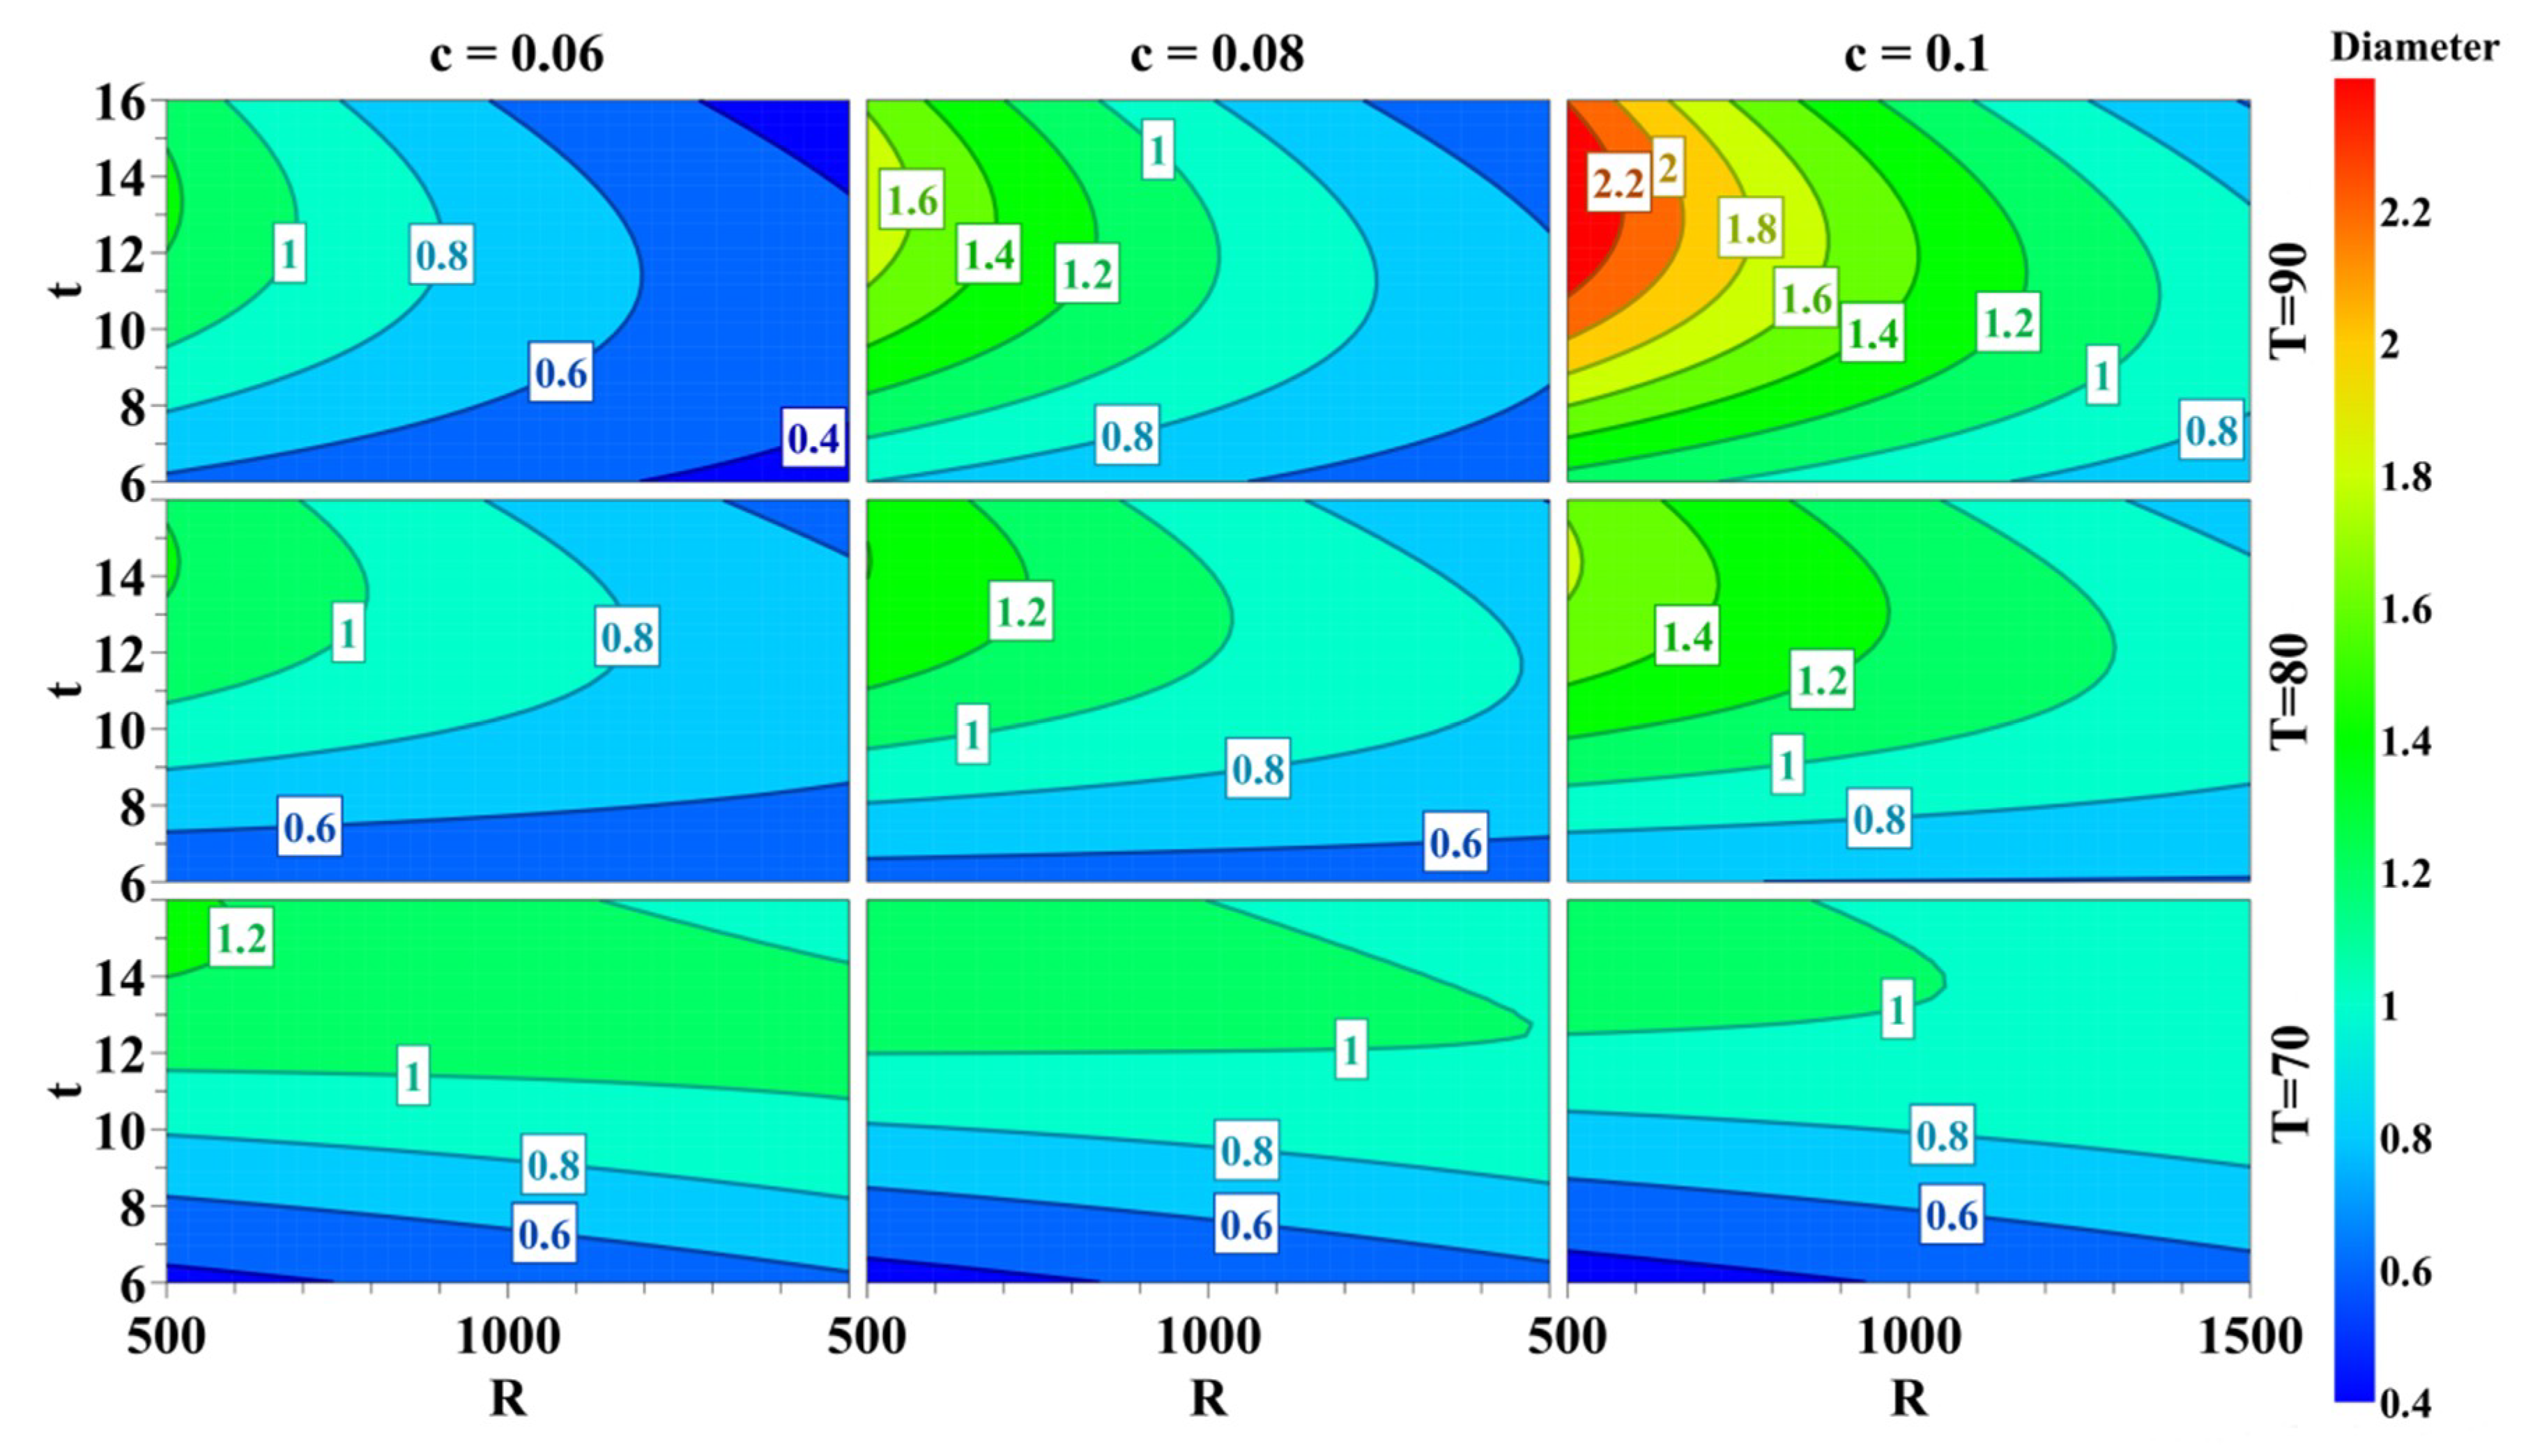
Figure 6.
One-pair-at-a-time main effect analysis of varied parameters (a) the concentration of Zn2+, (b) temperature, (c) reaction time, and (d) molar ration of Zn2+ to tri-sodium citrate on the texture coefficients for the first sixteen experiments in Table 1.
Figure 6.
One-pair-at-a-time main effect analysis of varied parameters (a) the concentration of Zn2+, (b) temperature, (c) reaction time, and (d) molar ration of Zn2+ to tri-sodium citrate on the texture coefficients for the first sixteen experiments in Table 1.

Figure 7.
One-pair-at-a-time main effect analysis of varied parameters (a) the concentration of Zn2+, (b) temperature, (c) reaction time, and (d) molar ration of Zn2+ to tri-sodium citrate on aspect ratios for the first sixteen experiments in Table 1.
Figure 7.
One-pair-at-a-time main effect analysis of varied parameters (a) the concentration of Zn2+, (b) temperature, (c) reaction time, and (d) molar ration of Zn2+ to tri-sodium citrate on aspect ratios for the first sixteen experiments in Table 1.

Figure 8.
Typical SEM images (a–d) and XRD patterns (e) of the obtained ZnO rod arrays. The insets in the SEM images are the corresponding cross-section images of ZnO nanorod arrays, and the enlarged cross-sectional images can be found in Figure S2 in the Supplemental Information. The numbers denoted in the plots are the sample number in Table 1.

Figure 9.
Photoluminescence spectra of the obtained ZnO rod arrays with different parameters. The number denoted above each spectrum represents the experiment number in Table 1.
Figure 9.
Photoluminescence spectra of the obtained ZnO rod arrays with different parameters. The number denoted above each spectrum represents the experiment number in Table 1.

Table 1.
Optimization design with detailed factors and the obtained responses.
| No. | c/M | T/°C | t/h | R/ | TC002/ | Aspect Ratio/ | D/μm |
|---|---|---|---|---|---|---|---|
| 1 | 0.06 | 70 | 6 | 500 | 80.71 | 6.61 | 0.26 |
| 2 | 0.1 | 70 | 6 | 500 | 95.92 | 4.76 | 0.36 |
| 3 | 0.06 | 90 | 6 | 500 | 96.12 | 1.45 | 0.70 |
| 4 | 0.1 | 90 | 6 | 500 | 69.05 | 1.45 | 1.20 |
| 5 | 0.06 | 70 | 16 | 500 | 91.84 | 1.23 | 1.47 |
| 6 | 0.1 | 70 | 16 | 500 | 97.67 | 1.71 | 1.03 |
| 7 | 0.06 | 90 | 16 | 500 | 97.95 | 1.31 | 1.11 |
| 8 | 0.1 | 90 | 16 | 500 | 99.62 | 0.96 | 1.77 |
| 9 | 0.06 | 70 | 6 | 1500 | 71.27 | 1.57 | 0.71 |
| 10 | 0.1 | 70 | 6 | 1500 | 95.09 | 2.51 | 0.52 |
| 11 | 0.06 | 90 | 6 | 1500 | 92.53 | 9.28 | 0.29 |
| 12 | 0.1 | 90 | 6 | 1500 | 97.90 | 2.55 | 0.71 |
| 13 | 0.06 | 70 | 16 | 1500 | 98.58 | 2.20 | 0.73 |
| 14 | 0.1 | 70 | 16 | 1500 | 91.27 | 2.30 | 0.75 |
| 15 | 0.06 | 90 | 16 | 1500 | 98.89 | 7.92 | 0.31 |
| 16 | 0.1 | 90 | 16 | 1500 | 97.04 | 2.42 | 0.71 |
| 17 | 0.06 | 80 | 11 | 1000 | 98.24 | 2.20 | 0.80 |
| 18 | 0.1 | 80 | 11 | 1000 | 94.53 | 2.18 | 0.96 |
| 19 | 0.08 | 70 | 11 | 1000 | 83.39 | 1.63 | 0.99 |
| 20 | 0.08 | 90 | 11 | 1000 | 98.35 | 1.95 | 0.74 |
| 21 | 0.08 | 80 | 6 | 1000 | 98.41 | 4.78 | 0.43 |
| 22 | 0.08 | 80 | 16 | 1000 | 98.43 | 1.62 | 1.08 |
| 23 | 0.08 | 80 | 11 | 500 | 94.76 | 2.30 | 1.20 |
| 24 | 0.08 | 80 | 11 | 1500 | 99.67 | 3.00 | 0.66 |
| 25 | 0.08 | 80 | 11 | 1000 | 93.11 | 1.65 | 1.18 |
| 26 | 0.08 | 80 | 11 | 1000 | 95.42 | 1.84 | 1.12 |
| 27 | 0.08 | 80 | 11 | 1000 | 93.10 | 1.78 | 1.27 |
Table 2.
The ANOVA table of the three responses.
| TC002 | DF a | SS b | MS c | F | p |
| Total | 27 | 236,668 | 8765.49 | ||
| Constant | 1 | 234,987 | 234,987 | ||
| Total corrected | 26 | 1681.06 | 64.656 | ||
| Regression | 6 | 764.311 | 127.385 | 2.779 | 0.039 |
| Residual | 20 | 916.751 | 45.838 | ||
| Lack of Fit (Model error) | 18 | 913.178 | 50.732 | 28.399 | 0.035 |
| Pure error (Replicate error) | 2 | 3.573 | 1.786 | ||
| Aspect Ratio | DF a | SS b | MS c | F | p |
| Total | 27 | 5.474 | 0.203 | ||
| Constant | 1 | 4.001 | 4.001 | ||
| Total corrected | 26 | 1.472 | 0.057 | ||
| Regression | 4 | 0.397 | 0.099 | 2.032 | 0.125 |
| Residual | 22 | 1.075 | 0.049 | ||
| Lack of Fit (Model error) | 20 | 1.074 | 0.054 | 106.606 | 0.009 |
| Pure error (replicate error) | 2 | 0.001 | 0.001 | ||
| Diameter | DF a | SS b | MS c | F | p |
| Total | 27 | 1.611 | 0.060 | ||
| Constant | 1 | 0.364 | 0.364 | ||
| Total corrected | 26 | 1.247 | 0.048 | ||
| Regression | 9 | 1.104 | 0.123 | 14.541 | 0.000 |
| Residual | 17 | 0.143 | 0.008 | ||
| Lack of Fit | 15 | 0.142 | 0.009 | 12.629 | 0.076 |
| (Model error) | |||||
| Pure error | 2 | 0.001 | 7.4 × 10⁻⁴ | ||
| (replicate error) |
a degree of freedom, b sum of squares, and c means square.
© 2020 by the authors. Licensee MDPI, Basel, Switzerland. This article is an open access article distributed under the terms and conditions of the Creative Commons Attribution (CC BY) license (http://creativecommons.org/licenses/by/4.0/).
Share and Cite
MDPI and ACS Style
Sheng, X.; Cheng, Y.; Yao, Y.; Zhao, Z. Optimization of Synthesizing Upright ZnO Rod Arrays with Large Diameters through Response Surface Methodology. Processes 2020, 8, 655. https://doi.org/10.3390/pr8060655
AMA Style
Sheng X, Cheng Y, Yao Y, Zhao Z. Optimization of Synthesizing Upright ZnO Rod Arrays with Large Diameters through Response Surface Methodology. Processes. 2020; 8(6):655. https://doi.org/10.3390/pr8060655
Chicago/Turabian StyleSheng, Xiaofei, Yajuan Cheng, Yingming Yao, and Zhe Zhao. 2020. "Optimization of Synthesizing Upright ZnO Rod Arrays with Large Diameters through Response Surface Methodology" Processes 8, no. 6: 655. https://doi.org/10.3390/pr8060655
Note that from the first issue of 2016, this journal uses article numbers instead of page numbers. See further details here.