Synthesis of European Union Biorefinery Supply Networks Considering Sustainability Objectives


1
Faculty of Chemistry and Chemical Engineering, University of Maribor, Smetanova ulica 17, 2000 Maribor, Slovenia
2
Department of Chemical Engineering, University of Salamanca, 37008 Salamanca, Spain
*
Author to whom correspondence should be addressed.
Processes 2020, 8(12), 1588; https://doi.org/10.3390/pr8121588
Submission received: 30 October 2020
/
Revised: 22 November 2020
/
Accepted: 27 November 2020
/
Published: 1 December 2020
(This article belongs to the Special Issue Multi-Period Optimization of Sustainable Energy Systems)
Abstract
:Increasing the use of renewable energy sources is one of the most important goals of energy policies in several countries to build a sustainable energy future. This contribution proposes the synthesis of a biorefinery supply network for a case study of the European Union (EU-27) under several scenarios based on a mathematical programming approach. Several biomass and waste sources, such as grains, waste oils, and lignocellulosics, are proposed to be utilized, and various biofuels including first, second, and third generations are produced such as bioethanol, green gasoline, biodiesel, Fischer Tropsch (FT) diesel, and hydrogen. The aim of this study is to evaluate the capabilities of EU-27 countries to be able to meet the Renewable Energy Directive (RED II) target regarding the share of renewable energy in the transport sector by 2030 in each Member State while not compromising the current production of food. A generic mathematical model has been developed for the multi-period optimization of a biorefinery supply network with the objective of maximizing sustainability profit. The solutions obtained show that biomass and waste are promising raw materials to reach and go beyond the EU’s renewable energy target in the transport sector for the year 2030. However, some countries would need to provide additional subsidies for their companies to achieve at least a non-negative economic performance of biofuel production.
1. Introduction
The economic growth over the last century brought an increased pressure on social and environmental resources [1]. Global climate changes and related threats are among the most important factors that awaken growing environmental consciousness [2]. In addition to environmental problems, there are other important areas such as economic efficiency, unemployment, energy supply security, and many others [3]. Therefore, sustainable development is essential for satisfying the future needs. The most important pillar of sustainability is still economics, but nowadays, environmental, and social pillars are becoming more and more important. Therefore, companies must consider also environmental and social aspects while obtaining good economic performance [4].
The world’s economy is heavily dependent on transport and consequently on petroleum fuels. The transportation sector is almost exclusively reliant on fossil-based fuels and represents about 30% of the EU’s total energy consumption [5]. The reduction of fossil energy reserves and the associated environmental impact are the two main reasons that lead to considering the use of alternative and renewable energy sources within the transportation sector [6]. In the short term, only biofuels from biomass, such as biodiesel and bioethanol, could provide an alternative that can be implemented because of their high density, compatibility of current automobile engines, and existing fuels’ distribution infrastructures [7].
Due to the depletion of oil and growing demand for mitigating climate change, several countries have set ambitious goals to increase the use of renewable-based transportation fuels. The Renewable Energy Directive (RED II) 2018/2001/EU [8] has set targets for the EU to substitute at least 14% of the current transportation fuels by renewable-based ones by 2030. So far, bioethanol, biodiesel, and also Fischer Tropsch (FT) diesel and green gasoline (gasoline synthesized from syngas, the same gasoline as gasoline from crude oil), both from Fischer Tropsch (FT-) based technology, have been presented as the most promising liquid biofuels due to their compatibility with current supply chains and vehicles [9]. However, political targets and subsidies are the main drivers of bioenergy production [10]. Biomass plays a key role in renewable energy projections of the European Union [11]. In some reports, it is suggested that it could provide up to 60% of the global renewable energy by 2030 [12].
Biofuel production can improve energy security and independence, as well as the development of rural regions and employment [7]. On the other hand, there are also several obstacles and trade-offs with biomass utilization, waste collection, and biofuel production:
- An increase in cultivated fields may lead to biodiversity loss, due to the conversion of land not currently under crop production, such as forest and grassland [15];
- Competitiveness of the use of biomass and waste heavily relies on the evaluation of the supply chain due to the seasonality and regional availability of the biomass, as well as the transportation cost [16];
- Biomass has low energy density and high moisture content. It degrades during storage and requires extensive infrastructure for harvesting, transportation, storage, and processing [17];
- Biofuels have significant land [10] and water footprints [18], and they may also have negative impact on nitrogen [19], phosphorus [20], biodiversity [21], and even carbon [14] footprints. It could jeopardize the availability of arable lands, water, soil nutrients, and increase dependence on agrochemicals [22];
- Biofuel supply chains could generate significant amounts of waste and emissions to air, water, and soil [23];
- Second and third generations of biofuels are still at an early stage of development, and there are few commercial-scale productions and none for the third-generation biofuels in the world yet, although pilot and demonstration facilities are being developed [24];
- Advantages in biotechnology could increase biofuel production; however, its potential risks and benefits, and economic and environmental impacts, are still debated [25].
Several studies exist on the specific biofuel generation path, as well as on biomass and biofuel supply chains and supply networks. In addition, several recent reviews on this topic could be found including planning methodologies [26] and opportunities and challenges of biofuel supply chain modeling, optimization [27], and design [28].
Several biomass and biofuel supply chain and supply network studies have been developed regarding specific regional characteristics. Few such studies are shortly presented below for several countries and states. Elia et al. [29] performed the nationwide supply chain analysis accounting for the varying configurations of feedstock production and the demand profile for transportation fuels in the United States. The nationwide hardwood biomass-to-liquid system in the United States to produce gasoline, diesel, and jet fuel was also analyzed [30]. Biomass-to-ethanol [31] and biomass-to-biofuel supply chains [32] were analyzed for the Midwestern United States. You et al. [33] performed optimal design and planning of biomass-to-liquid supply chains under economic and environmental criteria for the state of Iowa, while the other study [34] addressed the optimal design and planning of cellulosic ethanol supply chains under economic, environmental, and social objectives for the state of Illinois. Giarola et al. [35] analyzed ethanol supply chains in Italy in terms of profitability and environmental impact under market uncertainty.
Several studies on biofuel supply chains have also dealt with multi-objective optimization considering a combination of economic, environmental, and/or social objectives. For example, Liu et al. [36] designed multi-objective biofuel supply chains producing bioethanol, biomethanol, and biodiesel considering economic, energy, and environmental criteria in China. Egieya et al. [37] optimized a biogas supply network by considering a combination of different objectives. Huang et al. [38] performed multi-objective optimization for sustainable jet fuel production from corn stover applied to the Midwestern U.S. Hombach et al. [39] developed a robust multi-objective optimization approach under market uncertainties applied to the German biodiesel market.
Until now, there have been several studies applying the multi-objective optimization of biomass and biofuel supply chains considering regional characteristics. However, from the review of the literature, it was found that only a few studies evaluated supply chains at a larger scale [40]. Optimization-based methods require significant computational time for solving the problem, especially multi-objective optimization, which could even fail to provide a solution due to the required computational load [26]. Biofuels production is typically competitive with fossil fuels only due to subsidy policies [41], and it could be highly interdependent with forestry and agriculture, such as food production and afforestation/deforestation. To the best of the authors’ knowledge, none of the studies reported performing sustainability (considering economic, environmental, and social pillars) optimization of the biorefinery and food supply networks at a larger scale while considering subsidy policies and the interdependence of biofuel production with agriculture and forestry.
The purpose of this work is to perform the synthesis of large-scale biorefinery supply networks that not only consider biomass for biofuels but also meet the demand for food and allow for afforestation under a constrained availability of land. To be able to analyze large-scale biorefinery supply networks, the model previously developed by authors [24] was used, and it was upgraded using different model reduction techniques [42]. A biorefinery’s supply network accounts for different biomass sources and conversion technologies, and it includes first, second, and third generations of biofuels and bioproducts [24]. It is demonstrated on the case study of the European Union (EU-27), producing food and biofuel considering the targets set by the EU (RED II) for the year 2030. The EU’s biorefinery supply network was synthesized with the objective of maximizing sustainability profit [40], which resembles an objective in a composite form, comprising economic, environmental (eco) and social profit. Economic profit was further calculated for each Member State to determine how much government subsidies are required to obtain a non-negative economic performance of biofuel producers.
2. Problem Description
For synthesizing an optimally integrated biorefinery supply network within the entire EU (EU-27), a four-layer (L1–L4) supply network superstructure [24] was used. A range of biomass feedstocks and technologies can be applied for the conversion into biofuels. The synthesis is based on a multi-period (monthly-based) mixed-integer linear programming (MILP) model of a biorefinery supply network.
2.1. Supply Network Synthesis
A four-layer (L1–L4) supply chain superstructure [43] reformulated as a supply network superstructure [24] was used for synthesizing an optimally integrated biorefinery system. The supply network contains sets of potential locations of (i) harvesting sites at supply zones at L1, (ii) collection, pre-processing, and intermediate storage at L2, (iii) biorefineries and storage of products at L3, and (iv) end users at L4, including connection links between and within the layers.
The model applied (see Supplementary Materials in [24]) has several features, such as
- Capability of accounting for different biomass types;
- Capability of optimizing the locations, types, and capacities of the processing plants and the connecting logistics of network;
- A multi-period formulation that accounts for seasonality (12 time periods, each time period represents a specific month) and the availability of resources;
- It enables determining the optimal time periods and capacities when the facilities are operating;
- Accounts for harvesting loss, biomass, and bioproducts’ degradation, and loss with time related to storage, distribution, and usage;
- Optimal selection of areas during the year for each year-round biomass resource and optimal harvesting period(s) for seasonal biomass resources;
- It includes the possibility of purchasing additionally required resources that are not produced within the region at L2 and L3;
- The products produced can be recycled and used as raw materials at L2 and L3 within other technologies;
- Energy can be reused within the network at L2 and L3 through internal and total site heat integration;
- The model is in this way formulated as a MILP problem, and therefore, the solutions obtained are globally optimal. Nonlinear non-convex terms are represented by piecewise linear approximations.
From the previous work [24], the model is now extended to be applied to larger-scale biorefinery supply networks; it enables optimization considering different sustainability objectives, it considers interdependence (competition) between fuel and food production and establishment of forest on the available land area, it accounts for market prices of biofuels and investigates subsidy policy, and it also accounts for the reduction of model size [42].
Several biomass and waste sources are considered to be used in biofuel/food production, such as food crops (corn grain, wheat grain), agricultural residues (wheat straw, corn stover), wood residues (forest thinning), energy crops (miscanthus), waste cooking oil, and algae. Feedstocks from each supply zone (L1) are shipped to collection and pre-processing facilities (L2) to be dried and stored before shipping to the biorefineries. At the pre-processing facilities, algal oil extraction is also considered. At the potential plant locations (L3), different technologies [44] can be applied for the conversion of biomass into biofuels and other by-products:
- The dry-grind process converting corn and wheat grain to bioethanol [45];
- Gasification and further catalytic synthesis converting corn stover, wheat straw, miscanthus, and forest thinning to bioethanol and hydrogen [46];
- Gasification and further syngas fermentation converting corn stover, wheat straw, miscanthus, and forest thinning to bioethanol and hydrogen [46];
- FT diesel and green gasoline production converting corn stover, wheat straw, miscanthus, and forest thinning to FT diesel and green gasoline, both from Fischer Tropsch (FT)-based technology [47];
- Hydrogen production applying gasification, water gas shift reaction, and membrane separation, converting corn stover, wheat straw, miscanthus, and forest thinning to hydrogen [48];
- Biochemical process for lignocellulosic biomass via the hydrolysis of miscanthus through dilute acid pretreatment to bioethanol [49];
- Biodiesel production from algae and waste cooking oil [50]. For algal oil, the homogeneous alkali-catalyzed transesterification process is considered, whilst for waste cooking oil, the process selected is based on the heterogeneous catalyzed transesterification. The transesterification of oil could be performed either with methanol or with recycled bioethanol [51].
Using these technologies, biofuels such as bioethanol, green gasoline, biodiesel, FT diesel, and hydrogen with high purity can be produced. Products such as ethanol, hydrogen, or the energy surpluses can be reused within the network [24]. Food-based products (corn and wheat grains) can either be directly used at demand locations, or alternatively, their surpluses can be used in the production of biofuels and by-products.
The model includes energy and mass balances, production and conversion constraints, economic [24], environmental, and social constraints, and the objective function of maximizing the sustainability profit [40] or individual profits (economic, environmental, and social). The restrictions for the model are the availability of cultivation areas for food and biofuels, minimum and maximum capacities for the plants, and the required demand to be satisfied. The model is presented in detail in the previous work [24], objectives are presented in detail in [40], model reduction techniques are presented in [42], and the model is briefly presented also in the Supplementary Materials (Part F).
2.2. Methodology Overview and Dynamic Synthesis
In order to select the appropriate technologies for the production of biofuels, first, an initial pre-screening of technologies was performed, followed by the detailed synthesis of an individual technology’s flowsheet (see the contribution by [44]). Furthermore, the surrogate models for the different facilities consist of input–output models based on conversion factors and cost correlations to estimate investment and production costs. The data from the detailed models are inserted in a data-independent form into the renewable supply and demand network model. The multi-period MILP mathematical model of a heat-integrated biorefinery’s supply network (see Supplementary Materials by [24]) includes (i) mass and energy balances, (ii) production and conversion constraints, (iii) investment, pretreatment, operating, storage, and transportation cost constraints, and (iv) the objective function and constraints for maximizing sustainability profit and individual profits (economic, eco, and social). Moreover, the linearization of nonlinear investment terms is performed by piecewise linear approximations. Furthermore, to apply the model to the case study of the EU-27, the size of the model was reduced using various model reduction techniques, such as (i) reducing the connectivity in a biomass supply chain network (after [42]), (ii) eliminating unnecessary variables and constraints (after [42]), (iii) neglecting the heat loss, (iv) neglecting heat distribution cost, and (v) assuming that no utility is sold.
An optimization model including above-described features has been applied to a case study of the EU. The EU-27 is divided into 132 zones, as shown in Figure 1. Possible sites of storage and intermediate pre-processing centers, biorefineries, and demand are assumed to be located close to the center of each zone.
The zones in the study were selected based on the size and population of each country, preferably having a reduced number of zones. In this way, the problem is simplified and could be solved in a reasonable time. Despite the limited number of zones, several conclusions could be obtained and could be regarded as a base for more detailed analysis. The applied multi-period model considers dynamic changes in raw material availability and harvesting. Consequently, it affects the whole supply network that is also changing with time. Transportation, production of biofuels and food, storage capacities, etc. vary with time periods. Twelve time periods (each time period represents one month) are assumed as a simplification and to preserve the problem to be solvable in reasonable time.
2.3. Objectives of the Study
The supply networks were synthesized under different objective functions. Sustainability profit (Psustainability), first proposed in Zore et al. [40], represents an objective in a composite form, comprising eco, economic, and social profit. Therefore, the solutions obtained are economically, environmentally, and socially balanced. The biorefinery supply networks were synthesized also with the objective of maximizing economic profit (Peconomic), eco profit (Peco), and social profit (Psocial). Additionally, the economic profit of each EU Member State was calculated based on the market prices of fuels to determine the government subsidy needed to obtain a non-negative economic performance of biofuel production.
2.3.1. Economic Profit
The economic profit (Equation (1)) from a wider macroeconomic (governmental plus industrial) point of view is defined as revenues (R) reduced by expenditures (E) (costs of raw materials, production, transportation, energy, labor) and depreciation (D). Taxes paid by companies and government subsidies are cancelled out, because governments earn taxes from companies, and in contrast, governments give subsidies to companies [40].
The economic profit in each EU Member State was calculated from an industrial perspective in order to evaluate the subsidies that would need to be provided for the companies to generate a non-negative economic outcome while meeting the EU′s renewable energy target in the transportation sector. For this purpose, the economic outcome is defined as the economic profit (Peconomic) after tax (Ctax) without the government subsidies received (Rsubsidy).
To determine the minimal subsidies that would need to be provided in each country for its companies to generate at least non-negative economic profit, an additional constraint was added:
2.3.2. Eco Profit
Eco profit is defined as the difference between eco benefit (EB) and eco cost (EC), as shown in Equation (4), where benefits are related to provisions in monetary terms for unburdening the environment, and eco cost represents the investments needed for preventing the burdening effects of raw materials, products, technologies, pretreatment, transport, and land use on the environment. EB and EC are calculated using eco-cost coefficients (ECC), which are multiplied by the mass flows of feedstocks and products. ECC are determined for each raw material and product for selected technologies and are composed of global warming, ecosystem, resource depletion, and human health. For example, EB is obtained when waste is recovered rather than disposed of and when environmentally harmful products are supplemented with new, green products. Further eco benefit could also be achieved with the additional afforestation. More details about eco profit calculations and used eco-cost coefficients are presented in Supplementary Materials (part C and F).
2.3.3. Social Profit
Social profit is the difference between social benefits and costs. Social benefits are composed of social security contributions (SS), which are paid by employers and employees, and social unburdening (SU) effects due to the newly created jobs, while social costs (SC) represent the social support of the company and the state for the employees. Social security contributions (SS) are defined as the difference between gross and net wages in a production sector, multiplied by the number of jobs created. Social unburdening (SU) is defined as the product of number of new jobs created and the average state social transfer for the unemployed, since the state is now uncharged for the social transfers that were used to support unemployed. Social costs (SC) are determined as the sum of the state social transfer for employees and the average company’s social contribution per employee, which is multiplied by the number of new jobs created using new technologies. The state social transfer consists of health insurance, child allowance, state scholarships, and other types of benefits.
For more details regarding the calculation of social profit, the reader is referred to contributions by Zore et al. [40] and parts E and F of Supplementary Materials.
2.3.4. Sustainability Profit
Sustainability profit is further defined as the sum of the economic, eco, and social profits, where all the objectives are combined in the form of a single-objective optimization (composite criterion), hereby achieving a single balanced solution.
A detailed modeling regarding all objectives is presented in Part F of the Supplementary Materials.
3. Biofuel and Food Supply Networks Applied to European Union (EU-27)
The dynamic model developed previously for the synthesis of regional-sized biofuel and food supply networks [24] has been adapted for the larger scale and applied to the case of EU-27. The regional plan is now changed from the smaller and medium-sized illustrative problem to a complex real large-scale problem. To make the problem tractable, several model reduction techniques were employed. Only the differences in comparison with previous contribution by authors [24] are described here in more detail.
3.1. Regional Plan
The biorefinery supply network consists of 132 zones; see Figure 1. The number of zones selected was a compromise between computational time and the consideration of different regional characteristics (resource availability and demand) within the countries. The size and population of each country was also taken into account, in which each country preferably has a reduced number of zones. In this way, the problem is reasonably simplified while reducing the size of the model to be solved in a reasonable time. The locations of pre-processing and storage facilities, biorefineries, and end users are assumed to be located close to the center of each zone. For each location, the latitudes and longitudes, given as decimal degrees, are as taken from [52]. For simplification, the distances between two locations are assumed as the straight distances between those locations. In order to calculate the distances between coordinate points in kilometers [53] in the Euclidean space, the spherical law of cosines is used, as presented in Egieya et al. [54]. The data related to the regional plan, such as locations of the items (locations of zone edges, collection centers, production plants, and end users), areas of the zones, and the populations are shown in Part A of Supplementary Materials.
3.2. Availability of Raw Materials
Several biomass and waste sources are assumed to be possible raw materials for the production of biofuels and food, such as corn grain, corn stover, wheat, wheat straw, miscanthus, forest thinning, algae, and waste cooking oil. For simplification, it is assumed that the biomass yield and waste cooking oil availability (all in 1000 t/(km2∙year)) are the same within each country. As the land use, and availability of land area for biofuels thereof, is a key issue and limiting factor in sustainable bioenergy production [55], it is assumed that up to 10% of the total area of each zone is devoted to satisfying biofuel and food (corn and wheat) demand, in order to be on the safe side regarding biodiversity loss. On average (data from 2014 to 2018), almost 2% of the EU’s area is intended for corn grain production, and around 6% of the EU’s area is intended for wheat production [56]. The raw materials used in the production of biofuels could be existing resources, such as existing biomass land area (more intensive agriculture) and “new” land [55]. Ovando et al. [57] assumed that 8–30% of the EU’s agricultural land could be afforested or diverted to bioenergy crops by 2020. They also assumed that about 85% of the total land area in EU is classified as “usable land” (forest and agriculture land). The data related to raw materials are presented in Supplementary Materials of [24], while the availability of raw materials (yields and harvesting periods) is presented in Part B of the Supplementary Materials.
3.3. Demands for Products
The demands for food and transportation fuels by country are presented in Table 1.
The demands are obtained from the following sources: corn grain [58], wheat [59], and gasoline and diesel [60]. The demands for food per person are assumed to be the same for every country, 0.16 t/(person·year) for corn and 0.24 t/(person·year) for wheat (a total EU population of about 450 × 106 inhabitants is considered [61]). Additionally, the share of energy from renewable sources in the transport sector for each Member State is presented (the data for 2018 [60]).
The prices for the different raw materials and products are given in Table 2 and are assumed to be constant during the year. In the case of selling prices of fuels, it is assumed that the prices represent the company’s net profit after taxes (VAT, excise duties, environmental taxes), which represent a large part of the total price of fuel [62]. The selling prices were calculated according to the prices of the petrol and diesel (data on 25 February 2020, taken from [62]) and adjusted for each type of fuel according to the heating value (higher calorific values from [24] are considered).
3.4. Sustainability Objectives
Different objectives are applied considering economic, environmental, and/or social pillars, which are all expressed in monetary terms. The pillars could be further merged to pairs of pillars (viability, bearability, and equitability) and all pillars combined (sustainability) [63]. The data related to the economic objective is obtained from [24] except for the cost and prices, which are shown in Table 2. Eco-cost and eco-benefit are determined by using eco-cost (eco-benefit) coefficients from Delft University of Technology [64]. The data related to eco-profit calculation are shown in Part C of the Supplementary Materials. To calculate the social profit, the concept and the data are adopted from Zore et al. [40]. The data for determining the number of jobs for construction and operation are taken from the Jobs and Economic Development Impact (JEDI) models [65], number of unemployed people from Eurostat [66], and average net and gross wages for each country from [67]. All the other data required in the model are presented in Supplementary Materials or taken from Supplementary Materials in Čuček et al. [24].
3.5. Analyzed Scenarios
The aim of our work is to show under which conditions it is possible to achieve the EU targets in the transport sector by 2030 and also to show how much additional biofuels could be produced. As the production of biofuels may affect land use and cause a land footprint, both scenarios are further subdivided to show how the eco cost of additional land use (land use beyond that currently used for the cultivation of corn and wheat) affects the selection of raw materials and technologies and how the cultivation of additional raw materials for fuel production affects the environment and sustainability. Therefore, four different scenarios are considered:
- Scenario 1: The target for biofuels (14% share of renewable energy sources (RES) within the transportation sector by 2030 [8]) and the demand for food (100%) should be satisfied in each EU Member State. It is considered that 14% of both petroleum-based fuels, gasoline and diesel, should be substituted with biofuels. For countries where the share of renewable energy exceeds 14% (Finland and Sweden, see Table 1), it is assumed that no additional biofuels are required, while also no export of the “excess” of renewable energy is considered.
- Scenario 2: Same as Scenario 1, while an eco cost of 0.5 €/m2 [68] for additional land area use beyond the land used for food production is assumed. In the case of afforestation, an eco benefit of 0.5 €/m2 is considered.
- Scenario 3: The demand for food should be satisfied, while for biofuels, no restrictions regarding demand are assumed. Corn grain and wheat are considered to be used only for satisfying the demand for food (while they cannot be used for production of biofuels), while wheat straw and corn stover could be utilized for the production of biofuels.
- Scenario 4: Same as Scenario 3, while an eco cost or eco benefit of 0.5 €/m2 is assumed for the area beyond the area required for growing food crops.
In addition, a sensitivity analysis is performed analyzing the influence of (i) raw material cost and (ii) product prices on the different objectives and the influence of (iii) the eco cost for additional land use on the economic profit and production of biofuels. The first two (the influences of raw material cost and product prices) are applied on Scenario 1, while the third (influence of eco cost for land use) is applied on Scenario 3.
The multi-period MILP model for the synthesis of EU-27 biorefinery supply networks consists of approximately 1,103,000 single equations, 26,827,000 single variables, and 26,700 binary variables. The problem is formulated in the modeling system GAMS, and a single solution was obtained using solver CPLEX on the HPC server DL580 G9 CTO (4 processors—32 core, Intel® Xeon® CPU E5-4627 v2 @ 3.30 GHz, 768 GB RAM) in about 5 h.
4. Results and Discussion
In this section, the results of the four scenarios considered are presented as well as the results of sensitivity analysis.
4.1. Demand Meeting Policy—Scenarios 1 and 2
The current share of renewable energy sources within the transport sector varies widely among countries [60] (see Table 1). As a result, the need for biofuels also varies from country to country. Two different cases are considered where the production of food and biofuels should be equal to the demand for food and the target for biofuels. 100% demand for corn and wheat grain should be achieved, and 14% share of renewable energy should be satisfied by biofuels. It is assumed that the additional production of both types of biofuels should correspond to the difference between the target and the current use of renewables (see Table 1). Both demand for food and target for biofuels should be achieved in each EU Member State. Wheat and corn grain are primarily used to satisfy the demand for food; the excess of both may also be used to produce biofuels. Other biomass and waste sources could be used in the production of biofuels, while additional afforestation is also possible.
4.1.1. First Scenario
Table 3 presents the optimization results of individual criteria (economic, eco, and social profit) and composite criteria (sustainability profit) when meeting the EU targets of biofuel consumption within the transport sector. The results show that when maximizing the economic profit (column “Economic profit”), a significant negative eco profit is observed, which is related to the comparably higher eco costs of selected raw materials, technologies, and products. Technologies proposed from an economic viewpoint are (i) gasification and syngas fermentation, (ii) gasification and lignocellulosic hydrogen production and (iii) biodiesel production from algal oil. When maximizing eco profit (column “Eco profit”), the solutions obtained are those that burden the environment the least and at the same time unburden the environment the most. In this case, hydrogen production is not selected because of its higher environmental impact, which results in a negative economic and sustainability profit.
Social profit is maximal when the maximum number of new jobs is generated (51,727 new jobs), which is also reflected in the largest number of proposed technologies. This leads to a negative economic, eco and sustainability profit (column “Social profit”). When maximizing the sustainability profit (last column), a balanced solution is achieved that is close to the maximum economic and eco profit.
The results of maximizing the Sustainability Profit showed that economic and eco profits have a major influence on the overall Sustainability Profit, while the impact of Social Profit is rather negligible (see Table 3). Based on these results, the trade-off between Eco Profit and Economic Profit is presented by the Pareto curve in Figure 2, where the value of Social Profit was set according to the result obtained from maximizing the Sustainability Profit (25.28 M$/year). In general, one could see that as Eco Profit increases, Economic Profit decreases. If we increase the Eco Profit from the value achieved when maximizing Economic Profit (this is the lowest value of Eco Profit), we do not initially notice any significant impact on Economic Profit. A drastic decrease in Economic Profit is observed when the Eco-Profit exceeds 10,000 M$/year, which is due to the selection of other technologies that are more environmentally friendly (in terms of raw materials used, products manufactured, etc.) and, on the other hand, unprofitable.
The figure also illustrates the location of the point of maximizing Sustainability Profit—it could be seen to be virtually in line with the Pareto curve and is located at the kink of the curve, where the compromise established by maximizing the Sustainability Profit corresponds to a solution where the Eco Profit was increased by about 10,000 M$/year at the cost of Economic Profit by only 1000 M$/year.
For the companies, it is also important that they operate profitably (with non-negative profits) [69]. However, to satisfy the target of RED II directive [8] in each Member State, subsidies might need to be required. Therefore, the optimization determines the amounts of subsidies that would be needed to encourage biofuel production.
When maximizing the sustainability profit, all the sustainability pillars are positive. The overall (cumulative) economic profit is almost 9000 × 106 $/year; however, in some countries, it is positive, and in some countries, it is negative. Consequently, subsidies would be needed for some countries for their companies to exhibit at least non-negative economic performance while meeting the EU’s renewable energy target in the transport sector by 2030. The Economic Profit for each country when maximizing the sustainability profit is shown in Table 4, together with the normalized profit, which is defined as a yearly economic profit per million people.
Thus, the results reveal that in some countries, subsidies would be needed to achieve a positive economic outcome while meeting a biofuel target of 14%. On the contrary, some countries have a significant potential to satisfy the demand without additional subsidies, either because of lower prices for the selected raw materials, their higher yield, or lower production costs. Some countries also accounted for a fairly high share of renewable energy sources in the transport sector by 2018 [60] (up to 10% of the required 14% except for Finland and Sweden, see Table 1), and they need to produce less additional biofuels to reach the target. The highest economic profit is obtained for Germany, Italy, and Poland, 8781 M$/year, 5067 M$/year, and 4288 M$/year, while the countries where the highest subsidies would need to be provided are Austria, Bulgaria and Ireland.
Among all the proposed technologies, hydrogen production has proven to be the most economically efficient. It should be noted that hydrogen production was not constrained in this study. The other profitable technologies for producing biofuels are gasification and syngas fermentation to produce ethanol and biodiesel production from algae with methanol as catalyst (which is cheaper than with recycled bioethanol [51]). The EU map in Figure 3 shows the economic profit (the objective is a maximization of the sustainability profit) of each country and the locations of selected technologies. The red zones are those zones where subsidies would need to be provided, while the green zones present the zones with a positive economic profit from the industrial perspective.
Figure 3 shows that for Germany and Poland, two countries with the highest economic profit, it is common that hydrogen is additionally produced (in each zone of these two countries). The main feedstock selected for its production is miscanthus, which has a low price and a relatively high hectare yield, and consequently, shows good economic prospects. Another advantage of the production of hydrogen is its relatively high selling price compared to other biofuels (see Table 2). Therefore, the additional production of hydrogen has proven to be economically advantageous.
When maximizing individual profits and composite profit, different raw materials and their amounts are cultivated and used. Figure 4 shows the available area (up to 10% of the total area of each zone) devoted to different raw materials under different maximization criteria.
Wheat and corn grain are in all cases produced in the amounts needed to satisfy the demand for food, 110,146 kt/year of wheat and 70,257 kt/year of corn grain. The areas required are about 2.3% for corn grain and about 4.7–5.3% for wheat.
When maximizing the economic profit, the raw materials selected for producing gasoline substitutes are corn stover, wheat straw, miscanthus, and forest residue, while biodiesel is produced from algal oil. The most promising raw materials from an environmental perspective are miscanthus and algae, which are used to produce bioethanol and biodiesel. In this case, only 7.62% of the total area is used for the production of food and biofuels, with 6.09% of the existing area and 1.53% of the additional area being cultivated. Compared to other maximization criteria, only a small amount of additional hydrogen is produced. Biodiesel production from algal oil was suggested as the most promising option, despite the relatively high costs of algae cultivation and oil extraction processes. Algae were proposed as a raw material because of its low eco cost coefficient and high productivity. From a social point of view, the promising raw materials are miscanthus, wheat straw, corn stover, algae, and cooking oil, which is not competing for the area. Of the total area, 8.57% was cultivated to satisfy the demand for food and biofuels while creating the maximal number of new jobs. Bioethanol was produced as a substitute for gasoline using the gasification and further catalytic synthesis technology, and biodiesel was produced from algal and cooking oil as a substitute for diesel. From the sustainability perspective, only miscanthus and algae are proposed, similarly to the case when maximizing eco profit, except that much more additional hydrogen is produced to achieve higher economic and consecutively sustainability profit.
Figure 5a–d show the production of corn grain, wheat, miscanthus, and algae within the EU when maximizing the sustainability profit. Corn grain and wheat are used only to satisfy the demand for food, while miscanthus and algae are used to satisfy the target for biofuels, as it was mentioned previously. As it could be seen, most of the corn grain is grown in the southern countries (Portugal, Spain, Italy, and Greece), Austria, Poland, the northern part of Germany, and the eastern part of France; wheat grain is grown more in northern countries, France, Ireland, and in Hungary; algae are suggested to be produced in southern countries (Portugal, Spain, Italy, Greece, Cyprus, and southern part of France) and miscanthus is grown in Germany, Poland, Slovenia, Italy, Spain, Portugal, Greece, France, Ireland, Denmark, Estonia, Latvia, Lithuania, Czechia, Slovakia, and south Sweden. The results confirm that the use of miscanthus plays an important role in bioethanol and also hydrogen production. It is the most promising raw material among all lignocellulosic materials available, especially due to comparably low cost (see Table 2) and high hectare yield (see Part B of Supplementary Materials).
4.1.2. Second Scenario
In the second scenario, the use of land eco cost is assumed when producing biofuel (beyond 8% of the current area used for food production), while in the case of afforestation, an eco benefit is assumed. The distribution of areas required for the cultivation of raw materials is shown in Figure 6.
The most significant difference with Scenario 1 is observed when maximizing eco and sustainability profits. With both criteria, about 3% of the area is suggested to be afforested because of the related eco benefit. The demand for biodiesel is in both cases was satisfied with the production of biodiesel from algae, while as a substitute for gasoline, bioethanol from wheat straw and forest residue is produced using gasification and syngas fermentation technology. Algae require comparably less area due to the high yield, while both substrates for ethanol production do not require any additional land.
On the other hand, afforestation is not desirable from an economic perspective where profitable technologies are suggested. Biodiesel is again produced from algal oil and ethanol from forest residue is also produced in smaller amounts. The highest social profit is obtained when producing bioethanol and hydrogen from miscanthus, wheat straw, and some corn stover. When satisfying the demand for biodiesel, cooking oil is suggested also, together with algae. Overall, about 8.57% of the total area is used for the production of food and biofuels.
4.2. No Restrictions Regarding Biofuel Production—Scenarios 3 and 4
For Scenarios 3 and 4, no restrictions regarding demand for biofuels are assumed. However, the demand for food should be satisfied in order not to harm food production. Corn grain and wheat are again produced to satisfy the demand for food, but it is also assumed that they cannot be used for the production of biofuels. For the additional land use, eco costs of 0 €/m2 for the third scenario and 0.5 €/m2 for the fourth scenario are considered.
Figure 7a shows that applying different optimization criteria do not greatly affect the production of raw materials for the supply of food and biofuels. In all cases, wheat straw, miscanthus, and algal oil are used for the production of gasoline and diesel substitutes as well as hydrogen. Additionally, when maximizing economic, social, and sustainability profit, corn stover is suggested also. Moreover, all the criteria also suggested the use of the waste cooking oil for the production of biodiesel. When maximizing eco, economic, and sustainability profit, green gasoline and FT diesel are produced in addition to ethanol and biodiesel. When the eco cost and eco benefit coefficient for the land use is changed from 0 to 0.5 €/m2 (Figure 7b), it can be seen from the environmental and sustainability perspective that a large part of the available area is used for afforestation instead of miscanthus cultivation, which is reflected in the eco benefits and environmental unburdening. On the contrary, from a social perspective, the production of biodiesel from algal oil and waste cooking oil and the production of hydrogen and ethanol from corn stover, wheat straw, and miscanthus are suggested.
Table 5 summarizes the main results of the sustainability profit optimization for all the four scenarios in terms of raw materials and technologies used for renewable fuel production. Among all the technologies, biodiesel production from algal oil with methanol as catalyst and gasification and syngas fermentation are the only two technologies that have been selected in all the four scenarios, indicating their potential to reach and go beyond the EU target for the year 2030.
In the first and second scenarios, lower amounts of gasoline and diesel substitutes have been produced compared to the third and fourth scenarios. With the raw materials and technologies available, and under the above-mentioned constraints, up to eight times more ethanol and green gasoline, and up to 5.5 times more biodiesel and FT diesel could be produced as required by the EU (Scenario 3). The results show that about 80% of the fossil-based gasoline and 38% of petroleum diesel could be substituted with biofuels. Results reveal that an increased production of biofuels is economically efficient, and it has a positive impact on environment and generates new jobs, which results in an increased sustainability profit compared to the first two scenarios. When eco cost/eco benefit for the additional land area use is assumed, also, a significant share of area is proposed for additional afforestation. The amount of food produced is the same in all scenarios, namely 70,257 kt/year of corn grain and 110,146 kt/year of wheat.
Figure 8 shows the production of (a) gasoline and (b) diesel substitutes within the EU, when no restrictions regarding biofuel production are assumed (the highest possible production of biofuels according to the availability of raw materials) and sustainability profit is maximized and no eco-cost/benefit of land use is assumed (Scenario 3). It could be seen that the highest amount of ethanol and green gasoline is suggested to be produced in Italy, Germany, and Poland, followed by France. The production of diesel substitutes is high in southern countries, Italy, Spain, Portugal, and Greece and also in France and Cyprus, because of the possibility of growing algae, while in other countries, waste cooking oil is used as a feedstock for biodiesel production.
To summarize, the results show that it is possible not only to meet the EU′s targets for renewable fuels in the transport sector by 2030 but also to surpass them using selected raw materials and technologies. However, as it has already been mentioned, it would be crucial for some countries to provide subsidies for their biofuel producers to exhibit non-negative economic performance. This can be part of the European policy toward its self-sufficiency in fuel production.
4.3. Sensitivity Analysis
Sensitivity analysis is further performed analyzing (i) the influences of raw material prices to study their effect on economics and sustainability, (ii) product prices to determine their impacts on sustainability and economic profit, and (iii) the eco cost for additional land use beyond land use for food production to study how it affects biofuel production and profits.
4.3.1. Influence of Raw Materials Costs
Different prices of raw materials (biomass and waste) were assumed from half to double the price of the values shown in Table 2. All the other data are the same as for Scenario 1. The impacts of changes in prices are studied on how they affect sustainability and economic profits as well as investment, production, and transportation costs, as shown in Figure 9.
When multiplying the price of raw materials by a factor beyond 1.5, negative sustainability profit is obtained; while in case of economic profit, the economic loss is obtained by an even lower price factor (between 1 and 1.25), as shown in Figure 9. On the contrary, the reduction of raw materials prices can significantly improve the economic performance of companies and also the overall sustainability profit. An increase in raw material prices causes a linear decrease in transportation, investment, and production costs due to more efficient use.
4.3.2. Influence of Product Prices
Figure 10 shows the case when selling prices of products are multiplied by factors from 0.5 to 2.0 of the current prices. Again, all the other data are the same as for Scenario 1. As expected, an increase of the selling prices is reflected in a significant increase of both sustainability and economic profits.
When the price of products is increased by a factor of 2, the economic profit increases from 8955 to 114,776 M$/year (12–13 fold increase), while the sustainability profit increases approximately six times over (from 18,495 M$/year to 118,956 M$/year). These results confirm the essential impact of the economic pillar on sustainability. The increase of product selling prices also affects the investment, production, and transportation costs. In all cases, the costs increase with the increasing price, but only to some extent (up to a factor of 1.25 to 1.5); then, a further increase of prices does not have a major impact on the costs. When compared to other categories, the impact of product prices on production cost is much less highlighted. On the other hand, when decreasing prices of products, a negative overall sustainability profit could be obtained by a factor of about 0.75, while negative economic profit at a factor closer to 1. With the decrease of selling prices below a factor of 1.0, investment, production, and transportation costs continuously decrease also, because other technologies with lower costs are selected to achieve as good as possible economic performance.
4.3.3. Variation of Eco Cost/Benefit Coefficient for Additional Land Use
This case considers a scenario where the eco cost/benefit coefficient for additional land use beyond the land use required for food production is varied from 0 to 1 €/m2. Scenario 3 is used for calculations where no restrictions regarding the production of biofuels are considered to determine the impact of additional potential afforestation on the production of biofuels. From Table 5, it was shown that the sustainability profit increased with planting new forest. The same could be observed from Figure 11, which shows (a) sustainability, economic, and eco profits and (b) the production of biofuels and percentage of area afforested vs. eco cost/benefit coefficient for land use.
It could be seen that with the increase of the eco cost/benefit coefficient for land use, both eco and sustainability profits also increase, while the economic profit decreases due to less biofuel production. It should be noted that in the case when an eco-cost coefficient has a lower value, the eco profit contributes to around 60–70% of the overall sustainability profit. When the eco cost is increased, the eco profit presents more than 90% of the total sustainability profit. This is related to the smaller production of biofuels (it decreases from 98 × 106 to around 65∙106 t/year), which reduces the economic profit. When an eco cost/benefit for the additional land area use is considered, most of the available area is afforested (from 2.5% at lower eco-cost coefficient to about 3.5%).
5. Conclusions
The generic MILP model for a multi-period synthesis of sustainable supply networks producing biofuels and food has been applied to a larger scale to a case study of the EU-27. The optimization of a biorefinery supply network was performed with the maximization of the sustainability profit, where the balanced solutions between economic, environmental, and social aspects are obtained. Various scenarios and sensitivity analyses were examined to reach the EU’s demand for food and the target of a 14% RES share within the transport sector by 2030 and beyond.
It was shown that especially miscanthus and algae are promising raw materials for the production of biofuels together with crop residues, which are intended to replace petroleum-based gasoline and diesel. Among all technologies, biodiesel production from algal oil and bioethanol production from miscanthus by gasification and syngas fermentation are the most promising technologies within sustainability metrics. The results also reveal that the biofuel production guidelines can be implemented economically by meeting the food demand within the EU by using additionally up to 2% and together with food production up to 10% of the total area. Significantly more than 14% of fuel demand for transport could be achieved by biofuels. About 80% of fossil-based gasoline and about 40% of petroleum–diesel could be replaced by biofuels in the EU, as shown in Scenario 3.
It is also interesting to note that when maximizing eco or sustainability profit, additional afforestation is proposed because of the related environmental benefits. When maximizing the sustainability profit, a balanced solution is achieved that maximizes the combined economic, eco, and social performance, which exhibits a relatively good economic, eco, and also social outcome.
However, for biofuel production to be competitive, it will be crucial in some countries to receive subsidies to prevent a non-negative economic performance of biofuel supply networks. It should also be noted that second- and third-generation biofuel technologies are being selected, which have not yet been commercialized and are therefore subject to considerable uncertainties. Furthermore, 10% of the area of each zone could be too large in some zones, and the potential is greater in some other zones. Despite the need for commercial verification of the technologies and a more detailed study, the results of this work could be a good starting point to assessing the capabilities of countries to meet the targets presented by the policy makers and for analyzing potentials beyond which they can go.
In the future, the work will be extended to include solar, wind, and geothermal electricity generation, technologies producing thermal energy and other renewable fuels, besides fuels used in road transportation as in this study, such as aviation biofuel, and finally, the time-span of renewable-based production of energy and food will be extended to the total lifetime of the supply networks.
Supplementary Materials
The following are available online at https://www.mdpi.com/2227-9717/8/12/1588/s1, Table S1: Data for regional plan, Table S2: Hectare yields (in 1000 t/(km2∙year)) and harvesting periods for raw materials, Table S3: Eco-cost coefficients of raw materials (in €/kg), Table S4: Eco-cost coefficients of products (in €/kg), Table S5: Eco-cost coefficients of pre-treatment for various raw materials (in €/kg), Table S6: Data related to technologies for bioethanol, FT-diesel and hydrogen production, Table S7: Data related to technologies for biodiesel production, Table S8: Costs of the storage, pre-treatment and biomass deterioration percentage, Table S9: Operating costs of the processing technology, Table S10: Transportation cost, Table S11: Gross and net wages in EU Member States.
Author Contributions
Conceptualization, L.Č. and Z.K.; methodology, S.P., Z.K. and L.Č.; software, L.Č. and S.P.; validation, S.P., L.Č. and M.M.; investigation, S.P. and L.Č.; data curation, L.Č., S.P. and M.M.; writing—original draft preparation, S.P.; writing—review and editing, L.Č., M.M. and Z.K.; visualization, S.P.; supervision, L.Č. and Z.K. All authors have read and agreed to the published version of the manuscript.
Funding
The financial support from the Slovenian Research Agency (PhD research fellowship contract No. 1000-19-0552, research core funding No. P2-0032 and P2-0412, and projects No. J7-1816 and N2-0138).
Conflicts of Interest
The authors declare no conflict of interest.
Abbreviations
| EU | European Union |
| EU-27 | EU with 27 countries as of May 2020 |
| FT | Fischer Tropsch |
| MILP | Mixed-integer linear programming |
| RED | Renewable Energy Directive |
| RES | Renewable energy sources |
| WCO | Waste cooking oil |
References
- Næss, P.; Saglie, I.-L.; Richardson, T. Urban sustainability: Is densification sufficient? Eur. Plan. Stud. 2020, 28, 146–165. [Google Scholar] [CrossRef]
- Baleta, J.; Mikulčić, H.; Klemeš, J.J.; Urbaniec, K.; Duić, N. Integration of energy, water and environmental systems for a sustainable development. J. Clean. Prod. 2019, 215, 1424–1436. [Google Scholar] [CrossRef]
- Zore, Ž.; Čuček, L.; Širovnik, D.; Novak Pintarič, Z.; Kravanja, Z. Maximizing the sustainability net present value of renewable energy supply networks. Chem. Eng. Res. Des. 2018, 131, 245–265. [Google Scholar] [CrossRef] [Green Version]
- Taliento, M.; Favino, C.; Netti, A. Impact of environmental, social, and governance information on economic performance: Evidence of a corporate ‘sustainability advantage’ from Europe. Sustainability 2019, 11, 1738. [Google Scholar] [CrossRef] [Green Version]
- Eurostat. Energy, Transport and Environment Statistics. Available online: https://ec.europa.eu/eurostat/documents/3217494/10165279/KS-DK-19-001-EN-N.pdf/76651a29-b817-eed4-f9f2-92bf692e1ed9 (accessed on 10 September 2020).
- Jungbluth, N.; Chudacoff, M.; Dauriat, A.; Dinkel, F.; Doka, G.; Faist Emmenegger, M.; Gnansounou, E.; Kljun, N.; Schleiss, K.; Spielmann, M.; et al. Life Cycle Inventories of Bioenergy, Ecoinvent Report No. 17; Swiss Centre for Life Cycle Inventories: Dübendorf, Switzerland, 2007. [Google Scholar]
- Čuček, L.; Martín, M.; Grossmann, I.E.; Kravanja, Z. Multi-period synthesis of a biorefinery’s supply networks. In Computer Aided Chemical Engineering; Andrzej, K., Ilkka, T., Eds.; Elsevier: Amsterdam, The Netherlands, 2013; Volume 32, pp. 73–78. [Google Scholar]
- The European Parliament; The Council of the European Union. Directive (EU) 2018/2001 of The European Parliament and of the Council of 11 December 2018 on the Promotion of the Use of Energy from Renewable Sources; European Union: Brussels, Belgium, 2018. [Google Scholar]
- Martín, M.; Grossmann, I.E. Optimal use of hybrid feedstock, switchgrass and shale gas for the simultaneous production of hydrogen and liquid fuels. Energy 2013, 55, 378–391. [Google Scholar] [CrossRef]
- De Schutter, L.; Giljum, S. A Calculation of the EU Bioenergy Land Footprint, Discussion Paper on Land Use Related to EU Bioenergy Targets for 2020 and an Outlook for 2030. Available online: foeeurope.org/sites/default/files/agrofuels/2015/foee_bioenergy_land_footprint_may2014.pdf (accessed on 30 September 2020).
- Banja, M.; Sikkema, R.; Jégard, M.; Motola, V.; Dallemand, J.-F. Biomass for energy in the EU—The support framework. Energy Policy 2019, 131, 215–228. [Google Scholar] [CrossRef]
- International Renewable Energy Agency (IRENA). Biomass Could Provide 60% of Global Renewable Energy by 2030. Available online: circularonline.co.uk/news/biomass-could-provide-60-of-global-renewable-energy-by-2030/ (accessed on 14 September 2020).
- Ajanovic, A. Biofuels versus food production: Does biofuels production increase food prices? Energy 2011, 36, 2070–2076. [Google Scholar] [CrossRef]
- Azapagic, A. Sustainability considerations for integrated biorefineries. Trends Biotechnol. 2014, 32, 1–4. [Google Scholar] [CrossRef]
- Mata, T.; Martins, A.; Sikdar, S.; Costa, C.V. Sustainability considerations of biodiesel based on supply chain analysis. Clean Technol. Environ. Policy 2011, 13, 655–671. [Google Scholar] [CrossRef]
- Yu, Y.; Bartle, J.; Li, C.-Z.; Wu, H. Mallee biomass as a key bioenergy source in western australia: Importance of biomass supply chain. Energy Fuels 2009, 23, 3290–3299. [Google Scholar] [CrossRef]
- Lam, H.L.; Varbanov, P.S.; Klemeš, J.J. Optimisation of regional energy supply chains utilising renewables: P-graph approach. Comput. Chem. Eng. 2010, 34, 782–792. [Google Scholar] [CrossRef]
- Gerbens-Leenes, P.W.; Hoekstra, A.Y.; van der Meer, T. The water footprint of energy from biomass: A quantitative assessment and consequences of an increasing share of bio-energy in energy supply. Ecol. Econ. 2009, 68, 1052–1060. [Google Scholar] [CrossRef]
- Čuček, L.; Klemeš, J.J.; Kravanja, Z. Carbon and nitrogen trade-offs in biomass energy production. Clean Technol. Environ. Policy 2012, 14, 389–397. [Google Scholar] [CrossRef]
- Elshout, P.M.F.; van der Velde, M.; van Zelm, R.; Steinmann, Z.J.N.; Huijbregts, M.A.J. Comparing greenhouse gas footprints and payback times of crop-based biofuel production worldwide. Biofuels 2019, 1–7. [Google Scholar] [CrossRef]
- Groom, M.J.; Gray, E.M.; Townsend, P.A. Biofuels and biodiversity: Principles for creating better policies for biofuel production. Conserv. Biol. 2008, 22, 602–609. [Google Scholar] [CrossRef] [PubMed]
- Benites-Lazaro, L.L.; Giatti, L.L.; Sousa, W.C., Jr.; Giarolla, A. Land-water-food nexus of biofuels: Discourse and policy debates in Brazil. Environ. Dev. 2020, 33, 100491. [Google Scholar] [CrossRef]
- Zaimes, G.G.; Vora, N.; Chopra, S.S.; Landis, A.E.; Khanna, V. Design of sustainable biofuel processes and supply chains: Challenges and opportunities. Processes 2015, 3, 634–663. [Google Scholar] [CrossRef] [Green Version]
- Čuček, L.; Martín, M.; Grossmann, I.E.; Kravanja, Z. Multi-period synthesis of optimally integrated biomass and bioenergy supply network. Comput. Chem. Eng. 2014, 66, 57–70. [Google Scholar] [CrossRef]
- Barragán-Ocaña, A.; Silva-Borjas, P.; Olmos-Peña, S.; Polanco-Olguín, M. Biotechnology and bioprocesses: Their contribution to sustainability. Processes 2020, 8, 436. [Google Scholar] [CrossRef] [Green Version]
- Nguyen Duc, D.; Nananukul, N. Advanced methodologies for biomass supply chain planning. Processes 2019, 7, 659. [Google Scholar]
- Yue, D.; You, F. 7-Biomass and biofuel supply chain modeling and optimization. In Biomass Supply Chains for Bioenergy and Biorefining; Holm-Nielsen, J.B., Ehimen, E.A., Eds.; Woodhead Publishing: Cambridge, UK, 2016; pp. 149–166. [Google Scholar]
- Lan, K.; Park, S.; Yao, Y. Chapter 10—Key issue, challenges, and status quo of models for biofuel supply chain design. In Biofuels for a More Sustainable Future; Ren, J., Scipioni, A., Manzardo, A., Liang, H., Eds.; Elsevier: Amsterdam, The Netherlands, 2020; pp. 273–315. [Google Scholar]
- Elia, J.A.; Baliban, R.C.; Floudas, C.A. Nationwide energy supply chain analysis for hybrid feedstock processes with significant CO2 emissions reduction. AIChE J. 2012, 58, 2142–2154. [Google Scholar] [CrossRef]
- Elia, J.A.; Baliban, R.C.; Floudas, C.A.; Gurau, B.; Weingarten, M.B.; Klotz, S.D. Hardwood biomass to gasoline, diesel, and jet fuel: 2. Supply chain optimization framework for a network of thermochemical refineries. Energy Fuels 2013, 27, 4325–4352. [Google Scholar] [CrossRef]
- Marvin, A.W.; Schmidt, L.D.; Benjaafar, S.; Tiffany, D.G.; Daoutidis, P. Economic optimization of a lignocellulosic biomass-to-ethanol supply chain. Chem. Eng. Sci. 2012, 67, 68–79. [Google Scholar] [CrossRef]
- Marvin, W.A.; Schmidt, L.D.; Daoutidis, P. Biorefinery location and technology selection through supply chain optimization. Ind. Eng. Chem. Res. 2012, 52, 3192–3208. [Google Scholar] [CrossRef]
- You, F.; Wang, B. Life cycle optimization of biomass-to-liquid supply chains with distributed-centralized processing networks. Ind. Eng. Chem. Res. 2011, 50, 10102–10127. [Google Scholar] [CrossRef]
- You, F.; Tao, L.; Graziano, D.J.; Snyder, S.W. Optimal design of sustainable cellulosic biofuel supply chains: Multiobjective optimization coupled with life cycle assessment and input-output analysis. AIChE J. 2012, 58, 1157–1180. [Google Scholar] [CrossRef] [Green Version]
- Giarola, S.; Bezzo, F.; Shah, N. A risk management approach to the economic and environmental strategic design of ethanol supply chains. Biomass Bioenergy 2013, 58, 31–51. [Google Scholar] [CrossRef]
- Liu, Z.; Qiu, T.; Chen, B.A. Study of the LCA based biofuel supply chain multi-objective optimization model with multi-conversion paths in China. Appl. Energy 2014, 126, 221–234. [Google Scholar] [CrossRef]
- Egieya, J.M.; Čuček, L.; Zirngast, K.; Isafiade, A.J.; Kravanja, Z. Optimization of biogas supply networks considering multiple objectives and auction trading prices of electricity. BMC Chem. Eng. 2020, 2, 1–23. [Google Scholar] [CrossRef] [Green Version]
- Huang, E.; Zhang, X.; Rodriguez, L.; Khanna, M.; de Jong, S.; Ting, K.C.; Ying, Y.; Lin, T. Multi-objective optimization for sustainable renewable jet fuel production: A case study of corn stover based supply chain system in Midwestern U.S. Renew. Sustain. Energy Rev. 2019, 115, 109403. [Google Scholar] [CrossRef]
- Hombach, L.E.; Büsing, C.; Walther, G. Robust and sustainable supply chains under market uncertainties and different risk attitudes—A case study of the German biodiesel market. Eur. J. Oper. Res. 2018, 269, 302–312. [Google Scholar] [CrossRef]
- Zore, Ž.; Čuček, L.; Kravanja, Z. Syntheses of sustainable supply networks with a new composite criterion—Sustainability profit. Comput. Chem. Eng. 2017, 102, 139–155. [Google Scholar] [CrossRef]
- Ziolkowska, J.R. Chapter 1—Biofuels technologies: An overview of feedstocks, processes, and technologies. In Biofuels for a More Sustainable Future; Ren, J., Scipioni, A., Manzardo, A., Liang, H., Eds.; Elsevier: Amsterdam, The Netherlands, 2020; pp. 1–19. [Google Scholar]
- Lam, H.L.; Klemeš, J.J.; Kravanja, Z. Model-size reduction techniques for large-scale biomass production and supply networks. Energy 2011, 36, 4599–4608. [Google Scholar] [CrossRef]
- Čuček, L.; Lam, H.L.; Klemeš, J.J.; Varbanov, P.S.; Kravanja, Z. Synthesis of regional networks for the supply of energy and bioproducts. Clean Technol. Environ. Policy 2010, 12, 635–645. [Google Scholar] [CrossRef]
- Martín, M.; Grossmann, I.E. On the systematic synthesis of sustainable biorefineries. Ind. Eng. Chem. Res. 2013, 52, 3044–3064. [Google Scholar] [CrossRef] [Green Version]
- Karuppiah, R.; Peschel, A.; Grossmann, I.E.; Martín, M.; Martinson, W.; Zullo, L. Energy optimization for the design of corn-based ethanol plants. AIChE J. 2008, 54, 1499–1525. [Google Scholar] [CrossRef]
- Martín, M.; Grossmann, I.E. Energy optimization of bioethanol production via gasification of switchgrass. AIChE J. 2011, 57, 3408–3428. [Google Scholar] [CrossRef]
- Martín, M.; Grossmann, I.E. Process optimization of FT-Diesel production from lignocellulosic switchgrass. Ind. Eng. Chem. Res. 2011, 50, 13485–13499. [Google Scholar] [CrossRef]
- Martín, M.; Grossmann, I.E. Energy optimization of hydrogen production from lignocellulosic biomass. Comput. Chem. Eng. 2011, 35, 1798–1806. [Google Scholar] [CrossRef]
- Martín, M.; Grossmann, I.E. Energy optimization of bioethanol production via hydrolysis of switchgrass. AIChE J. 2012, 58, 1538–1549. [Google Scholar] [CrossRef]
- Martín, M.; Grossmann, I.E. Simultaneous optimization and heat integration for biodiesel production from cooking oil and algae. Ind. Eng. Chem. Res. 2012, 51, 7998–8014. [Google Scholar] [CrossRef]
- Severson, K.; Martín, M.; Grossmann, I.E. Optimal integration for biodiesel production using bioethanol. AIChE J. 2013, 59, 834–844. [Google Scholar] [CrossRef]
- Google Maps. Available online: maps.google.com (accessed on 16 October 2014).
- BlueMM. Excel Formula to Calculate Distance between 2 Latitude, Longitude (lat/lon) Points (GPS Positions). Available online: bluemm.blogspot.com/2007/01/excel-formula-to-calculate-distance.html (accessed on 6 September 2020).
- Egieya, J.M.; Čuček, L.; Zirngast, K.; Isafiade, A.J.; Pahor, B.; Kravanja, Z. Synthesis of biogas supply networks using various biomass and manure types. Comput. Chem. Eng. 2019, 122, 129–151. [Google Scholar] [CrossRef]
- Bentsen, N.; Felby, C. Biomass for energy in the European Union—A review of bioenergy resource assessments. Biotechnol. Biofuels 2012, 5, 25. [Google Scholar] [CrossRef] [PubMed] [Green Version]
- FAOSTAT. Crops. Available online: Fao.org/faostat/en/#data/QC/ (accessed on 10 August 2020).
- Ovando, P.; Caparrós, A. Land use and carbon mitigation in Europe: A survey of the potentials of different alternatives. Energy Policy 2009, 37, 992–1003. [Google Scholar] [CrossRef]
- Statista. Forecast Volume of Maize Consumed in the European Union (EU 28) from 2015 to 2028. Available online: https://www.statista.com/statistics/614398/maize-consumption-volume-european-union-28/ (accessed on 17 August 2020).
- Statista. Forecast Volume of Wheat Consumed in the European Union (EU 28) from 2015 to 2028. Available online: https://www.statista.com/statistics/545781/wheat-consumption-volume-european-union-28/ (accessed on 18 August 2020).
- Eurostat. SHARES 2018 Summary Results (Short Assessment of Renewable Energy Sources). Available online: Ec.europa.eu/eurostat/web/energy/data/shares (accessed on 12 September 2020).
- European Union. Living in the EU. Available online: europa.eu/european-union/about-eu/figures/living_en (accessed on 2 October 2020).
- Ministry of Economic Development and Technology of the Republic of Slovenia. Prices of Petroleum Products. (In Slovenian). Available online: gov.si/teme/cene-naftnih-derivatov/ (accessed on 18 September 2020).
- Zore, Ž.; Čuček, L.; Kravanja, Z. Synthesis of sustainable production systems using an upgraded concept of sustainability profit and circularity. J. Clean. Prod. 2018, 201, 1138–1154. [Google Scholar] [CrossRef]
- Delft University of Technology. The Model of the Eco-Costs/Value Ratio (EVR). Available online: ecocostsvalue.com/ (accessed on 30 September 2020).
- NREL. JEDI—Jobs and Economic Development Impact Models. Available online: nrel.gov/analysis/jedi/ (accessed on 7 September 2020).
- EUROSTAT. Unemployed Statistics. Available online: https://ec.europa.eu/eurostat/statistics-explained/index.php/Unemployment_statistics (accessed on 17 September 2020).
- Fischer, R. Average Monthly Salary in European Union 2020. Available online: https://www.reinisfischer.com/average-monthly-salary-european-union-2020 (accessed on 17 October 2020).
- Hendriks, C.; Vogtländer, J. The Eco Costs/Value Ratio, Materials and Ecological Engineering; AEneas, Technical Publishers: Boxtel, The Netherlands, 2004. [Google Scholar]
- Waibel, M.W.; Steenkamp, L.P.; Moloko, N.; Oosthuizen, G.A. Investigating the effects of smart production systems on sustainability elements. Procedia Manuf. 2017, 8, 731–737. [Google Scholar] [CrossRef]
Figure 1.
The European Union (EU)-27 divided into 132 zones. The map is taken from Google Maps (2020). EU-27: EU with 27 countries as of May 2020.
Figure 1.
The European Union (EU)-27 divided into 132 zones. The map is taken from Google Maps (2020). EU-27: EU with 27 countries as of May 2020.

Figure 2.
Trade-off between eco and economic profits.
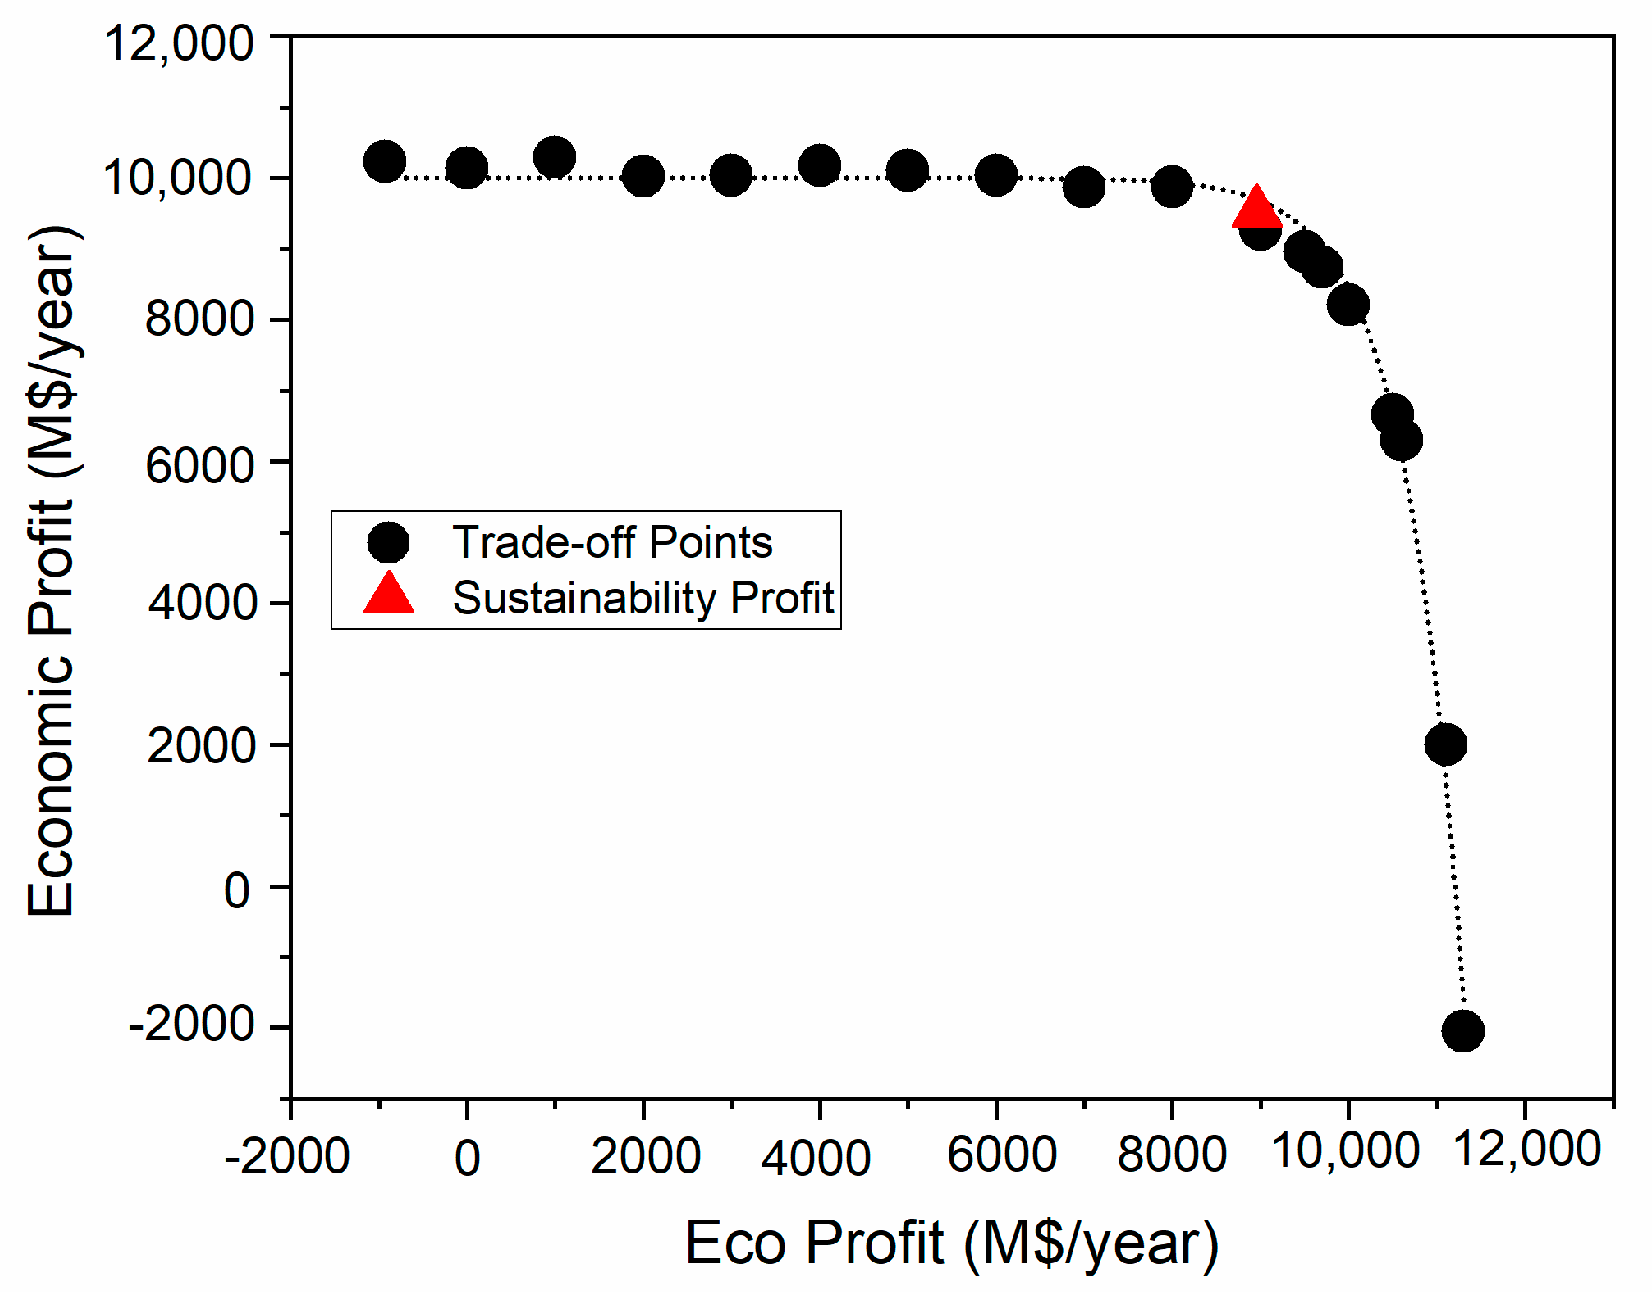
Figure 3.
Economic profit from an industrial perspective and locations of the selected technologies when maximizing sustainability profit.
Figure 3.
Economic profit from an industrial perspective and locations of the selected technologies when maximizing sustainability profit.
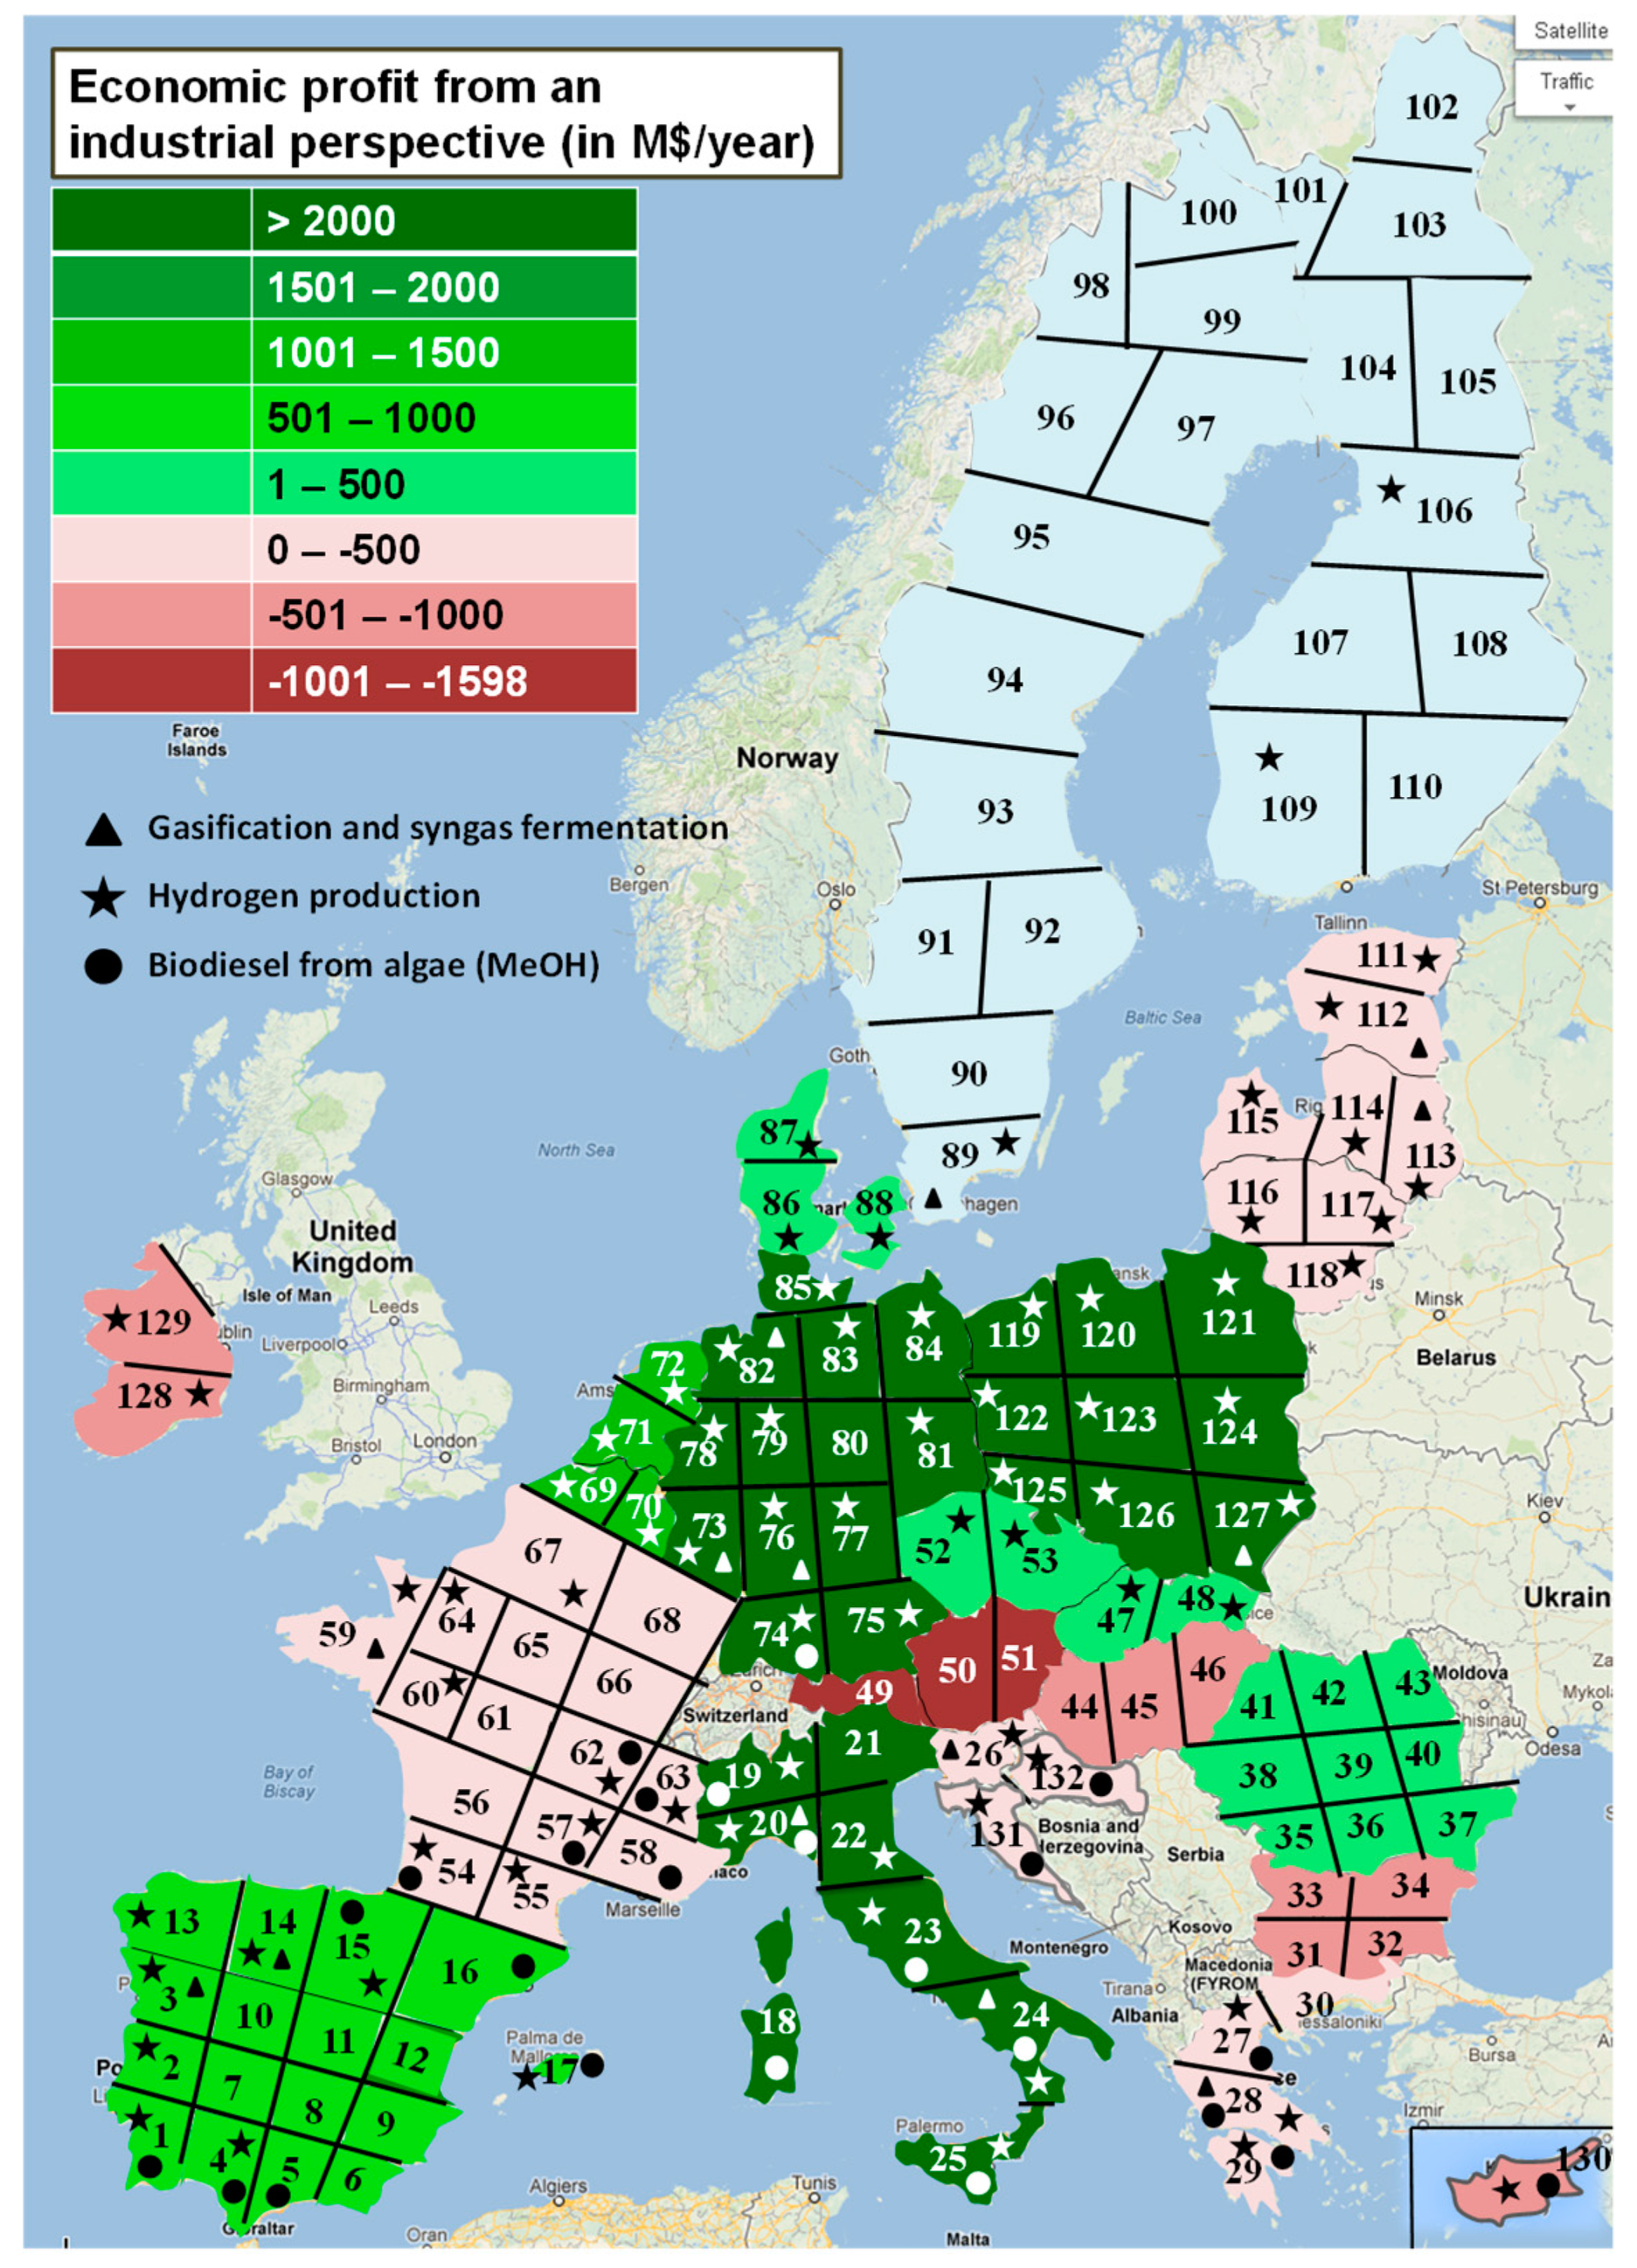
Figure 4.
Usage of available area when maximizing different profits.
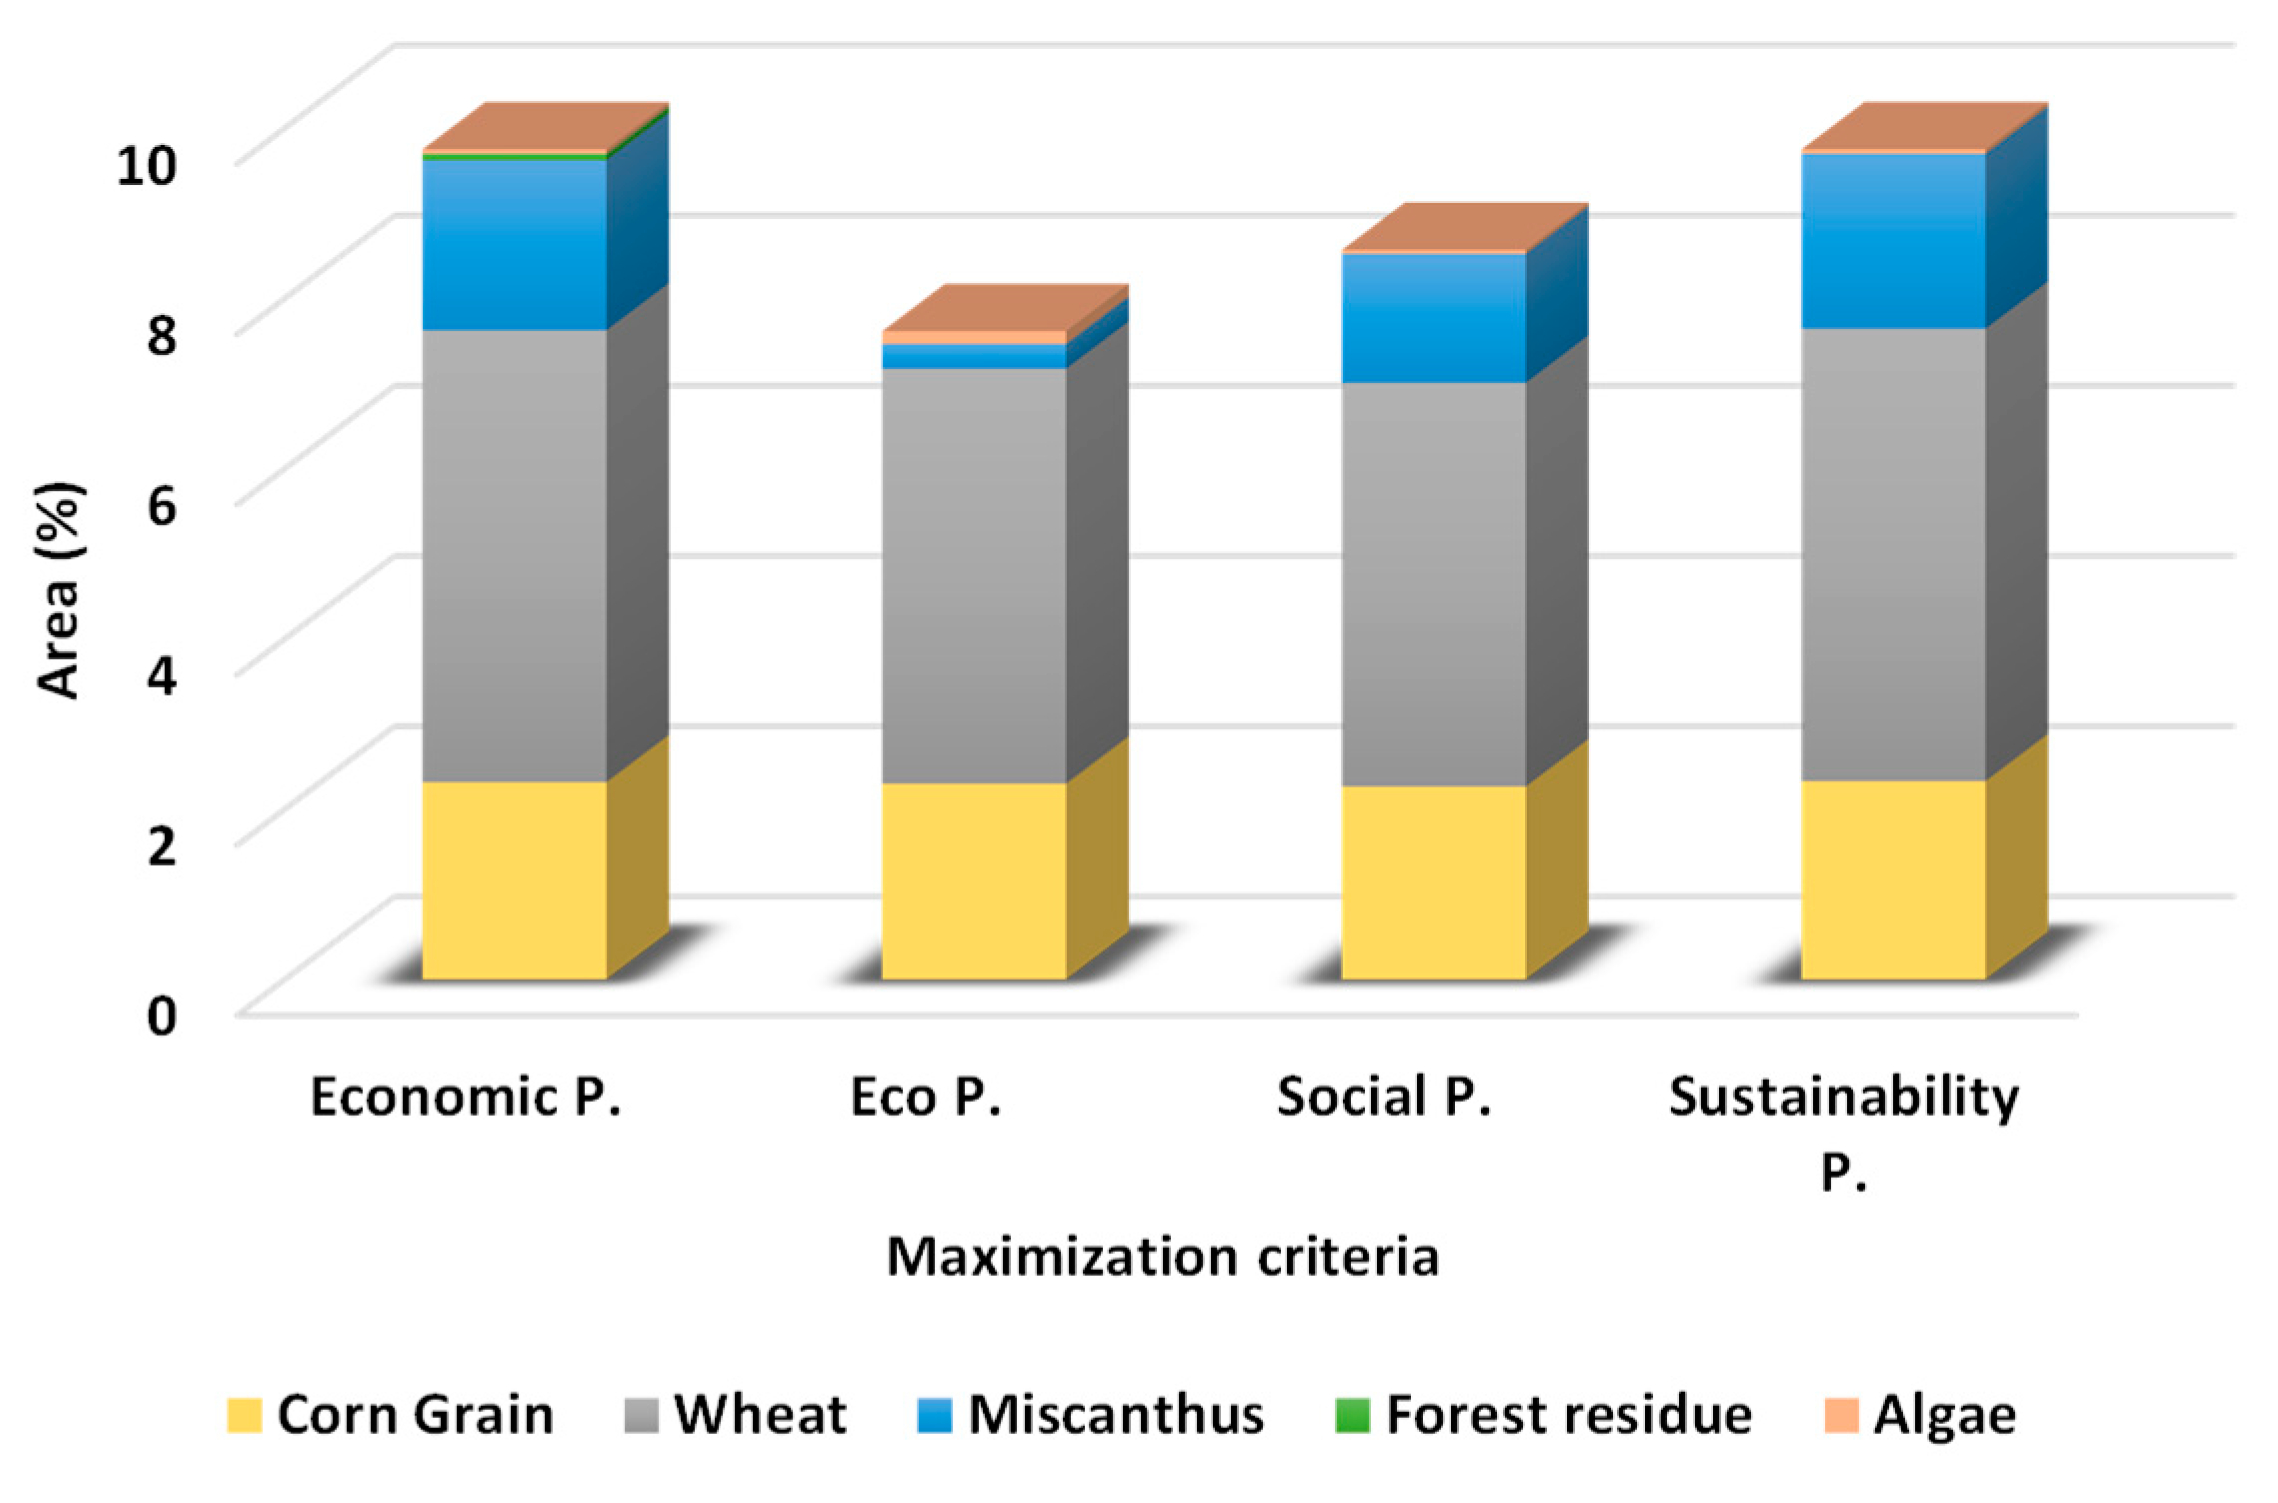
Figure 5.
Production of (a) corn grain, (b) wheat, (c) algae, and (d) miscanthus when maximizing sustainability profit.
Figure 5.
Production of (a) corn grain, (b) wheat, (c) algae, and (d) miscanthus when maximizing sustainability profit.
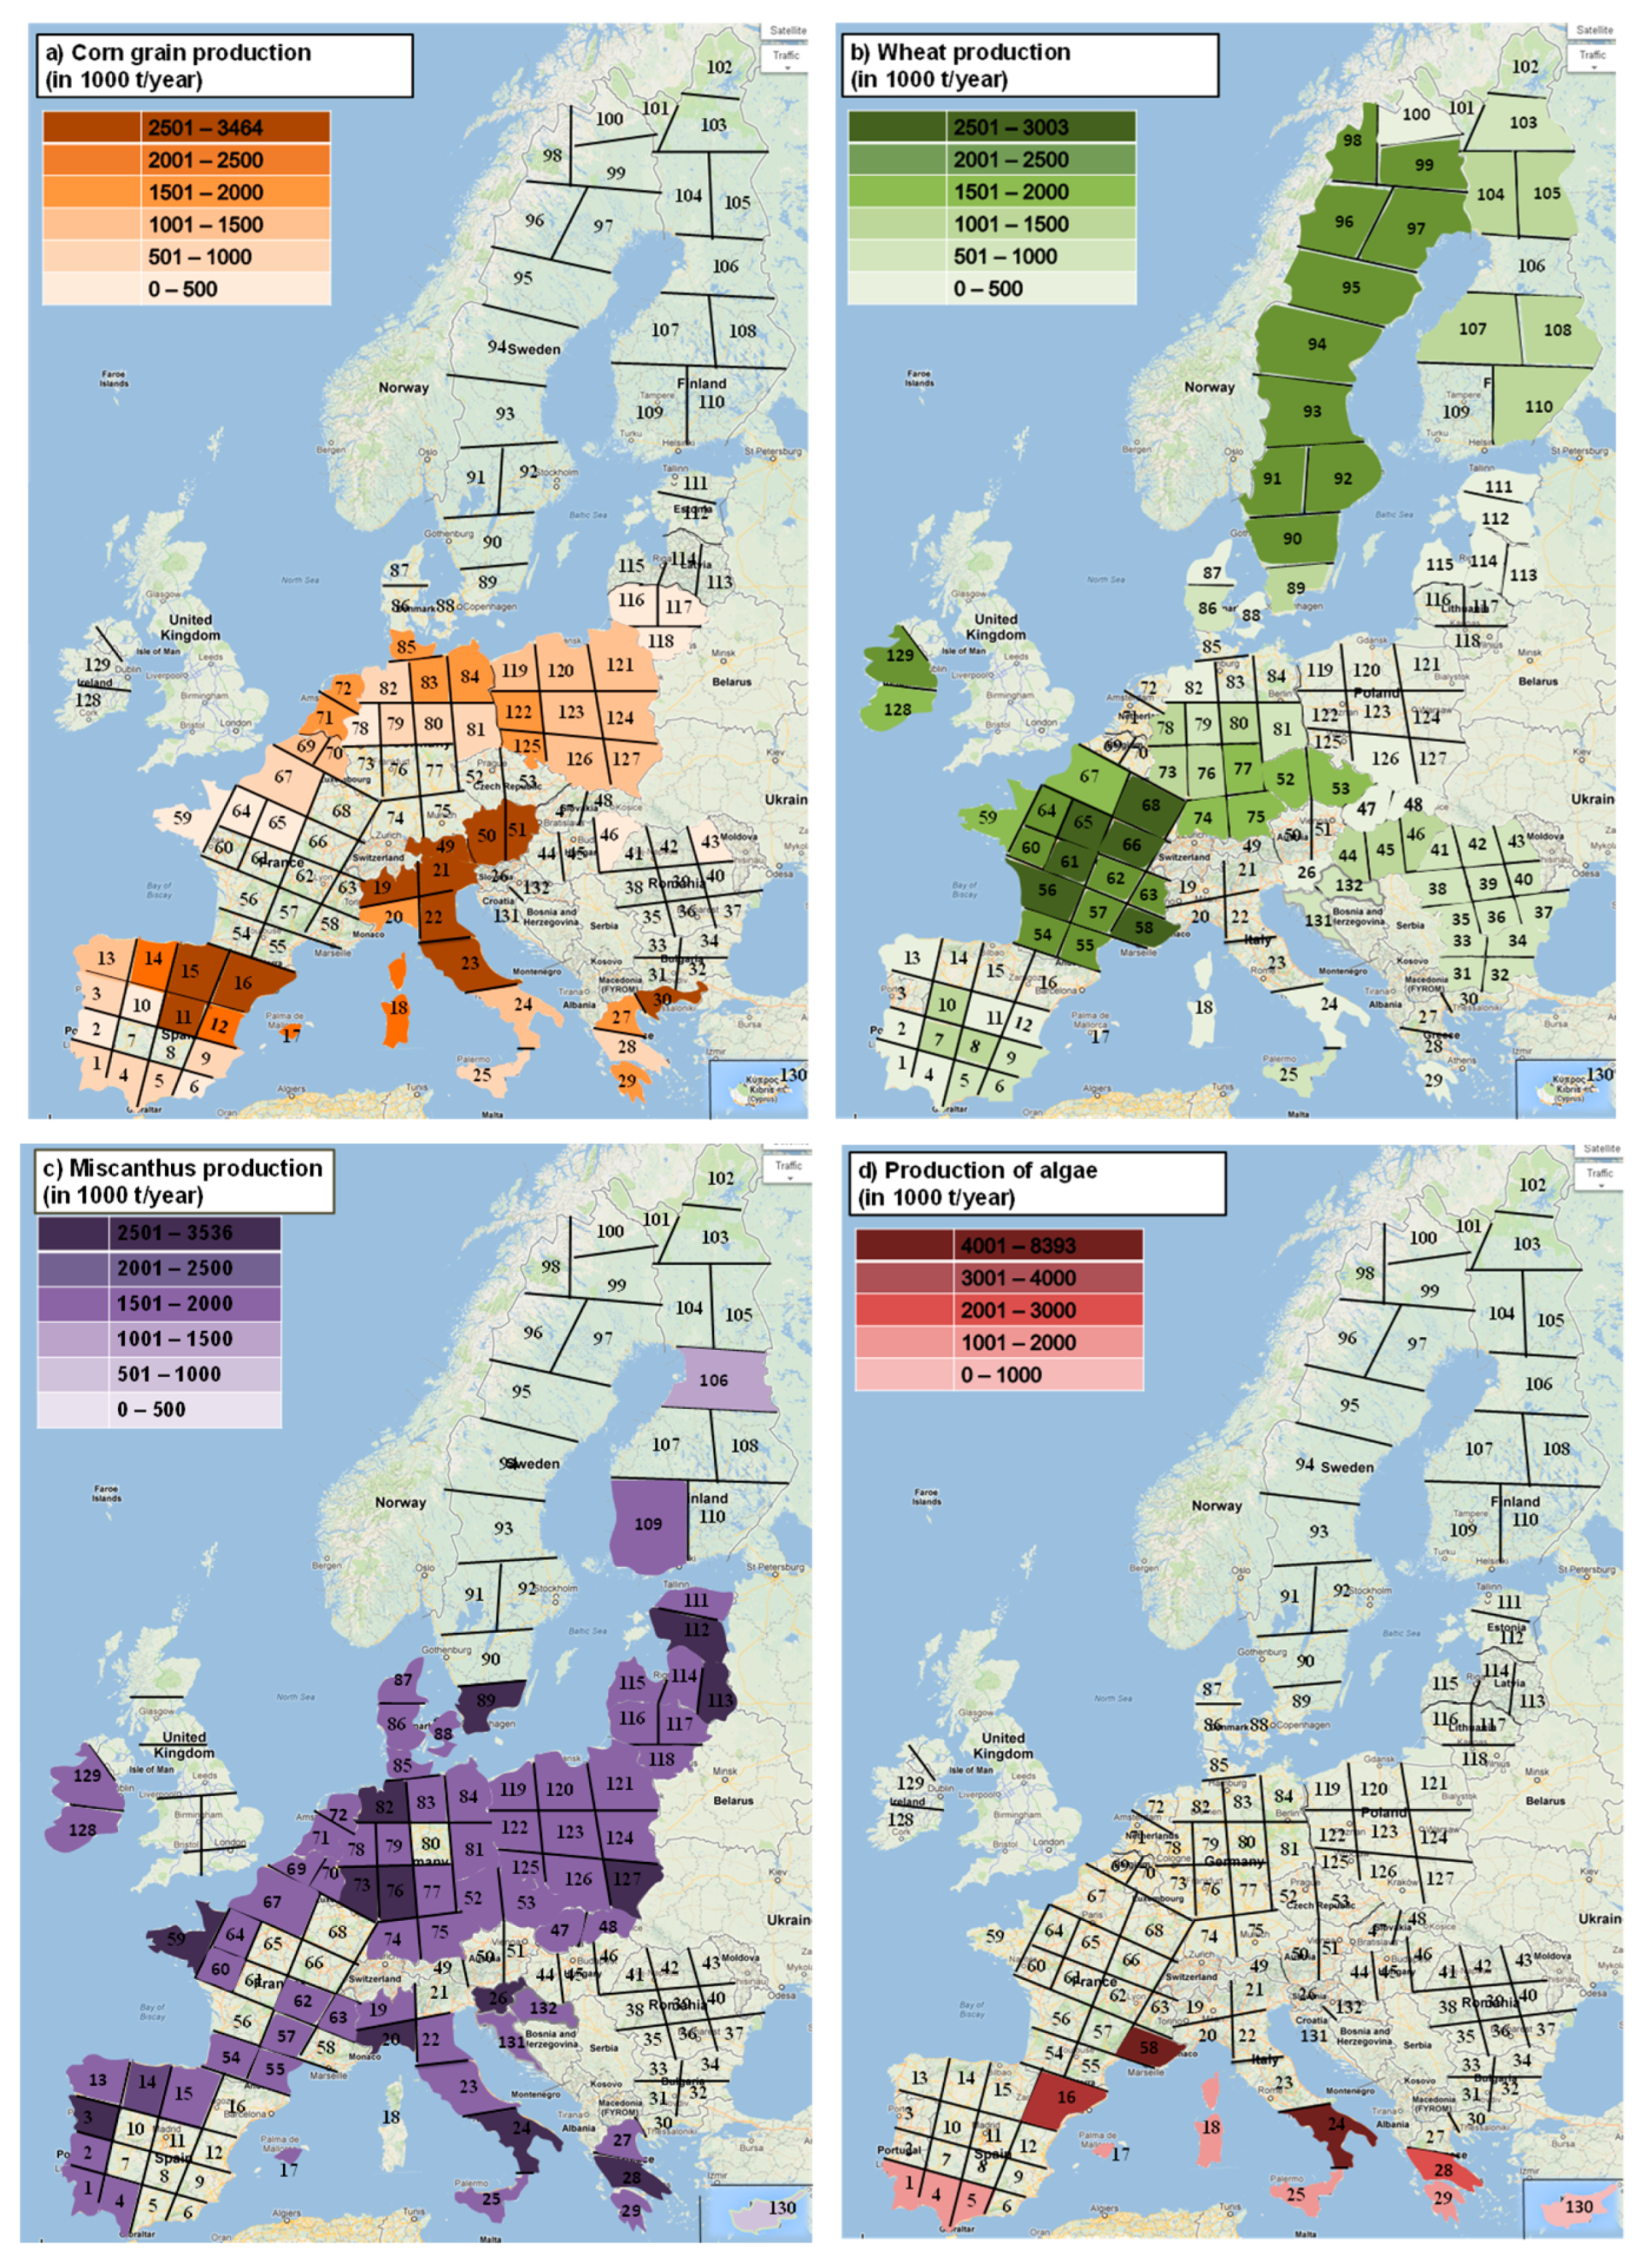
Figure 6.
Usage of available area when applying different maximization criteria for Scenario 2.

Figure 7.
Usage of the area when applying different maximization criteria for (a) third and (b) fourth scenario.
Figure 7.
Usage of the area when applying different maximization criteria for (a) third and (b) fourth scenario.
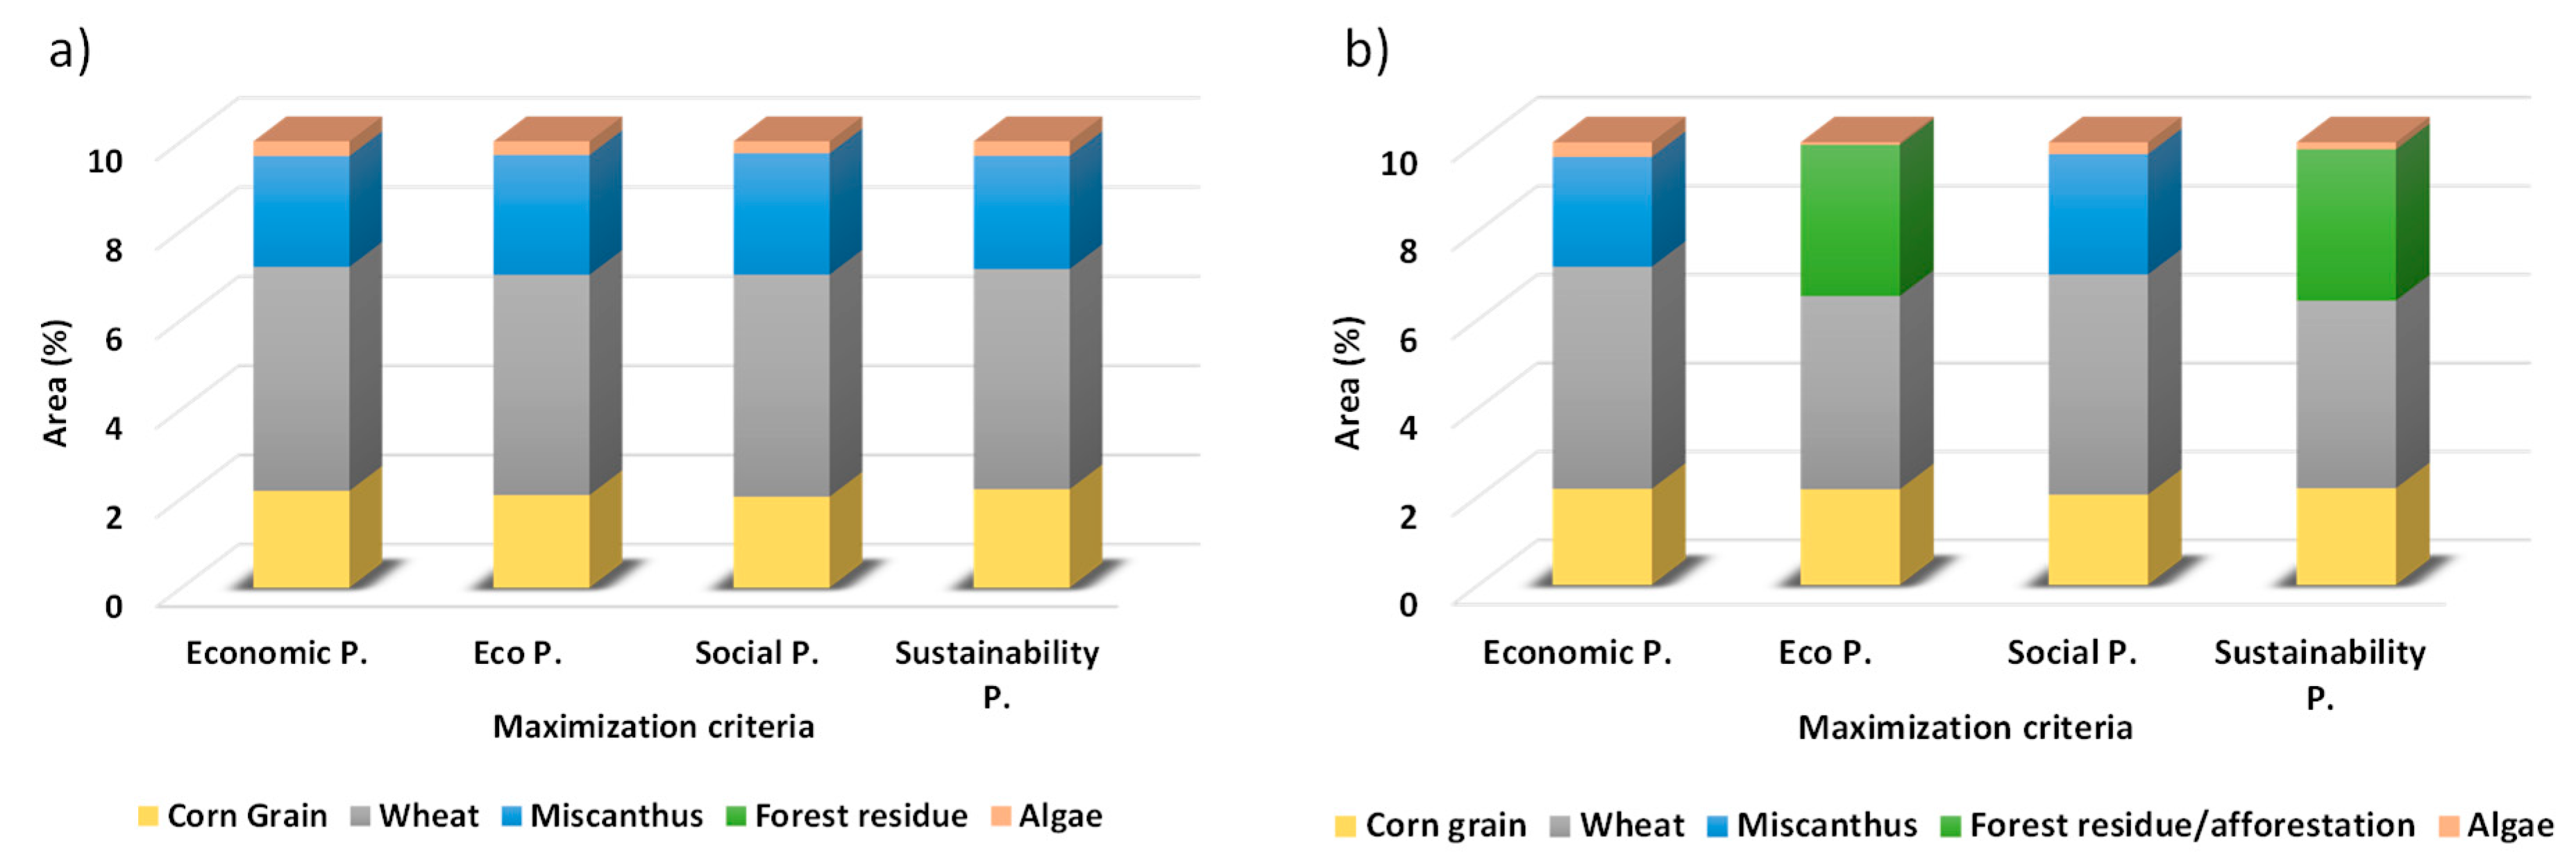
Figure 8.
Production of (a) gasoline and (b) diesel substitutes for Scenario 3 (the highest possible production of biofuels) when maximizing sustainability profit.
Figure 8.
Production of (a) gasoline and (b) diesel substitutes for Scenario 3 (the highest possible production of biofuels) when maximizing sustainability profit.
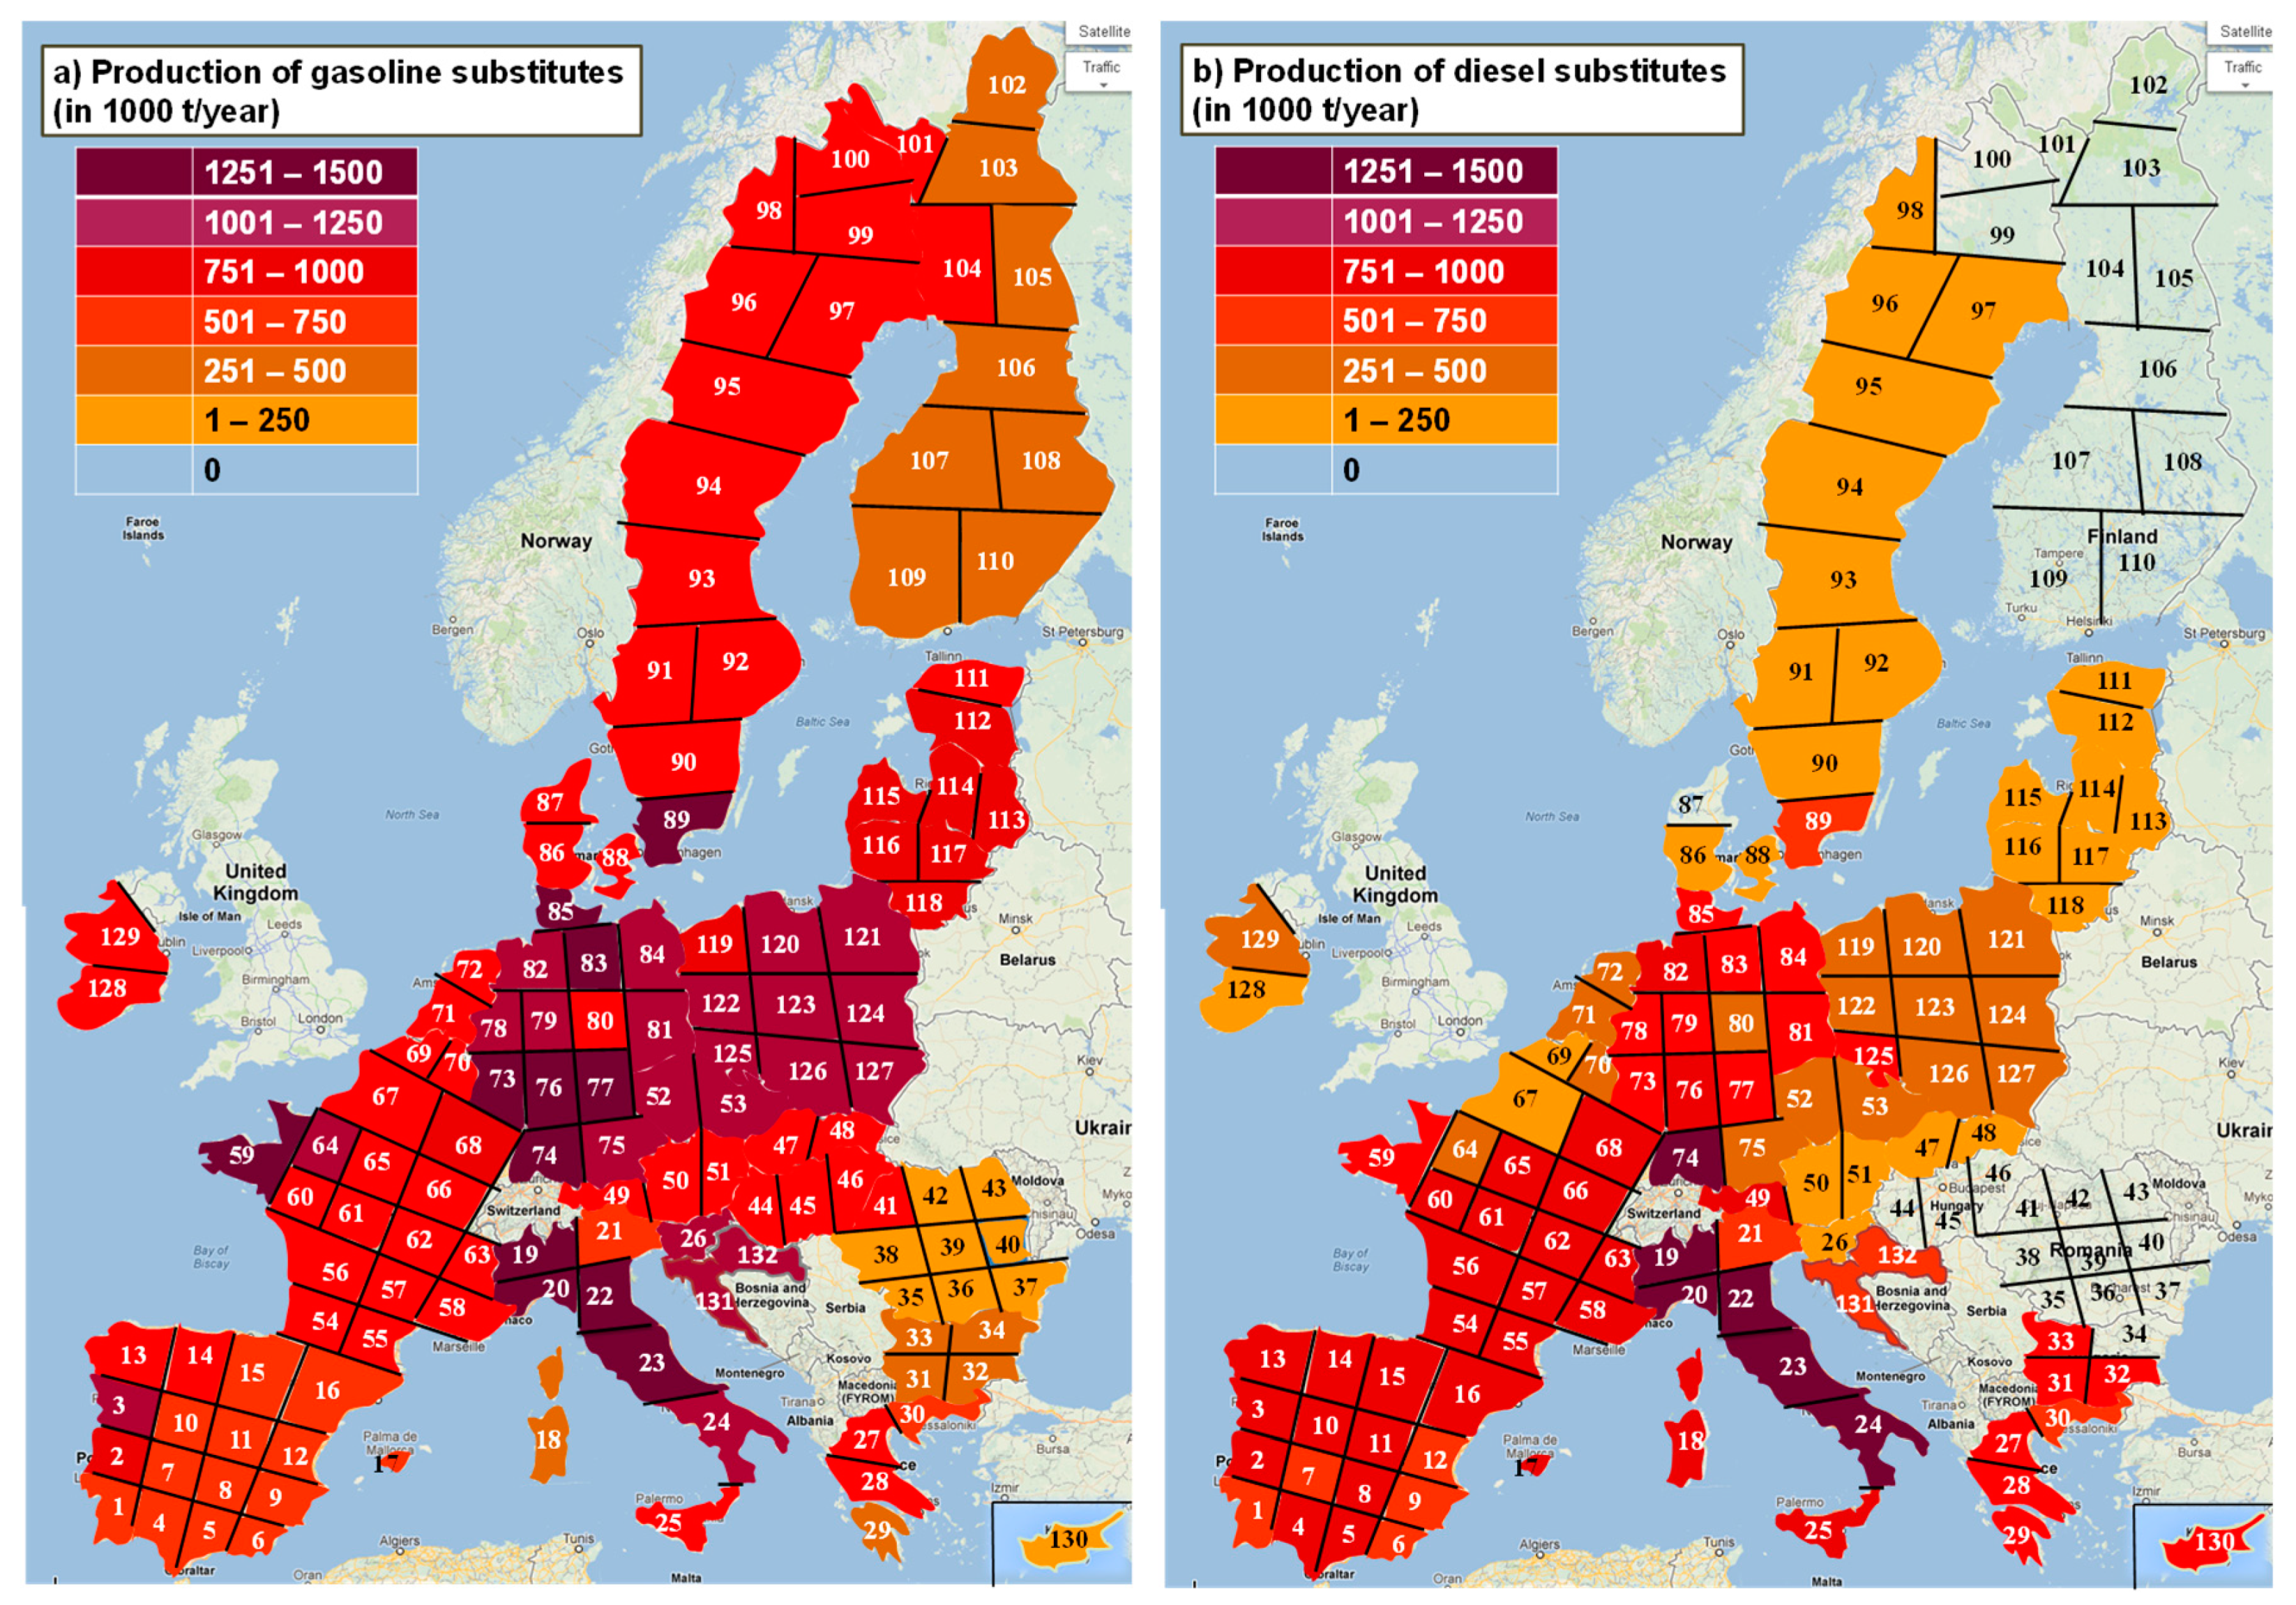
Figure 9.
Influence of costs of raw materials on different objectives: (a) sustainability and economic profit, (b) investment cost, (c) production cost, and (d) transportation cost.
Figure 9.
Influence of costs of raw materials on different objectives: (a) sustainability and economic profit, (b) investment cost, (c) production cost, and (d) transportation cost.
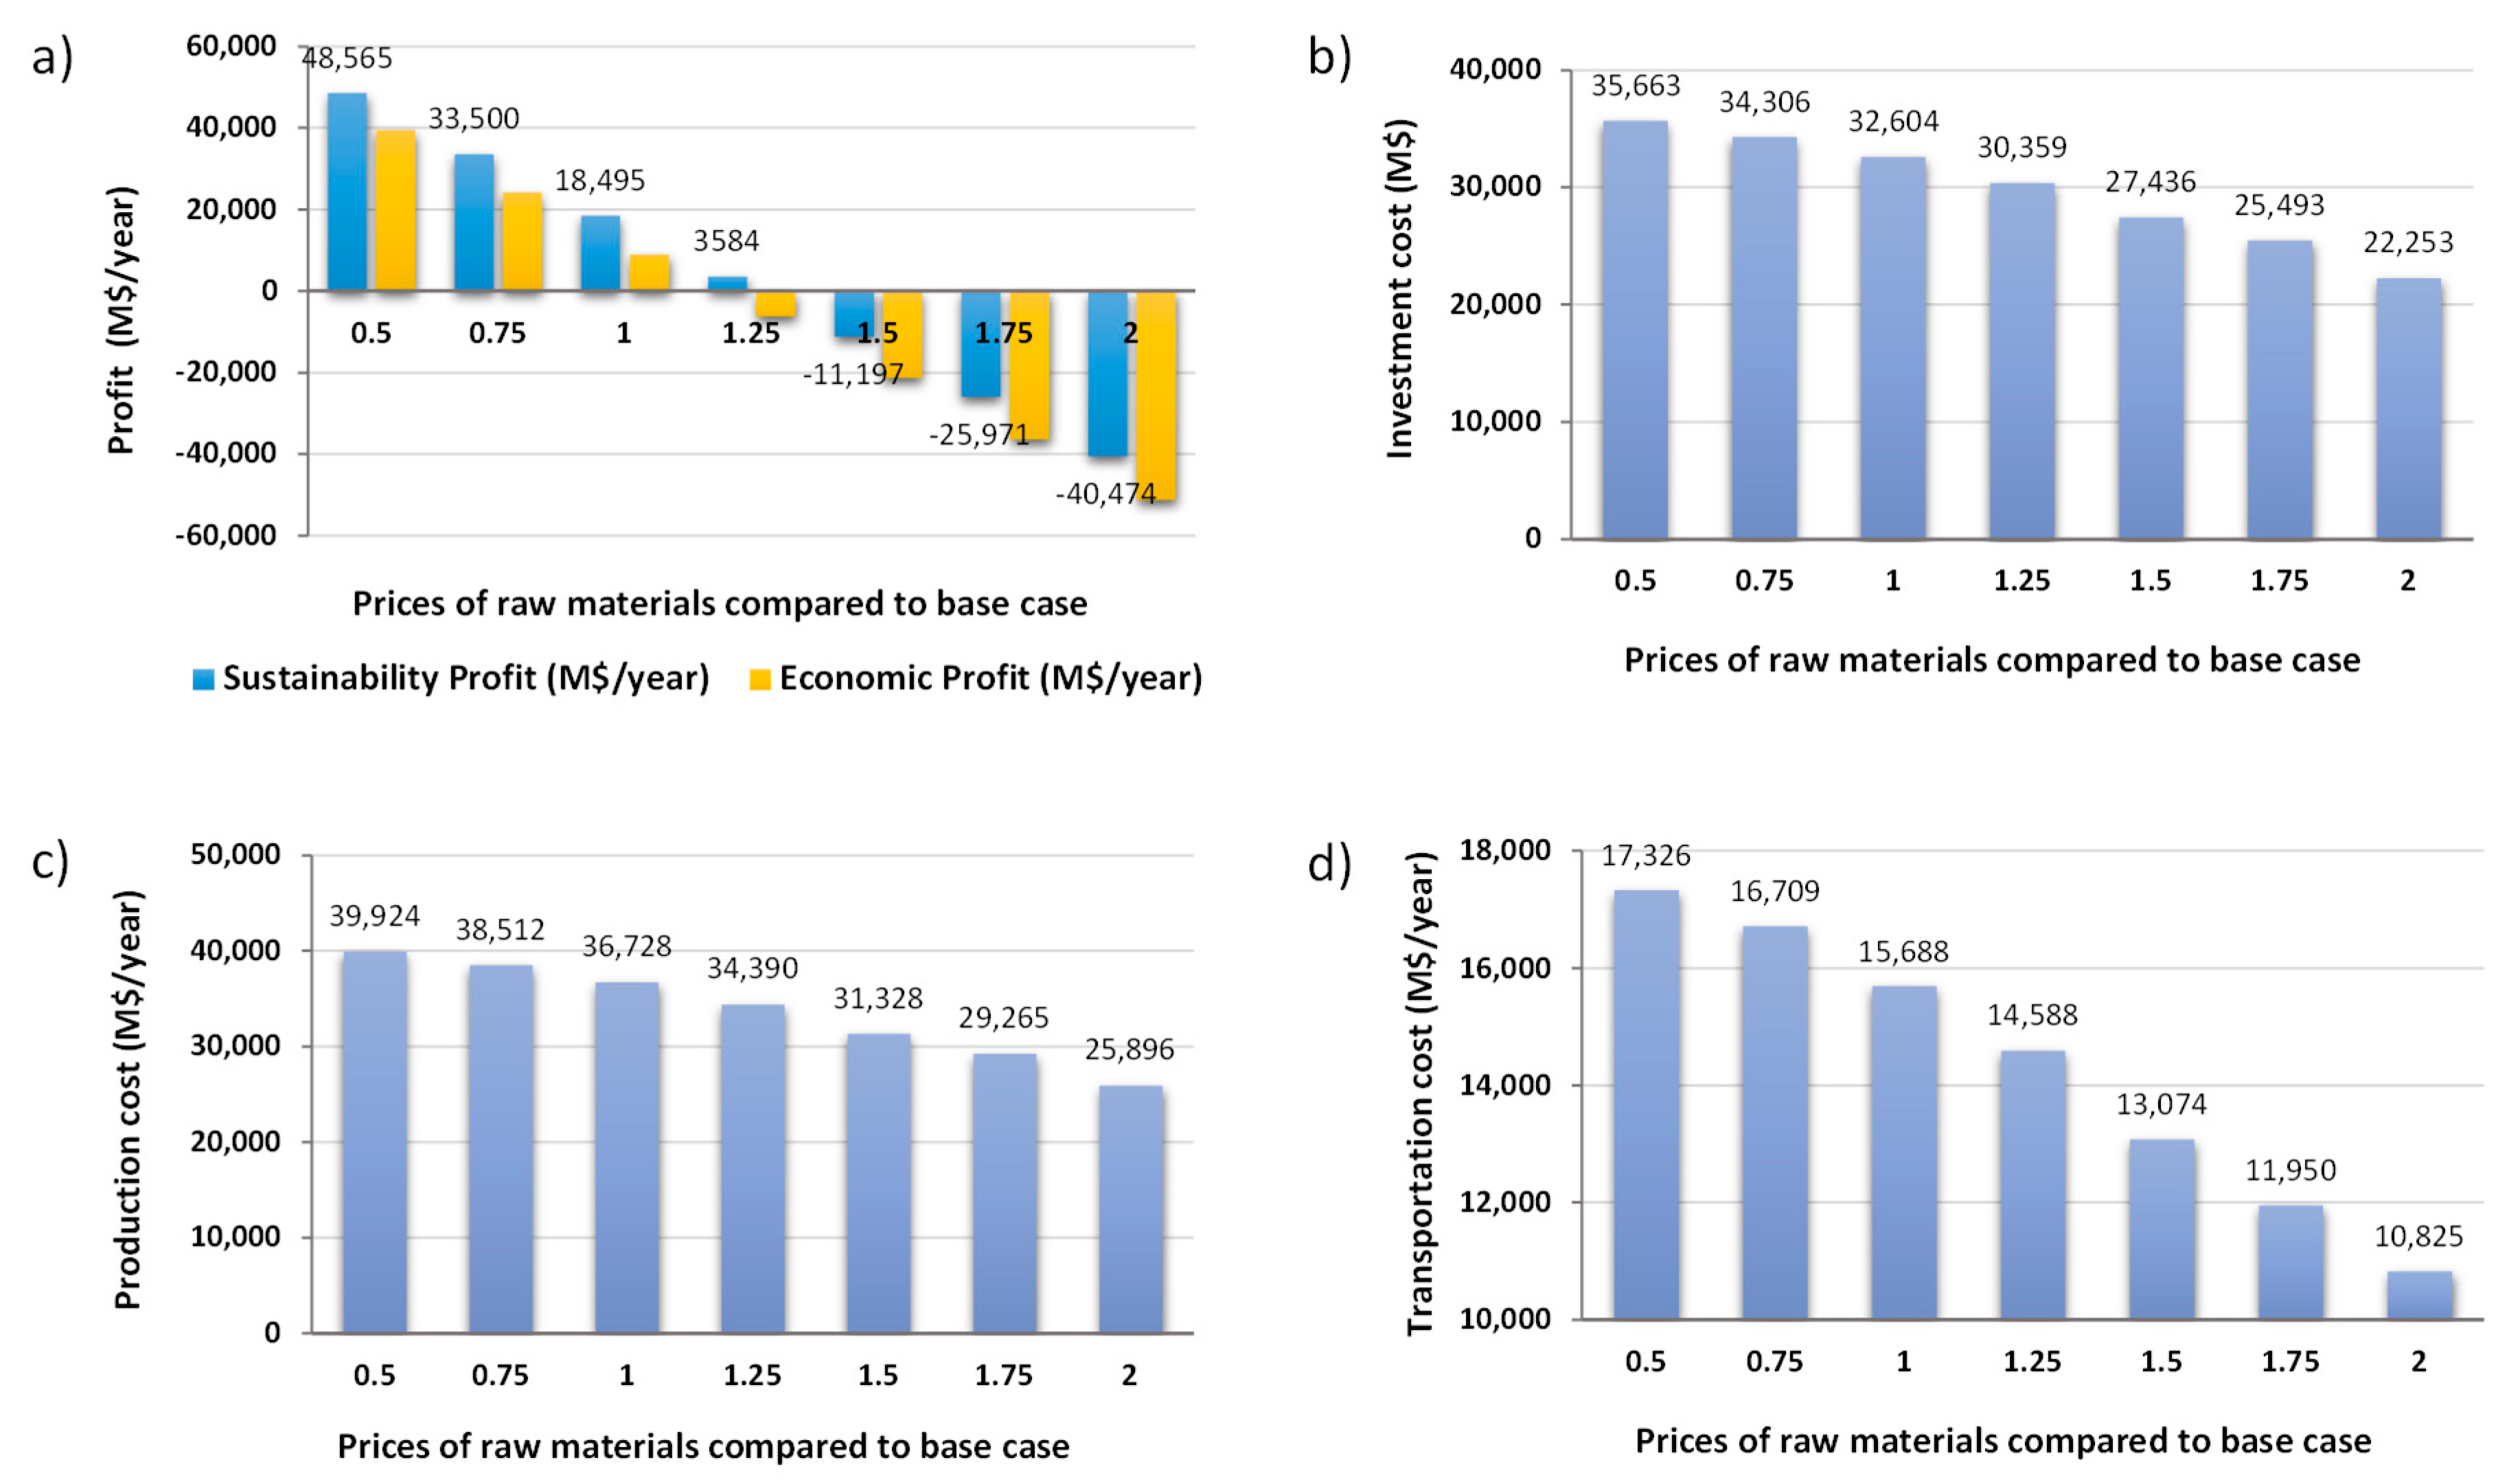
Figure 10.
Influence of product selling prices on (a) sustainability and economic profit, (b) investment cost, (c) production cost, and (d) transportation cost.
Figure 10.
Influence of product selling prices on (a) sustainability and economic profit, (b) investment cost, (c) production cost, and (d) transportation cost.

Figure 11.
Influence of eco cost/benefit coefficient for additional land use on (a) economic, eco, and sustainability profit and (b) production of biofuels and percentage of afforested area.
Figure 11.
Influence of eco cost/benefit coefficient for additional land use on (a) economic, eco, and sustainability profit and (b) production of biofuels and percentage of afforested area.


Table 1.
Demands for food and transportation fuels (all types, i.e., fossil-based fuels and biofuels) by country (in 1000 t/year) and share of renewables in transport sector in 2018 in percentage.
Table 1.
Demands for food and transportation fuels (all types, i.e., fossil-based fuels and biofuels) by country (in 1000 t/year) and share of renewables in transport sector in 2018 in percentage.
| Country/Product | Corn Grain | Wheat | Gasoline | Diesel | Share of Renewable Energy |
|---|---|---|---|---|---|
| Austria | 1396 | 2189 | 1628 | 6661 | 9.8 |
| Belgium | 1806 | 2831 | 1670 | 6982 | 6.6 |
| Bulgaria | 1103 | 1730 | 490 | 2183 | 8.1 |
| Croatia | 643 | 1007 | 478 | 1502 | 3.9 |
| Cyprus | 138 | 216 | 334 | 314 | 2.7 |
| Czechia | 1679 | 2632 | 1575 | 4644 | 6.5 |
| Denmark | 915 | 1435 | 1365 | 2926 | 6.6 |
| Estonia | 209 | 327 | 261 | 539 | 3.3 |
| Finland | 870 | 1364 | 1344 | 2731 | 14.9 |
| France | 10,563 | 16,560 | 8069 | 34,362 | 9.0 |
| Germany | 13,086 | 20,516 | 17,197 | 35,541 | 7.9 |
| Greece | 1690 | 2650 | 2239 | 2687 | 3.8 |
| Hungary | 1540 | 2415 | 1398 | 3138 | 7.7 |
| Ireland | 773 | 1212 | 797 | 3190 | 7.2 |
| Italy | 9514 | 14,916 | 7167 | 23,010 | 7.7 |
| Latvia | 303 | 474 | 185 | 858 | 4.7 |
| Lithuania | 440 | 691 | 229 | 1698 | 4.3 |
| Netherlands | 2724 | 4271 | 4150 | 6231 | 9.6 |
| Poland | 5986 | 9384 | 4451 | 14,975 | 5.6 |
| Portugal | 1620 | 2540 | 1004 | 4435 | 9.0 |
| Romania | 3060 | 4798 | 1385 | 4701 | 6.3 |
| Slovakia | 859 | 1347 | 560 | 1978 | 7.0 |
| Slovenia | 328 | 514 | 408 | 1504 | 5.5 |
| Spain | 7399 | 11,599 | 4936 | 23,966 | 6.9 |
| Sweden | 1613 | 2528 | 2093 | 4576 | 29.7 |
| EU | 70,257 | 110,146 | 65,816 | 197,254 |
Table 2.
Cost of raw materials and selling prices for products in $/t.
| Raw Material | Cost | Product | Selling Price |
|---|---|---|---|
| Corn grain | 210 | Corn grain | 260 |
| Wheat | 260 | Wheat | 290 |
| Corn stover | 60 | Ethanol | 667 |
| Wheat straw | 60 | Green gasoline | 1063 |
| Miscanthus | 56 | Biodiesel/FT diesel | 841/956 |
| Forest residue | 47 | Hydrogen | 1580 |
| Algal oil | 131 | DDGS | 170 |
| Waste cooking oil | 200 | Glycerol | 600 |
Table 3.
Individual profits and sustainability profit, technologies, and total number of new jobs generated under different maximization criteria when meeting the EU target.
Table 3.
Individual profits and sustainability profit, technologies, and total number of new jobs generated under different maximization criteria when meeting the EU target.
| Maximization Criteria | ||||
|---|---|---|---|---|
| Profit (M$/Year) | Economic Profit | Eco Profit | Social Profit | Sustainability Profit |
| Economic profit | 11,274.11 | −21,696.92 | −77,225.17 | 8955.34 |
| Eco profit | −927.31 | 12,134.86 | −18,036.33 | 9514.71 |
| Social profit | 30.56 | 15.71 | 48.87 | 25.28 |
| Sustainability profit | 10,376.99 | −9546.35 | −95,212.63 | 18,495.34 |
| Technologies | ||||
| Gasification and syngas fermentation | ● | ● | ● | |
| Gasification and catalytic synthesis | ● | |||
| Gasification and lignocellulosic hydrogen production | ● | ● | ● | |
| Biodiesel production from algae | ● | ● | ● | ● |
| Biodiesel production from waste cooking oil | ● | |||
| New jobs | 48,588 | 23,845 | 51,727 | 39,315 |
Table 4.
Economic and Normalized Profit for each EU Member State from an industrial point of view when maximizing sustainability profit.
Table 4.
Economic and Normalized Profit for each EU Member State from an industrial point of view when maximizing sustainability profit.
| Country | Economic Profit (M$/Year) | Normalized Profit M$/(Year·Mpeople) | Country | Economic Profit (M$/Year) | Normalized Profit M$/(Year·Mpeople) |
|---|---|---|---|---|---|
| Austria | −1597.81 | −182.13 | Ireland | −760.59 | −155.09 |
| Belgium | 987.40 | 86.98 | Italy | 5067.70 | 83.64 |
| Bulgaria | −967.49 | −136.23 | Latvia | −48.52 | −24.88 |
| Croatia | −178.73 | −43.02 | Lithuania | −31.39 | −11.02 |
| Cyprus | −588.65 | −688.64 | Netherlands | 1299.11 | 76.05 |
| Czechia | 353.59 | 33.42 | Poland | 4288.89 | 112.95 |
| Denmark | 403.86 | 70.25 | Portugal | 801.18 | 77.71 |
| Estonia | −290.49 | −220.80 | Romania | 7.75 | 0.39 |
| Finland * | - | - | Slovakia | 169.68 | 31.22 |
| France | −283.11 | −4.23 | Slovenia | −289.32 | −140.05 |
| Germany | 8781.65 | 106.42 | Spain | 718.20 | 15.44 |
| Greece | −296.26 | −27.51 | Sweden * | - | - |
| Hungary | −547.51 | −55.88 |
* Country already achieved target of at least a 14% share of renewable energy in the transport sector.
Table 5.
Main results of sustainability optimization for different scenarios.
| Scenario 1 | Scenario 2 | Scenario 3 | Scenario 4 | |
|---|---|---|---|---|
| Sustainability profit (M$/year) | 18,495 | 84,927 | 86,456 | 113,439 |
| Raw materials for food (kt/year) | ||||
| corn grain | 70,257 | 70,257 | 70,257 | 70,257 |
| Wheat | 110,146 | 110,146 | 110,146 | 110,146 |
| Raw materials for fuel(kt/year) | ||||
| corn stover | 13,054 | 19,786 | ||
| wheat straw | 22,088 | 107,689 | 107,890 | |
| Miscanthus | 140,495 | 206,778 | ||
| forest residue | 86 | 830 | ||
| cooking oil | 4218 | 4399 | ||
| algae (algal oil) | 14,067 | 14,067 | 35,104 | 30,959 |
| Technologies | ||||
| gasification and syngas fermentation | ● | ● | ● | ● |
| gasification and FT synthesis | ● | ● | ||
| gasification and lignocellulosic hydrogen production | ● | ● | ● | |
| biodiesel production from algae * | ● | ● | ● | ● |
| biodiesel production from WCO ** | ● | ● | ||
| Biofuels (kt/year) | ||||
| Bioethanol | 6367.15 | 6367.15 | 43,395.64 | 17,313.00 |
| green gasoline | 9879.41 | 3818.89 | ||
| Biodiesel | 13,504.86 | 13,504.86 | 37,748.44 | 33,943.78 |
| FT-diesel | 37,165.41 | 14,366.31 | ||
| Hydrogen | 14,007.46 | 992 | 4252.89 | 1815.37 |
| Afforestation (% of used area) | 0 | 3.57 | 0 | 3.40 |
| Number of new employees | 39,315 | 24,214 | 153,698 | 82,693 |
* Methanol is used as catalyst, ** WCO—waste cooking oil, methanol is used as catalyst.
Publisher’s Note: MDPI stays neutral with regard to jurisdictional claims in published maps and institutional affiliations. |
© 2020 by the authors. Licensee MDPI, Basel, Switzerland. This article is an open access article distributed under the terms and conditions of the Creative Commons Attribution (CC BY) license (http://creativecommons.org/licenses/by/4.0/).
Share and Cite
MDPI and ACS Style
Potrč, S.; Čuček, L.; Martin, M.; Kravanja, Z. Synthesis of European Union Biorefinery Supply Networks Considering Sustainability Objectives. Processes 2020, 8, 1588. https://doi.org/10.3390/pr8121588
AMA Style
Potrč S, Čuček L, Martin M, Kravanja Z. Synthesis of European Union Biorefinery Supply Networks Considering Sustainability Objectives. Processes. 2020; 8(12):1588. https://doi.org/10.3390/pr8121588
Chicago/Turabian StylePotrč, Sanja, Lidija Čuček, Mariano Martin, and Zdravko Kravanja. 2020. "Synthesis of European Union Biorefinery Supply Networks Considering Sustainability Objectives" Processes 8, no. 12: 1588. https://doi.org/10.3390/pr8121588
Note that from the first issue of 2016, this journal uses article numbers instead of page numbers. See further details here.