Carbon Dioxide Capture in Homogeneous and Heterogeneous Surfaces of Porous Silica Glass


School of Chemical Engineering, Institute of Engineering, Suranaree University of Technology, Nakhon Ratchasima 30000, Thailand
*
Author to whom correspondence should be addressed.
Processes 2020, 8(10), 1260; https://doi.org/10.3390/pr8101260
Submission received: 7 September 2020
/
Revised: 27 September 2020
/
Accepted: 2 October 2020
/
Published: 7 October 2020
(This article belongs to the Section Environmental and Green Processes)
Abstract
:Experimental and simulation studies for carbon dioxide (CO2) adsorption on porous silica glass were performed to reveal how surface heterogeneity can affect the adsorption mechanism of CO2. In performing the simulation, the structure of porous silica glass was modeled as a slit pore consisting of parallel walls of connected SiO4 units. The adsorption isotherms of CO2 at 283 K were generated for a series of pore widths using a Monte Carlo ensemble. The defective surfaces created by random removal of surface atoms and the surfaces containing hydroxyl functional groups were chosen to represent the surface heterogeneity for the simulation tasks. The isotherms derived for the defective surfaces showed a rapid adsorption at low pressures because of the stronger interaction between the rough nonuniform surfaces and CO2 molecules. For the role of surface functional groups, the adsorption isotherms dramatically increased with an increasing number of functional groups. The amount of CO2 adsorbed for randomly placed functional groups was greater than that for the presence of functional groups at the pore edges. The proper control of surface heterogeneity by manipulating both the amounts of hydroxyl surface groups and surface defects should help enhance the efficient capture of CO2 in porous silica glass.
1. Introduction
Due to the global warming crisis, the control of greenhouse gases, which consist predominantly of carbon dioxide, has received increasing attention from scientists and engineers [1,2,3]. Gas cleaning technologies have been developed to control the amount of carbon dioxide emitted to the atmosphere from the combustion of fossil fuels. In addition to mitigating CO2 emissions from power plants burning fossil fuels, carbon dioxide removal is also an important separation process for the purification of natural gas, biogas, and landfill gas. Adsorption has become one of the attractive separation methods for CO2 capture, due mainly to its low operating costs and low energy consumption compared with other current separation technologies such as amine absorption and membrane separation [4,5,6]. Since adsorption is extensively applied to many industries for the purification and separation of gas and liquid mixtures, the development of new advanced adsorbents for the adsorption process has therefore been the focal point of many researchers. However, the porous properties of the new adsorbents should be assessed and they can be determined by characterizing the adsorbents with various kinds of adsorptive gases. Among the possible methods developed for gas cleaning, adsorption by using porous silica glass has become a promising choice because porous silica glass possesses several advantageous characteristics, such as an ability to withstand high temperatures and chemical attacks, having relatively high impact strength, showing narrow pore size distribution, easy shaping, and capability of surface grafting with various types of functional groups for specific applications [7,8]. The investigation of CO2 adsorption on different surface structures of porous silica glass will assist researchers to tailor a potential porous solid absorbent for CO2 capture and obtain useful information on the adsorption equilibrium for the design of adsorption processes [2].
Monte Carlo (MC) simulation and Molecular Dynamics (MD) are the two molecular simulation tools that have been used to explore the microscopic properties of confined fluids in nanopores of different geometries [9,10]. To model the structure of porous silica glass, a pore was assumed to be a cylinder or a slit shape pore whose walls can be structureless (amorphous) or in the form of a perfect crystal structure [11]. However, in reality, porous silica glass contains functional groups, namely silanol groups (silicon atoms attaching to OH groups), as well as defects on its surfaces. It has been reported that the adsorption behavior of fluid on porous glass can be predicted reasonably well by using a simple pore model [12]. A set of adsorption isotherms obtained by using a Monte Carlo ensemble have been compared with the adsorption isotherms derived from the experiment to evaluate the porous properties of solids. The adsorption information generated from a solid adsorbent can then be used to describe the adsorption mechanism between the adsorbent and the adsorbate molecules.
In this study, a simple model of porous silica glass was proposed as a finite-length slit pore with two parallel walls. Each wall was arranged as an assemblage of connecting SiO4 units. The silica surfaces could contain either hydroxyl (OH) groups or defects to examine the effect of surface heterogeneity on the behavior of carbon dioxide (CO2) capture. A highly mimetic model of porous silica glass was constructed to generate CO2 adsorption isotherms for slit-shaped pores of various pore widths. In addition, the measurement of adsorption isotherms of pure CO2 at different temperatures and that of nitrogen (N2) isotherms at 77 K for the prepared porous silica glass were also conducted and used to determine the pore size distribution (PSD) of the porous silica glass. The effects of concentration and position configuration of the functional groups on the adsorption behavior of CO2 were also investigated.
2. Experimental Methods
2.1. Preparation of Porous Silica Glass
Commercial-grade sodium silicate (Na2SiO3), purchased from MMC Chemical, Bangkok, Thailand, was used as a starting precursor for the preparation of porous silica glass through the hydrolysis and condensation reactions [13]. Sodium silicate weighing 4.5 g was mixed with 70.0 mL of deionized water in a 250 mL Erlenmeyer flask and continuously stirred until a clear solution was obtained. Then, the pH of solution was adjusted to the desired value by adding a proper amount of 2M concentration of hydrochloric acid (Merck, Darmstadt, Germany). The solution was then heated on a hot plate to 40 °C and agitated for 24 h. Next, the solution was transferred into a Teflon-lined autoclave reactor (250 mL capacity, Par Instrument Company, Illinois, USA.). The reactor was then heated in an electric oven to the temperature of 100 °C and held at this temperature for 24 h. The obtained gel was removed from the autoclave and washed thoroughly with distilled water. The gel was further dried in an oven for 12 h at 105 °C and calcined in a muffle furnace at the studied temperatures of 200° and 500 °C for 4 h, as a means to control the amounts of silanol groups on the silica glass surfaces [13]. The mean pore size of the prepared porous glass was altered by varying the pH value of sodium silicate solution during the gel preparation. Three pH values of 2, 3, and 4 were studied.
2.2. Determination of Surface Silanol Group Contents
There are three types of silanol groups existing on the surface of porous silica, namely, isolated silanol, vicinal silanol, and geminal silanol, as depicted in Figure 1. The amounts of the silanol groups on the porous silica glass surface was determined by following the weight losses of porous silica in a thermogravimetric analyzer (TGA), using the method proposed in the literature [14,15]. The amounts of geminal silanol and vicinal silanol are determined from the weight loss over the temperature range of 200 to 600 °C, while the weight loss from 600 to 1000 °C indicates the amount of isolated silanol. The experimental measurement commenced by loading about 20 mg of the porous silica sample into a sample crucible of the TGA (SDT 2960 Simultaneous DTA–TGA, TA Instruments, New Castle, DE, USA.), and then heating at a constant heating rate of 10 °C/min from room temperature to the final temperature of 1000 °C under a constant flow of nitrogen gas (100 cm3/min), during which the remaining weight of the sample was continuously recorded. The derived TGA curves used for determining the silanol group contents will be presented in Section 4.1.1.
2.3. Experimental Isotherms for N2 and CO2 Adsorption
The isotherms of N2 and CO2 adsorption on the prepared porous silica glass were measured using a surface area and porosity analyzer (model ASAP 2020, Micromeritics, Norcross, GA, USA.). The measurement was performed by using about 0.2 g of porous silica sample, which were outgassed at 150 °C for 12 h prior to the measurement. The numbers of pressure points for isotherm measurement at a given temperature were specified, and the amounts adsorbed at the equilibrium condition for each increasing pressure were recorded. The adsorption steps were performed until the maximum pressure of one bar was reached and then the desorption steps (decreasing pressures) were carried out. The porous properties of porous silica glass were derived from the measured adsorption isotherms of N2 at 77 K. The BET surface area of the porous silica glass was computed using the BET equation [16]. The mesopore volume and mesopore surface area were estimated by the BJH theory [16]. The total pore volume was calculated by converting the amount of N2 adsorbed at the relative pressure (P/P0) of 0.98, into the volume of N2 in liquid state. The micropore volume was determined by subtracting the mesopore volume from the total pore volume. The average pore size was calculated from 4V/A, where V and A are the total pore volume, and the BET surface area, respectively. The adsorption behavior of CO2 by porous silica glass was evaluated from the measured isotherms of CO2 at 273, 283, and 293 K.
3. Computational Methodology
3.1. Fluid Model
The fluid model of CO2 used for the GCMC simulation is the 3-Center-Lennard-Jones (LJ) molecule proposed by Harris and Yung [17]. The model consists of interaction sites situated at the center of mass containing three-point charges, that is, one positive charge for the carbon atom and two negative charges for the oxygen atoms. The distance between the C-O bond of the CO2 molecule is 1.16 Å, while the bond angle of O-C-O is fixed at 180°. Table 1 shows the molecular parameters and partial point charges of CO2 and SiO4 used for the simulation, where ɛ is the energy well depth of the atoms., kb is the Boltzman’s constant, and the point charge on each site is designated as q.
The potential energy of interaction between fluids and the interaction between the fluids and solids are estimated by the Lennard-Jones 12-6 potential equation as shown in Equation (1) [9].
where rij is the distance between the collision diameter of sites i and j for two fluid molecules or between the collision diameter of site i of the fluid molecule and that of site j of the solid molecule, σij and εij are the collision diameter and energy well depth, respectively, of site i and j. The cut-off radius used in this investigation is 5σff, where σff is the collision diameter of carbon atoms of CO2 and ε is the energy well depth of the atoms. Not only the potential energy between two Lennard-Jones sites is considered, but the interaction due to electrostatic charges is also taken into account for the polar molecules of CO2 and SiO4. The electrostatic interaction between different molecules is estimated by using Coulomb’s law, as shown in Equation (2) [9].
where qi and qj is the charge on sites i and j, respectively, rij is the separation distance between two electrostatic charges on sites i and j, and the permittivity of free space is denoted as ε0.
3.2. Porous Silica Glass Model
The porous silica model used in this study is taken as a slit-shape pore whose length is finite with equal dimensions in the X and Y axes of 60 Å. The slit pore consists of two opposite walls in parallel and the separating distance between the two walls is represented as the pore width (H), as shown in Figure 2. Each wall is composed of SiO4 unit linkage, which forms a tetrahedral configuration. The center of each unit is a silicon atom and the four tetrahedron vertices are the position of the oxygen atoms. The dispersive sites having a negative charge of −0.36e are located at the oxygen atoms, while the silicon atom has a positive charge of +0.18e [18]. The molecular parameters of SiO4 used in this study are shown in Table 1 with εss/kb of 185.0 K, σss of 2.708 Å [19], and the angle of O-Si-O is about 147° [20]. The solid configuration model is depicted in Figure 2.
3.3. Model of Surface Functional Groups
The model for a silanol functional group (Si-OH) existing on the silica surface is essentially represented by the presence of hydroxyl (OH) group. The dispersive sites of the OH group are located at the oxygen atom having a charge of −0.64e and at the hydrogen atom having a positive charge of +0.45e. The molecular parameters of OH are also presented in Table 1 with ɛss/kb of 78.23 K, and σss of 3.07 Å [21]. The center of the oxygen atoms of the OH group is 1.364 Å from the pore wall and perpendicular to the wall. The separating distance between the hydrogen and oxygen atom is 0.96 Å, and the angle between the oxygen and hydrogen atom of the O-H group is about 109° [19].
In this paper, two models for the functional group allocation or the placement configuration of the functional group were investigated to examine how the functional group positions could affect the CO2 capture in porous silica glass. For the first model, OH groups are randomly placed on the inner surface of each wall, as delineated in Figure 3a. As to the second model, OH groups are fixed and located along the pore edges, as shown in Figure 3b. The reason for choosing this type of functional group model is because there is a possibility that the surface functional groups could situate around the edges of the adsorbent sheet, as reported, for example, for the case of activated carbon, which contains various types of surface functionalities at the edge sites of the graphene planes [22]. From here on, the first model and the second model are referred to as the random topology model and the fixed topology model, respectively.
3.4. Defective Surfaces
In reality, the surface of porous silica glass is not homogeneous, and its surface structure is not perfect crystals. To account for this surface heterogeneity, the solid model whose surfaces contain some forms of defects is introduced to explore whether the defects can affect the adsorption behaviour of CO2 in porous silica glass. The defects are firstly created by randomly removing some silicon atoms from the inner wall of SiO4 structure, thus forming initially a small hole on the solid surface. Next, either silicon or oxygen atoms, located at the boundary of a hypothetical sphere forming the initial hole having an effective radius Rc, are then randomly removed as shown in Figure 4. The different pit sizes of the surface defects are noticeable because of the possible overlapping of the adjacent pits upon increasing the numbers of atom removal. Both the magnitude of the effective radius and the percentage area of defects are specified for modeling the effect of a defective surface on CO2 adsorption, as described in the literature [23,24].
3.5. Grand Canonical Monte Carlo Ensemble
The Grand Canonical Monte Carlo (GCMC) simulation was chosen to investigate the adsorption mechanism of carbon dioxide in porous silica glass. The simulation box volume (Vpore) is determined from the pore length in X and Y axes denoted as LX and LY, respectively, and pore width (H) to give Vpore = LX × LY × H. In this ensemble, the chemical potential, the simulation box volume, and the system temperature are specified to establish the equilibrium state. A total of 1000 transposition moves, insertions, and deletions with equal probability are specified in one cycle of GCMC calculation. In this study, 20,000 GCMC cycles are used for the equilibrium state evaluation, and a further 20,000 cycles are applied in the sampling step to evaluate the average properties. The initial configuration of an empty box is used to carry out a simulation until it reaches an equilibrium at which the number of particles in the statistical sense does not change, and then the number of particles is averaged (Ninside). The correlation between bulk pressure and chemical potential is evaluated by using the equation of state proposed by Johnson et al. [25]. The adsorption capacity or pore density is then evaluated according to Equation (3).
4. Results and Discussion
Firstly, the experimental data of nitrogen adsorption at 77 K and the porous properties of porous silica glass obtained from nitrogen adsorption isotherms will be discussed. Secondly, the adsorption isotherms for carbon dioxide at various temperatures obtained from the ASAP2020 will be presented. Then, the adsorption isotherms of CO2 at 283 K in finite-length pore model of silica glass with different pore widths will be given to illustrate the different adsorption behavior of CO2 inside the pores. Later, the effects of the functional group and its concentration on carbon dioxide adsorption will be revealed, as well as the effect of the functional group allocation. Gas adsorption behavior on the defective surface will be compared with that of the perfect surface. Finally, the simulation results and the experimental adsorption data of CO2 on porous silica glass will be compared to see which types of porous silica glass are most favorable for the effective capture of CO2.
4.1. Experimental Results
4.1.1. Porous Properties and Silanol Group Contents of Porous Silica Glass
The major composition of the prepared porous glass in this study as analyzed by XRF (X-ray Fluorescence Spectrometry) is SiO2 (99.2 wt%), as shown in Table 2. Therefore, the modeling of porous glass structure as an assemblage of SiO4 units forming the pore walls of the slit-pore model proposed in this study is reasonably acceptable. Figure 5 shows isotherms of N2 adsorption at 77 K by the tested porous silica glass. The adsorption isotherms for SG2-200 and SG2-500, having small pore sizes, showed a continuous increase in the amount of N2 adsorbed with an increase of relative pressure up to the value of 0.17, before it approached a constant value at higher relative pressures. These isotherms did not show hysteresis loops and their shapes resembled the initial part of the Type II isotherm, according to the IUPAC classification [26]. The porous glass synthesized at pH 3 (SG3-200), having an intermediate pore size, showed an adsorption isotherm with a hysteresis loop. According to the IUPAC classification of isotherms with hysteresis loops [26], this porous glass exhibited Type H2 isotherm. It showed a broad, almost flat plateau, and the steep characteristic of a desorption branch. This type of isotherm indicates that the pore structure of an adsorbent consists of interconnected networks of pores having different shapes and sizes [27]. The isotherms of porous glass having large pore sizes (SG4-200 and SG4-500) also showed isotherms with hysteresis loops, which can be classified as Type H1 isotherm [26]. The isotherms showed a relatively narrow loop, with very steep and almost parallel adsorption and desorption branches, indicating that the adsorbent has a narrow distribution of uniform pores [27].
The derived N2 adsorption isotherms of the prepared porous glass were used to determine the porous properties of the adsorbents and the results are presented in Table 3. Based on the percentage of mesopore volume, it can be seen that all the porous glass samples exhibited mesoporous types of adsorbent materials, with the mesopore volume varying from 62.4% to 98.5%. The average pore size increased from the value of 2.4 to 10.3 nm as the pH changed from the value of 2 to 4 (compare samples SG2-200, SG3-200, and SG4-200). The increase in pore size of the porous glass with increased pH was also observed in the previous studies [13,28]. This was hypothesized to result from the increasing formation of highly branched silica oligomers due to the increased condensation rate of silanol species that can prevent gel shrinkage as the pH of solution was increased. Increasing the pH also enhanced the development of mesopores of the prepared porous glass. The mesopore volume and the total pore volume increased almost threefold as the pH increased from the value of 2 to 4. On the other hand, the total BET surface area was found to decrease with the increase of pH, with the value decreasing almost twofold from 798 to 413 m2/g. The porous properties of the porous glass were also affected to a certain extent by the change in the calcination temperature. However, the average pore size remained almost unchanged by the increase in the calcination temperature from 200 to 500 °C. However, an increase in the calcination temperature from 200 to 500 °C decreased the BET surface area by 21% and 2.2% for the SG2 and SG4 samples, respectively.
Figure 6 shows the TGA curves for determining the silanol group concentrations of the tested porous glass samples. Similar TGA curves for the determination of silanol group contents in porous silica were also observed in the previous work [13]. It appeared that there were two weight loss regions of the TGA curves. The first region showed the abrupt decrease of the sample weight for temperatures lower than 120 °C, and this was attributed to the removal of physically adsorbed water from the silica surface [13]. The second consecutive region displayed a gradual drop of the sample weight which was the result of slow condensation of the existing silanol groups [13]. The weight loss over the temperature from 200 to 600 °C represents the decomposition of the germinal and vicinal silanol groups, whereas the weight loss from 600 to 1000 °C results from the decomposition of the isolated silanol. Table 4 shows the computed silanol group contents in terms of hydroxyl group (OH) contents. It is noted that the amounts of each type of silanol and the total silanol contents decreased when the porous glass was synthesized at higher values of pH and a higher calcination temperature. The total silanol content decreased from 7.94 mmol/g at pH 2 to 4.22 mmol/g at pH 4. This can be attributed to the increasing rate of silanol condensation in the synthesis reaction at a higher pH [13]. The increase of calcination temperature for SG2 from 200 to 500 °C resulted in a reduction of total silanol content from 7.94 to 4.18 mmol/g, which was obviously caused by the release of hydroxyl (OH) groups at a higher calcination temperature. It should be noted that in the simulation study, the surface concentration of the OH group was varied from 0–20 wt.% which covered the estimated experimental concentrations in the range from 7–14 wt.%.
4.1.2. Experimental Isotherms for CO2 Adsorption
The adsorption isotherms of CO2 at 283 K obtained for porous silica glasses, SG2-200, SG3-200, and SG4-200, having average pore widths of 2.4, 5.0, and 10.3 nm, respectively, are shown in Figure 7a,b. In Figure 7a, the adsorbed amount of CO2 in mmol/g of adsorbent is plotted against the pressure in kPa. For comparison with the simulation result, the adsorbed amount of CO2 is converted from mmol/g to kmol/m3 by dividing the number of mmol/g with the total pore volume (cm3/g) shown in Table 3 and plotted against pressure as shown in Figure 7b. The amounts of CO2 adsorbed increased with an increase in pressure and adsorption in smaller pores (2.4 and 5.0 nm for SG2-200 and SG3-200, respectively) were greater than that in the larger pores of 10.3 nm (SG4-200), due largely to the stronger interaction between carbon dioxide and silica glass surfaces in the smaller pores. It is interesting to observe from Figure 7a that for pressures less than, say, about 24 kPa, the amount of CO2 adsorbed by SG3-200 having a pore width of 5.0 nm and the silanol content of 6.05 mmol/g was slightly greater than that by SG2-200 with 2.4 nm pore width and 7.94 mmol/g of the silanol content. However, at higher pressures, the adsorption capacity for the pore width of 5.0 nm was significantly greater than that for the pore width of 2.4 nm, with the discrepancy becoming larger as the pressure was progressively increased. It could be possible that the porous silica with larger pore size (SG3-200) could allow the diffusion of CO2 molecules into the pores at a much faster rate to the adsorption sites, and hence giving the increase in the adsorbed amounts of CO2 [13].
Porous silica adsorbents with two different silanol contents were prepared using calcination temperatures of 200 and 500 °C, and their effects on the adsorption isotherms of CO2 at 273 K are displayed in Figure 8 and Figure 9 for porous silica glasses prepared at pH 2 and pH 4, respectively. The absolute pressure versus amount of CO2 adsorbed in mmol/g (a) and kmol/m3 (b) are presented in these figures. It is observed from Figure 9 that, in the case of larger pore silica glass (SG4 series), the amount of CO2 adsorbed for porous silica with a higher content of the silanol group (SG4-200) was notably greater than that for the silica glass with a lower content of functional group (SG4-500). This clearly indicates that the adsorption of CO2 could be promoted by the presence of surface functional groups. However, for silica glass with a smaller pore size (SG2 series), there is little significant effect of the functional group content on the adsorption isotherm of CO2, as shown in Figure 8a. If the adsorption isotherms are plotted in mole per unit volume (kmol/m3) as shown in Figure 8b, we observe that the adsorption isotherm obtained for a lower content of functional group (SG2-500) was greater than that for a greater amount of the silanol group (SG2-200). In Table 3, we observe that the mesopore volume of SG2-500 is greater than that of SG2-200, although the total pore volume of SG2-500 and functional group concentration are less than those of SG2-200. Therefore, when the adsorption isotherm is plotted in per unit volume, the adsorption isotherm of SG2 series shows a significant difference between mmol/g and kmol/m3. The number of moles of CO2 adsorbed per gram of SG2 series is not much different, and, when we divide this amount of total pore volume, it leads to the greater adsorption isotherm in kmol/m3 of SG2-500. The initial adsorption occurs at the functional group as the stronger interaction between solid and fluid and leads to the fluid cluster formation. The cluster may cause the difficulty for further fluid molecules to move inside the smaller pores; therefore, at higher pressures, the adsorption is affected by not only the functional group content but also the diffusion effect as well.
Next, the temperature effect on the adsorption isotherms of CO2 was investigated. In Figure 10, the CO2 adsorption on porous glasses prepared at pH 2 and at calcination temperatures of 200 °C for different adsorption temperatures are presented. The shape of the isotherms is similar to that of the initial part of the Type II isotherm, according to IUPAC classification [26]. There is a general tendency for the adsorption capacity to decrease with an increase in the adsorption temperature, which implies that the adsorption of CO2 on porous silica is an exothermic process, that is, it is a physical adsorption phenomenon.
4.2. GCMC Simulation Results
4.2.1. Adsorption Isotherms for Various Pore Widths
The isotherms for CO2 adsorption at 283 K on homogeneous surfaces of porous glass with various pore widths and pressures up to 4500 kPa obtained by the GCMC simulation are presented in Figure 11. From the shape of the isotherm curve, the adsorption of CO2 in the finite-length slit pore model of silica glass for 1 nm pore width shows the continuous formation of a monolayer. For pore widths larger than 1 nm, a monolayer along the pore wall can be firstly observed and an additional adsorbed layer follows. For the finite-length pore model of silica glass, the phase transition can be observed, and the adsorption isotherm has a smooth phase transition that is similar to that observed for activated carbon [29]. The adsorption in the finite-length pore model is narrower and the two contact layers can be seen where the pore density of about 10 kmol/m3 occurs at different pressures for each pore width. The contact layer occurs at a higher pressure when the pore becomes larger, and beyond this pressure the pores are then filled. The inner core is gradually filled due to the lower interaction between fluid and solid at the pore mouth region and a meniscus is observed [30]. When the pressure is further increased, the phase transition from a gas-like phase to a liquid-like phase takes place, and the pore density becomes close to 19.6 kmol/m3, which is the saturated condition of liquid carbon dioxide at 283 K. This transition occurs at pressures of about 1500, 2500, 3000, 4000, and 4500 kPa for the pore widths of 2, 3, 4, 5, and 6 nm, respectively. The maximum capacity for the saturation condition decreases with an increase in pore widths, and this may be due to the packing effect where different numbers of CO2 molecules are closely packed in the pore. The compression of the adsorbed phase from the liquid-like phase to a highly liquid-like phase or solid-like phase is also observed for pore widths smaller than 6 nm. This is because of the stronger interaction between fluids and solids for the smaller pores. It is noted that the behavior of adsorption isotherms obtained using the GCMC is quite similar to that obtained by the experiment as one can see in Figure 7b, that is, the adsorption capacity decreases with an increase in the pore width.
4.2.2. Effects of Functional Group Concentration on CO2 Adsorption Isotherms
The effect of pore width on the adsorption isotherms of CO2 was presented in the previous section. Next, the study of the effect of functional group concentration on CO2 adsorption at 283 K for pore width of 2 nm, which is close to the average pore width of SG2 porous glass, will be presented. The random topology mentioned in Section 3.3 is first considered, and for this model the surfaces are covered with the OH groups of 5%–20%. The adsorption of CO2 in homogeneous finite-length pores (diamond-shape symbols), and three isotherms obtained for heterogeneous finite-length pores with different OH concentrations; 5% of OH (square symbols), 10% of OH (upward triangle symbols), and 20% of OH (circle symbols), respectively, are shown in Figure 12. As shown in Figure 12a, the adsorption isotherms obtained for heterogeneous pores are greater than those for the homogeneous pores (without OH groups) at pressures lower than 200 kPa. This behaviour should be attributed to the stronger interaction between CO2 and the silanol groups on the pore walls. However, at pressures greater than 200 kPa, the opposite behaviour is observed, as shown in Figure 12a,b. This behaviour is probably caused by the reduction of pore volume as the number of functional groups is increased. An early onset in the adsorption isotherms is observed in the heterogeneous pores, and the adsorption isotherms increase with an increase in the contents of the functional groups at low pressures, as seen in Figure 12a. This is due to the stronger potential energy of interactions between CO2 molecules and the number of OH groups on the solid surfaces. When the first layer is completely formed as shown in Figure 13c, the further adsorption is dominated by the interaction between fluids. Therefore, the number of CO2 molecules increases with pressure. However, in this study, the simulation box volume (Vpore) is fixed as described in Section 3; therefore, the number of functional groups on the solid surfaces will reduce the pore space for CO2 to occupy. This will lead to the adsorption isotherm of the homogeneous pore being greater than those of the heterogeneous pore. The contribution of the functional groups can enhance the adsorption of fluid at the first layer and becomes less significant for additional adsorption especially for the small pores. This behaviour was also found in the experiments for pores having an average width of 2.4 nm (SGS2-200 and SGS2-500) as discussed in Section 4.1.2.
Figure 13 presents the microscopic configurations of CO2 in a finite-length slit pore model where 20% of the OH groups are placed randomly on the surfaces at different pressures. The initial adsorption occurs at the functional group sites, and then an adsorbed phase is formed at the contact layer next to the pore walls at low pressures, as shown in Figure 13b. When the pressure is further increased, the second layer is formed and followed by the pores filling in the inner cores, as can be seen in Figure 13c, d. Then, when the contact layers are completed, the heterogeneous surface effects on the second and higher layers become negligible [31].
4.2.3. Effects of the Functional Group Allocation on the Adsorption of CO2
The effect of functional group allocation (placement scheme) on the adsorption behaviour of CO2 in finite-length pores of silica glass was also investigated. As seen previously in Section 4.2.2 for pore widths of 2 nm, it was found that the isotherms obtained for the random topology model were greater than those obtained for the pores without the silanol group at pressures lower than 200 kPa, and that the opposite behaviour was observed at higher pressures. Typical simulated adsorption isotherms obtained for the 4 nm pore width at 283 K and with 20% of the functional groups being placed as random topology and fixed topology are presented in Figure 14. For comparison, the isotherm obtained for 4 nm pore width without the functional groups are also presented in the same figure. The adsorption isotherms obtained for both models are greater than those obtained for homogeneous pores at pressures lower than 1500 kPa. At higher pressures, the adsorption isotherms obtained from pores without functional groups become greater than those obtained from the heterogeneous pore models. It is further noted that adsorption of CO2 for the fixed topology model is greater than that for the random topology model at pressures lower than 0.1 kPa. This is because the number of functional groups at the pore entrance in the case of the fixed topology model are greater than those in the case of the random topology model. The initial formation of the adsorbed layer at the pore entrance, where the interaction between the OH group and fluid is very strong, could lead to greater adsorption isotherms as observed in the case of the fixed topology model. For pressure ranging from 0.1 to 20 kPa, it is observed that the adsorption isotherms obtained from the random topology model become greater than that obtained from the fixed topology model. This may be due to the fact that the adsorption occurs not only at the pore entrance but it could also occur inside the pores as well. As mentioned above, the adsorption isotherms from the random topology is greater than those from the fixed topology where the functional groups are allocated at the pore entrance and this may lead to the difficulty for CO2 to diffuse into the inner pore, as observed for the case of the experimental isotherms in Section 4.1.2 for the smaller pore widths of sample SG2-200. Over a pressure range higher than 20 kPa, the isotherms obtained from the fixed topology become greater than those from the random topology and then they tend to merge together at very high pressures. This may imply that the functional groups could be formed at the pore edges in the case of smaller pores, while the functional groups may be distributed along the solid surfaces if the pores are large enough. If the mesoporous silica glass containing suitable amounts and distribution of OH groups could be synthesized, this material could be employed to adsorb carbon dioxide at an ambient temperature.
4.2.4. Adsorption of CO2 on a Defective Surface
Figure 15 depicts the simulated isotherms of CO2 adsorption at 283 K derived from a perfect homogeneous surface model, and the defective heterogeneous surface model. The adsorption isotherms for a defective surface show an early onset of adsorption and are greater than those in the case of the homogeneous pores. This may be due to the presence of surface defect pits where CO2 molecules are strongly adsorbed because of the greater interaction between CO2 and surface atoms around the defective hole. When the formation of two contact layers along the pore wall is accomplished, the defective surface shows a slight effect on the adsorption of a further layer. However, the adsorption capacity at the saturation condition for the case of the defective surface pore model is still greater than that of the perfect surface pore model. This may be due to the packing efficiency effect, that is, the amount of CO2 molecules can accommodate not only in the inner core volume but also inside the defective spaces as well.
4.2.5. Comparison between the Experiment and GCMC Simulation Method
Pore size distribution (PSD) of the prepared porous silica glass can be determined based on the method proposed by Samios et al., [32] by comparing the experimental CO2 isotherms and the isotherms calculated using the GCMC ensemble. A set of 12 CO2 adsorption isotherms obtained from the GCMC simulation was calculated for finite-length pores of 1 to 12 nm in width, up to the saturation vapour pressure of CO2 at 283 K (4500 kPa) for which the results were previously shown in Figure 11. Then, these adsorption isotherms are compared with the experimental adsorption isotherms for SG2-200 using an optimization solver of EXCEL program. The simulated isotherms from the optimization method (line) are compared with the experimental data, as shown in Figure 16. It is clear that both isotherms agree very well. The total pore volume obtained from CO2 adsorption isotherms at 283 K is 0.2019 cm3/g, which is lower than that obtained from N2 adsorption isotherms at 77 K (Table 3) of 0.487 cm3/g. This discrepancy arises from the fact that the experimental adsorption of CO2 was not performed up to the saturation pressure condition at 283 K. The PSD of the prepared porous silica glass obtained by using CO2 adsorption isotherms is displayed in Figure 17. It shows a bimodal characteristic consisting of the first larger area covering pore sizes from 0–5 nm and a second smaller area in the range of 7–9 nm pore sizes. The average pore size is estimated to be around 2 nm, which is close to that derived from the adsorption data of N2 at 77 K (2.4 nm), as presented in Section 4.1.1. A good agreement of the adsorption results between the experiments and the simulation has proved that the simple finite-length slit pore model based on the assemblage of SiO4 units is adequate for describing the adsorption phenomena in a porous silica adsorbent.
5. Conclusions
In this study, simple porous silica glass models for homogeneous and heterogeneous surfaces were proposed and CO2 is used as a probe molecule for the adsorption study. The adsorption behavior of CO2 on porous silica model depends on the pore width, surface heterogeneity and adsorption temperature. The defective surface and surface containing silanol functional groups were used to represent the surface heterogeneity effect. The amount of CO2 adsorption decreased with the increase in pore width. The adsorption decreased with an increase in the adsorption temperature, thus indicating the physical adsorption of CO2 in porous silica glass. CO2 adsorption on a defective surface was higher than that on a homogeneous perfect surface, with the rapid rising of the amount adsorbed being noticed at relatively low pressures, due principally to the initial forming of two contact adsorbed layers along the pore wall. The adsorption of CO2 increased with an increase of functional group contents due to the stronger interaction between the fluid and the silanol group. The placement scheme of the functional group also affects the adsorption isotherms; the adsorption for the fixed topology model was greater than that for the random topology model at a low-pressure range but became less than that of the random topology at higher pressures, possibly caused by the diffusion effect (mas transfer resistance) of CO2 to the inner pore. The simulated isotherms for different single pore widths together with the experimental isotherm data can be used to compute the pore size distribution. It was demonstrated that the finite-length slit pore model, whose walls consist of an assemblage of connected SiO4, can be used to represent the structure of porous silica glass for a successful simulation study of CO2 adsorption.
Author Contributions
This work is contributed by C.B. for material preparation and experimental study, A.W. for simulation study and writing—original draft preparation and C.T. for supervision, writing—review and editing. All authors have read and agreed to the published version of the manuscript.
Funding
This research was funded by The Thailand Research Fund (TRF) grant number PHD/0343/2552, and the APC was funded by Suranaree University of Technology.
Acknowledgments
This work is supported by Suranaree University of Technology. We also gratefully acknowledge The Thailand Research Fund (TRF) for its financial support to Chontira Boonfung via the RGJ PhD scholarship, batch number 12.
Conflicts of Interest
The authors declare no conflict of interest.
References
- Lopes, F.V.S.; Grande, C.A.; Ribeiro, A.M.; Loureiro, J.M.; Evaggelos, O.; Nikolakis, V.; Rodrigues, A.E. Adsorption of H2, CO2, CH4, CO, N2 and H2O in activated carbon and zeolite for hydrogen production. Sep. Sci. Technol. 2009, 44, 1045–1073. [Google Scholar] [CrossRef]
- Feng, L.; Shen, Y.; Wu, T.; Liu, B.; Zhang, D.; Tang, Z. Adsorption equilibrium isotherms and thermodynami analysis of CH4, CO2, CO, N2, and H2 on NaY Zeolite. Adsorption 2020. [Google Scholar] [CrossRef]
- Kemper, J. Biomass and carbon dioxide capture and storage: A review. Int. J. Greenh. Gas Control 2015, 40, 401–430. [Google Scholar] [CrossRef]
- Khandaker, T.; Hossain, M.S.; Dhar, P.K.; Rahman, M.S.; Hossain, M.A.; Ahmed, M.B. Efficacies of carbon-based adsorbents for carbon dioxide capture. Processes 2020, 8, 654. [Google Scholar]
- Leung, D.Y.C.; Caramanna, G.; Maroto-Valer, M.M. An overview of current status of carbon dioxide capture and storage technologies. Renew. Sustain. Energy Rev. 2014, 39, 426–443. [Google Scholar] [CrossRef] [Green Version]
- Chiang, Y.C.; Juang, R.S. Surface modification of carbonaceous materials for carbon dioxide adsorption: A review. J. Taiwan Inst. Chem. Eng. 2017, 71, 214–234. [Google Scholar] [CrossRef]
- Yazawa, T. Present Status and Future Potential of Preparation of Porous Glass and Its Application in Porous Ceramic Materials; Liu, D.-M., Ed.; Trans. Tech. Publications: Stafa-Zurich, Switzerland, 1995; pp. 125–146. [Google Scholar]
- Nimjaroen, C.; Morimoto, S.; Tangsathitkulchai, C. Preparation and properties of porous glass using fly ash as a raw material. J. Non-Crystalline Solids 2009, 355, 1737–1741. [Google Scholar] [CrossRef]
- Frenkel, D.; Smit, B. Understanding Molecular Simulation; Academic Press: New York, NY, USA, 2002. [Google Scholar]
- Allen, M.P.; Tildesley, D.J. Computer Simulation of Liquids; Clarendon Press: Oxford, UK, 1987. [Google Scholar]
- Ketprasoet, N.; Nimjaroen, C.; Tangsathitkulchai, C.; Wongkoblap, A. Adsorption and isosteric heat studies for adsorption of fluid on porous silica glass using GCMC simulation. In Proceedings of the 9th South East Asian Technical University Consortium (SEATUC) Symposium, Suranaree University of Technology, Nakhon Ratchasima, Thailand, 27–30 July 2015. [Google Scholar]
- Xiaoning, Y.; Xiaopeng, Y. Adsorption and structure of Lennard-Jones model fluid in slit like amorphous silica nanopoes. Colloids Surfaces A Physicochem. Eng. Asp. 2007, 301, 166–173. [Google Scholar]
- Witoon, T.; Chareonpanich, M. Effect of pore size and surface chemistry of porous silica on CO2 adsorption. Songklanakarin J. Sci. Technol. 2012, 34, 403–407. [Google Scholar]
- Kim, J.M.; Chang, S.M.; Kong, S.M.; Kim, K.S.; Kim, J.; Kim, W.S. Control of hydroxyl group in silica particle synthesized by the sol-precipitation process. Ceram. Int. 2005, 35, 1015–1019. [Google Scholar] [CrossRef]
- Ek, S.; Root, A.; Peussa, M.; Niinisto, L. Determination of the hydroxyl group content in silica by thermogravimetry and a comparison with H MAS NMR results. Thermochim. Acta 2001, 379, 201–212. [Google Scholar] [CrossRef]
- Do, D.D. Adsorption Analysis: Equilibria and Kinetics; Imperial College Press: London, UK, 1998. [Google Scholar]
- Harris, J.G.; Yung, K.H. Carbon dioxide’s liquid-vapor coexistence curve and critical properties as predicted by a simple molecular model. J. Phys. Chem. 1995, 99, 12021–12024. [Google Scholar] [CrossRef]
- Burchart, E.D.; Vandegraaf, B.; Vogt, E.T.C. A consistent molecular mechanics force field for aluminophosphates. J. Chem. Soc. Faraday Trans. 1992, 88, 2761–2769. [Google Scholar] [CrossRef]
- He, Y.; Seaton, N.A. Experimental and computer simulation studies of the adsorption of ethane, carbon dioxide, and their binary mixtures in MCM-41. Langmuir 2003, 19, 10132–10138. [Google Scholar] [CrossRef]
- Calero, S.; Dubbeldam, D.; Krishna, R.; Smit, B.; Vlugt, T.J.H.; Denayer, J.F.M.; Martens, J.A.; Maesen, T.L.M. Understanding the role of sodium during adsorption: A force field for alkanes in sodium-exchanged Faujasites. J. Am. Chem. Soc. 2004, 126, 11377–11386. [Google Scholar] [CrossRef] [Green Version]
- Jorge, M.; Schumacher, C.; Seaton, N.A. Simulation study of the effect of the chemical heterogeneity of activated carbon on water adsorption. Langmuir 2002, 18, 9296–9306. [Google Scholar] [CrossRef] [Green Version]
- Bansal, R.C.; Goyal, M. Activated carbon Adsorption; Taylor& Francis: Boca Raton, FL, USA, 2005. [Google Scholar]
- Do, D.D.; Do, H.D. Modeling of adsorption on nongraphitized carbon surface: GCMC simulation studies and comparison with experimental data. J. Phys Chem. B. 2006, 110, 17531–17538. [Google Scholar] [CrossRef]
- Wongkoblap, A.; Do, D.D. Characterization of Cabot non-graphitized carbon blacks with a defective surface model: Adsorption of argon and nitrogen. Carbon 2007, 45, 1527–1534. [Google Scholar] [CrossRef]
- Johnson, J.K.; Zolloweg, J.A.; Gubbins, K.E. The Lennard-Jones equation of state revisited. Mol. Phys. 1993, 78, 591–618. [Google Scholar] [CrossRef]
- Sing, K.S.W.; Everett, D.H.; Haul, R.A.W.; Moscou, L.; Pierotto, R.A.; Rouquerol, J.; Siemieniewska, T. Reporting Physisorption Data for Gas/Solid systems, with special reference to the determination of surface area and porosity, International Union of Pure and Applied Chemistry. Pure Appl. Chem. 1985, 57, 603–619. [Google Scholar] [CrossRef]
- Rouquerol, F.; Rouquerol, J.; Sing, K. Adsorption by Powders and Porous Solids: Principles, Methodology and Applications; Academic Press: San Diego, CA, USA, 1999. [Google Scholar]
- Muñoz-Aguado, M.J.; Gregorkiewitz, M. Preparation of silica-based microporous inorganic gas separation membranes. J. Membr. Sci. 1996, 111, 7–18. [Google Scholar] [CrossRef]
- Wongkoblap, A.; Junpirom, S.; Do, D.D. Adsorption of Lennard-Jones fluids in carbon slit pores of a finite length a computer simulation study. Ads. Sci. Technol. 2005, 23, 1–18. [Google Scholar] [CrossRef]
- Wongkoblap, A.; Do, D.D. The effects of energy sites on adsorption of Lennard–Jones fluids and phase transition in carbon slit pore of finite length: A computer simulation study. J. Colloid Interface Sci. 2006, 297, 1–9. [Google Scholar] [CrossRef] [PubMed]
- Borowko, M. Adsorption Theory, Modeling and Analysis; Toth, J., Ed.; Marcel Dekker Inc.: New York, NY, USA, 2002. [Google Scholar]
- Samios, S.; Stubos, A.K.; Kanellopoulos, N.K.; Cracknell, R.F.; Papadopoulos, G.K.; Nicholson, D. Determination of micropore size distribution from Grand Canonical Monte Carlo simulations and experimental CO2 isotherm data. Langmuir 1997, 13, 2795–2802. [Google Scholar] [CrossRef]
Figure 1.
Types of silanol groups on the surface of porous silica [14].
Figure 1.
Types of silanol groups on the surface of porous silica [14].
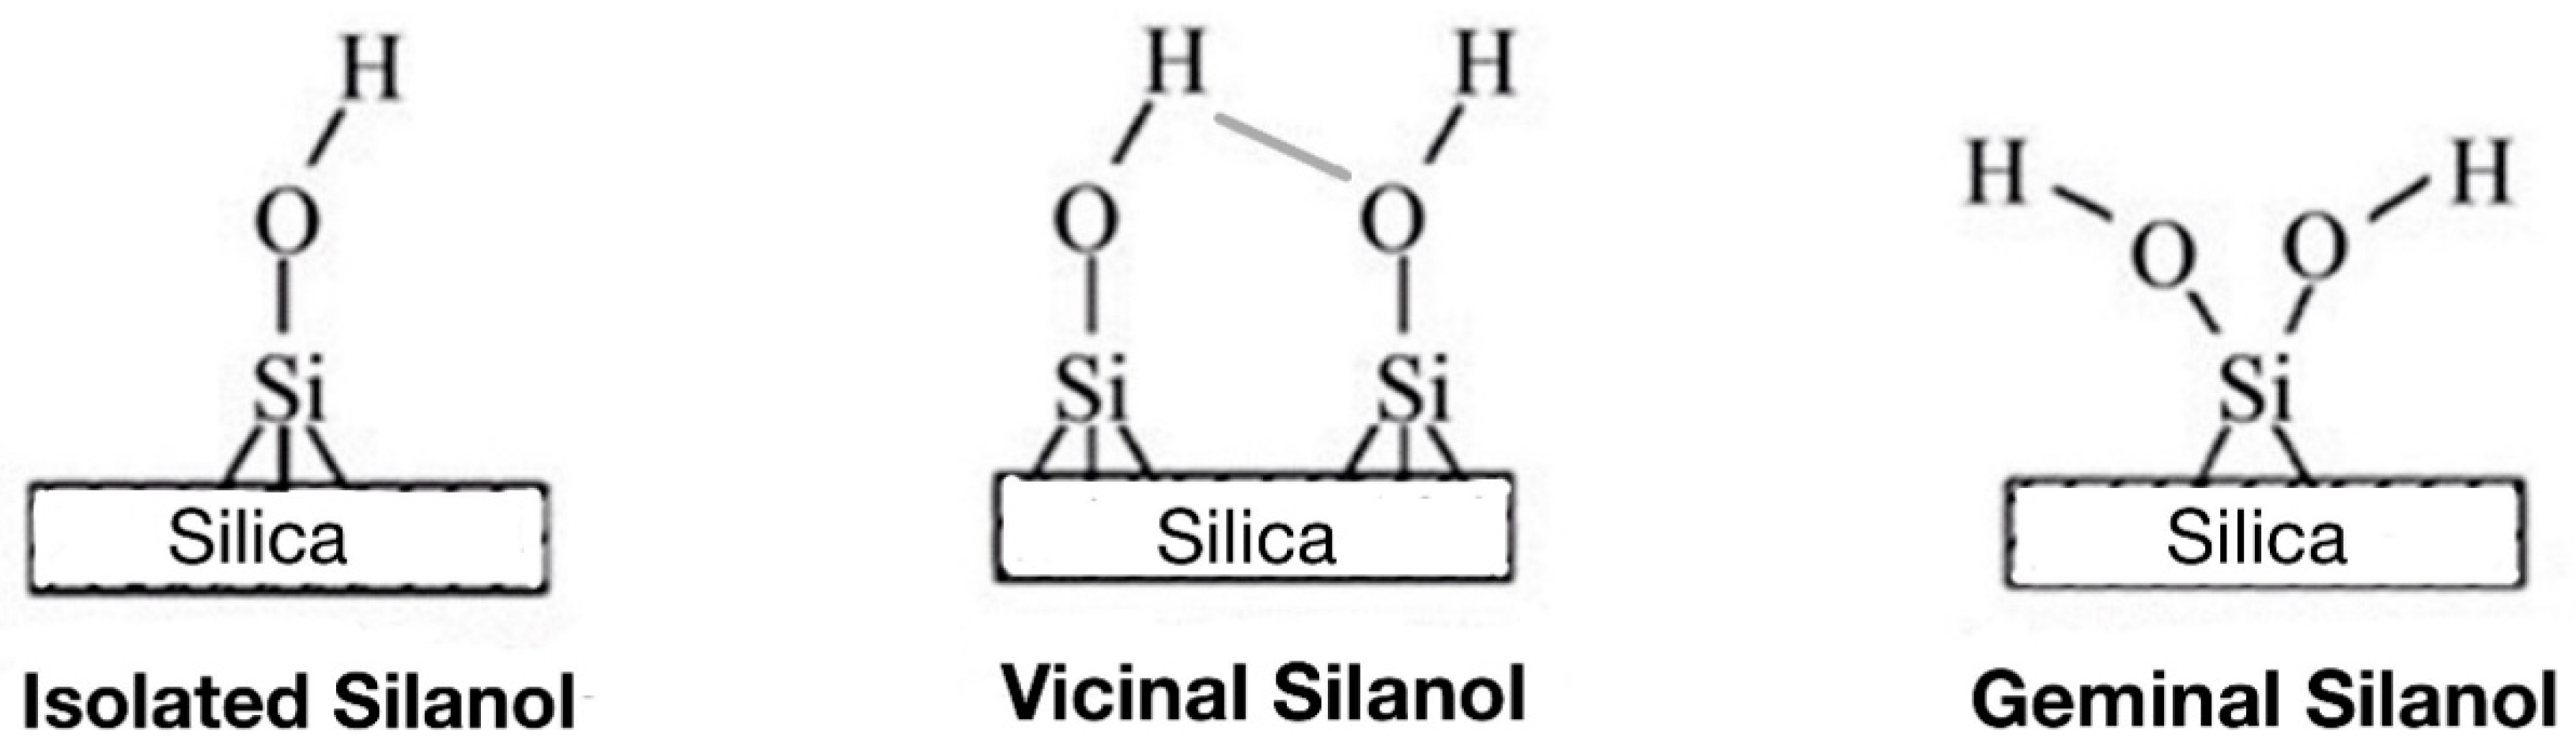
Figure 2.
The solid model of porous silica glass used in this study; each wall consists of an assemblage of SiO4 crystals. In the figure, yellow spheres and grey spheres represent silicon and oxygen atoms, respectively.
Figure 2.
The solid model of porous silica glass used in this study; each wall consists of an assemblage of SiO4 crystals. In the figure, yellow spheres and grey spheres represent silicon and oxygen atoms, respectively.

Figure 3.
Two proposed models for OH groups presenting on the inner walls of porous silica surfaces (a) the random and (b) the fixed topologies. In the figures, the yellow spheres represent the silicon atoms and the grey spheres represent the oxygen atoms of SiO4. The red spheres and small white spheres represent the oxygen and hydrogen atoms of the OH functional group.

Figure 4.
A characteristic of defective surfaces of the porous silica glass model.

Figure 5.
Isotherms of nitrogen adsorption at 77 K on the porous silica glass samples prepared with different pH values.
Figure 5.
Isotherms of nitrogen adsorption at 77 K on the porous silica glass samples prepared with different pH values.
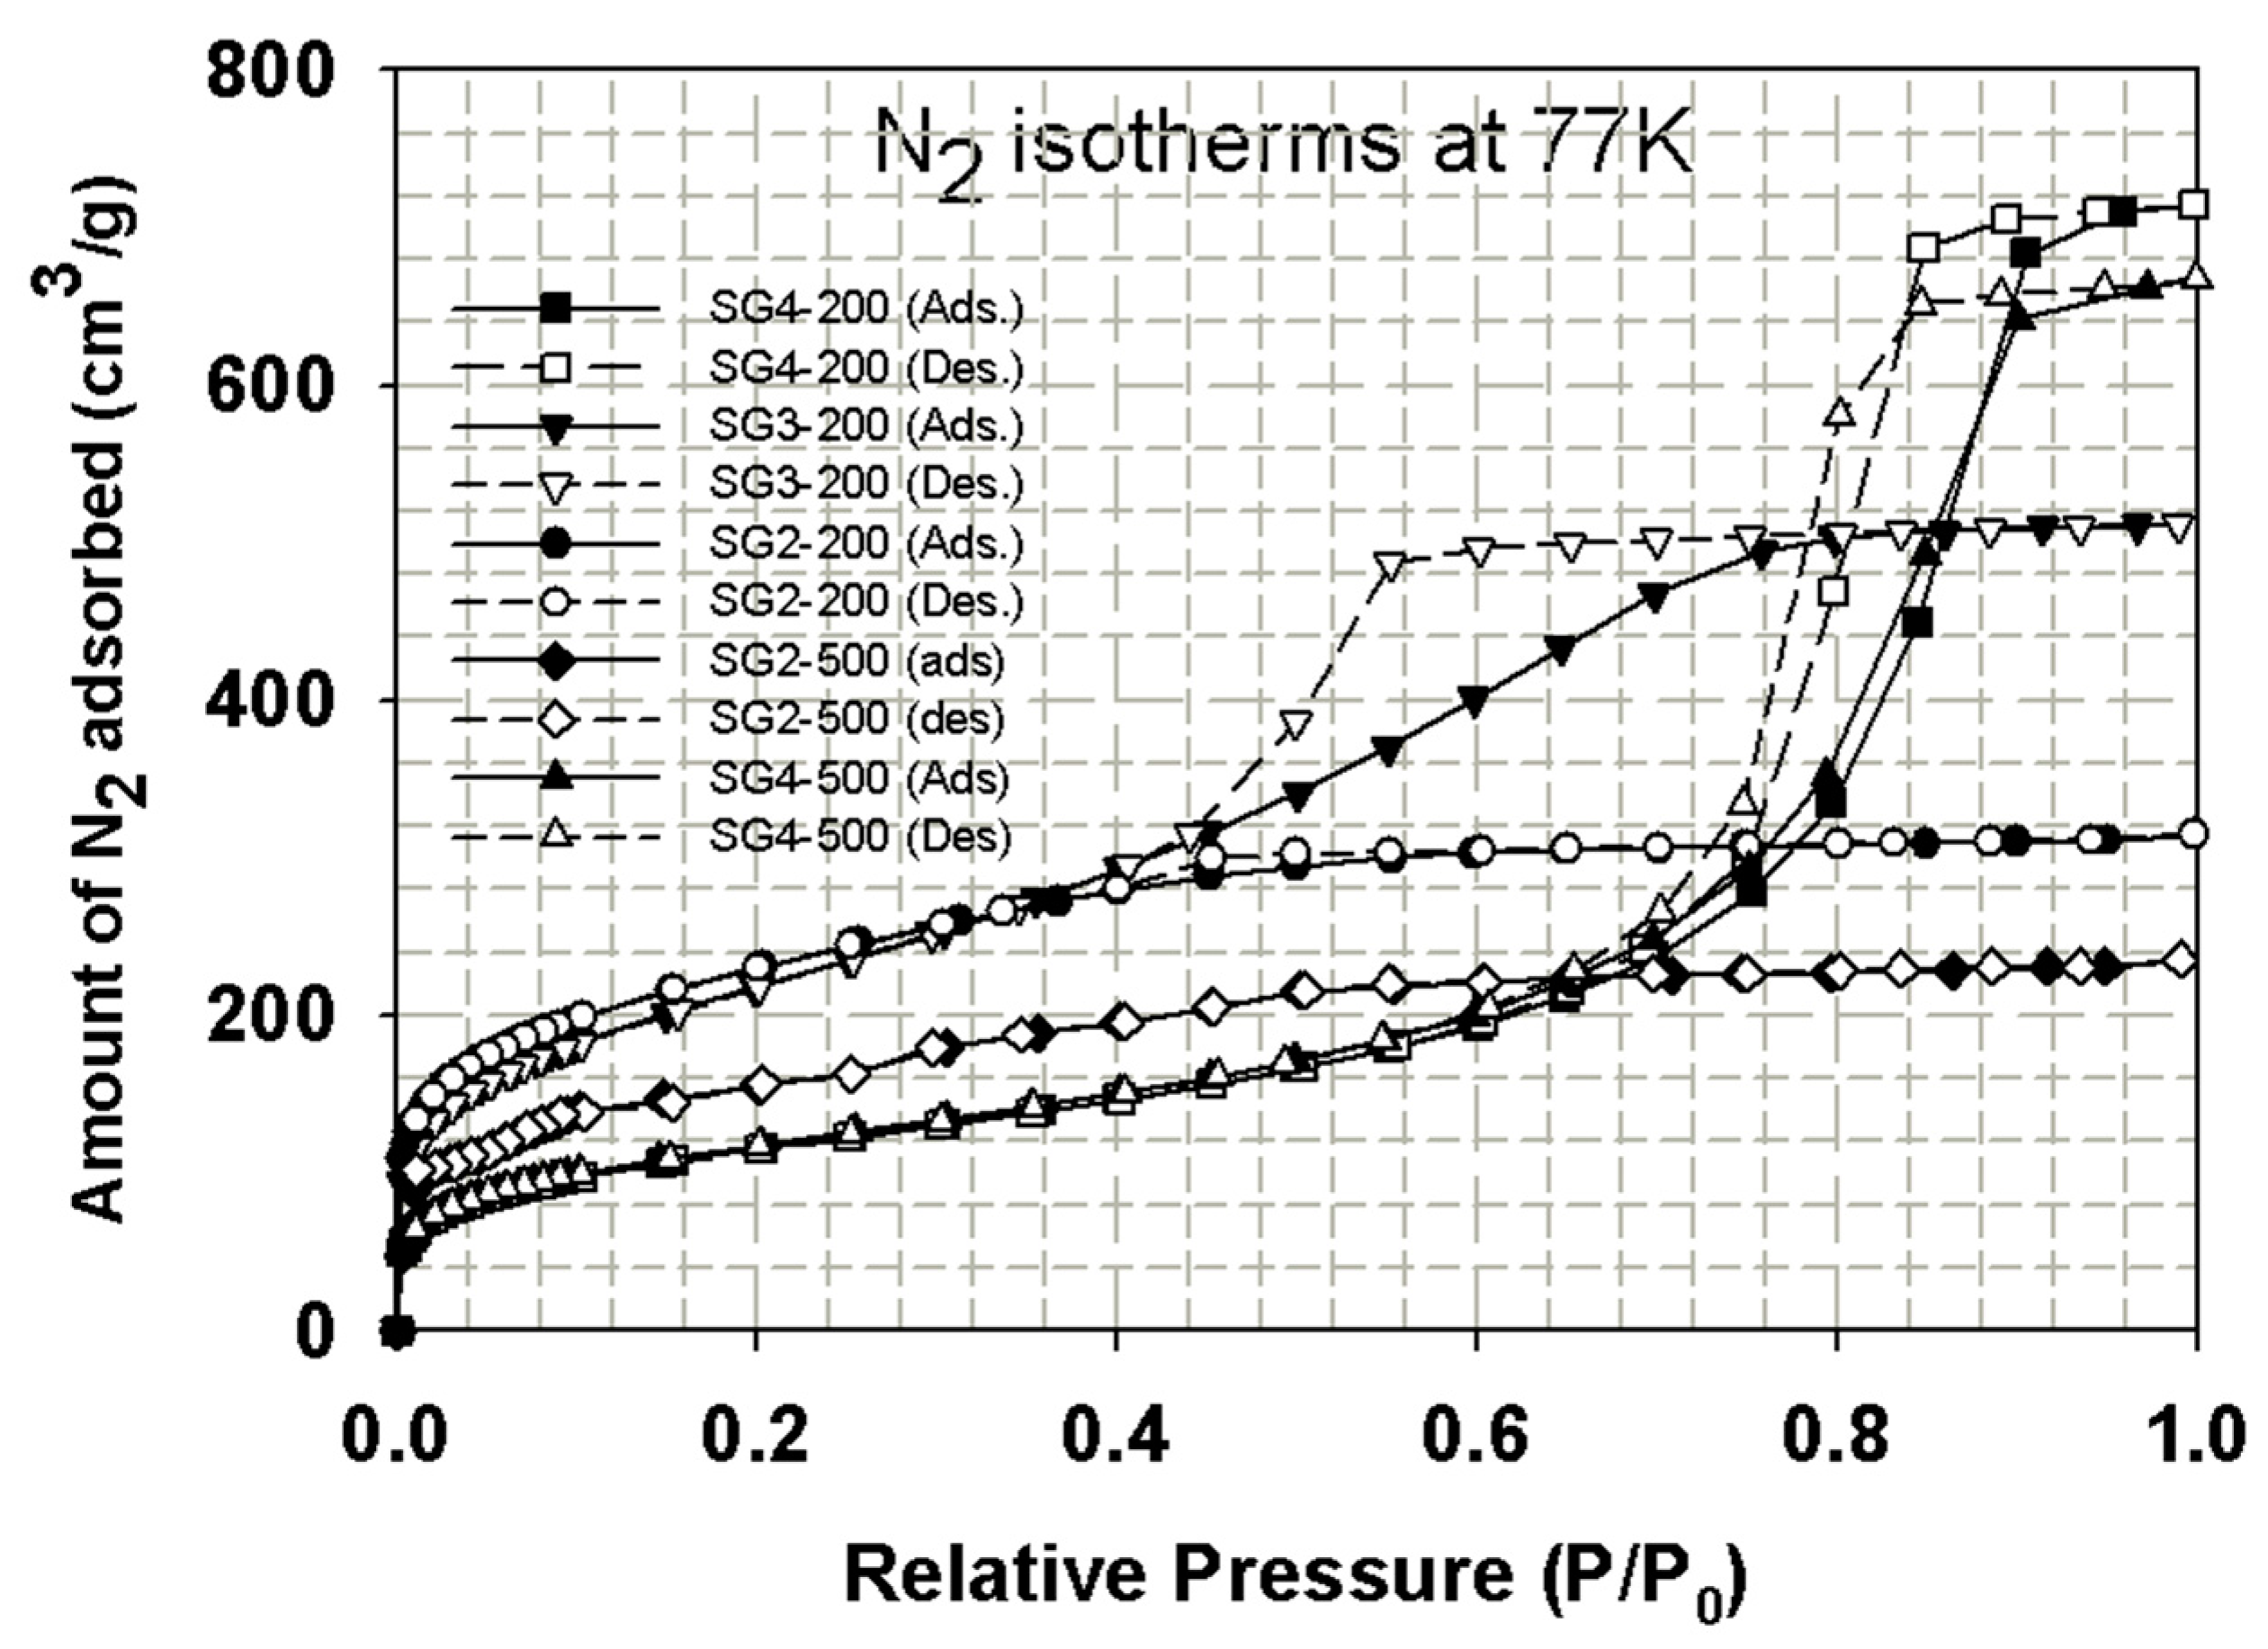
Figure 6.
Typical TGA curves of porous silica glass for determining the amounts of silanol groups.

Figure 7.
CO2 adsorption isotherms at 283 K for porous silica glass prepared at different pH values. (a) adsorbed amount plotted in mmol/g and (b) adsorbed amount plotted in kmol/m3.
Figure 7.
CO2 adsorption isotherms at 283 K for porous silica glass prepared at different pH values. (a) adsorbed amount plotted in mmol/g and (b) adsorbed amount plotted in kmol/m3.
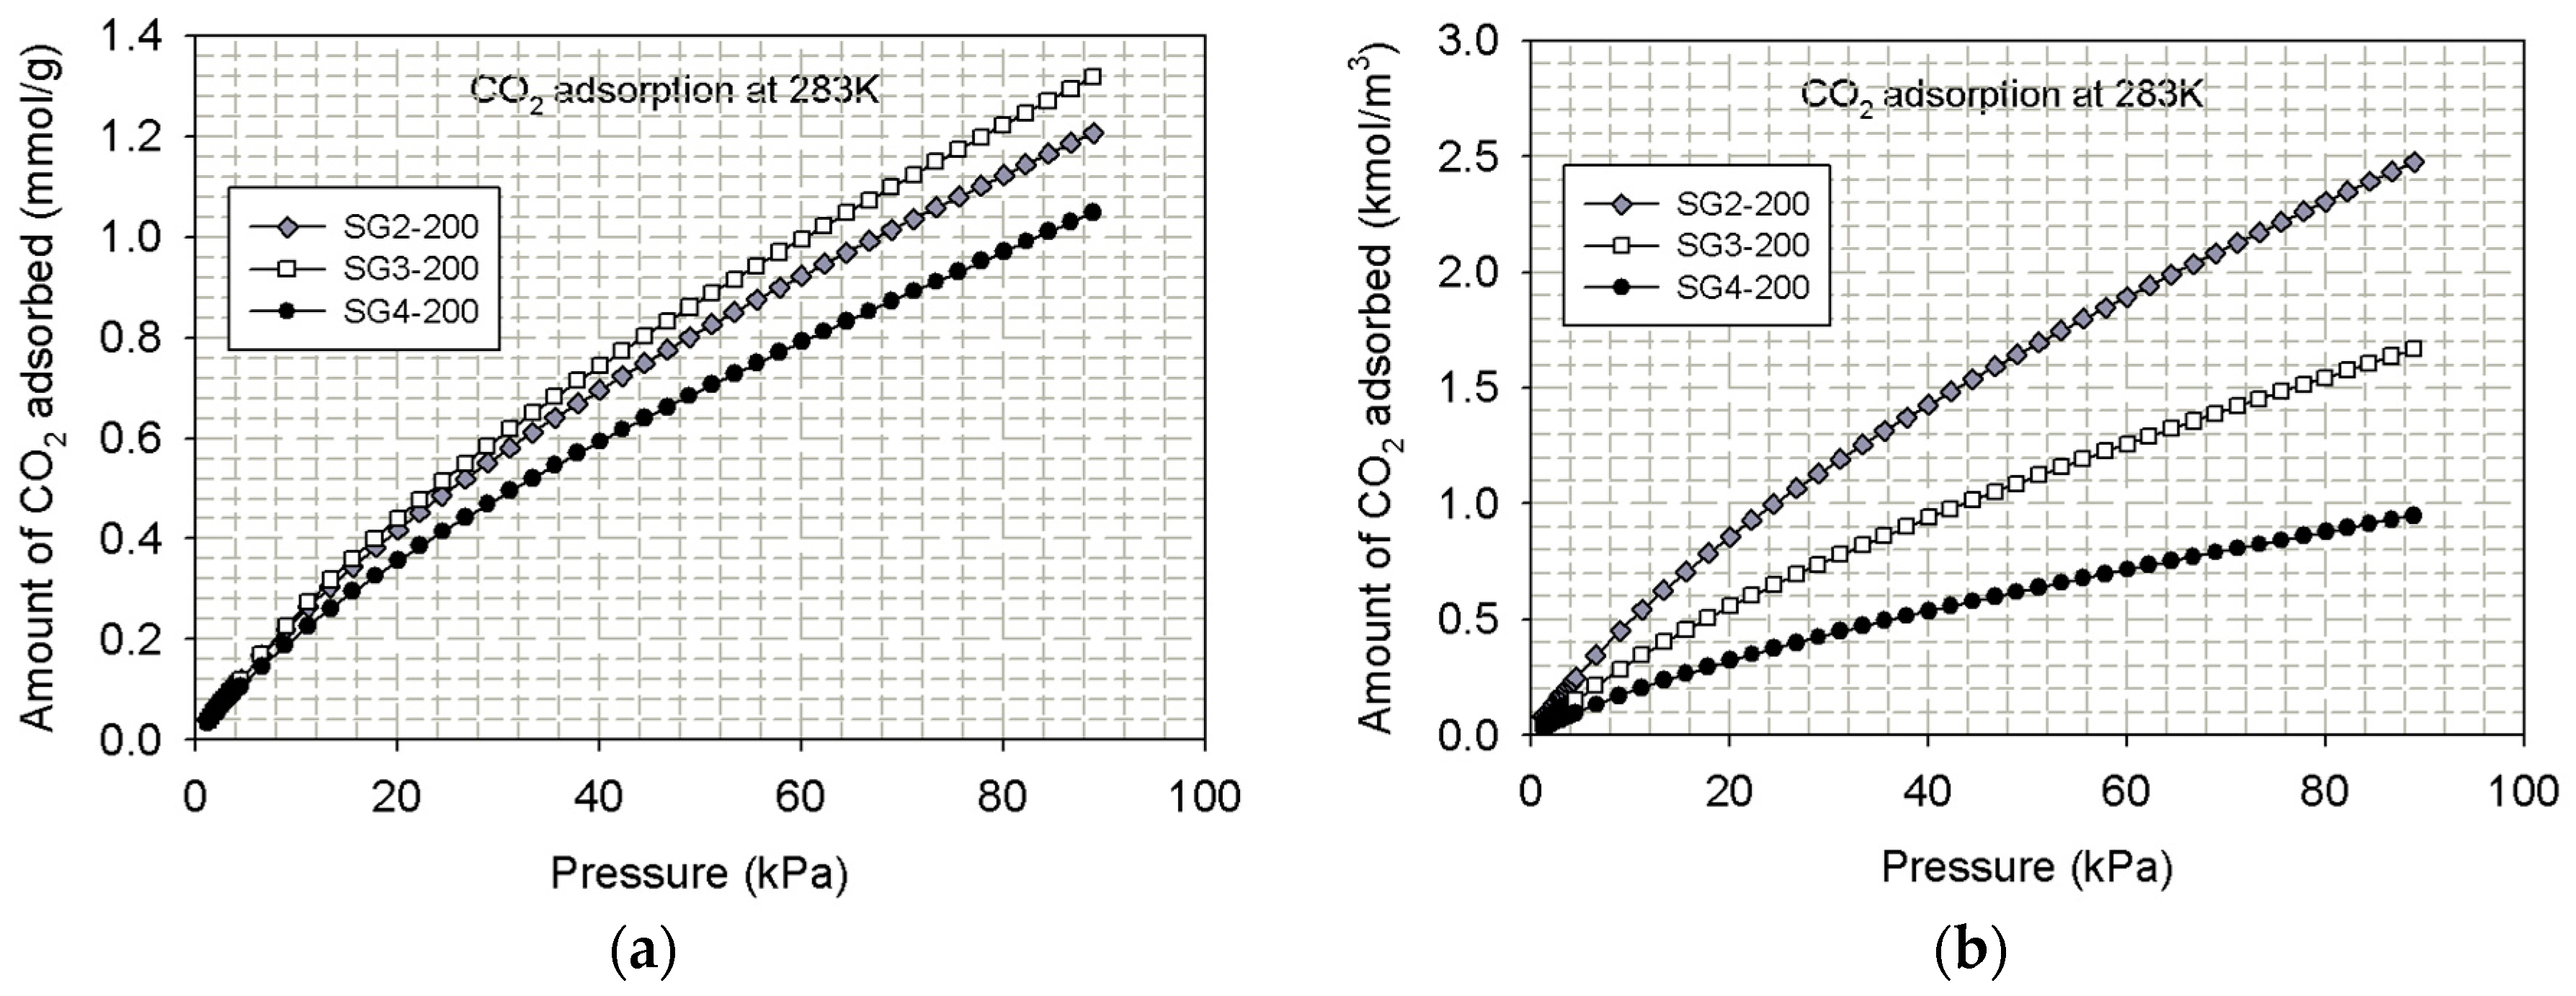
Figure 8.
CO2 isotherms at 273 K for porous silica glass prepared at pH 2, (a) adsorbed amount plotted in mmol/g and (b) adsorbed amount plotted in kmol/m3.
Figure 8.
CO2 isotherms at 273 K for porous silica glass prepared at pH 2, (a) adsorbed amount plotted in mmol/g and (b) adsorbed amount plotted in kmol/m3.

Figure 9.
CO2 isotherms at 273 K for porous silica glass prepared at pH 4, (a) adsorbed amount plotted in mmol/g and (b) adsorbed amount plotted in kmol/m3.
Figure 9.
CO2 isotherms at 273 K for porous silica glass prepared at pH 4, (a) adsorbed amount plotted in mmol/g and (b) adsorbed amount plotted in kmol/m3.
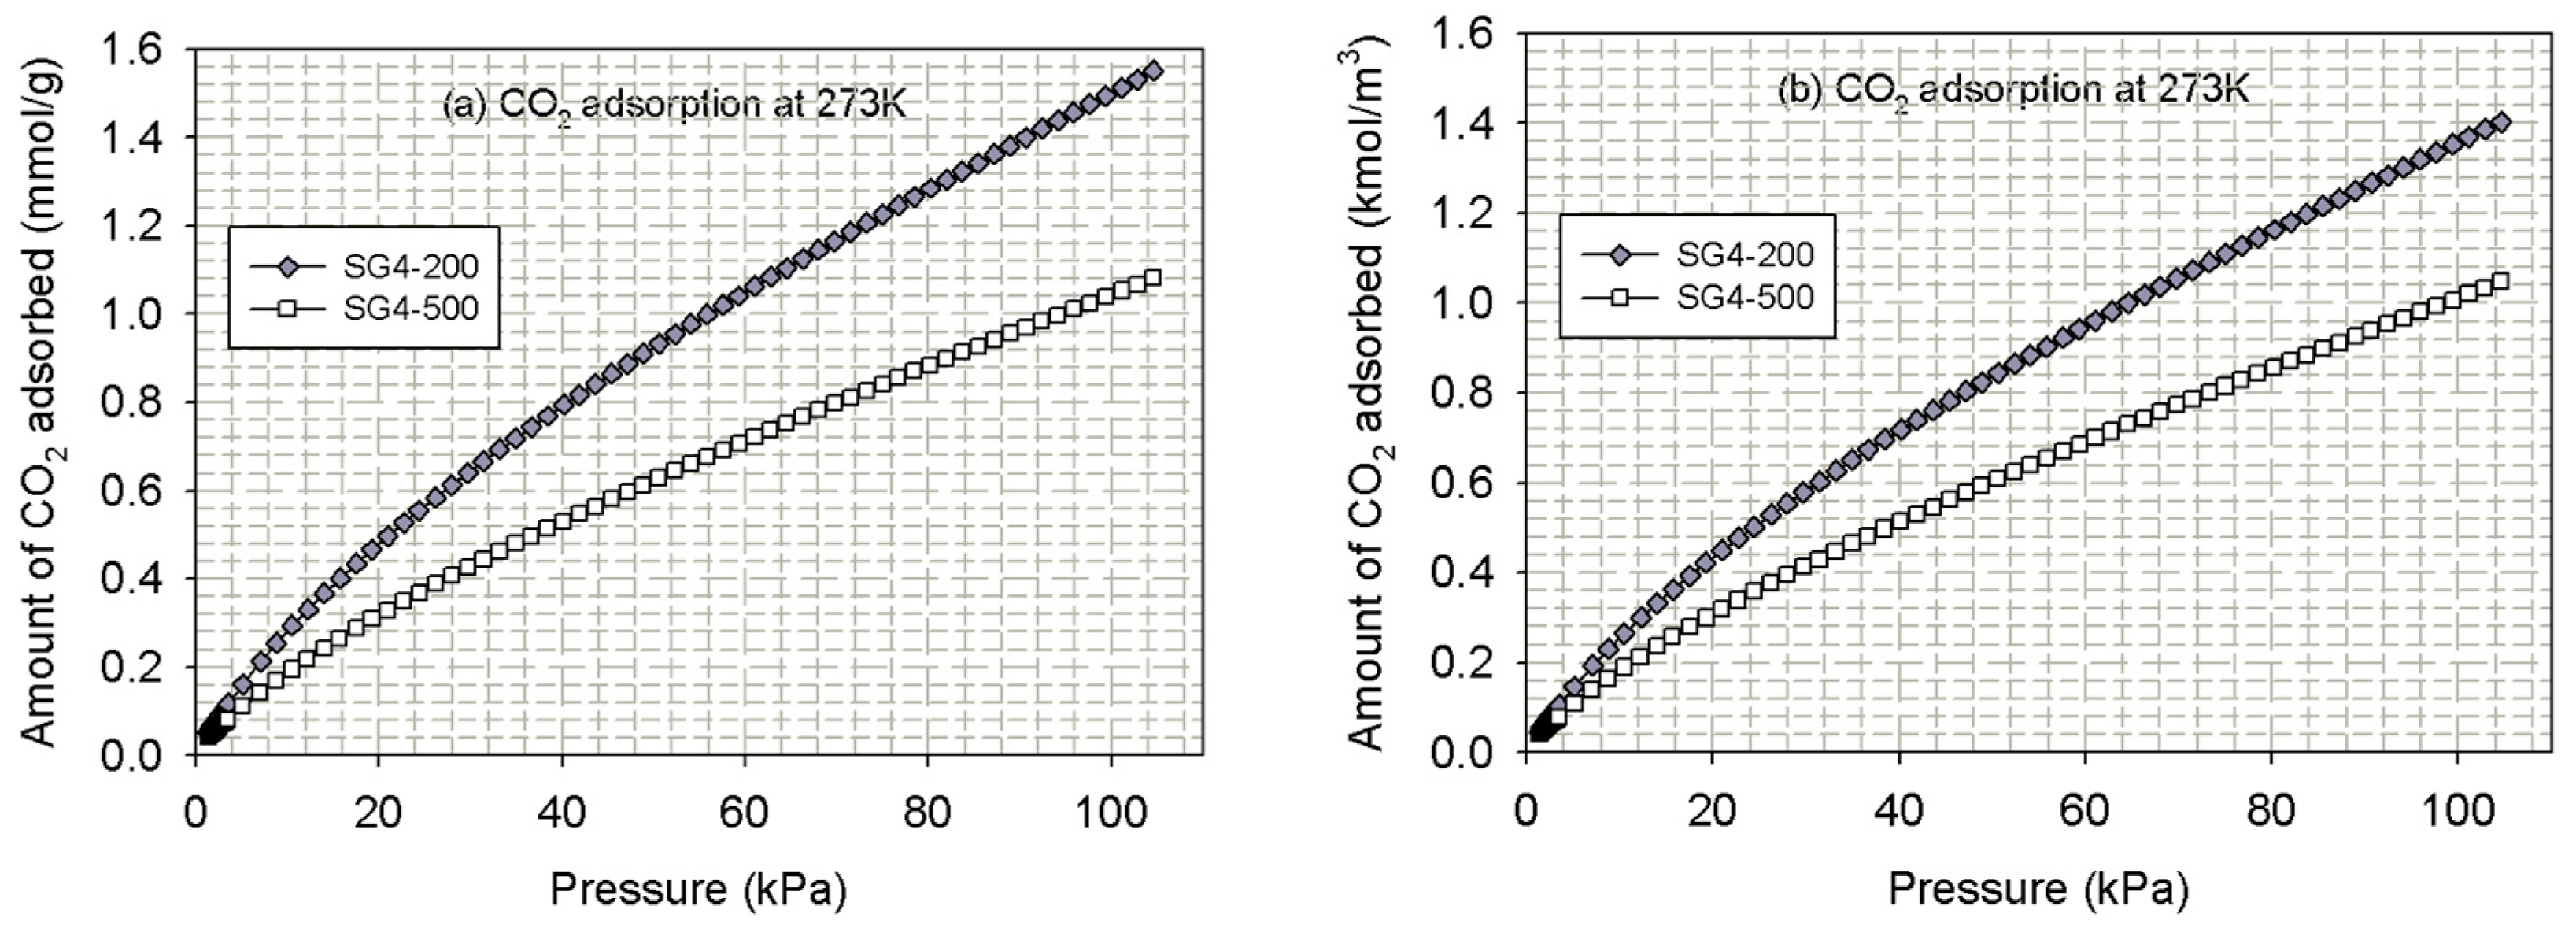
Figure 10.
Experimental CO2 adsorption isotherms at 273, 283 and 293 K for the prepared porous glass, (a) adsorbed amount plotted in mmol/g and (b) adsorbed amount plotted in kmol/m3.
Figure 10.
Experimental CO2 adsorption isotherms at 273, 283 and 293 K for the prepared porous glass, (a) adsorbed amount plotted in mmol/g and (b) adsorbed amount plotted in kmol/m3.

Figure 11.
Adsorption isotherms of CO2 on finite-length slit pore model of porous silica glass at 283 K.
Figure 11.
Adsorption isotherms of CO2 on finite-length slit pore model of porous silica glass at 283 K.

Figure 12.
CO2 adsorption isotherms at 283 K in a slit pore model of porous silica glass with 2 nm. width and different concentrations of OH (a) plotted in semi-log scale and (b) plotted in linear scale.
Figure 12.
CO2 adsorption isotherms at 283 K in a slit pore model of porous silica glass with 2 nm. width and different concentrations of OH (a) plotted in semi-log scale and (b) plotted in linear scale.
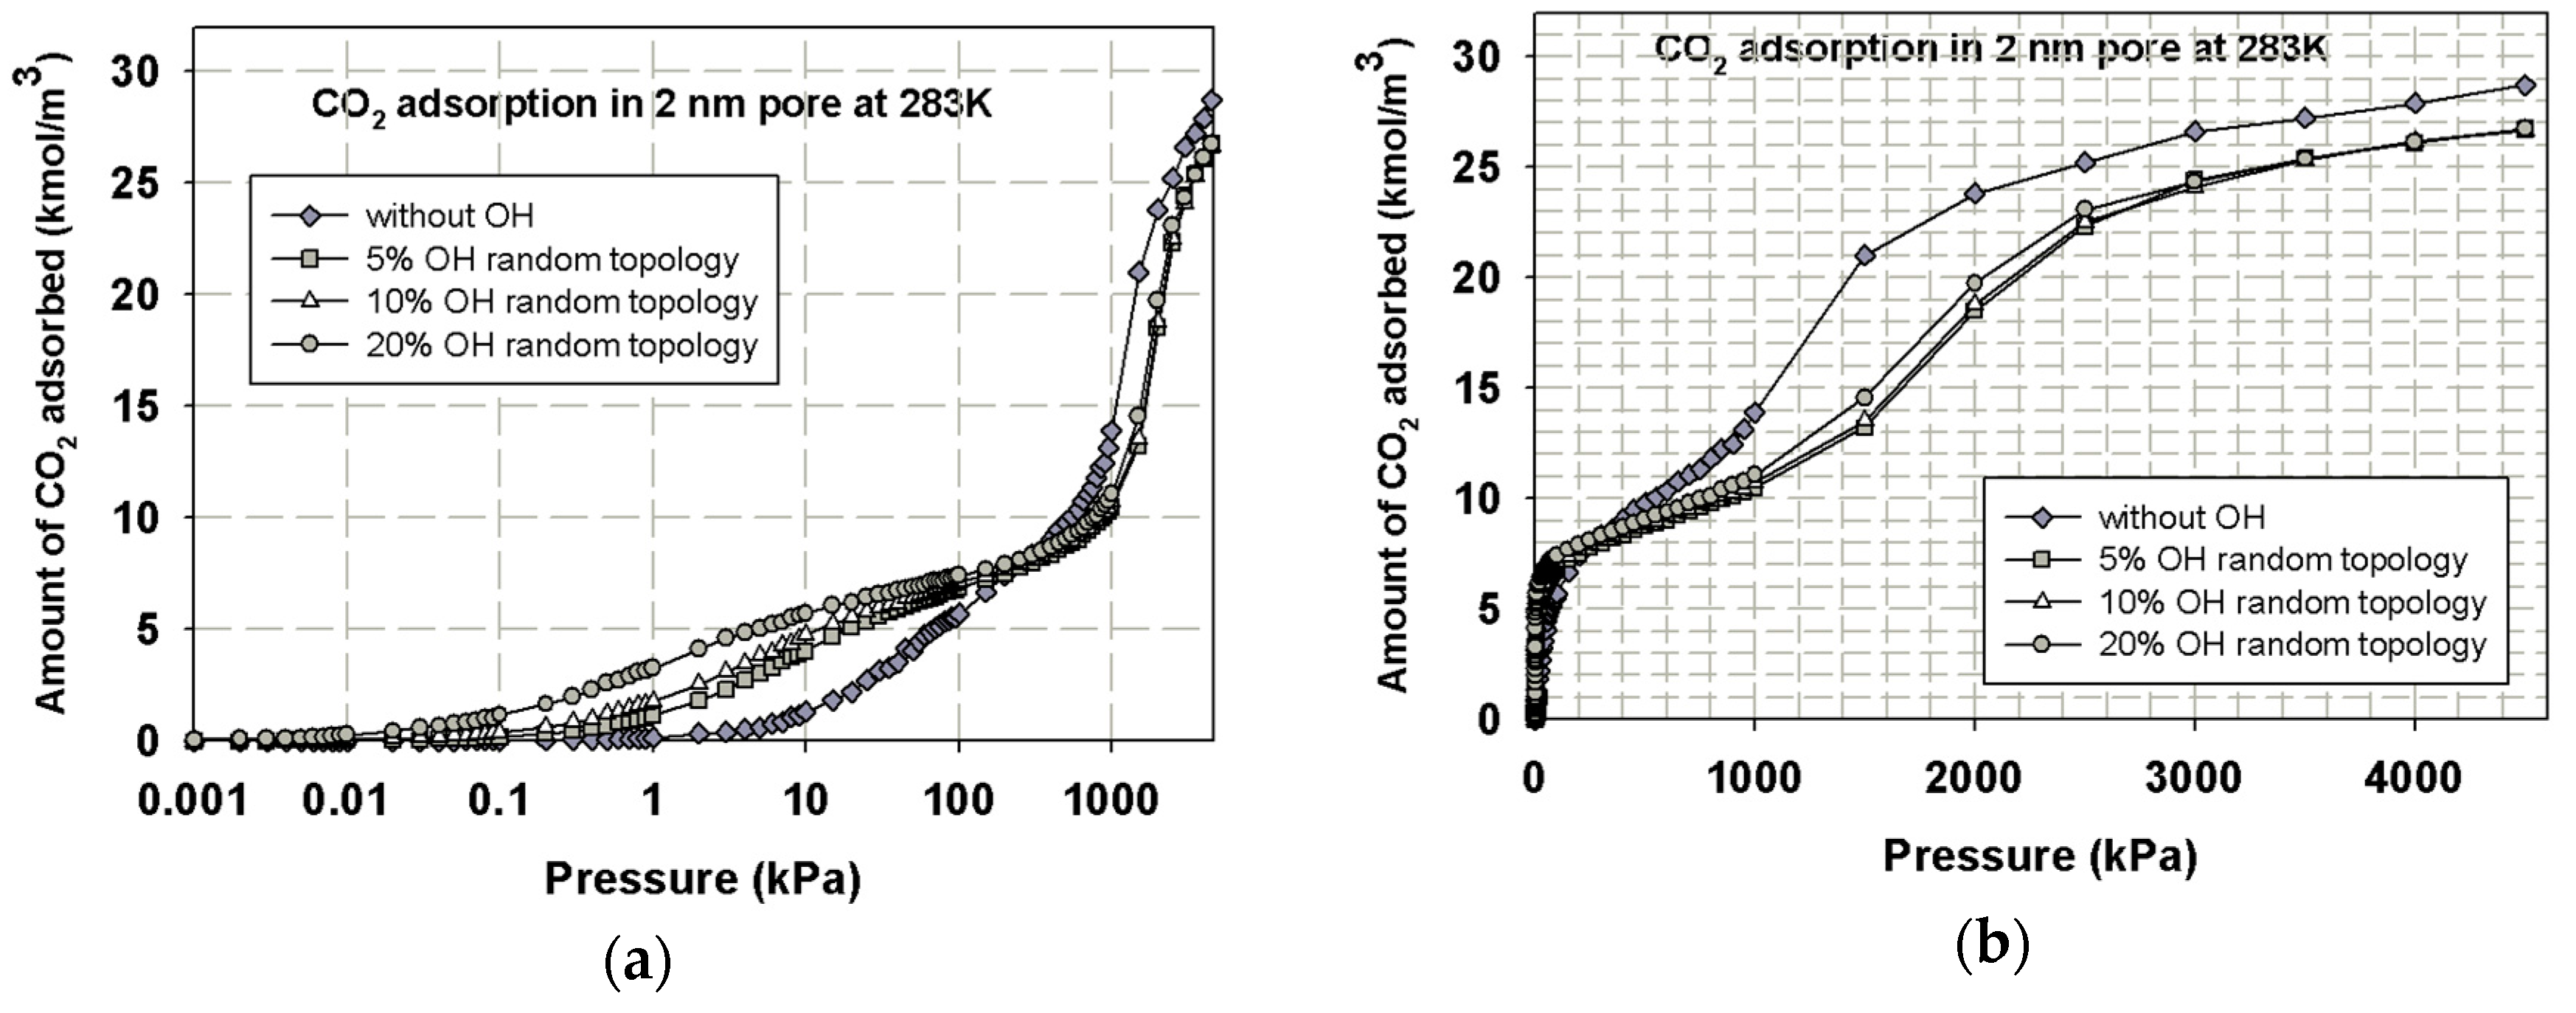
Figure 13.
Snapshots of CO2 molecules in heterogeneous porous glass of 2 nm. In widths at 283 K and 20% of the functional groups. In these figures, the large and small grey spheres represent the solid model of SiO4 crystals, the large green spheres and small green spheres represent the oxygen atoms and the hydrogen atoms of OH group, respectively, and the large black spheres and small red spheres represent the carbon atoms and oxygen atoms of the CO2 molecules, respectively.

Figure 14.
Effects of functional group allocation on CO2 adsorption isotherms at 283 K for the porous silica model of 4 nm widths at (a) plotted in semi-log scale and (b) plotted in linear scale.
Figure 14.
Effects of functional group allocation on CO2 adsorption isotherms at 283 K for the porous silica model of 4 nm widths at (a) plotted in semi-log scale and (b) plotted in linear scale.

Figure 15.
CO2 adsorption on perfect and defective surfaces of pore walls of (a) 1 nm and (b) 3 nm pore widths.
Figure 15.
CO2 adsorption on perfect and defective surfaces of pore walls of (a) 1 nm and (b) 3 nm pore widths.

Figure 16.
Comparison of experimental and simulated isotherms for CO2 adsorption by porous silica glass (sample SG2-200) at 283 K.
Figure 16.
Comparison of experimental and simulated isotherms for CO2 adsorption by porous silica glass (sample SG2-200) at 283 K.

Figure 17.
Calculated PSD obtained from CO2 adsorption isotherms using GCMC simulation.


Table 1.
Molecular parameters and partial point charges of CO2, SiO4 and OH.
| Site | Collision Diameter σ [Å] | Reduced Well Depth, ε/kb [K] | Point Charge q[e] |
|---|---|---|---|
| C (in CO2) | 2.757 | 28.129 | +0.6512 |
| O (in CO2) | 3.033 | 80.507 | −0.3256 |
| O (in silica) | 2.708 | 185.0 | −0.36 |
| Si (in silica) | +0.18 | ||
| O (in OH) | 3.07 | 78.23 | −0.64 |
| H (in OH) | +0.45 |
Table 2.
Chemical compositions (wt.%) of porous glass.
| Composition | SiO2 | CaO | TiO2 | Fe2O3 | Others |
|---|---|---|---|---|---|
| wt.% | 99.213 | 0.017 | 0.338 | 0.052 | 0.380 |
Table 3.
Porous properties of porous silica glass synthesized in this study.
| Samples * | Average Pore Size (nm) | BET Surface Area (m2/g) | Micropore Volume (cm3/g) | Mesopore Surface Area (m2/g) | Total Pore Volume (cm3/g) | Mesopore Volume (cm3/g) |
|---|---|---|---|---|---|---|
| SG2-200 | 2.4 | 798 | 0.183 (37.6%) | 719 | 0.487 | 0.304 (62.4%) |
| SG2-500 | 2.2 | 630 | 0.062 (15.9%) | 596 | 0.391 | 0.329 (84.1%) |
| SG3-200 | 5.0 | 778 | 0.062 (7.8%) | 739 | 0.791 | 0.729 (92.2%) |
| SG4-200 | 10.3 | 413 | 0.017 (1.5%) | 399 | 1.105 | 1.088 (98.5%) |
| SG4-500 | 10.9 | 404 | 0.016 (1.6%) | 390 | 1.032 | 1.016 (98.4%) |
* Porous silica sample is designated as SGX-Y where X is the preparation pH and Y is the calcination temperature.
Table 4.
The concentration of silanol group on the prepared silica glass using TGA.
| Samples | Geminal and Vicinal Silanols Content (mmol OH/g) | Isolated Silanols Content (mmol OH/g) | Total OH Group Content (mmol/g) |
|---|---|---|---|
| SG2-200 | 4.48 | 3.46 | 7.94 |
| SG2-500 | 3.92 | 0.26 | 4.18 |
| SG3-200 | 4.32 | 1.73 | 6.05 |
| SG4-200 | 3.86 | 0.36 | 4.22 |
© 2020 by the authors. Licensee MDPI, Basel, Switzerland. This article is an open access article distributed under the terms and conditions of the Creative Commons Attribution (CC BY) license (http://creativecommons.org/licenses/by/4.0/).
Share and Cite
MDPI and ACS Style
Boonfung, C.; Tangsathitkulchai, C.; Wongkoblap, A. Carbon Dioxide Capture in Homogeneous and Heterogeneous Surfaces of Porous Silica Glass. Processes 2020, 8, 1260. https://doi.org/10.3390/pr8101260
AMA Style
Boonfung C, Tangsathitkulchai C, Wongkoblap A. Carbon Dioxide Capture in Homogeneous and Heterogeneous Surfaces of Porous Silica Glass. Processes. 2020; 8(10):1260. https://doi.org/10.3390/pr8101260
Chicago/Turabian StyleBoonfung, Chontira, Chaiyot Tangsathitkulchai, and Atichat Wongkoblap. 2020. "Carbon Dioxide Capture in Homogeneous and Heterogeneous Surfaces of Porous Silica Glass" Processes 8, no. 10: 1260. https://doi.org/10.3390/pr8101260
Note that from the first issue of 2016, this journal uses article numbers instead of page numbers. See further details here.