Numerical Analysis to the Effect of Guiding Plate on Flow Characteristics in a Ball Valve
by
Yanping Wang
1, 
Chaoning Zhu
1,
Guang Zhang
1,
Dejing Wang
2,
Minghe Jiang
2,
Zuchao Zhu
1 and
Zhe Lin
1,* 1
State-Province Joint Engineering Lab of Fluid Transmission System Technology, Zhejiang Sci-Tech University, Hangzhou 310000, China
2
Danai Pumps Co., Ltd., No.86 Liaohe East Road, DD-Port, Dalian 110621, China
*
Author to whom correspondence should be addressed.
Processes 2020, 8(1), 69; https://doi.org/10.3390/pr8010069
Submission received: 4 November 2019
/
Revised: 28 November 2019
/
Accepted: 2 January 2020
/
Published: 3 January 2020
(This article belongs to the Collection Modeling, Simulation and Computation on Dynamics of Complex Fluids)
Abstract
:When internal flows go through a valve with a small opening degree, high-speed jet flows are induced, which causes the erosion of the valve core and affects the stability of the flow field. Setting guiding plates in the valve behind the valve core has the function of reducing the adverse effect of high-speed jet flows. In this work, numerical simulations were carried out to investigate the effect of the guiding plate on flow and resistance coefficient, velocity and pressure distributions and flow stability downstream of the valve. The number of guiding plates was changed from 0 to 3 and the opening degree was varied from 0 to 100% at intervals of 10%. A guiding plate with holes in it plays the role of bypassing and guiding flow. Under the action of the guiding plate, the flow coefficient obviously decreases, the gap flow between the valve core and the valve wall in the top of the valve are modified, and the gap flow even disappeared in the valve with 3 guiding plates. It was found that setting the guiding plate can improve the performance of the ball valve, reducing the internal erosion and increasing the stability of valve downstream flow efficiently.
1. Introduction
In process machinery, pumps, valves, pipes, absorption tower, fluid-bed and other devices which involve complex flow or heat transfer are indispensable [1,2,3,4,5,6,7,8,9,10,11,12,13]. Among them, the valve is an important controlling device for opening and closing pipelines, adjusting the flow direction and regulating the transmission of the medium [14,15,16,17,18,19,20]. Due to its various features and functions, the valve is widely used in life and in industrial fields. With the continuous upgrading of equipment manufacturing, the reliability and performance of valve is highly demanded. Vortices, water blows and cavitation may be occurring as the flows pass through the valve, its downstream pipelines and equipment [21]. When the valve is opened to different opening degrees, the flow states are greatly changed. Particularly, when the valve is opened at small opening degrees, high-speed jet flows are generated under the high pressure behind the valve core. The generated high-speed jet flows collide with the walls of valve and downstream pipelines, also eroding their surface, which simultaneously affects the performance of the valve and results in lengthening the stable distance of downstream flow. To improve the above problems, a lot of theoretical and experimental studies have been carried out. Tabrizi et al. [22] carried out numerical simulations to study the cavitation in a ball valve, and found that as the valve opening degree decreased, the vortex at the downstream grew and led to a high pressure drop, as well as energy loss. Ming et al. [23] studied the performance, flow patterns and cavitation phenomena of a ball valve, visualized various patterns of flows in a downstream ball valve with different valve opening degrees, and discussed the correlation between the performance of ball valves and flow patterns in detail. Moujaes et al. [24] used a 3D CFD model to simulate fluid flow in a commonly used flanged ball valve at different valve opening degrees, and calculated the loss coefficient and flow coefficient at different valve opening degrees. The obtained Reynolds numbers at full open, two thirds open and one third open of a ball valve were discussed. Ye et al. [25] investigated flow characteristics in slide valves with different channels, derived the function among drainage coefficient, groove geometry, flow state, fitting coefficient and flow stability was compared between experimental and CFD data. The groove shape was observed to have a significant influence on flow characteristics such as flow area, jet angle, flow stability and throttle stiffness in the valves.
Overall, the flow pattern in a valve is an important factor affecting valve performance and erosion characteristics. Adding guiding plates in the channel of the downstream valve core is an effective way to adjust the flow pattern. As is known, the ball valve is a commonly used valve used in process machinery; hence, in this work, a ball valve was chosen as the sample valve, and different numbers of the guiding plates were set in the sample valve to check their effects on flow pattern and performance of valve. A numerical method was employed to simulate the internal flow field of sample valve with different numbers of guiding plate under different valve opening degrees.
2. Simulation Calculation
2.1. Computational Domain
A ball valve (DN50) with good sealing performance and simple structure, which can be closed and opened with a small force, was chosen as the sample valve. The diameter of the valve core was 80 mm and the diameter of the flow channel was 50 mm. In addition, the hole with the diameter of 40 mm was designed in the left side to reduce effects of the high-speed jet flows at small valve opening degrees. The structure of the ball valve with guiding plate (the number of guiding plate is three) is shown in Figure 1.
The guiding plate was designed as a rectangle with rounded corners, as shown in Figure 2. Fifteen holes are evenly distributed in the center of the plate, the diameter of the holes is 4 mm, the center distance between two holes is 9 mm, and the thickness of the plate is 3 mm.
In the present study, the internal flow characteristics of the sample valve and the valve with 1, 2 and 3 guiding plates at different valve opening degrees were simulated respectively. The valve opening degree was varied from 10% to 100% with an interval of 10%.
When the number of guiding plates was more than one, a cambered plate was used to connect the guiding plates to be an assembled part located in the center of the valve core. The structure of the simulated valve cores is illustrated in Figure 3.
2.2. Boundary Conditions
The commercial software FLUENT was used. The governing equations of mass and momentum are shown in Equations (1) and (2), respectively. The RNG k-ε model was chosen as the turbulence model to calculate the steady 3D flows in valves, and the turbulent kinetic energy, energy dissipation rate and turbulence viscosity were calculated based on Equations (3)–(5). RNG k-ε turbulence model modifies the turbulent viscosity, which has advantages for calculating flows with turbulent eddies and close to the wall. The velocity inlet and pressure outlet were used as the boundary conditions for the inlet and outlet. Two monitor points were set to measure the static pressure located at the 10D upstream and 10D downstream of the ball valve.
where V is velocity vector, τij is Reynolds stress, and F is external force. k, ε and μt represent turbulent kinetic energy, energy dissipation rate and turbulence viscosity. Gk is the kinetic energy induced by the mean velocity gradient and Gb is the kinetic energy induced by the buoyancy force. YM represents energy term of fluctuation expansion for turbulence flows. Sk and Sε are user-defined terms based on different turbulence flows. Ω is the vortex characteristic number and as is the vortex constant based on different flow conditions.
2.3. Computational Grids
The unstructured grids were created and used in 3D numerical simulations. ICEM was used to generate the computational grids. The partial domains were created with dense grids such as the valve core or regions upstream and downstream of the valve core. The Octree algorithm was used as automatic grid algorithm of ICEM. The grid type is the tetrahedral/hybrid grid. The mesh distributions of the computation domain are shown in Figure 4.
2.4. Mesh Independence Verification
The model valve with 2 guiding plates under 50% opening degree was selected to verify the mesh independence. The total quantity of grids is about 1.5 million, 4 million, 5 million and 7 million, respectively. The histogram of flow coefficient and resistance coefficient calculated by simulation is shown in Figure 5, which displays that the flow coefficient and resistance coefficient calculated under different number of grids are almost same. To ensure the clarity of fluid flow in and downstream of the valve, 3.5 million grids were chosen.
2.5. Simulation Accuracy Verification
To verify the accuracy of the numerical calculation, the external characteristics of the sample ball valve at ten different opening degrees were explored, and the experimental and simulation results were compared. The sketches of experimental system are shown in Figure 6, and the experimental and numerical results are illustrated in Figure 7. A variable frequency pump was used to provide the power for the working fluid through the whole pipeline system controlled by several regulating valves. Two pressure transducers were installed upstream and downstream of the valve to monitor the pressure change. The whole pipeline system was a closed loop system, and the working fluid can be used repeatedly.
From Figure 7, it can be seen that both the curve from the experimental results and that from the numerical results have the same trend, and the experimental and numerical values of flow coefficient nearly coincide at opening degrees of less than 70%. In particular, at the 50% opening degree, the flow coefficient in the experimental and numerical studies are nearly the same. However, at relatively large opening degrees (>70%), the difference of flow coefficient is relatively large between the experimental and numerical values. Based on the calculation equation of the flow coefficient, the flow coefficient is inversely proportional to the square root of pressure difference between upstream and downstream of the valve core. At larger opening degrees, the pressure difference is smaller, and it is more sensitive to measured pressure valve from experimental tests.
Overall, although there may be some errors between the simulation and the experimental values, most of the data are consistent, particularly when the opening degree is less than 70%, which shows that the numerical method is reasonable. Therefore, the following studies about the effect of guiding plates and valve opening degree on flow characteristic of flows in valve are able to be investigated by the numerical method.
3. Results and Discussion
3.1. Flow and Resistance Coefficient
Flow resistance characteristics can be expressed by using the flow coefficient and the resistance coefficient. The flow coefficient (Kv) indicates the flow capacity of the valve, which is calculated based on Equation (6). The pressure difference (∆P) between 10D upstream and 10D downstream of the valve are obtained to calculate Kv and ζ. The flow coefficient is directly and inversely proportional to the flow rate and the square root of the pressure difference, respectively.
The resistance coefficient (ζ) is used to express the pressure drop of the flow through the valve core and it is calculated as shown in Equation (7). As the pressure difference increases, the resistance coefficient increases as well.
where ∆P is the pressure drop (Pa), ρ is the fluid density (kg/m3), Q is the flow rate (m3/h), and v is the flow velocity.
The flow coefficients are plotted at different valve opening degrees and numbers of guiding plates in Figure 8. No matter whether the valve is with guiding plate or not, the flow coefficient increases with increasing valve opening degree. When the opening degree is at 10%–20%, the guiding plate has no effect on flow coefficients, flow coefficients of the valve with or without guiding plate are exactly the same. In addition, with the increase of opening degree (>20%), the flow coefficient of valve without guiding plate is higher than that with guiding plate. This is due to the fact that the flow area is decreased compared to that in the valve core without the plate. When more plates are added, the ability of flows to go through the valve core is further decreased. Similarly, the number of guiding plates has little effect on flow coefficient at 10%–70% opening degree, and until the opening degree is larger than 70%, the flow coefficient decreases apparently when the number of guiding plates increases.
The resistance coefficients are also obtained at different valve opening degrees and numbers of the guiding plates, as shown in Figure 9. The resistance coefficient decreases as the valve opening degree increases in the range of 10%–70%, and it remarkably decreases at the range of 10% to 20%. When the opening exceeds 70%, the difference of resistance coefficient of all models can be ignored.
Moreover, Figure 9 reveals that the effect of the guiding plate on resistance coefficient is slight. The resistance coefficient of the valve with the guiding plate is a little higher than that of the valve without the guiding plate.
3.2. Velocity Distribution of Valve Internal Flow
To examine the effect of guiding plate on the internal flow of the valve, the velocity distributions of flow in the valve without guiding plate and with 1, 2 and 3 guiding plates were simulated. The typical opening degree, namely, small opening degree (20%), half opening degree (50%) and large opening degree (80%) are considered. The respective velocity contours are shown in Figure 10, Figure 11 and Figure 12.
The velocity contours corresponding to an opening degree of 20% are shown in Figure 10. In Figure 10a, when there is no guiding plate in the valve, the flows move downstream without any obstructions. The flows are separated into two parts when guiding plates are installed inside the valve. One part of the flows moves through holes on the guiding plate, and the other part moves through the gap between the valve core and the valve wall, as shown in Figure 10b–d. From Figure 10d, it can be found that when three guiding plates are used, most flows move through the holes on the guiding plate, and the guiding plate at the downstream blocks the gap between the valve core and the valve wall. Additionally, as the number of the guiding plates increases, the flow cross-section in the valve is reduced, and the flow capacity is also decreased. The velocity is higher in the valve with 3 guiding plates compared to that in other 3 cases, and the jet flows are also weaker along downstream of the valve with three guiding plates.
The velocity contours at the opening degree of 50% are shown in Figure 11. Most flows move through the holes on guiding plate, and the flow capacity also increases, which increases due to the valve opening degree.
When one guiding plate is used, as the flow cross-section decreases, high-speed jet flows are induced behind the holes on guiding plate, as shown in Figure 11b. Flows are separated into two parts when 2 guiding plates are used, as shown in Figure 11c. The guiding plates block the gap again when three guiding plates are installed in the ball valve (Figure 11d).
The velocity contours at a valve opening degree of 80% are shown in Figure 12. Due to the large opening degree of the valve, the jet flows are weak. As the number of the guiding plates increases, the flow velocity at the exit of the ball valve also increases, which indicates that the guiding plate has a reverse effect on stabilizing the jet flow at a large valve opening degree.
3.3. Velocity and Pressure Distribution in the Valve with Three Guiding Plates
According to the analysis on velocity distribution on the valve with guiding plate, it is noted that the flow in the valve with three guiding plates is more desirable than the others. Therefore, more detailed simulations were calculated on it. The velocity contours and pressure contours of the valve with three guiding plates at opening degrees of 10%, 30%, 50%, 70% and 90% were simulated and discussed.
Velocity contours are shown in Figure 13. The velocity of the flows in the valve decreases with the increasing opening degree; on the contrary, the flow capacity increases. The maximum velocity is observed at the opening degree of 10%, which leads to the most serious erosion on the surface of the guiding plate and the top wall of the valve. As the valve opening degree gradually increases, the inlet velocity decreases, and the erosion is alleviated. The velocity of flows across the holes on guiding plates is varying at different opening degrees. As shown in Figure 13a–c, the velocity across holes gradually increases when the opening degree is enlarged from 10% to 50%, and it grows to the maximum at the opening degree of 50%. In this situation, as a result of the cross-section of flow be to the smallest, most flows must move through the holes on guiding plate. However, as shown in Figure 14c–e, when the opening degree of the valve is varied from 50% to 90%, the flow velocity across the holes on the guiding plate gradually decreases, and the flows move through the holes on guiding plate as well as the channel between two guiding plates.
Pressure contours obtained at different valve opening degrees are shown in Figure 14. High-pressure regions are observed upstream of the valve core at different valve opening degrees. As the valve opening degree gradually increases, the pressure gradually decreases in the ball valve and the pressure upstream of the valve core is also reduced. The pressure difference between the pressure at the upstream and the pressure at the downstream of the valve core is the highest at the valve opening degree of 10% compared to that at other opening degrees. High-pressure regions are observed at the front edge of the guiding plate for all cases. When flows move through the holes on the guiding plate, relatively high-pressure regions are observed near the holes on the front guiding plate.
3.4. Velocity Distribution Downstream of Valve
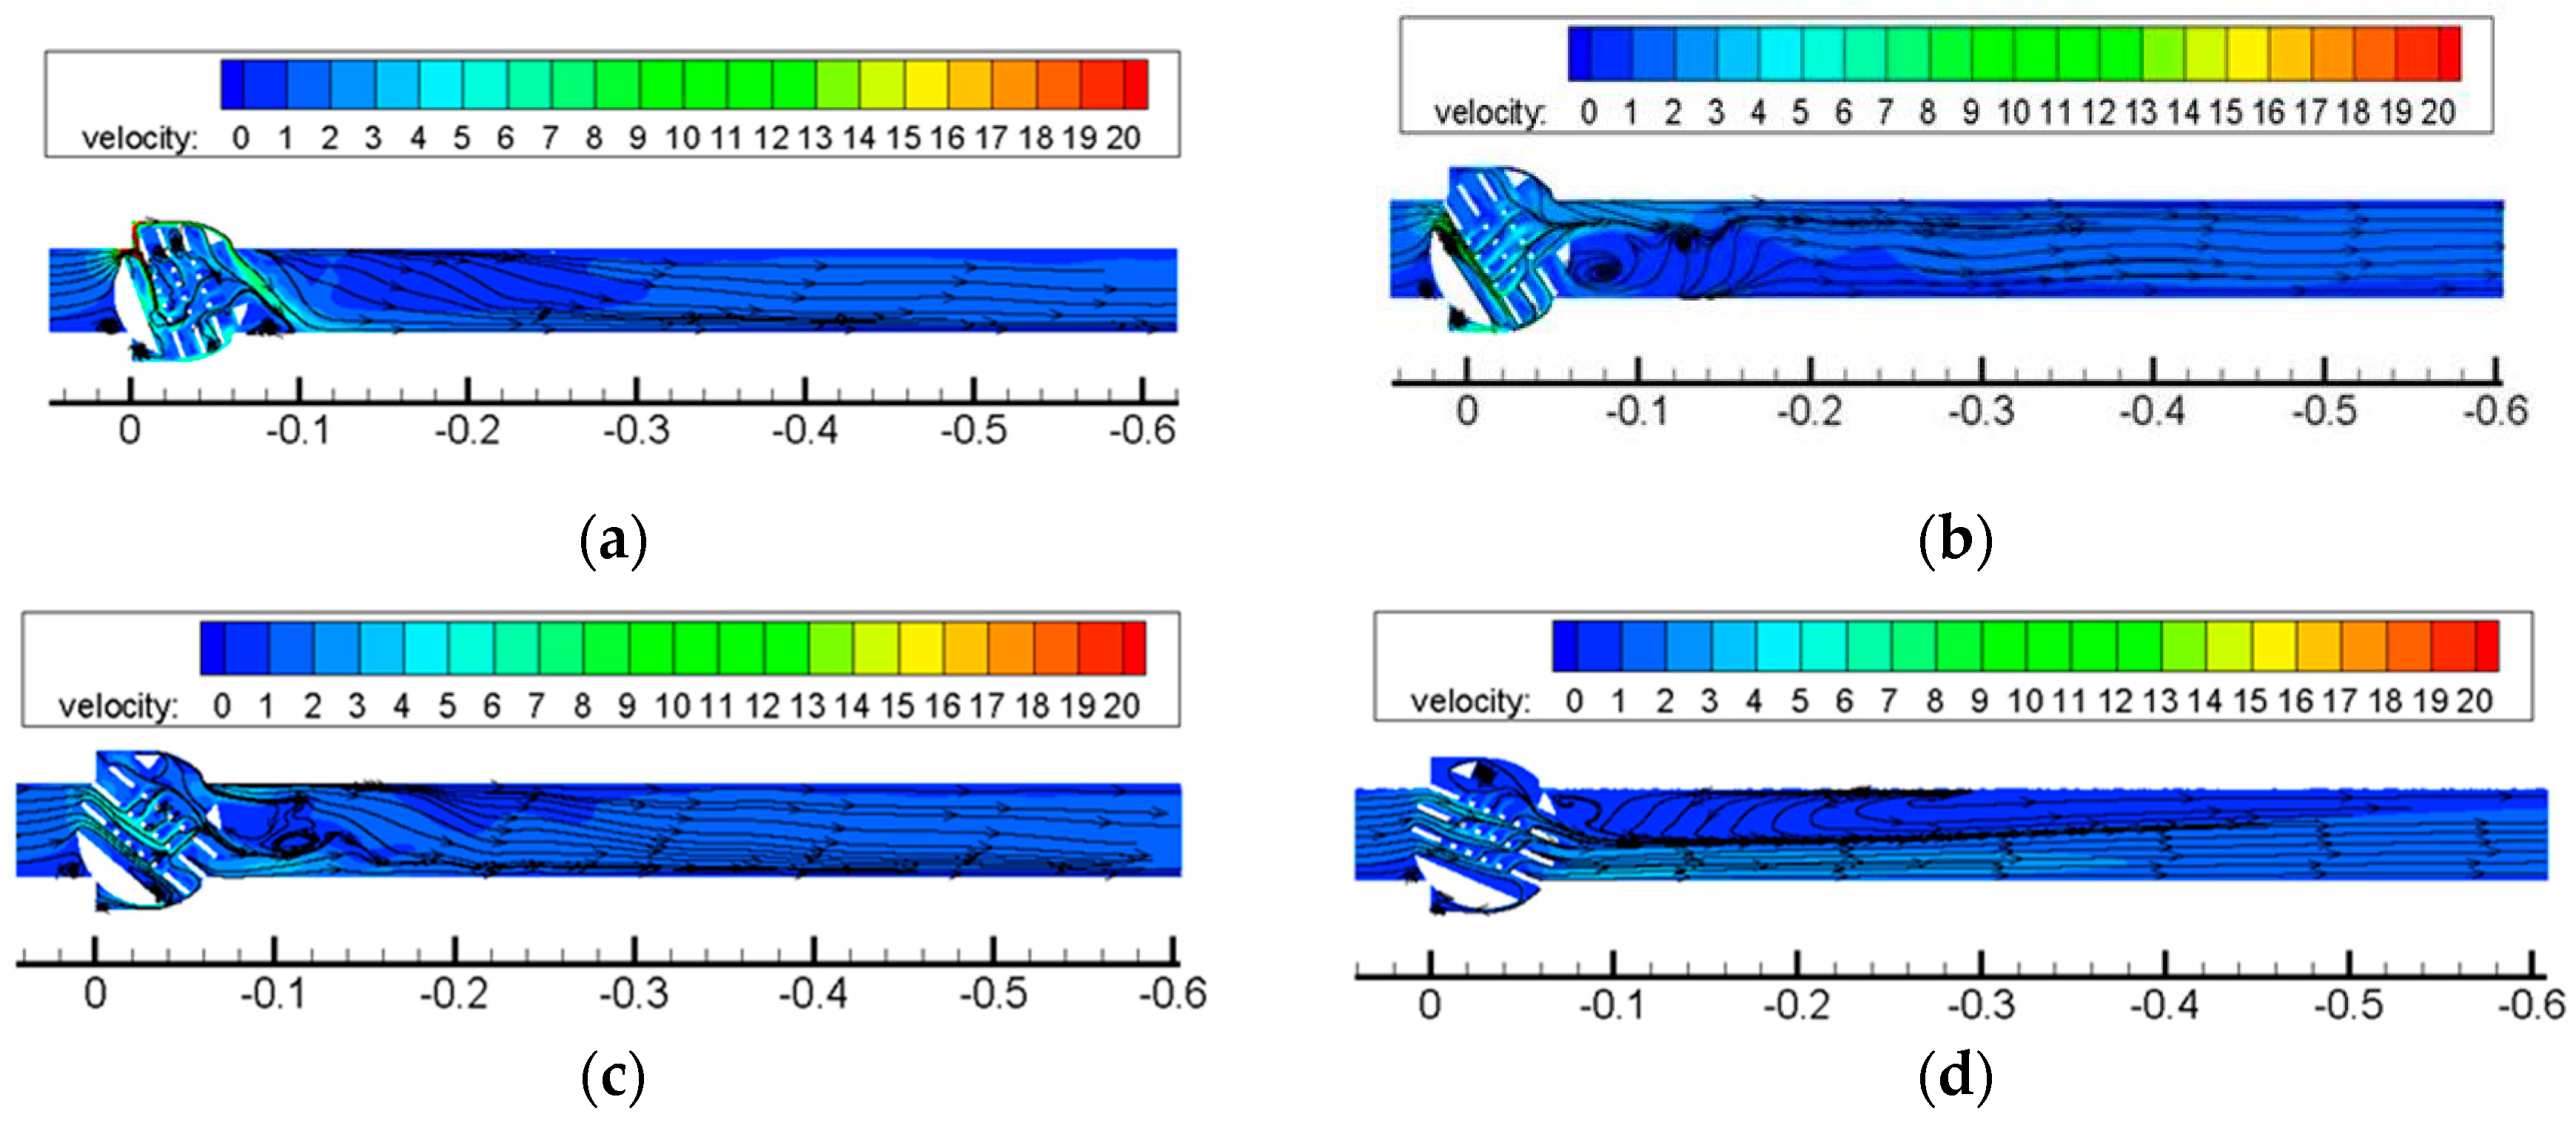
Velocity contours and streamlines of flows downstream of the ball valve with three guiding plates are obtained at different valve opening degrees, and are demonstrated in Figure 15.
In Figure 15a, a small vortex is observed at the downstream of the valve at the opening degree of 10%, and the flows become stable after the location of 4D. In Figure 15b, at the opening degree of 30%, the vortex downstream of the ball valve expands and the flows located at the region from 0 to 2D are extremely turbulent. In Figure 15c, at the valve opening degree of 50%, the vortex moves upward and becomes smaller. Figure 15d shows that a large vortex is generated along the top wall and dominates the whole flow field along with the valve was opened to 70%. Meanwhile, different from the existing velocity contours and streamlines, the vortex disappears and the flows become stable in the whole field when the valve was opened further to 90% opening degree (as seen in Figure 15e).
4. Conclusions
The effect of guiding plates on internal flow characteristic of a ball valve and its downstream were discussed by numerical method. Four valve structures including a sample vale (without guiding plate) and ball valves with one plate, two plates and three plates were simulated. The opening degrees of 10%, 20%, 30%, 40%, 50%, 60%, 70%, 80%, 90% and 100% were selected. By analyzing the flow and resistance coefficient, velocity, and pressure contours, the conclusions are summarized as follows:
- (1)
- By comparing the flow and resistance coefficients of the valves without guiding plates and with guiding plates, the guiding plate can decrease the flow coefficient obviously, but will have a slight effect on the resistance coefficient.
- (2)
- The guiding plate can modify the gap flow between the valve core and the valve wall in the top of the valve. When three guiding plates are used, most flows move through the holes on the guiding plate. The plate at the downstream blocks the whole gap, thus avoiding the generation of the gap jet flow, and improves the flow stability of downstream of valve ultimately. High-speed jet flows occur downstream of the guiding plate, which alleviates the erosion of the core and the wall.
- (3)
- The guiding plate plays a significantly important role in separating the flow and the holes on guiding plate provide drainage. Compared to the valve without guiding plates, the flow distribution in the valve with guiding plate is much more uniform, which reduces the internal erosion and stabilizes the downstream flow of the valve, particularly when the valve opening degree is small, when the effect is more noticeable. The present studies have practical significance for designing a ball valve. By adding the guiding plate, the downstream flows of the valve core are stabilized, and the erosion of the valve core and wall surface is reduced as well, which increases the lifetime of the ball valve and working stability of the pipeline system.
Author Contributions
Conceptualization, Y.W., Z.L.; software, C.Z. and Y.W.; formal analysis, C.Z., Z.Z., D.W. and M.J.; investigation, Y.W.; data curation, Z.L., Z.Z., D.W. and M.J.; writing—original draft preparation, C.Z., G.Z., Y.W.; writing—review and editing, G.Z., Y.W., Z.Z., D.W. and M.J.; supervision, Z.L.; funding acquisition, Y.W. All authors have read and agreed to the published version of the manuscript.
Funding
This research was funded by National Natural Science of China, grant number 51676174.
Acknowledgments
The authors thank for the financial support of National Natural Science of China.
Conflicts of Interest
The authors declare no conflict of interest.
References
- Li, X.J.; Chen, B.; Luo, X.W.; Zhu, Z.C. Effects of flow pattern on hydraulic performance and energy conversion characterization in a centrifugal pump. Renew. Energy 2019. [Google Scholar] [CrossRef]
- Pei, J.; Osman, M.K.; Wang, W.J.; Yuan, J.P.; Yin, T.Y.; Appiah, D. Unsteady flow characteristics and cavitation prediction in the double-suction centrifugal pump using a novel approach. Proc. Inst. Mech. Eng. Part A J. Power Energy 2019. [Google Scholar] [CrossRef]
- Bai, L.; Zhou, L.; Han, C.; Zhu, Y.; Shi, W.D. Numerical study of pressure fluctuation and unsteady flow in a centrifugal pump. Processes 2019, 7, 354. [Google Scholar] [CrossRef] [Green Version]
- Wang, C.; Chen, X.X.; Qiu, N.; Zhu, Y.; Shi, W.D. Numerical and experimental study on the pressure fluctuation, vibration and noise of multistage pump with radial diffuser. J. Braz. Soc. Mech. Sci. 2018, 481. [Google Scholar] [CrossRef]
- Wang, C.; He, X.K.; Shi, W.D.; Wang, X.K.; Wang, X.L.; Qiu, N. Numerical study on pressure fluctuation of a multistage centrifugal pump based on whole flow field. AIP Adv. 2019, 9, 035118. [Google Scholar] [CrossRef] [Green Version]
- Pei, J.; Zhang, F.; Appiah, D.; Hu, B.; Yuan, S.Q.; Chen, K.; Asomani, S.N. Performance prediction based on effects of wrapping angle of a side channel pump. Energies 2019, 12, 139. [Google Scholar] [CrossRef] [Green Version]
- Liu, Q.; Ye, J.H.; Zhang, G.; Xu, H.G.; Jin, H.Z.; Zhu, Z.C. Study on the metrological performance of a swirlmeter affected by flow regulation with a sleeve valve. Flow Meas. Instrum. 2019, 67. [Google Scholar] [CrossRef]
- Liu, Q.; Ye, J.H.; Zhang, G.; Lin, Z.; Xu, H.G.; Zhu, Z.C. Metrological performance investigation of swirl flowmeter affected by vortex inflow. J. Mech. Sci. Tech. 2019, 33, 1–10. [Google Scholar] [CrossRef]
- Li, Y.; Zhang, H.B.; Lin, Z.; He, Z.H.; Xiang, J.L.; Xiang, X.H. Relationship between wear formation and large-particle motion in a pipe bend. R. Soc. Open Sci. 2019, 6, 181254. [Google Scholar] [CrossRef] [Green Version]
- Yang, H.; Zhang, W.; Zhu, Z.C. Unsteady mixed convection in a square enclosure with an inner cylinder rotating in a bi-directional and time-periodic mode. Int. J. Heat Mass. Tran. 2019, 136, 563–580. [Google Scholar] [CrossRef]
- Zhang, W.; Li, X.J.; Zhu, Z.C. Quantification of wake unsteadiness for low-Re flow across two staggered cylinders. Proc. Inst. Mech. Eng. Part C J. Mech. Eng. Sci. 2019, 233, 6892–6909. [Google Scholar] [CrossRef]
- Li, S.J.; Deng, S.; Zhao, L.; Zhao, R.K.; Lin, M.; Du, Y.P.; Lian, Y.H. Mathematical modeling and numerical investigation of carbon capture by adsorption: Literature review and case study. Appl. Energy 2018, 221, 437–449. [Google Scholar] [CrossRef]
- Li, X.J.; Li, B.W.; Yu B., X.; Ren, Y.; Chen, B. Calculation of cavitation evolution and associated turbulent kinetic energy transport around a NACA66 hydrofoil. J. Mech. Sci. Tech. 2019, 33, 1231–1241. [Google Scholar] [CrossRef]
- Zheng, X.; Lin, Z.; Xu, B.Y. Thermal conductivity and sorption performance of nano-silver powder/FAPO-34 composite fin. Appl. Therm. Eng. 2019, 29, 114055. [Google Scholar] [CrossRef]
- Kim, C.K.; Lee, S.M.; Jang, C.M. Performance analysis of a ball valve used for gas pipelines by introducing nondimensional parameters. Adv. Mech. 2019, 11, 1–10. [Google Scholar] [CrossRef] [Green Version]
- Wang, G.R.; Tao, S.Y.; Liu, Q.Y.; Fu, Y.K.; Zhu, H.; Chu, F. Experimental validation on a new valve core of the throttle valve in managed pressure drilling. Adv. Mech. 2015, 6, 324219. [Google Scholar] [CrossRef] [Green Version]
- Tao, J.Y.; Lin, Z.; Ma, C.J.; Ye, J.H.; Zhu, Z.C.; Li, Y.; Mao, W. An experimental and numerical study of regulating performance and flow loss in a V-Port ball valve. ASME J. Fluids Eng. 2020, 142, 021207. [Google Scholar] [CrossRef]
- Xia, G.D.; Bo, C.; Cheng, L.X.; Wang, Z.; Jia, Y. Experimental study and modelling of average void fraction of gas-liquid two-phase flow in a helically coiled rectangular channel. Exp. Therm. Fluid Sci. 2018, 94, 9–22. [Google Scholar] [CrossRef] [Green Version]
- Cui, B.L.; Lin, Z.; Zhu, Z.C.; Wang, H.J.; Ma, G.F. Influence of opening and closing process of ball valve on external performance and internal flow characteristics. Exp. Therm. Fluid Sci. 2016, 80, 193–202. [Google Scholar] [CrossRef]
- Lin, Z.; Ma, G.F.; Cui, B.L.; Li, Y.; Zhu, Z.C.; Tong, N.S. Influence of flashboard location on flow resistance properties and internal features of gate valve under the variable condition. J. Nat. Gas Sci. Eng. 2016, 33, 108–117. [Google Scholar] [CrossRef]
- Cui, B.L.; Ma, G.F.; Wang, H.J.; Lin, Z.; Sang, Z.H. Influence of valve core structure on flow resistance characteristics and internal flow field of throttling stop valve. J. Mech. Eng. 2015, 51, 178–184. [Google Scholar] [CrossRef]
- Tabrizi, A.S.; Asadi, M.; Xie, G.; Lorenzini, G.; Biserni, C. Computational fluid-dynamics-based analysis of a ball valve performance in the presence of cavitation. J. Eng. Thermophysics. 2014, 23, 27–38. [Google Scholar] [CrossRef]
- Ming, J.C.; Wang, C.C.; Ma, C.H. Performance test and flow visualization of ball valve. Exp. Therm. Fluid Sci. 2006, 31, 505–512. [Google Scholar] [CrossRef]
- Moujaes, S.F.; Jagan, R. 3D CFD predictions and experimental comparisons of pressure drop in a ball valve at different partial openings in turbulent flow. J. Energy Eng. 2008, 134, 24–28. [Google Scholar] [CrossRef]
- Ye, Y.; Yin, C.B.; Li, X.D.; Zhou, W.J.; Yuan, F.F. Effects of groove shape of notch on the flow characteristics of spool valve. Energy Convers. Manag. 2014, 86, 1091–1101. [Google Scholar] [CrossRef]
Figure 1.
Cross-section of the valve with 3 guiding plates.
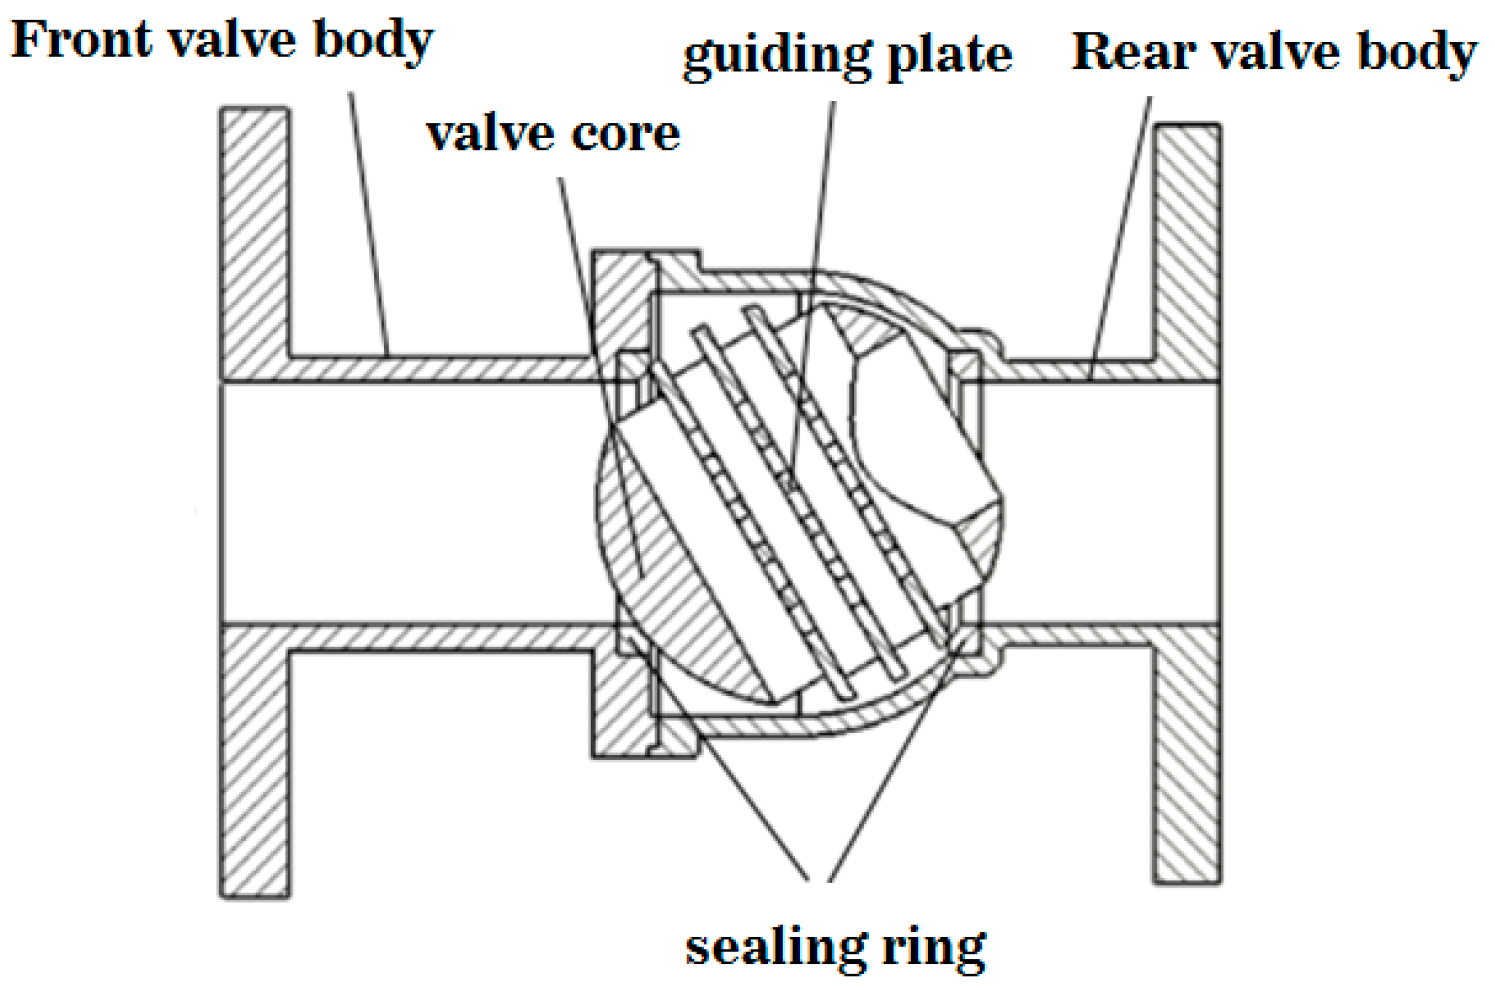
Figure 2.
Plane structure of the guiding plate.

Figure 3.
Structure of valve core without and with guiding plate. (a) No guiding plate, (b) 1 guiding plate, (c) 2 guiding plates, (d) 3 guiding plates.
Figure 3.
Structure of valve core without and with guiding plate. (a) No guiding plate, (b) 1 guiding plate, (c) 2 guiding plates, (d) 3 guiding plates.

Figure 4.
Mesh distributions of computational domain.
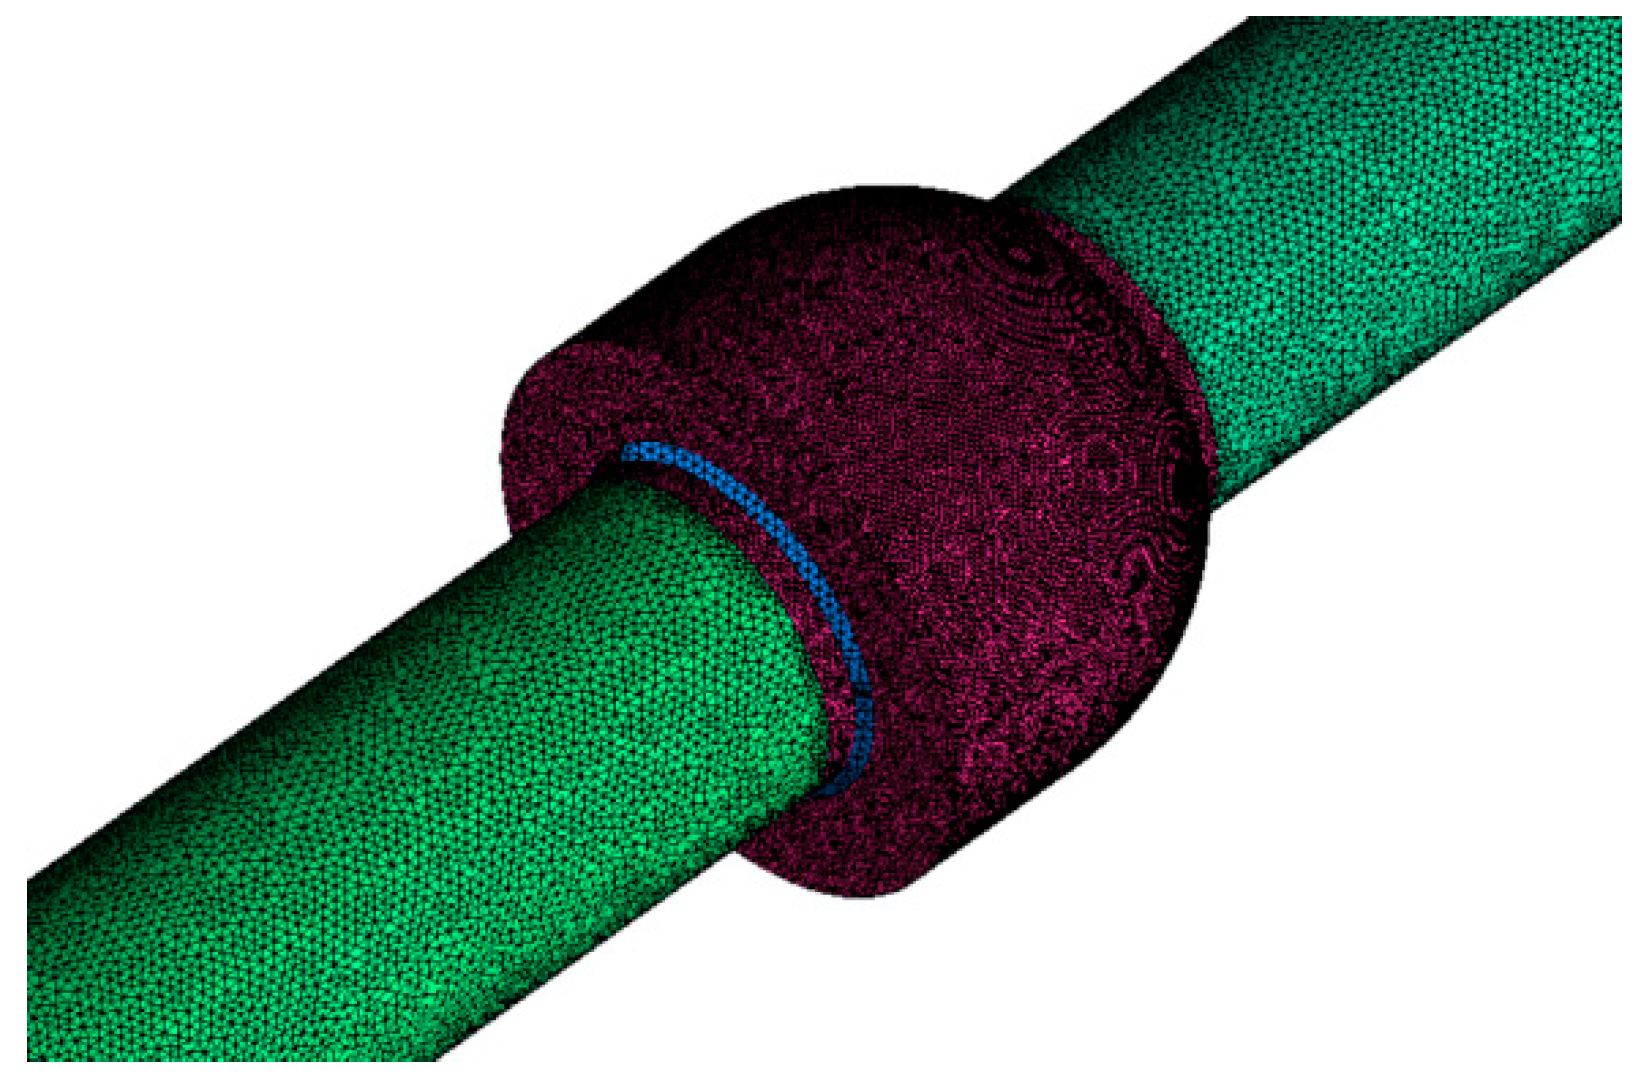
Figure 5.
Histogram of flow and resistance coefficient obtained by simulation.

Figure 6.
Sketches of experimental system.
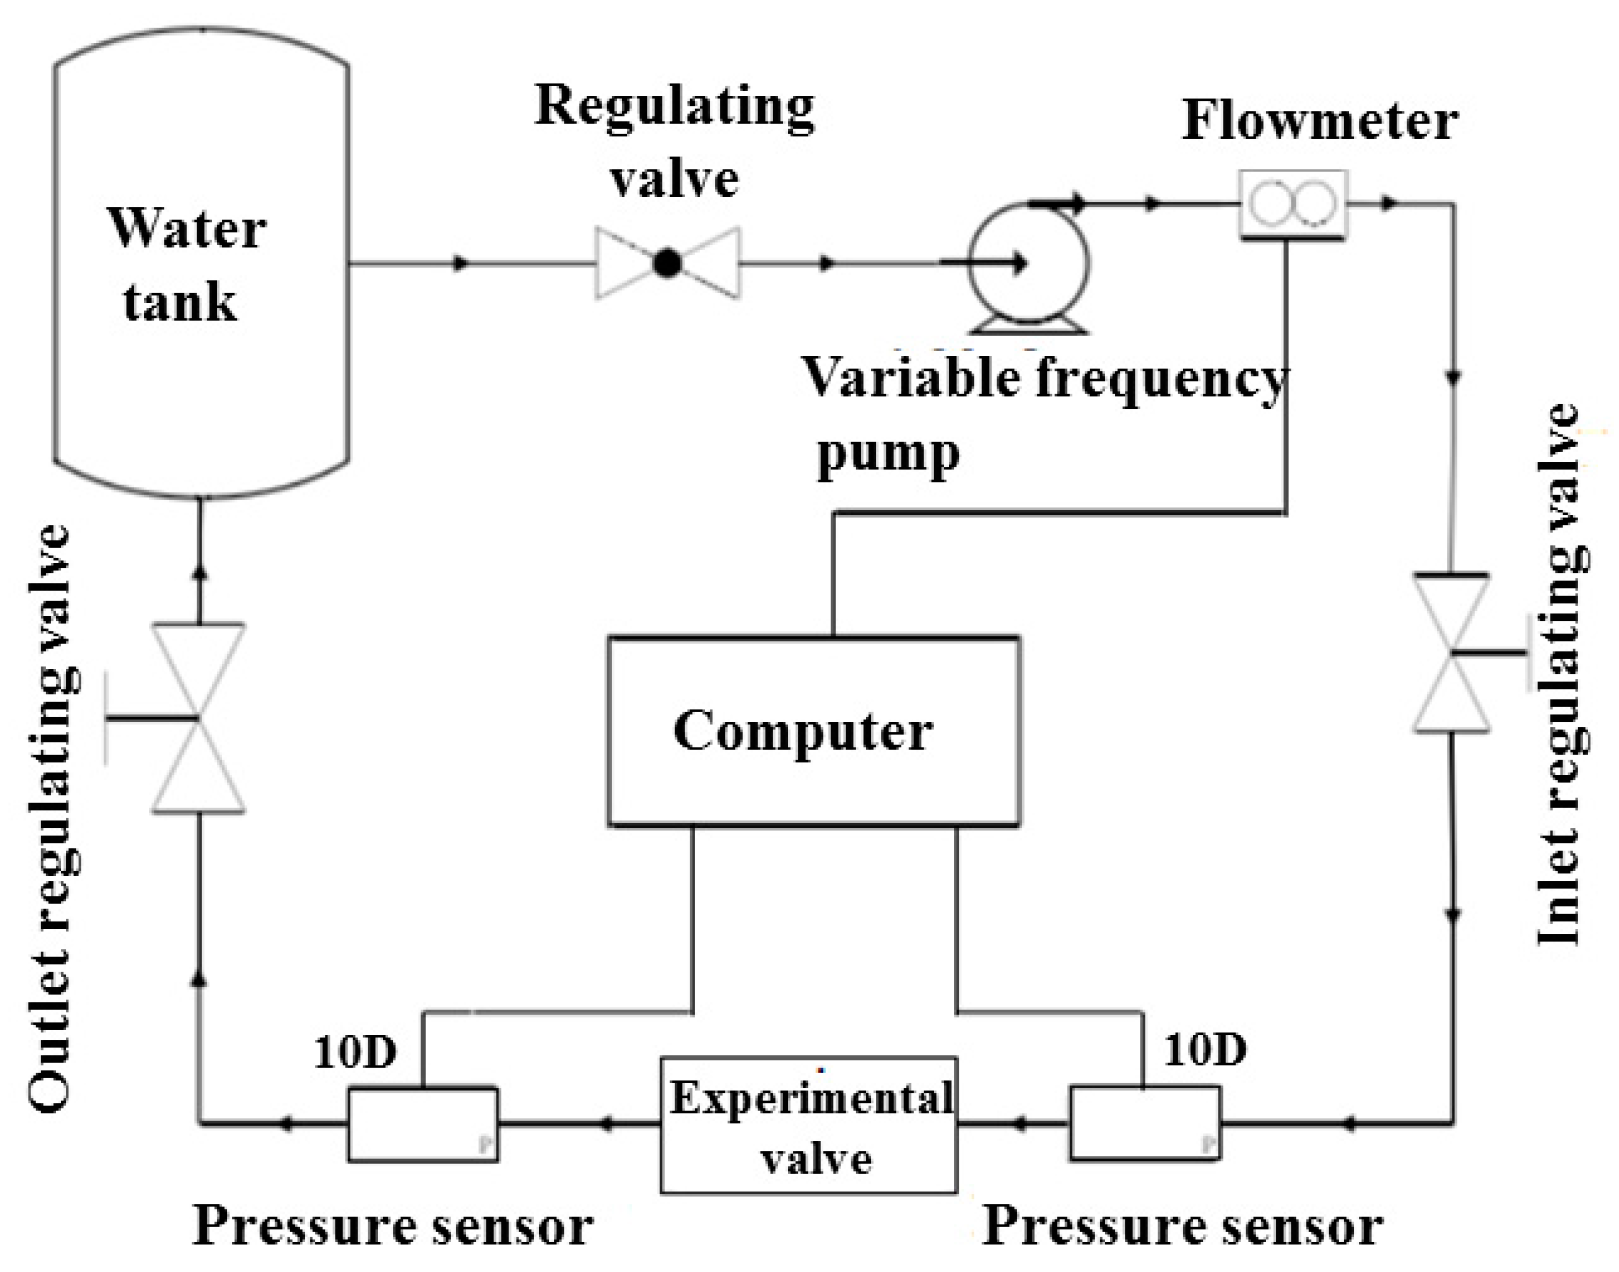
Figure 7.
Comparisons of experimental and numerical flow coefficients.

Figure 8.
Flow coefficients at different valve opening degrees.

Figure 9.
Resistance coefficients at different valve opening degrees.
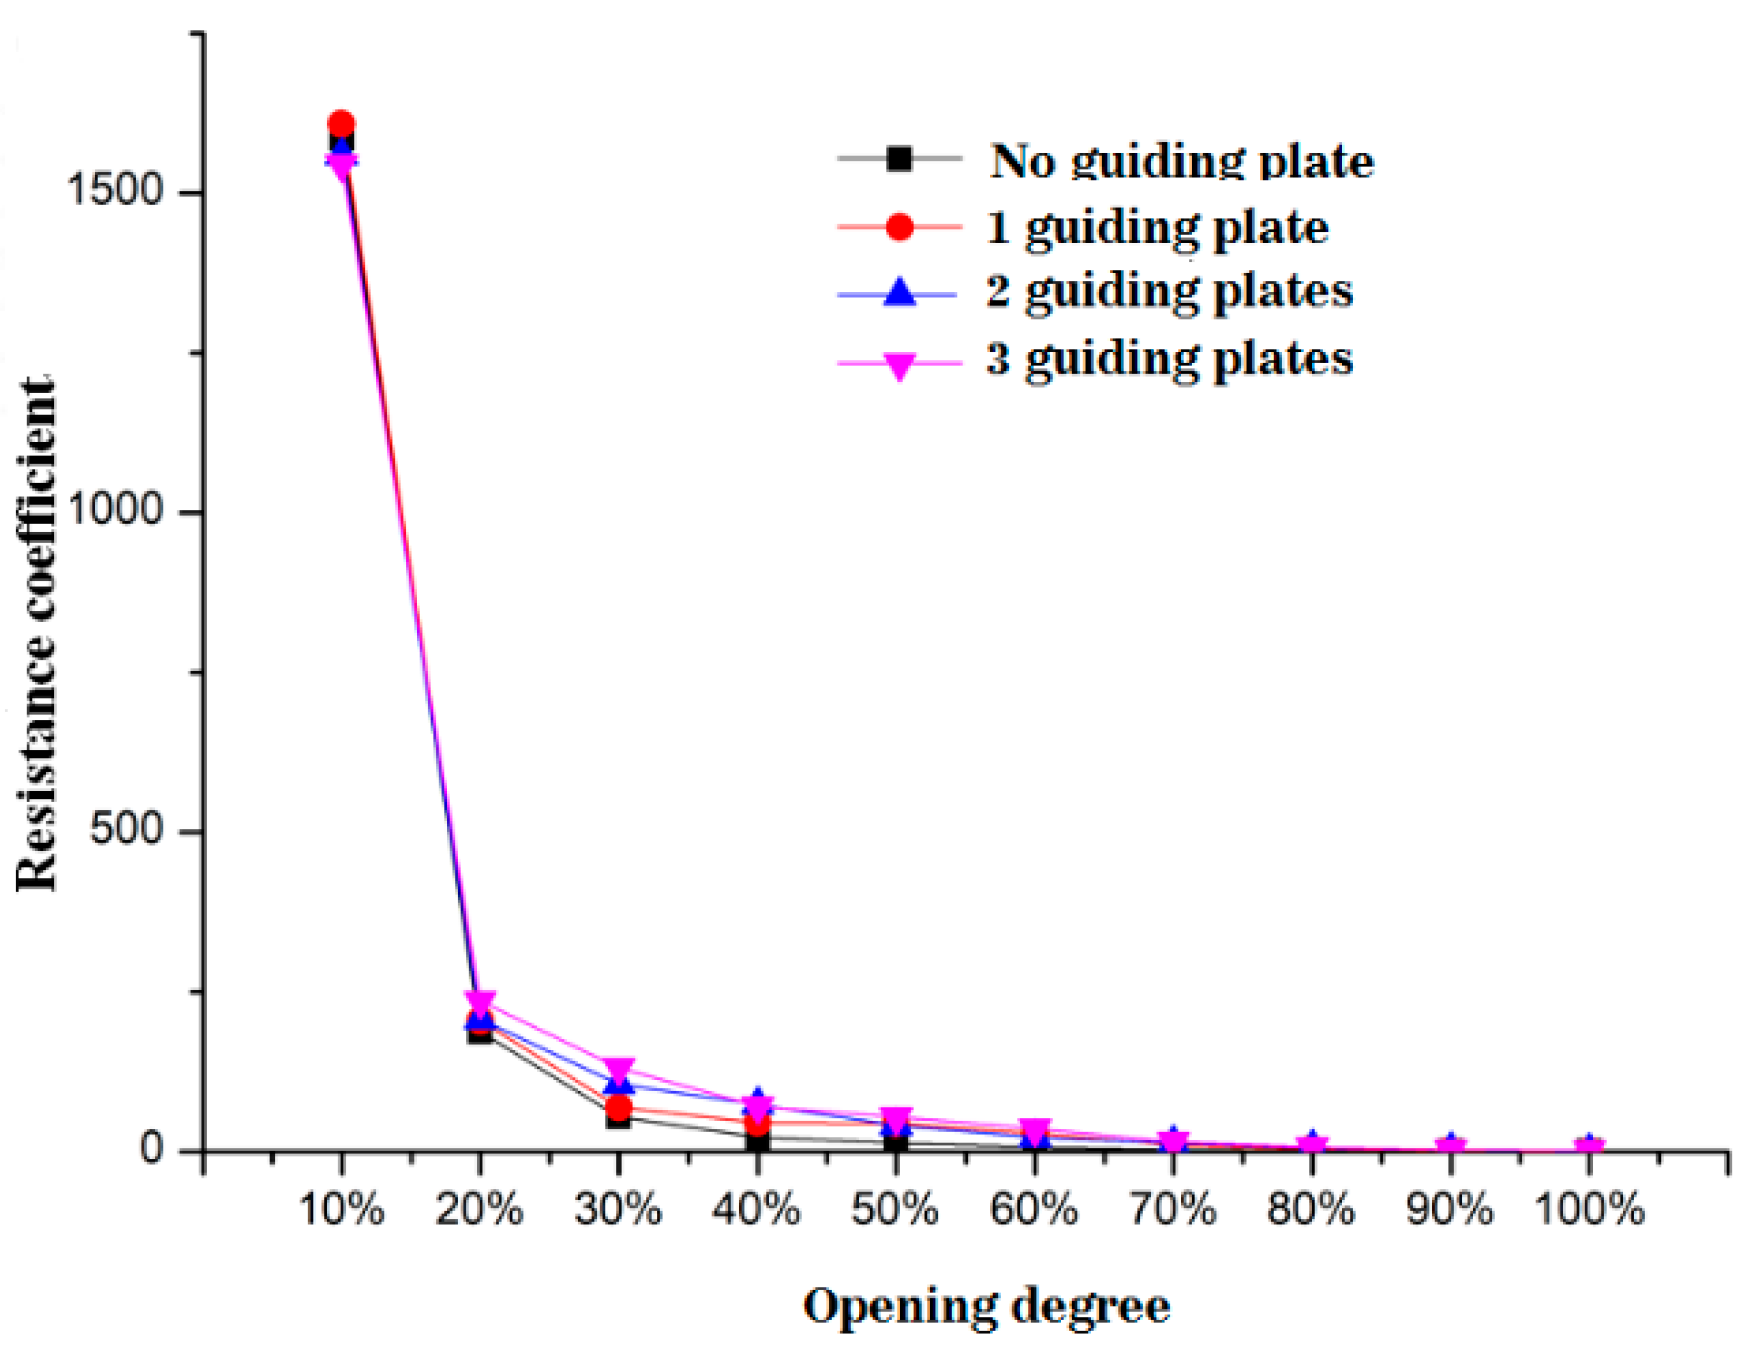
Figure 10.
Velocity contours at the valve opening degree of 20%. (a) No guiding plate, (b) 1 guiding plate, (c) 2 guiding plates, (d) 3 guiding plates.
Figure 10.
Velocity contours at the valve opening degree of 20%. (a) No guiding plate, (b) 1 guiding plate, (c) 2 guiding plates, (d) 3 guiding plates.

Figure 11.
Velocity contours at the valve opening degree of 50%. (a) No guiding plate, (b) 1 guiding plate, (c) 2 guiding plates, (d) 3 guiding plates.
Figure 11.
Velocity contours at the valve opening degree of 50%. (a) No guiding plate, (b) 1 guiding plate, (c) 2 guiding plates, (d) 3 guiding plates.
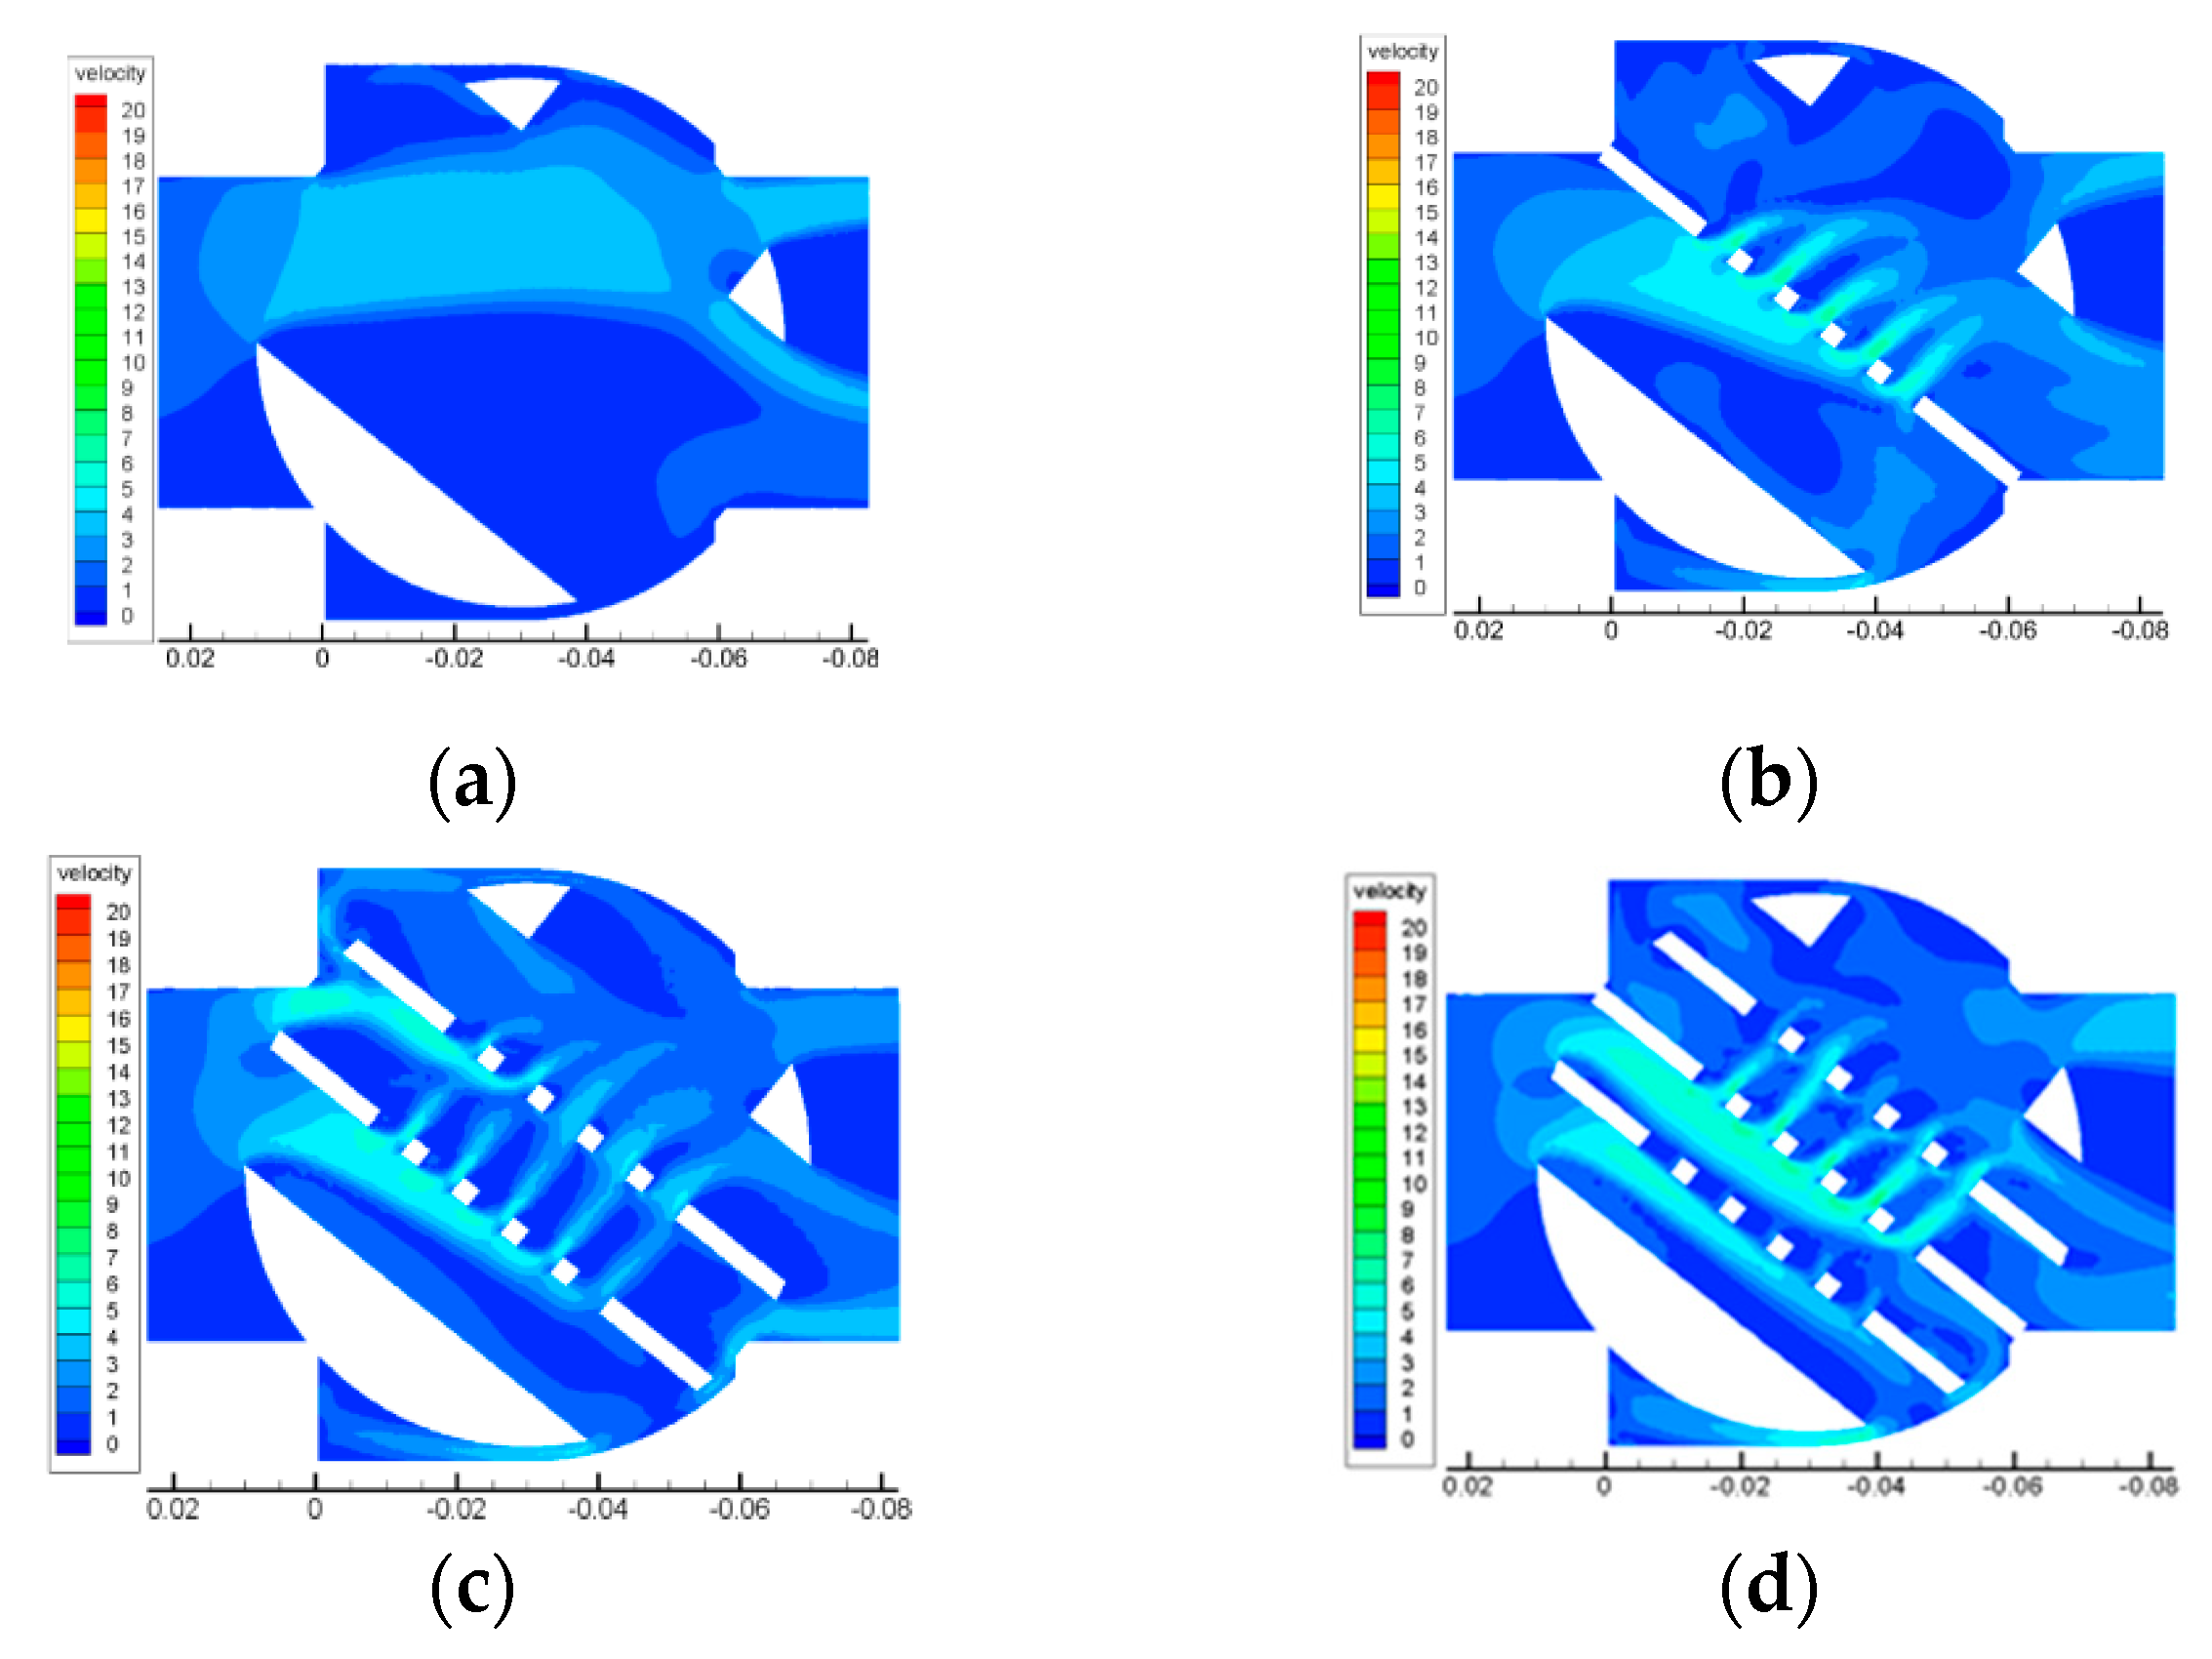
Figure 12.
Velocity contours at the valve opening degree of 80%. (a) No guiding plate, (b) 1 guiding plate, (c) 2 guiding plates, (d) 3 guiding plates.
Figure 12.
Velocity contours at the valve opening degree of 80%. (a) No guiding plate, (b) 1 guiding plate, (c) 2 guiding plates, (d) 3 guiding plates.
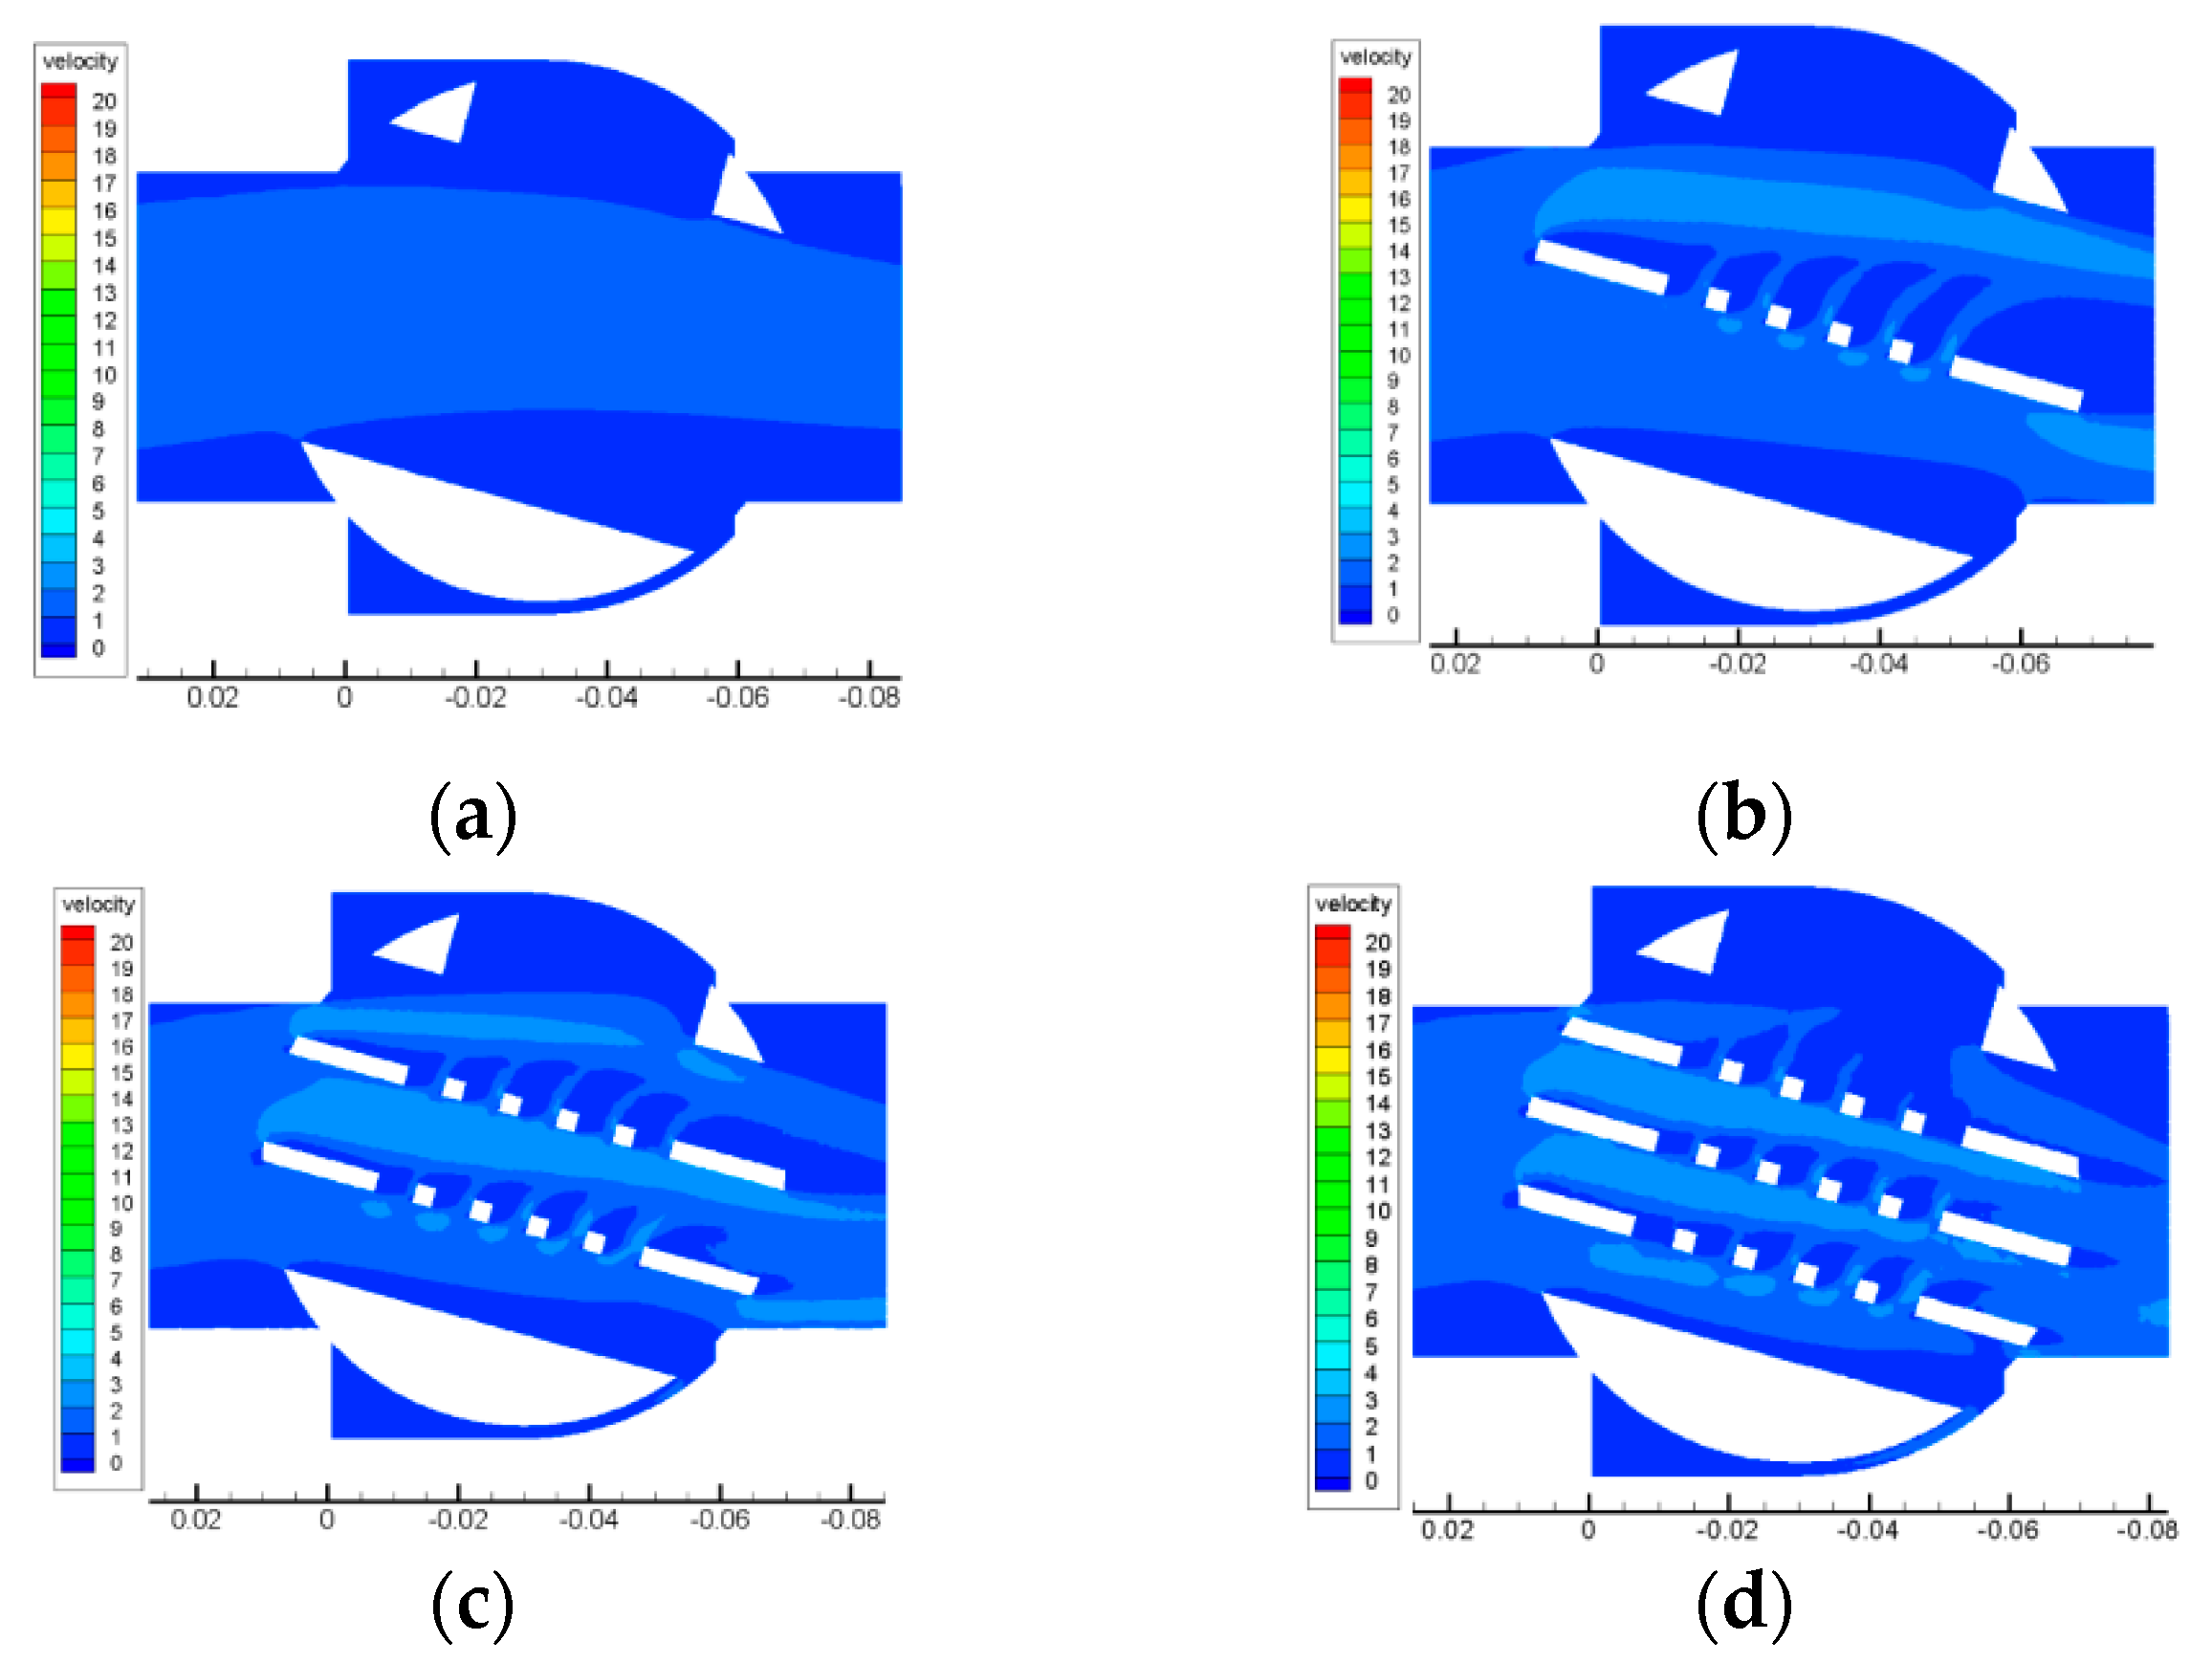
Figure 13.
Velocity contours at different valve opening degrees. (a) 10%, (b) 30%, (c) 50%, (d) 70%, (e) 90%.
Figure 13.
Velocity contours at different valve opening degrees. (a) 10%, (b) 30%, (c) 50%, (d) 70%, (e) 90%.

Figure 14.
Pressure contours at different valve opening degrees. (a) 10%, (b) 30%, (c) 50%, (d) 70%, (e) 90%.
Figure 14.
Pressure contours at different valve opening degrees. (a) 10%, (b) 30%, (c) 50%, (d) 70%, (e) 90%.
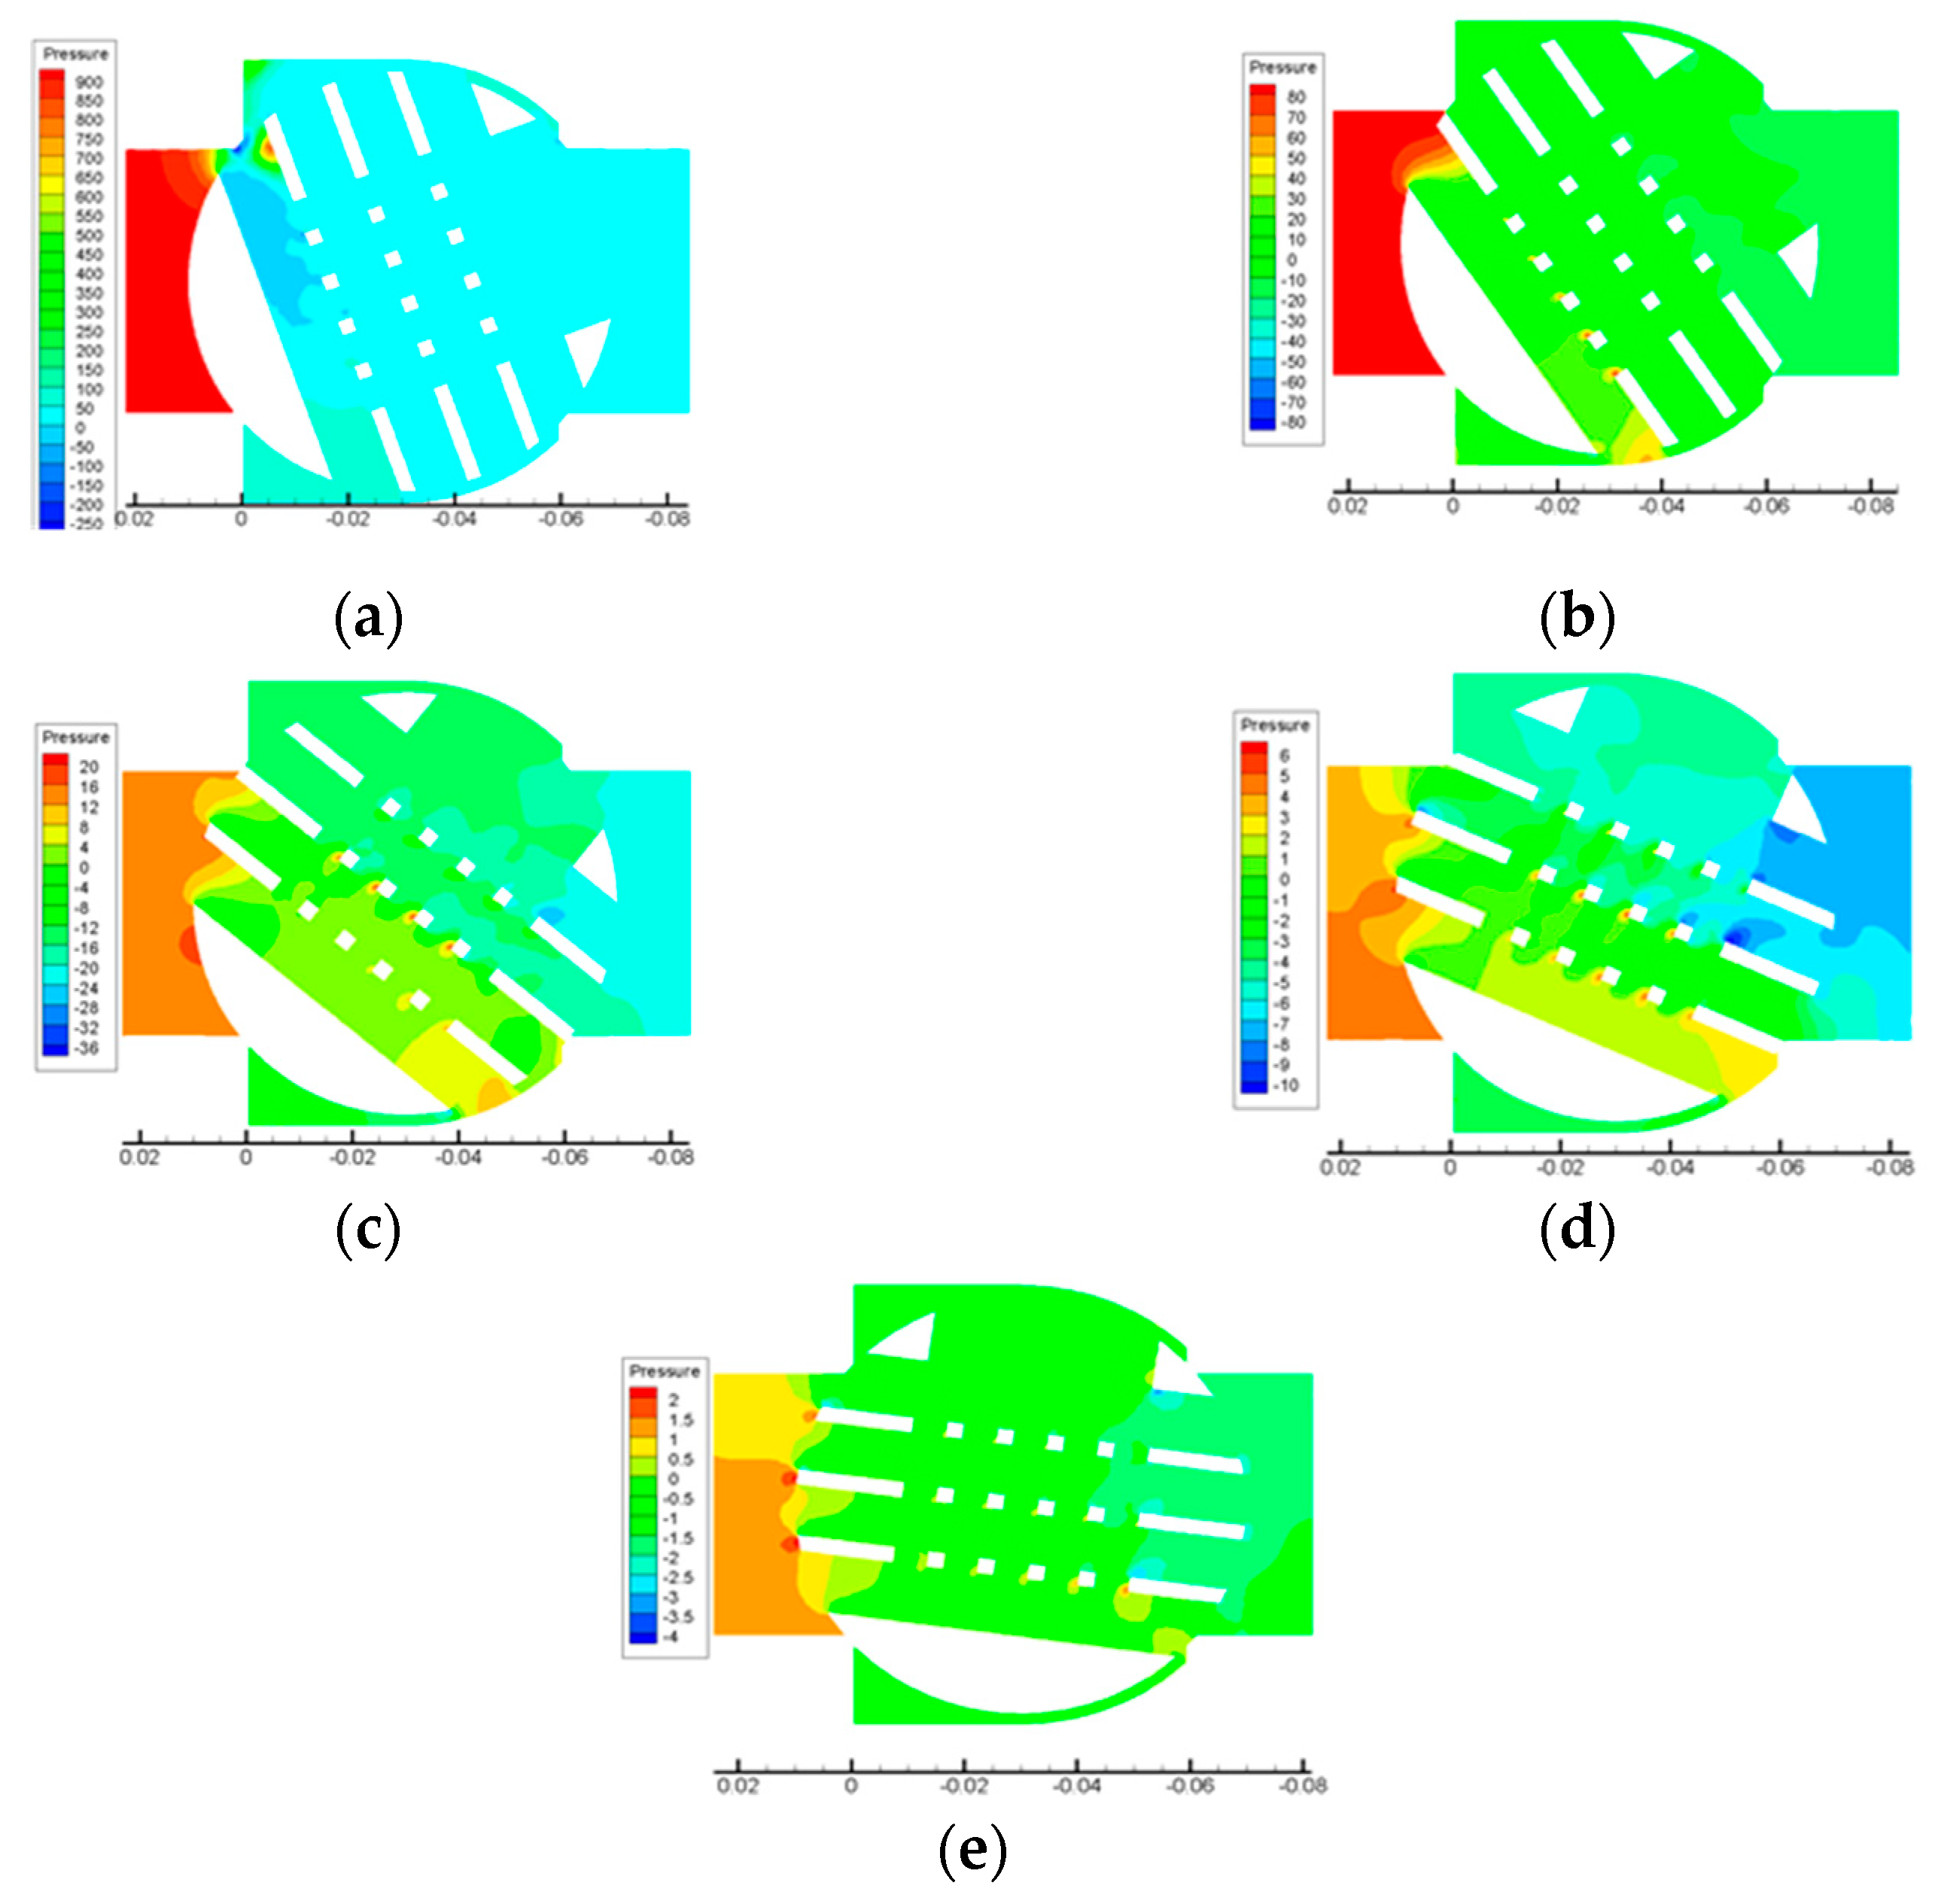
Figure 15.
Velocity contours and streamlines at different valve opening degrees. (a) Valve opening degree of 10%, (b) Valve opening degree of 30%, (c) Valve opening degree of 50%, (d) Valve opening degree of 70%, (e) Valve opening degree of 90%.
Figure 15.
Velocity contours and streamlines at different valve opening degrees. (a) Valve opening degree of 10%, (b) Valve opening degree of 30%, (c) Valve opening degree of 50%, (d) Valve opening degree of 70%, (e) Valve opening degree of 90%.

© 2020 by the authors. Licensee MDPI, Basel, Switzerland. This article is an open access article distributed under the terms and conditions of the Creative Commons Attribution (CC BY) license (http://creativecommons.org/licenses/by/4.0/).
Share and Cite
MDPI and ACS Style
Wang, Y.; Zhu, C.; Zhang, G.; Wang, D.; Jiang, M.; Zhu, Z.; Lin, Z. Numerical Analysis to the Effect of Guiding Plate on Flow Characteristics in a Ball Valve. Processes 2020, 8, 69. https://doi.org/10.3390/pr8010069
AMA Style
Wang Y, Zhu C, Zhang G, Wang D, Jiang M, Zhu Z, Lin Z. Numerical Analysis to the Effect of Guiding Plate on Flow Characteristics in a Ball Valve. Processes. 2020; 8(1):69. https://doi.org/10.3390/pr8010069
Chicago/Turabian StyleWang, Yanping, Chaoning Zhu, Guang Zhang, Dejing Wang, Minghe Jiang, Zuchao Zhu, and Zhe Lin. 2020. "Numerical Analysis to the Effect of Guiding Plate on Flow Characteristics in a Ball Valve" Processes 8, no. 1: 69. https://doi.org/10.3390/pr8010069
Note that from the first issue of 2016, this journal uses article numbers instead of page numbers. See further details here.