Article

A Wind Farm Active Power Dispatch Strategy Considering the Wind Turbine Power-Tracking Characteristic via Model Predictive Control

1
Xinjiang Xinneng Group CO., LTD Urumqi Electric Power Construction and Commissioning Institute, Urumqi 830011, China
2
State Grid Xinjiang Company Limited Electric Power Research Institute, Urumqi 830011, China
3
School of Control and Computer Engineering, North China Electric Power University, Beijing 102206, China
*
Author to whom correspondence should be addressed.
Processes 2019, 7(8), 530; https://doi.org/10.3390/pr7080530
Submission received: 26 June 2019 / Revised: 2 August 2019 / Accepted: 7 August 2019 / Published: 12 August 2019
(This article belongs to the Special Issue Energy, Economic and Environment for Industrial Production Processes)

Abstract

:
In this paper, an industrial application-oriented wind farm automatic generation control strategy is proposed to stabilize the wind farm power output under power limitation conditions. A wind farm with 20 units that are connected beneath four transmission lines is the selected control object. First, the power-tracking dynamic characteristic of wind turbines is modeled as a first-order inertial model. Based on the wind farm topology, the wind turbines are grouped into four clusters to fully use the clusters’ smoothing effect. A method for frequency-domain aggregation and approximation is used to obtain the clusters’ power-tracking equivalent model. From the reported analysis, a model predictive control strategy is proposed in this paper to optimize the rapidity and stability of the power-tracking performance. In this method, the power set-point for the wind farm is dispatched to the clusters. Then, the active power control is distributed from the cluster to the wind turbines using the conventional proportional distribution strategy. Ultra-short-term wind speed prediction is also included in this paper to assess the real-time performance. The proposed strategy was tested using a simulated wind farm based on an industrial wind farm. Good power-tracking performance was achieved in several scenarios, and the results demonstrate that the performance markedly improved using the proposed strategy compared with the conventional strategy.

1. Introduction

Energy plays an important role in the development of modern industry, and several renewable energies are gradually increasing their proportion of energy production. Among the types of renewable energies, wind energy has developed rapidly as a result of its environmentally friendly features [1,2]. In the process of wind energy use, the wind turbine is the key component in wind energy absorption and transformation. Over the past few years, many achievements have been developed for wind turbine control, resulting in improved wind turbine load conditions and power output stability [3]. The wind turbine is typically controlled for different targets in different regions. In the below-rated region, the maximum power point tracking (MPPT) strategy is adopted to control the generator torque and guarantees that the wind turbine has the optimal tip speed ratio and optimal wind power use coefficient [4]. In the above-rated region, a power limitation strategy is used to limit the power at the rated condition [5,6]. When the power demand for the wind turbine is lower than the available capacity, power limitation strategies are used to limit the generator power output and thus meet the power demand [7,8].
In the industrial field, wind turbines are controlled by and organized as wind farms. The power outputs from wind turbines are connected and boosted together by the booster station at the wind farm level and transmitted to the power grid. Furthermore, the wind farm serves as a control and operation center for internal wind turbines [9]. An important function of the wind farm is the control of wind turbines’ power output in the field to meet the power grid requirements, such as frequency regulation and voltage regulation. The active power and reactive power are controlled by frequency regulation and voltage regulation. In this paper, the active power control of the wind farm is the studied object. Wind farm power control is usually divided into primary or secondary frequency regulation (FR) according to the control timescales. The primary frequency regulation (PFR) is usually completed in milliseconds, while the secondary frequency regulation (SFR) is usually implemented in minutes. The review in [10] analyzes several wind farm active power control methods used by wind farms for PFR to balance the power grid’s electric supply and demand; these methods also support the grid frequency in emergency conditions. Wind turbines on a wind farm are controlled to release the kinetic energy stored in turbine rotors and increase the wind farm power output in the short term. The reviewed methods include Droop Control and Inertial Control. Wind turbines in the industrial field usually limit the output power at a power set-point, which is always below the optimal operating condition. The reserve spare capacity from the current maximum output [11] can be used to regulate the electric power system’s peak load and frequency using the Deloading Control method [12].
SFR, which is also known as automatic generation control (AGC), is one of the most important functions in power plants, including wind power plants, namely wind farms. In the SFR condition, the wind farm calculates the available power for the whole farm and uploads it to the power grid dispatching center. The wind farm also obtains the set-point from the dispatching center and schedules the active power set-points for all internal wind turbines. All the wind turbine generator power is connected as the wind farm power output to follow the set-point. The power supply and demand is balanced while ensuring that the wind farm can track the power demand. The power set-point for the wind farm is always less than or equal to the available power. In recent years, studies have been performed on wind farm power control strategies to meet the demand for the power system. In [13,14], the authors proposed distributed model predictive control methods for wind farms using clustering-based modeling of wind turbines to develop a linearized and piece-wise affine model. Based on the model, the wind farm is set to track the active power output using the conventional strategy while reducing the wind turbine loads. In [15], the authors proposed a two-time-level wind farm active power control strategy to improve the wind power output; an alternating direction method of multipliers (ADMM)-based distributed model predictive control strategy was introduced in this paper. Wind farm active power control was first constructed for a centralized framework, and it was further improved for a decentralized framework. ADMM was used in this framework to improve the efficiency of the method. When the wind farm is connected to the power grid, the voltage is an important parameter that needs to be considered. In [16], the authors proposed a voltage-source converter (VSC)-based high-voltage direct current (VSC-HVDC) system that is connected to wind farm active control to mitigate voltage variation and improve the performance of wind farm voltage control.
With the continuous development of the wind power industry, the research on the secondary frequency regulation of wind farms has intensified. The value of using wind turbines as a local power-tracking and output unit has been gradually recognized in related research. In [17], the author studied the performance of wind turbine power-tracking. In this study, the power set-point for the wind turbine was the input, and the wind turbine active power was the output. First-order and second-order models were used to model the wind turbine power-tracking characteristic. In [18], a variable-constrained model predictive controller was proposed to dispatch the active power set-point in a wind turbine cluster of four wind turbines. The wind turbine power-tracking characteristic was used to improve the clusters’ power-tracking performance. Although the study was useful and meaningful, the author pointed out that the proposed strategy was mainly suitable for a cluster with few units and cannot be used directly for an entire wind farm. The model introduced in [17] focused on the wind turbine power-tracking performance. As a result, of wind turbulence, the generator power always fluctuates around the set-point. Although the amplitude of the fluctuation is very low relative to the set-point, this small modeling error has a pronounced impact when the entire wind farm is controlled. Until this problem is solved, the variable-constrained model predictive controller introduced in [18] cannot be used for an entire wind farm. Another issue that should be considered during application is that the reviewed strategies typically use the measured wind speed to predict the power that is available from wind turbines. This assumption is feasible in the active power control of a wind turbine cluster. However, wind turbines on a wind farm are frequently distributed in a large area, and the time delay caused by the calculation and transmission process influences the timeliness in wind turbine performance. This problem should be considered in the active power dispatch process at the wind farm level.
In this paper, which is guided and inspired by [18], a model predictive control-based wind farm active power dispatch strategy is proposed to optimize the power-tracking performance of a wind farm. The power-tracking characteristics of the wind turbines are included in the proposed strategy. First, the wind turbine power-tracking model is introduced in Section 2. A first-order process is used as the power-tracking model, and the parameters are identified by the black-box identification method. Second, Section 3 constructs a simulated wind farm that uses a real industrial wind farm as an example. Twenty wind turbines connected to four transmission lines are included in the simulated wind farm, and turbines connected to the same transmission line are grouped as a cluster. A method for frequency-domain aggregation and approximation is used to obtain the clusters’ power-tracking model. Then, an adaptive neuro-fuzzy inference system (ANFIS) is used for ultra-short-term wind prediction in Section 4. From these works, Section 5 proposes a dynamic model prediction and optimization strategy to dispatch the active power set-point on the wind farm. The proposed strategy is simulated and compared with the conventional strategy using the constructed wind farm, and simulation results are analyzed in Section 6. Section 7 concludes this paper.

2. Modeling the Wind Turbine Power-Tracking Characteristic

Usually, wind turbines are controlled by a blade pitch controller, generator torque controller, and yaw controller. In the power limitation mode, wind turbines are controlled from the wind farm dispatching center to maintain the active power set-point and ensure that the wind farm power output corresponds to the total power demand. The controllers in the wind turbines coordinate to maintain the demanded power output. Wind turbines serve as a power-tracking actuator in the power limitation scenario. First-order and second-order dynamic processes are used to model the wind turbine power-tracking characteristic. The model input is the active power set-point, and the output is the wind turbine active power. These two power-tracking models are defined as follows:
First-order model:
G ( s ) = 1 T i s + 1 .
Second-order model:
G ( s ) = a i s + b i s 2 + c i s + b i .
where i represents the ith wind turbine, and T i , a i , b i , and c i are tunable parameters used to qualify the model and should be obtained by data-based identification. As introduced in [17], both first-order and second-order processes can be used to model the power-tracking dynamic characteristic. Although the second-order process achieves better fitting accuracy than the first-order process, there are few differences. The wind turbine power-tracking model can be expressed as shown in Figure 1, in which G ( s ) is the dynamic model, as indicated in Equations (1) and (2). The programmable logic controller in the figure is the wind turbine’s main control system, which includes blade pitch, generator torque, and yaw control strategies.
In this paper, the first-order model is applied. The related wind turbine power-tracking performance test and modeling approach are derived from [17]. Furthermore, the first-order power-tracking model in Equation (1) can be rewritten as a state-space model:
x ˙ i = 1 T i x i + 1 T i u i , y i = x i ,
where the input u i is the ith wind turbine active power set-point P i s e t , and the state x i and output y i are the ith wind turbine generator’s active power output P i o u t tracking and the active power set-point, respectively.
Once the state-space model of wind turbine power-tracking is developed, the performance of wind farm power-tracking can be modeled by an extended state-space model that takes every wind turbine’s active power outputs as state variables, and the combination of all state variables forms the output. In [18], the wind farm power-tracking model-based model predictive control strategy was shown to have problems in the wind farm active power dispatch process: wind farm power output pulsing can result from system disturbances, and short-term pulsing should be avoided since it affects the power grid. Therefore, improvements need to be implemented before the tracking model and active power model predictive control strategy can be applied at the wind farm level.

3. Wind Farm Clustering and Equivalent Modeling Based on Topology

First, the studied wind farm is introduced. An industrial wind farm in central China was selected as an example in this research. The wind farm topology is shown in Figure 2. A total of 20 wind turbines are included in the wind farm and are connected by four transmission lines, which are connected by a radiating structure. Five wind turbines are connected to one transmission line, and all four lines are connected to the wind farm’s main transformer. Each wind turbine has a booster cabinet, and the power output from the generator is boosted from 690 v to 35 kv in the booster cabinet, which boosts the electricity from the wind farm’s main transformer from 35 kv to 110 kv and is connected to the external power grid. The actual wind farm has 98 wind turbines that are connected to four transmission lines. There are two types of wind turbines; they have different towers and rotors but the same capacity of 2 megawatts (MW). The studied wind farm maintains the same topology and transmission line connections as those of the real wind farm. However, because of limitations imposed by simulations, the NREL 5 MW wind turbine was used instead of the wind turbine model on the actual wind farm. The studied wind farm was simulated in the M a t l a b / S i m u l i n k simulation environment using the S i m W i n d F a r m toolbox.
In [18], a model predictive active power controller was used for active power dispatch within a four-unit cluster. Although the proposed strategy had a beneficial control effect in the tested scenario, further simulation indicated that the introduced controller could not be used for active power control for a whole wind farm. In the author’s opinion, the following causes of this issue should be considered. In [18], each wind turbine served as one minimum unit and was modeled in the predictive model. In the proposed wind turbine active power model, the active power set-point is the main input, and the generator power is the output. However, given the wind turbulence and wind turbine controller performance, the fluctuation in generator power is unavoidable for every unit. In other words, the power fluctuation caused by turbulent wind is not included in the current power-tracking model. As the number of wind turbines increases, the modeling error introduced by each wind turbine becomes more significant. Approaches to fixing this problem can be guided by referencing the research on wind turbines’ smoothing effects. In [19,20], the smoothing effects of distributed wind turbines were studied. These studies showed that with an increasing number of wind turbines in a wind turbine cluster, the randomness and volatility of a cluster’s power output in the high-frequency region are more suppressed by smoothing effects. Field data measured in Hokkaido indicated that the smoothing effect was significant for a six-unit cluster. In a region with a frequency higher than 10 3 Hz, the power spectrum of the cluster’s power output decreased more rapidly compared with the single-unit condition. In other words, the output power of multiple units is more stable with fewer fluctuations than that of a single unit, especially in the high-frequency region. Thus, the smoothing effect is conducive to overcoming the modeling error that results from power fluctuations caused by wind turbulence, as reported in [18]. At the wind farm level, the wind turbine cluster should be used as a middle layer in the active power control process.
In the strategy proposed in this paper, the wind farm is divided into groups, and a row of units on each transmission line is regarded as a cluster. The wind farm active power dispatch center first splits the power set-point and assigns it to all clusters. The cluster acts as a middle layer between the wind farm and the individual units and sends the power set-point commands to each unit in the cluster. This double-layer dispatching approach allows for the realization of the complete active power control process in a wind farm. In the upper-layer control component, every cluster can be modeled as equivalent to wind turbines. In contrast to other equivalent modeling strategies, the cluster should be modeled to have the power-tracking dynamic performance of the internal wind turbines, and the dynamic performance related to the equivalent modeling strategy should be applied. In this paper, a frequency-domain aggregation-based modeling strategy is used to obtain the clusters’ power-tracking model. The strategy is outlined below.
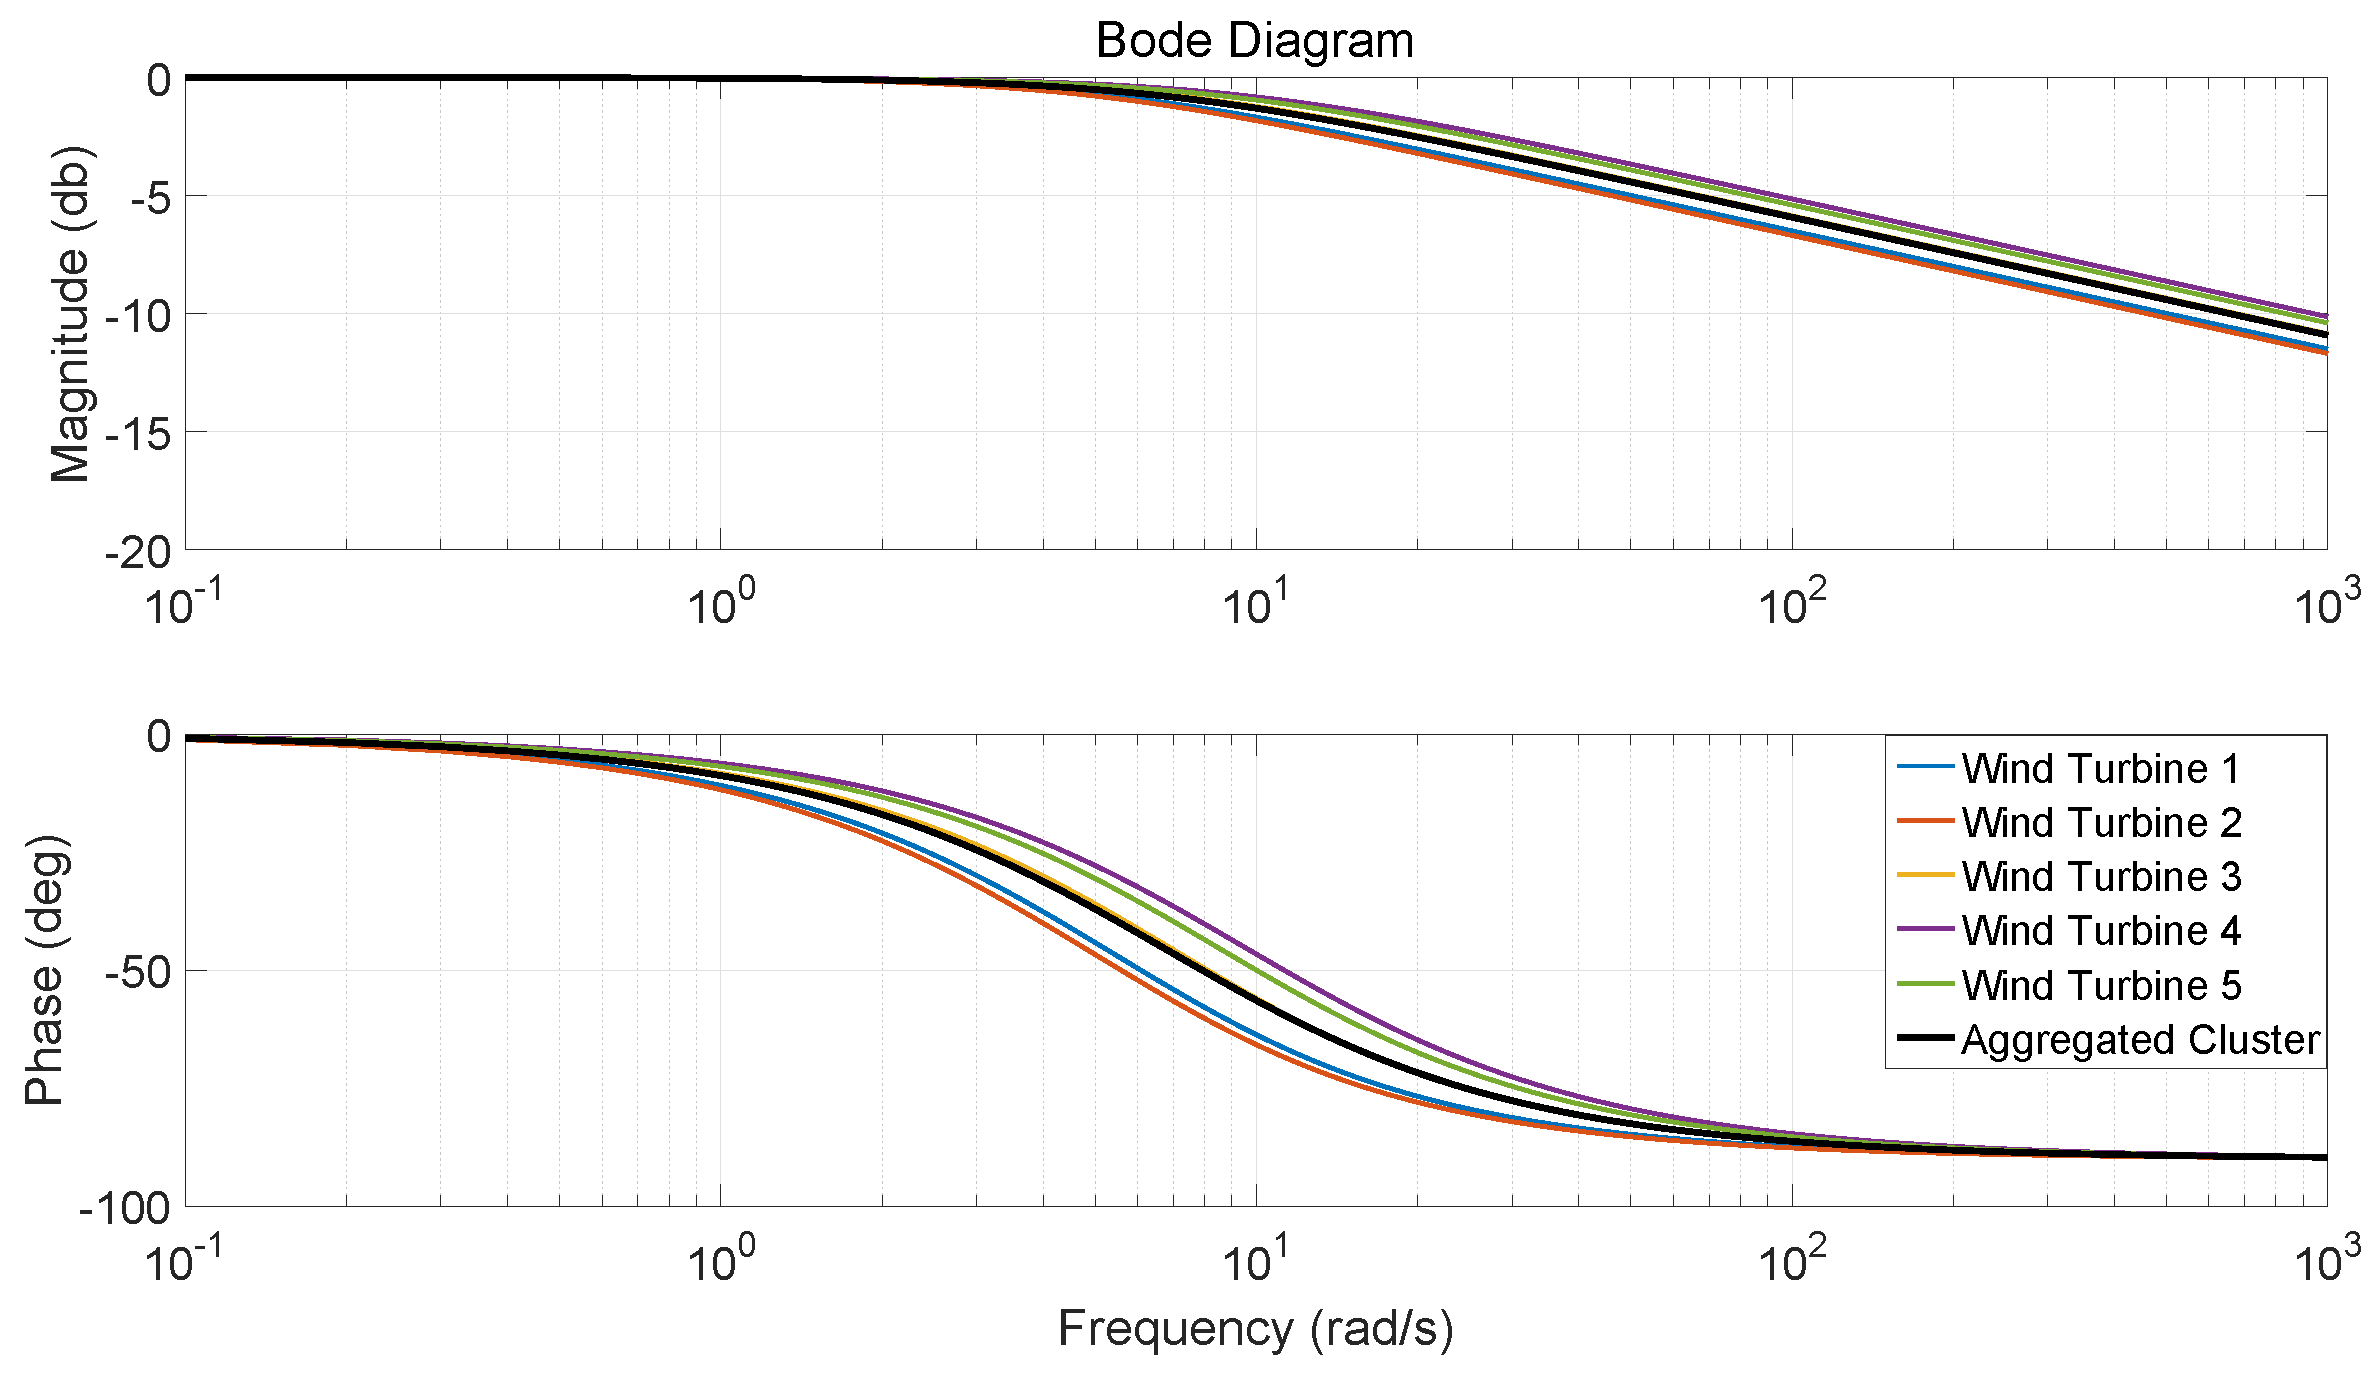
  • Step 1. The wind turbine power-tracking model is analyzed for its frequency-domain performance using the Bode diagram. The magnitude of the ith wind turbine is denoted by f r e q M i , and the phase is denoted by f r e q P i .
  • Step 2. Repeat Step 1 until all the wind turbines in the cluster are analyzed.
  • Step 3. The cluster’s frequency-domain performance is calculated as
    f r e q M f a r m = i = 1 n f r e q M i n , f r e q P f a r m = i = 1 n f r e q P i n .
  • Step 4. Plot all magnitudes and phase performances of the studied cluster in one Bode diagram.
  • Step 5. Choose the wind turbine model that is closest to the cluster’s magnitude and phase performance as the cluster’s power-tracking model.
The equivalent modeling strategy used in this study contains two main parts: frequency-domain aggregation and approximation. First, in steps 1–3, the clusters’ power-tracking performance is achieved by the aggregation of all wind turbines’ Bode diagrams. Second, the approximation in steps 4–5 selects the closest wind turbine’s power-tracking model as the cluster’s model. A detailed introduction and explanation of the applied strategy can be found in [17].
After frequency-domain aggregation and approximation, the clusters in the wind farm are modeled as equivalent to wind turbines, and the wind farm active power dispatch can be divided into two layers: the upper layer is the wind farm dispatch to the clusters, and the lower layer is the clusters’ dispatch to all the units. In the upper layer, the wind farm power-tracking dynamic performance can be expressed in a state-space form. If there are m clusters on the wind farm, then the wind farm active power output can be expressed as follows:
x ˙ = A x + B u , y = C x ,
where the input variable is defined as the active power set-point for each cluster, with u = P 1 c , s e t , P 2 c , s e t , , P m c , s e t . The state is the active power output for each cluster, with x = P 1 c , o u t , P 2 c , o u t , , P m c , o u t , and the output y is the output active power P f a r m o u t for the wind farm. The state-space model parameters are expressed as
A = 1 T 1 c 1 T 2 c 1 T m c m × m , B = 1 T 1 c 1 T 2 c 1 T m c m × m , C = 1 , 1 , , 1 1 × m .
The clusters’ power-tracking model and the wind turbines’ power-tracking model are distinguished by adding the superscript c to the parameters and variables of a cluster.

4. Ultra Short-Term Wind Speed Prediction

The wind turbines’ available power during the next control period is evaluated by using a prediction method based on wind speed information, which is more in line with the actual operation of the wind turbine. Given the control time step in this paper, ultra-short-term wind speed prediction is suitable for the demands in this paper. Many studies on this subject have applied this approach and have attained good accuracy. In [21], artificial neural networks (ANNs) were applied to predict the monthly mean wind speed. Prediction results for the Mersin meteorological station achieved great accuracy, with a 4.49% mean absolute percentage error. In [22], the mechanism and prediction accuracy of three artificial neural networks were compared. The studied methods included adaptive linear element ANN, back-propagation ANN, and a radial basis function ANN. With the continuous work in this field, deep neural networks have also been introduced for wind speed prediction; related research can be found in [23,24]. In this paper, an ANFIS is used for ultra-short-term wind speed prediction. ANFIS is a fuzzy inference system implemented in the framework of adaptive networks and was first proposed by Jang in [25]. ANFIS uses a hybrid learning procedure to construct an input–output mapping based on both human knowledge (in the form of fuzzy if-then rules) and stipulated input–output data pairs. Detailed definitions and instructions of ANFIS and its application in the field of wind energy can be found in [25,26,27].
After adequately training, the appropriate ANFIS for wind prediction can be obtained, and the accuracy can be verified by testing a wind speed file from the studied wind farm. The prediction result is shown in Figure 3, in which the blue curve is the original wind speed with 1-s time step measurements, and the orange curve is the predicted wind speed that results from predicting the wind speed after a sliding window filter. Clearly, ANFIS achieves satisfactory prediction accuracy for ultra-short-term wind speed prediction.
Once the wind speed of each wind turbine is attained, wind turbines with controllers can be assumed to be able to track appropriate operating points defined by the wind speed, and the available power calculation for each unit can be simplified as a static nonlinear function and realized as a lookup table. Detailed parameters and the lookup table function can be obtained from [18,28].

5. Wind Farm Active Power Dispatch Strategy

In this section, the wind farm active power dispatch strategy is proposed. First, the conventional wind farm active power control strategy is introduced. In the proposed strategy, the wind farm active power dispatch is divided into two layers. A dynamic model prediction and optimization-based strategy is used to dispatch the power set-point from the wind farm to the clusters. Next, the structure, power-tracking predictive model, cost function, and constraints of the proposed strategy are described.

5.1. Conventional Strategy

The conventional wind farm active power control strategy, which is also referred to as proportional distribution (PD), can be expressed as
P i P D = P f a r m s e t P f a r m a v i P i a v i ,
P f a r m a v i = i = 1 n P i a v i ,
where P f a r m s e t is the wind farm power set-point (demand), P i a v i is the predictive available power for the ith wind turbine, P f a r m a v i is the available power for the wind farm calculated by following (8), P i P D is the power set-point for the ith wind turbine, and n is the number of analyzed wind turbine on the wind farm.

5.2. Wind Farm Active Power Dispatch Structure

As introduced in the above sections, the wind farm is clustered according to the wind farm topology and transmission line connections, and each cluster is modeled as equivalent to a wind turbine. Thus, the wind farm power control can be divided into layers. In the upper layer, the wind farm distributes the active power set-point to each cluster, and the clusters dispatch the power set-point to each wind turbine in the lower layer to complete the whole active power dispatch process. The proposed model predictive strategy is used to dispatch the power set-point from the wind farm to all the clusters. Within one cluster, the active power dispatch from the cluster to the wind turbines follows the conventional strategy. The wind farm control structure in this paper is shown in Figure 4.

5.3. Wind Farm Power-Tracking Predictive Model

The wind farm active power-tracking state-space model in (5) can be further discretized through the zero-order holder method into the following discrete state-space model:
x ( k + 1 ) = A d x ( k ) + B d u ( k ) , y = C d x ( k ) ,
where the matrix parameters ( A d , B d , C d ) are the discretized version from the ( A , B , C ) system. The state and input variables of the discretized system are the same as those in the continuous system in (5). The initial time is k, and the prediction horizon is N; then, the predictive model can be reorganized as follows:
X ( k ) = F x x ( k ) + G x U ( k ) ,
where
X ( k ) = x ( k + 1 ) x ( k + N ) , U ( k ) = u ( k ) u ( k + N 1 ) ,
F x = A d A d N , G x = B d 0 0 A d N 1 B d B d .

5.4. Cost Function

The cost function is defined as follows:
J = t = k + 1 k + N P f a r m s e t j = 1 m x ( t ) ,
where P f a r m s e t is the active power set-point for the wind farm, P j t , o u t is the output active power of the jth cluster at the predictive time step t, m is the total number of clusters (which is four in this study) on the wind farm, and N is the prediction time horizon. Because the timescale of the predictive horizon is much smaller than the time in which the cluster power set-point changes, the power demand or the set-point can be regarded as unchanged during one prediction horizon, so P f a r m s e t remains constant during one prediction period. The state variables at the same time step are combined as the wind farm power output. In other words, the power-tracking predictive model predicts the wind farm power output response in the next N time steps, and then the wind farm power-tracking error for the whole prediction horizon are summarized as the cost function. Thus, the wind farm power output can be optimized to follow the power set-point.

5.5. Constraints

The following constraints are used in the proposed strategy:
( 1 a ) × P j c , P D P j c , s e t min ( 1 + a ) × P j c , P D , P j c , a v i ,
( 1 b ) × P f a r m s e t j = 1 m P j c , s e t ( 1 + b ) × P f a r m s e t .
The clusters of the wind turbines are distinguished by adding the superscript c corresponding parameters and variables of a cluster, and the subscript for clusters are marked as j, with all m clusters existing on one wind farm. Obviously, for the wind farm described in Section 3, m is 4. In the constraints, P j c , P D is the jth cluster’s power set-point in a conventional PD strategy, and a and b are adjustable relaxation parameters. For comparison, the conventional constraints are given below.
0 P j c , s e t P j c , a v i .
j = 1 m P j c , s e t = P f a r m s e t .
For each cluster, (14) limits the power set-point within a feasible interval in which each cluster has the ability to track its power setting, and (15) guarantees that the summarized power set-point for each cluster is equal to the power set-point for the wind farm. Although time-varying constraints are introduced in [18], the variable framework is not suitable for the requirements and premise of industrial application in this paper. The time-varying constraints in [18] are simplified to form constraints (12) and (13) in this paper. Power set-points for clusters in the conventional PD strategy (introduced in (7)) are first calculated as references. Based on these references, (12) is used instead of the available power constraint in (14). With the improved constraint, small, constrained regions are used to limit the set-point range of each cluster. The constrained region is set to a percent higher and lower than P j c , P D . This limits the power set-point to remain close to P j c , P D for the small inertial cluster and thus balance the output power between clusters. However, (12) raises another issue, i.e., once the available power for a faster cluster is decreasing, the slower clusters have to fill this gap to ensure that the power output follows the demand. Given the difference in power-tracking dynamic ability, it is impossible for a slower cluster to fill the gap as at the same rate at which the power of a faster cluster is decreasing. Therefore, in (13), the summation of all clusters’ power set-points is not constrained to be strictly equal to the wind farm power set-point. The hope is that when the faster clusters reduce their power load, a power set-point with a larger amplitude can be given to the slower clusters, and the stable power output for the wind farm can be maintained. The introduced constraints provide a tunable flexible region for power set-points and balance the power set-point differences caused by the varying power-tracking performance.
For setting the parameters, a and b in (12) and (13) can be easily adjusted for different intentions. In simulations, the power set-point for the wind farm is usually 50% lower than its available power, so a is set to 30%. Strictly speaking, (13) may not be prescribed in simulations. It is used to break the equality constraints as usual while still providing the necessary protection in consideration of controller robustness. In the following simulations, a is set to 30%, and b is 2%.

5.6. Industrial Application-Related Information

During the application of the proposed wind farm active power control strategy, the wind farm main controller, which is likely an industrial control computer, first calculates the power set-points through the model predictive control method. After the set-points for the clusters are obtained, further calculation and application can be accomplished in both hardware and software solutions, respectively. In the hardware solution, an external programmable logic controller (PLC) can be constructed in the controlled cluster, and the external PLC acquires the cluster’s set-point from the main controller. Then, the PLC calculates and dispatches the set-points for the units in this cluster. Under special conditions, such as the construction of a physical communication connection between wind turbines, the main controller of the first wind turbine in the cluster can be used instead of the external PLC. Power set-points within one cluster are calculated by the first wind turbine and then forwarded to all clustered units. In the software solution, the cluster-level calculations are also accomplished by the wind farm main controller, and the cluster control level only exists in the calculations without any physical objects. The advantage of the software solution is that the communication topology of the existing wind farms does not need to be changed because of the differences in the calculations, and different clustering methods can be adopted using the software solution without the adjustment in the hardware solution. Nevertheless, the advantages of the hardware solution are worth mentioning. To achieve high-efficiency signal transmission, the signal transmission from the wind farm to the wind turbine is usually through optical fiber cables, which have high requirements for early input. Typically, wind turbines connected to one transmission line are close to each other, and a cluster-level controller would facilitate cost savings for transmission networks. In this way, the optical fiber cable can be used only for transmission from the wind farm to the cluster controllers, and signal communication in one cluster can be applied in different forms, such as shielded twisted pair cables or wireless transmission. Meanwhile, the cluster-level controller can share the computational load with the wind farm main controller, and it is also helpful for the development of flexible control strategies at the cluster level, such as active–reactive power coordination control and distributed cooperative control among clusters. Both the hardware and software solutions can be used in the application of the proposed strategy.

6. Simulation Tests

In the experiments described in this section, the proposed wind farm power controller was tested under different scenarios to verify the effectiveness. The simulations were implemented in Matlab. The simulated wind turbines are NREL 5 MW onshore turbines provided in the S i m W i n d F a r m toolbox. In the simulated scenario, 20 wind turbines are connected to form the wind farm, and they are connected as illustrated by the wind farm topology in Figure 2. During the simulations, the industrial measured actual wind speed was selected as the wind input of the simulated wind turbines. Wind configurations for all 20 simulated units are from the 20 different wind turbines on the actual wind farm, and the distance between units is quite large (more than 10 diameters). The wake effect is not considered in this study. The difference in wind turbine power-tracking characteristics in simulations is reflected by the different settings of the controller parameters for all 20 wind turbines. The authors emphasize that the wind turbine power-tracking characteristics on the industrial wind farm differ from each other, but the simulated difference is set to clear the wind turbines’ and clusters’ performance differences in the proposed strategy.
After the differential adjustment between wind turbines, step changing of the power set-point and black-box identification are used to identify the power-tracking models for all wind turbines. Detailed tests and identifications are described in [17]. The frequency-domain aggregation and approximation method introduced in Section 3 is used to obtain the clusters’ power-tracking model. For example, cluster 1 includes wind turbines 1–5, and the Bode diagram of the aggregation result is shown in Figure 5.
In Figure 5, the Bode diagrams for all five wind turbines are shown in different colors, and the black curves represent the aggregated clusters’ Bode diagram in terms of magnitude and phase. Clearly, the power-tracking performance of cluster 1 is closest to that of wind turbine 3; thus, the power tracking model of wind turbine 3 is selected as the model of cluster 1. The clusters’ power-tracking inertial time constants after equivalent modeling are shown in Table 1. Furthermore, the ultra-short-term effective wind speed is predicted for each wind turbine, so the available power for each unit can be obtained.

6.1. Step Set-Point Test

First, the simulated wind farm is tested under a step-changing power set-point. To ensure that the set-point can be effectively achieved, the wind farm available power is first calculated. The power set-point for the wind farm is below the available power.
In Figure 6, the wind farm available power calculated by the measured wind speed is drawn in blue, the power set-point is drawn in black, and the predicted wind farm available power is in orange. Clearly, the predicted wind farm tracking of available power matches the actual available power precisely. Meanwhile, only the mean wind speed is predicted, and this is also reflected in the available power prediction by the smoother predicted available power. The set-point is below the available power and changes step by step. It is noted that the predicted available power starts at a low value and tracks the real available power in a few seconds. This is the result of the ANFIS prediction process taking the measured wind speed from the current time step to the three steps previous as input, and the previous values at the start time are initialized from zero. In our tests, the predicted output starts tracking the actual value from the fourth second. With this power set-point, the simulated wind farm was tested using the proposed active power dispatch strategy and the conventional strategy. The simulation results are shown in Figure 7, Figure 8 and Figure 9.
In Figure 7, the wind farm active power set-point is in black, the wind farm power output from the conventional strategy is in blue, and the power output from the proposed strategy is in orange. Similarly, in the following figures, the orange curve represents the responses using the proposed strategy, and the blue curve represents the corresponding responses using the conventional strategy. Clearly, the wind farm power output using the proposed strategy is more stable and smoother than that using the conventional one, and the tracking error between the power output and set-point are much more stable using the proposed strategy. Meanwhile, the subfigures in Figure 7 show that power-tracking with the set-point step changing in the proposed strategy is quicker than that in the conventional method.
In Figure 8, the power output for all four clusters using different control strategies are drawn in one figure for comparison, and wind turbines 1, 6, 11, and 16 are selected as examples from each cluster and compared in Figure 9. It can be observed from the two figures that the power output for each cluster using the under the proposed strategy is more appropriately adjusted than that using the conventional strategy. The tracking performance differences between clusters are used to improve the wind farm power-tracking rapidity and stability. Clusters with small time constants, especially cluster 1, are fully developed and have the leading role in this test scenario. In the first 150 s simulations, the output power of clusters 1 and 3 is higher using the proposed strategy compared with that using the conventional strategy. Thus, the wind farm power-tracking rapidity is confirmed. However, the unbalanced tracking performance does not change much in each wind turbine. Figure 9 shows that the power outputs of the shown units using different control strategies are close, which is the result of applying Equation (12), and the clusters’ power set-point using the proposed strategy is restrained near that in the conventional strategy.

6.2. Time-Varying Set-Point Test

After the step set-point test, the wind farm was also simulated using a time-varying power set-point to test the rapidity of the wind farm power-tracking. Both the proposed strategy and conventional strategy were simulated in this test. The author emphasizes that the simulated time-varying set-point condition is an extreme working condition that is not likely to occur in real industrial wind farms, but the frequent variation in the set-point is useful as a rapidity and robustness test. The simulated power set-point is shown in Figure 10. In Figure 10, the predicted wind farm available power is in orange, the time-varying set-point is in black, and the actual wind farm available power is in blue. The set-point is obtained by multiplying the wind farm available power with a time-varying proportional coefficient that gradually convergence to 1 after 400 s. The wind farm power output in this scenario is shown in Figure 11.
In Figure 11, the wind farm power output tracking of the set-point is fast and precise using the proposed strategy in the initial test region; the result using the proposed strategy is in orange. The power set-point is tracked accurately compared with the set-point curve in black, which is hard to identify in Figure 11. On the other hand, the power output shows a clear tracking delay using the conventional strategy. The reason is that wind turbines/clusters with different tracking characteristics play equal roles in the conventional strategy, and the slower turbines/clusters show a clear tracking delay compared with the faster turbines/clusters. The clusters’ power output and example wind turbine power output are shown in Figure 12 and Figure 13.
Clearly, clusters 1 and 3 track the high-frequency power set-point using the proposed strategy, and slower clusters, such as cluster 4, act as a mainstay in the wind farm. The set-point in low frequency is tracked smoothly by the slower clusters. Another point of interest is that, in Figure 11, when the simulations reach 400 s and the set-point as a whole is tracked, the power output tracking using the proposed strategy still has the advantage of tracking rapidity, but not all set-points can be achieved. This is because the ultra-short-term wind speed prediction only predicts the effective wind speed, which, in this paper, is the wind speed signal smoothed by a 10-s sliding window filter. In other words, the tracking accuracy using the proposed model predictive strategy is guaranteed by accurate equivalence modeling and precise constraint setting. However, the proposed strategy mainly focuses on a wind farm with power limitation, and the wind farm power set-point after 400 s is in free generation mode. Under such circumstances, the power set-point is not followed, and each wind turbine generates electricity freely. As a result, a flag position should be set to trigger the proposed strategy once the wind farm is controlled under power limitation conditions.

7. Conclusions

This paper proposes a wind farm active power dispatch strategy which takes the wind turbines’ power-tracking characteristics into consideration. The wind farm is clustered into several clusters based on the wind farm topology, and a first-order inertial model is used to model the wind turbine power-tracking performance. A frequency-domain aggregation and approximation-based method is used to assess the clusters’ power-tracking performance based on the wind turbines’ power-tracking model. An ANFIS is trained to predict the effective wind speed for each wind turbine in favor of the available power calculation. Once the clusters’ power-tracking model and predicted available power are achieved, a dynamic model prediction and optimization-based strategy is proposed to split the active power set-point of the wind farm among all clusters, and the active power distribution the among wind turbines in a cluster is implemented using the conventional strategy.
The wind farm performance using the proposed strategy was simulated in the M a t l a b / S i m u l i n k environment using the S i m W i n d F a r m toolbox. An industrial wind farm was used as a benchmark model, and the simulated wind farm was constructed according to its topology and transmission line connections. All 20 NREL 5 MW wind turbines were split into four clusters based on the topology. Each wind turbine was differentially adjusted so that different power-tracking performance could be obtained. Simulations using both step set-point and time-varying set-point conditions show the effectiveness and efficiency of the proposed strategy, and the wind farm improves in both power-tracking rapidity and stability using the proposed strategy.

Author Contributions

Methodology, W.L; Software, W.L., Q.X.; Funding Acquisition, W.L., H.H.; Project Administration, W.L.; Formal Analysis, D.K., Q.X; Investigation, D.K., Y.L.; Resources, D.K., X.W., X.Z., Y.L.; Methodology, X.W.; Data Curation, X.Z; Conceptualization, W.W., Z.C.; Original Draft Preparation, H.H, Z.C.; Writing—Review & Editing, W.W.; Supervision, W.W.

Funding

This research received no external funding.

Conflicts of Interest

The authors declare no conflict of interest.

References

  1. GWEC. Global Wind Report 2017. Available online: http://gwec.net/publications/global-wind-report-2/ (accessed on 25 April 2018).
  2. Cai, W.; Liu, C.; Lai, K.H.; Li, L.; Cunha, J.; Hu, L. Energy performance certification in mechanical manufacturing industry: A review and analysis. Energy Convers. Manag. 2019, 186, 415–432. [Google Scholar] [CrossRef]
  3. Chehouri, A.; Younes, R.; Ilinca, A.; Perron, J. Review of performance optimization techniques applied to wind turbines. Appl. Energy 2015, 142, 361–388. [Google Scholar] [CrossRef]
  4. Kumar, D.; Chatterjee, K. A review of conventional and advanced MPPT algorithms for wind energy systems. Renew. Sustain. Energy Rev. 2016, 55, 957–970. [Google Scholar] [CrossRef]
  5. Boukhezzar, B.; Lupu, L.; Siguerdidjane, H.; Hand, M. Multivariable control strategy for variable speed, variable pitch wind turbines. Renew. Energy 2007, 32, 1273–1287. [Google Scholar] [CrossRef]
  6. Yin, X.X.; Lin, Y.G.; Li, W.; Gu, Y.J.; Lei, P.F.; Liu, H.W. Adaptive back-stepping pitch angle control for wind turbine based on a new electro-hydraulic pitch system. Int. J. Control 2015, 88, 2316–2326. [Google Scholar] [CrossRef]
  7. Rodriguez-Amenedo, J.L.; Arnalte, S.; Burgos, J.C. Automatic generation control of a wind farm with variable speed wind turbines. IEEE Trans. Energy Convers. 2002, 17, 279–284. [Google Scholar] [CrossRef]
  8. Horiuchi, N.; Kawahito, T. Torque and power limitations of variable speed wind turbines using pitch control and generator power control. In Proceedings of the 2001 Power Engineering Society Summer Meeting. Conference Proceedings (Cat. No. 01CH37262), Vancouver, BC, Canada, 15–19 July 2001; Volume 1, pp. 638–643. [Google Scholar]
  9. Knudsen, T.; Bak, T.; Svenstrup, M. Survey of wind farm control—Power and fatigue optimization. Wind Energy 2015, 18, 1333–1351. [Google Scholar] [CrossRef]
  10. Sun, Y.Z.; Zhang, Z.S.; Li, G.J.; Lin, J. Review on frequency control of power systems with wind power penetration. In Proceedings of the 2010 International Conference on Power System Technology, Hangzhou, China, 24–28 October 2010; pp. 1–8. [Google Scholar]
  11. Aho, J.; Buckspan, A.; Laks, J.; Fleming, P.; Jeong, Y.; Dunne, F.; Churchfield, M.; Pao, L.; Johnson, K. A tutorial of wind turbine control for supporting grid frequency through active power control. In Proceedings of the American Control Conference (ACC), Montreal, QC, Canada, 27–29 June 2012; pp. 3120–3131. [Google Scholar]
  12. Badihi, H.; Zhang, Y.; Hong, H. Active power control design for supporting grid frequency regulation in wind farms. Annu. Rev. Control 2015, 40, 70–81. [Google Scholar] [CrossRef]
  13. Zhao, H.; Wu, Q.; Guo, Q.; Sun, H.; Xue, Y. Distributed Model Predictive Control of a Wind Farm for Optimal Active Power ControlPart I: Clustering-Based Wind Turbine Model Linearization. IEEE Trans. Sustain. Energy 2015, 6, 831–839. [Google Scholar] [CrossRef] [Green Version]
  14. Zhao, H.; Wu, Q.; Guo, Q.; Sun, H.; Xue, Y. Distributed Model Predictive Control of a Wind Farm for Optimal Active Power ControlPart II: Implementation With Clustering-Based Piece-Wise Affine Wind Turbine Model. IEEE Trans. Sustain. Energy 2015, 6, 840–849. [Google Scholar] [CrossRef] [Green Version]
  15. Spudić, V.; Conte, C.; Baotić, M.; Morari, M. Cooperative distributed model predictive control for wind farms. Optim. Control Appl. Methods 2015, 36, 333–352. [Google Scholar] [CrossRef]
  16. Guo, Y.; Gao, H.; Wu, Q.; Zhao, H.; Østergaard, J.; Shahidehpour, M. Enhanced voltage control of VSC-HVDC-connected offshore wind farms based on model predictive control. IEEE Trans. Sustain. Energy 2018, 9, 474–487. [Google Scholar] [CrossRef]
  17. Chen, Z.; Liu, J.; Lin, Z.; Duan, Z. Closed-loop active power control of wind farm based on frequency domain analysis. Electr. Power Syst. Res. 2019, 170, 13–24. [Google Scholar] [CrossRef]
  18. Chen, Z.; Liu, J.; Lin, Z.; Qu, C. Variable-Constrained Model Predictive Control of Coordinated Active Power Distribution for Wind-Turbine Cluster. Appl. Sci. 2019, 9, 112. [Google Scholar] [CrossRef]
  19. Nanahara, T.; Asari, M.; Sato, T.; Yamaguchi, K.; Shibata, M.; Maejima, T. Smoothing effects of distributed wind turbines. Part 1. Coherence and smoothing effects at a wind farm. Wind Energy 2004, 7, 61–74. [Google Scholar] [CrossRef]
  20. Nanahara, T.; Asari, M.; Maejima, T.; Sato, T.; Yamaguchi, K.; Shibata, M. Smoothing effects of distributed wind turbines. Part 2. Coherence among power output of distant wind turbines. Wind Energy 2004, 7, 75–85. [Google Scholar] [CrossRef]
  21. Bilgili, M.; Sahin, B.; Yasar, A. Application of artificial neural networks for the wind speed prediction of target station using reference stations data. Renew. Energy 2007, 32, 2350–2360. [Google Scholar] [CrossRef]
  22. Li, G.; Shi, J. On comparing three artificial neural networks for wind speed forecasting. Appl. Energy 2010, 87, 2313–2320. [Google Scholar] [CrossRef]
  23. Khodayar, M.; Kaynak, O.; Khodayar, M.E. Rough deep neural architecture for short-term wind speed forecasting. IEEE Trans. Ind. Inform. 2017, 13, 2770–2779. [Google Scholar] [CrossRef]
  24. Dalto, M.; Matuško, J.; Vašak, M. Deep neural networks for ultra-short-term wind forecasting. In Proceedings of the 2015 IEEE International Conference on Industrial Technology (ICIT), Seville, Spain, 17–19 March 2015; pp. 1657–1663. [Google Scholar]
  25. Jang, J.S. ANFIS: Adaptive-network-based fuzzy inference system. IEEE Trans. Syst. Man Cybern. 1993, 23, 665–685. [Google Scholar] [CrossRef]
  26. Petković, D.; Ćojbašić, Ž.; Nikolić, V.; Shamshirband, S.; Kiah, M.L.M.; Anuar, N.B.; Wahab, A.W.A. Adaptive neuro-fuzzy maximal power extraction of wind turbine withcontinuously variable transmission. Energy 2014, 64, 868–874. [Google Scholar] [CrossRef]
  27. Petković, D.; Ćojbašić, Ž.; Nikolić, V. Adaptive neuro-fuzzy approach for wind turbine power coefficient estimation. Renew. Sustain. Energy Rev. 2013, 28, 191–195. [Google Scholar] [CrossRef]
  28. Jonkman, J.M.; Buhl, M.L. SciTech Connect: FAST User’s Guide—Updated August 2005; FAST User’s Guide; National Renewable Energy Lab: Golden, CO, USA, 2005. [Google Scholar]
Figure 1. Wind turbine power-tracking dynamic characteristic.
Processes 07 00530 g001
Figure 2. Wind farm topology and bus connections.
Processes 07 00530 g002
Figure 3. Comparison between the actual wind speed and predicted wind speed.
Processes 07 00530 g003
Figure 4. Wind farm control structure.
Processes 07 00530 g004
Figure 5. Frequency-domain aggregation for cluster 1.
Processes 07 00530 g005
Figure 6. Set-point and available power for the tested wind farm.
Processes 07 00530 g006
Figure 7. Wind farm output power comparison.
Processes 07 00530 g007
Figure 8. Power output comparison for all four clusters.
Processes 07 00530 g008
Figure 9. Power output comparison for wind turbines 1, 6, 11, and 16.
Processes 07 00530 g009
Figure 10. Set-point and available power for the tested wind farm.
Processes 07 00530 g010
Figure 11. Frequency-domain aggregation for cluster 1.
Processes 07 00530 g011
Figure 12. Power output comparison for all four clusters.
Processes 07 00530 g012
Figure 13. Power output comparison for wind turbines 1, 6, 11, and 16.
Processes 07 00530 g013
Table 1. Clusters’ power-tracking model.
Cluster NumberClosest Wind Turbine T j
1No. 30.1339
2No. 80.2240
3No. 120.1328
4No. 160.2053

