Article

Thermo-Ultrasound-Based Sterilization Approach for the Quality Improvement of Wheat Plantlets Juice

1
School of Food Science and Engineering, South China University of Technology, Guangzhou 510640, China
2
Overseas Expertise Introduction Center for Discipline Innovation of Food Nutrition and Human Health (111 Center), Guangzhou 510640, China
3
Beijing Advanced Innovation Center for Food Nutrition and Human Health, Laboratory of Molecular Science, College of Food Science and Chemical Engineering, Beijing Technology and Business University, Beijing 100048, China
4
Department of Food Science, College of Food Science and Engineering, Jilin University, Changchun 130012, China
5
School of Public Health, Harbin Medical University, Harbin 150081, China
6
University Institute of Diet and Nutritional Sciences, The University of Lahore, Islamabad Campus, Islamabad 44000, Pakistan
7
Department of Chemistry, Government College University Faisalabad, Faisalabad 38000, Pakistan
8
Department of Food Engineering and Technology, Faculty of Engineering and Technology, University of Gezira, Wad Medani 21111, Sudan
*
Author to whom correspondence should be addressed.
Processes 2019, 7(8), 518; https://doi.org/10.3390/pr7080518
Submission received: 25 June 2019 / Revised: 20 July 2019 / Accepted: 23 July 2019 / Published: 6 August 2019
(This article belongs to the Section Advanced Digital and Other Processes)

Abstract

:
The impact of thermo–ultrasound (TU) on the quality of fresh wheat plantlets juice is described in this study. Fresh wheat plantlets juice was treated with TU using ultrasound (US) bath cleaner with different treatment variables, including power (70%, 420 W), frequency (40 kHz), processing time (20 and 40 min) and temperature (30, 45 and 60 °C) for the determination of free amino acids, minerals, microbial loads and bioactive compounds. The treatments have non-significant effects in ºBrix, pH, and titratable acidity while a significant increase in non-enzymatic browning, viscosity, and cloud value. The TU treatment at 30 °C for 20 and 40 min has achieved the highest value of total phenolics, flavonoids, total antioxidant capacity, 2, 2-diphenyl-1-picrylhydrazyl (DPPH), carotenoids, anthocyanin contents, chlorophyll (a + b), minerals and free amino acids than other treatments as well as untreated sample. A lightly visible variation in the color was observed among all treatments. TU treatments also showed a significant impact on the reduction of microbial loads at 60 °C for 40 min. The verdicts revealed that TU at low temperature a viable option to improve the quality of wheat plantlets juice at an industrial scale as compared to alone.

Graphical Abstract

1. Introduction

Wheat (Triticum aestivum L.) plays an essential role in the human diet, and different epidemiological investigations have suggested that adding whole grain products to the diet has a protective action against chronic diseases [1]. The germination of wheat for 10–16 days, sprouts grew is known as “wheat plantlets”. Variations during the sprouting process lead to the synthetization of compounds like antioxidants, vitamins, and phenolics [2]. In wheatgrass, chlorophyll is the most active component that has a useful role in the inhibition of metabolic carcinogens and also good source of vitamins (A, E and C), antioxidants, and minerals (Fe, Ca, and Mn), and benzo(a)pyrene in a bioavailable form [1]. Juices are generally recognized as a valuable source of vitamins and different kinds of other nutrients. The quality of fruit juices can be defined on the base of bioactivity towards free radicals, besides their safety [3]. Antioxidants are principal active components in plant beverages, as described by Saura–Calixto and Goñi [4], the antioxidant capacities can have an essential function from a nutritional point of view. Continuously growing consumer need for packaged beverages and foods fresh like properties has boosted food processing industries to utilize novel food processing and preserving technologies.
Thermal processing negatively affects the sensory and nutritive quality of juices which have encouraged the application of nonthermal processing techniques [5,6]. In this thought, there has been vital interest in ultrasound (US) for nonthermal pasteurization of juices [7]. The US processing technique has been described to have lower impacts on fruit juices quality. The US is a novel food processing technology that has been generally considered for improving food processes and fruit juices quality [8]. The combination of heat and the US is called thermo–ultrasound (TU), in which the food product is subjected to moderate temperature and found more effective for microbial inactivation than the US without heat. The produced sound diffuses through liquid food media, providing a complicated phenomenon known as “cavitation” [9]. Cavitation combined with heat creates an essential impact on heat-shocked cell structure that enhances the deadly range for enzyme and bacterial inactivation [10]. Simultaneously impact of sound, and heatwaves, high sensitivity and causing the damage on microbial cell wall structure [11], as a result of the called “additive effect”. Temperature performs an essential part in food preservation; however, an accretion of temperature might influence the quality of juice. Most of the author reported, the increase in temperature was associated with the processing time and ultrasonic intensity used throughout the treatment. The cavitation bubbles produced the continuous temperature rises in the medium during heat transfer, and the cavitation impact can be minimized by increasing the temperature of the medium [12]. High temperature is one of the essential variables that influence the microbial and enzymatic inactivation or bioactive compounds [13]. Due to the issues, it is necessary that this TU should be employed with temperature control to conserve the cavitation impacts. TU is an excellent alternative for thermal treatment and was declared to have insignificant impacts on the quality of different fruit juices such as orange juice [14] and blackberry juice [15]. Earlier, some authors had studied the impacts of TU on the quality enhancement in watermelon juice [16], and apple juice [17]. In our view, no report is accessible on the impact of TU technique on chlorophyll, carotenoids, antioxidant activities, total flavonoids, phenolics, flavonols, free amino acids, minerals content and physicochemical properties of the wheat plantlets juice. The present work has clearly established the usefulness of the best treatment parameters and maintaining the nutritional value and improved bioactive compounds.

2. Materials and Methods

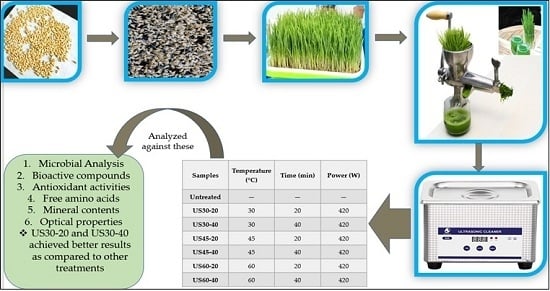
2.1. Selection of Seeds, Growing and Juice Preparation

Wheat organic seeds of variety (Inqilab-91) were procured from Cereal Crop Research Institute (CCRI) Nowshehra, Pakistan. The reason for choosing this variety due to highly nutritive value among from the other 16 verities available in Khyber Pakhtunkhwa, Pakistan. The wheatgrass was grown inside the laboratory where the sufficient light and airflow. Warm water was used to wash the wheat seeds for the removal of microbial load and undesirable adhered particles from the surface. Wheat seeds were then soaked 24 h in distilled water, then drained. After that, seeds were wrapped in a muslin cloth and left for sprouting at least for 12 h. Grains were spread on soil trays and the water was sprinkled every day. Wheat plantlets were cut using scissors after 14 days, 2 cm above the soil.
Wheat plantlets juice was extracted by a specifically designed manual juice extractor due to being fibrous in nature. They press the plantlets and employing centrifugal force; manual plantlets juicers also assure from oxidation and heat. Then wheat plantlets juice extracted by the masticating process after washed and air-dried.

2.2. Thermo–Ultrasound (TU) Treatment

The TU treatment was conducted directly after the wheat plantlets juice was extracted from wheat plantlets and the juice was vortex-mixed and equally divided into seven parts. The TU treatment was done in an ultrasonic (SKYMEN JP-031S, Skymen Cleaning Equipment Shenzhen Co. Ltd., Shenzhen, China) bath cleaner at a power 420 W radiation 70%, frequency 40 kHz, and processing time (20 and 40 min), and temperature (30, 45 and 60 °C) for 100 mL wheatgrass juice (Table 1). The temperature of the bath cleaner was retained by the water circulation (0.5 L/min). To evade any potential obstruction of light, all the TU treatments were performed in the dark. After treatments, all samples were stored in airtight and sterilized glass bottles and stored at 4 °C until further analysis.

2.3. Microbiological Analysis

Manzoor et al. [18] explained the pour plate method was adopted for the determination of mold and yeast count and total plate count. Total plate counts were performed on nutrient agar medium by pour plate method, while yeast and mold counts were done on PDA medium. The outcomes were explained as log CFU/mL.

2.4. Total Flavonoid Contents (TFC) and Total Phenolic Contents (TPC)

TFC was measured according to the proposed method of Kim et al. [19]. A sample solution 500 µL was mixed with 75 µL of 5% NaNO2 solution and 1.25 mL of dd H2O. After 6 min, 150 µL of AlCl3·H2O (10%) solution were added. After five minutes, 0.5 mL of 1 M NaOH solution was added. The absorbance against blank was estimated at 510 nm by using spectrophotometer (TU-1810 series of UV–visible, General Analysis of General Instrument Co. Ltd., Beijing, China). TPC was estimated by the method of Slinkard and Singleton [20]. A sample solution 500 µL was mixed with 0.5 mL of Folin-Ciocalteu phenol reagent and 1 mL of dd H2O. Then 2.5 mL of Na2CO3 (20%) solution were added before incubating at room temperature in the dark for 20 min. The absorbance against a blank was measured at 735 nm.

2.5. The 2,2-Diphenyl-1-Picrylhydrazyl (DPPH) Activity and Total Antioxidant Capacity (TAC)

The 2,2-diphenyl-1-picrylhydrazyl (DPPH) activity of the wheat plantlets juice was measured according to Manzoor et al. [7]. Take 250 µL concentration of each sample and mixed with 1 mM DPPH solution (50 µL) solution prepared with methanol. After that mixed solution was incubated at room temperature in dark for 30 min. The absorbance was measured against blank at 517 nm. Total antioxidant capacity (TAC) was estimated by the procedure described by Aadil et al. [21]. A known aliquot (0.4 mL) of the juice sample was taken and mixed with 4 mL of reagent solution comprising 4 mM ammonium molybdate, 28 mM sodium phosphate, and 0.6 M sulphuric acid. After that, the obtained mixture was incubated in a water bath at 95 °C for 90 min. After cooling to ambient temperature, the absorbance was estimated at 695 nm. The calibration curve was made by employing ascorbic acid. The calculation of DPPH was done by using Equation (1).
D P P H % = 1 A   s a m p l e A   b l a n k A   c o n t r o l     A   b l a n k × 100 .

2.6. Carotenoids and Chlorophyll Contents

The carotenoids and chlorophyll contents were estimated by the method used by Liao et al. [22]. The absorbance was measured at 450 nm using spectrophotometer at ambient temperature. The chlorophyll contents were estimated by the method of Zhao et al. [23]. Three-milliliter acetone (80% v/v) was mixed with untreated, and control juice (3 mL). Then the solution was filtered through a Whatman filter paper three-time. The absorbance values of filtrate at 663 nm and 645 nm were estimated at ambient temperature. The following equations were used to calculate the total chlorophyll contents;
C h l o r o p h y l l   a = ( 11.85 × A 664 ) ( 1.54 × A 647 )
C h l o r o p h y l l   b = ( 21.03 × A 664 ) ( 5.43 × A 647 )
T o t a l   c h l o r o p h y l l = ( c h l o r o p h y l l   a ) ( c h l o r o p h y l l   b ) .

2.7. Free Amino Acids

An A300 amino acid analyzer (membraPure GmbH, Berlin, Germany) was used to distinguish the free amino acids of processed wheat plantlets juice. The software iPeak and iControl (membraPure, Berlin, Germany) was used. In brief, 4 mL of each sample complemented with 3,5-dinitrosalicylic acid (1 mL) was stored for 1 h at 4 °C to insert into the protein and centrifuged twice at 9000 rpm for 15 min. Diluents comprising acetic acid, formic acid, trifluoroacetic acid lithium acetate, and ethanol to the final amino nitrogen of 0.008–0.01% were used to dilute the supernatant. Liquid chromatography with a column (TS263, membraPure) was used to separate the amino acids and detected by ninhydrin reaction, and then the absorbance was estimated at 570 nm and 440 nm for Pro. Each amino acid concentration was measured using external standards (Sigma–Aldrich, St. Louis, MO, USA). All the outcomes were expressed in mg/100 mL.

2.8. Mineral Elements

Mineral contents of wheat plantlets juice were estimated using atomic absorption spectroscopy (Hitachi Z, 2000, Polarized, Zeman, Tokyo, Japan) according to the method of Aadil et al. [24].

2.9. Electric Conductivity (EC), °Brix and pH

The electrical conductivity (EC), °Brix, and pH were estimated with a conductivity meter (DDS-11A, Nanjing T-Bota Scietech Instruments & Equipment Co., Ltd. Nanjing, China), Abbe refractometer (RX-5000, ATAGO U.S.A. Inc., Bellevue, USA) and digital pH-meter (PHS-3S, INESA Scientific Instrument Co., Ltd., Shanghai, China), respectively.

2.10. Cloud Value, Non-Enzymatic Browning (NEB), Viscosity, and Titratable Acidity (TA)

The non-enzymatic browning (NEB) was estimated according to the method of Aadil et al. [25]. A 5 mL wheat plantlets juice sample was centrifuged at 12,500 g for 10 min. The obtained supernatant was clarified through 0.45 µm filter, and NEB value was determined as the absorbance at 420 nm. The cloud value was determined according to Aadil et al. [25]. A 5 mL wheat plantlets juice was centrifuged at 3000 rpm at 20 °C for 10 min. Cloud value was expressed as the absorbance of the supernatant at 660 nm and distilled water used as a blank. Viscosity was measured by using Brookfield viscometer (Brookfield DV2T Rotational Viscometer (115 V/60 Hz), Gilson Company, INC. USA) and TA by the method of Manzoor et al. [7].

2.11. Color Properties

Color values, a* (greenness/redness), b* (blueness/yellowness) and L* (darkness/brightness) of the samples were estimated by a colorimeter (CR-400 Chroma–Meter, Osaka, Japan). All the measurements were done in triplicate. A white tile was used for the calibration of the instrument. The colors of treated and untreated samples were analyzed by using the following Equations (5)–(7).
Hue (h0) = tan−1 (b*/a*)
C* = (a*2 + b*2)1/2
Δ E = ( Δ L * ) 2 +   ( Δ a * ) 2   +   ( Δ b * ) 2 .

2.12. Statistical Analysis

All trials were conducted in triplicate. The experimental data were statistically analyzed by SPSS version 24 (IBM SPSS Statistics, Armonk, NY, USA). In this study, p < 0.05 value was considered statistically significant.

3. Results and Discussion

3.1. Impact of TU on Microbial Loads

The outcomes regarding Y&M and total plate counts in wheat plantlets juice treated with TU are shown in Table 2. It was observed that the Y&M and total plate counts were highly temperature-sensitive and complete inactivation was observed in US60-40 treated sample, which showed the higher decline effectiveness of microbial cells in juice treated for a prolonged time. Earlier, Kiang et al. [11] have been described as the peak inactivation of microbial cells in TU treated mango juice. In our study, at both exposure temperatures 35 and 45 °C, a significant (p < 0.05) reduction in Y&M and total plate counts were observed. The microbial cells reduction in the TU treated the sample with temperatures shown that association might exist between heat and sonication [26]. It has been documented in some studies that TU induce the highest inactivation of pathogens in grapefruit, pineapple, and cranberry juices [27]. The US has been confirmed due to cavitation, and some other changes in the cell structure membrane surface increase microbial sensitivity to low pH, high osmotic pressure, and heat [26]. The complete inactivation of bacterial populations might be due to chemical or physical phenomena on TU. Complete microbial inactivation (Y&M and total plate count) was reported by Abid et al. [17] with the combination of the US and mild heat. So, the outcomes showed that the higher inactivation of microbes in wheatgrass juice could be obtained by pairing the US with heat while lowering other opposing variations in the food product.

3.2. Impacts of TU on TPC and TFC

The untreated wheat plantlets juice had a TPC of 311.48 µg GAE/g and TFC 189.55 µg CE/g are presented in Table 3. TPC significantly increased in US30-20, US30-40, and US45-20 treatments, while reduced in the TU treated sample at 60 °C as compared with the untreated sample. The potential reason for the significant increments in bioactive compounds might be associated with the improved disruption of the plant cell wall. This might have happened due to cavitations as a result of rapid variation in pressures of the liquid during sonication exerted by shear forces. Finally, improved the extraction and availability of some chemically bound polyphenolic During the US, the polyphenolic oxidase activity might be improved, maybe another cause for this rise in phytonutrients. Similarly, the increase of TPC in the US treated red wine has been described [28]. But it was observed that the increase in treatment time and temperature increase the degradation of TPC, TFC and total flavonols, showing that the temperature has an essential impact on these compounds. Moreover, it was also noted that the impact was more obvious in the case of the US45-30 and US45-45 treatments. The reduction in TFC might be associated with the higher treatment temperature applied during processing as it causes the decomposition of functional compounds [29,30]. Our outcomes concerning a decrease in bioactive compounds are in line with the search of Rawson et al. [16], who described that these compounds reduced with increase in treatment temperature from 25 to 45 °C in watermelon juice treated TU. Gardner et al. [31], have also described the decline in the US treated apple juice at 80 °C for 15 min. In the plant, the secondary metabolites which play an important part in the improvement of color and flavor characteristic of fruit juices. In this study, at the treatment temperature of 45 and 60 °C, the highest reduction of all these compounds was examined in the US treated for 20 and 40 min.

3.3. Impacts of TU on Carotenoid and Chlorophyll Contents

Total carotenoid contents of TU treated samples as compared with untreated juice indicated significant (p < 0.05) variations (Table 3). The carotenoid contents increased in wheat plantlets juice might be useful to the consumers as it could act as a precursor to vitamin A, which has various health-promoting attributes. The records from other studies also recommended that the US could increase the level of carotenoids and it has been seen in apple juice [17] and mango juice [32]. The carotenoid levels might be increased due to the inactivation of lipoxygenase and breakage of cell walls by cavitation during US [32]. Abid et al. [17] reported that the inactivation of peroxidase (POD), polyphenol oxidase (PPO), and pectin methylesterase (PME) enzymes during the thermo-sonication at 20, 40 and 60 °C of apple juice. The carotenoid contents determined to be decreased as the US temperature raised to 60 °C. Carotenoid contents were also increased as the sonication time increased. As shown in Table 4, the concentration of total chlorophyll contents was significantly (p < 0.05) improved in all treatment expect US60-20 and US60-40. A significant increase was recorded in the total chlorophyll contents of wheat plantlets juice during TU at 30 and 45 °C, while the reduction was observed when the US temperature raised to 60 °C. The US significantly increased the extraction of chlorophyll contents. The similar impact was recorded with spinach juice subjected to high hydrostatic pressure (HHP) and was thought to be due to the lack of disruption of the chlorophyll-protein complexes photosystem II [33]. The US could accelerate hydration and swelling and induced enlargement in the plant cell wall pores; it occurred in a better extraction during treatment [34]. The reduction in chlorophyll contents was observed in TU treated Artemisia argyi leaf at 70 °C for 90 sec [35].

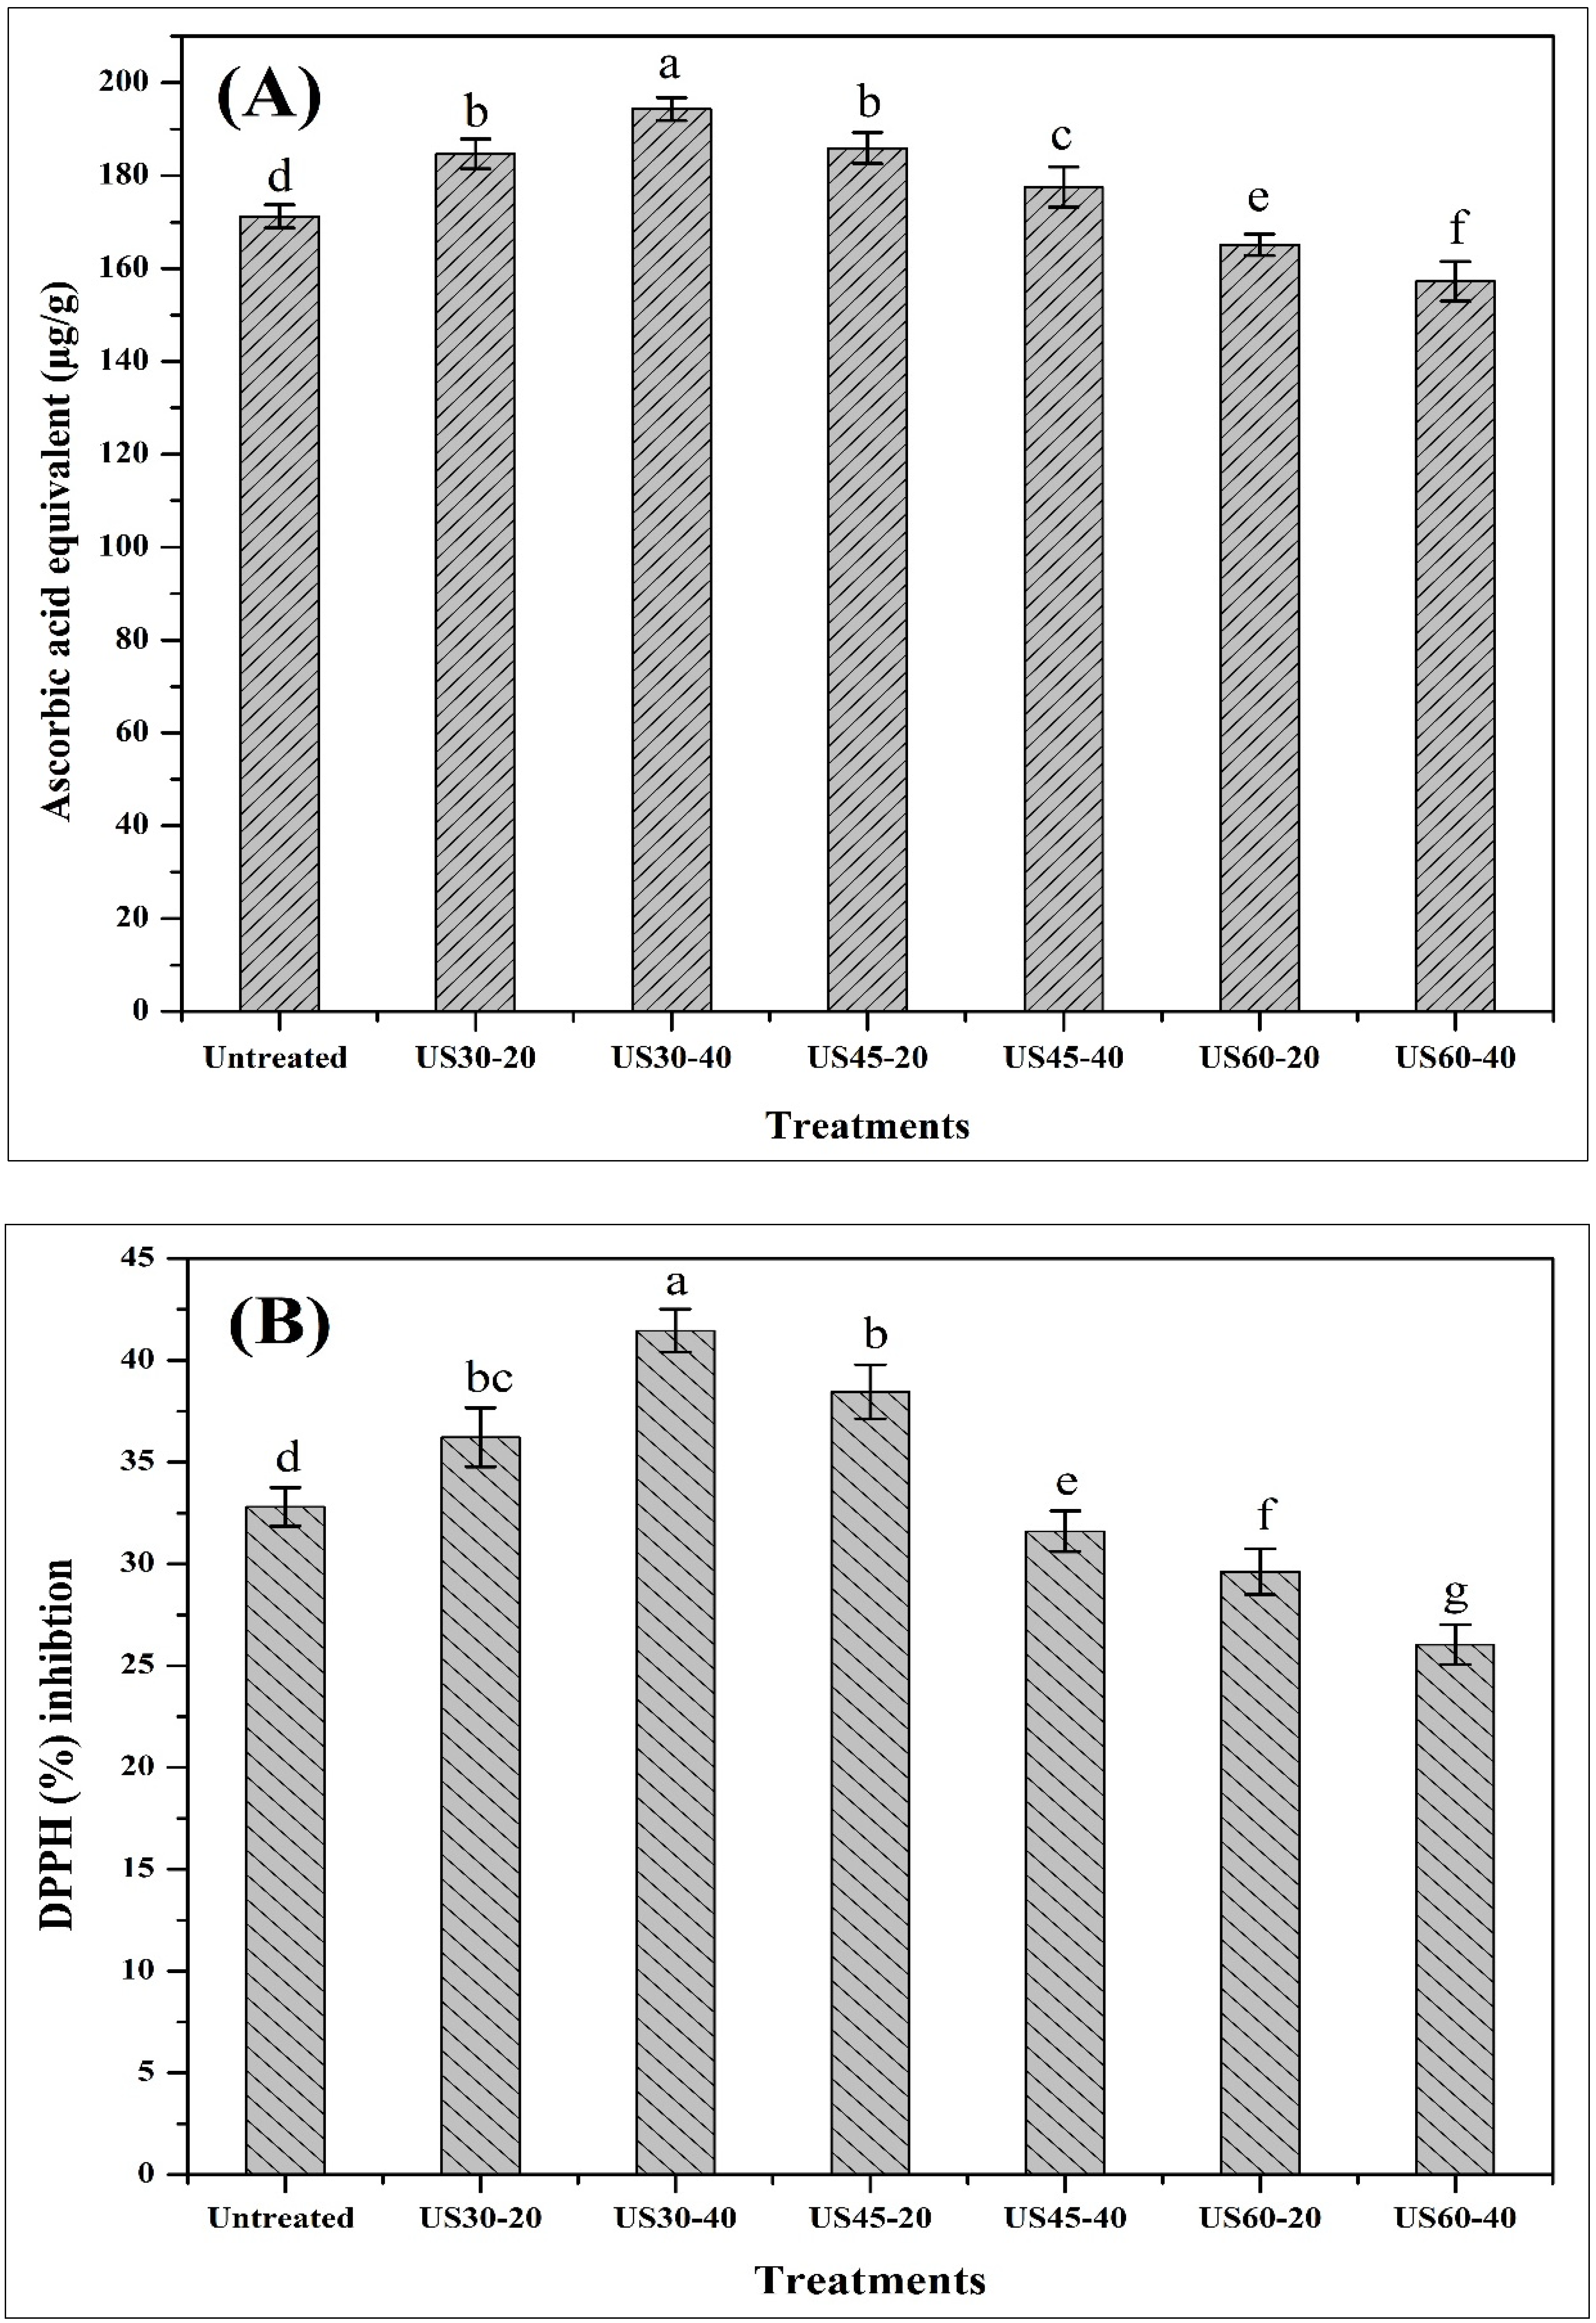
3.4. Impacts of TU on TAC and DPPH Activity

From the experimental results, it can be noted that the TAC and DPPH activities of TU treated samples were notably affected as compared to untreated juice (Figure 1). The TAC and DPPH activity significantly (p < 0.05) increased in US30-20, US30-40 and US45-20 as compared to untreated juice sample. On the other hand, by an increase in temperature from 30 to 45 and 60 °C, degradation of TAC and DPPH activity was also increased. Also, records that the significant impact of temperature on antioxidant activities, the lowest value was estimated in US60-45, 157.23 ascorbic acid equivalent µg/g for TAC and 26.03 % for DPPH radical. Earlier, some studies showed the increase in temperature might enhance the availability and extraction of phenolic compounds by improving the diffusion coefficient and solute solubility [36,37]. But some studies stated that temperature has a notable effect on bioactive compounds, and a substantial reduction was found with the increase in the temperature in TU treated grapefruit juice and watermelon juice [16,38]. Initially, the DPPH activities were increased due to the increase in phenolic compound levels, and the cavitation effect of ultrasonication facilitated it. The increase in the DPPH values might be associated with the production of hydroxylation of flavonoids and hydroxyl radicals during TU [39]. The treatment time also affected the antioxidant activity of juices, as described in the literature [40].

3.5. Impacts of TU on Free Amino Acids (FAA)

The concentration of free amino acids (FAA) contents in untreated and TU treated at 30, 45 and 60 °C with different treatment time presented in Table 5. Our findings show that the significant (p < 0.05) increased in the FAA contents of TU treated wheat plantlets juice at 30 °C for 20 min, while significant reduction (p < 0.05) was observed in all other TU treated wheat plantlets juice samples. In the present study, FAA contents increased 9.52% in the US30-20 treated wheat plantlets juice, while the significant reduction was recorded in all other treatments. The significant increase (p < 0.05) in all FAA contents was observed in US30-20 and US30-40 treated samples as compared to untreated, while the reduction was observed in all other samples. Zhao et al. [41] demonstrated that these amino acids likely released through plasmatic membrane pores, formed by indigenous micro-organisms, such as yeast. The higher FAA contents in the sample submitted to the US30-20 could be due to the release of some FAA from cell tissues that were ruptured by the US. Jambrak et al. [42] described that the US treatment can change the protein structure due to partial cleavage of intermolecular hydrophobic interactions, rather than disulfide bonds or peptides improved the release of FAA. On the other hand, during heating the modification in amino acids possibly happened when protein can react with different components such as (1) side chains degradation reactions; (2) interactions among amino acids producing new links and decreasing the bioavailability; (3) denaturing; (4) alterations of amino acids by S-S and SH- and groups; (5) carbohydrate interactions, where lysine is the commonly changed amino acid through double amino group, and (6) lipids interactions with amino acids, caused a reduction in the availability of sulfur-containing amino acids and. In the present study, the individual amino acids were increased and total amino acids could be ascribed to the release of some submerged free amino acids and hydrolyzation of some soluble protein. Further study is required to demonstrate the increase in free amino acids of wheat plantlets juice and their possible mechanism.

3.6. Impact of TU on Mineral Contents

Minerals play an important role in the wide number of physical and biochemical processes essential for human health [43]. The impact of food processing on minerals depends on the type of food, treatment time, the addition of water or not of water and the stability of the element analyzed [44]. The effects of TU treatments on the mineral contents such as iron, calcium, magnesium, potassium, and zinc of wheatgrass juice are illustrated in Table 6. In this study, a significant (p < 0.05) increase was recorded in Fe, Ca, Mn, and K in the US30-20 and US30-40 treated samples, while the reduction was observed in Zn content. But during other treatments US45-20, US45-40, US60-20, and US60-40 Zn, Mn and K contents was significantly (p < 0.05) decreased, while Ca and Fe was significantly (p < 0.05) increased. During TU treatment, time influences the combination of several structures in the liquid which leads to reducing ions in the liquid phase [45]. Mineral contents reduce during US treatment when the extraction medium temperature approaches to the ebullition temperature of the liquid phase, the efficiency of US declines due to the decreased surface tension of the medium, and increased vapor pressure inside the microbubbles [46]. The juice sample treated with US30-20 and US30-40 presented the highest values for all mineral contents as compared to untreated and other samples. It is the first study concerning the impact of TU on the minerals of wheat plantlets juice, so more research work is required to understand exact phenoms.

3.7. Impacts of TU on ºBrix, Titratable Acidity (TA), pH, and EC

Results regarding the impacts of TU treatments on pH, ºBrix, TA, and EC of wheat plantlets juice are shown in Table 7. No significant difference was observed in untreated and treated wheat plantlets juice samples for pH, ºBrix, and TA. Abid et al. [17] and Nayak et al. [47] also described the non-significant impact of thermo-sonication on Brix, pH, and acidity of apple and star fruit juice respectively. Tiwari et al. [15] earlier reported that the non-significant effect of US treatment on pH, Brix, and TA of juices. While, the EC of juices is due to nutrients like minerals, vitamins, proteins, and fatty acid [13]. In this study, the increase in EC might be associated with the release of vitamin and of mineral elements came from wheat plantlets tissues. The US could promote the release of these compounds when these were entangled into colloidal particles or vegetal cells [48]. During TU at 40 and 60 °C for 20 and 40 min, EC might be reduced due to the decrease in vitamins and minerals or increase in temperature during the US.

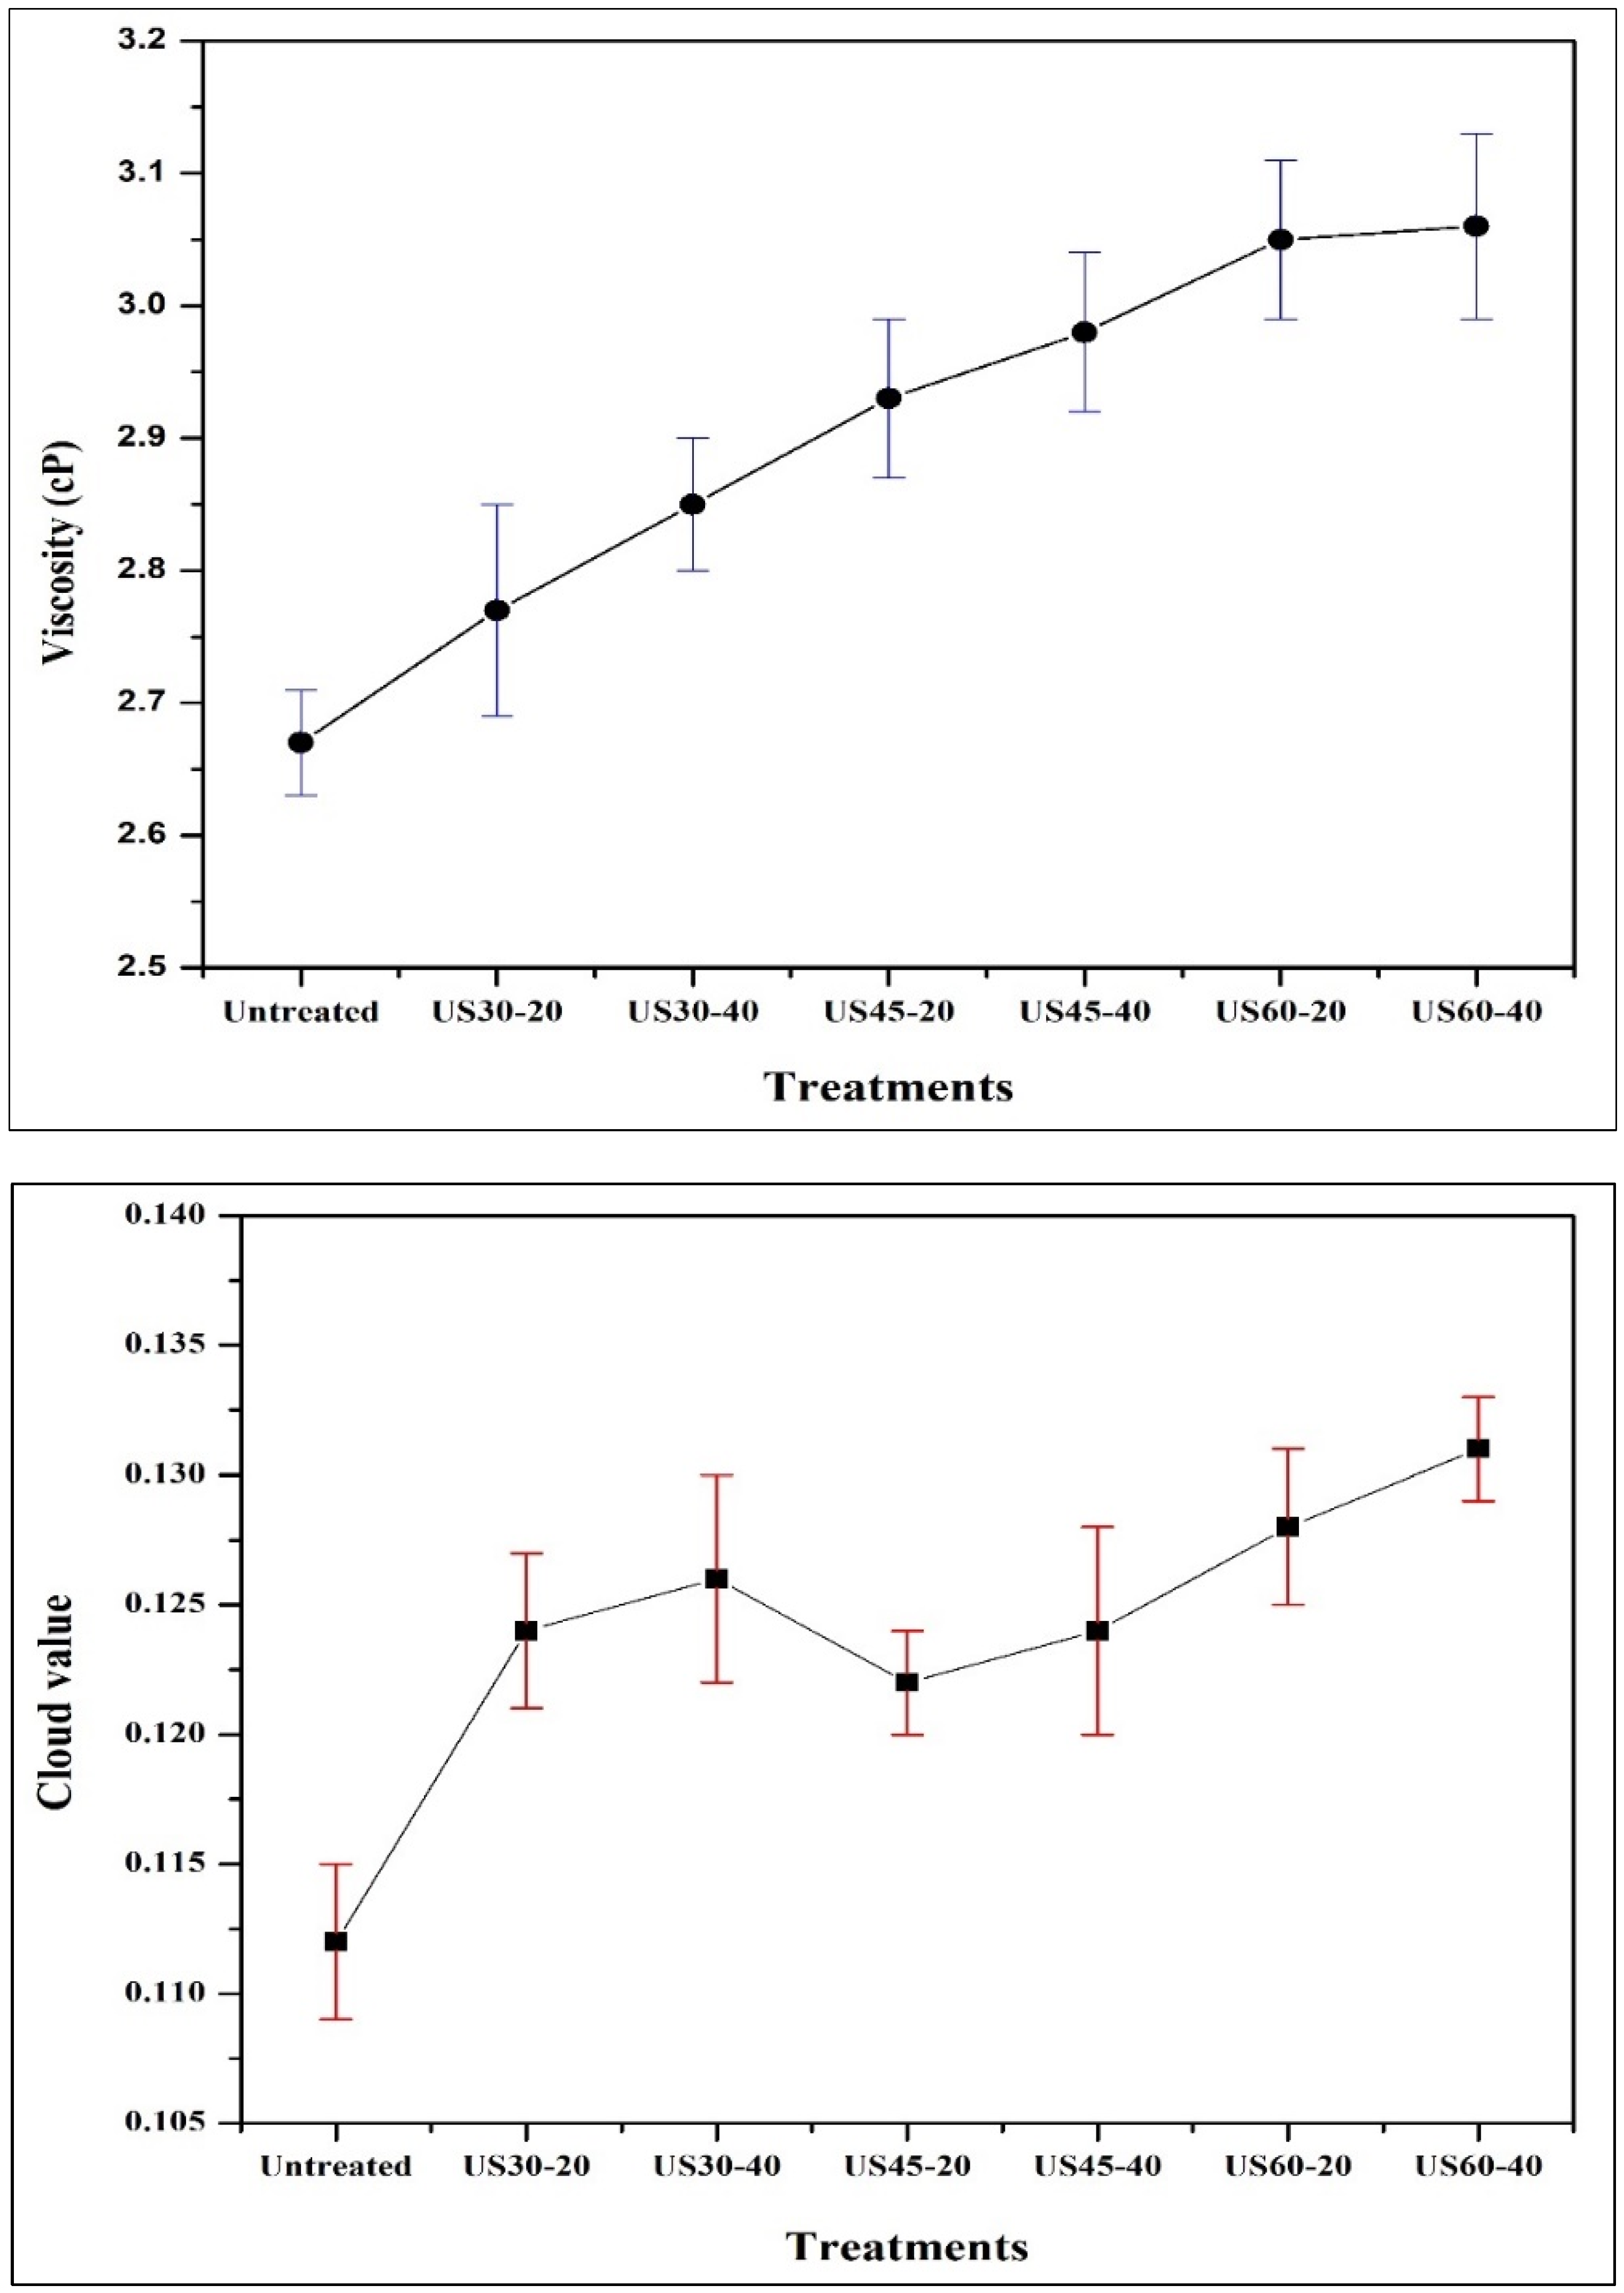
3.8. Impacts of TU on Non-Enzymatic Browning (NEB), Cloud Value, and Viscosity

Cloud value relates to the existence of particles like cellulose, hemicellulose, lipids, pectin, protein, and some other minor components [25]. It has been acknowledged as one of the essential quality parameters due to its important role in the flavor and color of juices. The cloud value of untreated and treated was varied from 0.112 to 0.131 (Figure 2). The TU had a significant (p < 0.05) impact on the cloud values as compared with untreated juice. The cloud value increase during TU, which break the larger molecules due to the mechanical forces produced from cavitation [32]. Temperature also increased the cloud value of juices as described in the literature [39]. The NEB of TU treated juices have significantly (p < 0.05) differed in comparison with untreated juice (Table 7). Processing time and temperature were the key parameters affecting the browning of juices. The changes in the browning value may be due to the breakage of carotenoid pigments. The similar, outcome was described by Ugarte-Romero et al. [49] for the US treated apple cider. Vitamin C degradation is known as a key source of NEB in foods, during degradation, carbonyls groups were released which can act as a precursor for browning [50]. The reduction in the NEB in the present study may be associated with the inactivation of enzymes which were able for the browning reactions. The viscosity of TU treated wheat plantlets juices was significantly increased (p < 0.05) when the treatment temperature and time increased as compared to the untreated sample and highest viscosity was reported for US60-45 (Figure 2). Wu et al. [51] described a significant increase in tomato juice viscosity after treated with TU. This increase might be associated with particle size reduction during TU treatments [51].

3.9. Impact of TU on Color Properties

Color of fruit juices is the vital quality parameter that directly affects consumer acceptance. The outcomes associated with the impact of different TU treatments on redness (a*), yellowness (b*) and lightness (L*) of wheat plantlets juice are presented in Table 8. We examined a significant increase (p < 0.05) in a* and L* in all values expect US30-20 and US30-40 treatments. While b* values were increased (p < 0.05) in all treatments treated at 30 and 40 °C but reduced at 60 °C. Similar results for color attributes in apple juice have been described by Abid et al. [40]. Rawson et al. [16] reported an increase in L* value in TU treated watermelon juice for longer exposure time. During TU treatment, the juice precipitation of unstable particles might be useful for the increase in L* value. On the other hand, Tiwari et al. [52] described that the L* value increased possibly due to an increase in the cloud value under the impact of the US, following in improved homogenization. The color values changed in TU treated wheatgrass juice, possibly due to combined impacts of external treatment variables of time and temperature. The variations in color properties may negatively influence the organoleptic characteristics and sequentially deteriorate the quality of juice. In the present study, these variations could be observed easily in US30-20 and US30-40 as compare to others.

4. Conclusions

The present study was carried to assess the impact of different TU treatments on bioactive compounds, microbial, nutritional and physicochemical properties of wheat plantlets juice. The results may indicate that the use of TU treatments is suitable to produce better quality wheat plantlets juice with decreased microbial loads and increased retention of other bioactive compounds, antioxidant activities, and nutritional profile at a much lower temperature. Hence, TU may be successfully used as an alternative processing approach to secure the microbiological and nutritional quality of wheat plantlets juice at an industrial scale. For the overall quality, more studies should be required to assume sensory quality because it’s an essential parameter.

Author Contributions

Conceptualization, Z.A., M.F.M.; methodology, Z.A.; software, M.F.M.; formal analysis, Z.A., R.S.; investigation, Z.A.; data analysis, N.B., A.K., I.S.; statistical analysis, U.F., A.S., Z.U.D.; writing—original draft preparation, M.F.M.; writing—review and editing, X.-A.Z.; supervision, X.-A.Z.

Acknowledgments

This research was supported by the National Natural Science Foundation of China (21576099), the S&T projects of Guangdong Province (2017B020207001 and 2015A030312001), as well as the 111 Project (B17018).

Conflicts of Interest

Authors do not have any conflict of interests.

References

  1. Akbas, E.; Kilercioglu, M.; Onder, O.N.; Koker, A.; Soyler, B.; Oztop, M.H. Wheatgrass juice to wheat grass powder: Encapsulation, physical and chemical characterization. J. Funct. Foods 2017, 28, 19–27. [Google Scholar] [CrossRef]
  2. Kulkarni, S.; Acharya, R.; Nair, A.; Rajurkar, N.; Reddy, A.; Kulkarni, S. Determination of elemental concentration profiles in tender wheatgrass (Triticum aestivum L.) using instrumental neutron activation analysis. Food Chem. 2006, 95, 699–707. [Google Scholar] [CrossRef]
  3. Durazzo, A.; Lucarini, M.; Novellino, E.; Daliu, P.; Santini, A. Fruit-based juices: Focus on antioxidant properties—Study approach and update. Phytother. Res. 2019. [Google Scholar] [CrossRef] [PubMed]
  4. Saura-Calixto, F.; Goñi, I. Antioxidant capacity of the Spanish Mediterranean diet. Food Chem. 2006, 94, 442–447. [Google Scholar] [CrossRef]
  5. Siddeeg, A.; Zeng, X.-A.; Rahaman, A.; Manzoor, M.F.; Ahmed, Z.; Ammar, A.-F. Quality characteristics of the processed dates vinegar under influence of ultrasound and pulsed electric field treatments. J. Food Sci. Technol. 2019, 1–10. [Google Scholar] [CrossRef]
  6. Rahaman, A.; Siddeeg, A.; Manzoor, M.F.; Zeng, X.-A.; Ali, S.; Baloch, Z.; Li, J.; Wen, Q.-H. Impact of pulsed electric field treatment on drying kinetics, mass transfer, colour parameters and microstructure of plum. J. Food Sci. Technol. 2019, 56, 2670–2678. [Google Scholar] [CrossRef] [PubMed]
  7. Manzoor, M.F.; Zeng, X.-A.; Rahaman, A.; Siddeeg, A.; Aadil, R.M.; Ahmed, Z.; Li, J.; Niu, D. Combined impact of pulsed electric field and ultrasound on bioactive compounds and FT-IR analysis of almond extract. J. Food Sci. Technol. 2019, 56, 2355–2364. [Google Scholar] [CrossRef]
  8. Rahaman, A.; Zeng, X.-A.; Kumari, A.; Rafiq, M.; Siddeeg, A.; Manzoor, M.F.; Bloch, Z.; Ahmad, Z. Influence of ultrasound-assisted osmotic dehydration on texture, bioactive compounds and metabolites analysis of plum. Ultrason. Sonochem. 2019, 58, 104643. [Google Scholar] [CrossRef]
  9. Chandrapala, J.; Oliver, C.; Kentish, S.; AshokKumar, M. Ultrasonics in food processing—Food quality assurance and food safety. Trends Food Sci. Technol. 2012, 26, 88–98. [Google Scholar] [CrossRef]
  10. Muñoz, A.; Caminiti, I.M.; Palgan, I.; Pataro, G.; Noci, F.; Morgan, D.J.; Cronin, D.A.; Whyte, P.; Ferrari, G.; Lyng, J.G. Effects on Escherichia coli inactivation and quality attributes in apple juice treated by combinations of pulsed light and thermosonication. Food Res. Int. 2012, 45, 299–305. [Google Scholar] [CrossRef]
  11. Kiang, W.S.; Bhat, R.; Rosma, A.; Cheng, L.H. Effects of thermosonication on the fate of E scherichia coli O157: H7 and Salmonella Enteritidis in mango juice. Lett. Appl. Microbiol. 2013, 56, 251–257. [Google Scholar] [CrossRef] [PubMed]
  12. Li, H.; Pordesimo, L.; Weiss, J. High intensity ultrasound-assisted extraction of oil from soybeans. Food Res. Int. 2004, 37, 731–738. [Google Scholar] [CrossRef]
  13. Abid, M.; Jabbar, S.; Hu, B.; Hashim, M.M.; Wu, T.; Wu, Z.; Khan, M.A.; Zeng, X. Synergistic impact of sonication and high hydrostatic pressure on microbial and enzymatic inactivation of apple juice. LWT Food Sci. Technol. 2014, 59, 70–76. [Google Scholar] [CrossRef]
  14. Valero, M.; Recrosio, N.; Saura, D.; Muñoz, N.; Martí, N.; Lizama, V. Effects of ultrasonic treatments in orange juice processing. J. Food Eng. 2007, 80, 509–516. [Google Scholar] [CrossRef]
  15. Tiwari, B.; O’Donnell, C.; Cullen, P.; Tiwari, B. Effect of non thermal processing technologies on the anthocyanin content of fruit juices. Trends Food Sci. Technol. 2009, 20, 137–145. [Google Scholar] [CrossRef]
  16. Rawson, A.; Tiwari, B.; Patras, A.; Brunton, N.; Brennan, C.; Cullen, P.; O’Donnell, C.; Tiwari, B. Effect of thermosonication on bioactive compounds in watermelon juice. Food Res. Int. 2011, 44, 1168–1173. [Google Scholar] [CrossRef]
  17. Abid, M.; Jabbar, S.; Hu, B.; Hashim, M.M.; Wu, T.; Lei, S.; Khan, M.A.; Zeng, X. Thermosonication as a potential quality enhancement technique of apple juice. Ultrason. Sonochem. 2014, 21, 984–990. [Google Scholar] [CrossRef]
  18. Manzoor, M.F. Effect of cooking temperature on some quality characteristic of Almond milk. Int. J. Agric. Life Sci. 2017, 3, 131–135. [Google Scholar]
  19. Kim, D.-O.; Jeong, S.W.; Lee, C.Y. Antioxidant capacity of phenolic phytochemicals from various cultivars of plums. Food Chem. 2003, 81, 321–326. [Google Scholar] [CrossRef]
  20. Slinkard, K.; Singleton, V.L. Total phenol analysis: Automation and comparison with manual methods. Am. J. Enol. Vitic. 1977, 28, 49–55. [Google Scholar]
  21. Aadil, R.M.; Zeng, X.-A.; Ali, A.; Zeng, F.; Farooq, M.A.; Han, Z.; Khalid, S.; Jabbar, S. Influence of different pulsed electric field strengths on the quality of the grapefruit juice. Int. J. Food Sci. Technol. 2015, 50, 2290–2296. [Google Scholar] [CrossRef]
  22. Liao, H.; Sun, Y.; Ni, Y.; Liao, X.; Hu, X.; Wu, J.; Chen, F. The effect of enzymatic mash treatment, pressing, centrifugation, homogenization, deaeration, sterilization and storage on carrot juice. J. Food Process Eng. 2007, 30, 421–435. [Google Scholar] [CrossRef]
  23. Zhao, L.; Wang, S.; Liu, F.; Dong, P.; Huang, W.; Xiong, L.; Liao, X. Comparing the effects of high hydrostatic pressure and thermal pasteurization combined with nisin on the quality of cucumber juice drinks. Innov. Food Sci. Emerg. Technol. 2013, 17, 27–36. [Google Scholar] [CrossRef]
  24. Aadil, R.M.; Zeng, X.-A.; Wang, M.-S.; Liu, Z.-W.; Han, Z.; Zhang, Z.-H.; Hong, J.; Jabbar, S. A potential of ultrasound on minerals, micro-organisms, phenolic compounds and colouring pigments of grapefruit juice. Int. J. Food Sci. Technol. 2015, 50, 1144–1150. [Google Scholar] [CrossRef]
  25. Aadil, R.M.; Zeng, X.-A.; Han, Z.; Sun, D.-W. Effects of ultrasound treatments on quality of grapefruit juice. Food Chem. 2013, 141, 3201–3206. [Google Scholar] [CrossRef] [PubMed]
  26. Wordon, B.; Mortimer, B.; McMaster, L. Comparative real-time analysis of Saccharomyces cerevisiae cell viability, injury and death induced by ultrasound (20 kHz) and heat for the application of hurdle technology. Food Res. Int. 2012, 47, 134–139. [Google Scholar] [CrossRef]
  27. Bermúdez-Aguirre, D.; Barbosa-Cánovas, G.V. Inactivation of Saccharomyces cerevisiae in pineapple, grape and cranberry juices under pulsed and continuous thermo-sonication treatments. J. Food Eng. 2012, 108, 383–392. [Google Scholar] [CrossRef]
  28. Masuzawa, N.; Ohdaira, E.; Ide, M. Effects of Ultrasonic Irradiation on Phenolic Compounds in Wine. Jpn. J. Appl. Phys. 2000, 39, 2978–2979. [Google Scholar] [CrossRef]
  29. Manzoor, M.F.; Ahmad, N.; Manzoor, A.; Kalsoom, A. Food based phytochemical luteolin their derivatives, sources and medicinal benefits. Int. J. Agric. Life Sci. IJAL 2017, 3, 11. [Google Scholar] [CrossRef]
  30. Manzoor, M.F.; Ahmad, N.; Ahmed, Z.; Siddique, R.; Zeng, X.-A.; Rahaman, A.; Aadil, R.M.; Wahab, A. Novel extraction techniques and pharmaceutical activities of luteolin and its derivatives. J. Food Biochem. 2019, e12974. [Google Scholar] [CrossRef]
  31. Gardner, P.T.; White, T.A.; McPhail, D.B.; Duthie, G.G. The relative contributions of vitamin C, carotenoids and phenolics to the antioxidant potential of fruit juices. Food Chem. 2000, 68, 471–474. [Google Scholar] [CrossRef]
  32. Santhirasegaram, V.; Razali, Z.; Somasundram, C. Effects of thermal treatment and sonication on quality attributes of Chokanan mango (Mangifera indica L.) juice. Ultrason. Sonochem. 2013, 20, 1276–1282. [Google Scholar] [CrossRef] [PubMed]
  33. Wang, R.; Ding, S.; Hu, X.; Zhang, Y. Stability of chlorophyll–protein complex (photosystem II) in processed spinach: Effect of high hydrostatic pressure. Int. J. Food Prop. 2017, 20, S3177–S3188. [Google Scholar] [CrossRef]
  34. Toma, M.; Vinatoru, M.; Paniwnyk, L.; Mason, T.J. Investigation of the effects of ultrasound on vegetal tissues during solvent extraction. Ultrason. Sonochem. 2001, 8, 137–142. [Google Scholar] [CrossRef]
  35. Xin, Y.; Zhang, M.; Yang, H.; Adhikari, B. Kinetics of argy wormwood (Artemisia argyi) leaf peroxidase and chlorophyll content changes due to thermal and thermosonication treatment. J. Food Sci. Technol. 2015, 52, 249–257. [Google Scholar] [CrossRef]
  36. Bhat, R.; Kamaruddin, N.S.B.C.; Min-Tze, L.; Karim, A. Sonication improves kasturi lime (Citrus microcarpa) juice quality. Ultrason. Sonochem. 2011, 18, 1295–1300. [Google Scholar] [CrossRef] [PubMed]
  37. Guerrouj, K.; Sánchez-Rubio, M.; Taboada-Rodríguez, A.; Cava-Roda, R.M.; Marín-Iniesta, F. Sonication at mild temperatures enhances bioactive compounds and microbiological quality of orange juice. Food Bioprod. Process. 2016, 99, 20–28. [Google Scholar] [CrossRef]
  38. Aadil, R.M.; Zeng, X.-A.; Sun, D.-W.; Wang, M.-S.; Liu, Z.-W.; Zhang, Z.-H.; Liu, Z.W. Combined effects of sonication and pulsed electric field on selected quality parameters of grapefruit juice. LWT Food Sci. Technol. 2015, 62, 890–893. [Google Scholar] [CrossRef]
  39. Cervantes-Elizarrarás, A.; Piloni-Martini, J.; Ramírez-Moreno, E.; Alanís-García, E.; Güemes-Vera, N.; Gómez-Aldapa, C.A.; Zafra-Rojas, Q.Y.; Cruz-Cansino, N.D.S. Enzymatic inactivation and antioxidant properties of blackberry juice after thermoultrasound: Optimization using response surface methodology. Ultrason. Sonochem. 2017, 34, 371–379. [Google Scholar] [CrossRef]
  40. Abid, M.; Jabbar, S.; Wu, T.; Hashim, M.M.; Hu, B.; Lei, S.; Zhang, X.; Zeng, X. Effect of ultrasound on different quality parameters of apple juice. Ultrason. Sonochem. 2013, 20, 1182–1187. [Google Scholar] [CrossRef]
  41. Zhao, W.; Yang, R.; Wang, M.; Lu, R. Effects of pulsed electric fields on bioactive components, colour and flavour of green tea infusions. Int. J. Food Sci. Technol. 2009, 44, 312–321. [Google Scholar] [CrossRef]
  42. Jambrak, A.R.; Mason, T.J.; Lelas, V.; Paniwnyk, L.; Herceg, Z. Effect of ultrasound treatment on particle size and molecular weight of whey proteins. J. Food Eng. 2014, 121, 15–23. [Google Scholar] [CrossRef]
  43. Biziuk, M.; Kuczynska, J. Mineral Components in Foods; Taylor &Francis: Abingdon, UK, 2007. [Google Scholar]
  44. López-Berenguer, C.; Carvajal, M.; Moreno, D.A.; Garcia-Viguera, C. Effects of Microwave Cooking Conditions on Bioactive Compounds Present in Broccoli Inflorescences. J. Agric. Food Chem. 2007, 55, 10001–10007. [Google Scholar] [CrossRef] [PubMed]
  45. Carvalho, L.; Souza, S.; Martinis, B.; Korn, M. Monitoring of the ultrasonic irradiation effect on the extraction of airborne particulate matter by ion chromatography. Anal. Chim. Acta 1995, 317, 171–179. [Google Scholar] [CrossRef]
  46. Elik, A. Ultrasound assisted pseudo-digestion of street dust samples prior to determination by atomic absorption spectrometry. Talanta 2005, 66, 882–888. [Google Scholar] [CrossRef] [PubMed]
  47. Nayak, P.K.; Chandrasekar, C.M.; Kesavan, R.K. Effect of thermosonication on the quality attributes of star fruit juice. J. Food Process Eng. 2018, 41, e12857. [Google Scholar] [CrossRef]
  48. Zou, Y.; Jiang, A. Effect of ultrasound treatment on quality and microbial load of carrot juice. Food Sci. Technol. 2016, 36, 111–115. [Google Scholar] [CrossRef] [Green Version]
  49. Feng, H.; Martin, S.E.; Cadwallader, K.R.; Robinson, S.J.; Ugarte-Romero, E.; Ugarte-Romero, E. Inactivation of Escherichia coli with Power Ultrasound in Apple Cider. J. Food Sci. 2006, 71, E102–E108. [Google Scholar]
  50. Caminiti, I.M.; Noci, F.; Muñoz, A.; Whyte, P.; Morgan, D.J.; Cronin, D.A.; Lyng, J.G. Impact of selected combinations of non-thermal processing technologies on the quality of an apple and cranberry juice blend. Food Chem. 2011, 124, 1387–1392. [Google Scholar] [CrossRef]
  51. Wu, J.; Gamage, T.; Vilkhu, K.; Simons, L.; Mawson, R. Effect of thermosonication on quality improvement of tomato juice. Innov. Food Sci. Emerg. Technol. 2008, 9, 186–195. [Google Scholar] [CrossRef]
  52. Tiwari, B.K.; Muthukumarappan, K.; O’Donnell, C.P.; Cullen, P.J.; Tiwari, B. Effects of Sonication on the Kinetics of Orange Juice Quality Parameters. J. Agric. Food Chem. 2008, 56, 2423–2428. [Google Scholar] [CrossRef]
Figure 1. Impacts of thermal–ultrasound (TU) on (a) total antioxidant capacity and (b) 2, 2-diphenyl-1-picrylhydrazyl (DPPH) radical scavenging activity of wheat plantlets juice. Results are expressed as mean and standard deviation (SD) (n = 3). Different letters (a–f) describe the significant (p < 0.05) among different treatments.
Processes 07 00518 g001
Figure 2. Effect of TU treatment on the viscosity and cloud value of wheat plantlets juice. Results are expressed as mean and standard deviation (SD) (n = 3).
Processes 07 00518 g002
Table 1. Processing conditions used during ultrasound treatments.
SamplesTemperature (°C)Time (min)Power (W)
Untreated
US30-203020420
US30-403040420
US45-204520420
US45-404540420
US60-206020420
US60-406040420
Table 2. Impact of thermal–ultrasound (TU) treatments on the survival of micro-organisms.
TreatmentsTotal Plate Count (log CFU/mL)Yeast & Mold (log CFU/mL)
Untreated4.12 ± 0.12 a3.48 ± 0.26 a
US30-203.91 ± 0.25 b2.78 ± 0.20 b
US30-403.63 ± 0.19 c2.40 ± 0.19 c
US45-203.34 ± 0.21 d2.10 ± 0.24 d
US45-402.08 ± 0.13 e1.92 ± 0.18 e
US60-201.87 ± 0.12 f1.62 ± 0.14 f
US60-40NDND
ND; not detected. All values are indicated as mean ± stander deviation. Values with different letters in the same row are significantly different (p < 0.05) from each other.
Table 3. Impact of TU treatment on bioactive compounds.
TreatmentsTotal PhenolicTotal FlavonoidsCarotenoids
Untreated311.48 ± 0.13 d189.55 ± 0.08 de94.30 ± 0.06 d
US30-20319.21 ± 0.16 b198.82 ± 0.05 bc96.21 ± 0.03 b
US30-40331.40 ± 0.09 a205.73 ± 0.03 a97.32 ± 0.05 a
US45-20321.15 ± 0.18 c201.27 ± 0.11 b97.71 ± 0.04 a
US45-40309.04 ± 0.11 de192.18 ± 0.09 d95.44 ± 0.02 c
US60-20305.17 ± 0.14 f187.64 ± 0.06 def93.02 ± 0.04 e
US60-40297.28 ± 0.05 g179.73 ± 0.12 g92.75 ± 0.07 f
All values are indicated as mean ± stander deviation. Values with different letters in the same row are significantly different (p < 0.05) from each other.
Table 4. Impact of TU treatment on carotenoids and chlorophyll contents.
TreatmentsChlorophyll aChlorophyll bChlorophyll a + b
Untreated360.6 ± 0.04 e120.2 ± 0.03 d480.8 ± 0.03 d
US30-20371.33 ± 0.02 bc123.23 ± 0.05 c494.56 ± 0.03 b
US30-40376.23 ± 0.03 a125.12 ± 0.02 ab501.23 ± 0.03 a
US45-20373.63 ± 0.06 ab126.45 ± 0.08 a500.08 ± 0.03 a
US45-40365.12 ± 0.07 d123.35 ± 0.05 c488.98 ± 0.03 c
US60-20359.47 ± 0.09 ef119.23 ± 0.02 de478.7 ± 0.03d e
US60-40355.97 ± 0.07 g116.15 ± 0.08 f472.12 ± 0.03 f
All values are indicated as mean ± stander deviation. Values with different letters in the same row are significantly different (p < 0.05) from each other.
Table 5. Impact of TU treatment on amino acids profile (mg/100 mL).
Amino AcidsUntreatedUS30-20US30-40US45-20US45-40US60-20US60-40
Asp32.03 ± 0.11 a33.536 ± 0.14 a32.69 ± 0.07 a16.68 ± 0.04 b16.57 ± 0.02 b17.04 ± 0.06 c16.77 ± 0.10 b
Thr13.76 ± 0.08BDLBDLBDLBDLBDLBDL
Ser125.12 ± 0.18 c141.518 ± 0.21 a135.71 ± 0.14 b86.08 ± 0.09 d85.90 ± 0.07 d84.38 ± 0.11 de84.71 ± 0.10 e
Glu0.92 ± 0.01 f1.281 ± 0.03 c1.84 ± 0.01 a1.13 ± 0.02 d0.79 ± 0.03 e1.25 ± 0.04 c1.57 ± 0.07 b
Gly6.69 ± 0.08 b7.895 ± 0.05 a7.74 ± 0.03 a3.74 ± 0.06 c3.61 ± 0.02 c3.44 ± 0.05 cd3.52 ± 0.01 cd
Ala44.28 ± 0.12 c50.195 ± 0.16 a48.21 ± 0.09 b25.39 ± 0.07 d24.35 ± 0.04 de23.52 ± 0.08 e23.79 ± 0.06 e
Cys1.91 ± 0.02 b2.052 ± 0.05 a2.02 ± 0.03 a1.01 ± 0.04 c1.00 ± 0.02 c0.96 ± 0.01 cd0.95 ± 0.01 cd
Val20.07 ± 0.12 c22.822 ± 0.15 a21.50 ± 0.09 ab11.54 ± 0.10 d11.13 ± 0.07 d10.85 ± 0.05 de11.02 ± 0.04 d
Met2.32 ± 0.03 c3.086 ± 0.02 b3.53 ± 0.01 a1.59 ± 0.01 d1.42 ± 0.02 e1.43 ± 0.01 e1.49 ± 0.03 d
Ile8.26 ± 0.04 b10.056 ± 0.05 a9.90 ± 0.06 a4.94 ± 0.02 c4.66 ± 0.02 cd4.51 ± 0.01 e4.63 ± 0.03 cd
Leu8.98 ± 0.02 c12.720 ± 0.06 a11.47 ± 0.04 b6.78 ± 0.03 d5.96 ± 0.04 e5.87 ± 0.05 e6.23 ± 0.03 d
Tyr7.89 ± 0.05 c9.704 ± 0.03 a8.90 ± 0.02 b5.06 ± 0.05 d4.63 ± 0.02 e4.63 ± 0.04 e4.77 ± 0.02 f
Phe11.66 ± 0.07 c13.737 ± 0.04 a13.16 ± 0.05 b7.50 ± 0.02 d6.84 ± 0.03 de6.95 ± 0.02 de7.19 ± 0.05 d
Lys22.39 ± 0.09 b25.09 ± 0.05 a24.65 ± 0.07 a13.02 ± 0.01 c12.44 ± 0.05 cd12.21 ± 0.05 cd12.46 ± 0.07 cd
NH328.72 ± 0.06 b34.115 ± 0.02 a33.48 ± 0.04 a17.56 ± 0.04 c16.48 ± 0.06 cd16.98 ± 0.08 cd17.15 ± 0.09 c
His14.74 ± 0.03 b15.473 ± 0.08 a14.77 ± 0.03 b7.74 ± 0.03 c7.59 ± 0.08 c7.56 ± 0.06 c7.62 ± 0.04 c
Arg11.56 ± 0.04 b13.339 ± 0.07 a6.83 ± 0.02 cd7.0 ± 0.05 c6.54 ± 0.04 e6.48 ± 0.03 e6.63 ± 0.03 cd
All values are indicated as mean ± stander deviation. Values with different letters (a–g) in the same row are significantly different (p < 0.05) from each other.
Table 6. Impact of TU treatment on minerals contents (mg/L).
MineralsUntreatedUS30-20US30-40US45-20US45-40US60-20US60-40
Zinc (Zn)4.18 ± 0.03 a4.11 ± 0.04 b3.64 ± 0.06 e3.91 ± 0.02 d3.57 ± 0.05 e3.94 ± 0.04 d4.01 ± 0.01 c
Iron (Fe)6.55 ± 0.02 d6.95 ± 0.05 b6.74 ± 0.03 c6.58 ± 0.01 d8.18 ± 0.07 a6.02 ± 0.01 e6.78 ± 0.02 c
Manganese (Mn)3.06 ± 0.01 a3.06 ± 0.03 a3.08 ± 0.02 a2.98 ± 0.01 b2.93 ± 0.02b c2.95 ± 0.04 bcd2.78 ± 0.01 e
Calcium (Ca)170 ± 0.07 f263 ± 0.09 c276 ± 0.10 b223 ± 0.11 e170 ± 0.05 f238 ± 0.06 d269 ± 0.08 a
Potassium (K)1432 ± 0.54 ab1434 ± 0.58 a1436 ± 0.45 a1374 ± 0.60 c1319 ± 0.32 d1274 ± 0.28 e1254 ± 0.24 f
All values are indicated as mean ± stander deviation. Values with different letters (a–g) in the same row are significantly different (p < 0.05) from each other.
Table 7. Impact of TU treatment on physicochemical properties.
ParametersUntreatedUS30-20US30-40US45-20US45-40US60-20US60-40
pH5.82 ± 0.02 a5.84 ± 0.01 a5.87 ± 0.03 a5.83 ± 0.01 a5.88 ± 0.04 a5.84 ± 0.05 a5.85 ± 0.02 a
EC*5.01 ± 0.05 c5.10 ± 0.04 b5.16 ± 0.02 a4.98 ± 0.04 cd4.94 ± 0.06 e4.93 ± 0.03 e4.91 ± 0.02 ef
Brix3.8 ± 0.01 a3.9 ± 0.01 a3.8 ± 0.01 a3.8 ± 0.02 a3.9 ± 0.01 a4.0 ± 0.01 a3.8 ± 0.01 a
TA (%)27.92 ± 0.34 a26.23 ± 0.56 a26.54 ± 0.18 a26.12 ± 1.02 a27.13 ± 0.65 a27.05 ± 1.13 a26.96 ± 0.86 a
NEB0.248 ± 0.005 f0.256 ± 0.006 e0.268 ± 0.008 d0.273 ± 0.003 c0.281 ± 0.004 b0.285 ± 0.001 b0.296 ± 0.002 a
All values are indicated as mean ± stander deviation. Values with different letters (a–g) in the same row are significantly different (p < 0.05) from each other; *EC (µS/cm).
Table 8. Impact of TU treatment on color properties.
ParametersUntreatedUS30-20US30-40US45-20US45-40US60-20US60-40
L39.133 ± 0.29 cd32.09 ± 0.07 ef33.17 ± 1.79 e40.11 ± 0.33 c42.30 ± 0.25 ab43.64 ± 0.32 a43.22 ± 0.25 a
a*−5.023 ± 0.07 e−7.163 ± 0.01 g−6.23 ± 0.41 f−4.38 ± 0.08 c−4.24 ± 0.03 cd−3.54 ± 0.01 ab−3.313 ± 0.02 a
b*6.53± 0.01 c11.29 ± 0.05 a11 ± 1.25 a8.37 ± 0.46 b6.33 ± 0.03 cd6.36 ± 0.03 cde6.2 ± 0.02 f
Hue (hº)−52.43 ± 0.20 a−57.62 ± 0.2 bc−60.47 ± 0.2 d−62.38 ± 0.2 ef−56.18 ± 0.17 b−60.90 ± 0.26 d−61.90 ± 0.28 e
C8.23 ± 0.06 d13.37 ± 0.38 a12.64 ± 0.32 b9.44 ± 0.28 c7.61 ± 0.18 e7.27 ± 0.21 ef7.02 ± 0.12 efg
ΔE----8.76 ± 0.35 a7.54 ± 0.65 b2.17 ± 0.23 f3.26 ± 0.42 e4.75 ± 0.52 c4.44 ± 0.58 cd
All values are indicated as mean ± stander deviation. Values with different letters in the same row are significantly different (p < 0.05) from each other.

