Article

Modeling of the Free Radical Copolymerization Kinetics of n-Butyl Acrylate, Methyl Methacrylate and 2-Ethylhexyl Acrylate Using PREDICI®

by
Javier A. Gómez-Reguera
1,
Eduardo Vivaldo-Lima
1,
Vida A. Gabriel
2 and
Marc A. Dubé
2,*
1
Departamento de Ingeniería Química, Facultad de Química, Universidad Nacional Autónoma de México, 04510 Ciudad de México, Mexico
2
Department of Chemical and Biological Engineering, Centre for Catalysis Research and Innovation, University of Ottawa, 161 Louis Pasteur Pvt., Ottawa, ON K1N 6N5, Canada
*
Author to whom correspondence should be addressed.
Processes 2019, 7(7), 395; https://doi.org/10.3390/pr7070395
Submission received: 30 April 2019 / Revised: 16 June 2019 / Accepted: 19 June 2019 / Published: 26 June 2019
(This article belongs to the Special Issue Modeling, Simulation and Control of Chemical Processes)

Abstract

:
Kinetic modeling of the bulk free radical copolymerizations of n-butyl acrylate (BA) and 2-ethylhexyl acrylate (EHA); methyl methacrylate (MMA) and EHA; as well as BA, MMA and EHA was performed using the software PREDICI®. Predicted results of conversion versus time, composition versus conversion, and molecular weight development are compared against experimental data at different feed compositions. Diffusion-controlled effects and backbiting for BA were incorporated into the model as they proved to be significant in these polymerizations. The set of estimated global parameters allows one to assess the performance of these copolymerization systems over a wide range of monomer compositions.

1. Introduction

Copolymer synthesis is important in several areas due to the wide range of properties that can be achieved from the combination of different monomers. Potential applications for the materials that result from the virtually unlimited possible combinations have not been fully explored and studied [1]. Acrylate copolymers are of specific interest because of their widespread use in coatings, adhesives, resins, and many other products [1,2]. N-Butyl acrylate (BA), 2-ethyl hexyl acrylate (EHA), and methyl methacrylate (MMA) monomers are used in adhesive production and coating applications as binders in household paints [2,3] largely because their different glass transition temperatures allow for the control of adhesive and other mechanical properties [4,5].
The use of MMA and BA for polymerization processes has been studied abundantly. Their kinetic rate coefficients and the specific phenomena caused by their presence in polymerization recipes are well known and understood [6]. EHA, on the other hand, has not been studied to the same extent. Nonetheless, the propagation rate coefficient has been studied in bulk polymerizations at lower reaction temperatures (5–25 °C) [7]. Other studies in mini-emulsion [8] and micro-emulsion [9] polymerizations provide important comparative information on kinetic behavior. For example, the kinetic behavior of EHA was shown to be similar to that of BA in emulsion polymerizations at 75 °C [10]. The production of tertiary radicals resulting from transfer to polymer reactions, mostly due to backbiting reactions, was noted. The backbiting reactions led to a lower effective propagation rate coefficient. Extrapolation of the propagation rate coefficient from the bulk polymerization conditions (25 °C) of Beuermann et al. [7] to the emulsion polymerization conditions (75 °C) resulted in differing values from that estimated in the emulsion polymerization [10]. The backbiting reactions for EHA were shown to be higher than that of BA in solution polymerizations at 70 °C [11]. Additional work in solution polymerization at low temperatures (−25–10 °C) showed a lower propagation rate coefficient than Beuermann et al. [7], leading to speculation that a possible solvent effect was present [12]. The most recent pulsed laser polymerization study in bulk by Junkers et al. [13] provides propagation rate coefficients in the temperature range 20 to 80 °C. Thus, aside from the propagation rate coefficient, detailed kinetic studies of free radical polymerization of EHA in bulk or modeling studies of such polymerizations are rare. The present contribution uses some recent data published by some of the co-authors to begin a more comprehensive look at modeling EHA-based copolymers [14]. More recent studies involving EHA in living polymerizations underlie the need for this kinetic modeling [15,16,17,18].
Diffusion-controlled (DC) effects, particularly the auto-acceleration effect which manifests at 30–50% monomer conversions, have proven to be of great importance for reliable modeling results in free-radical polymerization (FRP) [19]. Monomers that polymerize by FRP have been classified into two types, depending on the effect that DC-termination has on the polymerization rate [20]. Class “A” monomers, of which BA is a typical example, show a notorious increase in polymerization rate during the full conversion range. On the other hand, Class “B” polymers, of which MMA is a representative case, present a “plateau region” at low conversions, followed by the previously mentioned acceleration up to high conversions [21]. EHA was not included in that classification since it became important in more recent years, and it is usually polymerized in emulsion and solution processes. Therefore, DC effects in bulk polymerization of EHA have not been reported nor fully explored. In this contribution, DC effects have been considered in the copolymerization of BA, MMA and EHA.
Backbiting and the formation of tertiary radicals have been reported and measured in the polymerization of several acrylates [22,23], mainly BA, methyl acrylate (MA), EHA and dodecyl acrylate (DA). Backbiting for BA was included in our modeling approach because it has been reported to be important [24,25]. Although MMA is a widely studied monomer, there are no reports that we are aware of where backbiting is important for this monomer. In the case of EHA, there is evidence that backbiting may become important at temperatures in the range of 100 to 140 °C [23]. Since the experiments used in our study were conducted at 60 °C, it is well justified to neglect backbiting for EHA.

2. Experimental Section

The polymerization conditions and experimental data used herein are from a previous experimental study of the addressed systems [14]. Even though monomers were purified to remove inhibitors by passing them through an inhibitor removal column, significant inhibition periods were observed in all polymerizations. This result may be attributed to residual oxygen which was already present in the glass ampoules where the polymerizations were carried out. Since our model did not include this phenomenon, the experimental data were slightly modified to remove the effect. The correction procedure consisted of fitting a predefined function to the conversion-time profiles, extrapolating to zero conversion and adjusting data to the new zero condition. An example of this procedure is shown in Figure 1: Once the zero-conversion time was calculated with the empirical function (a logarithmic function in the example of Figure 1), the times corresponding to the experimental data were corrected by subtracting the calculated induction times to the recorded experimental ones. Each experimental data has its own induction time since it is virtually impossible to determine the exact amount of residual oxygen for every ampoule. The fitting functions were logarithmic, polynomial or linear.
Adjusted time = Original time − Estimated induction time
The polymerizations were carried out using azobisisobutyronitrile (AIBN), at a concentration of 0.08 wt.% in glass ampoules submerged in a temperature-controlled oil bath set to 60 °C, so that isothermicity can be assumed. Near-isothermal conditions have been reported for ampoule reactors of high surface to volume ratios at even higher AIBN concentrations [26]. Experimental monomer feed compositions for the three systems studied in this contribution (BA/EHA, MMA/EHA, BA/EHA/MMA) are detailed in Table 1, Table 2 and Table 3. The induction times fitting functions are summarized in Table 4.

3. Model Development

Table 5, Table 6 and Table 7 show the reaction steps used in PREDICI® (version 11.Hilbert.4, Computing in Technology, CiT, Rastede, Lower Saxony, Germany), a software commonly used in polymer science and engineering [27,28,29]. The copolymerization schemes for the three studied systems (BA/EHA, EHA/MMA, BA/EHA/MMA) are based on conventional bulk free-radical copolymerization kinetics, but takeinto consideration the nature of each system, such as the occurrence of certain side reactions (e.g., backbiting for BA [25], the presence of additional cross reactions for the terpolymer, and building on previous knowledge on MMA and BA homo- and copolymerizations [19,20,25].

3.1. Initiation

The initiation reaction involves two steps, as shown in Equations (2) and (3).
I→2fI
I + Mi→Pi(1)
As with many other initiators, AIBN decomposes into two initiator primary free radicals (I). The Arrhenius expression for the initiator decomposition kinetic rate coefficient is given by Equation (4) [6,31].
ki (s−1) = 1.07E14exp(−1.515 × 10⁴/T)
The initiator primary free radicals react with either of the monomers producing polymer radicals of each type and size 1. Since not all initiator molecules produce primary free radicals due to side reactions, an efficiency factor (f) for initiation is required. One explanation for the use of f is the so-called “cage effect”, which allows us to avoid considering side reactions such as termination between primary free radicals [35]. A value of f = 0.58 was used [30].

3.2. Propagation

Since the polymerization scheme is based on the terminal model [1], four propagation and four-chain transfer to monomer reactions are involved. The self-propagation kinetic rate coefficients for MMA and BA are shown in Equations (5) and (6) [6,31]. The cross-propagation kinetic rate coefficients are expressed in terms of reactivity ratios, as detailed in Section 3.4.
kpMMA(L mol−1 s−1) = 4.917E5exp(−4.353 × 10³/T)
kpBA(L mol−1 s−1) = 2.767E9exp(−9.630 × 10³/T)
For the EHA, the self-propagation kinetic rate coefficient and pulsed laser polymerization (PLP) experimental data [7] were analyzed and adjusted to an Arrhenius relationship, leading to Equation (7). The value for kpEHA used in our simulations (Table 5) is consistent (order of magnitude agreement) with values reported in other studies for such parameters at the same temperature [13].
kpEHA(L mol−1 s−1) = 9.00E6exp(−3.694 × 10³/T)

3.3. Chain Transfer

Kinetic rate coefficients for chain transfer to MMA and BA are given by Equations (8) and (9) [6,31].
kfMMA(L mol−1 s−1) = 1.55E4exp(−7.475 × 10³/T)
kfBA(L mol−1 s−1) = 1.55E3exp(−7.475 × 10³/T)
Unfortunately, there was no reliable information in the literature for chain transfer to EHA kinetic rate coefficients in bulk polymerization. A value of kfBA = 3.5 L mol−1 s−1 at 60 °C was estimated in this contribution.
The cross-chain transfer kinetic rate coefficients were obtained using reactivity ratios as in the case of propagation.

3.4. Cross-Propagation and Cross-Chain Transfer

Reactivity ratios, defined by Equation (10), were used to calculate the cross-parameters.
r 12 = k p 1 k p 12 = k f 1 k f 12 ;   r 21 = k p 2 k p 21 = k f 2 k f 21
The reactivity ratios for BA/EHA, MMA/EHA and BA/EHA/MMA used in our calculations are summarized in Equations (11)–(15), and were taken from the composition results obtained from Gabriel and Dubé [14] (at 60 °C) using a computational package developed in MATLAB [36].
BA/EHA
r 12 = k B A k E H A = k p 1 k p 12 = k f 1 k f 12 = 0.994 ;   r 21 = k E H A k B A = k p 2 k p 21 = k f 2 k f 21 = 1.621
MMA/EHA
r 12 = k M M A k E H A = k p 1 k p 12 = k f 1 k f 12 = 1.496 ;   r 21 k E H A k M M A = k p 2 k p 21 = k f 2 k f 21 = 0.315
BA/EHA/MMA
r 12 = k B A k E H A = k p 1 k p 12 = k f 1 k f 12 = 0.994 ;   r 21 = k E H A k B A = k p 2 k p 21 = k f 2 k f 21 = 1.621
r 13 = k B A k M M A = k p 1 k p 13 = k f 1 k f 13 = 2.022 ;   r 31 = k M M A k B A = k p 2 k p 31 = k f 2 k f 31 = 0.343
r 32 = k M M A k E H A = k p 1 k p 32 = k f 1 k f 32 = 1.496 ;   r 23 = k E H A k M M A = k p 2 k p 31 = k f 2 k f 31 = 0.315
The reliability of reactivity ratios is fundamental for the accurate prediction of copolymer composition. As stated in the Mayo-Lewis equation, reactivity ratios are a measure of a monomer’s preference and tendency to bond [35]. In the case of cross chain transfer to monomer reactions, since the reacting species are the same as in cross propagation, it was assumed that the cross chain transfer reactions can be calculated using the same reactivity ratios. This assumption does not have a strong theoretical background, but it allowed us to reduce the number of estimated parameters.

3.5. Backbiting of BA and Reactions with Mid-Chain Tertiary Radicals

Intramolecular chain transfer to polymer in BA polymerization is known to be important [37,38]. Mid-chain tertiary polymer radicals are formed from backbiting. They are quite stable and can propagate, transfer and terminate as any other polymer radicals. Backbiting and tertiary radical propagation, as well as their corresponding kinetic rate coefficients, are given by Equations (16)–(19) [25].
Tertiary radical formation:
P 1 ( s )   k b b Q 1 ( s )
kbb (L mol−1s−1) = 3.87 × 10⁶exp(−2.299 × 10³/T)
Tertiary radical propagation:
Q 1 ( s ) + M 1   k p 1 t e r t P 1 ( s + 1 )
kp1tert(L mol−1 s−1) = 59.9exp(−64.2/T)
Cross-propagation kinetic rate coefficients were also obtained from BA/EHA and BA/EHA/MMA reactivity ratios, which are given by Equations (20) and (21), respectively.
r 12 = k B A k E H A = k p 1 k p 12 = k f 1 k f 12 = 0.994 ; k p 12 t e r t = k p 1 t e r t r 12 ; k f 12 t e r t = k f 1 t e r t r 12
r 13 = k B A k M M A = k p 1 k p 13 = k f 1 k f 13 = 2.022 ; k p 13 t e r t = k p 1 t e r t r 13 ; k f 13 t e r t = k f 1 t e r t r 13
There were no estimates of k f 1 t e r t reported in the literature. It was therefore estimated in this study ( k f 1 t e r t = 6 ).

3.6. Termination

Termination by combination and disproportionation kinetic rate coefficients for BA and MMA copolymerizations were also taken from WATPOLY, as shown in Equations (22) and (23) [6,31].
ktcMMA + ktdMMA(L mol−1 min−1) = 4.68 × 10⁸exp(−8.73 × 10²/T)
ktcBA + ktdBA(L mol−1 min−1) = 5.88 × 10⁹exp(−7.01 × 10²/T)
The ratio between both termination kinetic rate coefficients for MMA and BA copolymerizations is given by Equation (24) [14].
k t c M M A k t d M M A = 0.8275 ;   k t c B A k t d B A = 0.7000
Termination by combination and disproportionation kinetic rate coefficients for EHA were estimated in this work, obtaining the values shown in Equations (25) and (26).
k t c E H A + k t d E H A = 5 × 10 8
k t c E H A = k t d E H A = 2.5 × 10 8
The missing “cross-termination” constants were calculated using the geometric average for every specific case, as shown in Equation (27).
k t i j = k t i k t j
In the case of bimolecular radical termination including mid chain radicals, Q 1 ( s ) , it was assumed that ktBA is independent of radical type [25,39]. More experimental or theoretical studies on termination of tertiary radicals to provide a sounder estimation of ktBA would be useful. Until then, the assumption of independence of radical type is needed to simplify our parameter estimation approach. Therefore, the termination kinetic rate coefficients for such cases are the same as “cross-termination”.

3.7. Diffusion-Controlled Effects

When implementing our model and trying to fit our experimental data, it was evident that diffusion-controlled (DC) effects were important. Since MMA was one of the monomers present in our reacting systems, this was not surprising [21,30]. All the reactions involving polymer molecules were assumed to be diffusion-controlled. DC effects were addressed using free-volume theory [25,40], as shown in Equation (28), where β is a free volume parameter andvf is fractional free volume, defined by Equation (29). Subscript “0” stands for initial conditions. T and Tgi are the reaction temperature and glass transition temperature for component i (monomer or polymer of each of the possible species, BA, EHA or MMA); α i is the expansion coefficient for species i, Vi is the volume of species i, and Vtis total volume.
k i = k i o exp [ β ( 1 υ f 1 υ f o ) ]
υ f = i = 1 #   o f   c o m p o n e n t s [ 0.025 + α i ( T T g i ) ] V i V t
The free volume parameters used in our calculations for the three copolymerization systems are summarized in Table 8 and Table 9. As observed in Table 9, different β values were required, even for similar polymer molecules, in order to explain the behavior observed experimentally over a wide range of (binary) copolymer and terpolymer compositions. This is not surprising if one considers that the material properties of the reacting mixture, such as viscosity [41], depend on molecular weight development but also on copolymer content in the reactive mass and quite likely, copolymer composition.
It is observed in Table 9 that β for kinetic rate coefficients with the same name differs from system to system. This is a consequence of the nomenclature used for each system. For instance, kp1 refers to BA in the case of copolymerization of BA and EHA, whereas the same parameter is related to MMA in the copolymerization of MMA and EHA. Also, DC effects in both propagation and termination reactions were required for the copolymerization of BA and EHA whereas only diffusion-controlled termination was needed in the case of copolymerization of MMA and EHA. High values of β result in an earlier and more pronounced decrease of the corresponding kinetic rate coefficient, while kinetic rate coefficients where no DC effects are considered remain constant throughout the polymerization.
In general, the presence of MMA causes higher polymerization rates. This behavior can be captured by the model by increasing β for termination or decreasing the corresponding β parameter for the propagation reaction. In other words, the βtp ratio for MMA must be greater (compared to the other monomers) for accurate predictions. The same trend applies for the “cross” kinetic rate coefficients when MMA is involved; βtp is also fundamental to tune the “onset” of the auto-acceleration effect. As discussed in the following section, it turned out that the only way to capture the behavior of the experimental data (particularly the conversion versus time profiles) was to include DC effects in most of the reactions and using different β values for similar polymer molecules.

3.8. Parameter Estimation Strategy

Most of the kinetic rate coefficients used in our study came from reports available in the literature. The kinetic rate coefficients estimated by us are summarized in Table 10. The other estimated parameters are the βs indicated in Table 9. As explained earlier, all the parameters estimated in this work are related to EHA. The estimation procedure consisted of a combination between a careful literature review, detailed parameter sensitivity analyses and the use of educated guesses (trial and error guided from the information gained from the literature review and the parameter sensitivity analyses). An example of the parameter estimation strategy is shown in Appendix A.
In the case of bimolecular radical termination between polymer radicals terminated in EHA monomer units, it was assumed that ktcEHA = ktdEHA. This is of course an approximation, but it is sufficient since, in many instances, in our model it is the total termination kinetic rate coefficient (kt = ktd + ktc) which is needed.
Regarding chain transfer to a monomer, our parameter sensitivity analyses showed that kfEHA, kftertEHA and kftertMMA had a negligible effect on the polymerization rate, but that reaction is important for molecular weight development. Thus, initial guesses for these parameters were assigned order of magnitude estimates, based on values of that parameter for other monomers, and they were fine-tuned using molecular weight development experimental data. Our parameter estimation strategy included addressing the BA/EHA and MMA/EHA copolymer systems first, and then proceeding with the terpolymer case. Although we could get fairly good (order of magnitude) overall predictions of the polymerization rate, copolymer composition and molecular weight development for most of the cases studied by adjusting the intrinsic kinetic rate coefficients, the reproduction of unusual behavior (e.g., opposite trends in the conversion-time profiles when changing feed composition, overlap of profiles in certain instances, for system MMA/EHA) was possible only if strong DC effects (large β values) were used in some cases.

4. Results and Discussion

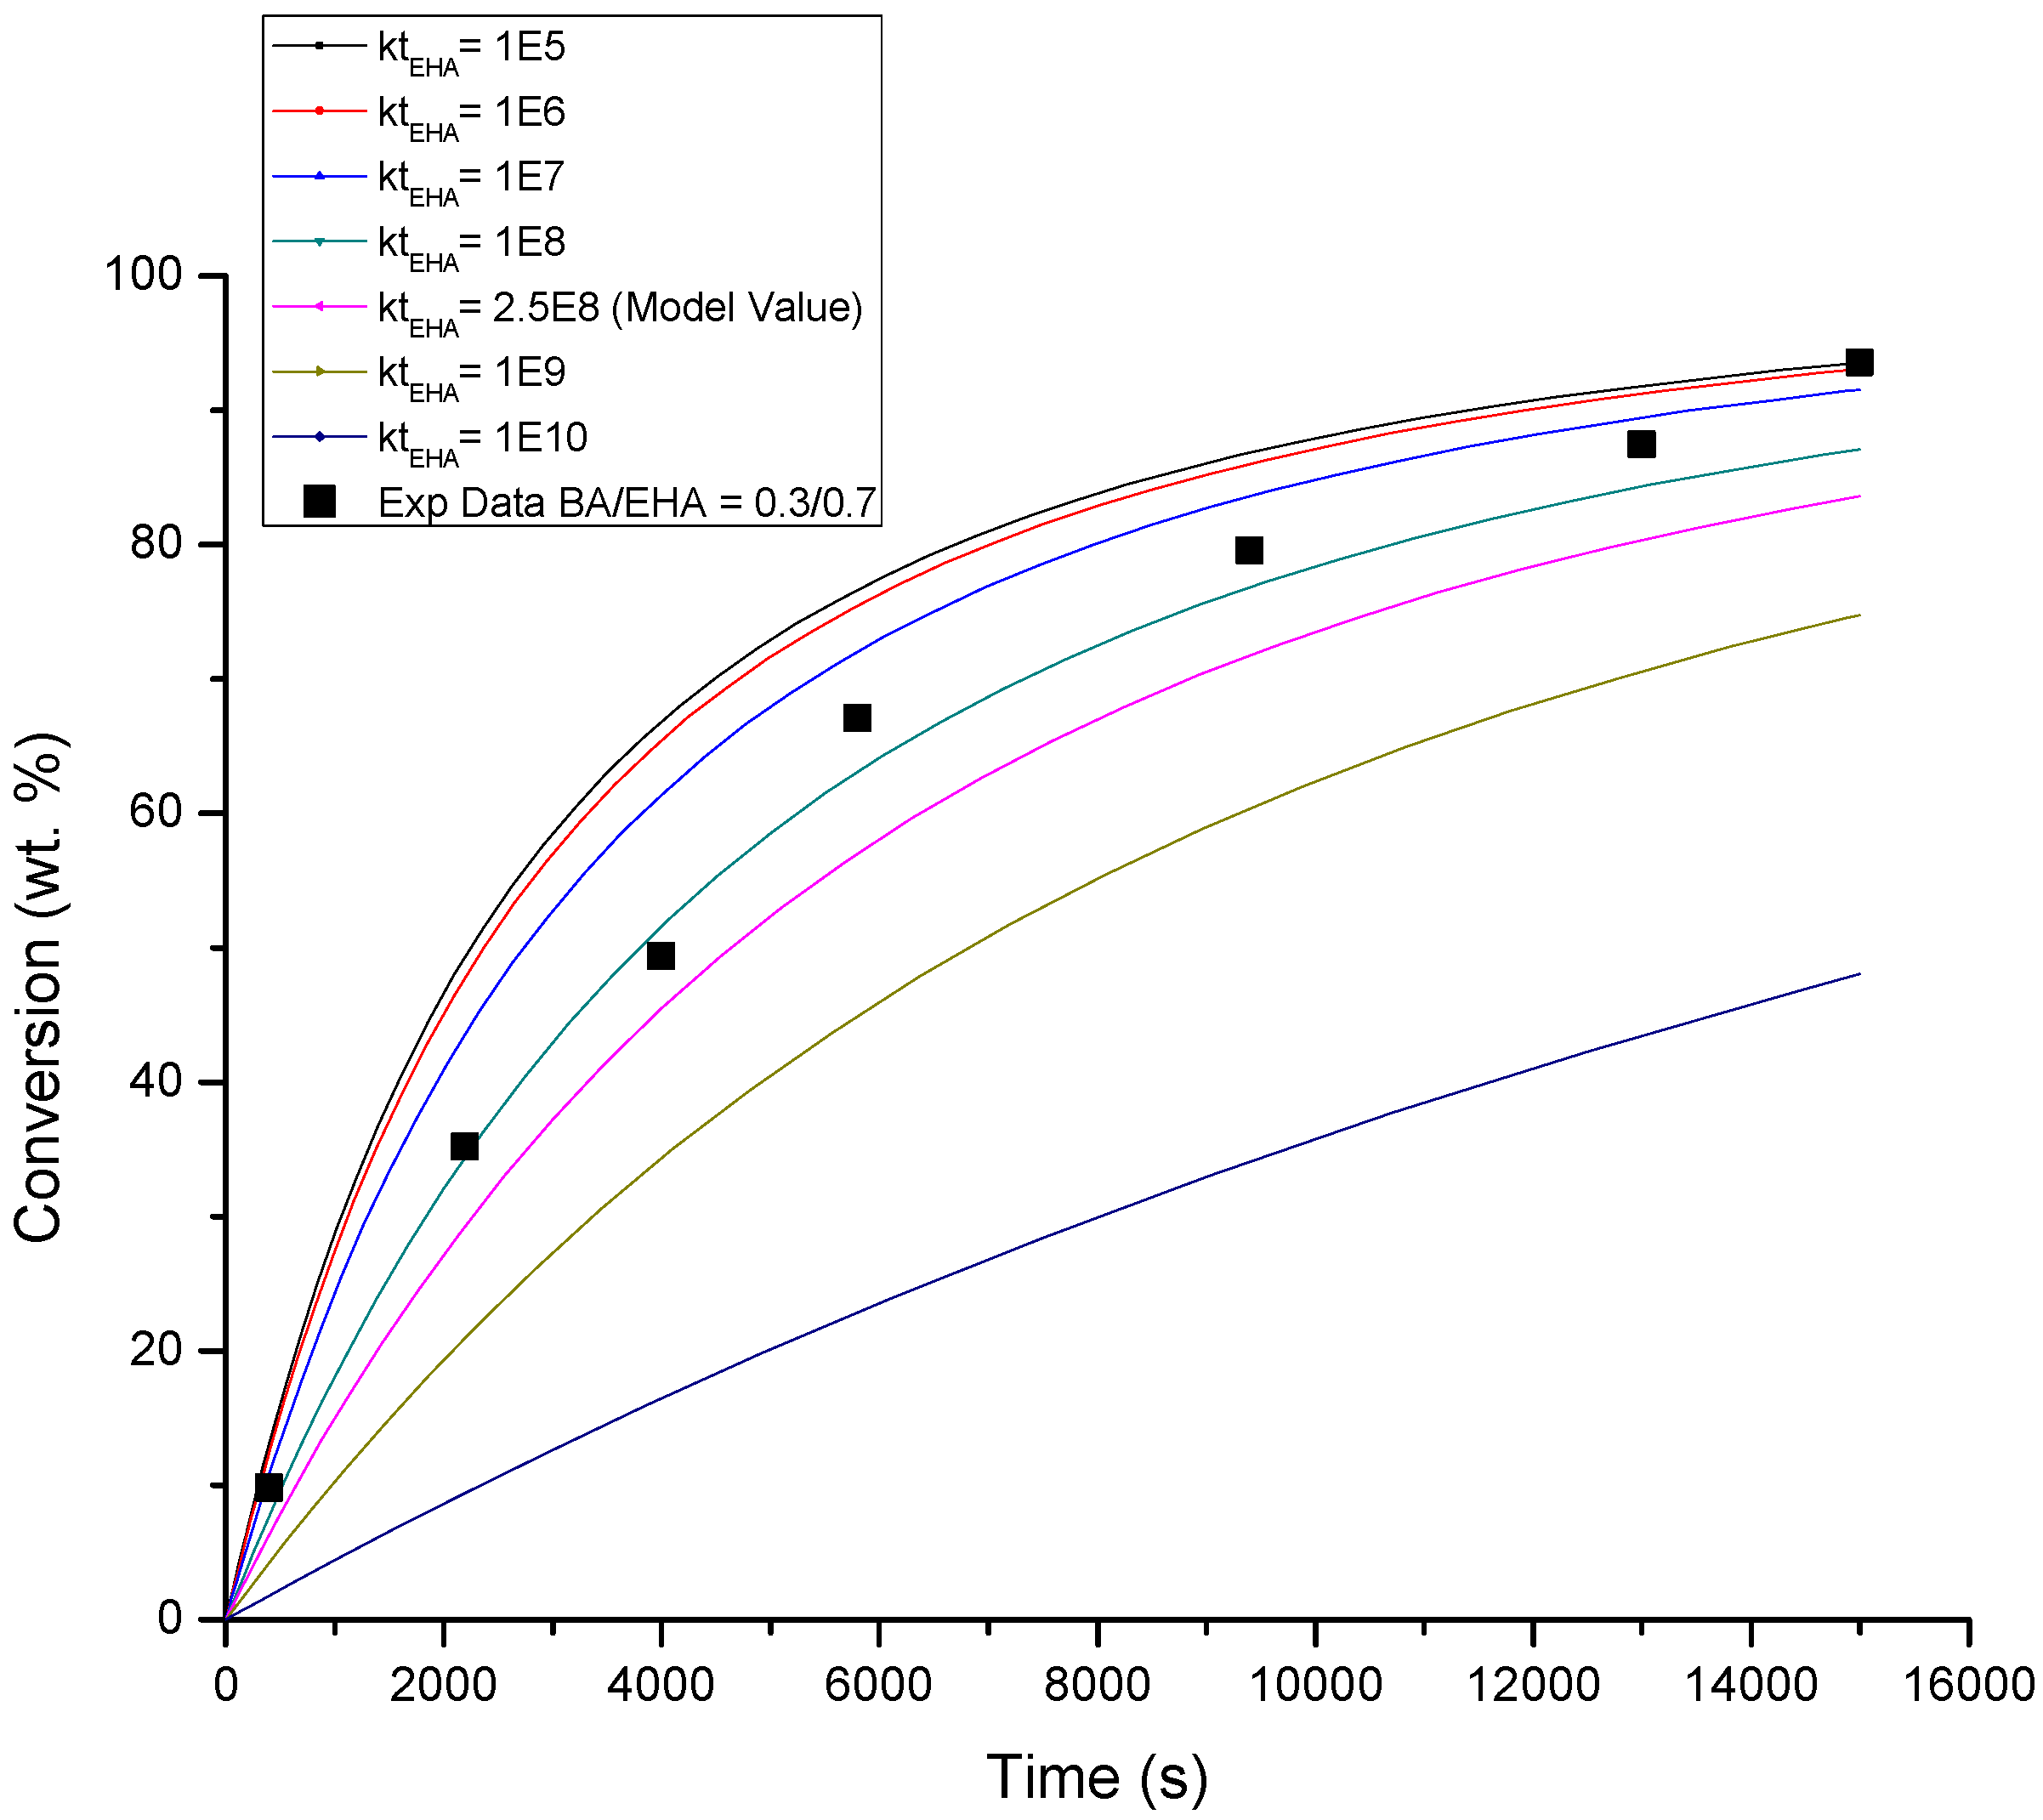
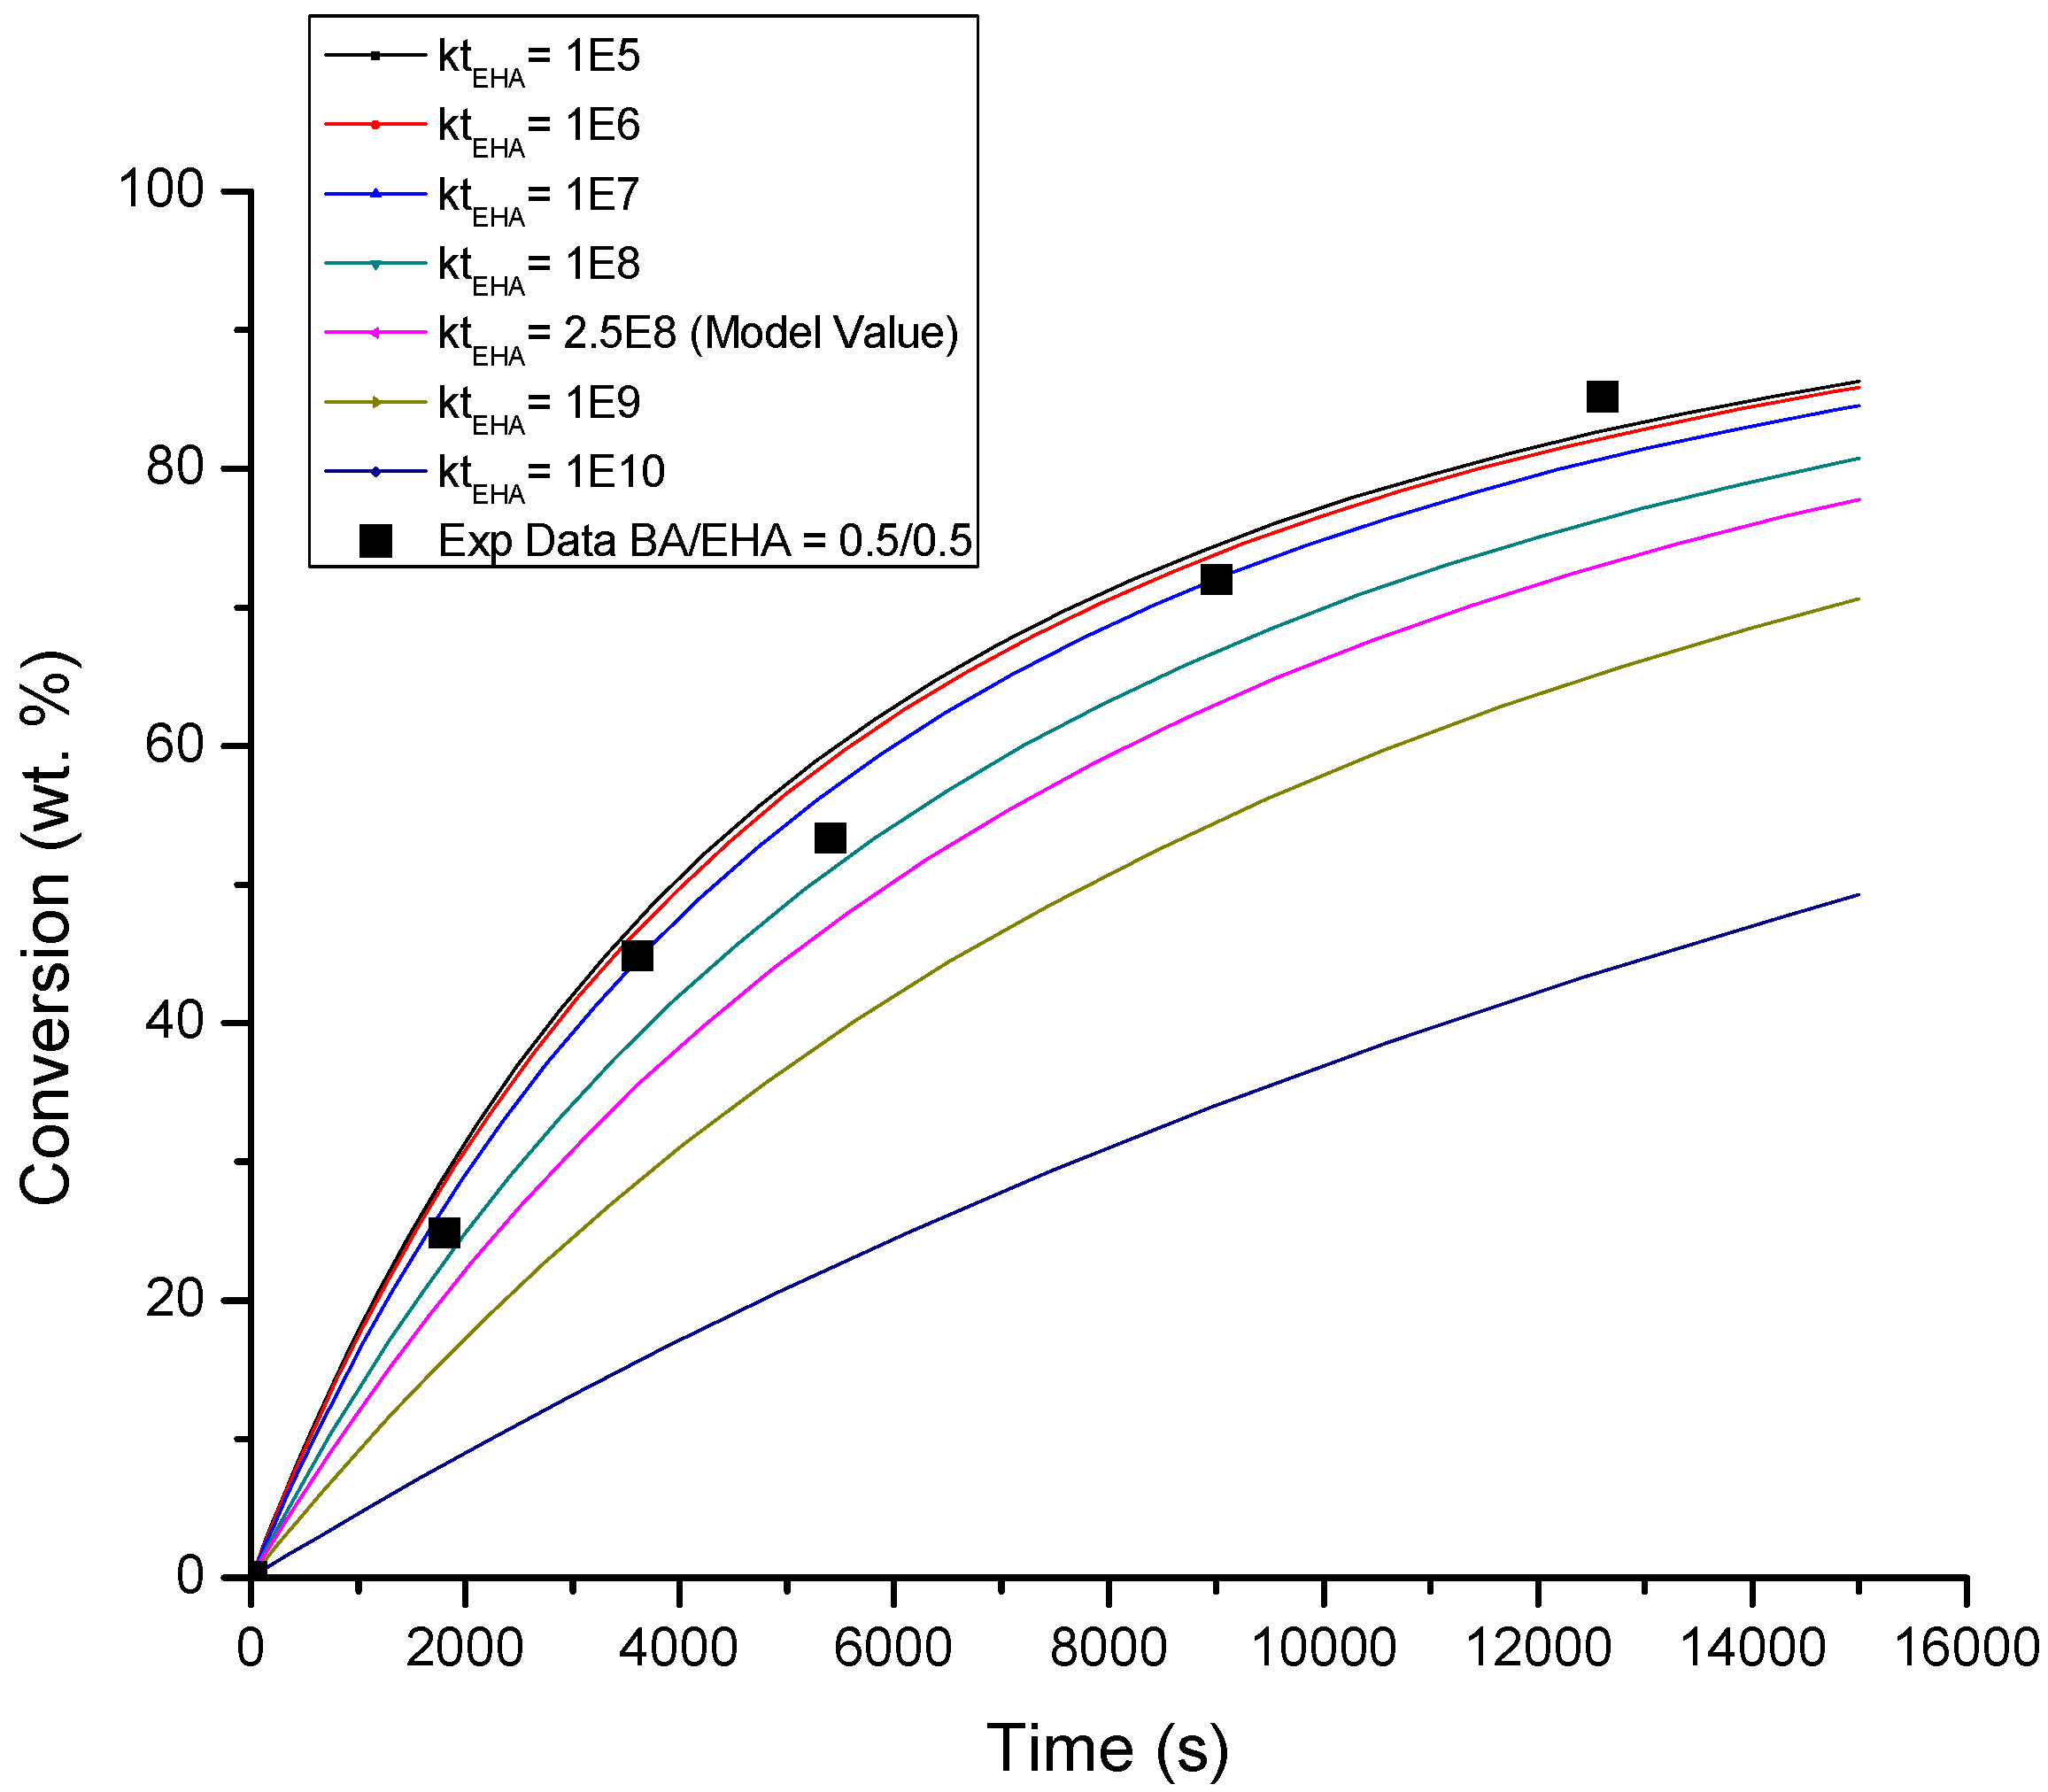
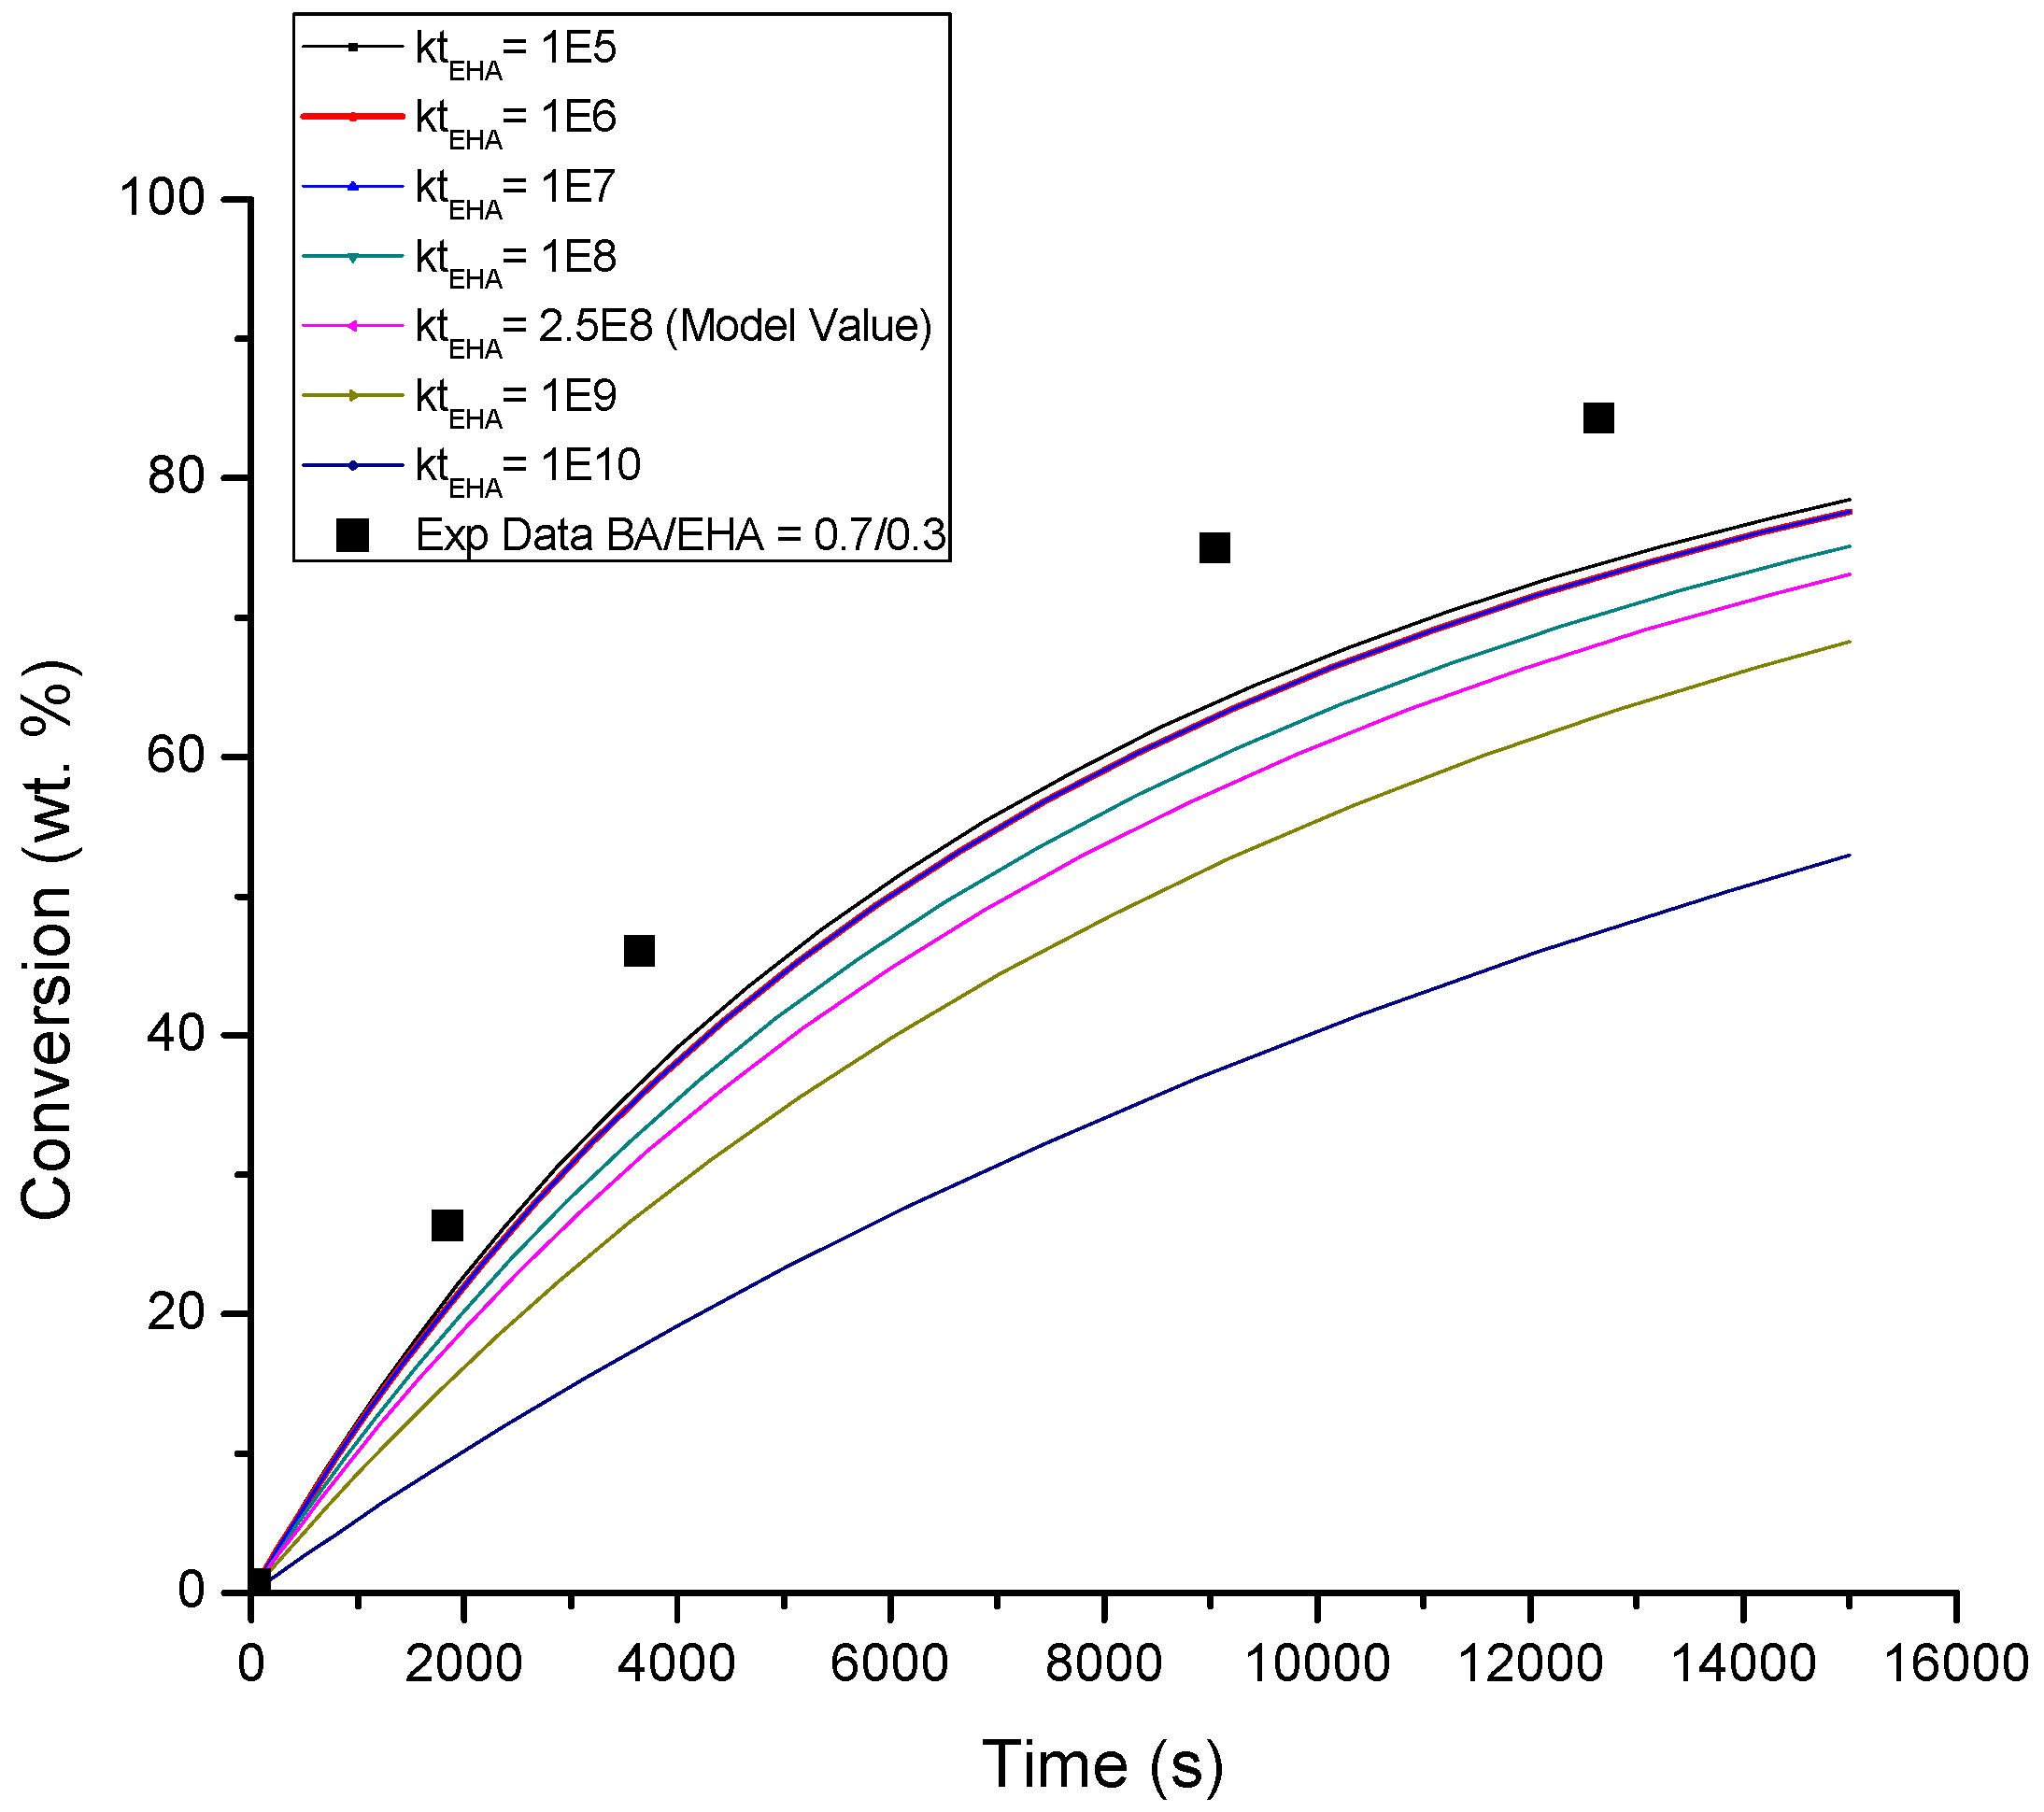
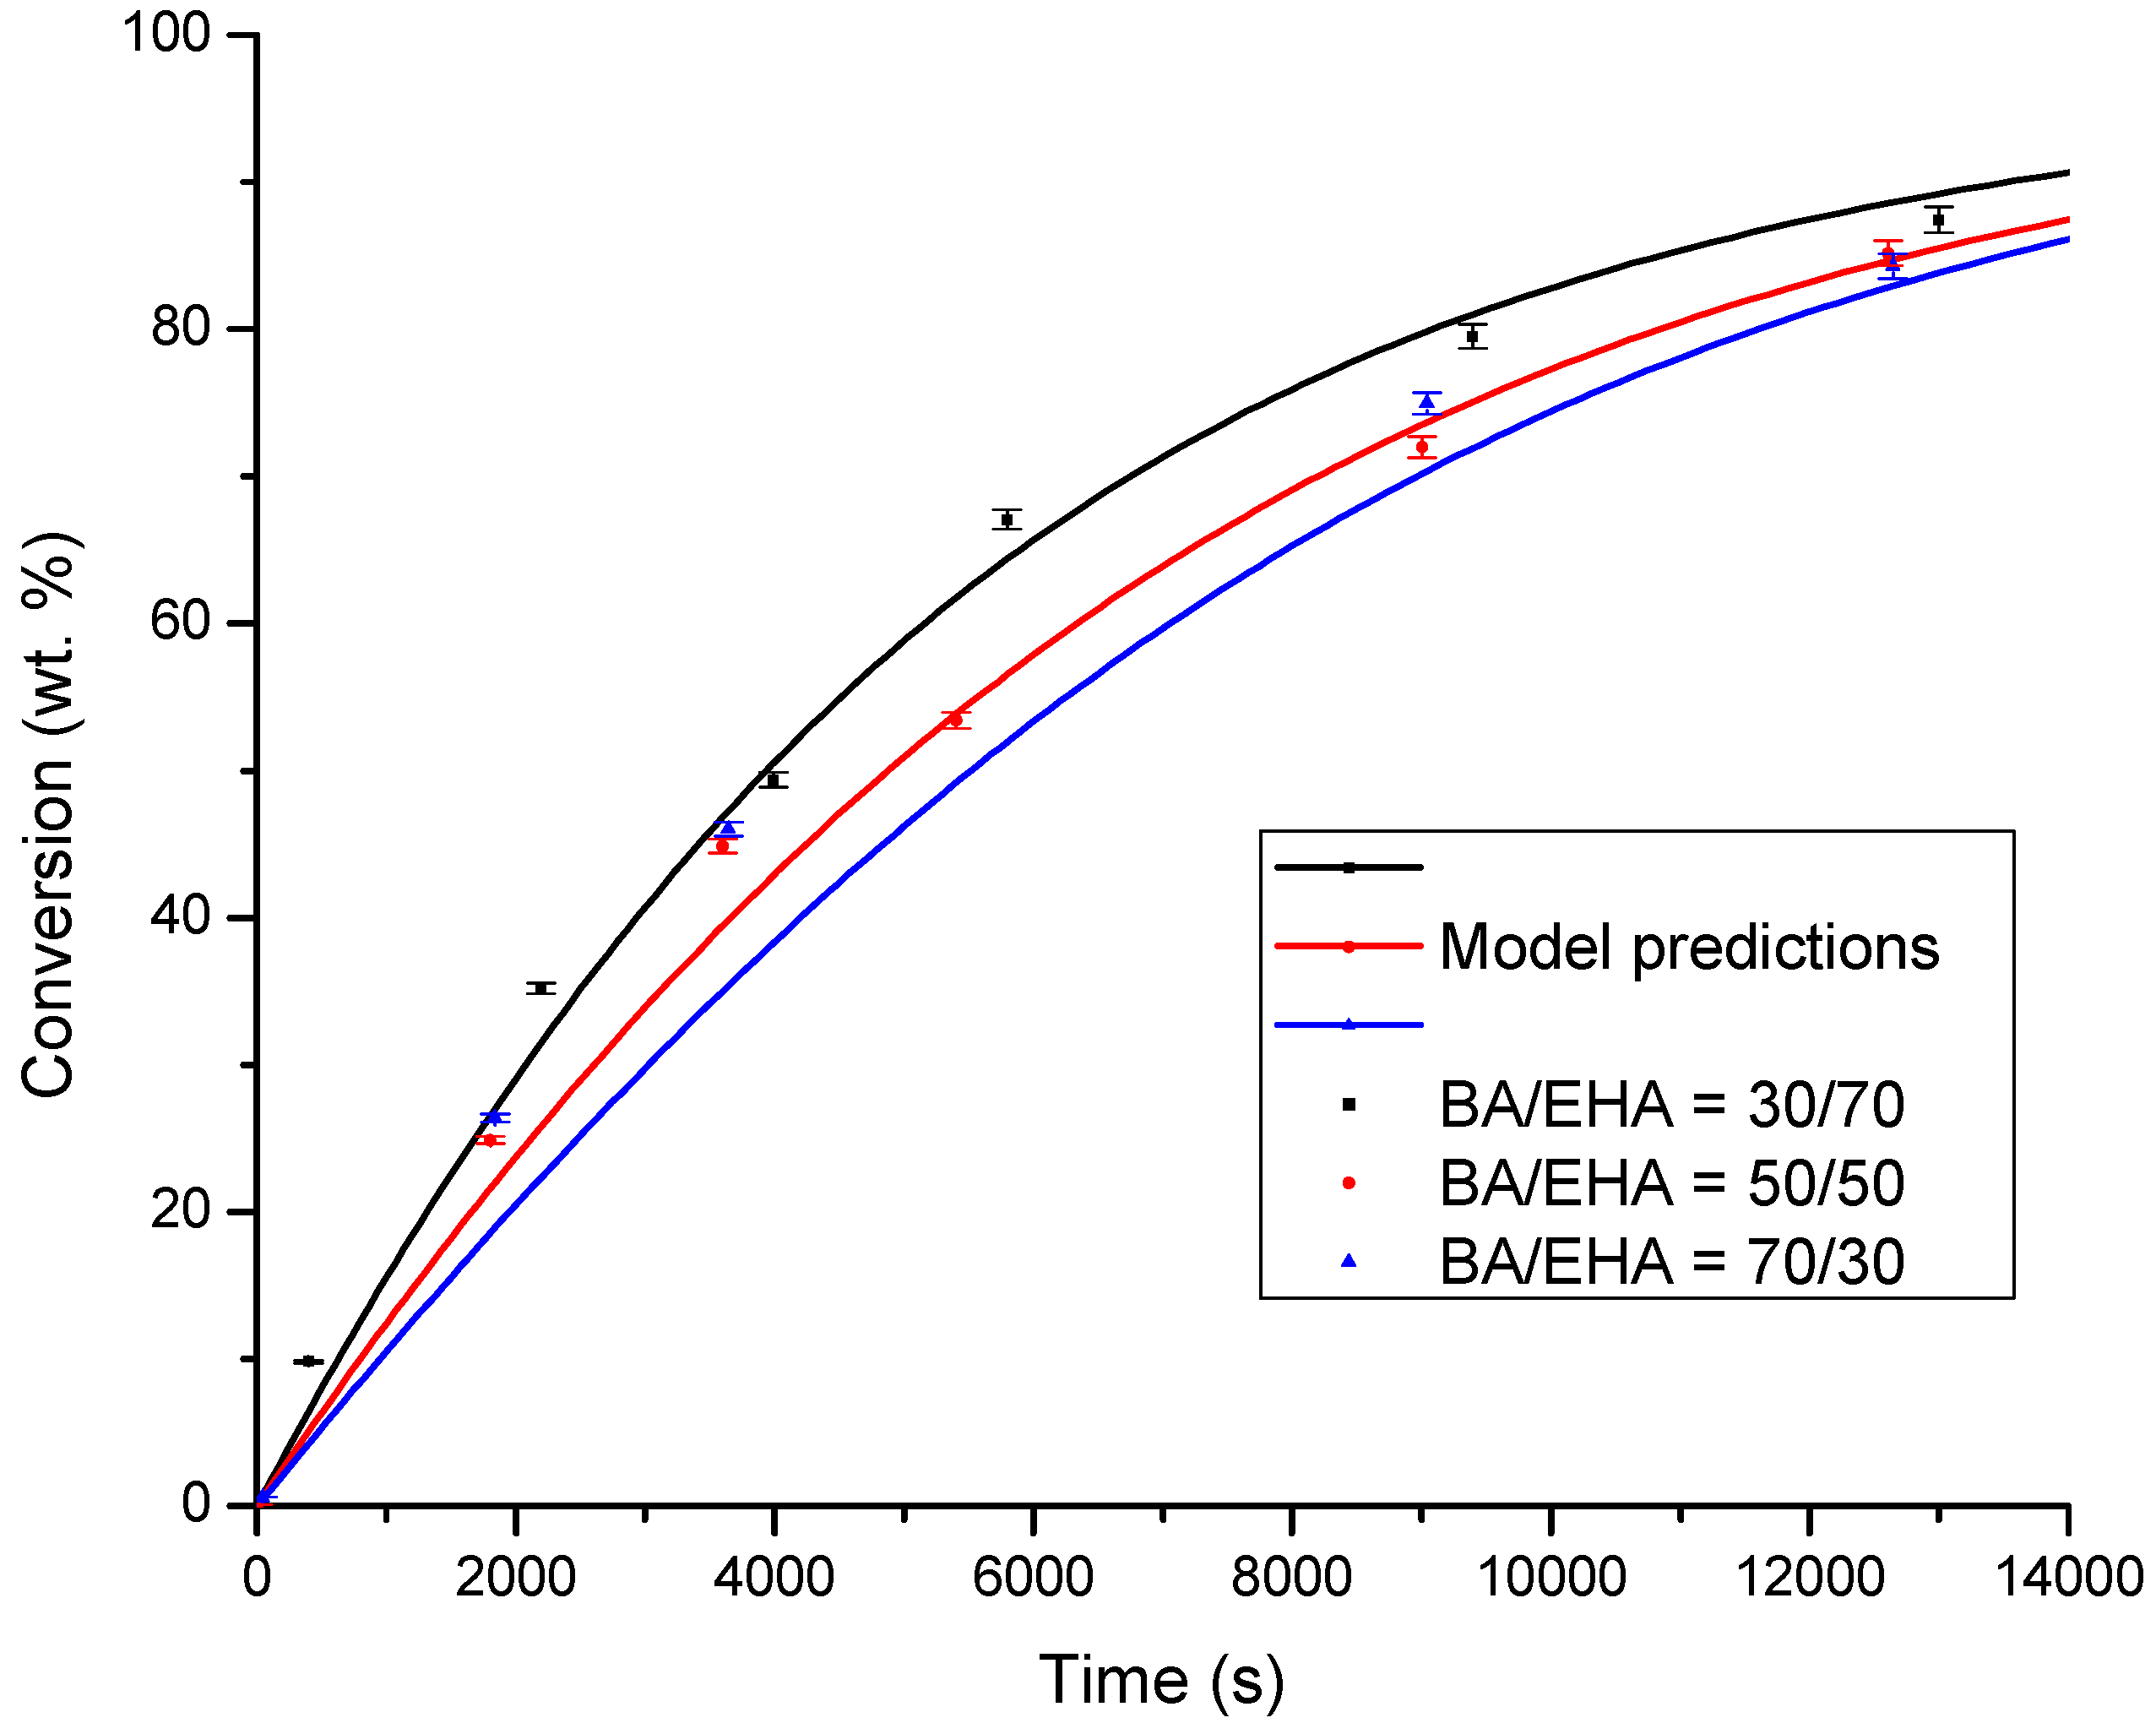
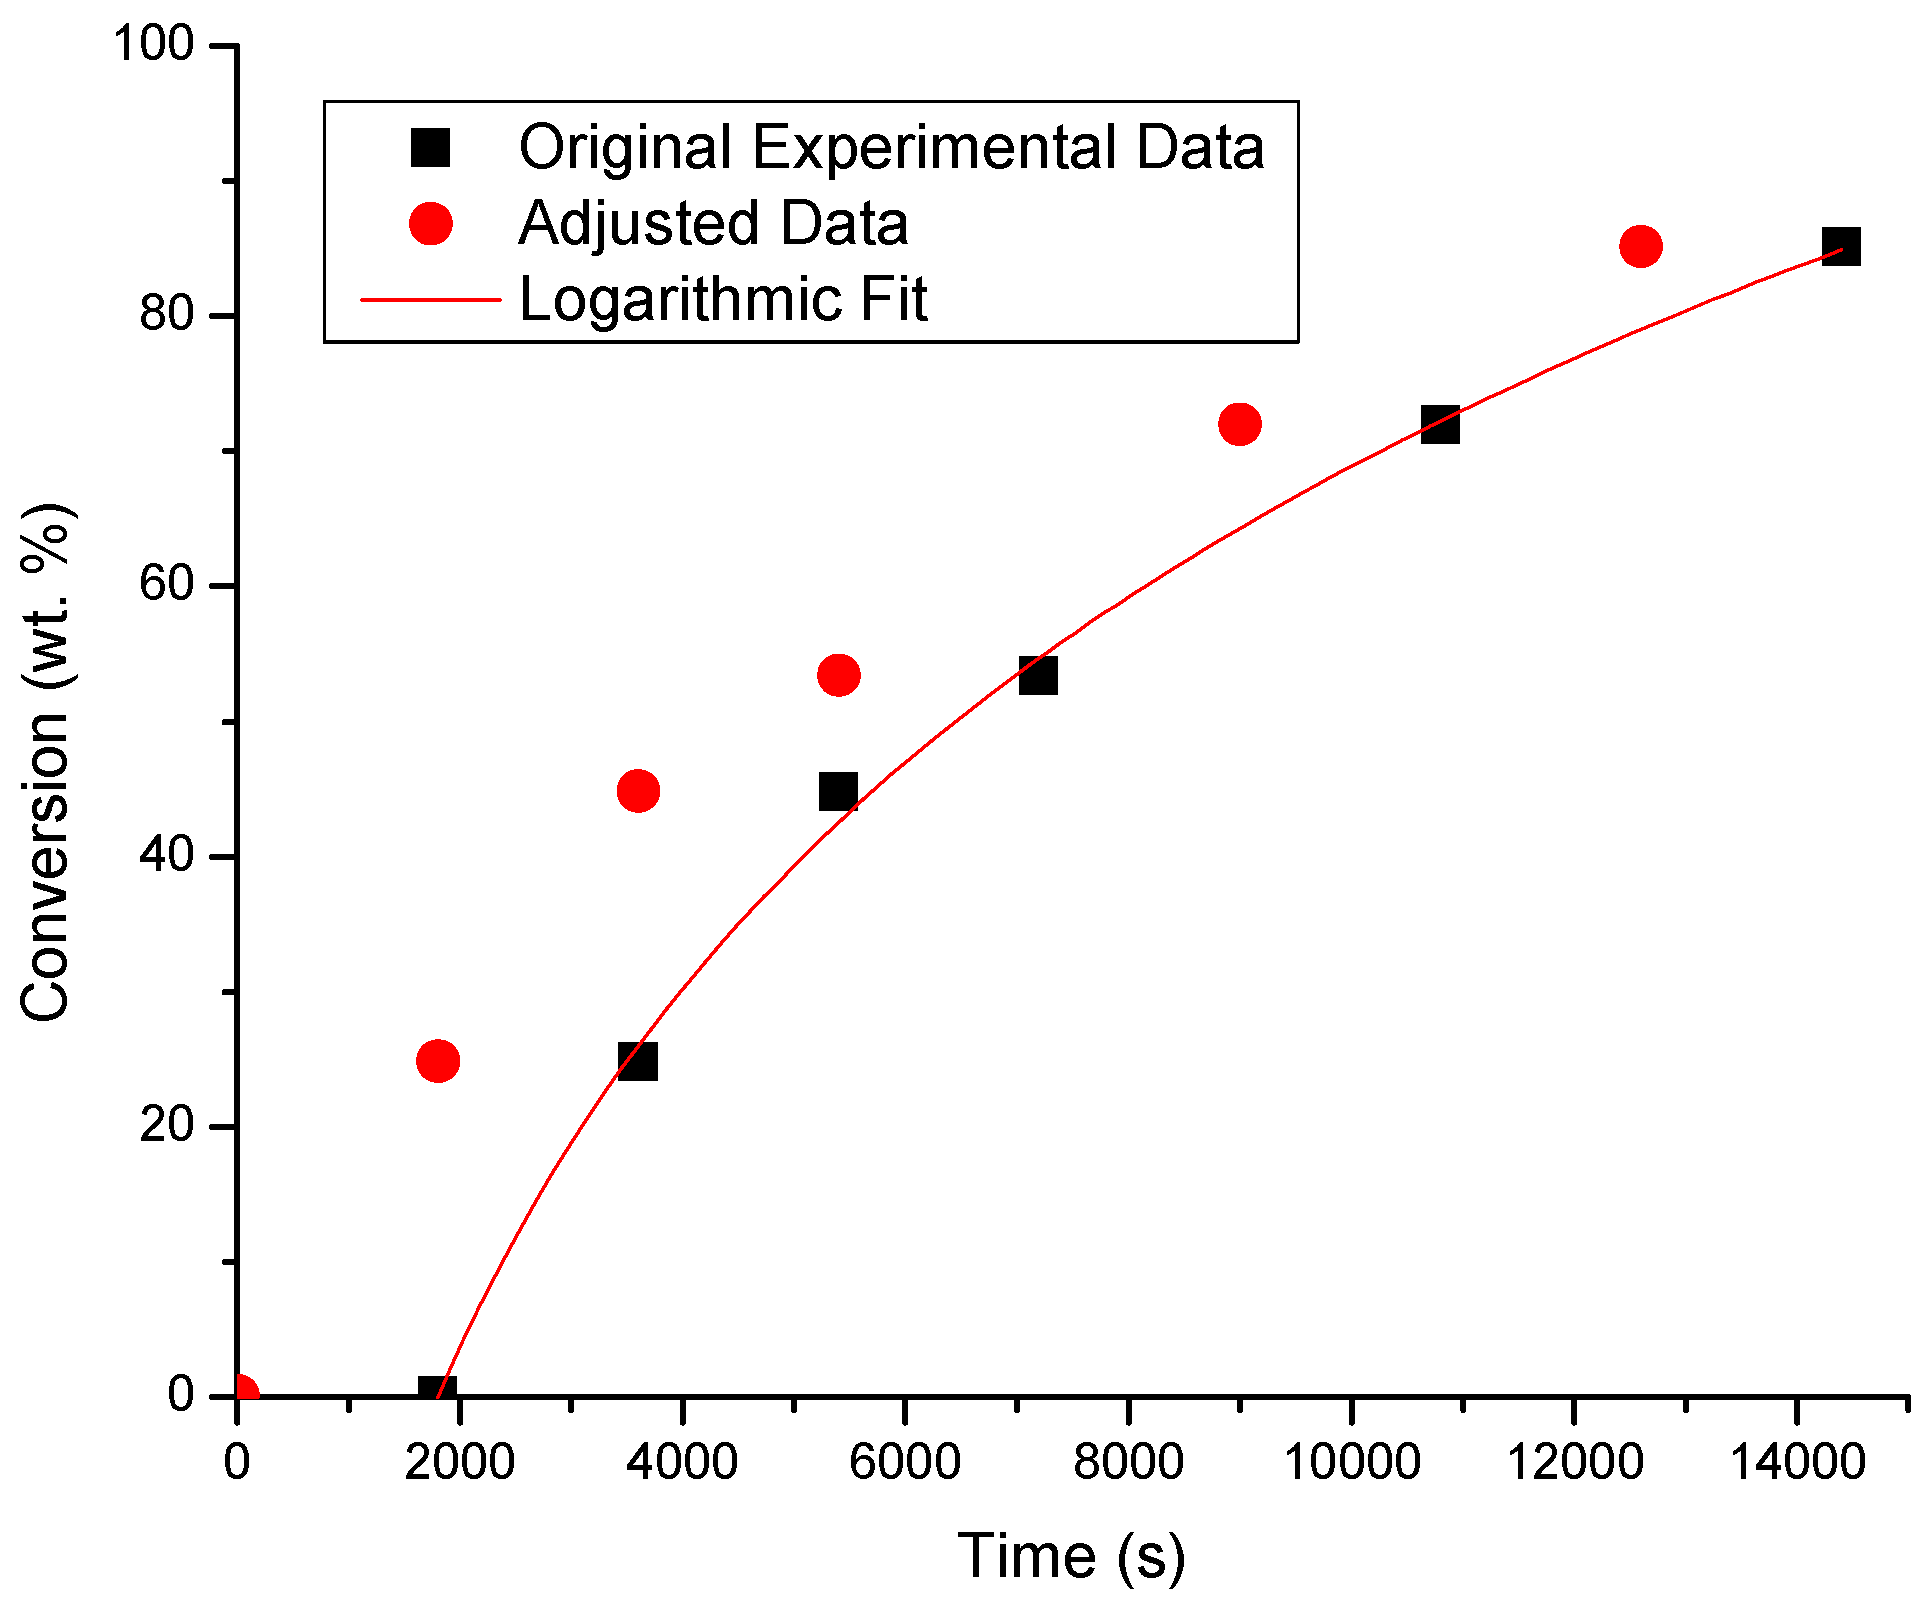
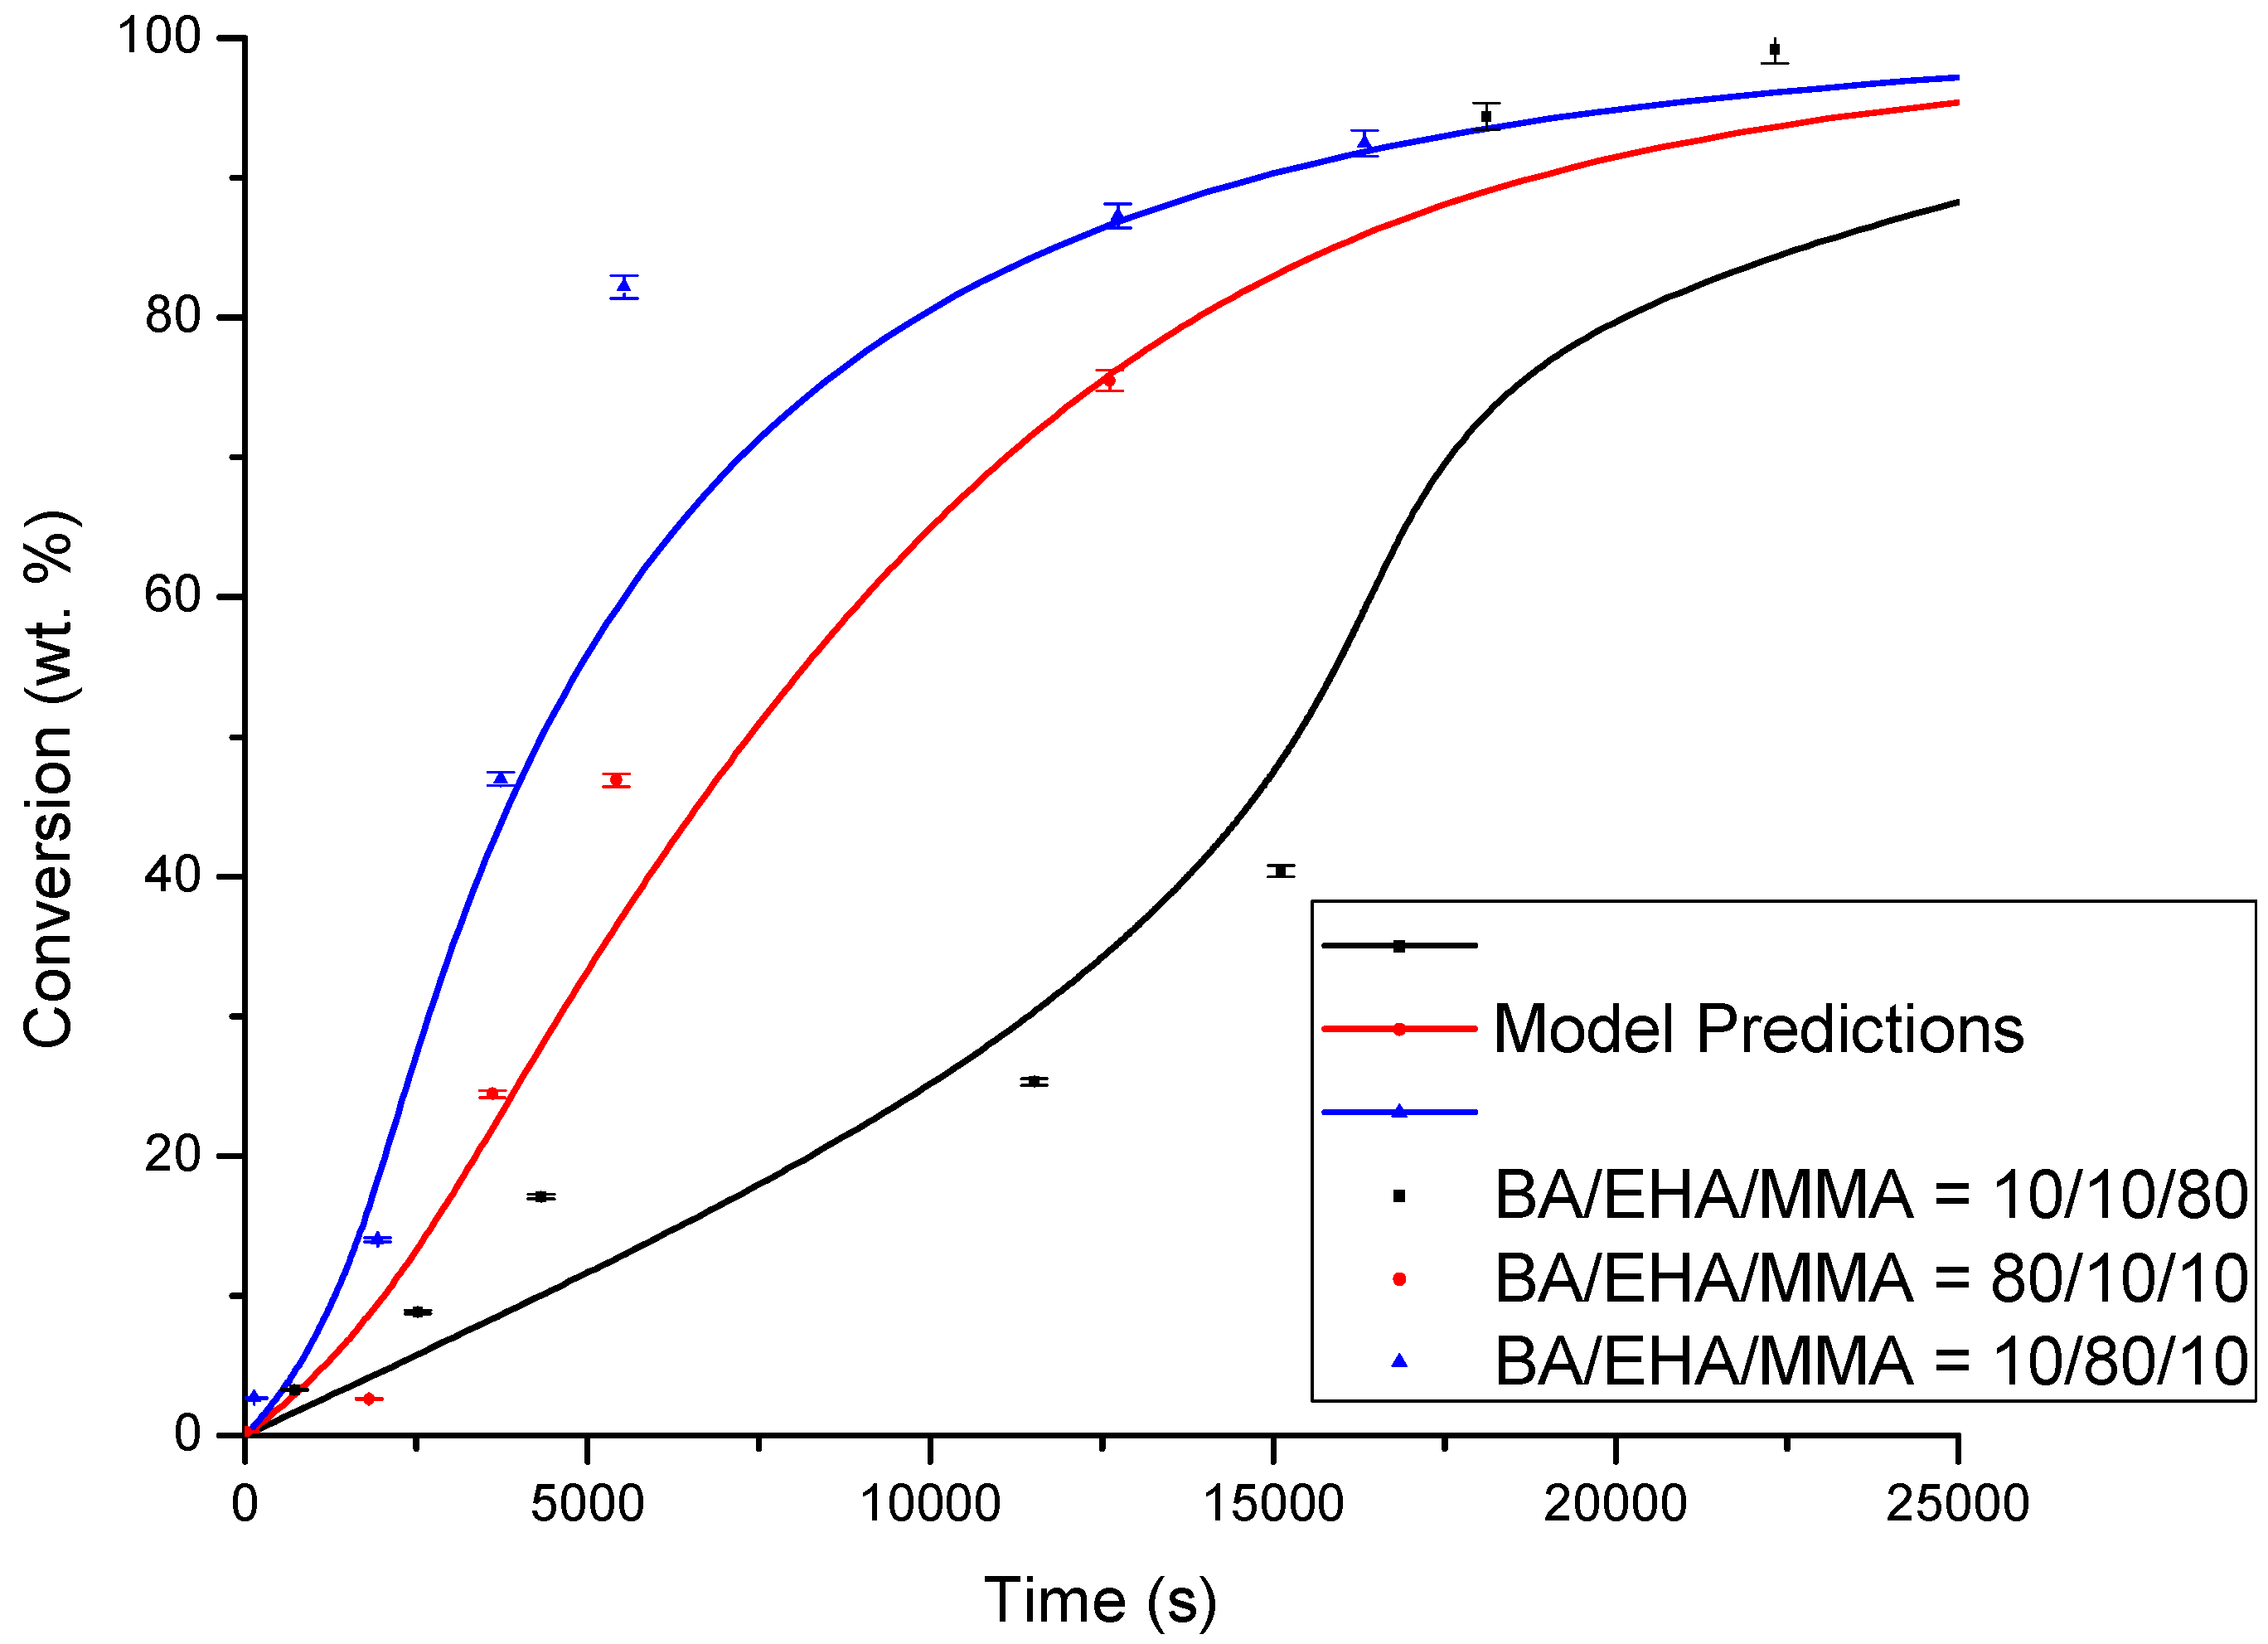
4.1. Conversion versus Time Profiles

As observed in Figure 2, Figure 3 and Figure 4, good agreement between experimental data and calculated profiles of conversion versus time was obtained for all the conditions studied of the three copolymerization systems analyzed in this contribution. It is also observed from the experimental profiles for the three reacting systems that the polymerization rate is higher, and higher conversions are reached when EHA is present in a major proportion. This is consistent with the fact that kp for EHA turned out to be the highest for the three monomers considered in this study.
If one compares the BA/EHA and MMA/EHA copolymerization systems, as shown in Figure 2 and Figure 3, it is observed that BA polymerizes faster than MMA and EHA polymerizes faster than BA. As observed in the previous section, the kp values are consistent with these observations.
In the case of copolymerization of BA and EHA, it is observed in Figure 2 that higher polymerization rates are obtained when the amount of EHA is increased. However, that increase in polymerization rate is only marginal since the profiles are close to one another. This result can be explained by comparing kp and kt for both monomers. Although kp for EHA is almost one order of magnitude higher than kp for BA, kt for EHA is two orders of magnitude higher than kt for BA. Since the polymerization rate is proportional to kp and inversely proportional to kt0.5, their effects almost cancel out. However, it is strange to observe from the experimental data that the final conversion for case 50BA/50EHA was higher than in case 70BA/30EHA, when the trend was exactly the opposite at very low conversions. This effect could not be captured by the model without DC effects. Even when single β parameters for similar polymer molecules were used, the observed trend could not be replicated. The only way to capture this effect was to use different β and kt values for EHA (see summary of β parameters in Table 9). Additional experimental data (i.e., extending the experimental study to include other monomer compositions for each co- and terpolymer system) as well as EHA homopolymerization studies would be required to more accurately estimate the model parameters. Another possible explanation for the extra fine tuning of EHA parameters is the fact that we estimated induction times and corrected the experimental sampling times accordingly.
Similar behavior as the one described above is observed in Figure 3 for the copolymerization of MMA and EHA. Although more noticeable differences in the polymerization rate are observed in this case, these differences are still moderate. As observed for the BA/EHA system, in the case of copolymerization of MMA and EHA, the experimental data show higher conversion values in the very low conversion region and lower final conversions in the medium to high conversion regions for system 70MMA/30EHA, compared to system 50MMA/50EHA. The same explanation as in BA/EHA applies for MMA/EHA. Another important aspect observed in Figure 3 for the copolymerization of MMA and EHA is the presence of strong DCEs, particularly the auto-acceleration effect (typical “S”-shaped conversion versus time profiles, both experimental and calculated). This auto-acceleration effect (diffusion-controlled termination) is manifested in all the copolymerizations where MMA is present, even the case with the lowest content of MMA (30MMA/70EHA). As a matter of fact, this case with the lowest MMA content is the one wherethe strongest diffusion-controlled termination is observed (see Figure 3). This behavior can be explained by the large difference in propagation kinetic rate coefficients between the two monomers (kp for EHA is 2 orders in magnitude higher than kp for MMA), so that a decrease in termination will have a more noticeable effect in the species with the faster propagation. Accurate estimation of ktin our MMA-containing copolymerizations is quite important, given their lower propagation rates and the nature of the experimental results obtained, which show very similar conversions reached at quite different initial monomer concentrations.
As shown in Figure 4 for the terpolymerization of BA, EHA and MMA, more noticeable differences in the polymerization rate expressed as conversion versus time at different comonomer initial compositions are observed in this case, compared to the binary copolymerization systems analyzed earlier. These differences can again be explained in terms of different propagation rates among the three monomers (with EHA being the fastest monomer), but also by the monomer initial concentrations, where one monomer dominates the process. A close look at the β values reported in Table 9 shows again that DC effects and specifically diffusion-controlled termination are relevant for MMA, since higher β values are obtained for kinetic rate coefficients involving MMA and MMA cross interactions. As a matter of fact, the best overall fit to experimental data was obtained when system 10BA/10EHA/80MMA was used to estimate free volume parameters for MMA (estimation of β values for MMA related reactions).

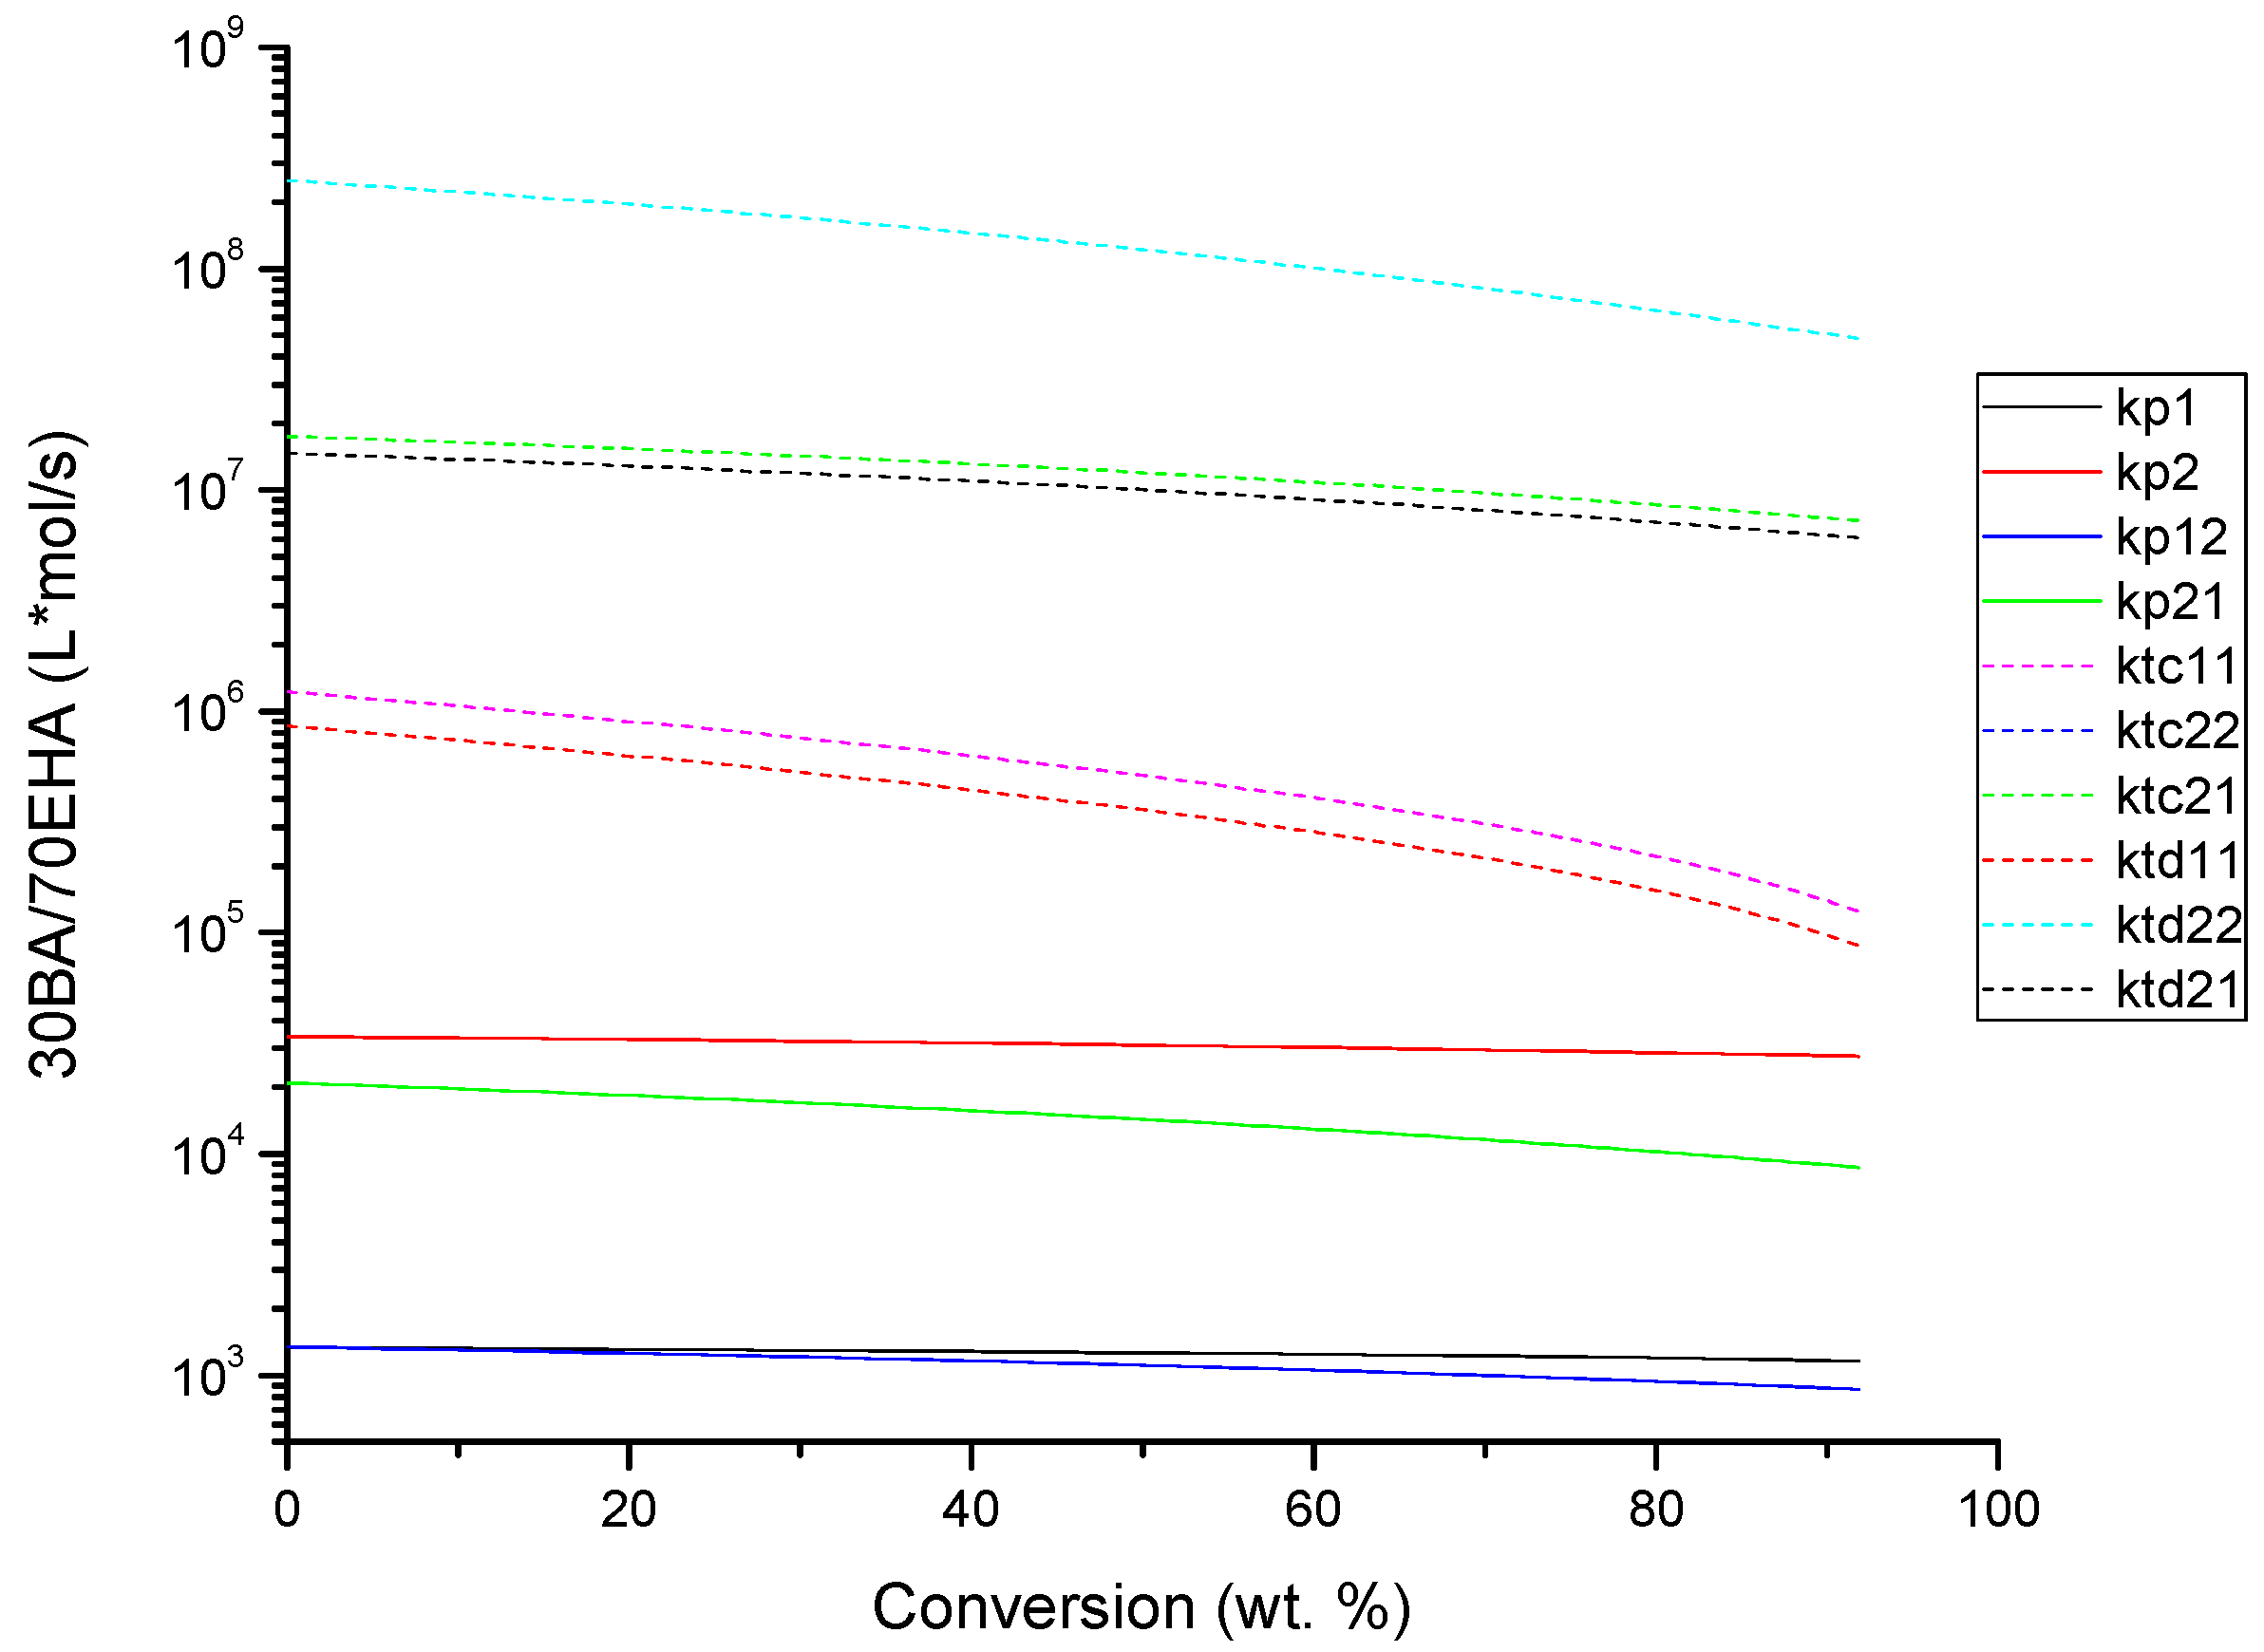
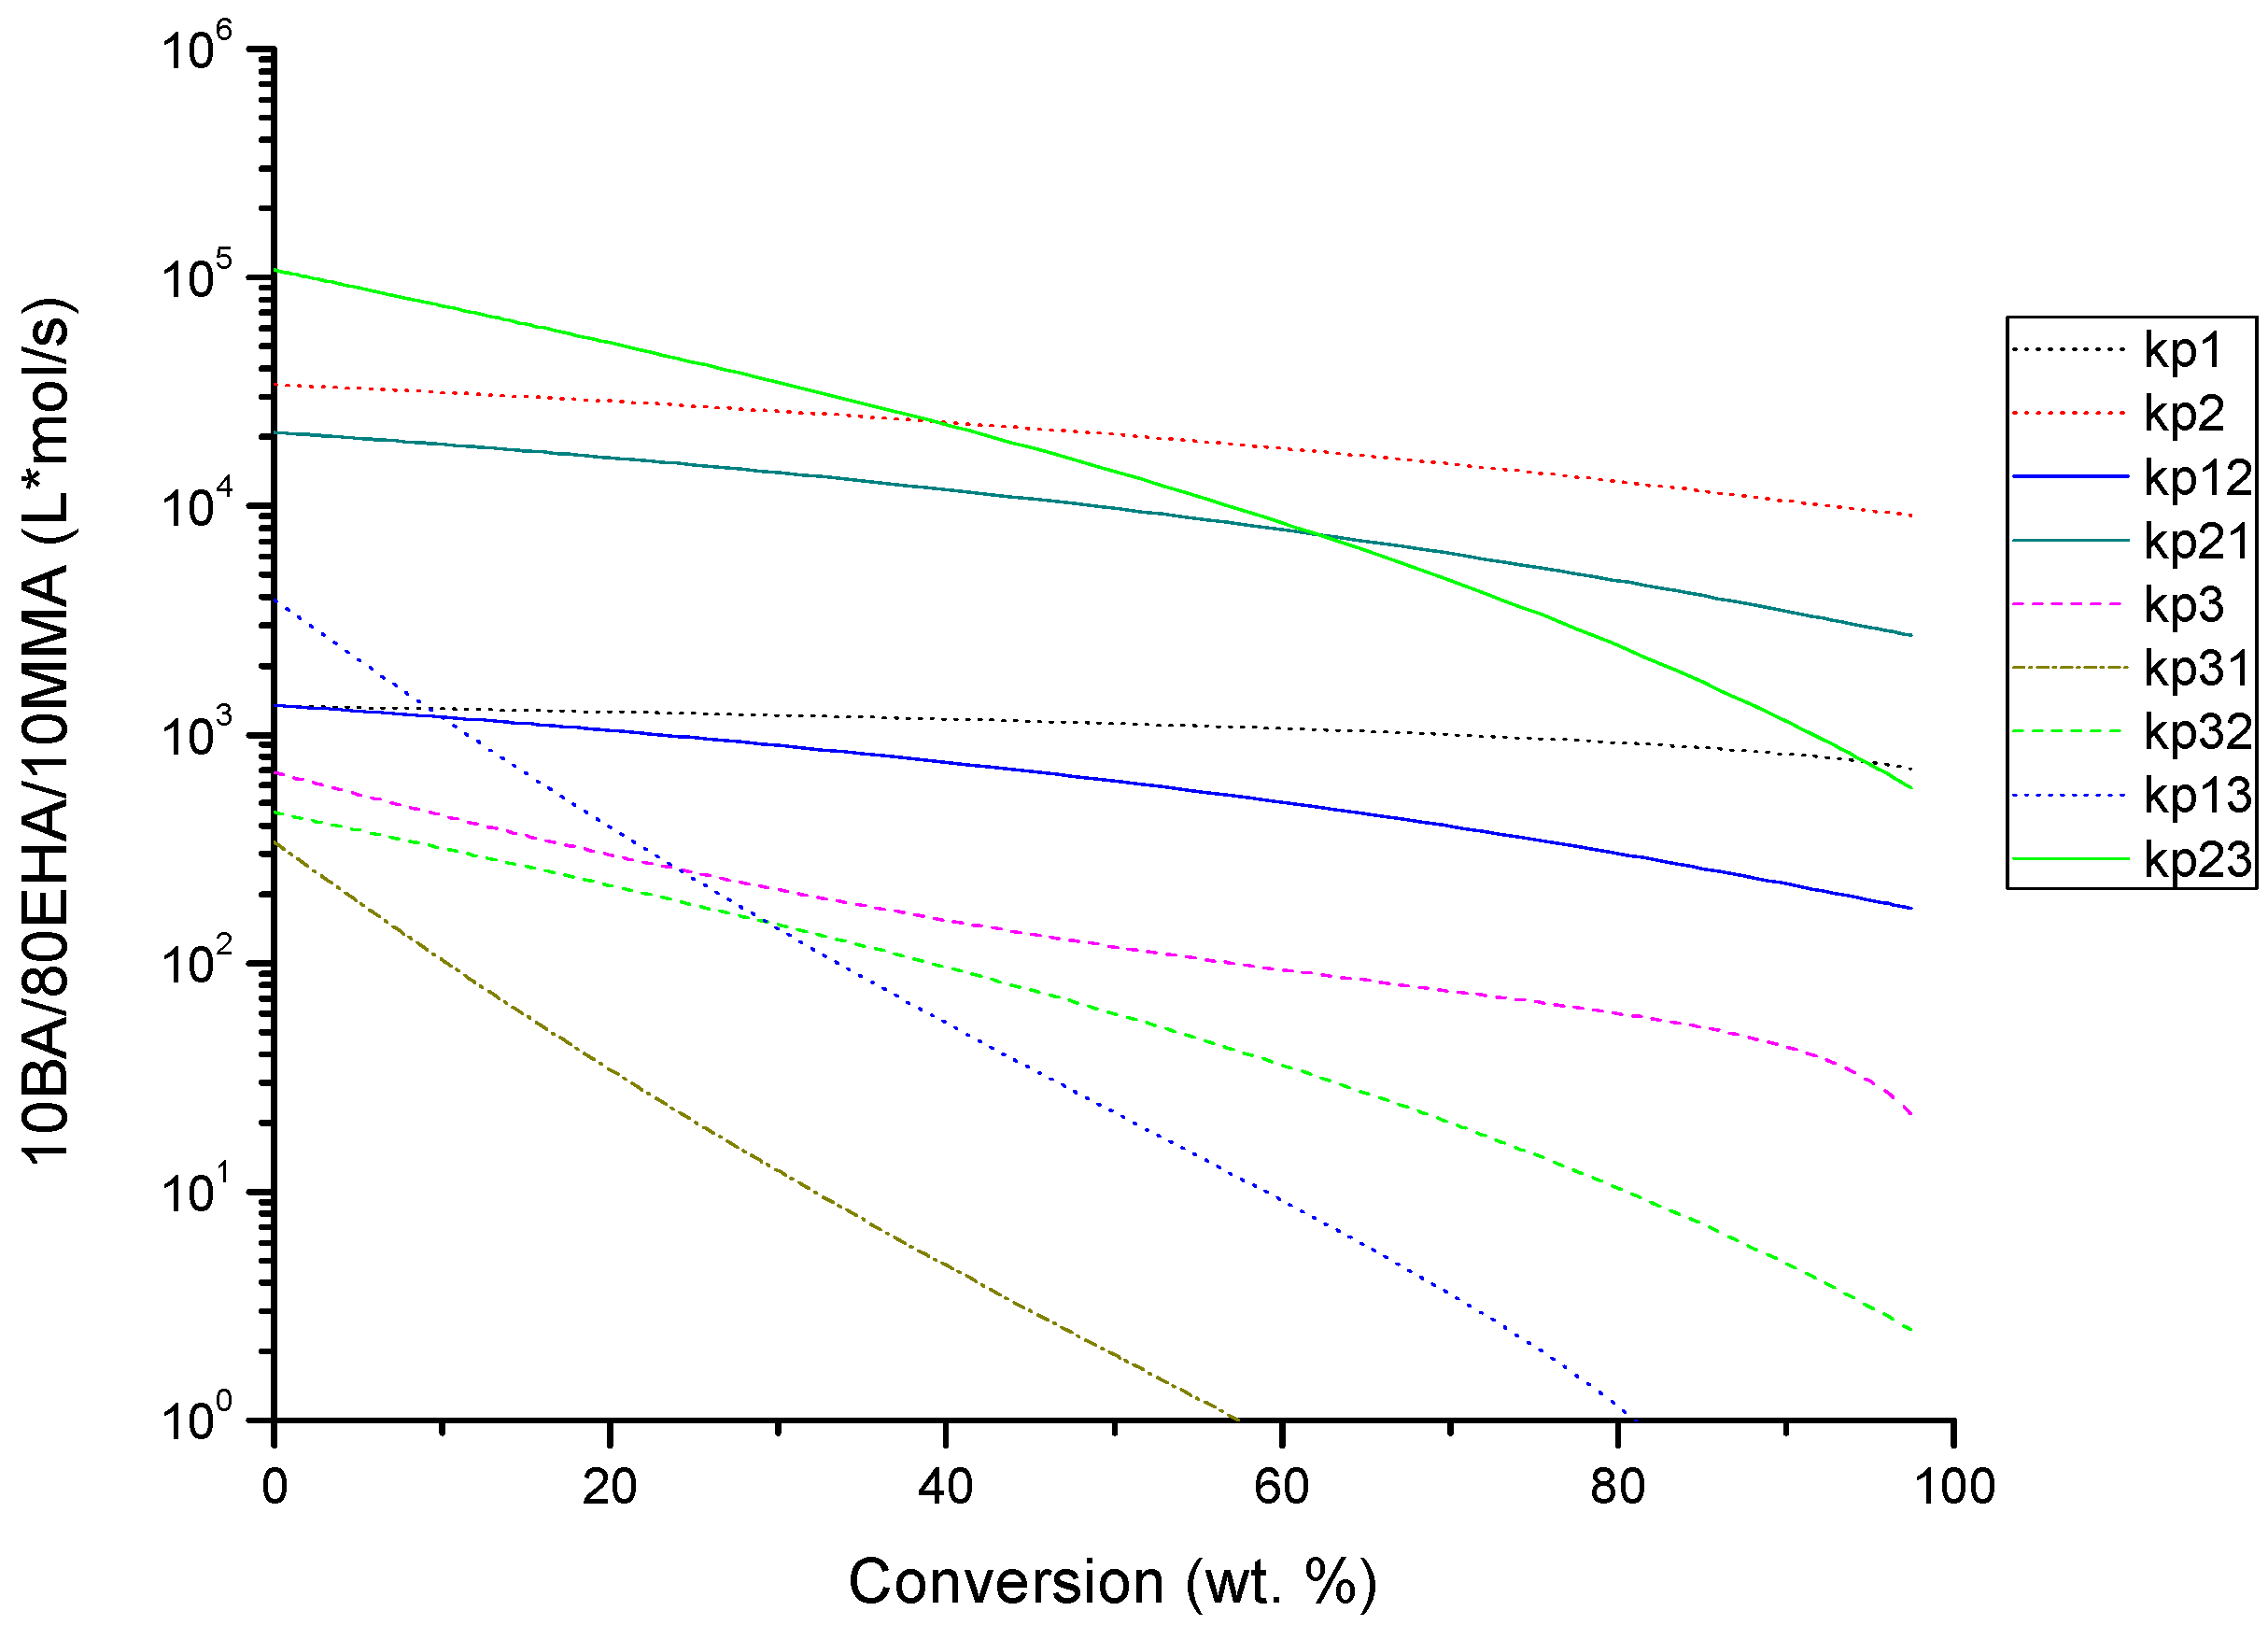
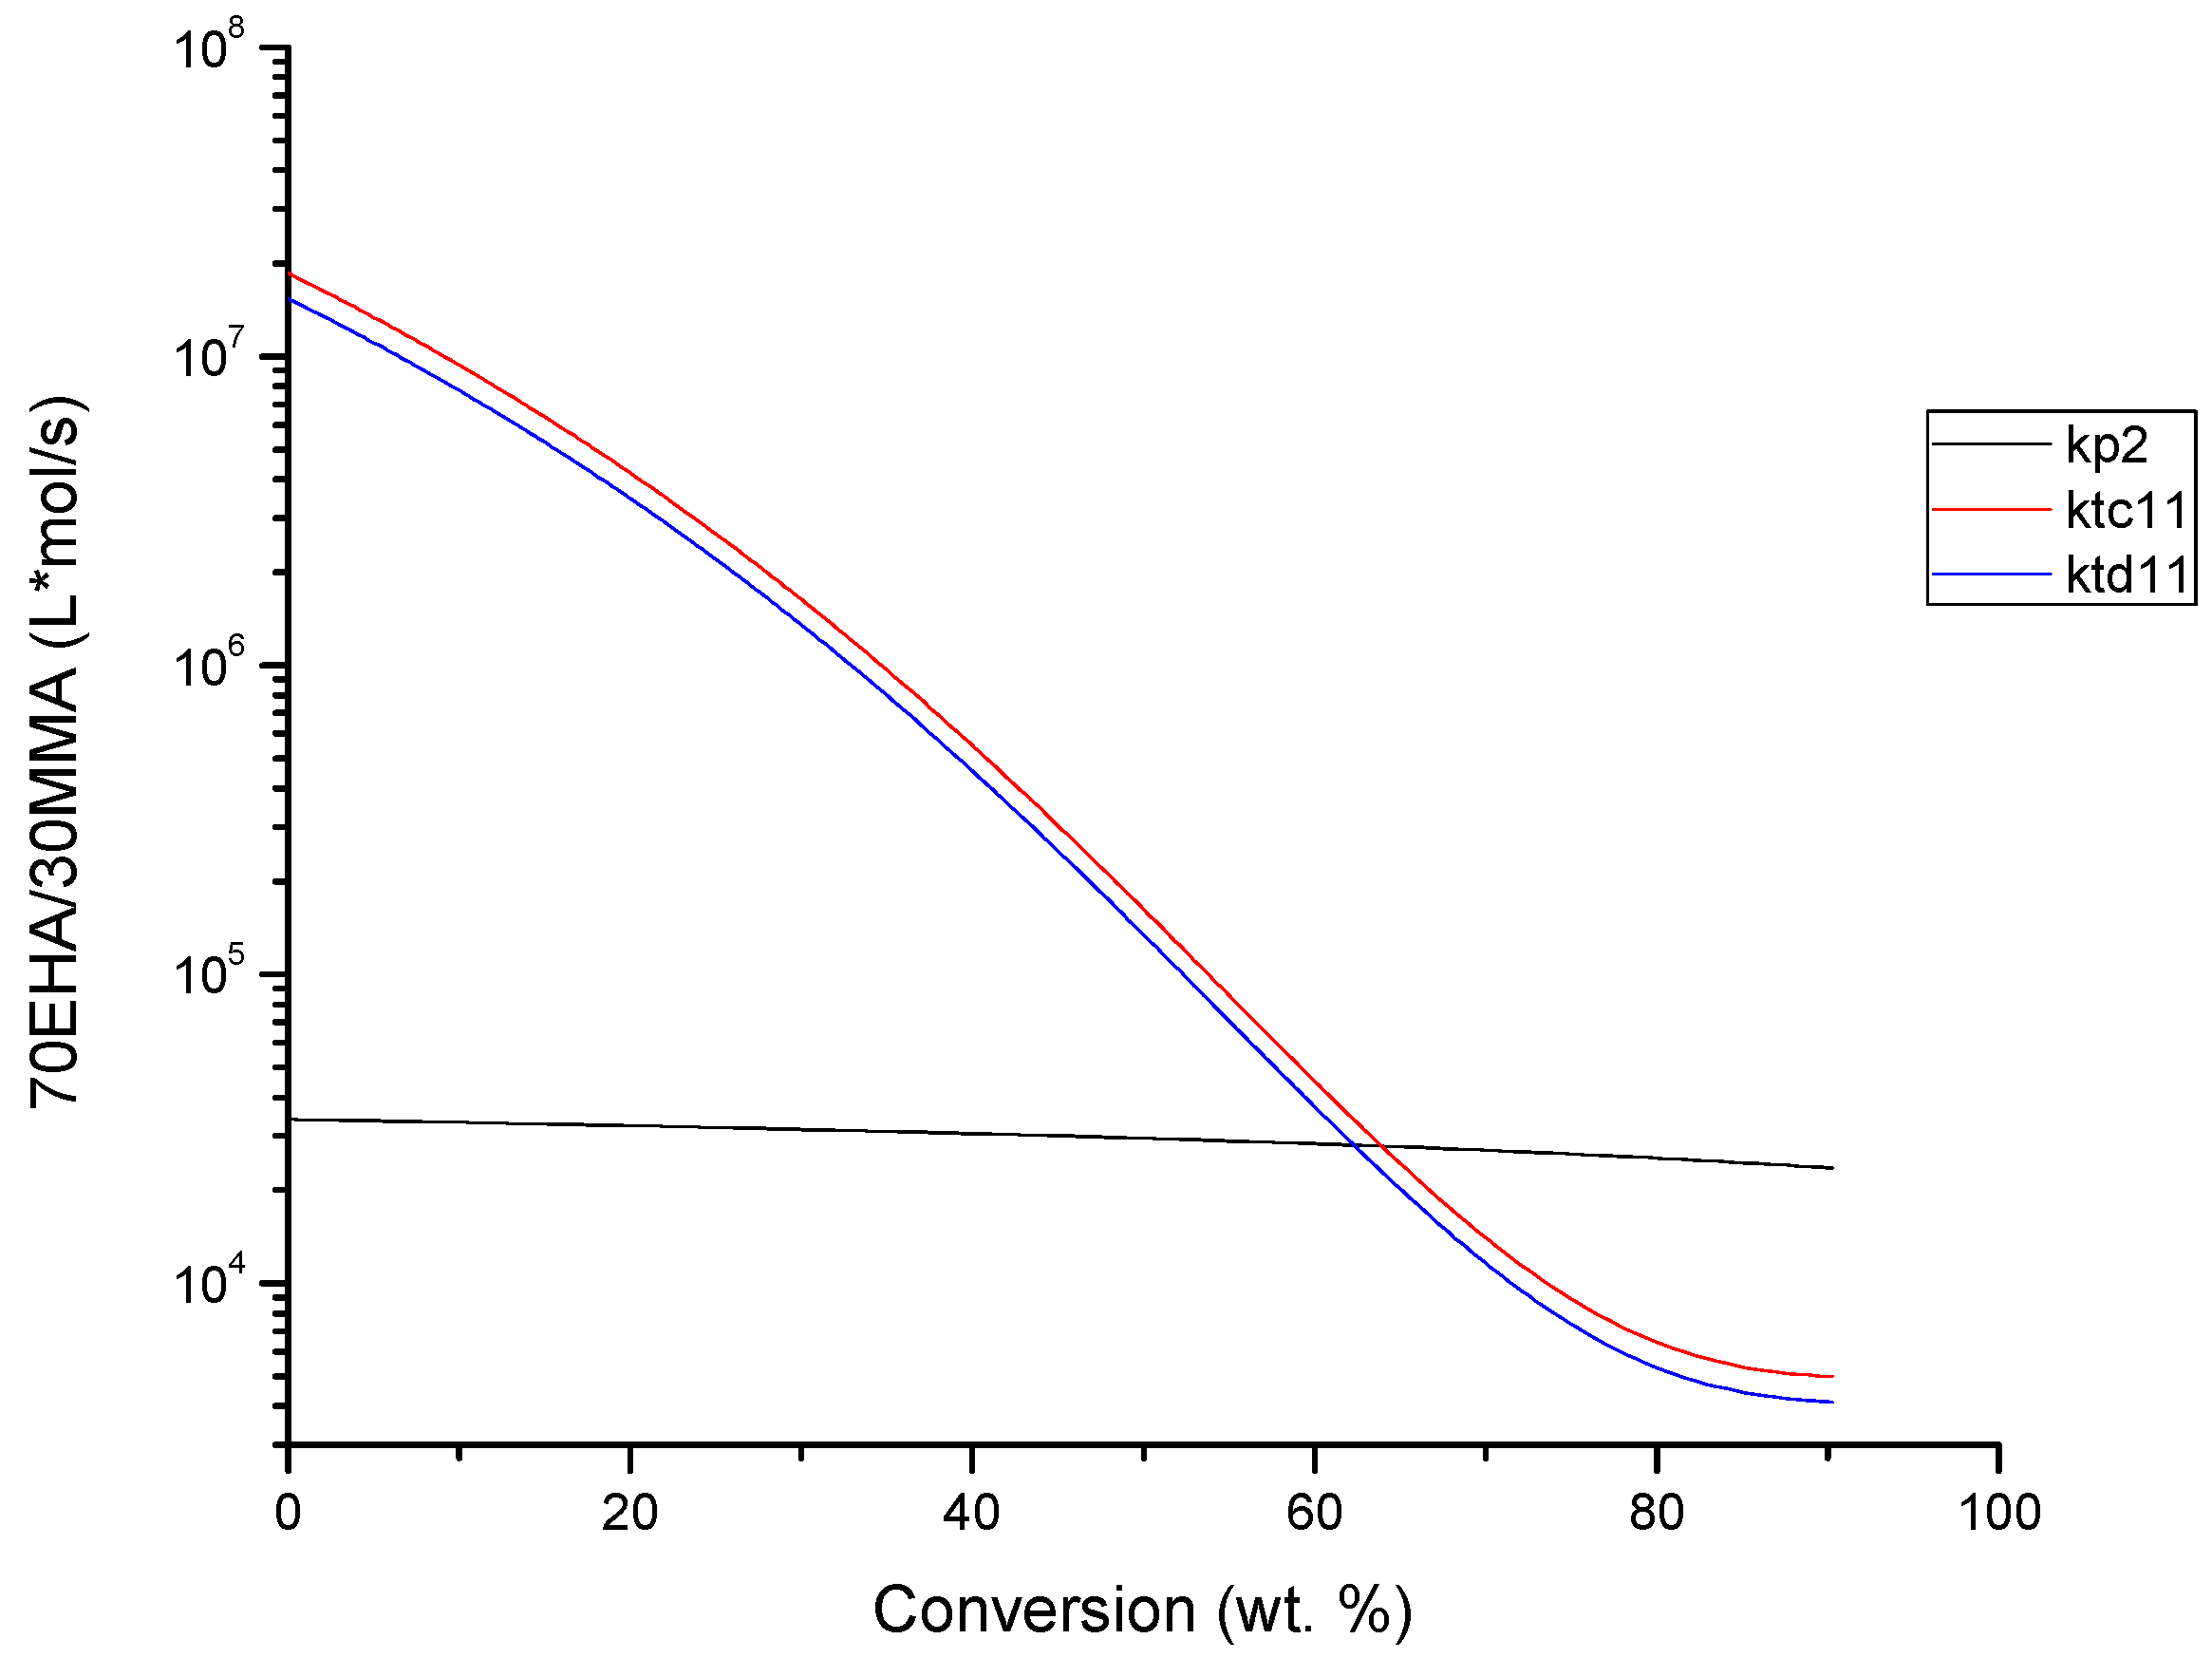
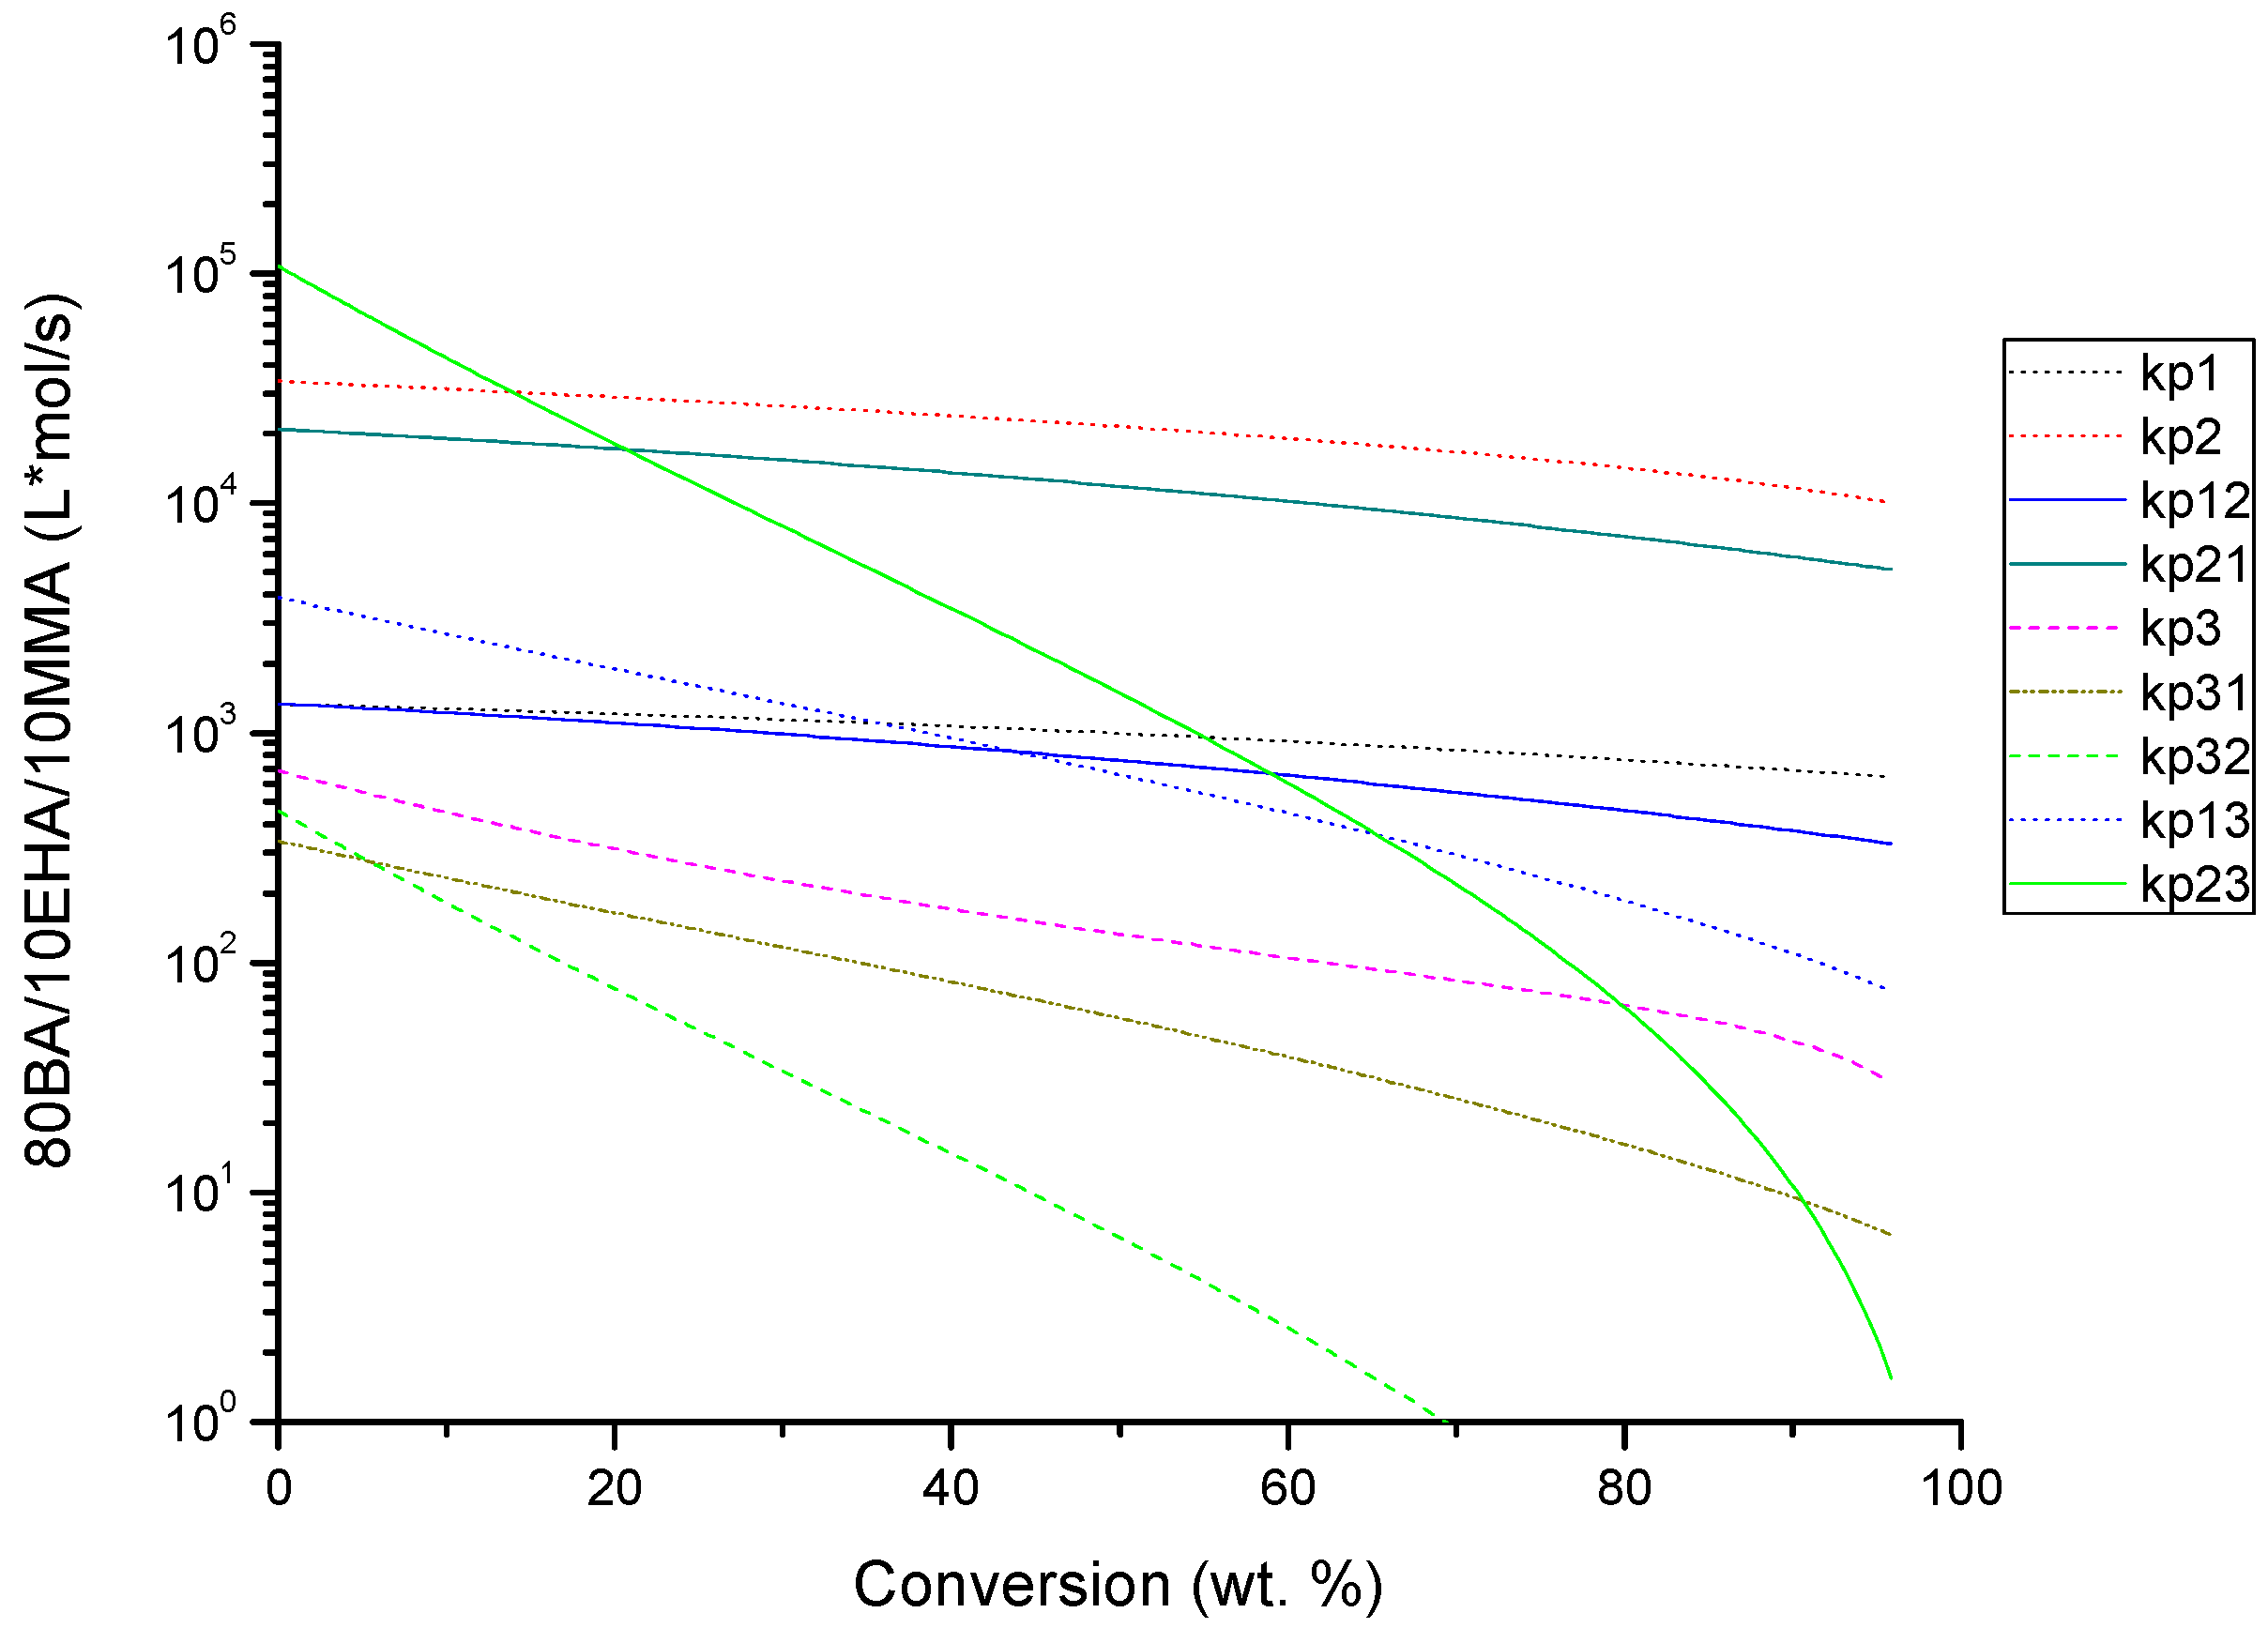
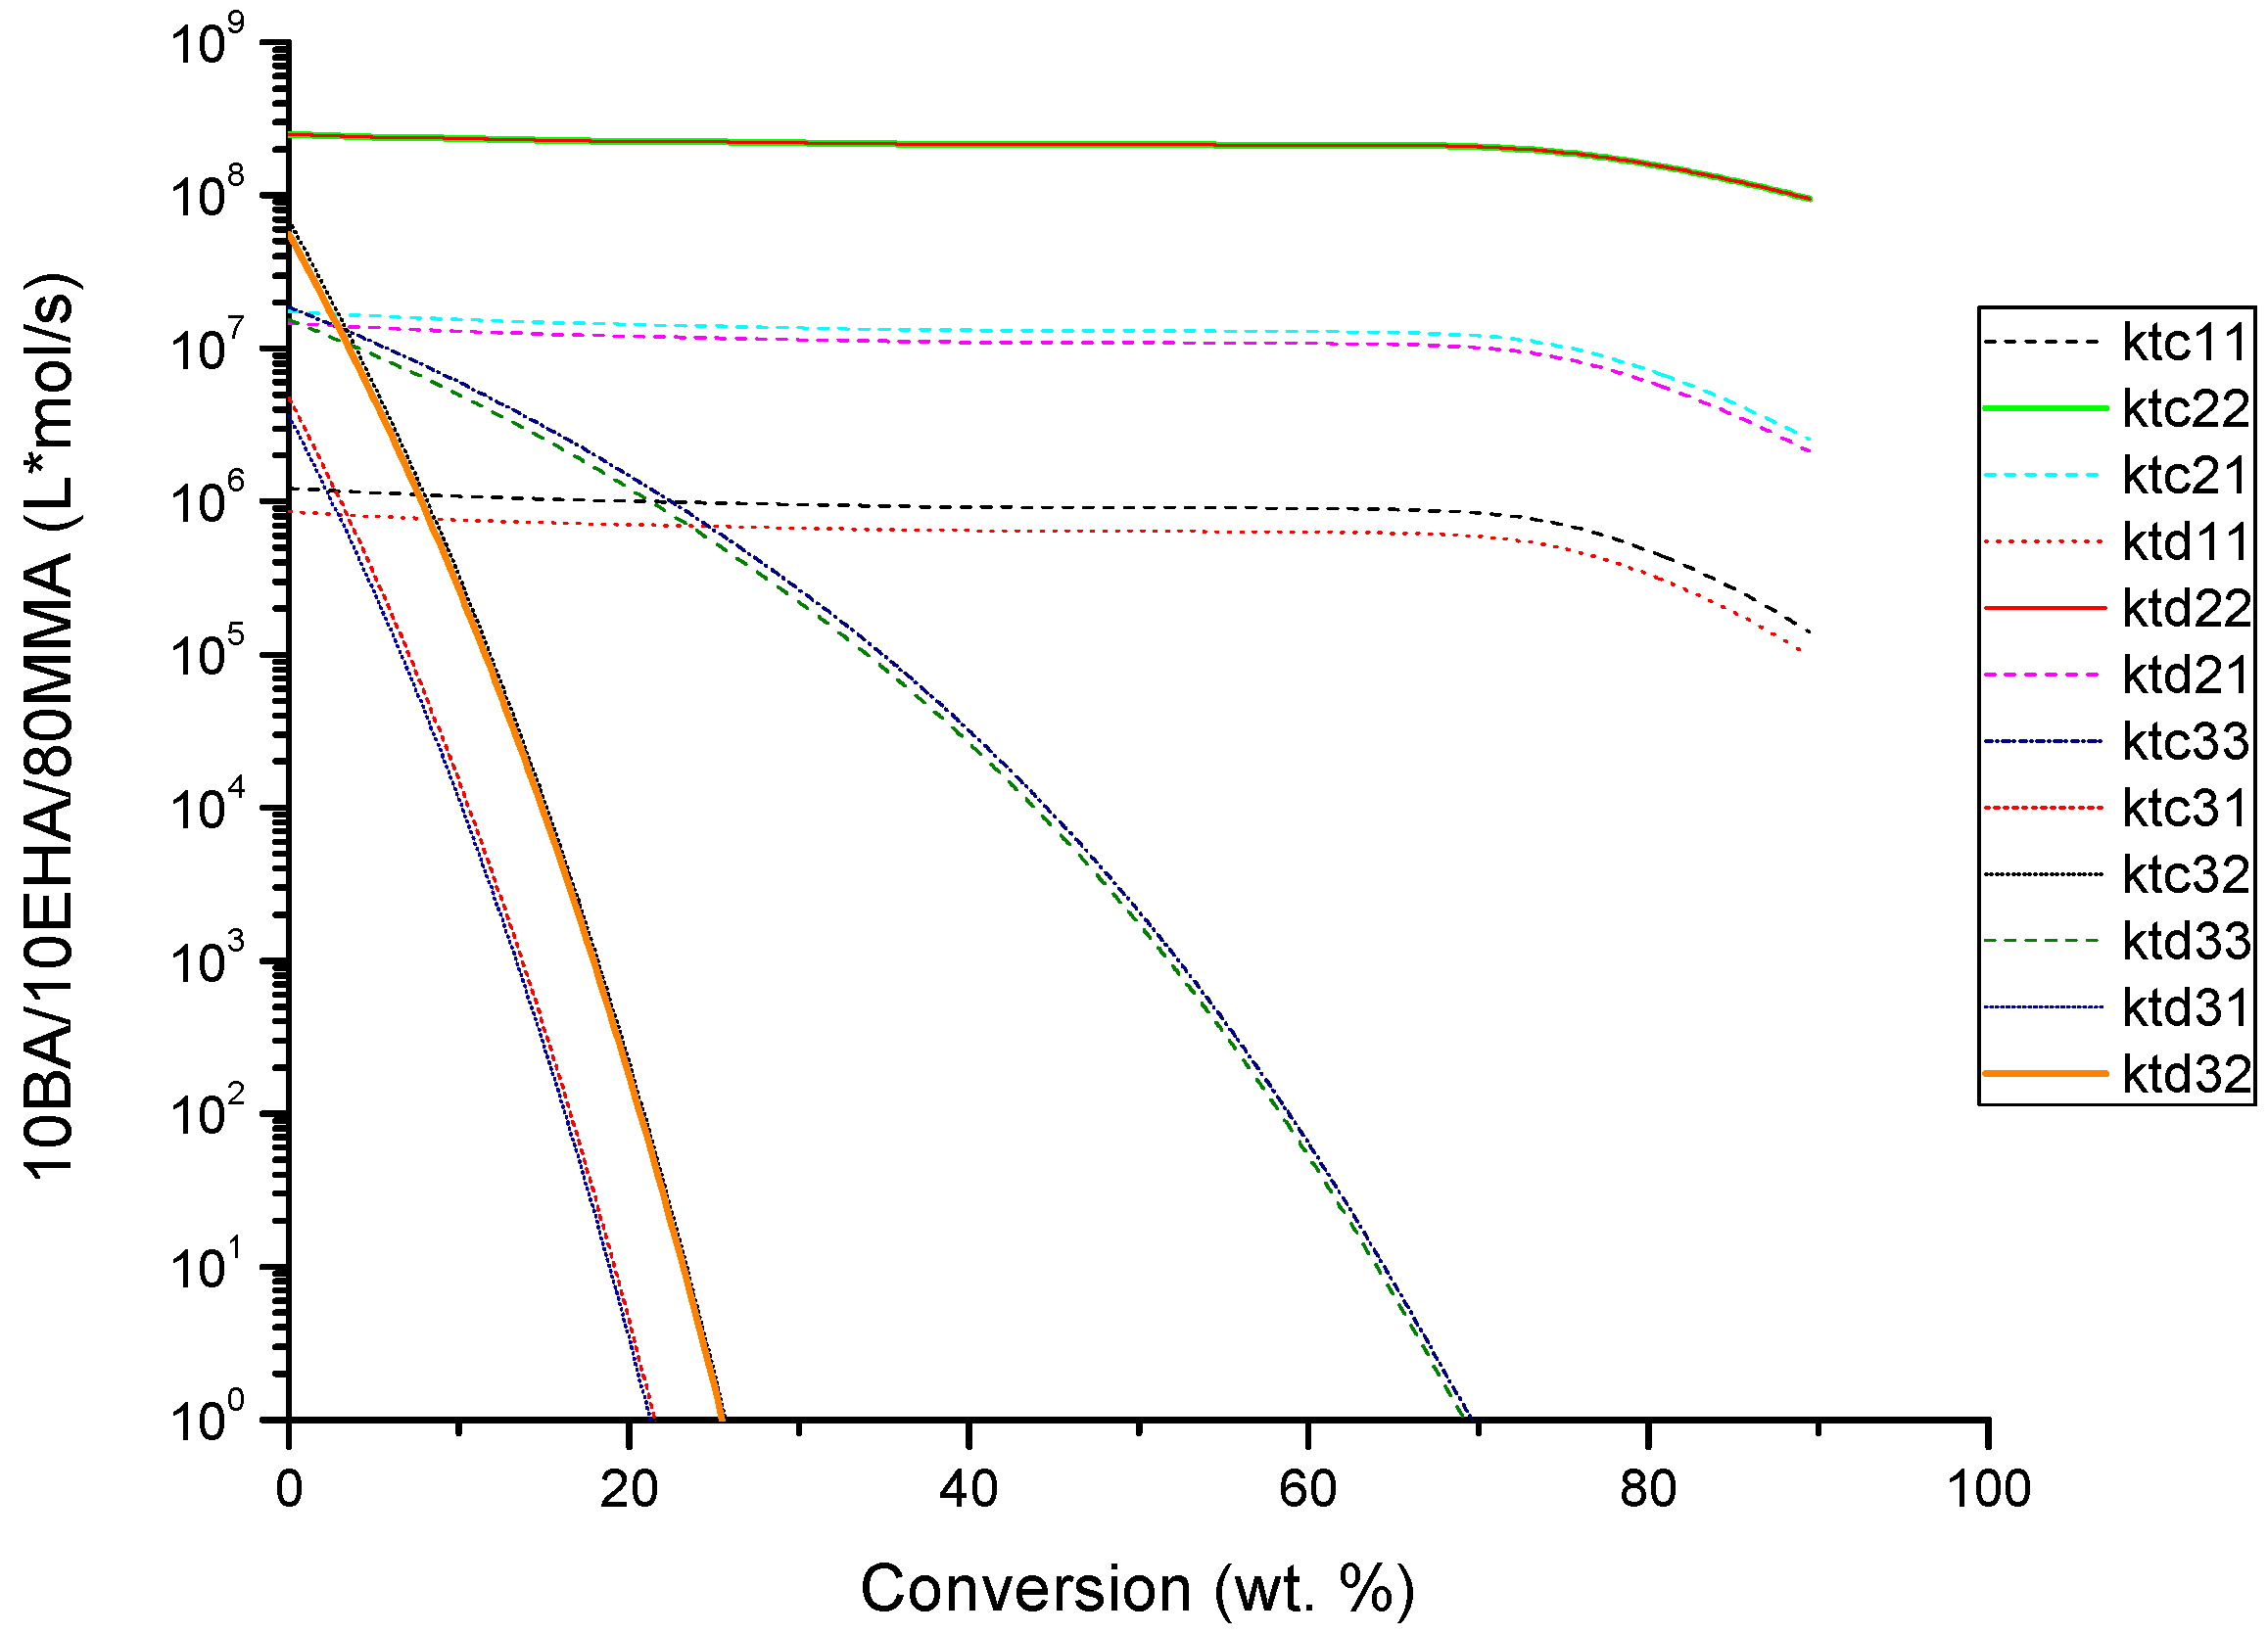
4.2. Evolution of Kinetic Rate Coefficients Due to DC Effects

It was stated above that DC effects were needed to reproduce the observed experimental phenomena, particularly the effect of feed comonomer composition on the polymerization rate and molecular weight development. In order to understand such behavior, it is useful to visualize how the kinetic rate coefficients that are DC evolve over time. The evolution with conversion of kp and kt for system 30BA/70EHA, kp and kt for system 70EHA/30MMA, kp for system 10BA/10EHA/80MMA, kp for system 80BA/10EHA/10MMA, kp for system 10BA/80EHA/10MMA, kt for system 10BA/10EHA/80MMA, kt for system 80BA/10EHA/10MMA, and kt for system 10BA/80EHA/10MMA, are shown in Figure 5, Figure 6, Figure 7, Figure 8, Figure 9, Figure 10, Figure 11 and Figure 12, respectively.
It is observed in Figure 5 that kt and kp for system 30BA/70EHA decrease very slowly as conversion increases, remaining almost constant during the polymerization. This behavior is typical of systems with very weak DC effects and agree well with the conversion versus time profile shown in Figure 2 for the same copolymerization system. Figure 6, on the other hand, shows the behavior of system 70EHA/30MMA, which displays strong DCeffects. DCtermination is particularly strong for system 70EHA/30MMA, since kp decreases moderately, but kt decreases by several orders of magnitude. This behavior agrees well with the conversion versus time profile shown in Figure 3. Similar behavior was obtained for systems 50BA/50EHA, 70BA/30EHA, 50EHA/50MMA and 30EHA/70MMA, although results for those systems were not included here due to space considerations.
It is also observed in Figure 5 and Figure 6, and in Table 9, that system BA/EHA required estimating more β parameters than system MMA/EHA. This is related to the nature of each system. System MMA/EHA is governed by the strong auto-acceleration effect (DC termination) of MMA whereas system BA/EHA required to estimate β parameters for several reactions involving polymer molecules in order to reproduce the experimental behavior of that system.
The terpolymer systems showed more complex behavior than the binary copolymerization ones. As observed in Figure 7, Figure 8, Figure 9, Figure 10, Figure 11 and Figure 12 for the terpolymer systems, each case shows remarkably different behavior. For instance, as observed in Figure 7, kp3, kp31, kp32, kp13 and kp23 for system 10BA/10EHA/80MMA decay much faster than in the other terpolymer systems shown in Figure 8 and Figure 9. The common feature in those cases is that the involved kinetic rate coefficients are related to MMA and cross propagation reactions with MMA, a monomer with strong DC effects. Similar decaying behavior for the termination kinetic rate coefficients, particularly kt33, kt32 and kt31 (both combination and disproportionation), all of them related to MMA, once more, can be observed in Figure 10, Figure 11 and Figure 12. This DC dependency of kp and kt for the terpolymer systems agrees well with the conversion versus time profiles observed in Figure 4.

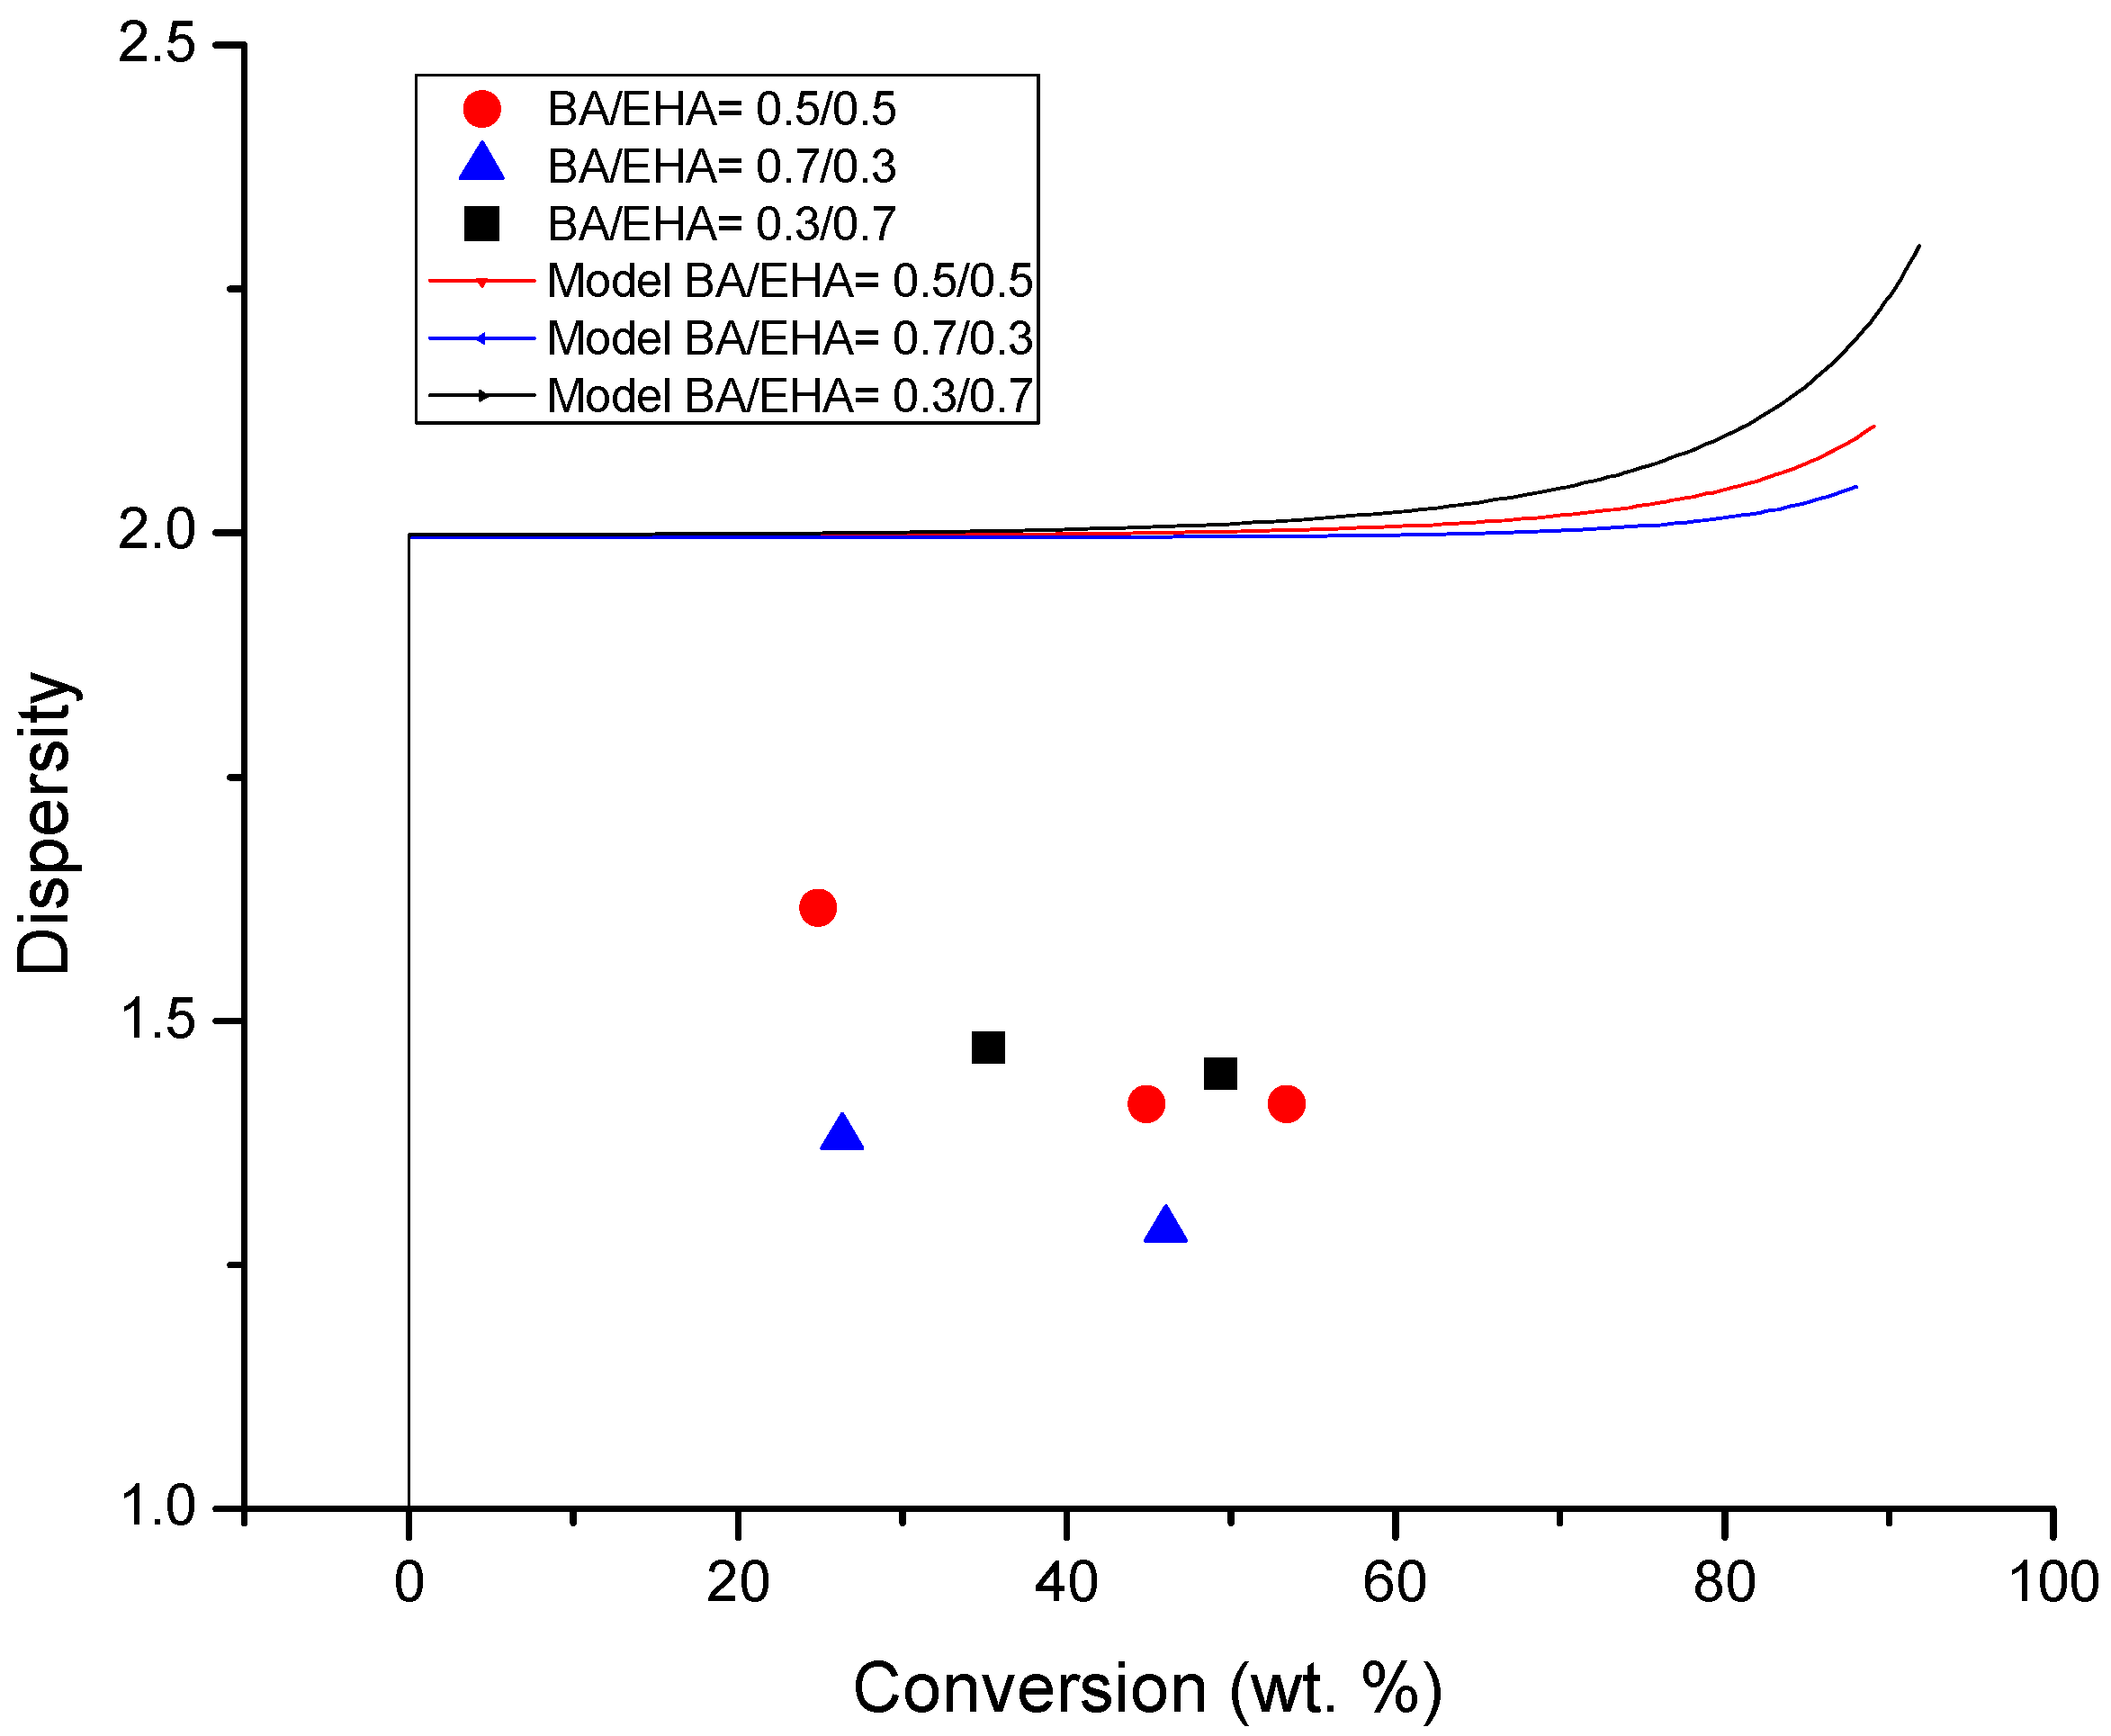
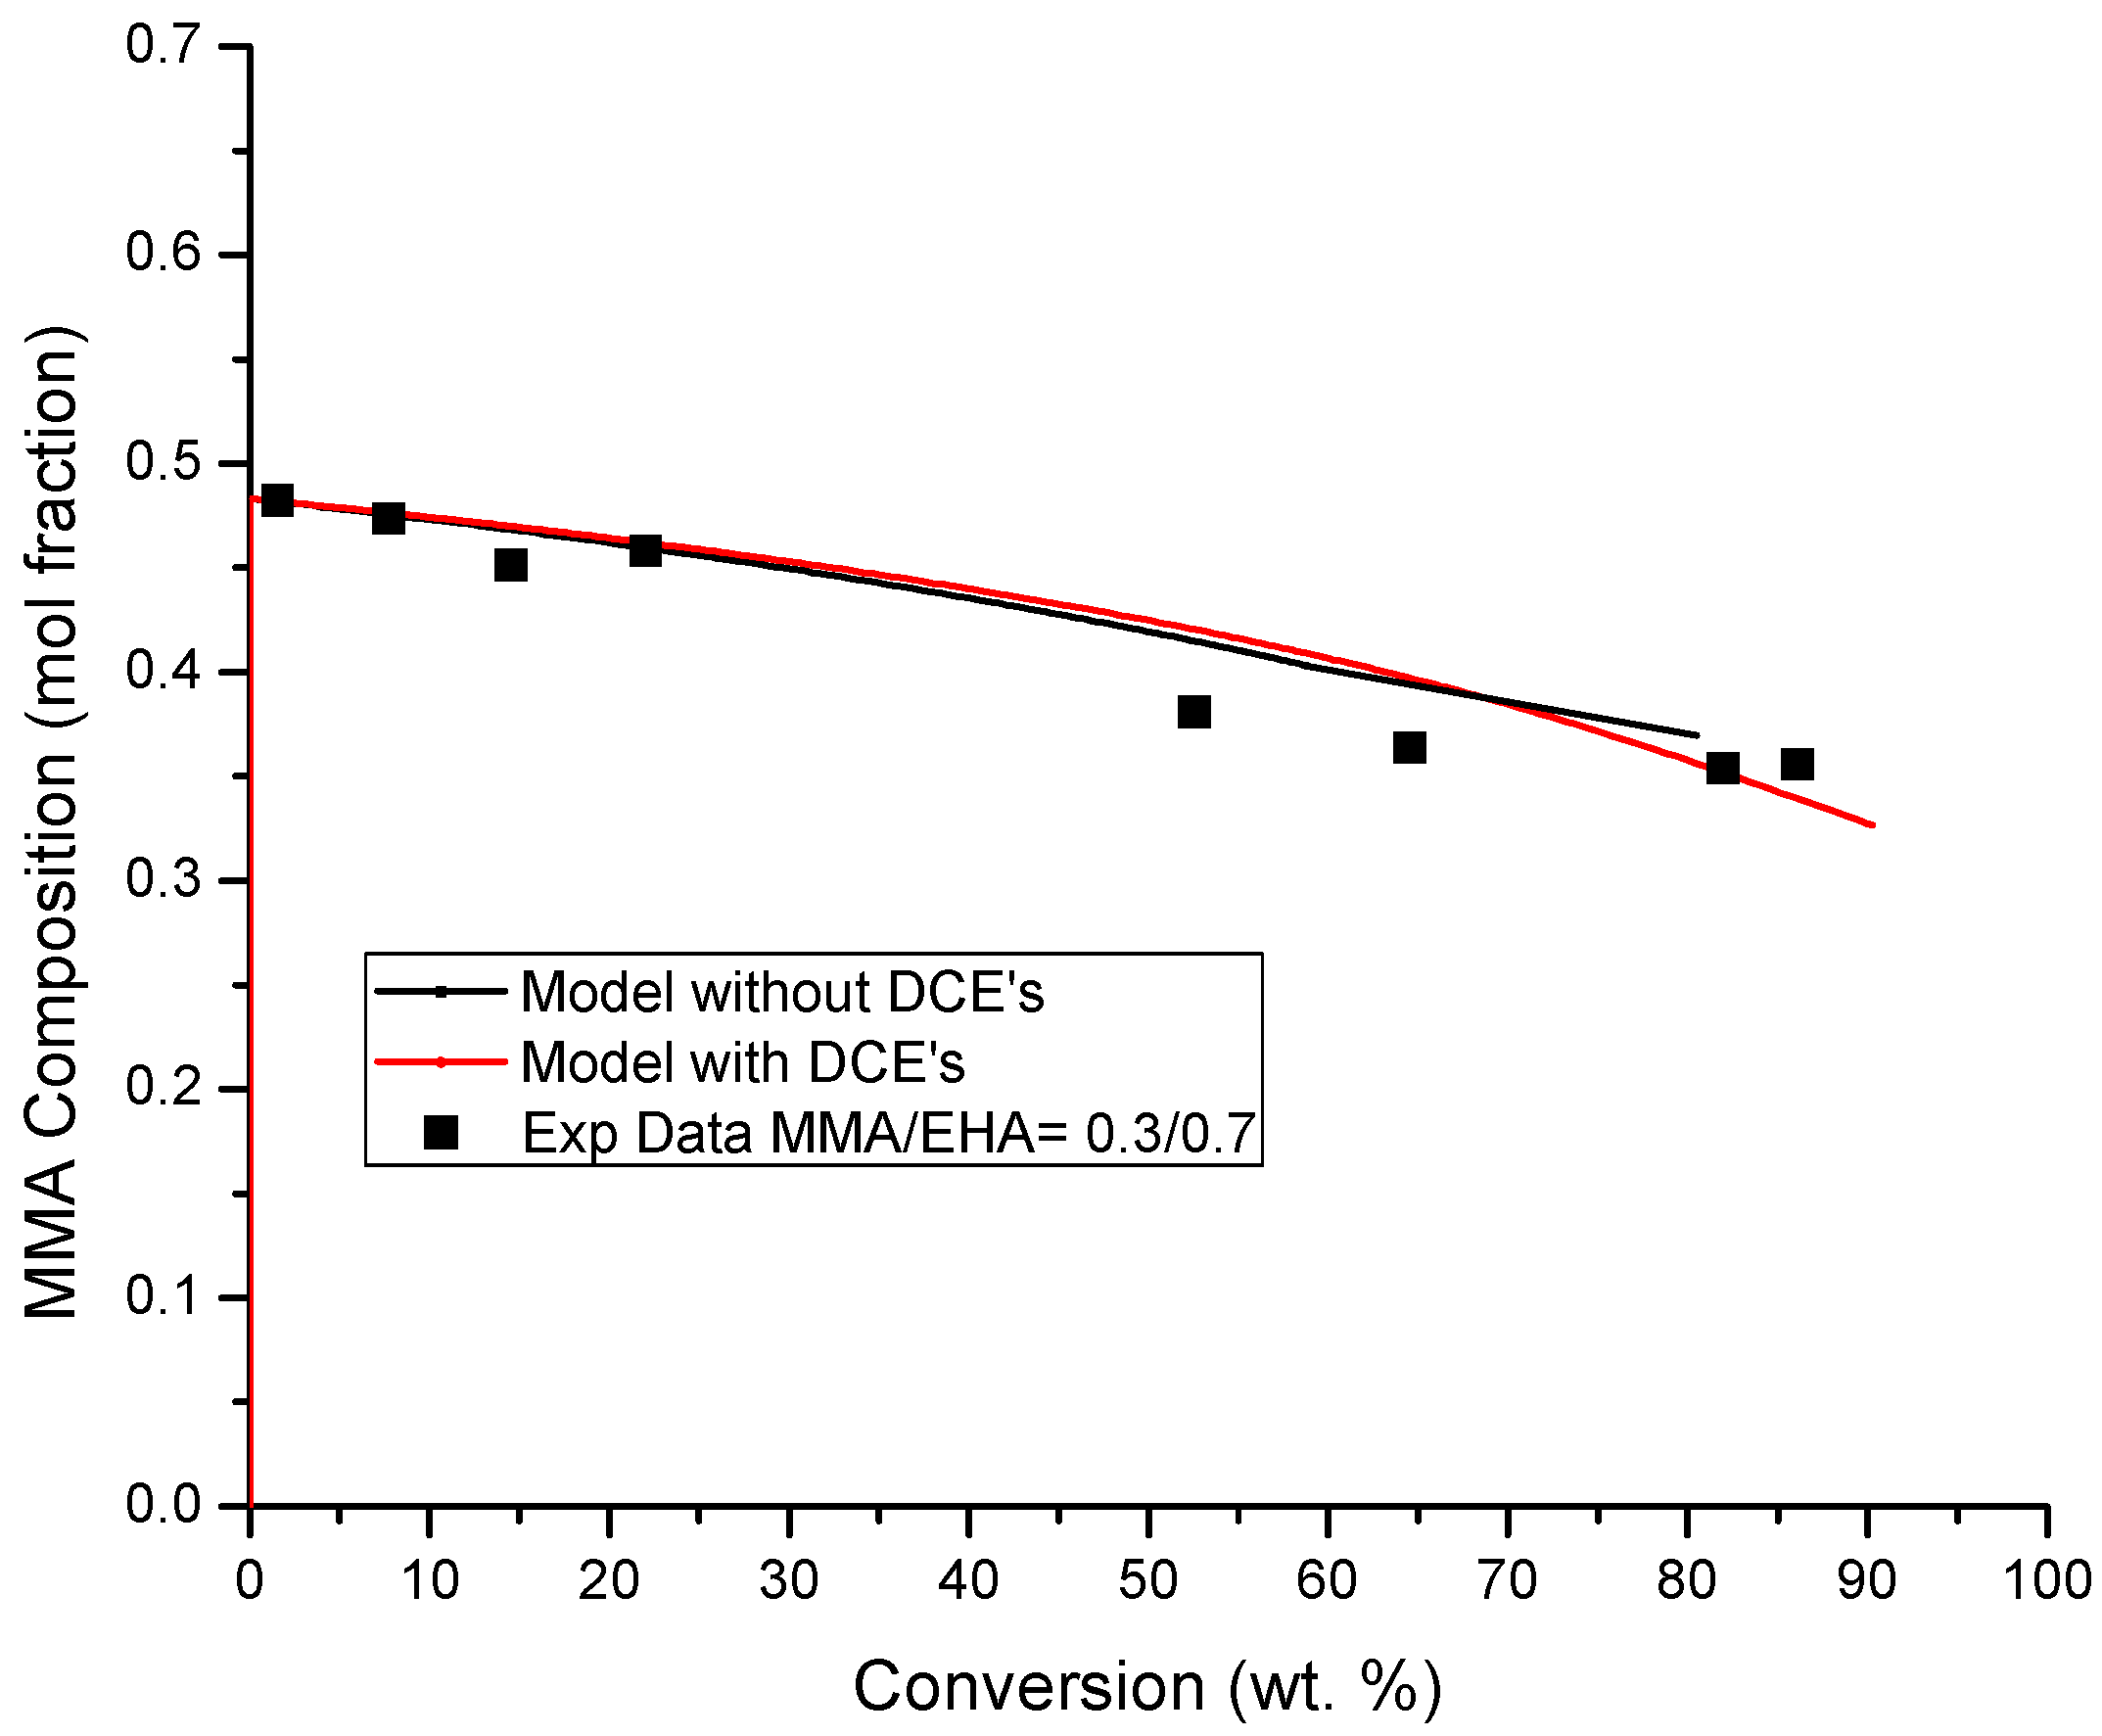
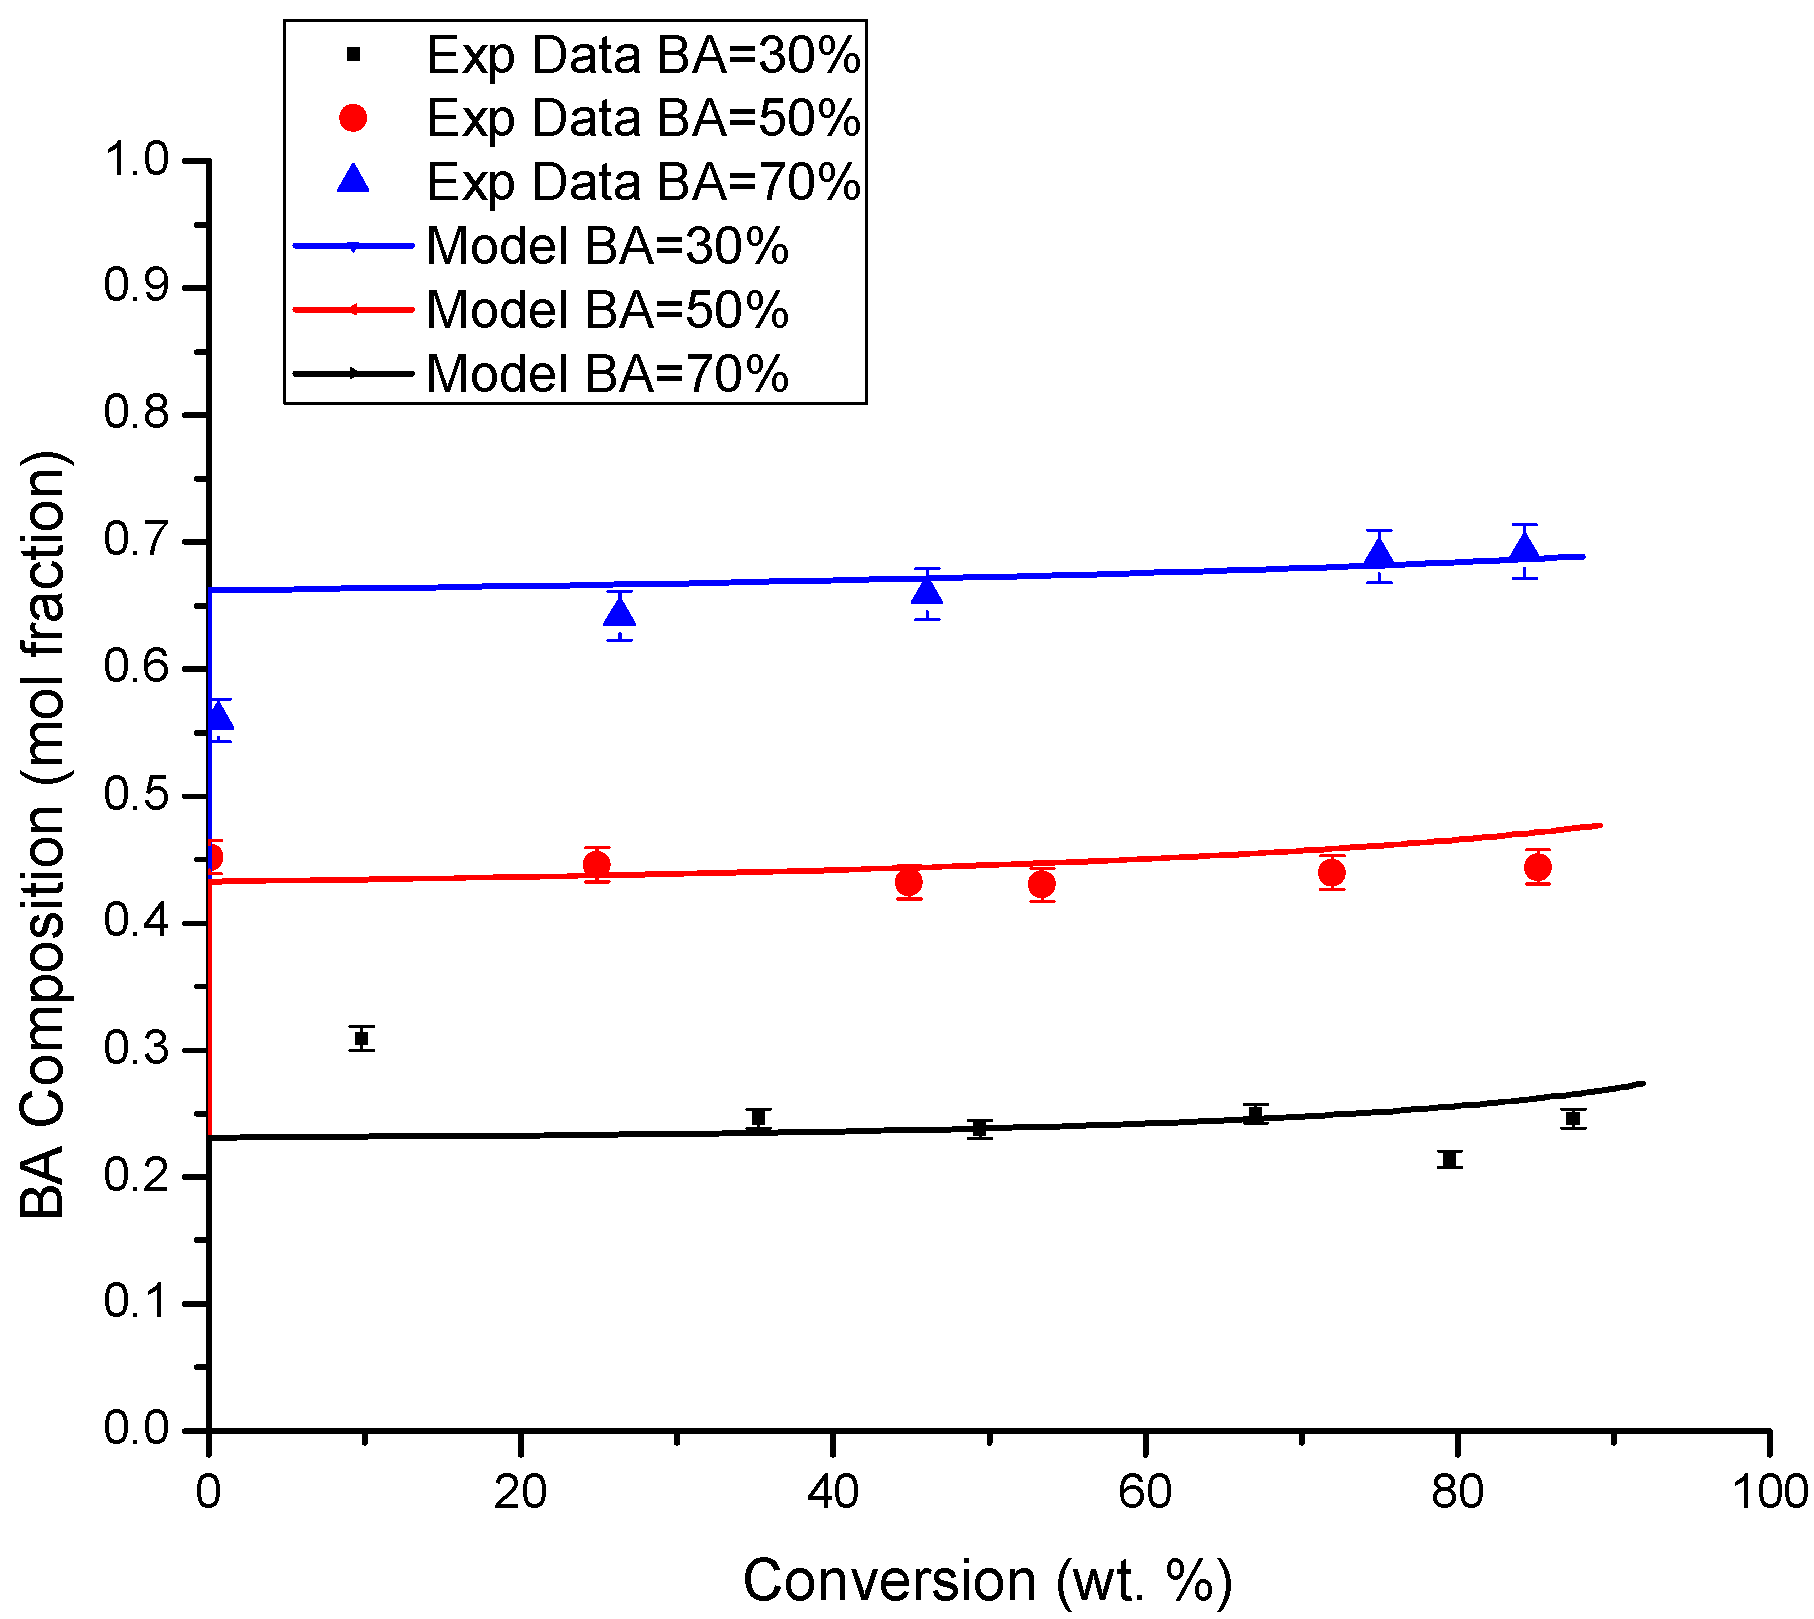
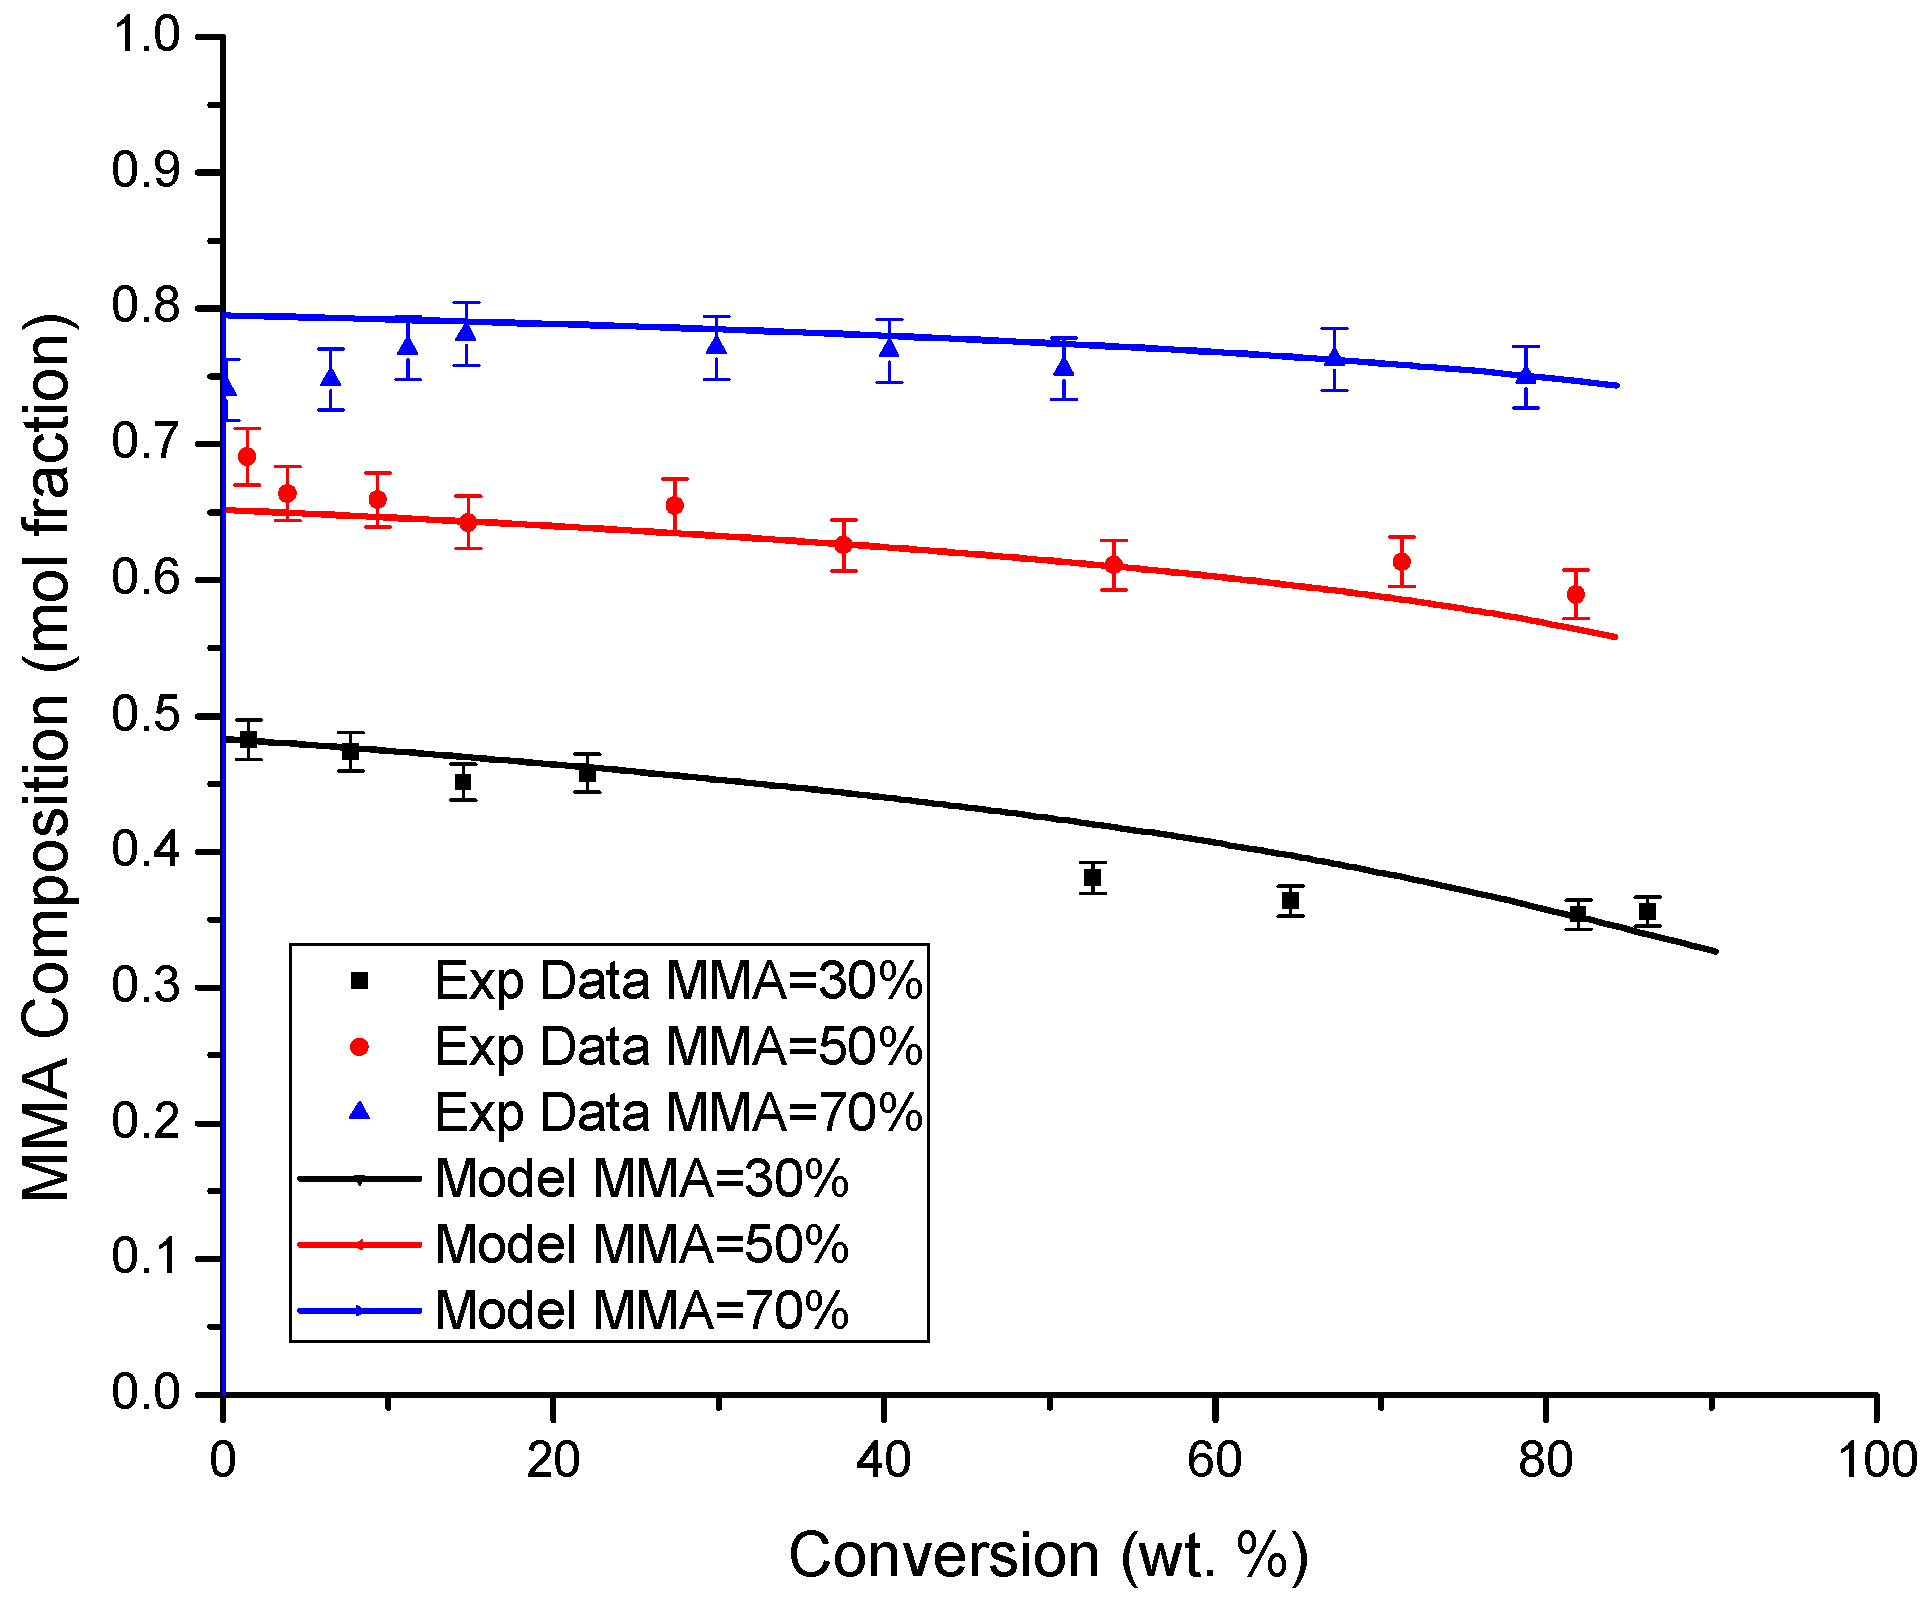
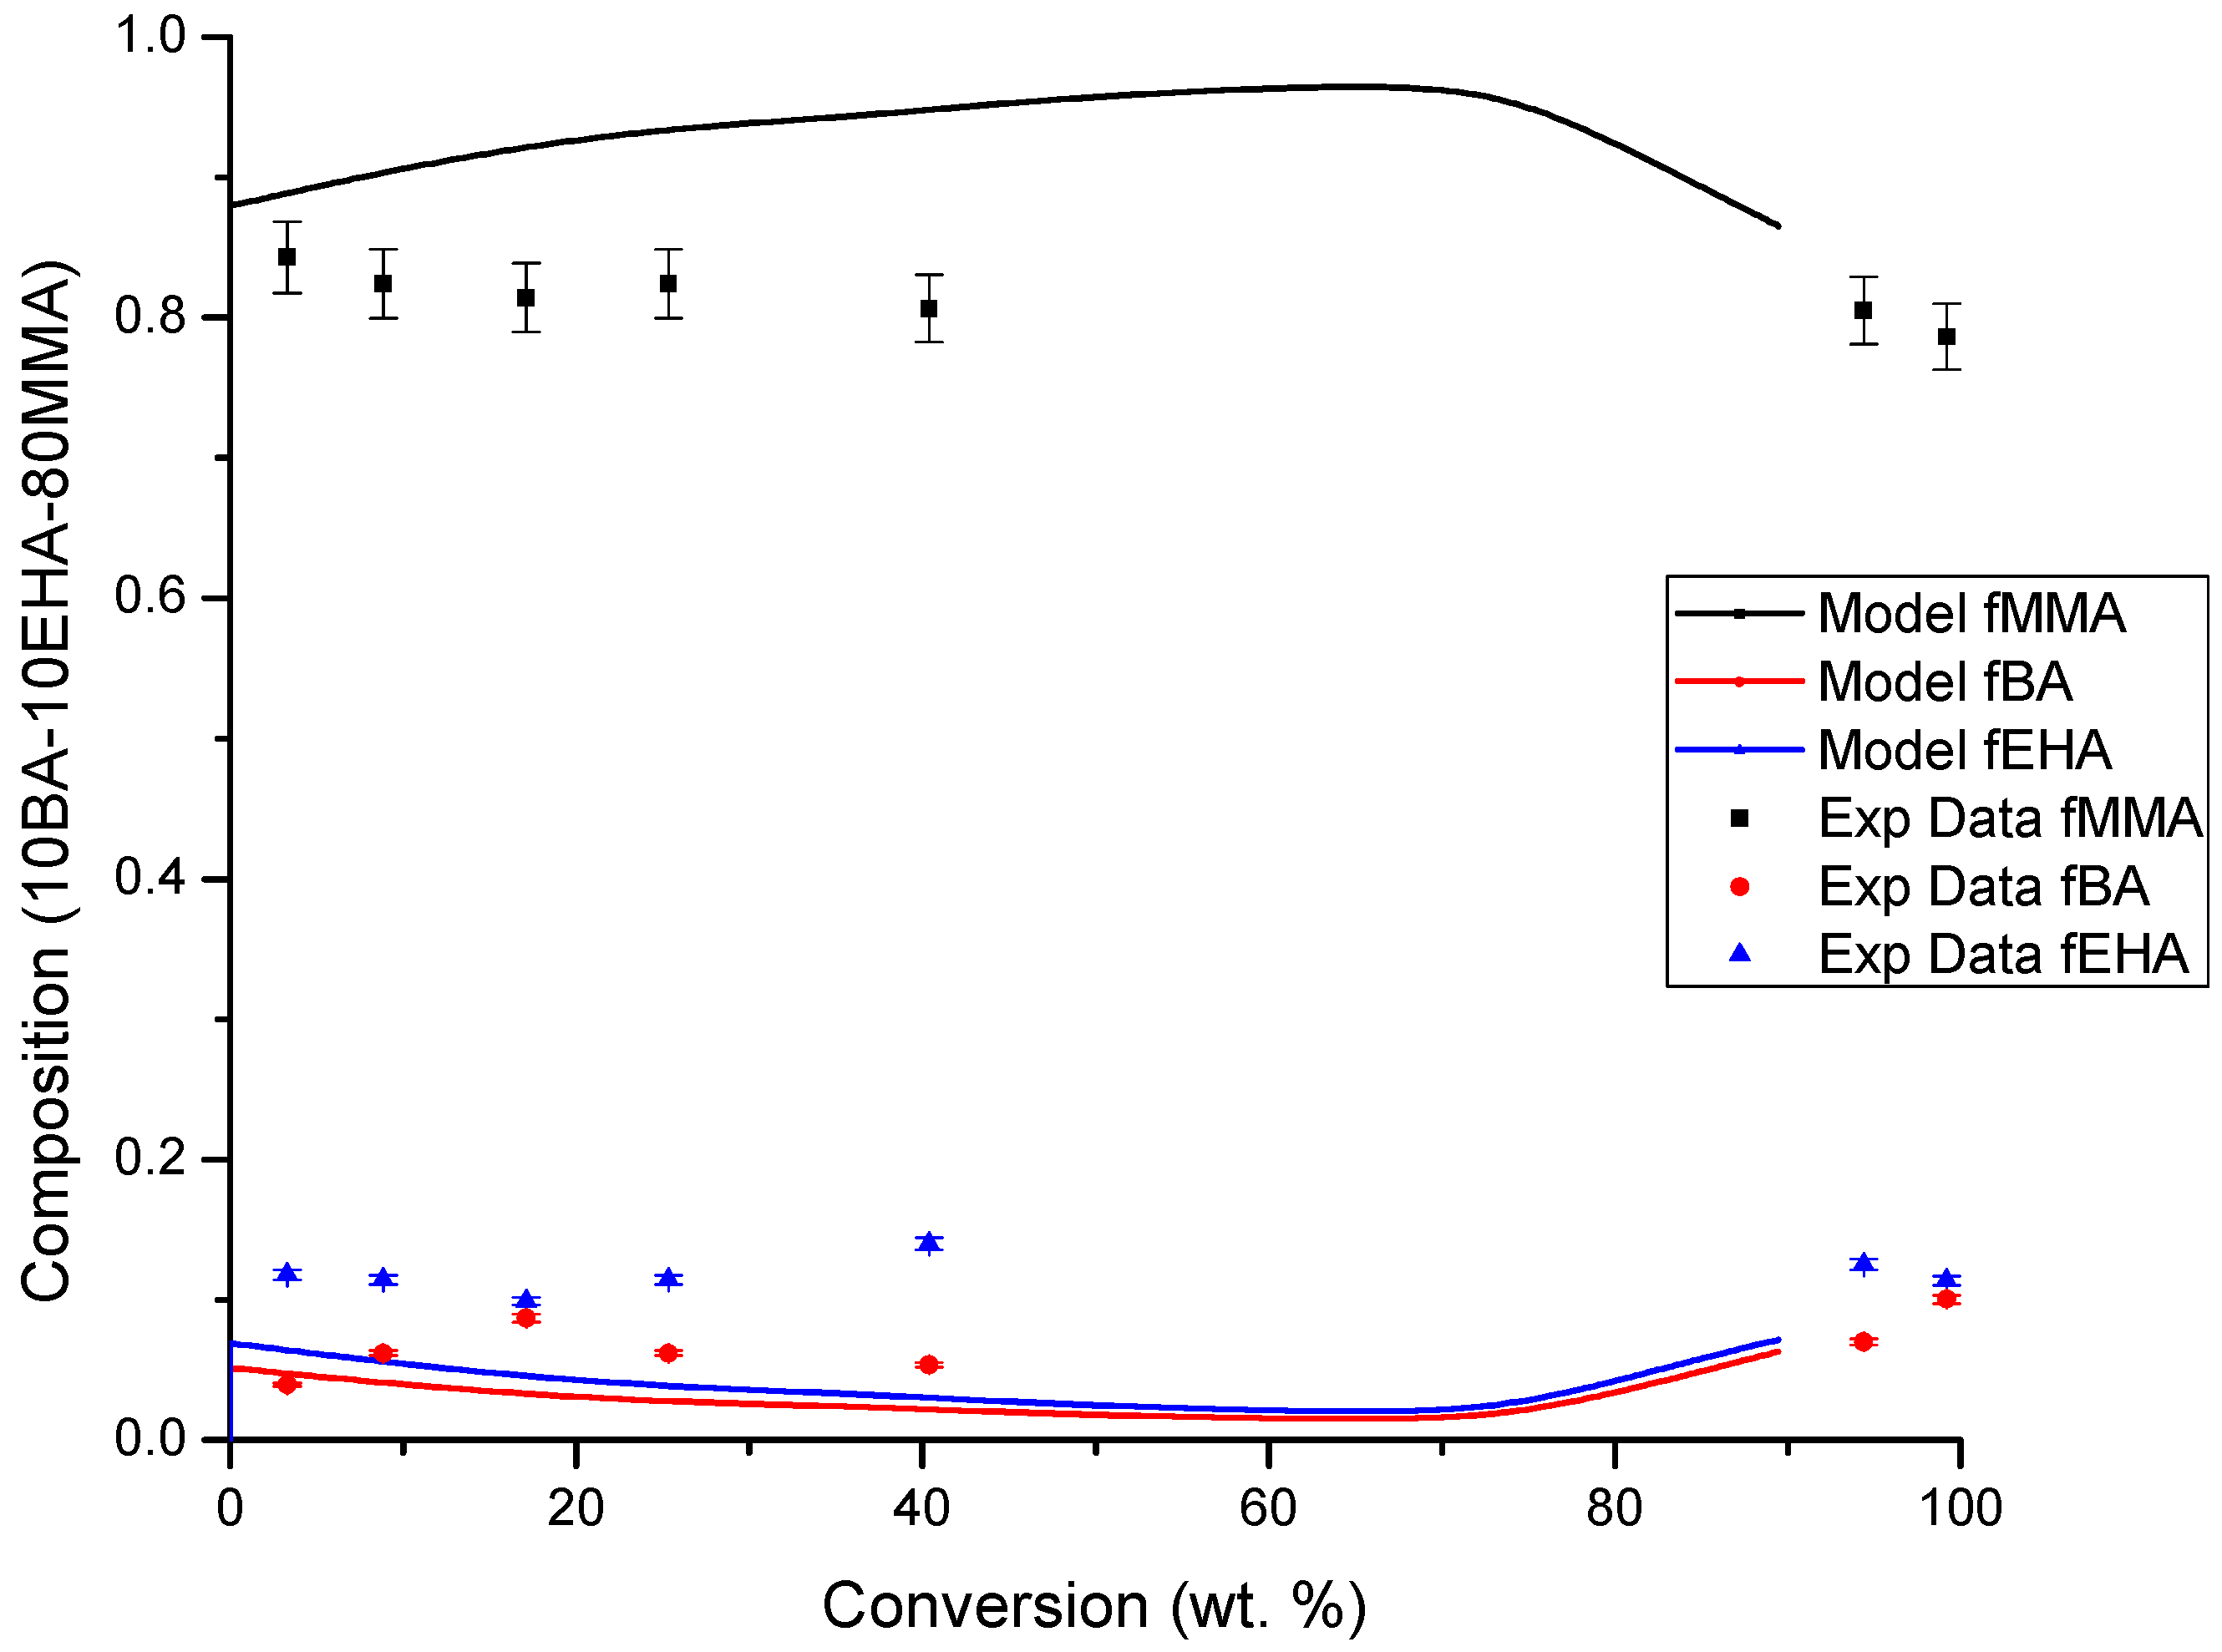
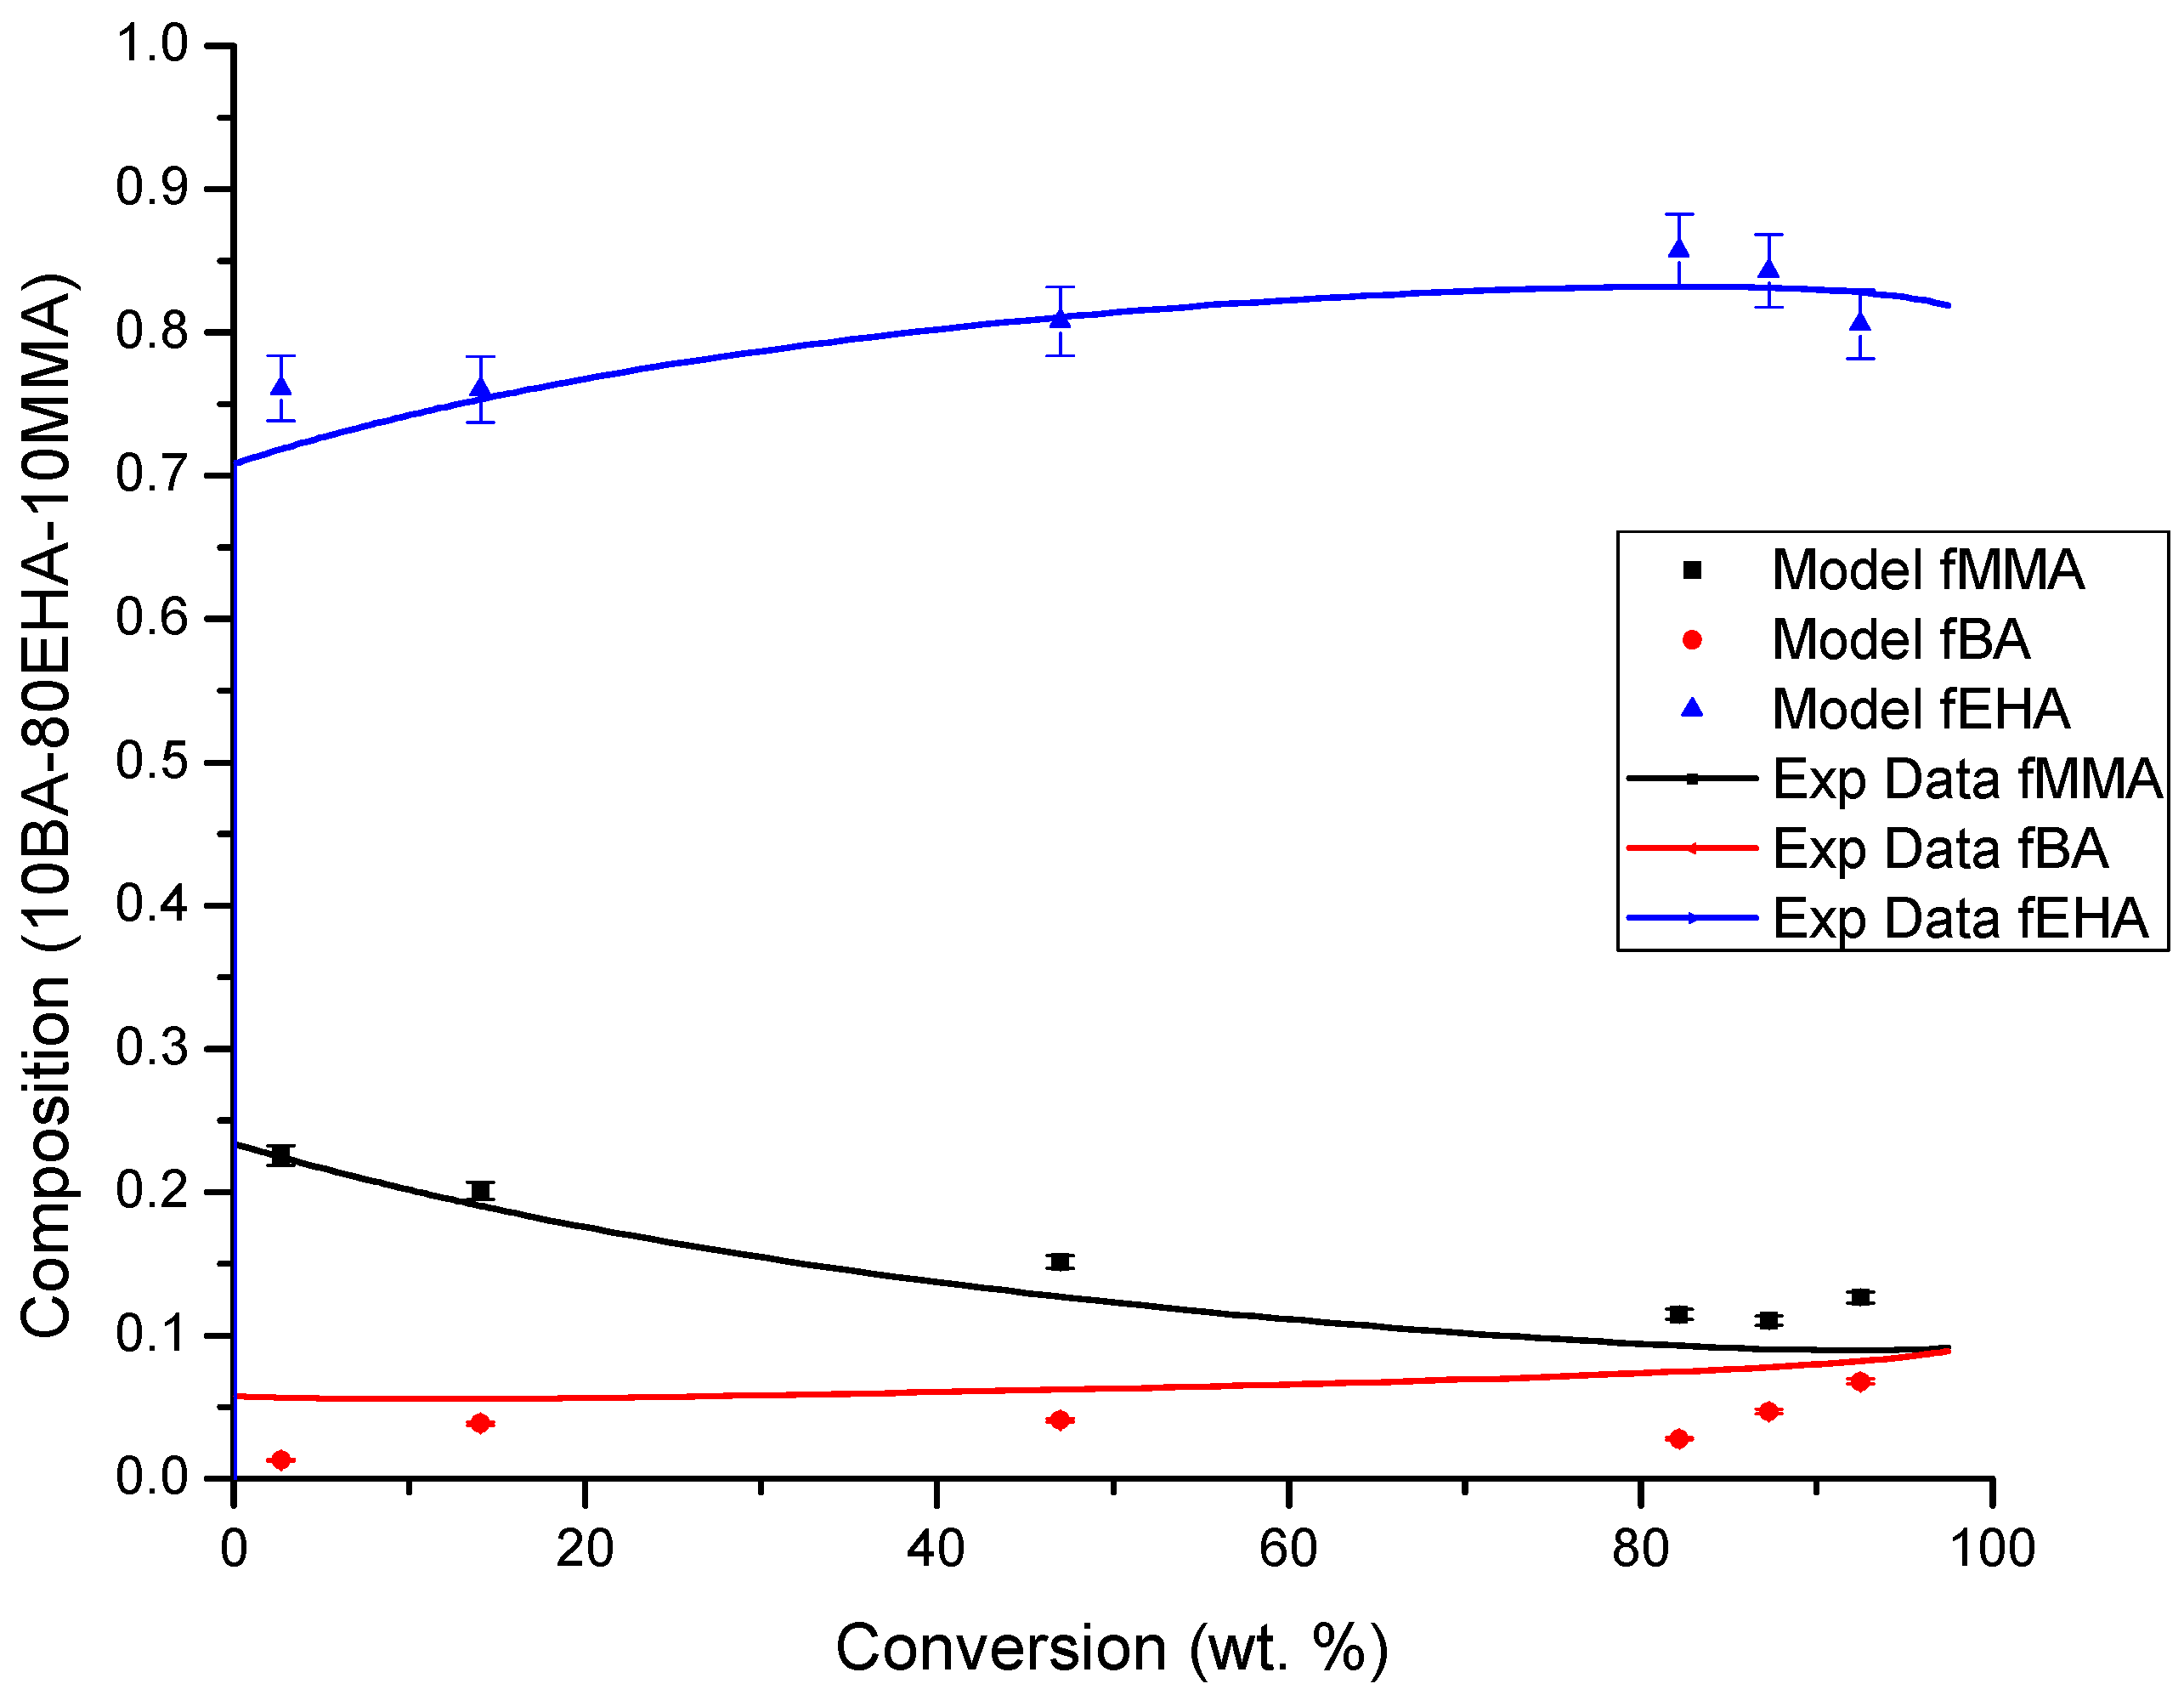
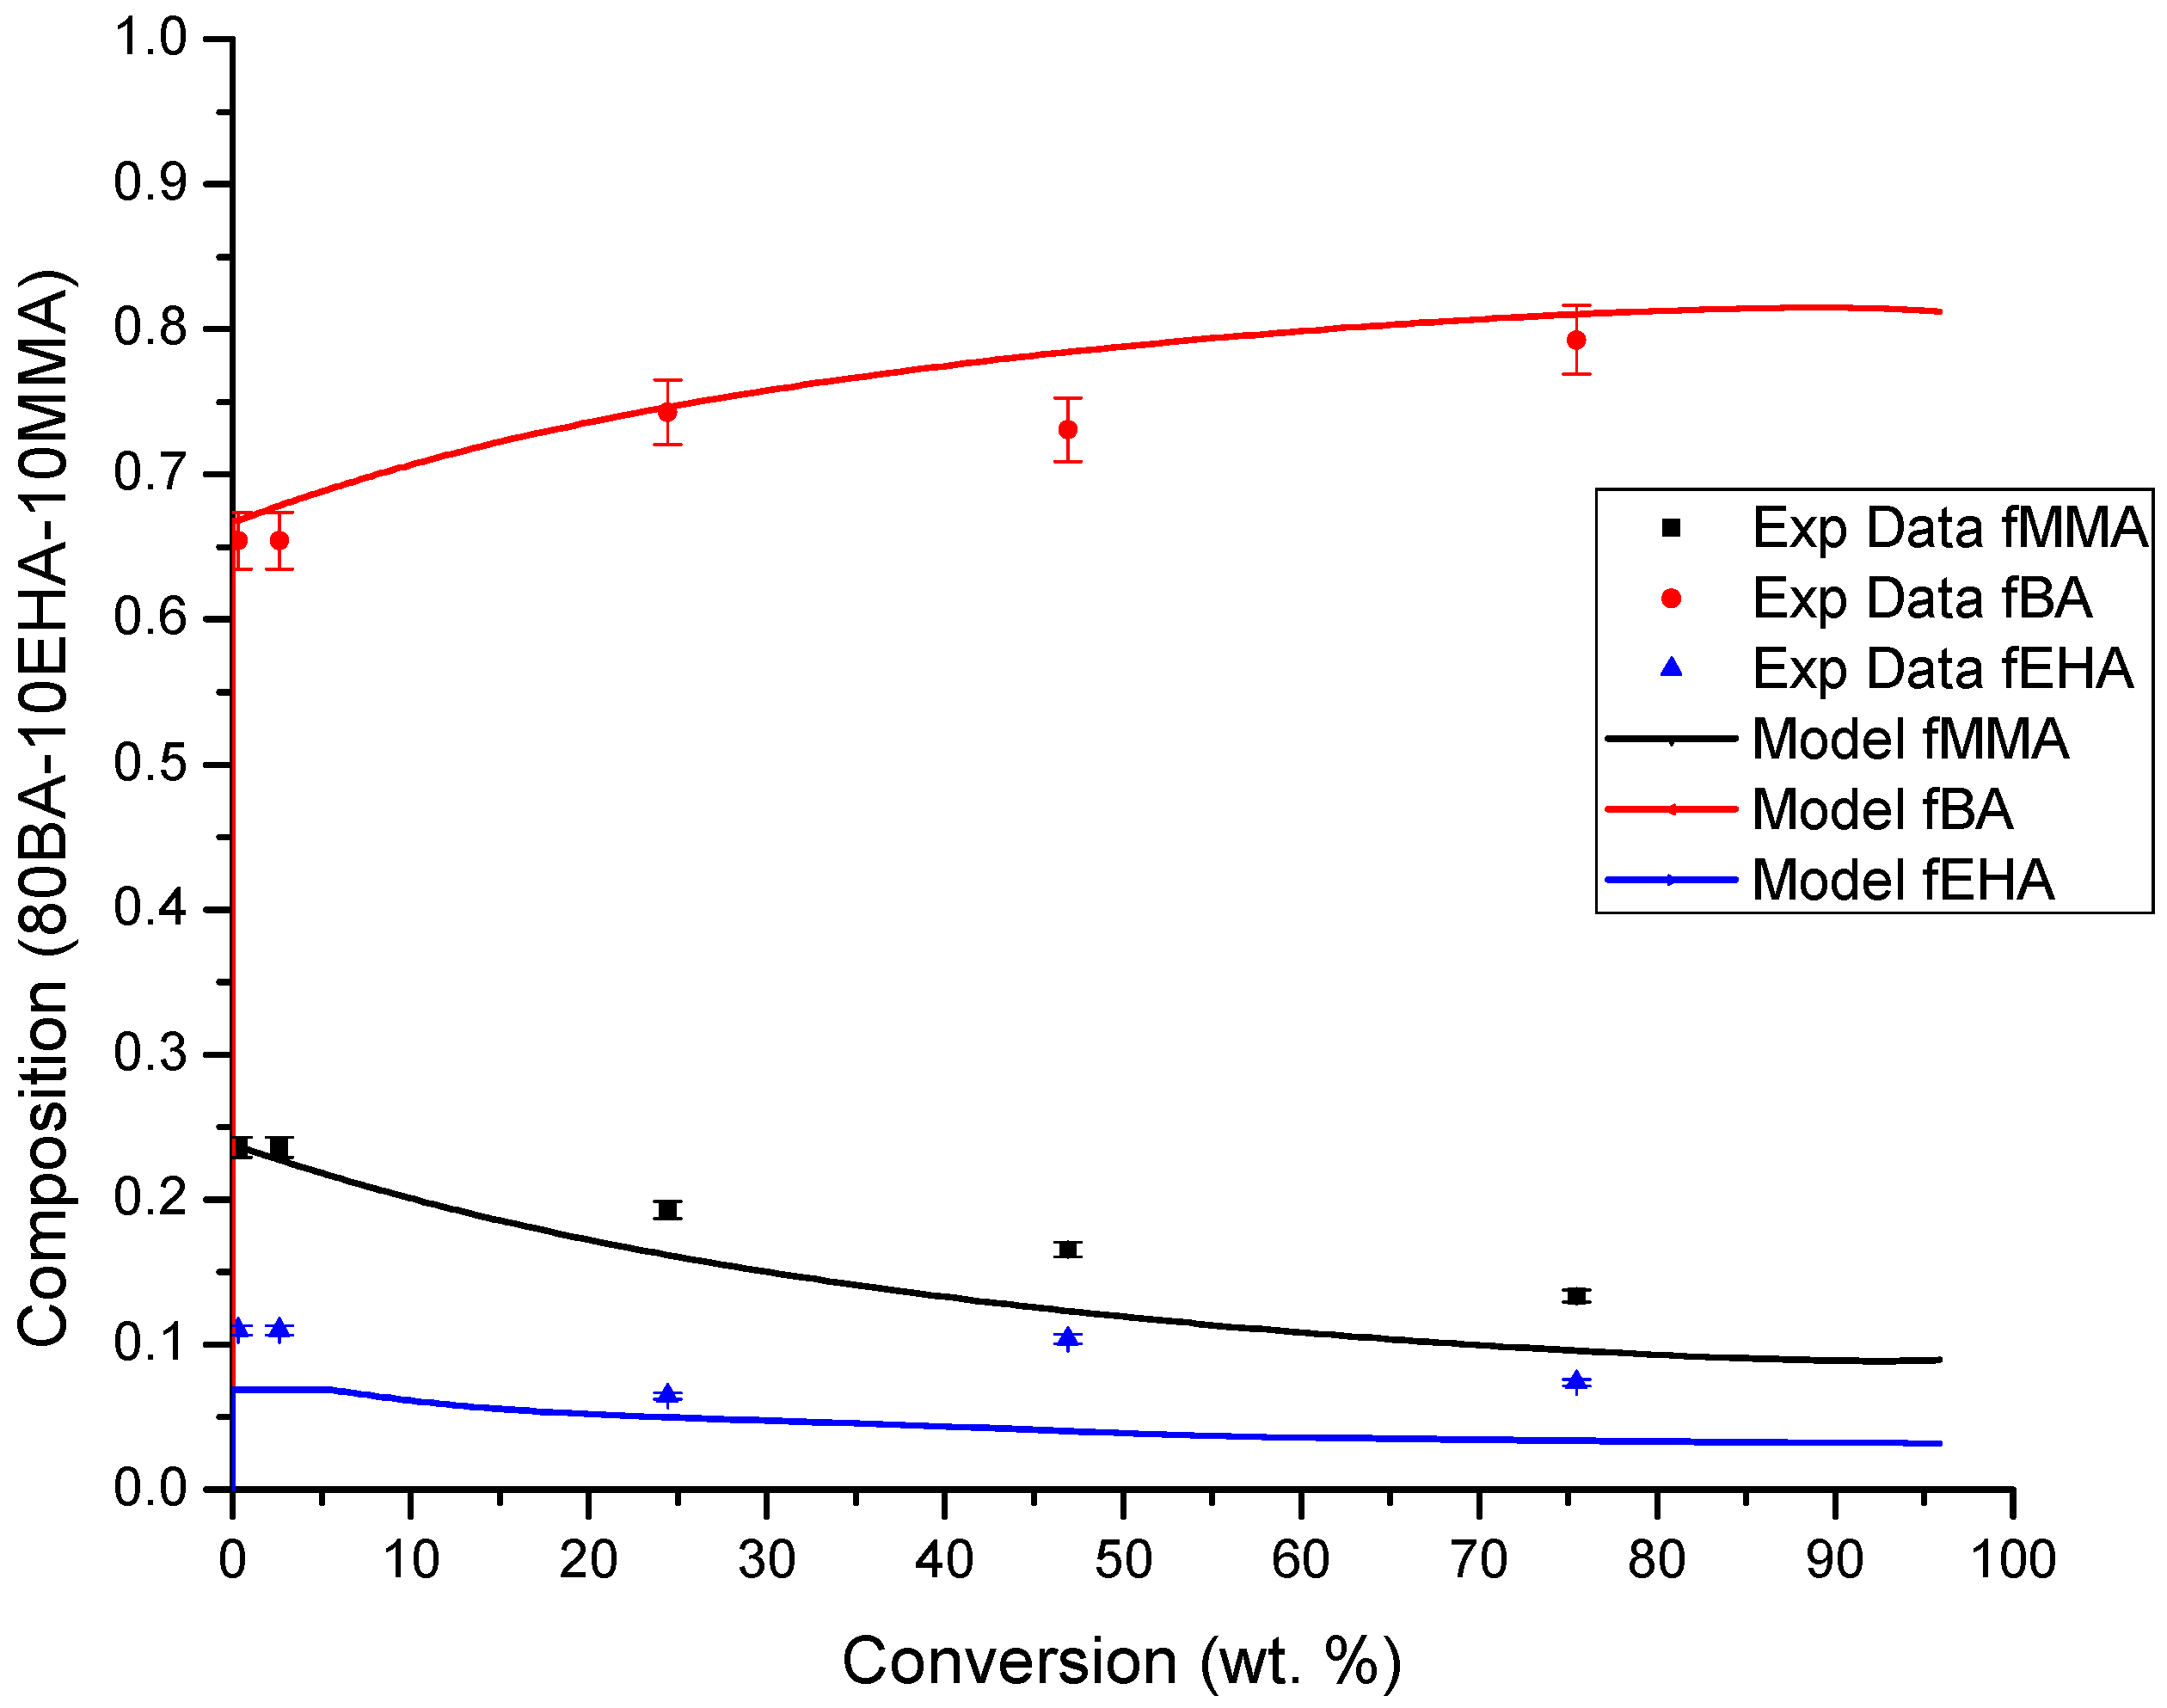
4.3. Copolymer Composition versus Conversion Profiles

As expected, accurate predictions of copolymer composition versus conversion strongly depend on the reactivity ratios used in the calculations. Given the excellent agreement between experimental data and calculated profiles of copolymer composition versus conversion at several initial compositions for the copolymerizations of BA and EHA, as well as MMA/EHA (see Figure 13 and Figure 14), it is fair to say that the estimates of reactivity ratios for such systems [14] were very good.
However, as observed in Figure 15, Figure 16 and Figure 17, the same does not hold entirely true for the terpolymerization cases. The agreement between experimental data and model predictions of copolymer composition versus conversion for terpolymerizations 80BA/10EHA/10MMA (see Figure 17) and 10BA/80EHA/10MMA (see Figure 16) is very good, but it is poor for case 10BA/10EHA/80MMA, as observed in Figure 15. On a first thought, one may argue that better reactivity ratio estimates may be needed, particularly for MMA-BA interactions. It is observed in Figure 15 that the largest deviation between experimental data and model predictions occurs when initial MMA content is highest. Given the lower kp value for MMA, compared to the corresponding values for BA and EHA, it may be argued that MMA incorporates slower into the copolymer and its composition could be slightly lower, as observed in the experimental profile (solid squares) of Figure 15. The adjustments carried out to eliminate induction times from experimental data may be an issue here. However, on a closer look, it is inferred from Table 9, that although the reactivity ratios at zero conversion coincide with the available ones, the fact that different free volume parameters (β values) for the cross-propagation terms were used, that causes the ratios to change (according to Equation (29); ratios of kpi0 remain unchanged, but since the βs are different, the actual ratios do not remain constant).

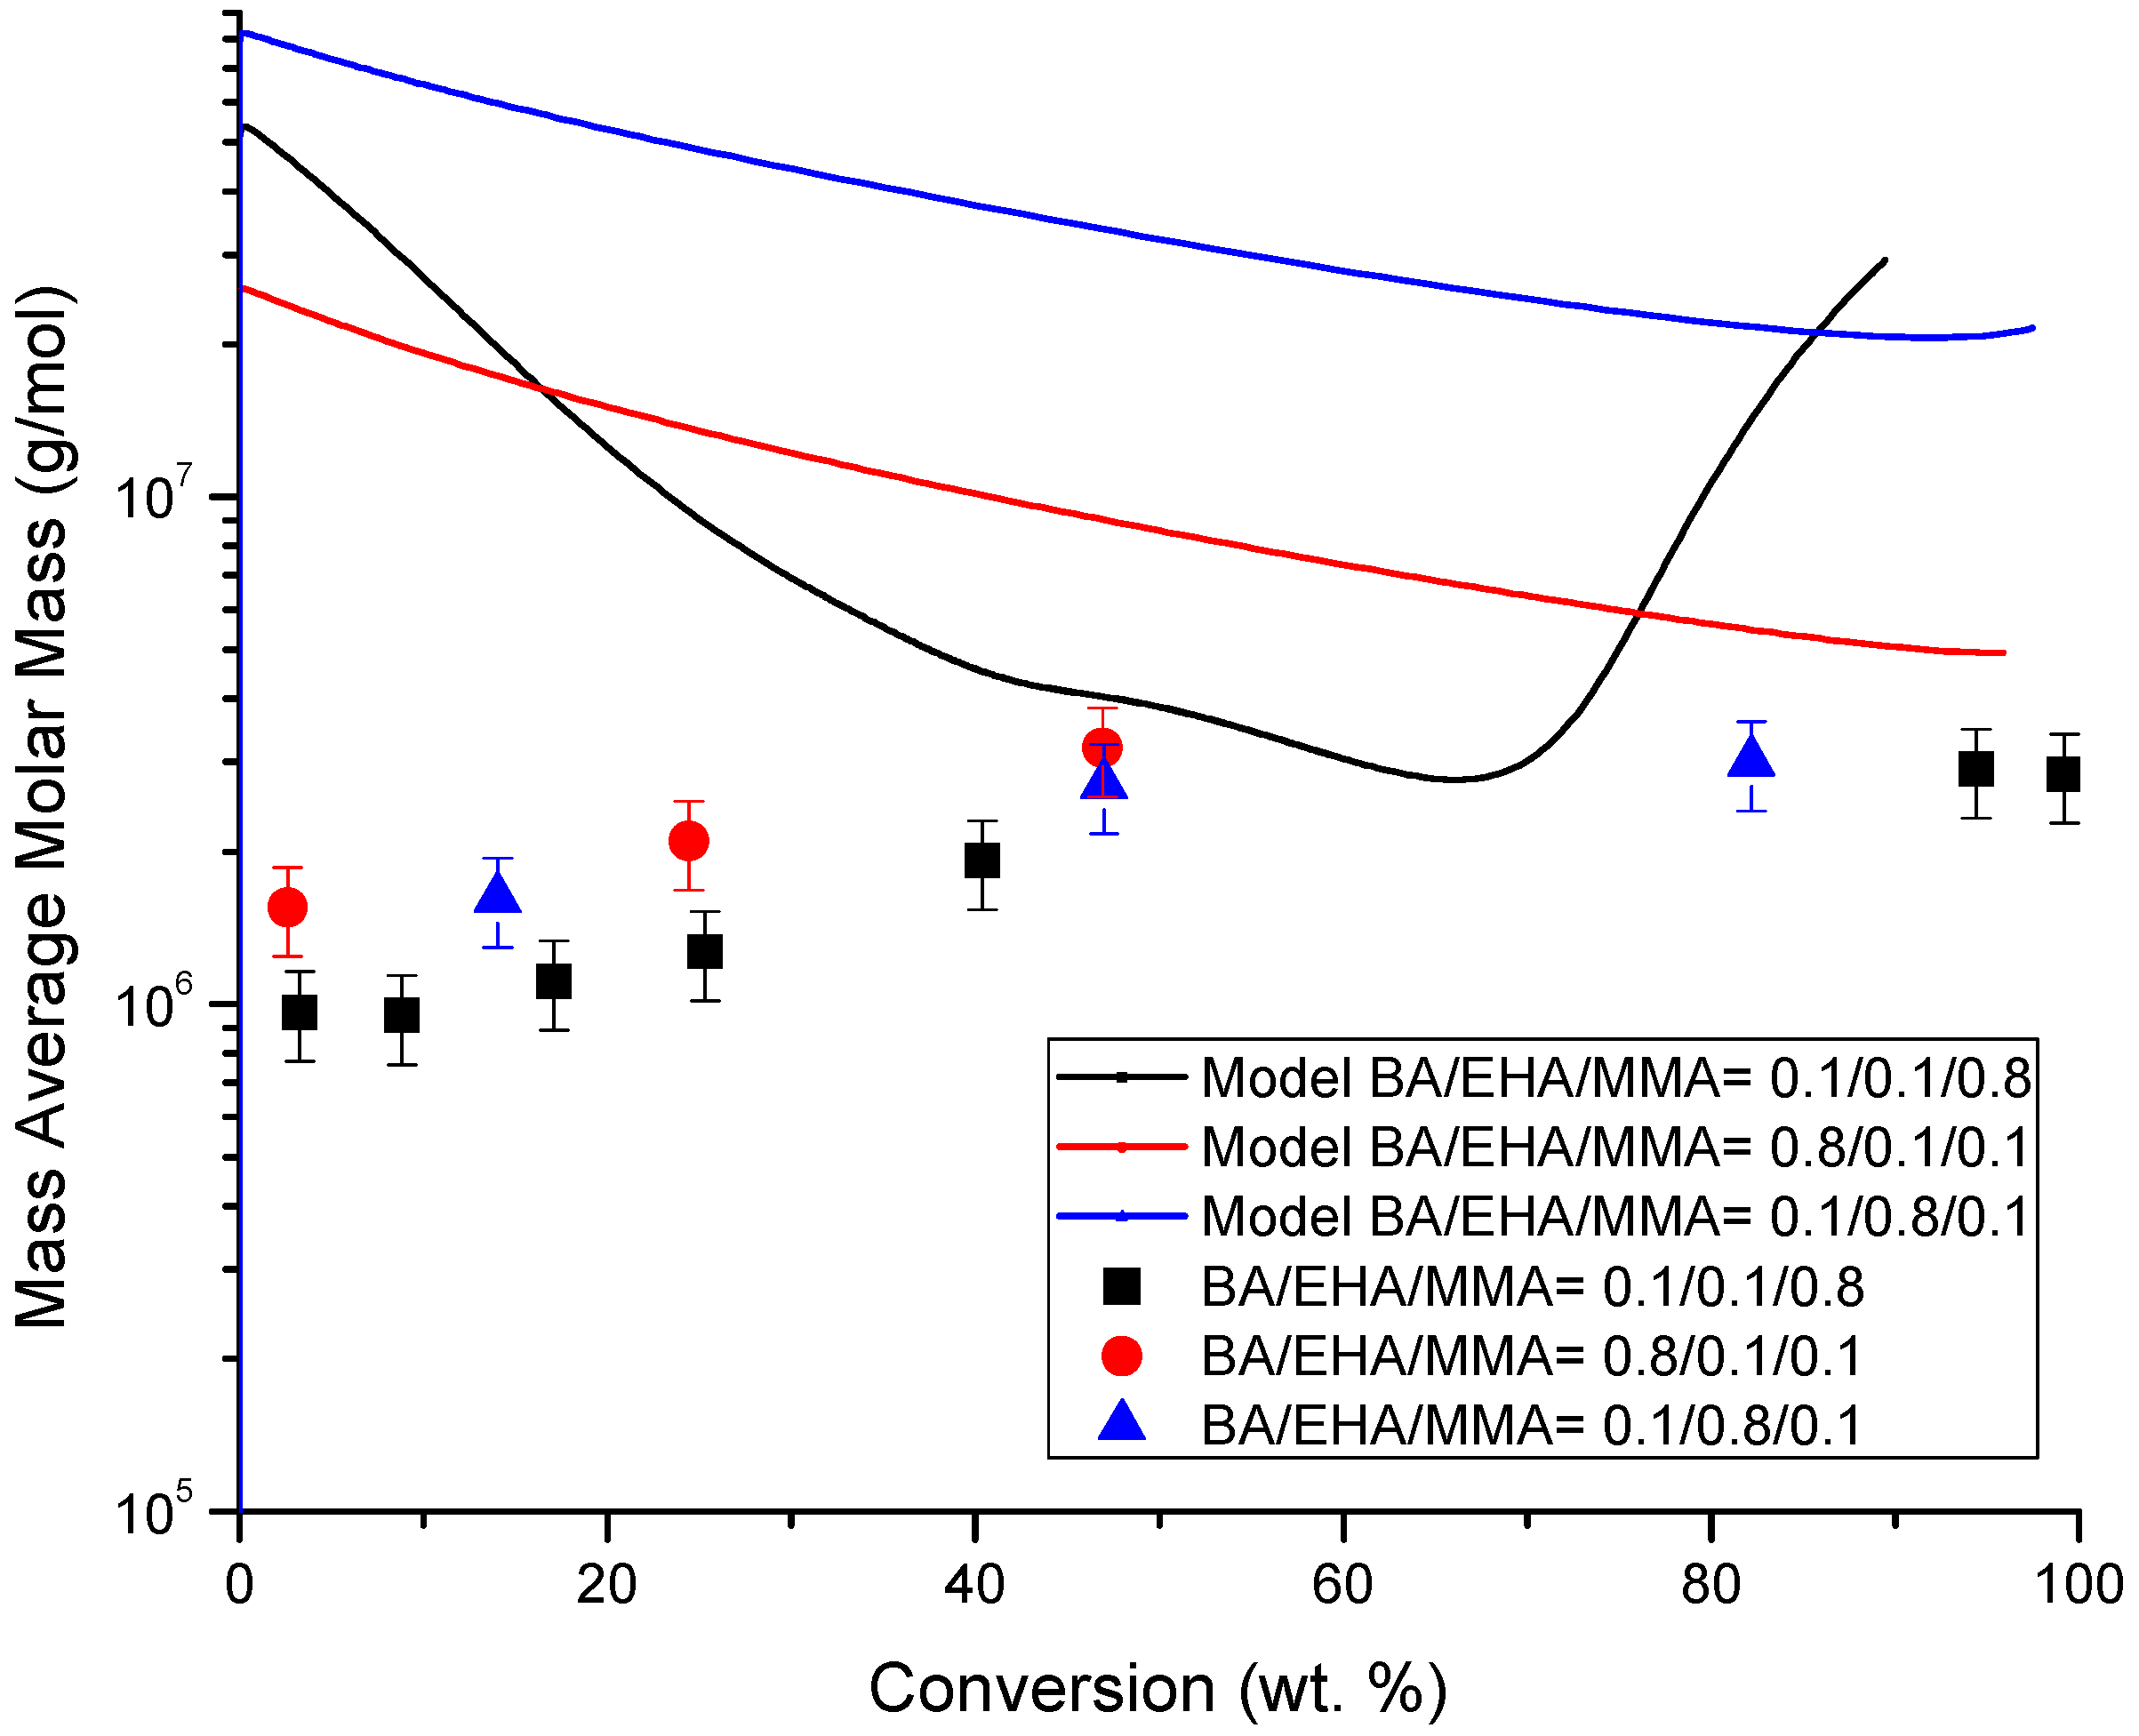
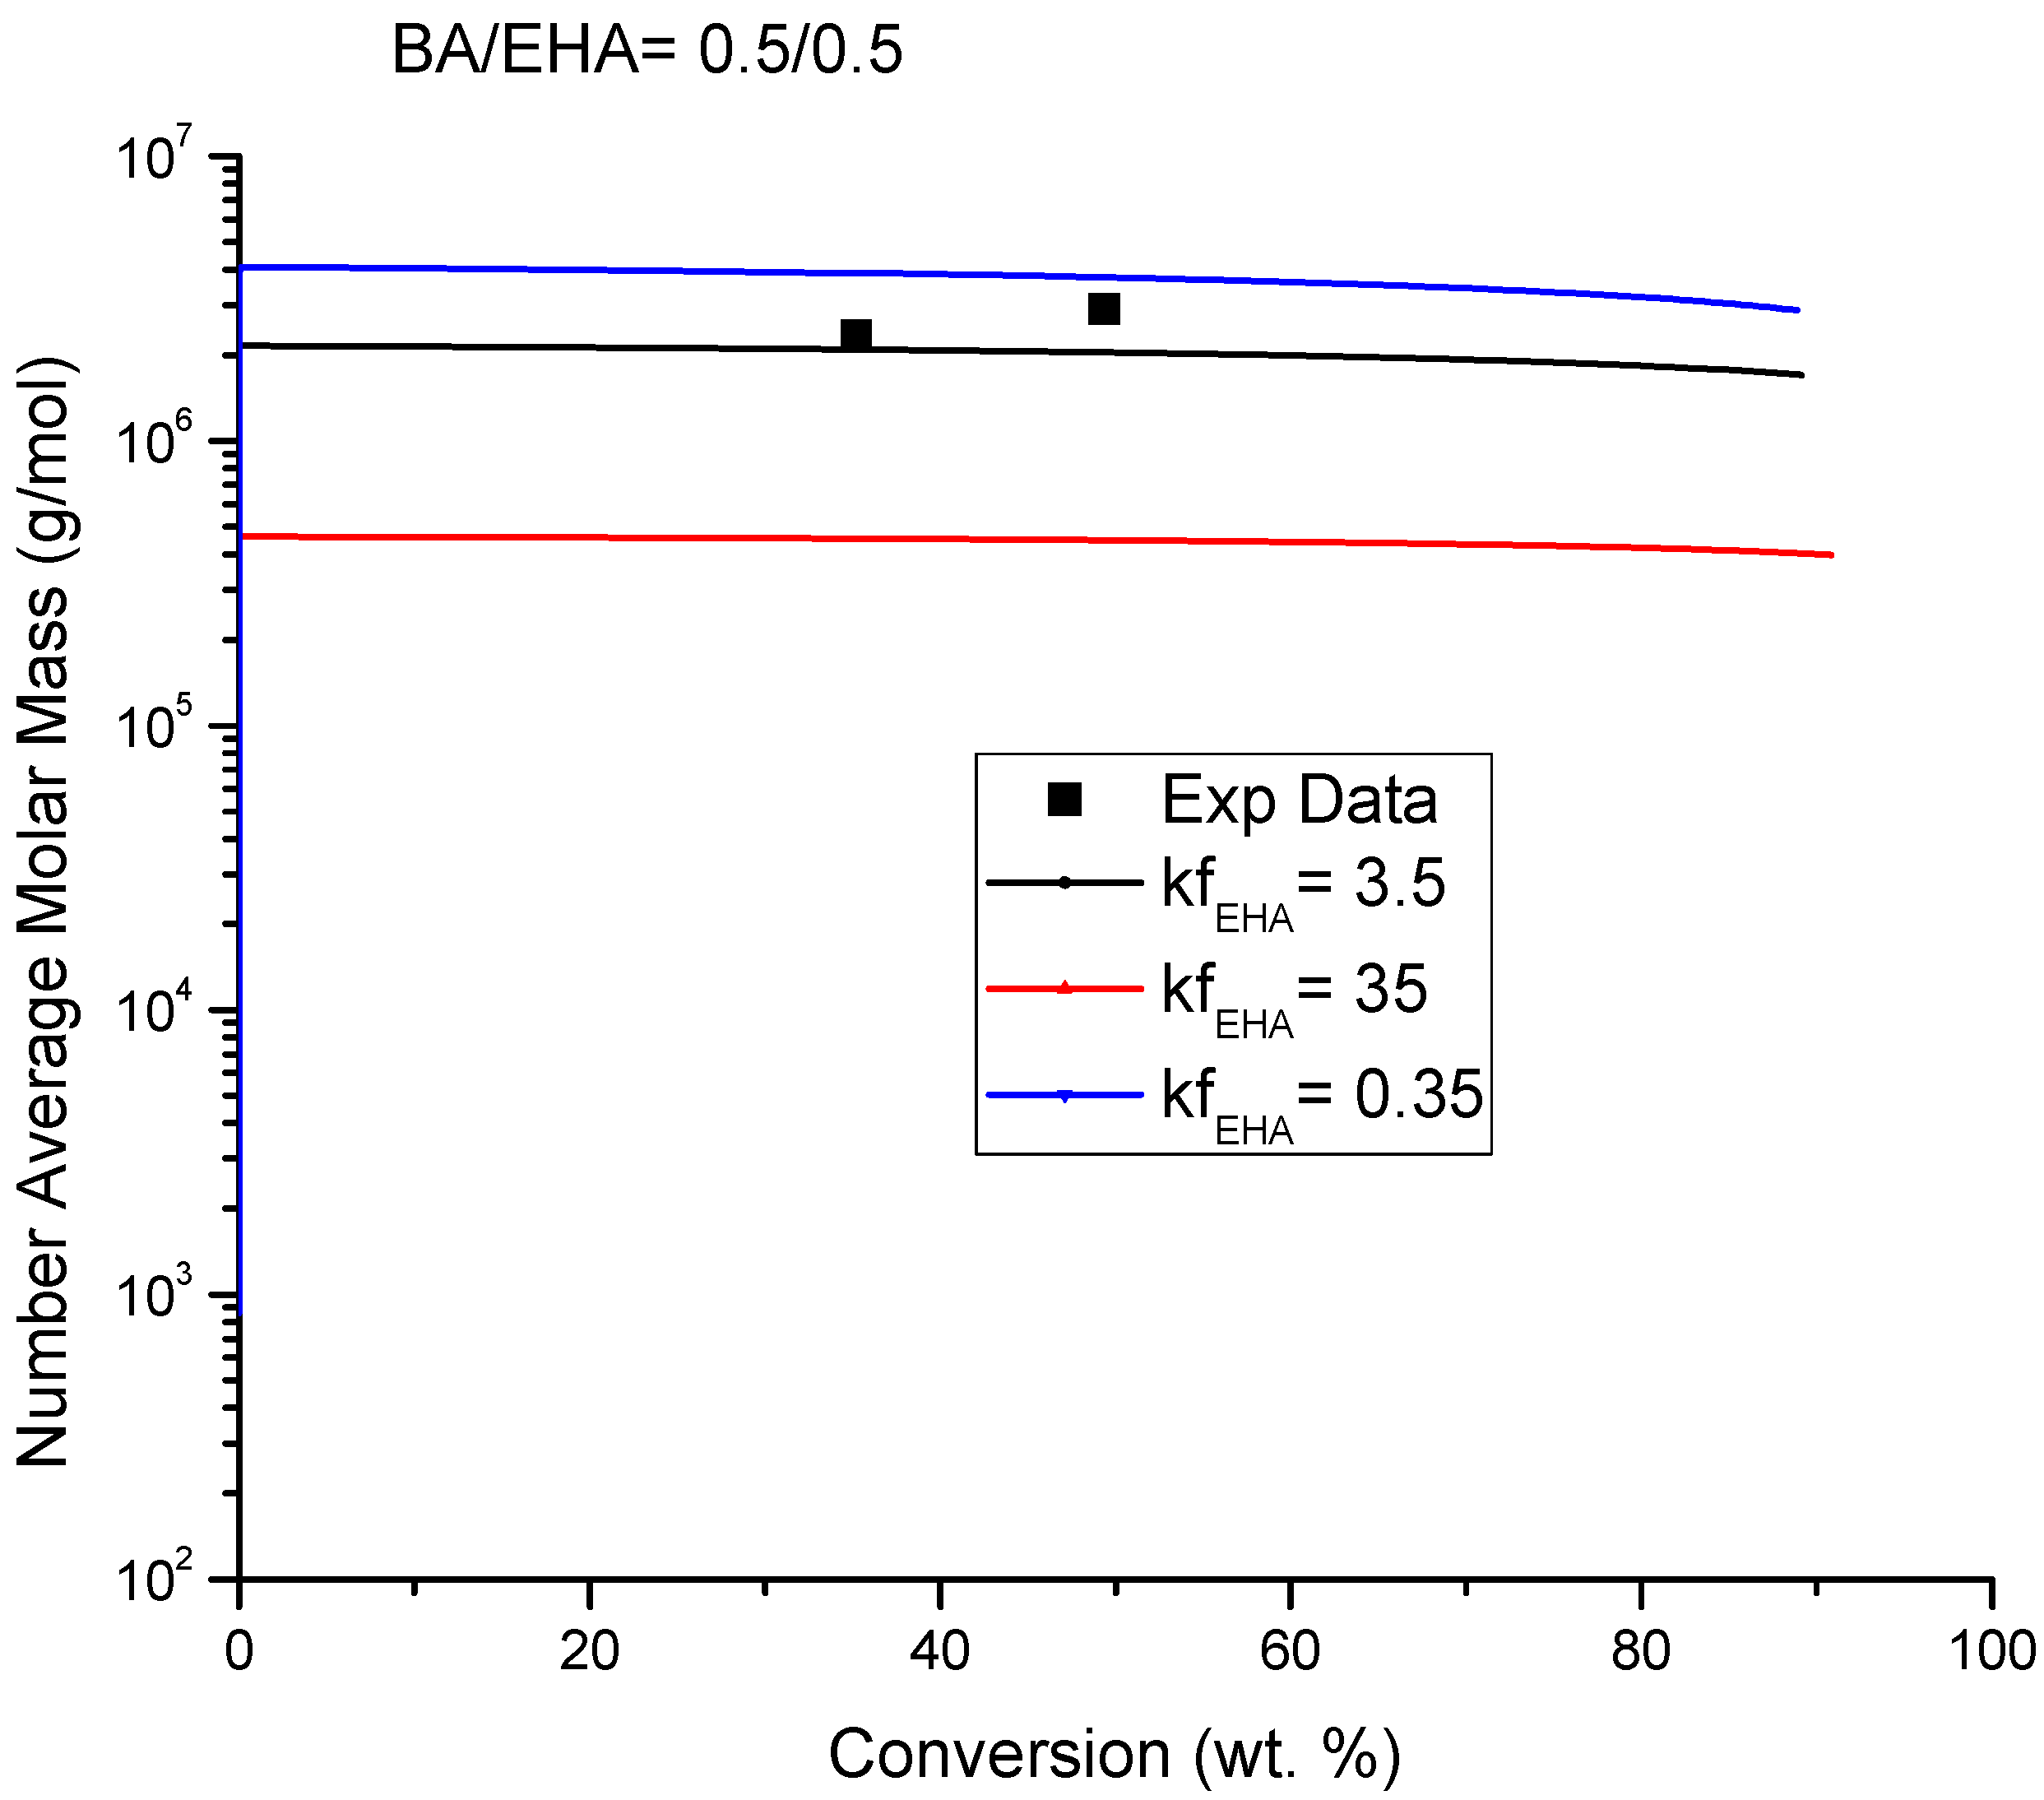
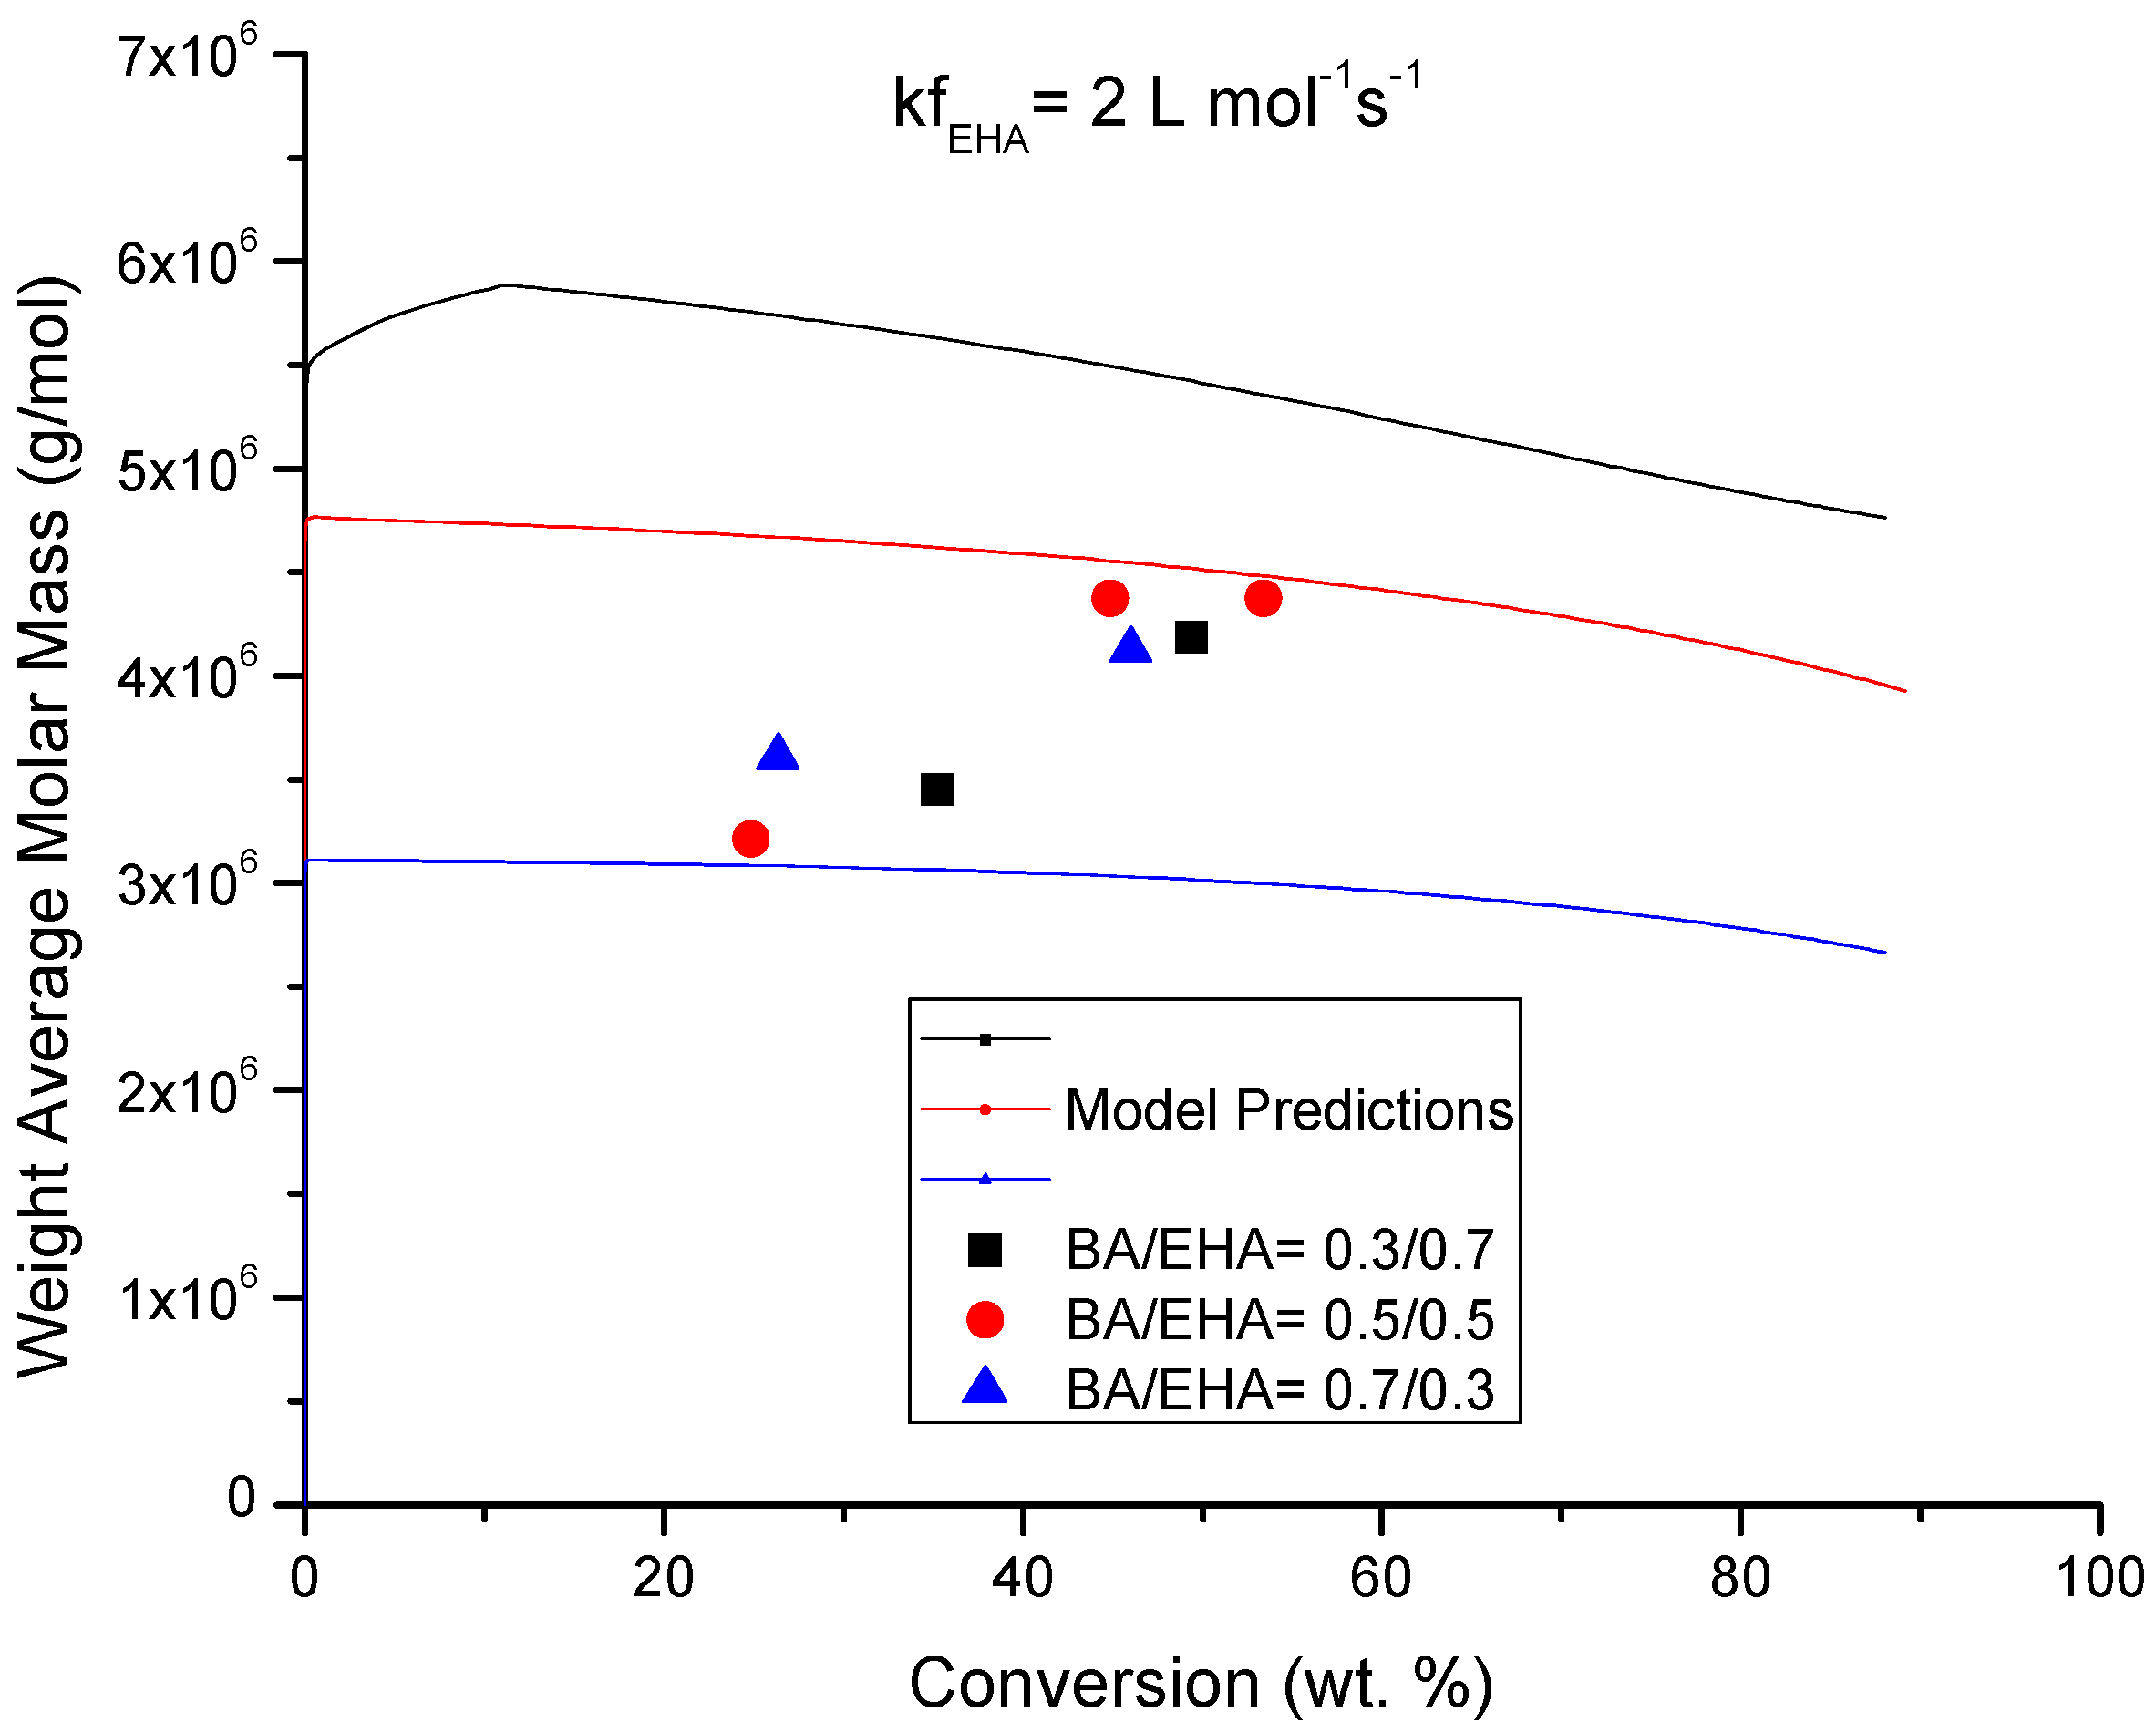
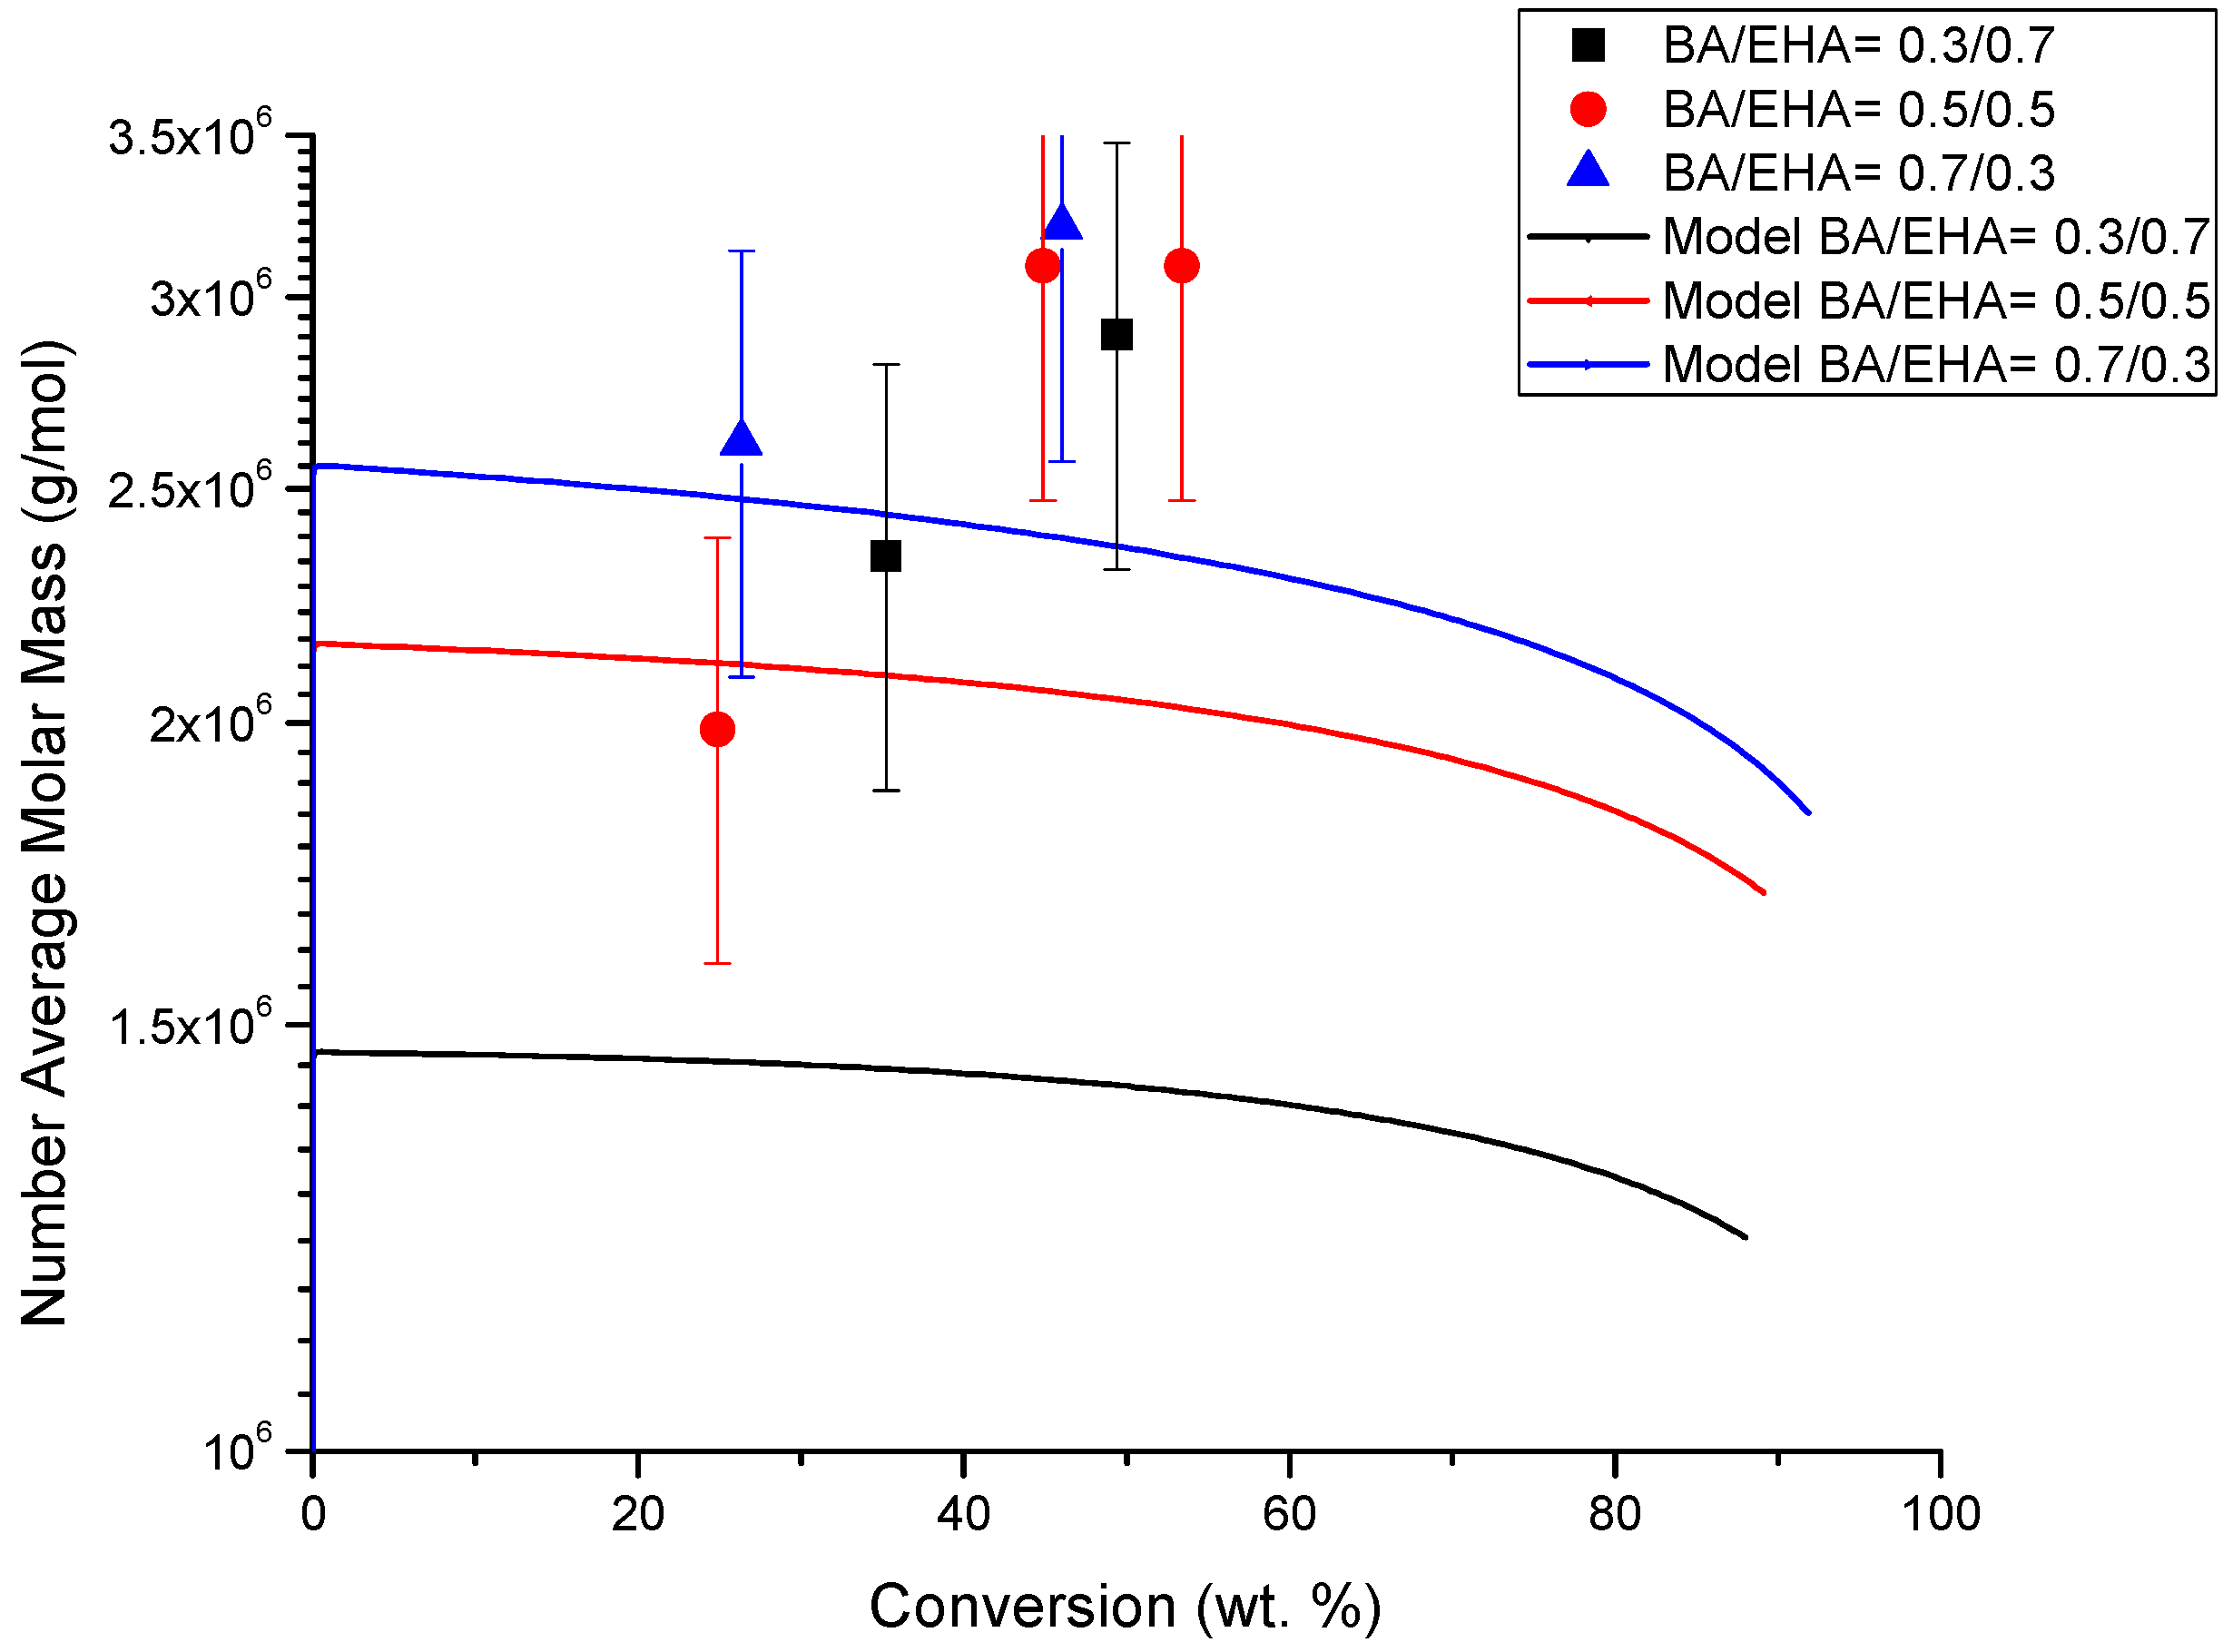
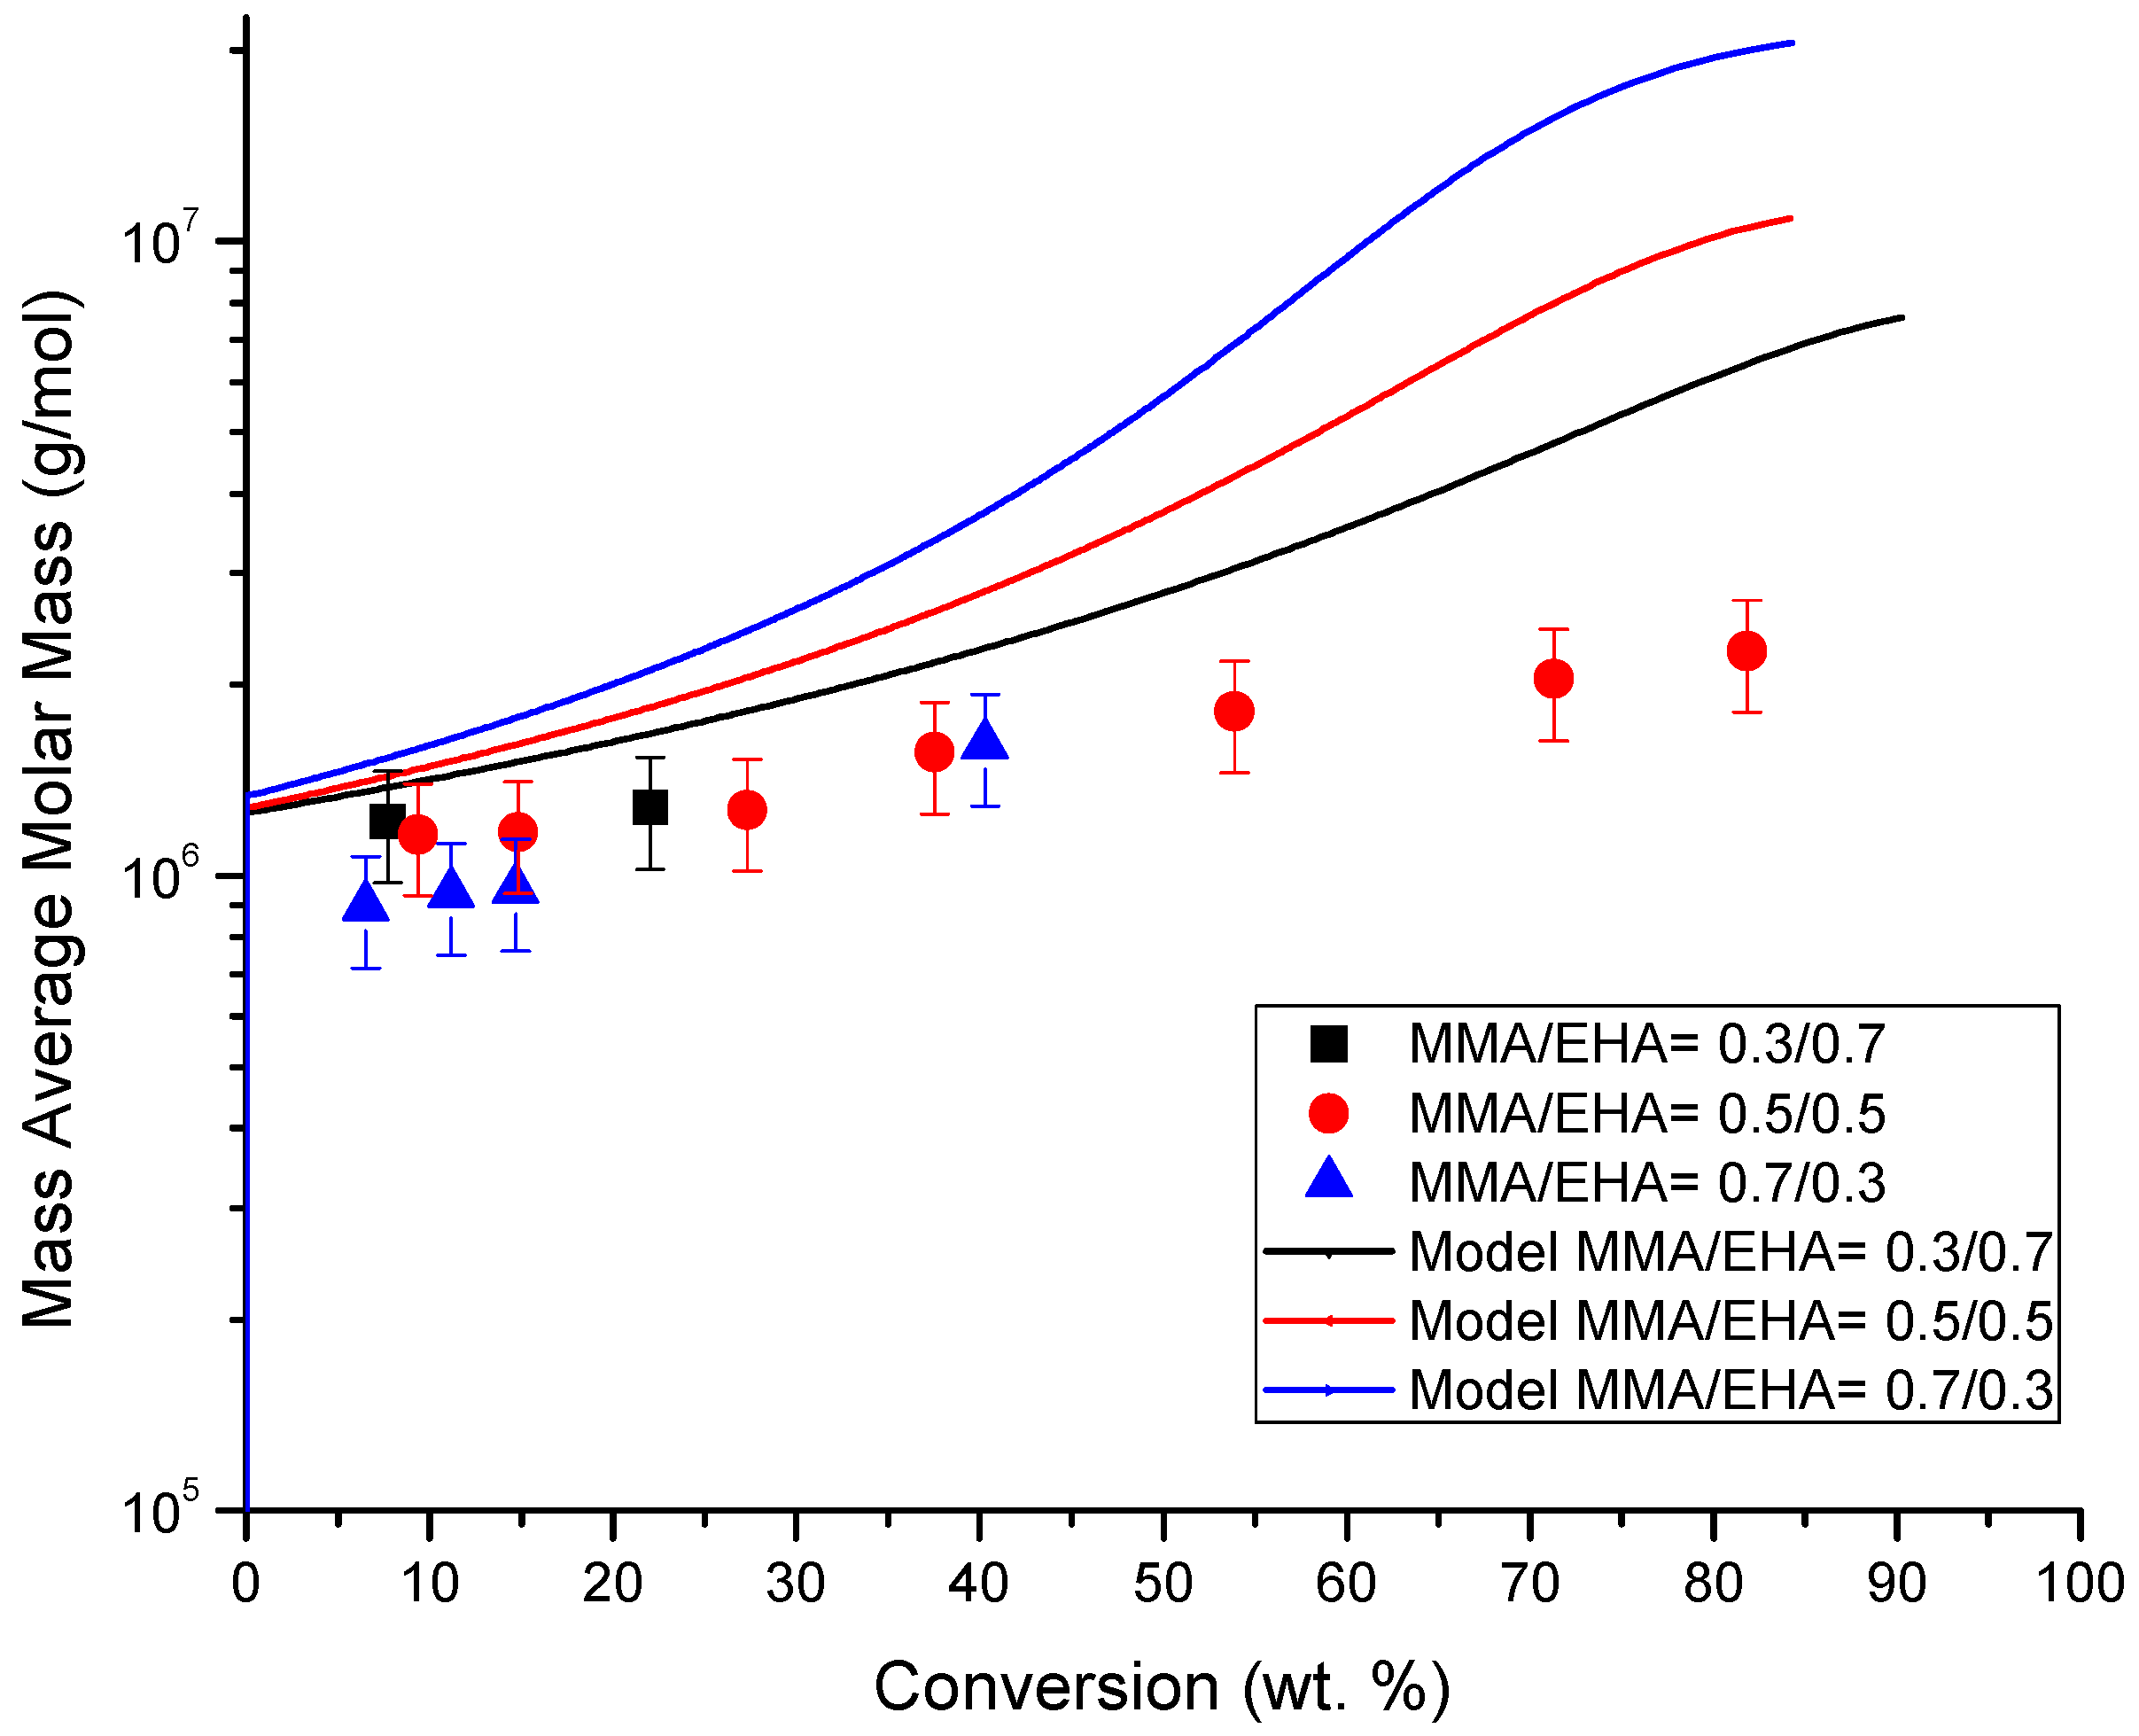
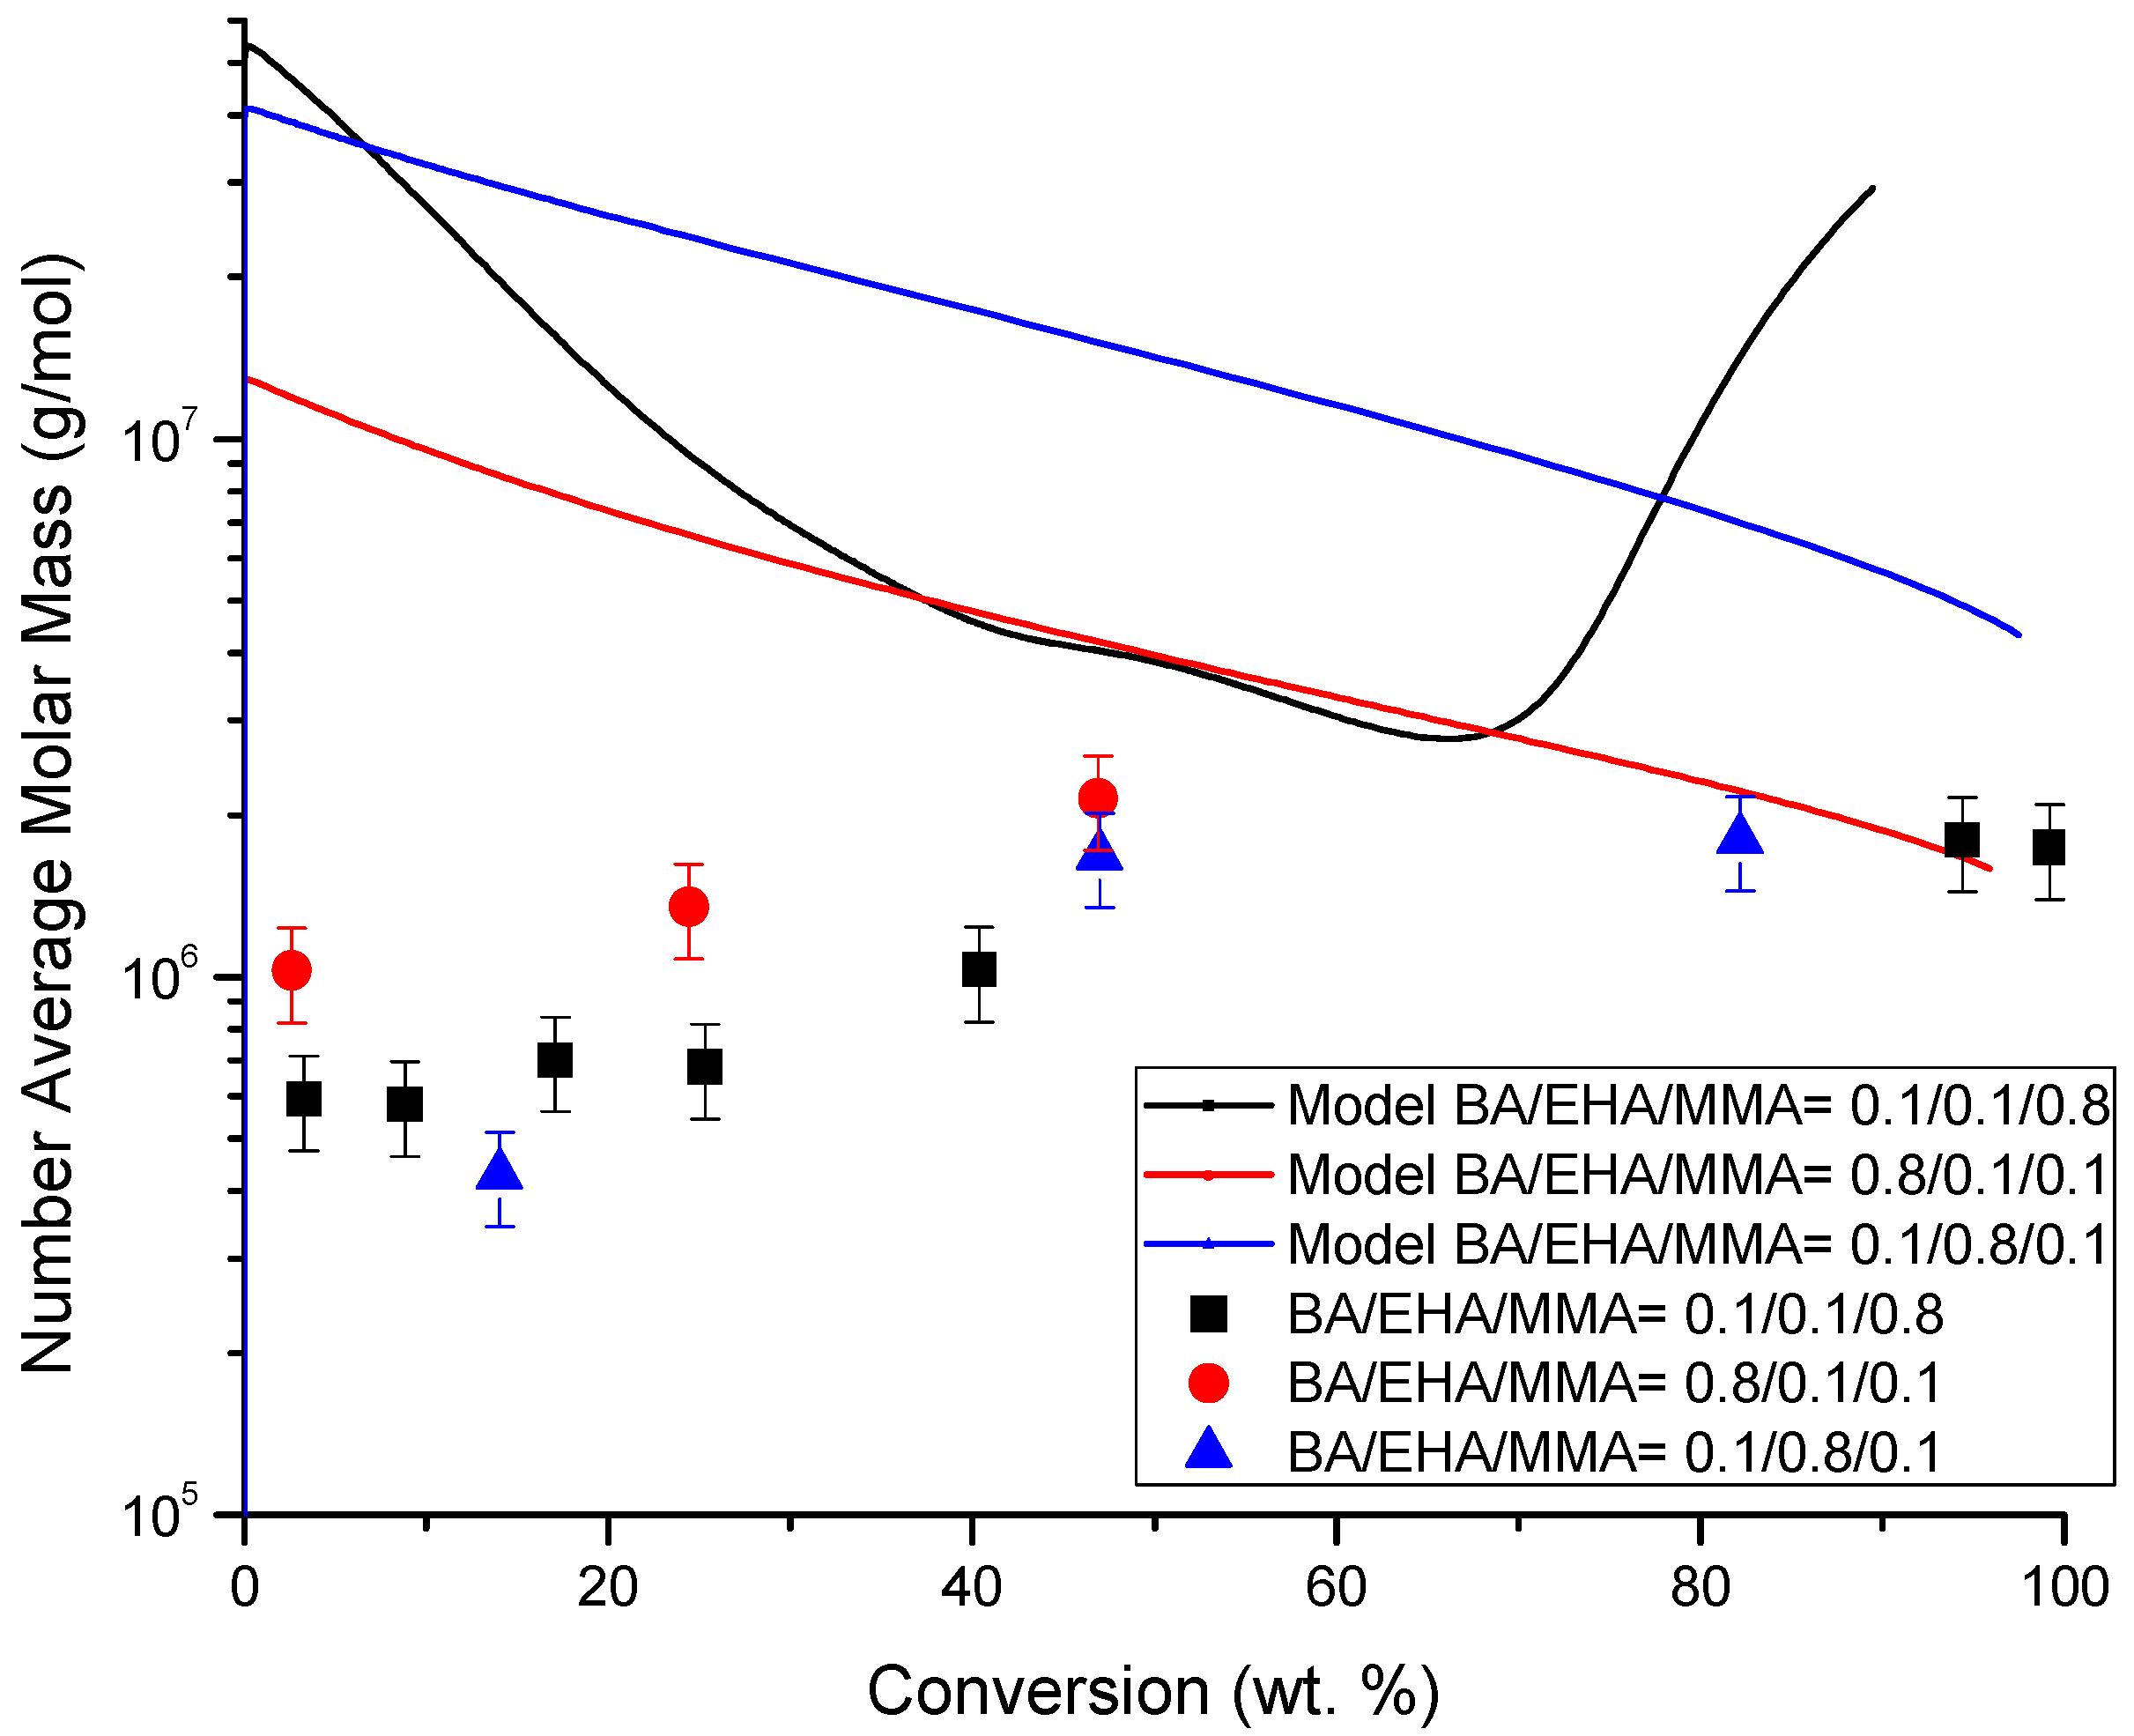
4.4. Molecular Weight versus Conversion Profiles

As observed in Figure 18, Figure 19, Figure 20, Figure 21, Figure 22 and Figure 23, the agreement between experimental data and calculated profiles of molar mass (Mn, Mw and Ð) versus conversion for the copolymerizations of BA and EHA as well as MMA and EHA is reasonably good. Order of magnitude agreement was obtained in both cases. It is observed from the experimental data of Mn, Mw and Ð that changes on initial monomer composition do not have significant effects on the molecular weights and dispersity achieved. The same trend was predicted by the model at low conversions, but significant deviations are observed at high conversions (calculated Mw-and consequently Ж being much higher than the corresponding experimental data).
As observed in Figure 21 and Figure 22 for copolymerization of MMA and EHA, the model predicts a slightly faster increase of molar mass as the polymerization proceeds, namely, the calculated profiles of both Mn and Mw slightly overpredict the molar masses achieved. It is also observed in these figures that although the experimental profiles seem to overlap, the effect of increasing the amount of MMA in the initial monomer mixture is captured in the opposite direction by the model. The experimental profiles show that molecular weight increases as the amount of MMA is decreased, whereas the calculated profiles show the opposite trend. To solve this issue, a more complete experimental study for the homopolymerization of EHA would be useful, since the chain transfer to the EHA kinetic rate coefficient had to be estimated in this study. However, the increasing trend of molar mass as time elapses is nicely captured by the model. This increasing trend was possible to reproduce by including diffusion-controlled dependence to the chain transfer to monomer reaction. Otherwise, flat profiles were obtained.
In the case of copolymerization of BA and EHA, although order of magnitude predictions of Mn and Mw were obtained, which was partly possible by the inclusion of DC effects in the chain transfer to monomer and backbiting reactions; the evolution with conversion of the profiles was captured very poorly. This may be explained by the fact that crosslinking and gelation occurred in the experimental system and these phenomena were not included in the model. Furthermore, as noted in the original data reference [14], because the samples were filtered prior to analysis, only the soluble part of the polymer could be analyzed. This situation also explains the large discrepancy between experimental and calculated values of Ð observed in Figure 20.
It is observed in Figure 24 and Figure 25 that our model is able to produce order-of-magnitude estimations of final molecular weights (Mn and Mw at high conversions), but their time (conversion) evolution is captured very poorly. As a matter of fact, the observed trends are opposite to the calculated profiles: The observed trend is that molecular weight increases within the same order of magnitude values, and the calculated profiles show huge decreasing trends (of about two orders of magnitude). Although this is not uncommon in polymerization modeling studies, these results may be attributed to the estimated kEHA chain transfer to monomer kinetic rate constant coefficients. As stated in Section 3.8 of this contribution, kEHA was used to fit BA/EHA and EHA/MMA copolymers molar masses. Since crosslinking and gelation occurred in the BA/EHA system, our estimation of kEHA was likely overpredicted. More complete experimental studies with a focus on capturing the early stages of the polymerization and gathering more data on molecular weight development are needed to improve our model.

5. Conclusions

MMA and BA are well-studied monomers whose polymerization kinetic rates coefficients are well known. However, this is not the case with EHA. Several important EHA kinetic rate coefficients (e.g., termination and transfer to monomer) had to be estimated in this study from experimental data not designed for such purposes.
The overall agreement between experimental data and model calculations for the three copolymerization systems was fairly good. Copolymer composition was captured very well with the model for systems BA/EHA and MMA/EHA. Some deviations between calculated and experimental data were observed in some cases for conversion versus time. Predictions of molecular weight development were rather poor in some cases, particularly for the terpolymer cases. Further experimental and modeling studies are needed, particularly for the estimation of chain transfer in EHA in bulk copolymerizations. From the experimental side, it would be useful to put more emphasis on reducing further or eliminating induction times (more through purification procedures) and gathering more experimental data for molecular weight development. Regarding the theoretical side, it would be useful to carry out simulations where BA is present with inclusion of crosslinking and gelation phenomena.
Finally, it is important to point out that our simulations were carried out using a global set of parameters. Namely, the parameters were not changed in individual cases to improve data fitting. If we had done that, our simulated profiles would have fit the experimental data much better, but that was not the point of our study.

Author Contributions

J.A.G.-R. performed all the simulations and parameter estimation procedure, guided by E.V.-L. M.A.D. and V.A.G. conceived the experimental research. V.A.G. conducted all experiments and characterization. M.A.D. and E.V.-L. provided technical direction to the project. J.A.G.-R. wrote the paper with feedback from V.A.G., while M.A.D. and E.V.-L. revised the final document.

Funding

This research was funded by: DGAPA-UNAM, grant numbers PAPIIT IG100718 and IV100119; Facultad de Química-UNAM, grant number PAIP 5000-9078.

Acknowledgments

Additional financial support from the following sources is gratefully acknowledged: (a) Consejo Nacional de Ciencia y Tecnología (CONACYT, México), MEng scholarship granted to J.A.G.-R.; and (b) Natural Sciences and Engineering Research Council (NSERC) of Canada.

Conflicts of Interest

The authors declare no conflict of interest.

Nomenclature

BAn-Butyl Acrylate
EHA2-Ethylhexyl Acrylate
MMAMethyl Methacrylate
DCDiffusion-Controlled (Effects)
PSAPressure Sensitive Adhesive
AIBNAzobisisobutyronitrile
fiMonomer Fraction for species i
IInitiator
I•Primary Radical
MiMonomer for species i
Pi(s)•Secondary Radical for species i
Qi(s)•Tertiary Radical for species i
PiPolymer for species i
Pi(s)•Secondary Radical for species i
kiInitiator Decomposition Kinetic Rate Coefficient
fInitiator Efficiency Factor
kpiPropagation Kinetic Rate Coefficient for species i
kpijCross-Propagation Kinetic Rate Coefficient for species iand j
kfiChain Transfer Kinetic Rate Coefficient for species i
kfijCross-Chain Transfer Kinetic Rate Coefficient for species i
kbbBackbiting Kinetic Rate Coefficient for n-Butyl Acrylate
ktiGlobal Termination Kinetic Rate Coefficient for species i
ktciTermination by Combination Kinetic Rate Coefficient for species i
ktdiTermination by Disproportionation Kinetic Rate Coefficient for species i
kfitertTertiary Radical Chain Transfer Kinetic Rate Coefficient for species i
kpitertTertiary Radical Propagation Kinetic Rate Coefficient for species i
ktcijCross-Termination by Combination Kinetic Rate Coefficient for species i
ktdijCross-Termination by Disproportionation Kinetic Rate Coefficient for species i
rijReactivity Ratio beween species iand j
βAttraction/Separation Overlap Factor in free-volume theory
α M Expansion Coefficient for Monomer
α P Expansion Coefficient for Polymer
vfFree Volume at a given calculated time
vfoFree volume at initial conditions
VmiMonomer Volume for species i
VpiPolymer Volume for species i
TgPPolymer Glass Temperature
TgMMonomer Glass Temperature
TSystem Temperature

Appendix A

As stated in Section 3.8, the parameter estimation procedure consisted of a combination between careful literature review, detailed parameter sensitivity analyses and the use of educated guesses (trial and error guided from the information gained from the literature review and the parameter sensitivity analyses). The strategy is illustrated in this appendix with a few examples related to the estimation of ktEHA, kfEHA and the β-parameters for DC effects.
As shown in Figure A1 for system 30BA/70EHA, ktEHA has a strong effect on polymerization rate and because of that it was used to fit conversion versus time data at low conversions (up to 20–30 wt. % monomer conversion). From the results shown in Figure A1, it seemed that ktEHA = 1 × 10⁸ L mol−1 s−1 was the best fit. However, as shown in Figure A2 and Figure A3 for systems 50BA/50EHA and 70BA/30EHA, respectively, that value was not the best for such systems. Therefore, the value of ktEHA was set by using a single value (ktEHA = 5 × 10⁸ L mol−1 s−1) that could reproduce reasonably well the experimental data for the three compositions and the experimental data (at different compositions) for system MMA/EHA (profiles not shown for those cases).
Figure A1. Effect of ktEHA on conversion versus time profiles for system 30BA/70EHA.
Processes 07 00395 g0a1
Figure A2. Effect of ktEHA on conversion versus time profiles for system 50BA/50EHA.
Processes 07 00395 g0a2
Figure A3. Effect of ktEHA on conversion versus time profiles for system 70BA/30EHA.
Processes 07 00395 g0a3
The calculated conversion versus time profiles agreed well with experimental data at low conversions but deviated at the high conversion region. The agreement at high conversions was improved by considering DC effects, namely, by adjusting βp and βt. When carrying out parameter sensitivity analyses for those parameters, it was found that it was the ratio of them, which was useful for data fitting purposes. Table A1 and Figure A4, Figure A5 and Figure A6 show some of the data sets used for estimation of βp and βt (Table A1 and Section 3.7) and the profiles obtained for the BA/EHA system. As shown in Figure A7 DC effects also affect the composition versus conversion profiles, a fact that was also considered in the estimation of the DC β-parameters.
Table A1. Tested βtp ratios for BA/EHA system.
BA βtpEHA βtpBA/EHA βtpFigure
Set 132164A4
Set 2 (Model)1682A5 (2)
Set 3841A6
Figure A4. Effect of the ratio βtp (DC effects) on conversion versus time profiles for system BA/EHA (Set 1 of Table A1).
Processes 07 00395 g0a4
Figure A5. (Figure 2) Effect of the ratio βtp (DC effects) on conversion versus time profiles for system BA/EHA (Set 2 of Table A1).
Processes 07 00395 g0a5
Figure A6. Effect of the ratio βtp (DC effects) on conversion versus time profiles for system BA/EHA (Set 3 of Table A1).
Processes 07 00395 g0a6
Figure A7. Comparison of modeling profiles of copolymer composition (MMA content) versus conversion, considering or neglecting DC effects, for system 30MMA/70EHA.
Processes 07 00395 g0a7
It is common knowledge in free radical polymerization that chain transfer reactions to small molecules may significantly affect molar mass development without affecting polymerization rate. This was the case for chain transfer to EHA. As observed in Figure A8, changing kfEHA by three orders of magnitude resulted on minimal effect on polymerization rate, but significant changes on molecular weight development (see Figure A9).
kfEHA was therefore used to fit molecular weight development data for the studied systems. As observed in Figure A10, Figure A11 and Figure A12, the best agreement with experimental data of Mn versus conversion was obtained with kfEHA = 2 L mol−1 s−1, but the best agreement with experimental data of Mw versus conversion was obtained with kfEHA = 5 L mol1 s−1 (see Figure A13, Figure A14 and Figure A15). A compromise was established by using a final value of kfEHA = 3.5 L mol−1 s−1. As explained in the body of the manuscript, gelation was an issue for systems containing BA, so that explains the deviation. Chain transfer to tertiary radicals for EHA was adjusted similarly, but its effect on molar mass development had less impact on molar mass results.
Figure A8. Effect of kfEHA on conversion versus time profiles for system 50BA/50EHA.
Processes 07 00395 g0a8
Figure A9. Effect of kfEHA on Mn versus conversion profiles for system 50BA/50EHA.
Processes 07 00395 g0a9
Figure A10. Comparison of experimental and calculated profiles of Mnversus conversion for system BA/EHA using kfEHA = 2 L mol−1 s−1.
Processes 07 00395 g0a10
Figure A11. Comparison of experimental and calculated profiles of Mn versus conversion for system BA/EHA using kfEHA = 3.5 L mol−1 s−1.
Processes 07 00395 g0a11
Figure A12. Comparison of experimental and calculated profiles of Mn versus conversion for system BA/EHA using kfEHA = 5 L mol−1 s−1.
Processes 07 00395 g0a12
Figure A13. Comparison of experimental and calculated profiles of Mw versus conversion for system BA/EHA using kfEHA = 2 L mol−1 s−1.
Processes 07 00395 g0a13
Figure A14. Comparison of experimental and calculated profiles of Mw versus conversion for system BA/EHA using kfEHA = 3.5 L mol−1 s−1.
Processes 07 00395 g0a14
Figure A15. Comparison of experimental and calculated profiles of Mw versus conversion for system BA/EHA using kfEHA = 5 L mol−1 s−1.
Processes 07 00395 g0a15

References

  1. Dubé, A.M.; Zapata-González, I. Ch. 6: Copolymerization. In Handbook of Polymer Synthesis, Characterization, and Processing; Saldívar-Guerra, E., Vivaldo-Lima, E., Eds.; John Wiley & Sons: Hoboken, NJ, USA, 2013; pp. 105–125. [Google Scholar]
  2. Learner, T.J.S.; Krueger, J.W.; Schilling, M.R. Modern Paints Uncovered. In Proceedings of the Modern Paints Uncovered Symposium, London, UK, 16–19 May 2006; Learner, J.S., Smithen, P., Krueger, J.W., Schilling, M.R., Eds.; Getty Conservation Institute: London, UK, 2007. [Google Scholar]
  3. Moghbeli, M.R.; Zamir, S.M.; Molaee, B. Resultant Synergism in the Shear Resistance of AcrylicPressure-Sensitive Adhesives Prepared by EmulsionPolymerization of n-Butyl Acrylate/2-Ethyl HexylAcrylate/Acrylic Acid. J. Appl. Polym. Sci. 2008, 108, 606–613. [Google Scholar] [CrossRef]
  4. Srivastava, S. Co-polymerization of Acrylates. Des. Monomers Polym. 2009, 12, 1–18. [Google Scholar] [CrossRef] [Green Version]
  5. Benedek, I. Pressure-Sensitive Adhesives and Applications, 2nd ed.; Springer-Verlag: Leipzig, Germany, 2004; pp. 5–10. [Google Scholar]
  6. Gao, J.; Penlidis, A. A Comprehensive Simulator Database Package for Reviewing Free-Radical Copolymerizations. Macromol. React. Eng. 1998, 38, 651–780. [Google Scholar] [CrossRef]
  7. Beuermann, S.; Paquet, D.A.; McMinn, J.H.; Hutchinson, R.A. Determination of Free-Radical Propoagation Rate Coefficients of Butyl, 2-Ethylhexyl, and Dodecyl Acrylates by Pulsed-Laser Polymerization. Macromolecules 1996, 29, 4206–4215. [Google Scholar] [CrossRef]
  8. Agirre, A.; Nase, J.; Degrandi, E.; Creton, C.; Asua, J.M. MiniemulsionPolymerization of 2-Ethylhexyl Acrylate. Polymer Architecture Control and Adhesion Properties. Macromolecules 2010, 43, 8924–8932. [Google Scholar] [CrossRef]
  9. Capek, I.; Juranicova, V.; Barton, J.; Asua, J.M.; Ito, K. Microemulsion Radical Polymerization ofAlkyl Acrylates. Polym. Int. 1997, 43, 1–7. [Google Scholar] [CrossRef]
  10. Plessis, C.; Arzamendi, G.; Alberdi, J.M.; Agnely, M.; Leiza, J.R.; Asua, J.M. Intramolecular Chain Transfer to Polymer in the Emulsion Polymerization of 2-EthylhexylAcrylate. Macromolecules 2001, 34, 6138–6143. [Google Scholar] [CrossRef]
  11. Heatley, F.; Lovell, P.A.; Yamashita, T. Chain Transfer to Polymer in Free-Radical Solution Polymerization of2-Ethylhexyl Acrylate Studied by NMR Spectroscopy. Macromolecules 2001, 34, 7636–7641. [Google Scholar] [CrossRef]
  12. Couvreur, L.; Piteau, G.; Castignolles, P.; Tonge, M.; Coutin, B.; Charleux, B.; Vairon, J.P. Pulsed-Laser Radical Polymerization and Propagation Kinetic Parameters of Some Alkyl Acrylates. Macromol. Symp. 2001, 174, 197–207. [Google Scholar] [CrossRef]
  13. Junkers, T.; Schneider-Baumann, M.; Koo, S.S.; Castignolles, P.; Barner-Kowollik, C. Determination of propagation rate coefficients for methyl and 2-ethylhexyl acrylate via high frequency PLP-SEC under consideration of the impact of chain branching. Macromolecules 2010, 43, 10427–10434. [Google Scholar] [CrossRef]
  14. Gabriel, V.A.; Dubé, M.A. Bulk Free-Radical Co- and Terpolymerization of n-Butyl Acrylate/2-Ehylhexyl Acrylate/MethylMethacrylate. Macromol. React. Eng. 2018. [Google Scholar] [CrossRef]
  15. Bicak, N.; Ozlem, M. Graft Copolymerization of Butyl Acrylate and 2-Ethyl HexylAcrylate from Labile Chlorines of Poly(vinyl chloride) byAtom Transfer Radical Polymerization. J. Polym. Sci. 2003, 41, 3457–3462. [Google Scholar] [CrossRef]
  16. Percec, V.; Popov, A.V.; Ramirez-Castillo, E.; Hinojosa-Falcon, L.A. Synthesis of Poly(vinyl chloride)-b-Poly(2-ethylhexylacrylate)-b-Poly(vinyl chloride) by the Competitive Single-Electron-Transfer/Degenerative-Chain-Transfer MediatedLiving Radical Polymerization of Vinyl Chloride Initiatedfromα,ω-Di(iodo)poly(2-ethylhexyl acrylate) and Catalyzedwith Sodium Dithionite in Water. J. Polym. Sci. 2005, 43, 2276–2280. [Google Scholar]
  17. Vidts, K.R.M.; Dervaux, B.; Prez, F.E.D. Block, Blocky Gradient and Random Copolymers of 2-Ethylhexyl Acrylate and Acrylic Acid by Atom Transfer Radical Polymerization. Polymer 2006, 47, 6028–6037. [Google Scholar] [CrossRef]
  18. Haloi, D.J.; Singha, N.K. Synthesis of Poly(2-ethylhexyl acrylate)/Clay Nanocompositeby In Situ Living Radical Polymerization. J. Polym. Sci. 2011, 49, 1564–1571. [Google Scholar] [CrossRef]
  19. Achilias, D.S. Review of Modeling of Diffusion Controlled Polymerization Reactions. Macromol. Theory Simul. 2007, 16, 319–347. [Google Scholar] [CrossRef]
  20. Buback, M.; Huckestein, B.; Russell, G.T. Modeling of termination in intermediate and high conversion free radical polymerizations. Macromol. Chem. Phys. 1994, 195, 539–554. [Google Scholar] [CrossRef]
  21. Stickler, M.; Panke, D.; Hamielec, A.E. Polymerization of Methyl Methacrylate up to High Degrees of Conversion: Experimental Investigation of the Diffusion-controlled Polymerization. J. Polym. Sci. Polym. Chem. 1984, 22, 2243–2253. [Google Scholar] [CrossRef]
  22. Arzamendi, G.; Plessis, C.; Leiza, J.R.; Azua, J.M. Effect of the Intramolecular Chain Transfer to Polymer on PLP/SEC Experiments of Alkyl Acrylates. Macromol. Theory Simul. 2003, 12, 315–324. [Google Scholar] [CrossRef]
  23. Lena, J.B.; Deschamps, M.; Sciortino, N.F.; Masters, S.L.; Squire, M.A.; Russell, G.T. Effects of Chain Transfer Agent and Temperature on Banching and β-Scission in Radical Polymerization of 2-Ethylhexyl Acrylate. Macromol. Chem. Phys. 2018, 219, 1700579. [Google Scholar] [CrossRef]
  24. Plessis, C.; Arzamendi, G.; Alberdi, J.M. Evidence of Branching in Poly(butyl acrylate) Produced in Pulsed Laser Polymerization Experiments. Macromol. Rapid Commun. 2003, 24, 173–177. [Google Scholar] [CrossRef]
  25. Ren, S.; Vivaldo-Lima, E.; Dubé, M.A. Modeling of the Copolymerization Kinetics of n-Butyl Acrylate and D-Limonene Using PREDICI. Processes 2015, 4, 1. [Google Scholar] [CrossRef]
  26. Zhu, S.; Hamielec, A.E. Heat effects for free-radical polymerization in glass ampoules reactors. Polymer 1991, 32, 3021–3025. [Google Scholar] [CrossRef]
  27. Zoller, A.; Gigmes, D.; Guillaneuf, Y. Simulation of radical polymerization of methyl methacylate at room temperaturre using a tertiary amine/BPO initiating system. Polym. Chem. 2015, 6, 1–3. [Google Scholar] [CrossRef]
  28. Wulkow, M. Computeir Aided Modeling of Polymer Reaction Engineering-The Status of Predici, 1-Simulation. Macromol. React. Eng. 2008, 2, 461–494. [Google Scholar] [CrossRef]
  29. Peikert, P.; Pflug, K.M.; Busch, M. Modeling of High-Pressure Ethene Homo- and Copolymerization. Chem. Ing. Tech. 2019, 91, 1–6. [Google Scholar]
  30. Louie, B.M.; Carratt, G.M.; Soong, D.S. Modeling the free radical solution and bulk polymerization of methyl methacrylate. J. Appl. Polym. Sci. 1985, 30, 3985–4012. [Google Scholar] [CrossRef]
  31. Penlidis, A. Watpoly Database; University of Waterloo: Waterloo, ON, Canada, 1992. [Google Scholar]
  32. Rantow, E.S.; Soroush, M.; Grady, M.C.; Kalfas, G.A. Spontaneous polymerization and chain microstructure evolution in high-temperature solution polymerization of n-butyl acrylate. Polymer 2006, 47, 1423–1435. [Google Scholar] [CrossRef]
  33. Dorschner, D. Multicomponent Free Radical Polymerization Model Refinements and Extensions with Depropagations. Master’s Thesis, University of Waterloo, Department of Chemical Engineering, Waterloo, ON, Canada, 2010. [Google Scholar]
  34. McManus, N.T.; Dubé, M.A. PeNLIDIS. Polym. React. Eng. 1999, 7, 131. [Google Scholar] [CrossRef]
  35. Hungenberg, K.D.; Wulkow, M. Modeling and Simulation in Polymer Reaction Engineering (A Modular Approach); Wiley-VCH: Weinheim, Germany, 2018; pp. 92–256. [Google Scholar]
  36. Scott, A.J.; Penlidis, A. Ready-to-Use Computattional Package for Copolymerzation Reactivity Ratio Estimation: Improved Acces to the Error-in-Variables-Model. Process 2017, 5, 1–41. [Google Scholar]
  37. Peck, A.N.F.; Hutchinson, R.A. Secondaryreactions in thehigh-temperature free radical polymerizationofbutyl acrylate. Macromolecules 2004, 37, 5944–5951. [Google Scholar] [CrossRef]
  38. Ahmad, N.M.; Heatley, F.; Lovell, P.A. Chain Transfer Copolymer in Free-radical Solution Polymerizationof n-Butyl Acrylatestudiedby NMR spectroscopy. Macromolecules 1998, 31, 2822–2827. [Google Scholar] [CrossRef]
  39. Theis, A.; Feldermann, A.; Charton, N.; Davies, T.P.; Stenzel, M.H.; Kowollik, C.B. Living free radical polymerization (RAFT) of dodecyl acrylate: Chain length dependent termination, mid-chain radicals and monomer reaction order. Polymer. 2005, 46, 6797–6809. [Google Scholar] [CrossRef]
  40. Hamielec, A.E. Recent Developments in Free Radical Polymerization at High Conversion Diffusion Controlled Termination and Propagation. Chem. Eng. Commun. 1983, 24, 1–19. [Google Scholar] [CrossRef]
  41. D’hooge, R.D.; Reyniers, M.F.; Marin, G.B. The Crucial Roles of Diffusional Limitantion in Controlled Radical Polymerization. Macromol. React. Eng. 2013, 7, 362–379. [Google Scholar]
Figure 1. Comparison between original experimental data and adjusted data for BA-EHA copolymer with an initial 50/50 molar proportion.
Processes 07 00395 g001
Figure 2. Comparison of experimental and calculated profiles of total monomer conversion versus time at 60 °C for copolymerization of BA and EHA at different initial concentrations of BA.
Processes 07 00395 g002
Figure 3. Comparison of experimental and calculated profiles of total monomer conversion versus time at 60 °C for copolymerization of MMA and EHA at different initial concentrations of MMA.
Processes 07 00395 g003
Figure 4. Comparison of experimental and calculated profiles of total monomer conversion versus time at 60 °C for copolymerization of BA, EHA and MMA at different initial concentrations.
Processes 07 00395 g004
Figure 5. Evolution with conversion of propagation and termination kinetic rate coefficients for system 30BA/70EHA due to DCeffects.
Processes 07 00395 g005
Figure 6. Evolution with conversion of propagation and termination kinetic rate coefficients for system 70EHA/30MMA due to DCeffects.
Processes 07 00395 g006
Figure 7. Evolution with conversion of propagation kinetic rate coefficient for system 10BA/10EHA/80MMA due to DCeffects.
Processes 07 00395 g007
Figure 8. Evolution with conversion of propagation kinetic rate coefficient for system 80BA/10EHA/10MMA due to DCeffects.
Processes 07 00395 g008
Figure 9. Evolution with conversion of propagation kinetic rate coefficient for system 10BA/80EHA/10MMA due to DCeffects.
Processes 07 00395 g009
Figure 10. Evolution with conversion of termination kinetic rate coefficient for system 10BA/10EHA/80MMA due to DCeffects.
Processes 07 00395 g010
Figure 11. Evolution with conversion of termination kinetic rate coefficient for system80BA/10EHA/10MMA due to DCeffects.
Processes 07 00395 g011
Figure 12. Evolution with conversion of termination kinetic rate coefficient for system10BA/80EHA/10MMA due to DCeffects.
Processes 07 00395 g012
Figure 13. Comparison of experimental data and calculated profiles of BA composition versus conversion in the copolymerization of BA and EHA at different initial compositions of BA.
Processes 07 00395 g013
Figure 14. Comparison of experimental data and calculated profiles of MMA composition versus conversion in the copolymerization of MMA and EHA at different initial compositions of MMA.
Processes 07 00395 g014
Figure 15. Comparison of experimental data and calculated profiles of copolymer composition for each monomer species versus conversion for a system with 10BA/10EHA/80MMA initial concentrations.
Processes 07 00395 g015
Figure 16. Comparison of experimental data and calculated profiles of copolymer composition for each monomer species versus conversion for a system with 10BA/80EHA/10MMA initial concentrations.
Processes 07 00395 g016
Figure 17. Comparison of experimental data and calculated profiles of copolymer composition for each monomer species versus conversion for a system with 80BA/10EHA/10MMA initial concentrations.
Processes 07 00395 g017
Figure 18. Comparison of experimental data and calculated profiles of number average molar mass versus conversion in the copolymerization of BA and EHA at different initial compositions of BA.
Processes 07 00395 g018
Figure 19. Comparison of experimental data and calculated profiles of weight average molar mass versus conversion in the copolymerization of BA and EHA at different initial compositions of BA.
Processes 07 00395 g019
Figure 20. Comparison of experimental data and calculated profiles of Ð versus conversion in the copolymerization of BA and EHA at different initial compositions of BA.
Processes 07 00395 g020
Figure 21. Comparison of experimental data and calculated profiles of number average molar mass versus conversion in the copolymerization of MMA and EHA at different initial compositions of MMA.
Processes 07 00395 g021
Figure 22. Comparison of experimental data and calculated profiles of weight average molar mas versus conversion in the copolymerization of MMA and EHA at different initial compositions of MMA.
Processes 07 00395 g022
Figure 23. Comparison of experimental data and calculated profiles of Ð conversion in the copolymerization of MMA and EHA at different initial compositions of MMA.
Processes 07 00395 g023
Figure 24. Comparison of experimental data and calculated profiles of number average molar mass versus conversion for terpolymerizations of BA, EHA and MMA at the initial concentrations indicated in the legend.
Processes 07 00395 g024
Figure 25. Comparison of experimental data and calculated profiles of weight average molar mass versus conversion for terpolymerizations of BA, EHA and MMA at the initial concentrations indicated in the legend.
Processes 07 00395 g025
Table 1. Experimental conditions for the bulk copolymerization of BA and EHA at 60 °C.
Monomer Feed
(BA Molar Fraction)
Monomer Feed
(EHA Molar Fraction)
BA (mol L−1)EHA (mol L−1)AIBN (mol L−1)
fBA = 0.3fEHA = 0.71.5963.6990.00414
fBA = 0.5fEHA = 0.52.8442.8360.00414
fBA = 0.7fEHA = 0.34.2841.8370.00414
Table 2. Experimental conditions for the bulk copolymerization of MMA/EHA at 60 °C.
Monomer Feed
(MMA Molar Fraction)
Monomer Feed
(EHA Molar Fraction)
MMA (mol L−1)EHA (mol L−1)AIBN (mol L−1)
fMMA = 0.3fEHA = 0.71.68473.94070.00414
fMMA = 0.5fEHA = 0.53.17943.17620.00438
fMMA = 0.7fEHA = 0.35.10932.18970.00438
Table 3. Experimental conditions for the bulk terpolymerization of BA, EHA and MMA at 60 °C.
Monomer Feed
(BA Molar Fraction)
Monomer Feed
(EHA Molar Fraction)
Monomer Feed
(MMA Molar Fraction)
BA
(mol L−1)
EHA
(mol L−1)
MMA
(mol L−1)
AIBN
(mol L−1)
fBA = 0.8fEHA = 0.1fMMA = 0.15.4560.6830.6770.00414
fBA = 0.1fEHA = 0.8fMMA = 0.10.5124.2070.5090.00419
fBA = 0.1fEHA = 0.1fMMA = 0.80.8350.8346.6890.00450
Table 4. Estimated induction times and extrapolation functions for each polymerization.
Systemr2 ValueFitting Equation
(x: Conversion; t: Time)
Induction Time (s)
BA/50EHA0.997x = 38.457ln(t) − 288.171796
30BA/70EHA0.993x = 38.464ln(t) − 278.761404
70BA/30EHA0.998x = 40.656ln(t) − 303.781758
50MMA/50EHA0.996x = 7E−08t2+ 0.002t− 3.08581468
30MMA/70EHA0.996x = 4E−08t2 + 0.0034t − 4.85541405
70MMA/30EHA0.996x = 4E−08t2 + 0.0025t − 4.12441608
10BA/10MMA/80EHA0.969x = 39.607ln(t) − 293.781665
10BA/80MMA/10EHA0.987x = 0.0038t − 10.9492881
80BA/10MMA/10EHA0.899x = 33.614ln(t) − 251.671785
Table 5. Polymerization scheme and kinetic rate coefficients used in PREDICI® for simulation of the bulk copolymerization of BA and EHA at 60 °C (M1 = BA, M2 = EHA).
DescriptionStep in PREDICI®ParameterValue (L mol−1 s−1 Unless Otherwise Stated)Reference
Initiation
Initiator decompositionI→2fI•ki, f7.4609E−6, 0.58 (s−1)[30]
First Propagation for BAI• + M1→P1(1)kp11333.8[31]
First Propagation for EHAI• + M2→P2(1)kp233,395[7]
Propagation
Self-propagation for BAP1(s)• + M1→P1(s+1)•kp11333.8[31]
Self-propagation forEHAP2(s)• + M2→P2(s+1)•kp233,395[7]
Cross-PropagationP1(s)• + M2→P2(s+1)•kp121333.8/r12[14,31]
Cross-PropagationP2(s)• + M1→P1(s+1)•kp2133,395/r21[7,14]
Chain Transfer
Chain Transfer to BAP1(s)• + M1→P(s) + P1(1)•kf10.1492[31]
Chain Transfer to BAP2(s)• + M1→P(s) + P1(1)•kf213.5/r21This work/[14]
Chain Transfer to EHAP1(s)• + M2→P(s) + P2(1)•kf120.1492/r12[14,31]
Chain Transfer to EHAP2(s)• + M2→P(s) + P2(1)•kf23.5This work
Intramolecular chain transfer to BA
Backbitingfor BAP1(s)•→Q1(s)•kbb553[32]
Short-chainbranching BAQ1(s)• + M1→P1(s+1)•kp1tert49.401[33]
Short-chainbranching EHAQ1(s)• + M2→P2(s+1)•kp12tert49.401/r12[14,33]
Degradativechain transferQ1(s)• + M1→P(s) + P1(1)•kf1tert6This work
Degradativechain transferQ1(s)• + M2→P(s) + P2(1)•kf12tert6/r12This work/[14]
Termination
BycombinationP1(s)• + P1(r)•→P(s+r)ktc111.2259E6[31]
-P1(s)• + P2(r)•→P(s+r)ktc21√ktc11·ktc22[31]/This work
-P2(s)• + P2(r)•→P(s+r)ktc222.5E8This work
BydisproportionationP1(s)• + P1(r)•→P(s) + P(r)ktd118.5815E5[31]
-P1(s)• + P2(r)•→P(s) + P(r)ktd21√ktd11·ktd22[31]/This work
-P2(s)• + P2(r)•→P(s) + P(r)ktd222.5E8This work
Termination of BA tertiary radicals
BycombinationQ1(s)• + P1(r)•→P(s+r)ktc111.2259E6[31]
-Q1(s)• + P2(r)•→P(s+r)ktc21√ktc11·ktc22[31]/This work
-Q1(s)• + Q1(r)•→P(s+r)ktc111.2259E6[31]
BydisproportionationQ1(s)• + P1(r)•→P(s) + P(r)ktd118.5815E5[31]
-Q1(s)• + P2(r)•→P(s) + P(r)ktd21√ktd11·ktd22[31]/This work
-Q1(s)• + Q1(r)•→P(s) + P(r)ktd118.5815E5[31]
Table 6. Polymerization scheme and kinetic rate coefficients used in PREDICI® for simulation of the bulk copolymerization of MMA and EHA at 60 °C (M1 = MMA, M2 = EHA).
DescriptionStep in PREDICI®ParametersValue (L mol−1 s−1, Unless Otherwise Stated)Reference
Initiation
Initiator decompositionI→2fI•ki, f7.4609E−6, 5.8E−1 (s−1)[30]
First Propagation for MMAI• + M1→P1(1)kp1683.24[31]
First Propagation for EHAI• + M2→P2(1)kp233,395[7]
Propagation
Self-propagation for MMAP1(s)• + M1→P1(s+1)•kp1683.24[31]
Self-propagation for EHAP2(s)• + M2→P2(s+1)•kp233,395[7]
Cross-PropagationP1(s)• + M2→P2(s+1)•kp12683.24/r12[14,31]
Cross-PropagationP2(s)• + M1→P1(s+1)•kp2133,395/r21[7,14]
Chain Transfer
Chain Transfer to MMAP1(s)• + M1→P(s) + P1(1)•kf11.9321E−2[31]
Chain Transfer to MMAP2(s)• + M1→P(s) + P1(1)•kf213.5/r21This work/[14]
Chain Transfer to EHAP1(s)• + M2→P(s) + P2(1)•kf121.9321E−2/r12[14,31]
Chain Transfer to EHAP2(s)• + M2→P(s) + P2(1)•kf23.5This work
Termination
By combinationP1(s)• + P1(r)•→P(s+r)ktc111.859E7[31]
-P1(s)• + P2(r)•→P(s+r)ktc21√ktc11·ktc22[31]/This work
-P2(s)• + P2(r)•→P(s+r)ktc222.5E8This work
By disproportionationP1(s)• + P1(r)•→P(s) + P(r)ktd111.5382E7This work
-P1(s)• + P2(r)•→P(s) + P(r)ktd21√ktd11·ktd22[31]/This work
-P2(s)• + P2(r)•→P(s) + P(r)ktd222.5E8This work
Table 7. Polymerization scheme and kinetic rate coefficients used in PREDICI® for simulation of the bulk copolymerization of BA, EHA and MMA at 60 °C (M1 = BA, M2 = EHA, M3 = MMA).
DescriptionStep in PREDICI®ParametersValue (L mol−1 s−1, Unless Otherwise Stated)Reference
Initiation
Initiator decompositionI→2fI•ki, f7.4609E−6, 0.58 (s−1)[30]
First Propagation for BAI• + M1→P1(1)kp11333.8[31]
First Propagation for EHAI• + M2→P2(1)kp233,395[7]
First Propagation for MMAI• + M3→P3(1)kp3683.24[31]
Propagation
Self-propagation for BAP1(s)• + M1→P1(s+1)•kp11333.8[31]
Self-propagation for EHAP2(s)• + M2→P2(s+1)•kp233,395[7]
Self-propagation forMMAP3(s)• + M3→P3(s+1)•kp3683.24[31]
Cross-PropagationP1(s)• + M2→P2(s+1)•kp121333.8/r12[14,31]
Cross-PropagationP1(s)• + M3→P3(s+1)•kp131333.8/r13[31,34]
Cross-PropagationP2(s)• + M1→P1(s+1)•kp2133,395/r21[7,14]
Cross-PropagationP2(s)• + M3→P3(s+1)•kp2333,395/r23[7,14]
Cross-PropagationP3(s)• + M1→P1(s+1)•kp31683.24/r31[31,34]
Cross-PropagationP3(s)• + M2→P2(s+1)•kp32683.24/r32[31,34]
Chain Transfer
Chain Transfer to BAP1(s)• + M1→P(s) + P1(1)•kf10.1492[31]
Chain Transfer to BAP2(s)• + M1→P(s) + P1(1)•kf213.5/r21This work/[14]
Chain Transfer to BAP3(s)• + M1→P(s) + P1(1)•kf311.9321E−2/r31[31,34]
Chain Transfer to EHAP1(s)• + M2→P(s) + P2(1)•kf120.1492/r12[14,31]
Chain Transfer to EHAP2(s)• + M2→P(s) + P2(1)•kf24.5This work
Chain Transfer to EHAP3(s)• + M2→P(s) + P2(1)•kf321.9321E−2/r32[14,31]
Chain Transfer to MMAP1(s)• + M3→P(s) + P3(1)•kf130.1492/r13[31,34]
Chain Transfer to MMAP2(s)• + M3→P(s) + P3(1)•kf233.5/r23This work/[31]
Chain Transfer to MMAP3(s)• + M3→P(s) + P3(1)•kf31.9321E−2[31]
Intramolecular chain transfer of BA
Backbiting for BAP1(s)•→Q1(s)•kbb553[32]
Short-chain branching BAQ1(s)• + M1→P1(s+1)•kp1tert49.401[33]
Short-chain branching EHAQ1(s)• + M2→P2(s+1)•kp12tert49.401/r12[14,33]
Short-chain branching EHAQ1(s)• + M3→P3(s+1)•kp13tert49.401/r13[33,34]
Degradative chain transferQ1(s)• + M1→P(s) + P1(1)•kf1tert6This work
Degradative chain transferQ1(s)• + M2→P(s) + P2(1)•kf12tert6/r12This work/[14]
Degradative chain transferQ1(s)• + M3→P(s) + P3(1)•kf13tert6/r13This work/[34]
Termination
By combinationP1(s)• + P1(r)•→P(s+r)ktc111.2259E6[31]
-P1(s)• + P2(r)•→P(s+r)ktc21√ktc11·ktc22[31]/This work
-P1(s)• + P3(r)•→P(s+r)ktc31√ktc11·ktc33[31]
-P2(s)• + P2(r)•→P(s+r)ktc222.5E8This work
-P2(s)• + P3(r)•→P(s+r)ktc32√ktc22·ktc33This work/[31]
-P3(s)• + P3(r)•→P(s+r)ktc331.859E7[31]
By disproportionationP1(s)• + P1(r)•→P(s) + P(r)ktd118.5815E5[31]
-P1(s)• + P2(r)•→P(s) + P(r)ktd21√ktd11·ktd22[31]/This work
-P1(s)• + P3(r)•→P(s) + P(r)ktd31√ktd11·ktd33[31]
-P2(s)• + P2(r)•→P(s) + P(r)ktd222.5E8This work
-P2(s)• + P3(r)•→P(s) + P(r)ktd32√ktd22·ktd33This work/[31]
-P3(s)• + P3(r)•→P(s) + P(r)ktd331.5382E7[31]
Termination of BA tertiary radicals
By combinationQ1(s)• + P1(r)•→P(s+r)ktc111.2259E6[31]
-Q1(s)• + P2(r)•→P(s+r)ktc21√ktc11·ktc22This work
-Q1(s)• + P3(r)•→P(s+r)ktc31√ktc11·ktc33[31]
-Q2(s)• + Q2(r)•→P(s+r)ktc222.5E8This work
-Q2(s)• + Q3(r)•→P(s+r)ktc32√ktc22·ktc33This work/[31]
-Q3(s)• + Q3(r)•→P(s+r)ktc331.859E7[31]
By disproportionationQ1(s)• + P1(r)•→P(s) + P(r)ktd118.5815E5[31]
-Q1(s)• + P2(r)•→P(s) + P(r)ktd21√ktd11·ktd22[31]/
This work
-Q1(s)• + P3(r)•→P(s) + P(r)ktd31√ktd11·ktd33[31]
-Q2(s)• + P2(r)•→P(s) + P(r)ktd222.5E8This work
-Q2(s)• + P3(r)•→P(s) + P(r)ktd32√ktd22·ktd33This work/[31]
-Q3(s)• + Q3(r)•→P(s) + P(r)ktd331.5382E7[31]
Table 8. Free volume parameters used in our calculations.
SpeciesTgM(K)TgP(K) α M α P
BA1852180.0010.00048
EHA1672230.0010.00048
MMA1673870.0010.00048
Table 9. β parameters used in our simulations; β = 0 implies that DC effects were neglected in such cases.
SystemRate Coefficients Where DC Effects Were Consideredβ ValueRate Coefficients Where DC Effects Were Neglected (β = 0)
BA-EHAkp10.25ki
kp20.25f
kp120.25kf1
kp210.5kf21
kbb5kf12
ktc114kf2
ktc210.5kp1tert
ktc222kp12tert
ktd114kf1tert
ktd210.5kf12tert
ktd222----
MMA-EHAkp20.5ki
kf11f
kf121kp1, kp12
kf21kp2, kp21
kf211ktc22, ktd22
ktc114ktc21, ktd21
ktd114----
BA-EHA-MMAkp11ki
kp121f
kp21.5kf1
kp211kf21
kp232kf31
kp132kf12
kp32kf2
kp312kf32
kp322kf13
kbb2.5kf23
kf32kbb
kf13tert2kp1tert
ktc116kp12tert
ktc212kp13tert
ktc222kf1tert
ktc3110kf12tert
ktc3210----
ktc3310----
ktd116----
ktd212----
ktd222----
ktd3110----
ktd3210----
ktd3310----
Table 10. Estimated kinetic rate coefficients in this work.
ParameterValueDescription
ktcEHA2.5 × 108EHA termination by combination
ktdEHA2.5 × 108EHA termination by disproportionation
kfEHA45Chain transfer to EHA
kftertEHA60EHA intramolecular chain transfer to BA tertiary radicals
kftertMMA35MMA intramolecular chain transfer to BA tertiary radicals

