Article

Process Optimization by a Response Surface Methodology for Adsorption of Congo Red Dye onto Exfoliated Graphite-Decorated MnFe2O4 Nanocomposite: The Pivotal Role of Surface Chemistry

1
NTT Hi-Tech Institute, Nguyen Tat Thanh University, Ho Chi Minh City 755414, Vietnam
2
Center of Excellence for Green Energy and Environmental Nanomaterials, Nguyen Tat Thanh University, Ho Chi Minh City 755414, Vietnam
3
Graduate University of Science and Technology, Vietnam Academy of Science and Technology, Hanoi City 100000, Vietnam
4
Department of Pharmacy, Nguyen Tat Thanh University, Ho Chi Minh City 755414, Vietnam
5
Institute of Hygiene and Public Health, Ho Chi Minh City 700000, Vietnam
6
Ho Chi Minh City University of Technology, Vietnam National University-Ho Chi Minh City, Ho Chi Minh City 703500, Vietnam
7
Department of Display Engineering, Pukyong National University, Busan 608-737, Korea
8
Center of Excellence for Functional Polymers and NanoEngineering, Nguyen Tat Thanh University, Ho Chi Minh City 755414, Vietnam
*
Authors to whom correspondence should be addressed.
Processes 2019, 7(5), 305; https://doi.org/10.3390/pr7050305
Submission received: 20 March 2019 / Revised: 21 April 2019 / Accepted: 14 May 2019 / Published: 21 May 2019
(This article belongs to the Section Materials Processes)

Abstract

:
Natural graphite, a locally available, eco-friendly, and low-cost carbonaceous source, can be easily transformed into exfoliated graphite (EG) with many surface functional groups via a chemical oxidation route. Combination between EG and magnetic MnFe2O4 is a promising strategy to create a hybrid kind of nanocomposite (EG@MnFe2O4) for the efficient adsorptive removal of Congo red (CR) dye from water. Here, we reported the facile synthesis and characterization of chemical bonds of EG@MnFe2O4 using several techniques such as Fourier-transform infrared spectroscopy (FT-IR), and X-ray photoelectron spectroscopy (XPS). In particular, the quantity method by Boehm titration was employed to identify the content of functional groups: Carboxylic acid (0.044 mmol/g), phenol (0.032 mmol/g), lactone (0.020 mmol/g), and total base (0.0156 mmol/g) on the surface of EG@MnFe2O4. Through the response surface methodology-optimized models, we found a clear difference in the adsorption capacity between EG-decorated MnFe2O4 (62.0 mg/g) and MnFe2O4 without EG decoration (11.1 mg/g). This result was also interpreted via a proposed mechanism to elucidate the contribution of surface functional groups of EG@MnFe2O4 to adsorption efficiency towards CR dye.

1. Introduction

Over the past decades, numerous synthetic dyes have been discovered, developed, and applied in industrial fields, such as textile, paper, pharmaceuticals, and food [1]. It is understandable that the increasing consumption of dyes can result in a vast volume of pollutants. Without any pretreatment measures, disposals of such contaminants could be threatening for the aquatic systems due to, for example, depletion of the penetration of light or inhibition of photosynthetic processes that may be caused by such dyes [2]. Among the emergent dyes, Congo red (CR) in terms of molecular structure presents a kind of complex azo compound constituting of many carcinogenic aromatic rings, amines, and imines (Figure 1) [3]. Under appropriate aerobic reactions, these CR molecules are likely to react/combine with functional groups on the surface of other molecular systems in the body, raising potential risks of genetic mutation (GM) [4,5]. Therefore, treatment of persistent and non-degradable CR molecules should be a priority regardless of the huge challenges relating to cost and technologies.
It has been reported that exfoliated graphene (EG), a chemically modified compound from natural graphite under oxidative conditions, can possess a series of functional groups on the surface [6,7,8]. Zheng-Hong et al. found the surface chemistry of EG containing hydroxyl (–OH), carbonyl (–C=O), and carboxylic acid (–COOH) groups [9]. Wang et al. also asserted that these groups played the main role in tailoring the chemisorption towards toxic dyes [10]. However, the main drawback of EG material is their reliance on its difficult separation from the aqueous solution during post-treatment. It is therefore reasonable to introduce a magnetic component (e.g., iron-based particles) to the EG structure, making it integrated magnetically. For standards of high magnetism, eco-friendliness, chemical stability, and tunable synthesis, MnFe2O4 is a suitable additive [11,12,13]. Combining mentioned precursors to create a novel type of EG-decorated MnFe2O4 nanocomposite affords opportunities to utilize the materials in adsorption applications.
Here, a prevalent approach to investigate and optimize the effect of input parameters, namely, response surface methodology (RSM), is adopted. The main variables consist of solution pH, CR concentration, and contact time. We attempted to interpret the optimized adsorption results based on a proposed mechanism with the contribution of surface chemistry (i.e., surface functional groups), which was analyzed by physical techniques (e.g., Fourier-transform infrared spectroscopy (FT-IR), X-ray photoelectron spectroscopy (XPS), energy-dispersive X-ray spectroscopy (EDS), and quantity of surface functional groups via Boehm titrations. Scheme 1 illustrates the total process for adsorption of CR dye onto exfoliated graphite-decorated MnFe2O4 nanocomposite.

2. Materials and Methods

2.1. Chemicals and Instruments

The chemicals were commercially purchased from Merck (Kenilworth, New Jersey, USA) without any purification methods prior to the utilization. Natural graphite samples were locally purchased from Yen Bai province, Vietnam.
The D8 Advance Bruker powder diffractometer (Bruker, Billerica, MA, USA) was used to record the X-ray powder diffraction (XRD) profiles using Cu-Kα beams as excitation sources. The X-ray photoelectron spectroscopy (XPS) was performed on the ESCALab MKII spectrometer (Thermo Fisher Scientific, Waltham, MA, USA) using Mg-Kα radiation. The characteristics of chemical bonds and functional groups were investigated using the FT-IR spectra on the Nicolet 6700 spectrophotometer (Thermo Fischer Scientific, Waltham, MA, USA). The UV–VIS spectrophotometer (Shimadzu, Kyoto, Japan) was used to determine the CR concentration at 500 nm.

2.2. Synthesis of EG

Natural graphite samples (5.0 g) was carefully added in 100 mL of mixture containing H2SO4 (96%) and H2O2 (33%) (100:7 by volume) and vigorously stirred. After the process had been finished (2 h), the solid was washed with water many times until the aqueous residual became a neutral solution. To dry the sample, the solid was placed in an oven at 110 °C overnight. The EG was formed by the microwave-assisted irradiation of the bulky powder (750 W, 10 s).

2.3. Synthesis of MnFe2O4

The production of magnetic MnFe2O4 nanoparticles was based on recent work [14]. A mixture prepared by dissolving chemicals including citric acid (93 g), ethylene glycol (140 mL), and H2O (40 mL) was heated up 80 °C beneath open air. The MnCl2·6H2O crystals (0.303 g) were slowly added into the above mixture and their temperature was allowed to rise at 130 °C during 2 h. The as-received polymeric resin was embarked on the heat-resistant furnace before being heated up at 1000 °C during 2 h. After the sample was cooled, the MnFe2O4 was stored in a desiccator.

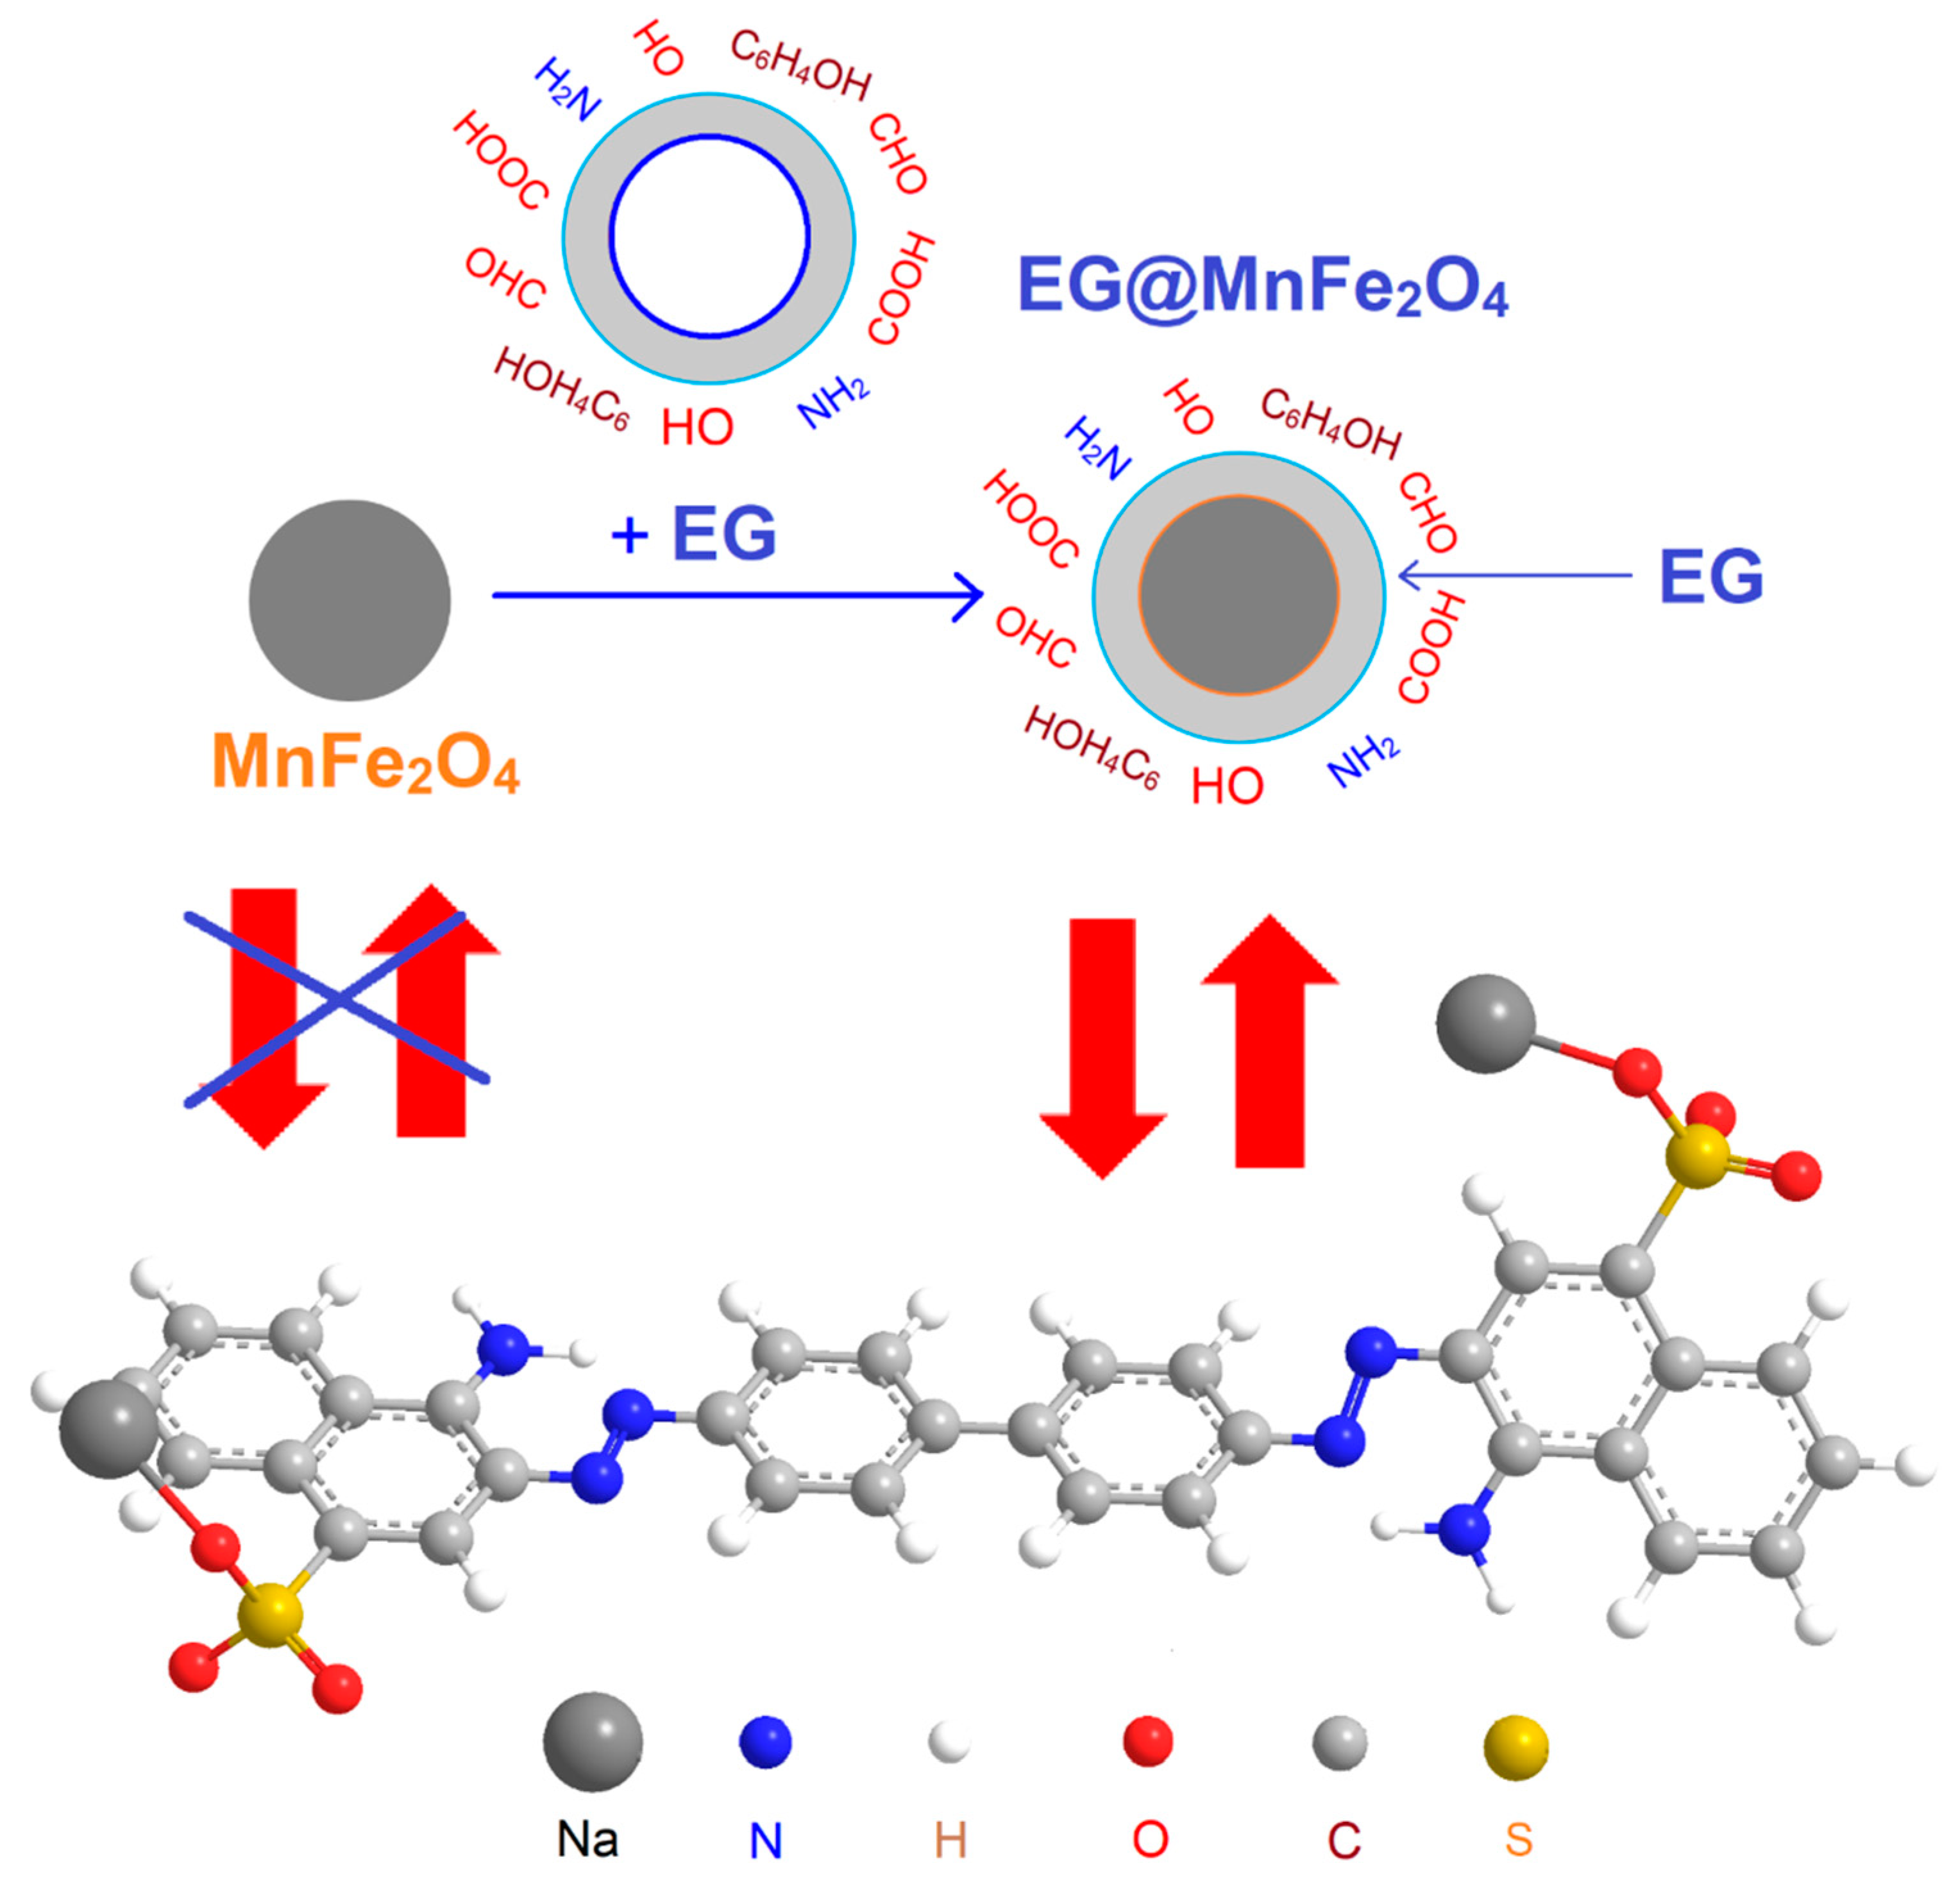
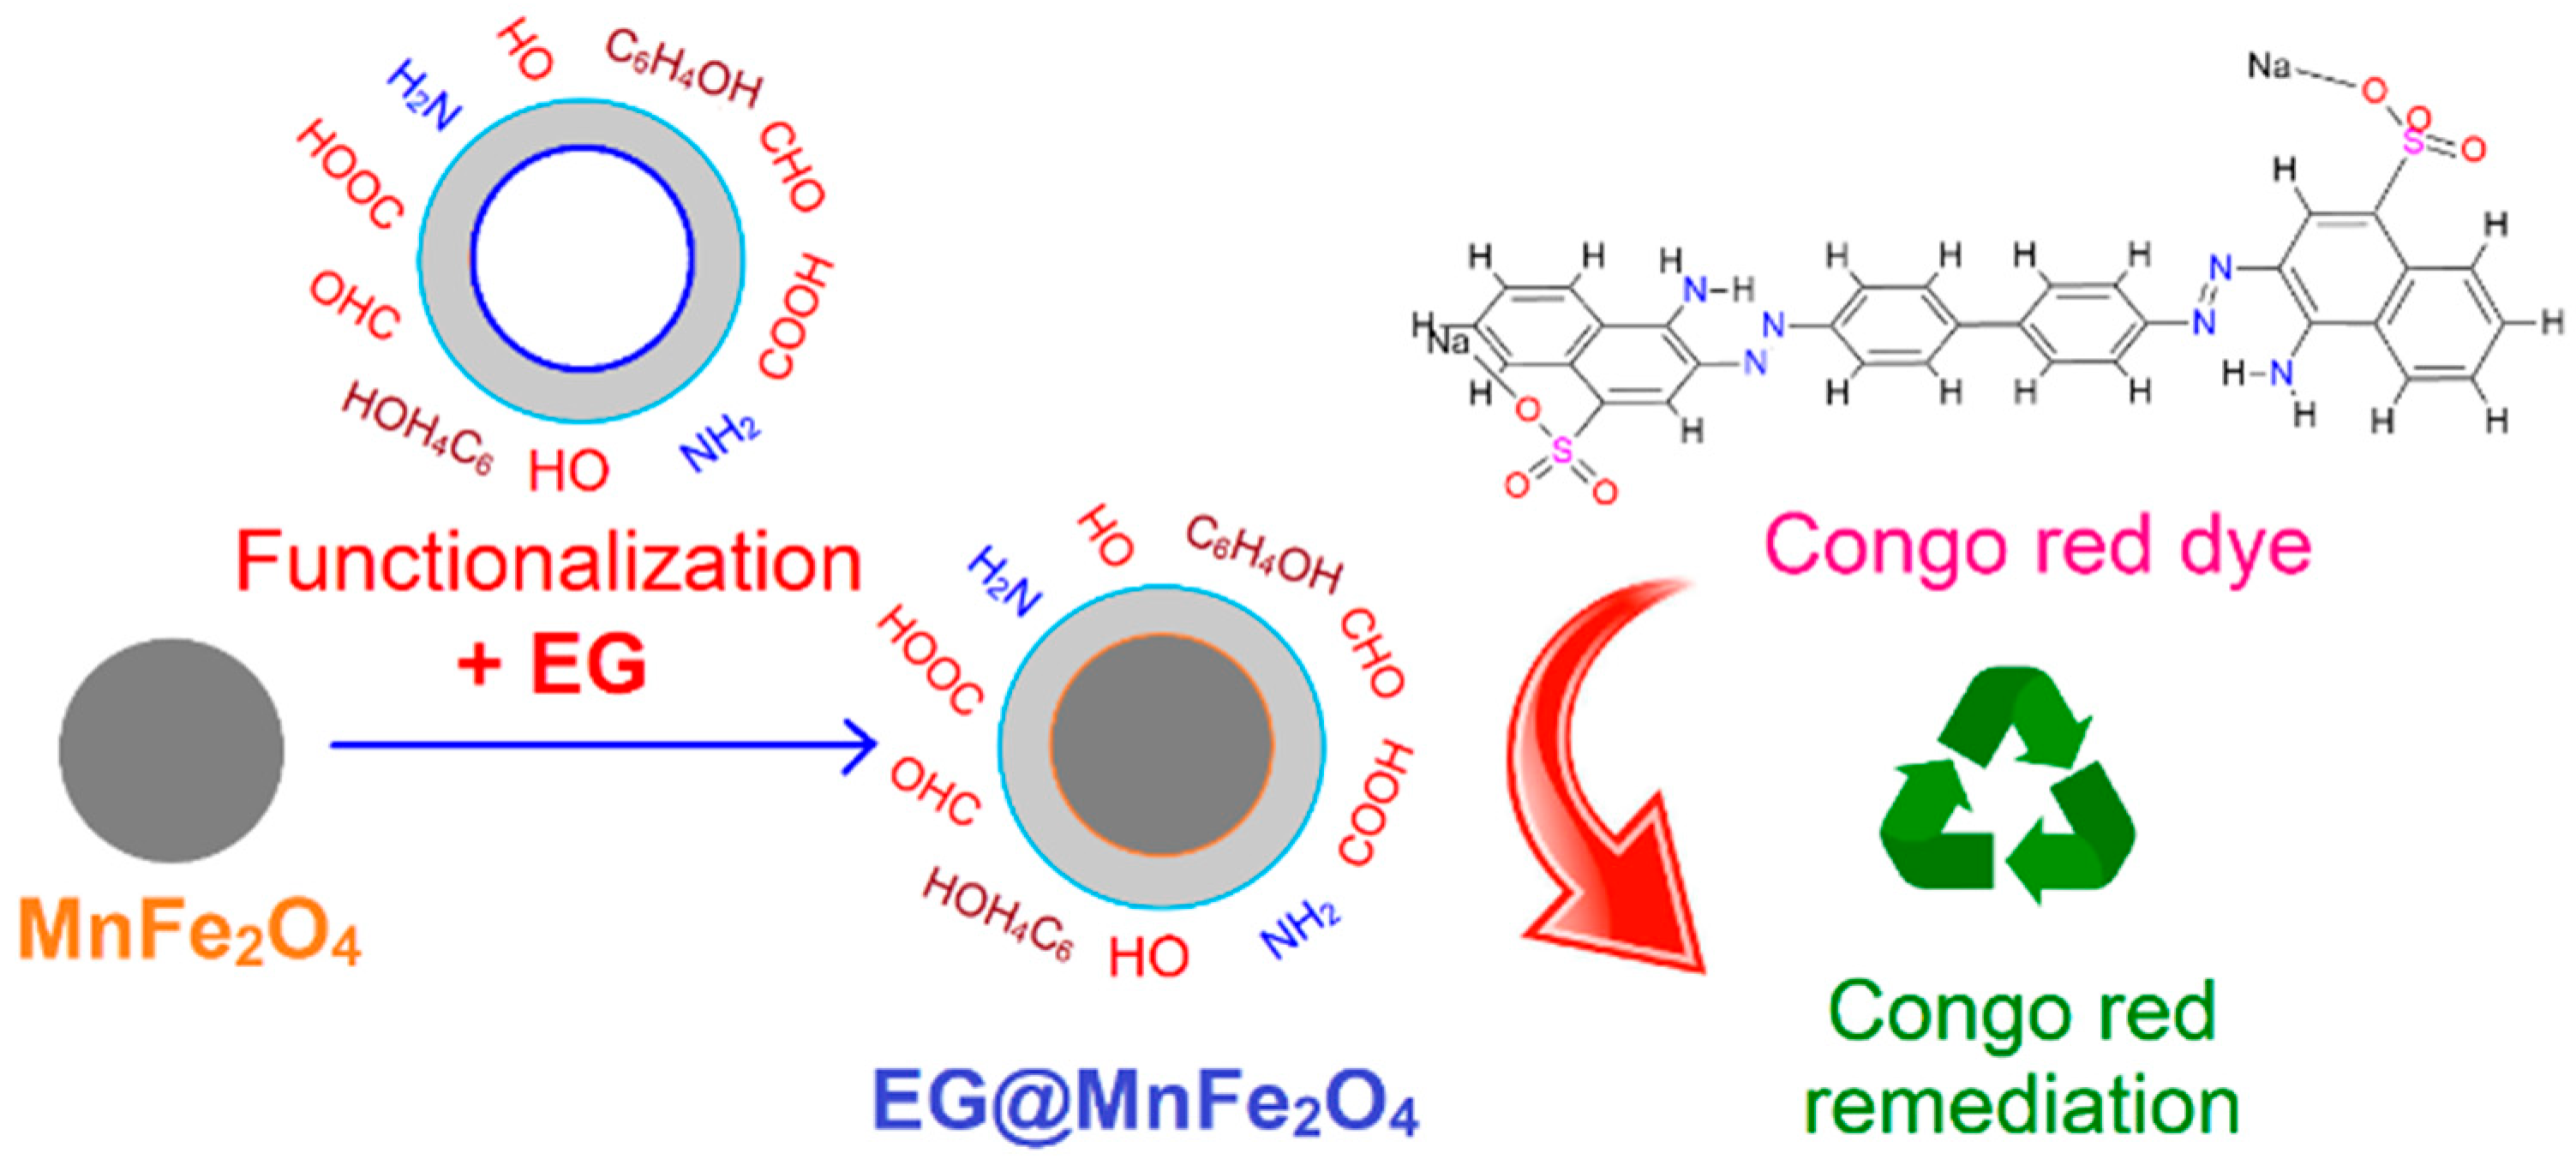
2.4. Synthesis of EG@MnFe2O4

To prepare the EG@MnFe2O4 nanocomposite, we used the synthesized EG as a precursor. To begin with, a solution (50 mL) of citric acid (0.02 M) was slowly added into another mixture consisting of Fe(NO3)3·9H2O (0.7 g) and Mn(NO3)2·6H2O (0.25 g) in 50 mL H2O at 90 °C for 1 h under vigorous stirring. The homogeneous solution was very slowly loaded with 0.8 g EG during 30 min. Next, NH3 solution was added dropwise until a solution with pH ranging between 8 and 9 was obtained. After 30 min, NH3 was repeatedly used to adjust pH to 8, and then the sample was dehydrated at 80 °C. The solid calcination was employed at 700 °C, 2 h to obtain a black magnetic sample.

2.5. Experimental Batch

Herein, EG@MnFe2O4 and MnFe2O4 were used as adsorbents to compare their adsorption capacity towards CR dyes. The adsorption experiments were based on the adsorbent dose (0.05 g/L) and the volume of dye solutions (100 mL). Other parameters including solution pH, CR concentration and contact time were described by experimental design with RSM. The samples in beakers (250 mL) were agitated on a shaking table (200 rpm). After the adsorption experiments had been finished, the adsorbent was separated from aqueous solution using a simple magnet and remaining concentration was measured by the UV–VIS spectrophotometer at 500 nm. The removal efficiency (H%), adsorption capacity (Q) at equilibrium period was calculated on the basis of the concentrations before and after adsorption process by the following equations:
H ( % ) = C o C e C o   ·   100
Q t = C o C t m   ·   V
where, Co and Ct are the dye concentrations (mg/L) at the initial and final periods, respectively. V and m represent the volume of solution (mL), and weight of adsorbent (g), respectively.

2.6. Experimental Design with RSM

To optimize conditions for the highest CR adsorption capacity in water, the RSM would be used for both EG@MnFe2O4 and MnFe2O4. In details, three parameters including solution pH (4.3–7.7), CR concentration (43.2–76.8 mg/L) and contact time (163.2–196.8 min) were incorporated into the model to investigate the effect of experimental conditions on the CR adsorption capacity of EG@MnFe2O4 and MnFe2O4 (Table 1). A second-order polynomial equation in which y and x represent the response and independent variables respectively could be established to describe the relationship between the adsorption capacity and experiment conditions as follows (Equation (3)). In this study, two equations were established representing CR adsorption of two materials, EG@MnFe2O4 and MnFe2O4
y = f ( x ) = β o + i = 1 k β i x i + i = 1 k j = 1 k β i j x i x j + i = 1 k β i i x i 2 N = 2 k + 2 k + c
where y is the predicted response; xi and xj are the independent variables (i, j = 1, 2, 3, 4…k). The parameter βo is the model constant; βi is the linear coefficient; βii is the second-order coefficient and βij is the interaction coefficient. The total number of experiments is defined by Equation (4). The Design-Expert® Software Version 10 (DX10) from Stat-Ease, Inc. (Minneapolis, Minnesota, USA) was used as a means of data analysis [15]. Table 1 summarizes independent factors and associated data levels used in the real experimental attempts.

3. Results

3.1. Structural Characterization

The crystallinity profile of both MnFe2O4 and EG@MnFe2O4 was analyzed using the X-ray diffraction technique, which is presented in Figure 2. It is obvious that the MnFe2O4 particles in Figure 2a offered a high degree of crystallinity with the presence of typical peaks at 24.4°, 34.0°, 36.7°, 50.0°, 54.5°, 62.5°, 64.8°. This observation was in line with many previous works, pointing out the successful synthesis of MnFe2O4 [16,17,18,19,20,21]. On the other hand, the EG@MnFe2O4 pattern in Figure 2b disclosed a very emergent peak at around 26.6°, corresponding to the presence of EG [7]. Although the intensity of peaks from 30° to 60° was low, the existence of MnFe2O4 in the structure of EG@MnFe2O4 could still be observed with the same position of mentioned peaks of MnFe2O4.
Figure 3 also provides more information about the magnetization of EG@MnFe2O4, whose saturation magnetization value (1.5 emu/g) was found to be drastically lower than that of original MnFe2O4 [14]. Meanwhile, EDS mapping results also provided the average iron content at 6.4%. This phenomenon may be due to the decoration of non-magnetic EG, leading to a depletion in magnetization and crystallinity of original MnFe2O4. However, with an eligible magnetization, EG@MnFe2O4 can be separated from solution by inducing a magnetic field. Consequently, the EG@MnFe2O4 structure obtained a combination of EG and MnFe2O4 components [22,23,24].
To gain more insight into various types of chemical bonds on the surface of EG@MnFe2O4, the FT-IR spectra were explored. According to Figure 4 and Table 2, the hydroxyl (–OH) and amine (–NH) groups can be ascribed to a broad band at 3400 cm−1 [25]. The aldehyde/ketone/acid/ester groups (C=O) were confirmed at around 1730 cm−1 and 1639 cm−1 regions with a strong intensity [26,27]. In addition, regions at round 1520 cm−1 and 1195 cm−1 were attributable to the existence of C=C, and C–O bonds, respectively [28,29]. A peak at 1076 cm−1 could be ascribed to possible existence of primary alcohol [30]. Moreover, apart from the main peaks in EG@MnFe2O4, the spectrum of CR-loaded EG@MnFe2O4 was present in Figure 2. It is clear that an emergent peak at 1346 cm−1 was of importance for C–N bond [31]. Meanwhile, three peaks at 1210 cm−1 (narrow), 1178 cm−1 (narrow), 1029 cm−1 (very strong) were devoted for the absorption of –SO3 groups, and at around 800 cm−1 for the ring vibrations of p-di-substituted aromatic compounds [31]. Moreover, the weak peaks at around 1580 cm−1 could be assigned to the N=N typical stretching [32]. To sum up, the EG@MnFe2O4 shows a variety of chemical bonds, which were essential for adsorption.
To illustrate more information about surface functional groups, the XPS spectrum is shown in Figure 5. At a glance, the XPS survey revealed the presence of four elements for EG@MnFe2O4: Carbon (C 1s), oxygen (O 1s), iron (Fe 2p), and manganese (Mn 2p). However, among those elements, the C 1s peak was measured with high intensity. This preliminary observation can be explained mainly because EG with carbonaceous components covers overall MnFe2O4 nanoparticles, leading a vague detection of the typical MnFe2O4 signal (note that XPS sensitivity works out within a certain nanoscale depth <10 nm) [33]. This kind of pattern is commensurate with the very weak signal of MnFe2O4 in the XRD spectrum as illustrated in Figure 2.
It was found that the C 1s XPS spectrum in Figure 5b indicated the presence of π–π interaction 289.6 (eV), C=O (286.0 eV), C–C (284.2 eV) [34]. Meanwhile, the O 1s XPS signals in Figure 5c can be broken down into three curves with peaks at binding energies 535.1, 532.5, 530.0 eV, corresponding to chemisorbed O, C–O/C=O, and iron oxides Fe–O [33]. Fe 2p spectrum in Figure 5d is divided into two sub levels including Fe 2p3/2 and Fe 2p1/2. It is obvious that a spin-orbit separation energy was found to be 13.5 eV, while the distance from Fe 2p1/2 to satellite position was only 8.1 eV, which represents Fe3+ cations [35]. Mn 2p spectrum in Figure 5e shows two sub-level of spin-orbit-splits between 2p3/2 and 2p1/2 with their binding energy gap of around 11.8 eV. This distance is in close proximity to spin-orbit separation energy (~11.62 eV) of manganese (II) oxide [35]. In particular, a satellite speak appeared at 647 eV, which is nearly 6.8 eV as far as the 2p½ state, suggesting the existence of Mn2+ in the structure of EG@MnFe2O4 [36].
To quantify the functional groups, the Boehm titration can be used. This experiment allows identification of the amount of phenolic, lactonic, carboxylic groups, and basic groups [37]. It is assumed that NaOH (a very strong base) can neutralize Brønsted acids including phenol, lactone, and carboxylic acid, Na2CO3 can neutralize lactone, and carboxylic acid, and finally, NaHCO3 can neutralize carboxylic groups [38]. According to Table 3, the EG@MnFe2O4 contains a wide range of functional groups (phenolic, lactonic, carboxylic groups, and basic groups) with the amount of 0.044, 0.032, 0.020, and 0.156 mmol/g, respectively. These functional group are obviously derived from the EG component since MnFe2O4 in absence of EG decoration failed to produce the same results. Therefore, compared with MnFe2O4 without EG, EG@MnFe2O4 can own many surface functional groups, which are responsible for enhanced adsorption of CR. The existence of functional groups on the surface of adsorbents can not only create the interaction between the adsorbent and adsorbate, but also, enhance the retention of CR molecules on the adsorbent surface; thus the more the dye molecules are captured, the better the removal efficiency is [39].

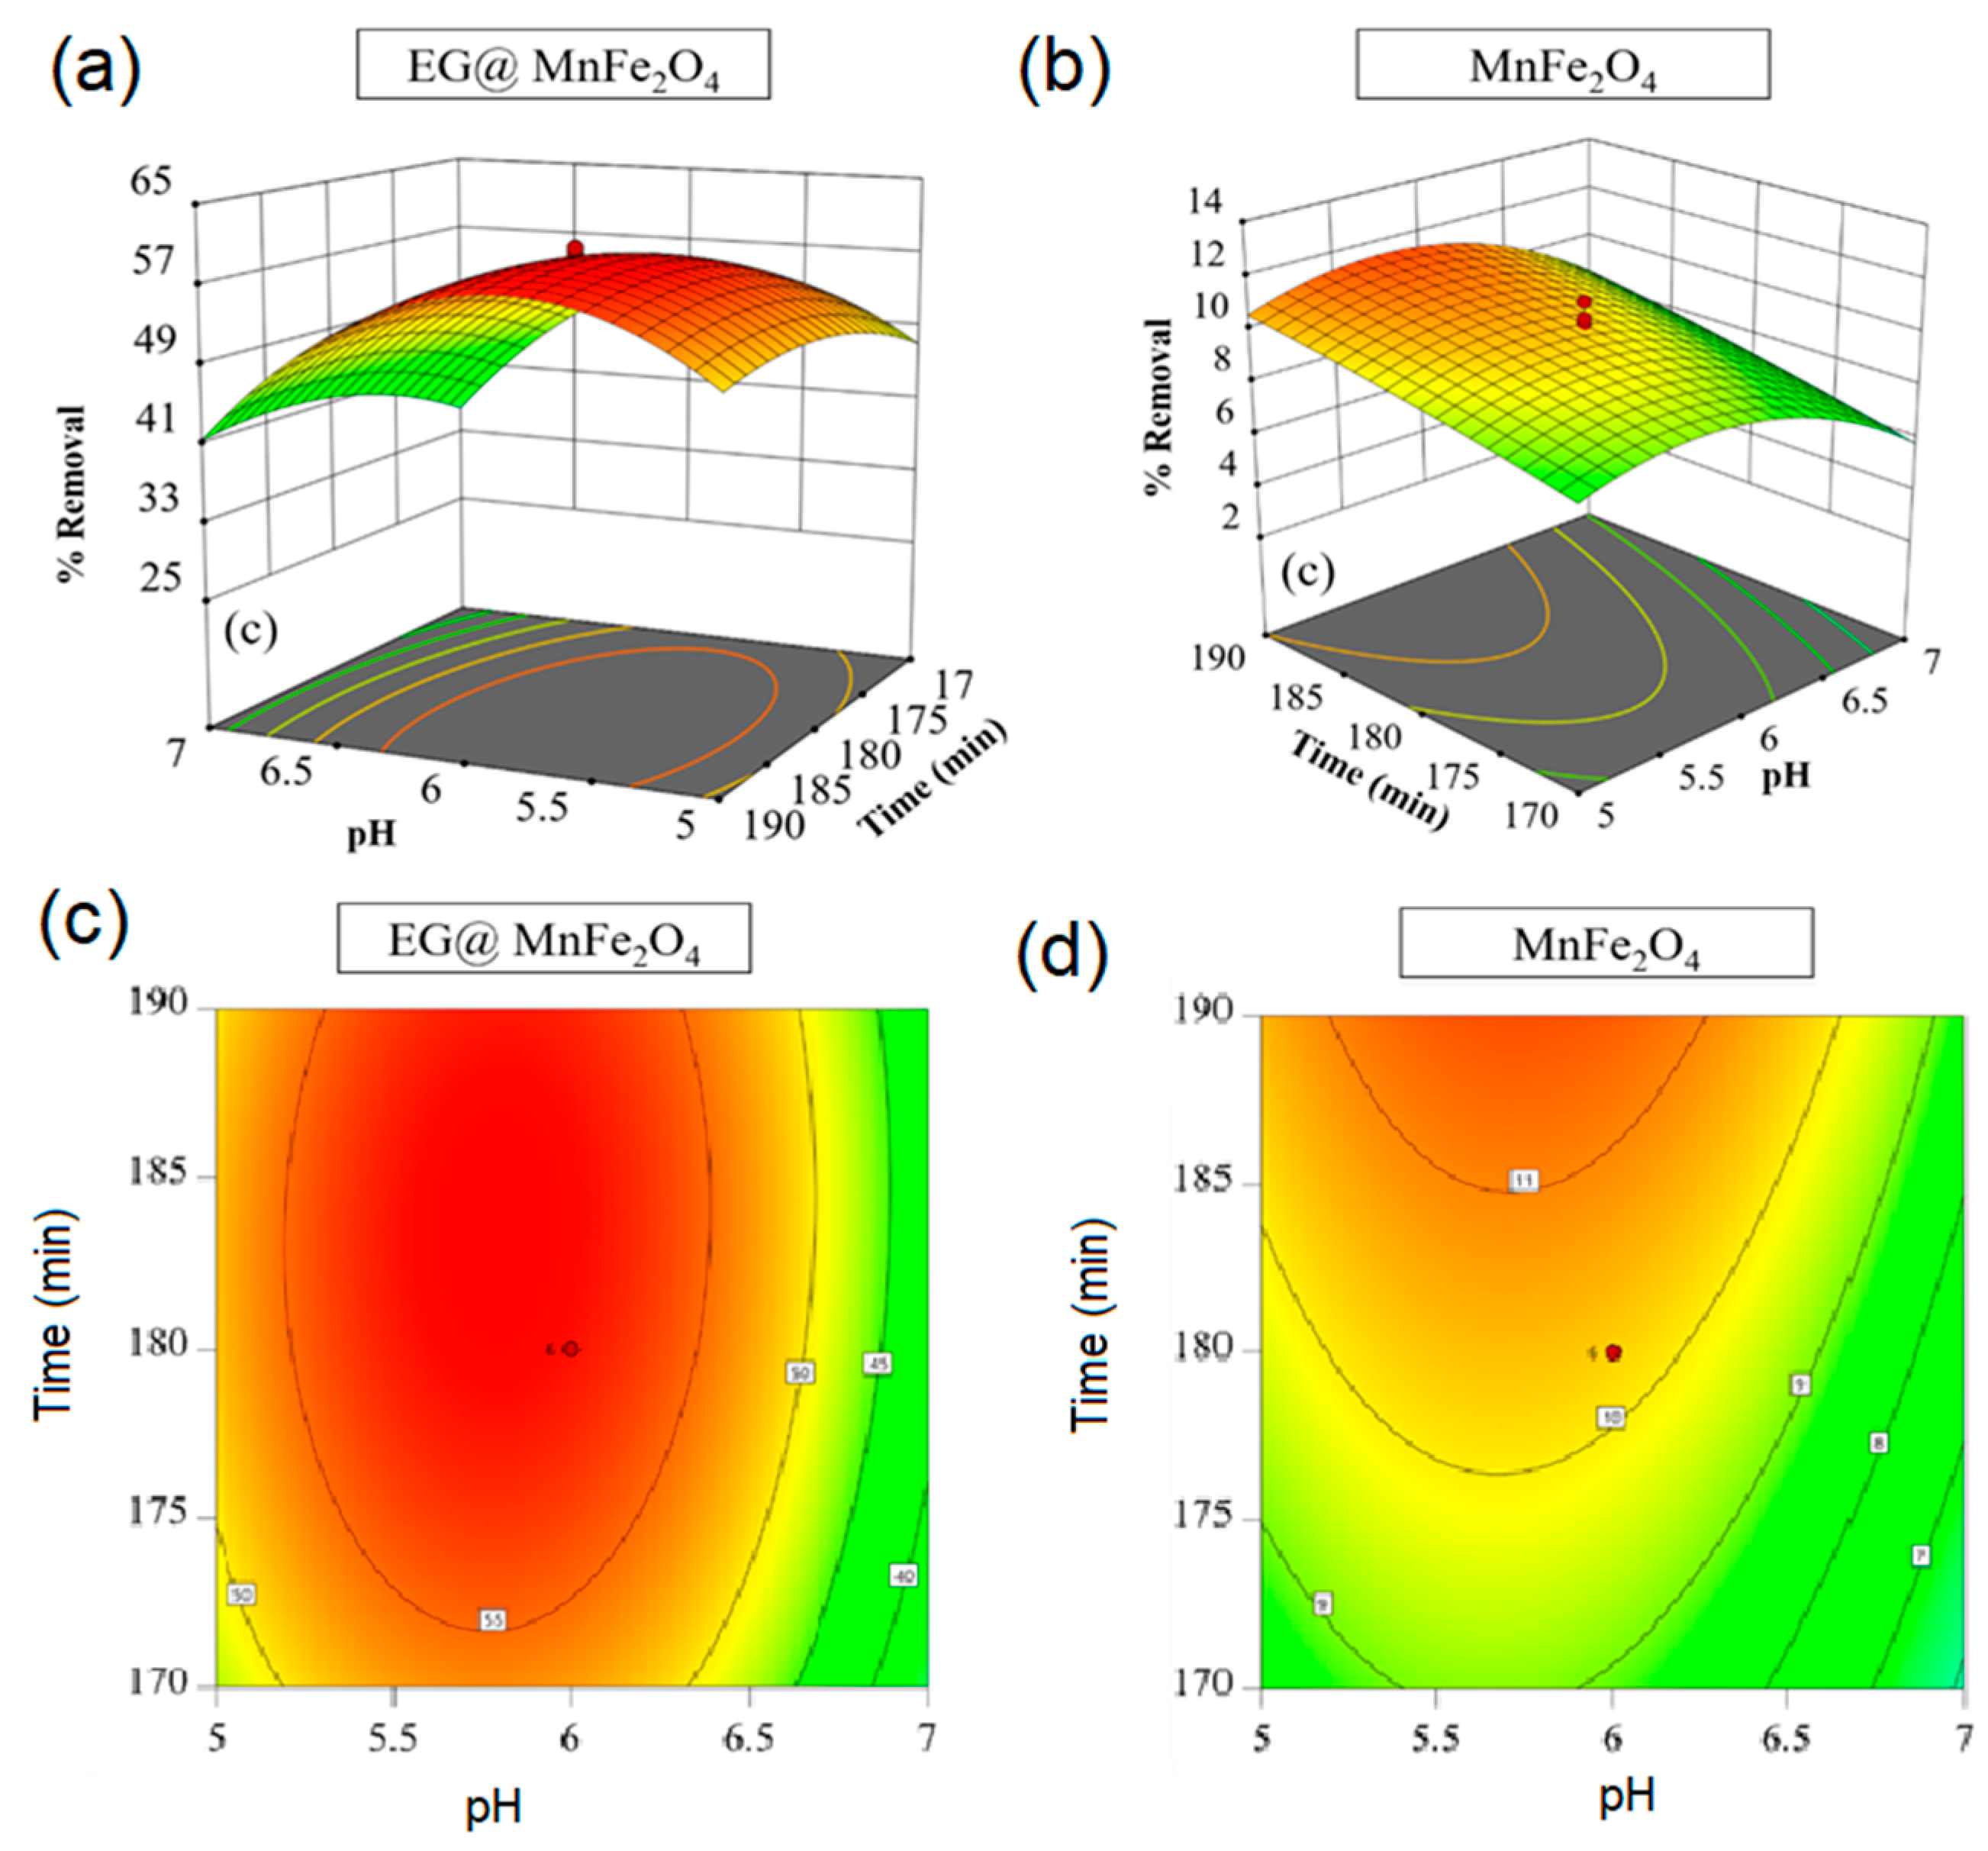
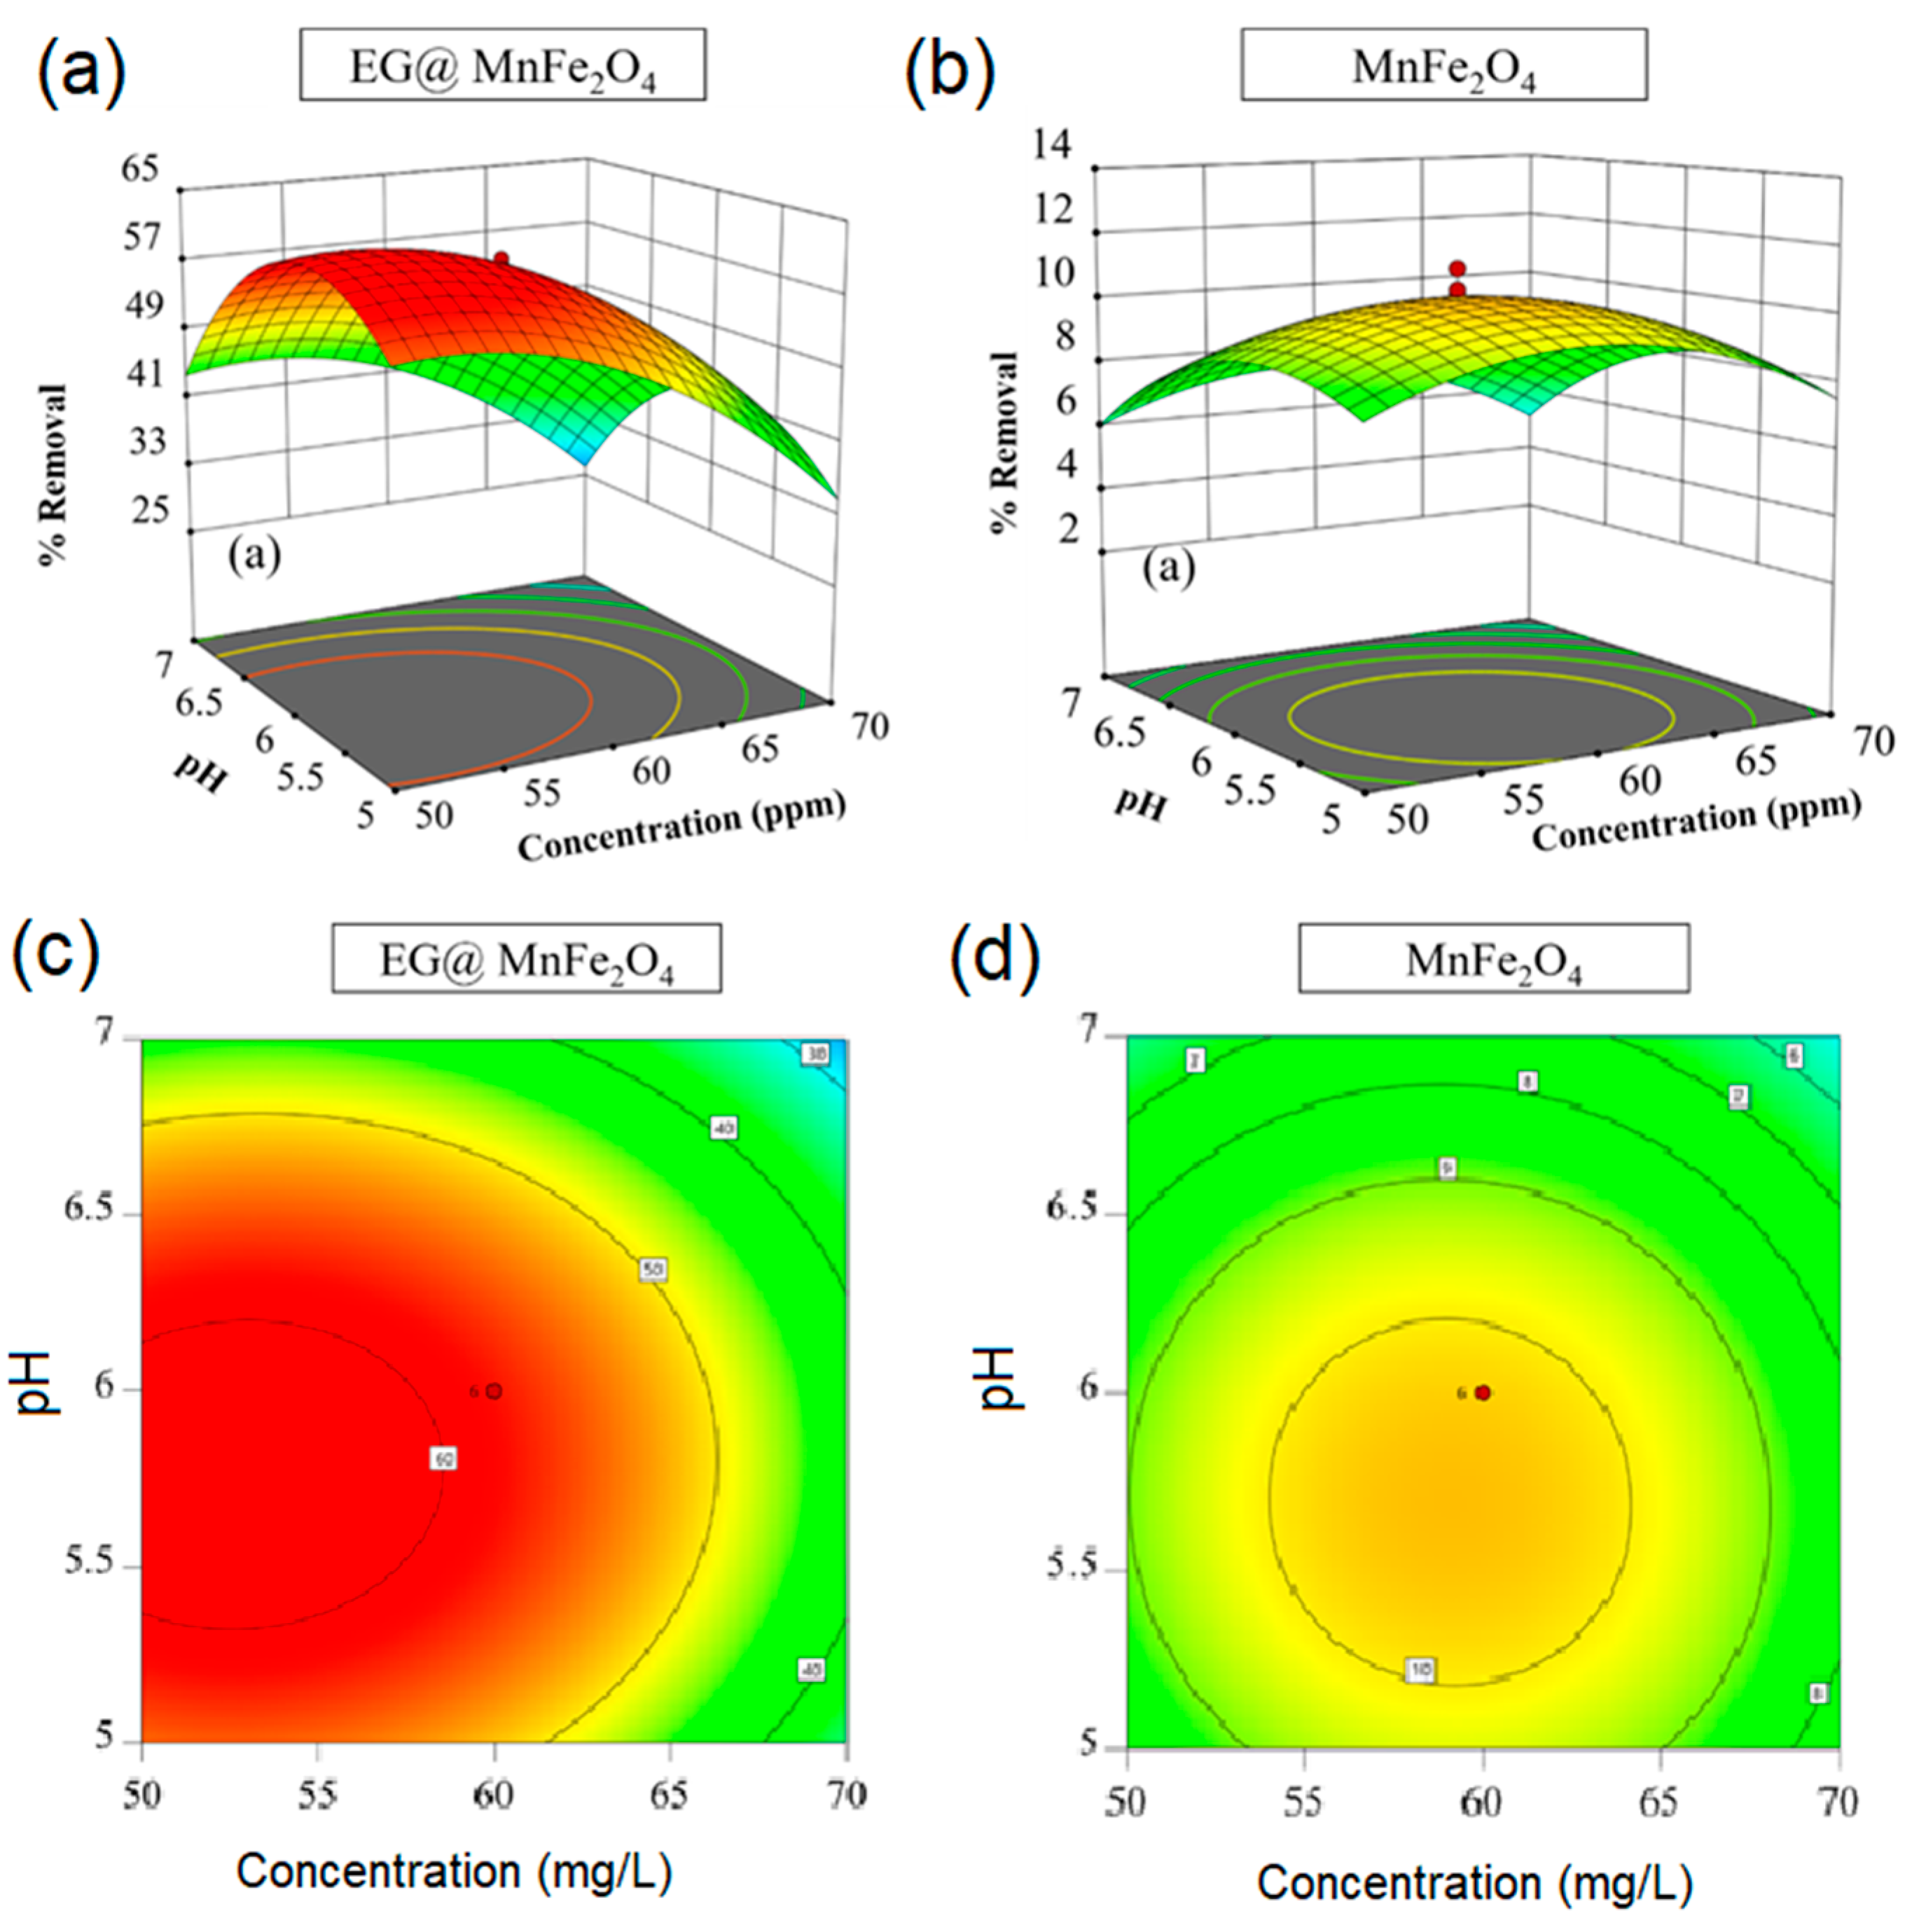
3.2. Optimization with RSM

To compare the adsorption capacity towards CR dye between EG@MnFe2O4 and MnFe2O4, we set up two models with the three variables including solution pH (4.3–7.7), CR concentration (43.2–76.8 mg/L) and contact time (163.2–196.8 min) as shown in Table 1. Table 4 presents the observed and predicted values of 20 experiments (8 axial points, 6 cube points and 6 replicates) using the central composites design (CCD) for two CR adsorption models of EG@MnFe2O4 and MnFe2O4. The values of response as adsorption capacity were also displayed in Table 4.
For all experiments, it is evident that CR adsorption capacities by EG@MnFe2O4 were significantly higher than those by MnFe2O4 materials. For example, in the last five entries, the former material offered the CR adsorption capacity at 58.21 mg/g, compared with 10.28 mg/g of MnFe2O4 without EG decoration. These results could be due to the existence of EG decorated on the surface of EG@MnFe2O4, leading to an enhancement of functional groups, which greatly contribute to the adsorption. To further investigate impact of experimental conditions on adsorption, we analyzed the ANOVA results extracted from Design Expert program, as shown in Table 5.
According to Table 5, ANOVA data is fully listed main statistical parameters of two models, including sum of squares, degree of freedom, mean square, F-value, p-value, coefficient of determination R2, and adequate precision ratio (AP). To obtain the most “statistically significant level”, several conditions of model parameters should be met [40,41,42]. Whereas the larger the F-value and the smaller p-value are desirable for model significance, R2 and AP should be greater than 0.9 and 4 respectively [28]. In that case, proposed models can be considered to be statistically significant at 95% significance level. Comparing these standards with statistical parameters of both models, it is obvious that Prob. > F values were lower than 0.0001, F-values (10.75–121.02) were reliable, along with very high R2 (0.9026–0.9909) and AP ratios (10.6995–30.2649), suggesting that both models offered an excellent degree of compatibility between predicted data and experimental data [43,44]. The R2 reported in this study well meets the criteria of Tugba et al. who suggested that R2 ≥ 0.80 is sufficient for model fitting [45]. Therefore, models for the adsorption of CR onto EG@MnFe2O4 and MnFe2O4 were well-designed, and hence eligible to predict the optimal conditions.
The residual analysis (Figure 6, Figure 7 and Figure 8) is an integral part of evaluating the model suitability. In detail, normal plots of residuals in Figure 6a,b were inclined to be “S-shape” lines rather than linear, possibly resulting in potential errors in predicting the trends of experimental data. However, Grace et al. reported that mentioned residual patterns are still eligible to analyze the transformation of the response [46]. Meanwhile, residuals versus run plots in Figure 7a,b illustrate relatively random scatters, proposing that the variance values are the constants against the residuals variables. At the same trend, Figure 8a,b show predicted and actual points distributed on the 45-degree line, therefore, it is reliable to predict the trends of models [47,48].
Three-dimensional surfaces and contour plots as shown in Figure 9, Figure 10 and Figure 11 reflect the effect of parameters on the response [49]. Figure 9a,b demonstrated the effect of concentration and solution pH on the adsorption of CR onto EG@MnFe2O4 and MnFe2O4. It is obvious that CR adsorption capacity obtained by the former materials was significantly higher than that of the latter. In addition, both variables showed a profound impact on the adsorption capacity of CR onto EG@MnFe2O4 and MnFe2O4, leading to the respective contour plots in Figure 9c,d reaching the convergent regions in the range of investigated values. Therefore, these regions would present the optimal conditions for the adsorption of CR. Figure 10a,b shows the major effect of concentration and modest effect of contact time on the adsorption of CR onto EG@MnFe2O4 and MnFe2O4. Clearly, highest CR adsorption capacities could be achieved at a moderate level of concentration and elevating the concentration past the optimal point may reduce the adsorption efficiency. For contact time, prolonging the exposure time could slightly improve CR uptake, as shown in contour plots of Figure 10c,d, particularly in the contour plot of MnFe2O4, where regions of optimal adsorption tended to deviate from the investigated regions to the top of the plot.. Similarly, Figure 11a–d show the effect of solution pH and contact time on the adsorption of CR onto EG@MnFe2O4 and MnFe2O4. Generally, pH is the most influential factor, while contact time presents a minor role in the adsorption process of CR. Contour plots in Figure 11c,d also demonstrate that the optimum pH was around 6.0.
To maximize the adsorption capacity value, the optimal conditions was set up based on the RSM as summarized in Table 6. Under the optimized conditions, confirmation tests were conducted under optimized conditions to verify the suitability between proposed and actual data. Highest adsorption capacities for the EG@MnFe2O4 and MnFe2O4 were recorded as 62.0 and 11.1 mg/g respectively. Also, it is evident that the results obtained by tested experiments were in line with those by predicted experiments, suggesting the model design was successfully applied. Table 7 compared adsorption capacity using various adsorbents, for which this study showed the better results.

3.3. Proposed Mechanism

Based on optimized conditions via RSM models, it was revealed that CR adsorption capacity of EG@MnFe2O4 was approximately six-fold higher than that of MnFe2O4. This result can be explained due to the role of chemical functional groups on the surface of EG@MnFe2O4 [56]. As previously mentioned, EG@MnFe2O4 is proved to contain many kinds of functional groups including carboxylic acid, lactone, phenol, and base groups, which are non-existent in MnFe2O4 (Table 3). During the adsorption process, the presence of functional groups may contribute to the interaction with CR molecules [56]. As a result, the CR molecules were more easily captured on the surface of EG@MnFe2O4 than on the surface of MnFe2O4.
Herein, we propose several kinds of plausible mechanism including H-bonding, and π–π interaction (Figure 12). It is known that CR molecules are constituted of aromatic rings, amines (–NH2) and imines (–N=N–) as shown in Figure 1, while the four mentioned functional groups contain both H-donors (hydrogen atoms belonging to groups such as –OH, –NH2, –C6H4OH) and H-acceptors (electron-rich oxygen or nitrogen atoms such as –CHO, N=N, –COO). Therefore, a H-bond type can be formed between these CR molecules and functional groups, enhancing the adsorption efficiency [57,58]. In addition, the EG@MnFe2O4 is decorated with the outer EG layer. Because the EG is the carbonaceous source that abundantly contains aromatic rings in the structure. As a result, π–π interaction can be formed between aromatic rings of CR molecules and EG layers of EG@MnFe2O4 material, leading to an improvement in adsorption capacity.
In MnFe2O4, the adsorption of CR may be attributable to the existence of weak forces including “oxygen–metal” bridge and van der Waals [59]. It was reported that the electron-rich atoms such as oxygen can interact with a metal/oxides site to form an intermediate bridge called “oxygen–metal” [59]. Because these kinds of force are weak, the adsorption of CR over MnFe2O4 was unconducive.

4. Conclusions

The EG@MnFe2O4 has been successfully synthesized and characterized. The XPS, FT-IR and Boehm titration results indicated that EG@MnFe2O4 contains various kind of functional groups with carboxylic acid (0.044 mmol/g), phenol (0.032 mmol/g), lactone (0.020 mmol/g), and total base (0.156 mmol/g) on the surface. In addition, EG@MnFe2O4 and MnFe2O4 were used to absorb the CR dye from water via the experimental design by RSM for three parameters: Solution pH (4.3–7.7), CR concentration (43.2–76.8 mg/L) and contact time. The quadratic regression models were proved to be statistically significant at 95% significance level. Verification of the optimized results revealed that the CR adsorption capacity onto EG@MnFe2O4 (62.0 mg/g) was significantly higher than that onto MnFe2O4 (11.1 mg/g). To explain these results, the plausible mechanisms including H-bonding, and π–π interaction were proposed based on the Boehm titration results, assuming that functional groups on the surface of EG@MnFe2O4 play a crucial role in enhancing the adsorption of CR dye.

Author Contributions

Investigation, V.T.P., H.-T.N.T., D.T.C.N., H.T.N.L., T.T.N., N.L.T.H., K.T.L. and V.T.T.; supervision, T.D.N. and L.G.B.; writing—original draft, V.T.P.

Funding

This research received no external funding.

Acknowledgments

The Foundation for Science and Technology Development, Nguyen Tat Thanh University, Ho Chi Minh city, Vietnam is acknowledged.

Conflicts of Interest

The authors declare no conflict of interest.

References

  1. Forgacs, E.; Cserhati, T.; Oros, G. Removal of synthetic dyes from wastewaters: A review. Environ. Int. 2004, 30, 953–971. [Google Scholar] [CrossRef]
  2. Ali, H. Biodegradation of synthetic dyes—A review. Water Air Soil Pollut. 2010, 213, 251–273. [Google Scholar] [CrossRef]
  3. Liu, W.; Liu, L.; Liu, C.; Hao, Y.; Yang, H.; Yuan, B.; Jiang, J. Methylene blue enhances the anaerobic decolorization and detoxication of azo dye by Shewanella onediensis MR-1. Biochem. Eng. J. 2016, 110, 115–124. [Google Scholar] [CrossRef]
  4. Zhang, Q.; Xie, X.; Liu, Y.; Zheng, X.; Wang, Y.; Cong, J.; Yu, C.; Liu, N.; Liu, J.; Sand, W. Fructose as an Additional Co-Metabolite Promotes Refractory Dye Degradation: Performance and Mechanism. Bioresour. Technol. 2019, 280, 430–440. [Google Scholar] [CrossRef]
  5. Raj, R.A.; Manimozhi, V.; Saravanathamizhan, R. Adsorption studies on removal of Congo red dye from aqueous solution using petroleum coke. Pet. Sci. Technol. 2019, 37, 913–924. [Google Scholar] [CrossRef]
  6. Si, Y.; Samulski, E.T. Exfoliated graphene separated by platinum nanoparticles. Chem. Mater. 2008, 20, 6792–6797. [Google Scholar] [CrossRef]
  7. Stankovich, S.; Dikin, D.A.; Piner, R.D.; Kohlhaas, K.A.; Kleinhammes, A.; Jia, Y.; Wu, Y.; Nguyen, S.T.; Ruoff, R.S. Synthesis of graphene-based nanosheets via chemical reduction of exfoliated graphite oxide. Carbon N. Y. 2007, 45, 1558–1565. [Google Scholar] [CrossRef]
  8. Wang, H.; Robinson, J.T.; Li, X.; Dai, H. Solvothermal reduction of chemically exfoliated graphene sheets. J. Am. Chem. Soc. 2009, 131, 9910–9911. [Google Scholar] [CrossRef] [PubMed]
  9. Huang, Z.-H.; Zheng, X.; Lv, W.; Wang, M.; Yang, Q.-H.; Kang, F. Adsorption of Lead(II) Ions from Aqueous Solution on Low-Temperature Exfoliated Graphene Nanosheets. Langmuir 2011, 27, 7558–7562. [Google Scholar] [CrossRef]
  10. Wang, S.; Zhu, Z.H.; Coomes, A.; Haghseresht, F.; Lu, G.Q. The physical and surface chemical characteristics of activated carbons and the adsorption of methylene blue from wastewater. J. Colloid Interface Sci. 2005, 284, 440–446. [Google Scholar] [CrossRef]
  11. Zeng, H.; Rice, P.M.; Wang, S.X.; Sun, S. Shape-controlled synthesis and shape-induced texture of MnFe2O4 nanoparticles. J. Am. Chem. Soc. 2004, 126, 11458–11459. [Google Scholar] [CrossRef]
  12. Hu, J.; Lo, I.M.C.; Chen, G. Fast removal and recovery of Cr, VI, using surface-modified jacobsite, MnFe2O4, nanoparticles. Langmuir 2005, 213, 11173–11179. [Google Scholar] [CrossRef]
  13. Tran, T.V.; Nguyen, U.T.T.; Nguyen, T.T.; Hoang, B.N.; Tran, H.T.; Nguyen, N.P.T.; Ho, V.T.T.; Nguyen, M.T.; Bach, L.G.; Nguyen, T.D. Synthesis and magnetic properties of graphene oxide-decorated cobalt, manganese and nickel ferrite nanoparticles prepared by polymerized route. In Proceedings of the IOP Conference Series: Materials Science and Engineering, Nice, France, 22–24 February 2019; IOP Publishing: Bristol, UK, 2019; p. 12114. [Google Scholar]
  14. Bach, L.G.; van Tran, T.; Nguyen, T.D.; van Pham, T.; Do, S.T. Enhanced adsorption of methylene blue onto graphene oxide-doped XFe2O4, X = Co, Mn, Ni, nanocomposites: Kinetic, isothermal, thermodynamic and recyclability studies. Res. Chem. Intermed. 2018, 44, 1661–1687. [Google Scholar] [CrossRef]
  15. Nguyen, D.T.C. Metal-Organic Framework MIL-53(Fe, as an Adsorbent for Ibuprofen Drug Removal from Aqueous Solutions: Response Surface Modeling and Optimization. J. Chem. 2019. [Google Scholar] [CrossRef]
  16. Shao, L.; Ren, Z.; Zhang, G.; Chen, L. Facile synthesis, characterization of a MnFe2O4/activated carbon magnetic composite and its effectiveness in tetracycline removal. Mater. Chem. Phys. 2012, 135, 16–24. [Google Scholar] [CrossRef]
  17. Zhang, Z.; Wang, Y.; Tan, Q.; Zhong, Z.; Su, F. Facile solvothermal synthesis of mesoporous manganese ferrite, MnFe2O4, microspheres as anode materials for lithium-ion batteries. J. Colloid Interface Sci. 2013, 398, 185–192. [Google Scholar] [CrossRef]
  18. Han, A.; Liao, J.; Ye, M.; Li, Y.; Peng, X. Preparation of Nano-MnFe2O4 and Its Catalytic Performance of Thermal Decomposition of Ammonium Perchlorate. Chin. J. Chem. Eng. 2011, 19, 1047–1051. [Google Scholar] [CrossRef]
  19. Şimşek, T.; Akansel, S.; Özcan, Ş.; Ceylan, A. Synthesis of MnFe2O4 nanocrystals by wet-milling under atmospheric conditions. Ceram. Int. 2014, 40, 7953–7956. [Google Scholar] [CrossRef]
  20. Aslibeiki, B.; Kameli, P.; Ehsani, M.H.; Salamati, H.; Muscas, G.; Agostinelli, E.; Foglietti, V.; Casciardi, S.; Peddis, D. Solvothermal synthesis of MnFe2O4 nanoparticles: The role of polymer coating on morphology and magnetic properties. J. Magn. Magn. Mater. 2016, 399, 236–244. [Google Scholar] [CrossRef]
  21. Chen, D.; Zhang, Y.; Kang, Z. A low temperature synthesis of MnFe2O4 nanocrystals by microwave-assisted ball-milling. Chem. Eng. J. 2013, 215–216, 235–239. [Google Scholar] [CrossRef]
  22. Yao, Y.; Cai, Y.; Lu, F.; Wei, F.; Wang, X.; Wang, S. Magnetic recoverable MnFe2O4 and MnFe2O4-graphene hybrid as heterogeneous catalysts of peroxymonosulfate activation for efficient degradation of aqueous organic pollutants. J. Hazard. Mater. 2014, 270, 61–70. [Google Scholar] [CrossRef] [PubMed]
  23. Yamaguchi, N.U.; Bergamasco, R.; Hamoudi, S. Magnetic MnFe2O4-graphene hybrid composite for efficient removal of glyphosate from water. Chem. Eng. J. 2016, 295, 391–402. [Google Scholar] [CrossRef]
  24. Li, S.; Wang, B.; Li, B.; Liu, J.; Yu, M.; Wu, X. Self-assembly of 2D sandwich-structured MnFe2O4/graphene composites for high-performance lithium storage. Mater. Res. Bull. 2015, 61, 369–374. [Google Scholar] [CrossRef]
  25. Pham, M.C.; Piro, B.; Bazzaoui, E.A.; Hedayatullah, M.; Lacroix, J.-C.; Novák, P.; Haas, O. Anodic oxidation of 5-amino-1, 4-naphthoquinone, ANQ, and synthesis of a conducting polymer, PANQ). Synth. Met. 1998, 92, 197–205. [Google Scholar] [CrossRef]
  26. Tran, T.V.; Le, H.T.N.; Ha, H.Q.; Duong, X.N.T.; Nguyen, L.H.-T.; Doan, T.L.H.; Nguyen, H.L.; Truong, T. A five coordination Cu(ii) cluster-based MOF and its application in the synthesis of pharmaceuticals via sp3 C-H/N-H oxidative coupling. Catal. Sci. Technol. 2017, 7, 3453–3458. [Google Scholar] [CrossRef]
  27. Gharib, M.; Safarifard, V.; Morsali, A. Ultrasound assisted synthesis of amide functionalized metal-organic framework for nitroaromatic sensing. Ultrason. Sonochem. 2018, 42, 112–118. [Google Scholar] [CrossRef]
  28. Tran, V.T.; Nguyen, D.T.; Ho, V.T.T.; Hoang, P.Q.H.; Bui, P.Q.; Bach, L.G. Efficient removal of Ni 2 ions from aqueous solution using activated carbons fabricated from rice straw and tea waste. J. Mater. Environ. Sci. 2017, 8, 426–437. [Google Scholar]
  29. Le, H.T.N.; Tran, T.V.; Phan, N.T.S.; Truong, T. Efficient and recyclable Cu2(BDC)2(BPY)-catalyzed oxidative amidation of terminal alkynes: Role of bipyridine ligand. Catal. Sci. Technol. 2015, 5, 851–859. [Google Scholar] [CrossRef]
  30. Bodirlau, R.; Teaca, C.A. Fourier transform infrared spectroscopy and thermal analysis of lignocellulose fillers treated with organic anhydrides. Rom. J. Phys. 2009, 54, 93–104. [Google Scholar]
  31. Jia, X.-J.; Wang, J.; Wu, J.; Du, Y.; Zhao, B.; den Engelsen, D. Bouquet-like calcium sulfate dihydrate: A highly efficient adsorbent for Congo red dye. RSC Adv. 2015, 5, 72321–72330. [Google Scholar] [CrossRef]
  32. Mittal, A.; Thakur, V.; Mittal, J.; Vardhan, H. Process development for the removal of hazardous anionic azo dye Congo red from wastewater by using hen feather as potential adsorbent. Desalin. Water Treat. 2014, 52, 227–237. [Google Scholar] [CrossRef]
  33. Van Tran, T.; Nguyen, D.T.C.; Le, H.T.N.; Bach, L.G.; Vo, D.-V.N.; Hong, S.S.; Phan, T.-Q.T.; Nguyen, T.D. Tunable Synthesis of Mesoporous Carbons from Fe3O(BDC)3 for Chloramphenicol Antibiotic Remediation. Nanomaterials 2019, 9, 237. [Google Scholar] [CrossRef]
  34. Guedidi, H.; Reinert, L.; Lévêque, J.-M.; Soneda, Y.; Bellakhal, N.; Duclaux, L. The effects of the surface oxidation of activated carbon, the solution pH and the temperature on adsorption of ibuprofen. Carbon N. Y. 2013, 54, 432–443. [Google Scholar] [CrossRef]
  35. Yamashita, T.; Hayes, P. Analysis of XPS spectra of Fe2+ and Fe3+ ions in oxide materials. Appl. Surf. Sci. 2008, 254, 2441–2449. [Google Scholar] [CrossRef]
  36. Wang, H.; Yao, Q.; Wang, C.; Fan, B.; Sun, Q.; Jin, C.; Xiong, Y.; Chen, Y. A simple, one-step hydrothermal approach to durable and robust superparamagnetic, superhydrophobic and electromagnetic wave-absorbing wood. Sci. Rep. 2016, 6, 35549. [Google Scholar] [CrossRef] [PubMed] [Green Version]
  37. Van Tran, T.; Nguyen, D.T.C.; Le, H.T.N.; Nguyen, O.T.K.; Nguyen, V.H.; Nguyen, T.T.; Bach, L.G.; Nguyen, T.D. A hollow mesoporous carbon from metal-organic framework for robust adsorbability of ibuprofen drug in water. R. Soc. Open Sci. 2019, 6, 190058. [Google Scholar] [CrossRef] [Green Version]
  38. Goertzen, S.L.; Thériault, K.D.; Oickle, A.M.; Tarasuk, A.C.; Andreas, H.A. Standardization of the Boehm titration. Part I. CO2 expulsion and endpoint determination. Carbon N. Y. 2010, 48, 1252–1261. [Google Scholar] [CrossRef]
  39. Van Tran, T.; Nguyen, D.T.C.; Le, H.T.N.; Duong, C.D.; Bach, L.G.; Nguyen, H.-T.T.; Nguyen, T.D. Facile synthesis of manganese oxide-embedded mesoporous carbons and their adsorbability towards methylene blue. Chemosphere 2019, 227, 455–461. [Google Scholar] [CrossRef]
  40. Van Tran, T.; Bui, Q.T.P.; Nguyen, T.D.; Le, N.T.H.; Bach, L.G. A comparative study on the removal efficiency of metal ions, Cu2+, Ni2+, and Pb2+, using sugarcane bagasse-derived ZnCl2-activated carbon by the response surface methodology. Adsorpt. Sci. Technol. 2017, 35, 72–85. [Google Scholar] [CrossRef]
  41. Van Thuan, T.; Quynh, B.T.P.; Nguyen, T.D.; Ho, V.T.T.; Bach, L.G. Response surface methodology approach for optimization of Cu2+, Ni2+, and Pb2+ adsorption using KOH-activated carbon from banana peel. Surf. Interfaces 2017, 6, 209–217. [Google Scholar] [CrossRef]
  42. Van Tran, T.; Bui, Q.T.P.; Nguyen, T.D.; Ho, V.T.T.; Bach, L.G. Application of response surface methodology to optimize the fabrication of ZnCl2-activated carbon from sugarcane bagasse for the removal of Cu2+. Water Sci. Technol. 2017, 75, 2047–2055. [Google Scholar] [CrossRef] [PubMed]
  43. Hadi, A.; Karimi-Sabet, J.; Moosavian, S.M.A.; Ghorbanian, S. Optimization of graphene production by exfoliation of graphite in supercritical ethanol: A response surface methodology approach. J. Supercrit. Fluids. 2016, 107, 92–105. [Google Scholar] [CrossRef]
  44. Ghasemi, F.A.; Ghasemi, I.; Menbari, S.; Ayaz, M.; Ashori, A. Optimization of mechanical properties of polypropylene/talc/graphene composites using response surface methodology. Polym. Test. 2016, 53, 283–292. [Google Scholar] [CrossRef]
  45. Ölmez, T. The optimization of Cr(VI) reduction and removal by electrocoagulation using response surface methodology. J. Hazard. Mater. 2009, 162, 1371–1378. [Google Scholar] [CrossRef]
  46. Grace, M.N.; Wilson, G.M.; Leslie, P.F. Statistical testing of input factors in the carbonation of brine impacted fly ash. J. Environ. Sci. Heal. Part A 2012, 47, 245–259. [Google Scholar] [CrossRef] [Green Version]
  47. Van Tran, T.; Nguyen, D.T.C.; Le, H.T.N.; Bach, L.G.; Vo, D.-V.N.; Kwon, L.T.; Nong, L.X.; Nguyen, T.D. Combined Minimum-Run Resolution IV and Central Composite Design for Optimized Removal of the Tetracycline Drug Over Metal–Organic Framework-Templated Porous Carbon. Molecules 2019, 24, 1887. [Google Scholar] [CrossRef]
  48. Ilaiyaraja, N.; Likhith, K.R.; Babu, G.R.S.; Khanum, F. Optimisation of extraction of bioactive compounds from Feronia limonia, wood apple, fruit using response surface methodology (RSM). Food Chem. 2015, 173, 348–354. [Google Scholar] [CrossRef]
  49. Van Tran, T.; Nguyen, D.T.C.; Le, H.T.N.; Tu, T.T.K.; Le, N.D.; Lim, K.T.; Bach, L.G.; Nguyen, T.D. MIL-53(Fe)-directed synthesis of hierarchically mesoporous carbon and its utilization for ciprofloxacin antibiotic remediation. J. Environ. Chem. Eng. 2019, 7, 102881. [Google Scholar] [CrossRef]
  50. Pavan, F.A.; Dias, S.L.P.; Lima, E.C.; Benvenutti, E.V. Removal of Congo red from aqueous solution by anilinepropylsilica xerogel. Dye. Pigment. 2008, 76, 64–69. [Google Scholar] [CrossRef]
  51. Vimonses, V.; Lei, S.; Jin, B.; Chow, C.W.K.; Saint, C. Kinetic study and equilibrium isotherm analysis of Congo Red adsorption by clay materials. Chem. Eng. J. 2009, 148, 354–364. [Google Scholar] [CrossRef]
  52. Namasivayam, C.; Muniasamy, N.; Gayatri, K.; Rani, M.; Ranganathan, K. Removal of dyes from aqueous solutions by cellulosic waste orange peel. Bioresour. Technol. 1996, 57, 37–43. [Google Scholar] [CrossRef]
  53. Akl, M.A.; Youssef, A.M.; Al-Awadhi, M.M. Adsorption of acid dyes onto bentonite and surfactant-modified bentonite. J. Anal. Bioanal. Tech. 2013, 4, 3–7. [Google Scholar]
  54. Wang, L.; Wang, A. Adsorption characteristics of Congo Red onto the chitosan/montmorillonite nanocomposite. J. Hazard. Mater. 2007, 147, 979–985. [Google Scholar] [CrossRef]
  55. Zhu, H.-Y.; Fu, Y.-Q.; Jiang, R.; Jiang, J.-H.; Xiao, L.; Zeng, G.-M.; Zhao, S.-L.; Wang, Y. Adsorption removal of congo red onto magnetic cellulose/Fe3O4/activated carbon composite: Equilibrium, kinetic and thermodynamic studies. Chem. Eng. J. 2011, 173, 494–502. [Google Scholar] [CrossRef]
  56. Uchimiya, M.; Chang, S.; Klasson, K.T. Screening biochars for heavy metal retention in soil: Role of oxygen functional groups. J. Hazard. Mater. 2011, 190, 432–441. [Google Scholar] [CrossRef] [PubMed]
  57. Ahmed, I.; Jhung, S.H. Applications of metal-organic frameworks in adsorption/separation processes via hydrogen bonding interactions. Chem. Eng. J. 2017, 310, 197–215. [Google Scholar] [CrossRef]
  58. Song, J.Y.; Bhadra, B.N.; Jhung, S.H. Contribution of H-bond in adsorptive removal of pharmaceutical and personal care products from water using oxidized activated carbon. Microporous Mesoporous Mater. 2017, 243, 221–228. [Google Scholar] [CrossRef]
  59. Van Tran, T.; Cao, V.D.; Nguyen, V.H.; Hoang, B.N.; Vo, D.-V.N.; Nguyen, T.D.; Bach, L.G. MIL-53(Fe) derived magnetic porous carbon as a robust adsorbent for the removal of phenolic compounds under the optimized conditions. J. Environ. Chem. Eng. 2019, 102902. [Google Scholar] [CrossRef]
Figure 1. Molecular structure of the Congo red dye.
Processes 07 00305 g001
Scheme 1. Process for adsorption of Congo red dye onto exfoliated graphite-decorated MnFe2O4 nanocomposite.
Processes 07 00305 sch001
Figure 2. XRD diffraction of EG@MnFe2O4 (a,b) and MnFe2O4 (a).
Processes 07 00305 g002
Figure 3. Vibrating sample magnetometer (VSM) curve of EG@MnFe2O4.
Processes 07 00305 g003
Figure 4. FT-IR spectra of EG@MnFe2O4 and CR-loaded EG@MnFe2O4.
Processes 07 00305 g004
Figure 5. XPS spectra of EG@MnFe2O4: (a) Survey, (b) C 1s, (c) O 1s, (d) Fe 2p, (e) Mn 2p.
Processes 07 00305 g005
Figure 6. Externally Studentized residuals versus normal probability plots for the adsorption of CR onto EG@MnFe2O4 (a) and MnFe2O4 (b).
Processes 07 00305 g006
Figure 7. Residuals versus run plots for the adsorption of CR onto EG@MnFe2O4 (a) and MnFe2O4 (b).
Processes 07 00305 g007
Figure 8. Actual versus predicted (a,b) plots for the adsorption of CR onto EG@MnFe2O4 (a) and MnFe2O4 (b).
Processes 07 00305 g008
Figure 9. Three-dimensional (3-D)surface responses (a,b) and their respective contour plots (c,d): Effect of concentration and solution pH on the adsorption of CR onto EG@MnFe2O4 (a,c) and MnFe2O4 (b,d).
Processes 07 00305 g009
Figure 10. 3-D surface responses (a,b) and their respective contour plots (c,d): Effect of concentration and contact time on the adsorption of CR onto EG@MnFe2O4 (a,c) and MnFe2O4 (b,d).
Processes 07 00305 g010
Figure 11. 3-D surface responses (a,b) and their respective contour plots (c,d): Effect of solution pH and contact time on the adsorption of CR onto EG@MnFe2O4 (a,c) and MnFe2O4 (b,d).
Processes 07 00305 g011
Figure 12. Proposed mechanism for the adsorption of CR onto EG@MnFe2O4.
Processes 07 00305 g012
Table 1. List of variables for optimization of Congo red (CR) removal.
NoIndependent FactorsUnitCodeLevels
α −10+1 + α
1pH of solution (pH)- x 1 4.35677.7
2Concentration (Co)g/L x 2 43.250607076.8
3Timemin x 3 163.2170180190196.8
Table 2. The surface functional groups analysis of EG@MnFe2O4.
Functional GroupsExperimental Frequency (cm−1)ClassRef.
O–H and N–H stretching3300–3500 (broad band)Primary amines, secondary amines, hydroxyls of absorbed water.[25]
C=O stretch1730 (very strong band)Carbonyls of aldehydes (–CHO) or ketones (–C=O), lactone, esters (–COO–) or acid carboxylic (–COOH)[26]
1639 (very strong band)Conjugation lowers frequency amides (–NHCO), or N–H stretching[27]
C=C bending1520Aromatic rings, alkenes[28]
C–O stretch1195 (strong band)Phenolic compounds or tertiary alcohol[29]
1076Primary alcohols[30]
Table 3. Surface groups obtained from Boehm titrations and textual properties of MnFe2O4 and EG@MnFe2O4.
NoMaterialsMnFe2O4EG@MnFe2O4
1Carboxylic groups (mmol/g)00.044
2Lactonic groups (mmol/g)00.032
3Phenolic groups (mmol/g)00.020
4Total oxygenated groups (mmol/g)00.096
5Total basic groups (mmol/g)00.156
Table 4. Matrix of observed and predicted values for CR adsorption capacity.
RunIndependent FactorsOnto EG@MnFe2O4Onto MnFe2O4
x 1 x 2 x 3 Actual (mg/g)Predicted (mg/g)Actual (mg/g)Predicted (mg/g)
150517049.9250.486.386.79
250717035.1037.835.986.27
370517030.3630.313.144.45
470717020.0120.472.513.61
550519052.6253.929.019.04
650719041.8143.628.648.46
770519034.3633.386.427.26
870719024.7025.895.636.36
9604.318033.5033.856.755.75
10607.718019.7416.915.163.34
11643.218058.2155.266.867.08
12676.818022.9123.395.163.34
13660163.247.5246.179.077.77
14660196.854.7553.6212.2811.97
1566018057.9158.2110.3510.28
1666018057.4558.2110.3010.28
1766018058.4158.2111.1310.28
1866018057.6858.219.1810.28
1966018058.3058.2110.4810.28
2066018059.0858.2110.0110.28
Table 5. ANOVA data for the model of CR adsorption.
MaterialSourceSum of SquaresDegree of FreedomMean SquareF-ValueProb. > FComment
EG@ MnFe2O4Model4056.219450.69121.02<0.0001 SD = 1.93
x 1 1225.9111225.91329.18<0.0001 Mean = 43.72
x 2 346.281346.2892.98<0.0001 CV(%) = 4.41
x 3 67.03167.0318.000.0017 R2 = 0.9909
x 1 2 642.601642.60172.55<0.0001 AP = 30.2649
x 2 2 1941.6011941.60521.36<0.0001
x 3 2 124.461124.4633.420.0002
x 1 x 2 3.9413.941.060.3279
x 1 x 3 0.065510.06550.01760.8971
x 2 x 3 2.7612.760.74060.4096
MnFe2O4Mode125.91913.9910.750.0005SD = 1.14
x 1 1.7311.731.330.2763Mean = 7.72
x 2 16.84116.8412.940.0049CV(%) = 14.78
x 3 21.34121.3416.390.0023R2 = 0.9063
x 1 2 47.42147.4236.430.0001AP = 10.6995
x 2 2 46.37146.3735.630.0001
x 3 2 0.305010.30500.23430.6388
x 1 x 2 0.055810.05880.04280.8402
x 1 x 3 0.001810.00180.00140.9713
x 2 x 3 0.157810.15780.12120.7349
Note that: Prob. is probability, SD is standard deviations, CV is coefficient of variation, R2 is coefficient of determination, AP is adequate precision.
Table 6. Confirmation of experiment results.
SamplepH
(-)
Concentration
(mg/L)
Time
(min)
Adsorption Capacity (mg/g)Desirability
PredictedTestedError
EG@MnFe2O45.757.718160.662.01.41.0000
MnFe2O46.062.018210.411.10.71.0000
Table 7. Comparation of adsorption capacity using various adsorbents.
No.AdsorbentsAdsorption Capacity (mg/g)Reference
1EG@MnFe2O462.0This work
2MnFe2O411.1This work
3Anilinepropylsilica xerogel22.62[50]
4Kaolin5.44[51]
5Waste orange peel22.4[52]
6Bentonite40.4[53]
7CTS powder74.7[54]
8CTS-MMT54.5[54]
9m-Cell/Fe3O4/ACCs60.5[55]

