Article

An Experimental Approach on Industrial Pd-Ag Supported α-Al2O3 Catalyst Used in Acetylene Hydrogenation Process: Mechanism, Kinetic and Catalyst Decay

by
Ourmazd Dehghani
,
Mohammad Reza Rahimpour
* and
Alireza Shariati
Department of Chemical Engineering, Shiraz University, Shiraz 71345, Iran
*
Author to whom correspondence should be addressed.
Processes 2019, 7(3), 136; https://doi.org/10.3390/pr7030136
Submission received: 4 February 2019 / Revised: 18 February 2019 / Accepted: 19 February 2019 / Published: 5 March 2019
(This article belongs to the Special Issue Metal Nanoparticles as Catalysts for Green Applications)

Abstract

:
The current research presents an experimental approach on the mechanism, kinetic and decay of industrial Pd-Ag supported α-Al2O3 catalyst used in the acetylene hydrogenation process. In the first step, the fresh and deactivated hydrogenation catalysts are characterized by XRD, BET (Brunauer–Emmett–Teller), SEM, TEM, and DTG analyses. The XRD results show that the dispersed palladium particles on the support surface experience an agglomeration during the reaction run time and mean particle size approaches from 6.2 nm to 11.5 nm. In the second step, the performance of Pd-Ag supported α-Al2O3 catalyst is investigated in a differential reactor in a wide range of hydrogen to acetylene ratio, temperature, gas hourly space velocity and pressure. The full factorial design method is used to determine the experiments. Based on the experimental results ethylene, ethane, butene, and 1,3-butadiene are produced through the acetylene hydrogenation. In the third step, a detailed reaction network is proposed based on the measured compounds in the product and the corresponding kinetic model is developed, based on the Langmuir-Hinshelwood-Hougen-Watson approach. The coefficients of the proposed kinetic model are calculated based on experimental data. Finally, based on the developed kinetic model and plant data, a decay model is proposed to predict catalyst activity and the parameters of the activity model are calculated. The results show that the coke build-up and condensation of heavy compounds on the surface cause catalyst deactivation at low temperature.

1. Introduction

Generally, ethylene is one of the most important building blocks in the chemical industry, which is widely used to produce a wide range of products and intermediates, such as polyethylene, ethylene oxide, ethylbenzene, and ethylene dichloride [1,2]. Although the catalytic conversion of hydrocarbons to ethylene is beneficial, the steam thermal cracking of ethane, LPG, naphtha, and gasoline is the most popular method to produce ethylene. Typically, a wide range of hydrocarbons is produced in the thermal cracking process. Acetylene as a by-product of cracking unit has an enormous effect on the quality of product and must be removed from the olefin streams prior to further processing [3]. Typically, the minimum required purity of ethylene in the polymerization processes to produce polyethylene is about 99.90% and the maximum allowable limit of acetylene is 5 ppm known as polymer-grade ethylene. Acetylene decreases the catalyst activity in the ethylene polymerization unit, and can produce metal acetylides as explosive compartments. In this regard, several technologies have been proposed to decrease the acetylene concentration in the effluent product from thermal cracking furnaces, including acetylene hydrogenation to ethylene and acetylene separation from the main stream [4]. Since the separation process is expensive and dangerous, the catalytic hydrogenation is more popular and attractive.

1.1. Hydrogenation Catalysts

Catalyst selection and preparation is one of the most important stages in process design and development. Generally, Pd, Pd-Ag, and Pd-Au supported on α-Al2O3 have been designed to use in the industrial acetylene hydrogenation process [5,6,7]. Ravanchi et al. reviewed the theoretical and practical aspects of catalysis for the selective hydrogenation of acetylene to ethylene and the potential ways to improve catalyst formulation [8]. Bos et al. investigated the kinetics of the acetylene hydrogenation on a commercial Pd catalyst in a Berty type reactor [9]. The considered reaction network consists of acetylene hydrogenation and ethylene hydrogenation reactions. They proposed different rate expressions and calculated the parameters of rates, based on the experimental data. The results showed that the classical Langmuir-Hinshelwood rate expressions could not fit the data well, when there is a small amount of carbon monoxide in the feed stream. Borodziński focused on the hydrogenation of acetylene and mixture of acetylene and ethylene on the palladium catalyst [10]. The results showed that two different active sites are detectable based on the palladium size. The results showed that, although acetylene and hydrogen are adsorbed on the small active site, ethylene did not adsorb, due to steric hindrance. In addition, all reactants were adsorbed on the large sites and butadiene as coke precursor was produced on that site. Zhang et al. investigated the performance of Pd-Al2O3 nano-catalyst in the acetylene hydrogenation [11]. The results showed that dispersing Ag as a promoter on the catalyst surface increases ethylene selectivity from 41% to 60% at 100 °C. Typically, adding Au to Pd-Al2O3 can tolerate carbon monoxide concentration swing, and improve the selectivity, and temperature resistant [12]. Schbib et al. investigated the kinetics of acetylene hydrogenation over Pd-Al2O3 in the presence of a large excess of ethylene in a laboratory flow reactor [13]. They claimed that C2H2 and C2H4 compounds are adsorbed on the same site and they react with the adsorbed hydrogen atoms to form C2H4, and C2H6, respectively. It appeared that the presence of a trace amount of silver on Pd-Al2O3 catalyst decreases the rate of ethylene hydrogenation as a side reaction [14]. Khan et al. studied adsorption and co-adsorption of ethylene, acetylene, and hydrogen on Pd-Ag, supported on α-Al2O3 catalyst by temperature programmed desorption [15]. The TPD (temperature programmed desorption) results showed that, although the presence of Ag on the catalyst suppresses overall hydrogenation activity, it increased the selectivity towards ethylene [16]. Pachulski et al. investigated the effect green oil formation and coke build-up has on the deactivation of Pd-Ag, supported on α-Al2O3 catalyst, applied in the C2-tail end-selective hydrogenation [17]. It was found that the catalyst contains low Ag to Pd ratio presents the highest long-term stability. The characterization results showed that the regenerated samples present the same stability. Currently, the use of non–toxic and inexpensive metals such as Fe, Ti, Cu or Zr, instead of Pd and Ag based commercial catalysts is an attractive topic. In this regard, Serrano et al, focused on the embedding FeIII on an MOF to prepare an efficient catalyst for the hydrogenation of acetylene under front–end conditions [18]. The experimental results showed that the prepared catalyst presents similar activity to Pd catalyst and could control acetylene concentration at the desired level.

1.2. Hydrogenation Method

The Front-End and Tailed-End are two common methods in acetylene hydrogenation, which differ in the reactor structure and process arrangements. In the Front-End method, the feed stream, which may contain up to 40% hydrogen, directly enters into the hydrogenation reactor and feeds temperature, is the only manipulated variable. Gobbo et al. modeled and optimized the Front-End acetylene hydrogenation process considering catalyst deactivation [19]. They calculated the dynamic optimal trajectory of feed temperature to control acetylene concentration at desired level. In the Tail-End method, hydrogen is separated from the effluent stream from steam cracker. In this method, the feed temperature and hydrogen concentration in the feed stream are manipulated variables. Aeowjaroenlap et al. modeled the Tailed-End hydrogenation reactors, based on the mass and energy balance equations at dynamic condition [20]. To obtain the optimum operating condition, a single objective dynamic optimization problem was formulated to maximize process economics. The inlet temperature and hydrogen concentration were selected as the decision variables. The results showed that applying optimal operation condition on the system increases process economics about 10%.

1.3. Reactor Arrangement

Typically, the acetylene hydrogenation process contains four catalytic beds, namely Lead and Guard Beds. The philosophy of guard bed is the sensitivity of downstream units to acetylene and the decreasing acetylene concentration to the desired level [21]. The coke build-up on the catalyst surface decreases activity and increases acetylene concentration in outlet stream from Guard bed gradually. In this regard, two beds are in operation, while two other beds are in standby or regeneration modes. Dehghani et al. modified the reaction-regeneration cycles and the reactor arrangement in the acetylene hydrogenation process to decrease energy consumption, and improve catalyst lifetime [22]. The feasibility of the proposed configuration was proved based on a theoretical framework.

1.4. Research Outlook

In this research, the reaction mechanism and kinetics of acetylene hydrogenation over the industrial Pd-Ag supported on α-Al2O3 is investigated in a lab-scale packed bed reactor, considering GHSV (gas hourly space velocity), hydrogen to acetylene ratio, pressure, and temperature as independent variables. The full factorial design of experiment method based on the cubic pattern is used to determine the number and condition of experiments. The fresh and deactivated catalysts are characterized by XRD, BET, SEM, TEM and DTG analyses. In addition, a detail reaction network is proposed and correspond kinetic model is developed based on the Langmuir-Hinshelwood-Hougen-Watson approach. Then, the Tail-End hydrogenation reactors in Jam Petrochemical Complex are modeled based on the mass and energy balance equations at dynamic conditions. Based on the developed model and available plant data, a decay model is proposed to predict catalyst activity. Then, the accuracy of the model is proved at steady and dynamic conditions.

2. Experimental Method

2.1. Catalyst Preparation

In this research, the performance of industrial Pd-Ag supported α-Al2O3 catalyst is investigated in a lab-scale reactor. The catalyst OleMax® 201 manufactured by SÜD-CHEMIE (Germany, Munich) is supplied from Jam Petrochemical Complex in Iran. It is a high performance, stable, and flexible catalyst to maximize olefins production through acetylene hydrogenation. Table 1 shows the specification of fresh catalyst.
The industrial catalyst is prepared by impregnation method and Pd and Ag are dispersed on the catalyst separately. Before tests, the catalyst is activated by removing water from the pores and subsequent reduction of palladium oxide on the support to palladium black. The removal of water is carried out by purging nitrogen through the reactor at 150 °C for 2 h. The reduction is conducted by hydrogen-diluted stream at 150 °C. After reduction, the catalyst is cooled to ambient temperature by the nitrogen purging.

2.2. Catalyst Characterization

The supplied catalyst is characterized by BET, TGA, XRD, SEM, and TEM analysis. BET analysis is used to measure the specific surface area and the pore size distribution of catalyst. The SEM test is used to analysis the surface and morphology of catalyst by scanning the surface with a focused beam of electron. TGA is a thermal method used to investigate the stability of a catalyst during heating. In this regard, the mass of the catalyst is measured over time during the heating. The XRD technique is an analytical tool used to determine the phase and dimension of crystalline material. In the present research, the SEM and TEM analyses were performed by using Philips XL 30 (FEI Company, Hillsboro, OR, USA) and FEI Tecnai G2 F20 (FEI Company, Hillsboro, OR, USA), respectively. The XRD pattern of the catalyst was recorded on a Rigaku D/Max-2500 (Rigaku, Austin, TX, USA) diffractometer at a scanning speed of 4 min−1 over the 2θ range of 10–80°. The TGA and DTA (differential thermal analysis) analysis of the fresh and deactivated catalysts were performed by Mettler Toledo Model 2007. The nitrogen adsorption and desorption tests were measured by Quanta chrome Autosorb at 70 K. The specific surface area of the catalyst was calculated by the Brunauer–Emmett–Teller equation. In addition, the Horvath and Kawazoe equation were used to calculate the pore size and volume of catalyst particles.
The supplied feed stream contains acetylene, ethylene, and ethane contaminated with a trace of propylene and methane. After regulation of the temperature and flow rate, feed stream enters to the reactor and passes over the ceramic ball and catalyst layers. The ceramic ball layer is considered to uniform distribution of feed along the catalytic bed. To detect the product distribution, the effluent is attached to the gas chromatography and product composition is measured on-line. Figure 1 shows the designed reactor to investigate kinetic of acetylene hydrogenation.

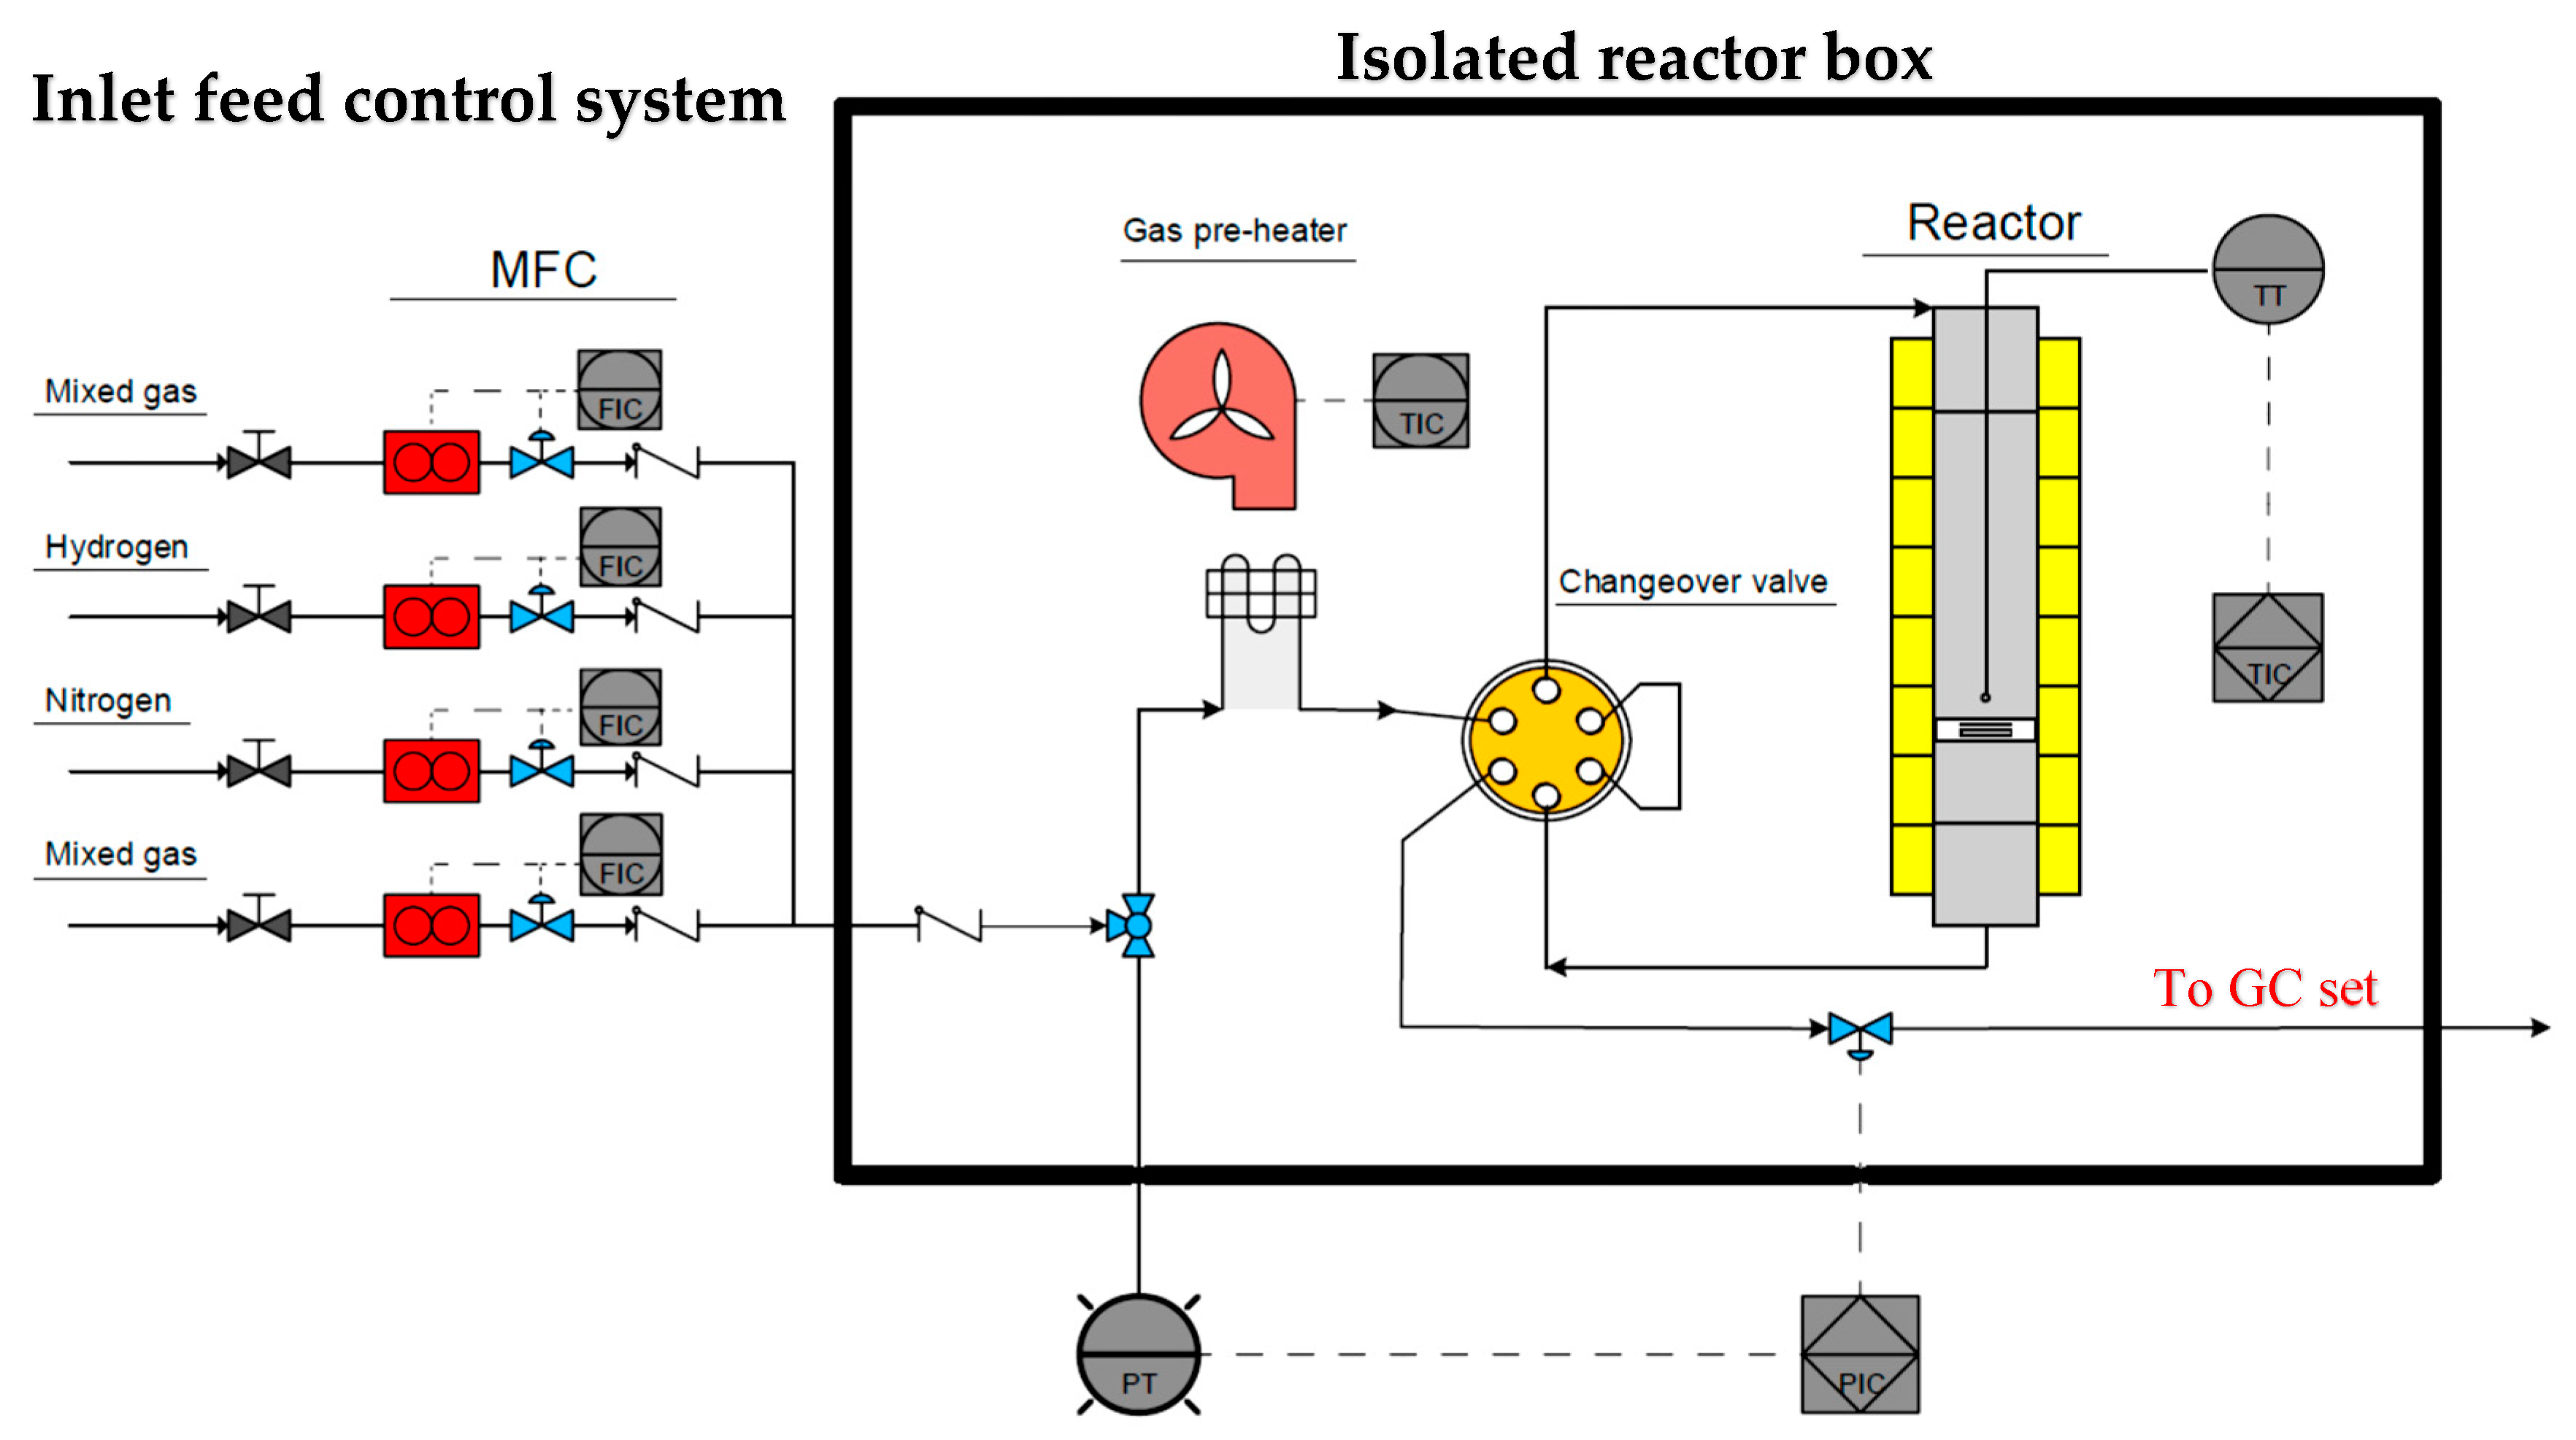
2.3. Experimental Apparatus

The designed reactor is a stainless steel cylindrical chamber with the inner diameter of 9 mm and the length of 300 mm. To control the reactor temperature, feed temperature, flow rate, and pressure, the setup was equipped by a jacket heater, heating blower, MFC model F-231M, made by Bronkhoest, pressure sensor model DP2-21 and backpressure regulator 1315G2Y, made by Hoke (prentice HALL, Upper Saddle River, NJ, USA), respectively. In the designed tests, the feed stream was supplied from industrial acetylene hydrogenation unit in Jam Petrochemical Complex. Table 2 shows the composition of the feed stream in the acetylene hydrogenation unit of Jam Petrochemical Complex.

3. Kinetic Modeling

3.1. Experiment Design

During the past decade, several designs of experimental approaches have been developed to reduce the numbers of experiments [23]. In the current research, the factorial design method, based on the cubic pattern, is used to determine the experiments. In statistics, the full factorial is an experimental design method, whose design consists of two or more factors, each with discrete possible levels. In the first step, the effective parameters, ranges, and levels are selected to cover a wide range of operating condition. The considered independent variables are temperature, pressure, hydrogen to acetylene ratio, and GHSV. The fraction of products in the outlet stream is selected as the objective function. Table 3 shows the variation range and the number of data points. Considering full factorial design method, 216 independent experiments are designed.

3.2. Reaction Mechanism

In this research, acetylene conversion to ethylene, ethane, butenes, and butadiene are considered as independent reactions in the considered network. Typically, the ethylene and acetylene could be adsorbed on the catalyst surface as:
C 2 H 2 Adsorbed   as { C H = C H d i σ Adsorbed C H C H π Complex C H C H 3 Ehthylidene C H = C H 2 Vinyl C C H 3 Ethylidene = C = C H 2 Vinylidene }
C 2 H 4 Adsorbed   as { C H 2 C H 2 d i σ Adsorbed C H 2 = C H 2 π Complex C H C H 3 Ehthylidene C H = C H 2 Vinyl C C H 3 Ethylidene }
Based on the density functional theory, selective acetylene hydrogenation to ethylene considering vinyl layer as the intermediate is the most dominant mechanism [24]. Based on the considered reaction mechanism, hydrogen is adsorbed on the catalyst surface as:
H 2 + 2   S 2 H S
In addition, acetylene is adsorbed on the surface and reacts with adsorbed hydrogen to produce ethylene:
C 2 H 2 ( g ) + S + H H C H 2   C H S + H C H 2 C H 2 ( g ) + s
In addition, ethylene in the gas phase is adsorbed on the surface and reacts with adsorbed hydrogen in two steps to produce ethane as:
H 2 C H 2   ( g ) + S C H 2 C H 2 S + H S C H 3 C H 2 S + S
C H 3 C H 2 S + H S C H 3 C H 3 ( g ) + 2 S
In general, there are two possible pathways to produce butadiene. According to the first path:
C H C H ( g ) + S C H 2   C H S + H H   C H 3   C H S
H C H ( g ) + S C H 2   C S
C H 3   C H S + C H 2   C S C H 2 C H   C H C H 2 ( g )
According to the second path:
C 2 H 2 ( g ) + S + H H C H 2   C H S
C 2 H 2 ( g ) + S + H H C ˘ H 2   C H S
C H 2   C H S + C ˘ H 2   C H S C H 2 C H C H C H 2 ( g ) + 2   S
Typically, 1,3-butadiene could be found in two different states, including in the gas phase and on the solid surface. In the first state, butadiene is detected in the outlet stream from the reactor, while the second state is a complex state that causes oligomer production. The produced oligomer is precipitated on the catalyst surface and leads to deactivation of the catalyst by blocking active sites [17,25]. Thus, to investigate butadiene and oligomer formation, the outlet gas stream from the reactor is analyzed by GC-mass and PIONA. The results of GC-mass has been presented in the Supplementary Materials (Data Set 3). The mechanism of 1-butene formation on the catalyst surface is:
C 2 H 2 ( g ) + S + H H C H 2   C H S + H H C H 3   C H S + C H 2   C H S C H 2 C H C H 2 C H 3 ( g )
In addition, the mechanism of cis-2-butane and trans-2-butane formation is as:
C 2 H 2 ( g ) + S + H H C H 2   C H S   + H H H 3   C H S + C H 3   C H S C H 3 C H C H C H 3 ( g )

3.3. Kinetic Model

In this section, based on the considered mechanism, a reaction network comprising six reactions is selected. The considered reactions are as follows:
C 2 H 2 + H 2 C 2 H 4
C 2 H 4 + H 2 C 2 H 6
2   C 2 H 2 + H 2 C 4 H 6
2   C 2 H 2 + 2 H 2 Cis C 4 H 8
2   C 2 H 2 + 2 H 2 Trans C 4 H 8
2   C 2 H 2 + 2 H 2 2 C 4 H 8
To simplify the acetylene hydrogenation to 1-butene, cis-2-butene and trans-2-butene reactions are lumped to acetylene hydrogenation to butene group. Based on the considered reaction network and Langmuir-Hinshelwood-Hougen-Watson mechanism, a detail kinetic model is proposed to predict the rate of reactions and the coefficients of the considered model are calculated based on experimental data [26]. The considered rate of reactions is as follows:
r i = k i P j n ( 1 + K j P j ) m

3.4. Deactivation Model

In general, the five intrinsic mechanisms of catalyst decay are poisoning, fouling, thermal degradation, chemical degradation, and mechanical failure [27]. Poisoning and thermal degradation are generally slow and irreversible, while fouling by coke and carbon is rapid and reversible. Generally, one of the main challenges in the acetylene hydrogenation process is catalyst deactivation, by coking and increasing acetylene concentration in the product stream. Typically butene and butadiene, as side products in acetylene hydrogenation, has led to oligomer and green oil formation on the catalyst surface [28]. The adsorbed acetylene and produced 1,3-butadiene react on the catalyst surface and green oil is produced. The deposited oligomers and green oil on the catalyst gradually reduce the catalyst activation during the process run-time [29]. The proposed correlations in the literature, that predict catalyst activity lack accuracy, so applying these activity equations in the model results in a notable error between simulation results and plant data. In this research, a power low decay model, modified by feed concentration, to account for coke formation, is proposed to calculate the catalyst activity. The considered deactivation model is as follows:
d a d t = k d e ( E d R T ) × a n × C m
The proposed decay model is applied in the dynamic model and the available plant data are used to calculate the activity parameters, considering the absolute difference between plant data and simulation results as the objective function.

4. Process Modeling

In this section, the industrial two-stage acetylene hydrogenation processes are modeled on the mass and energy balance equation at pseudo-steady state conditions. The adopted assumptions in the considered model are:
  • Pseudo-steady state condition;
  • the plug flow pattern in the reactor;
  • negligible concentration and temperature gradients in the catalyst particle;
  • negligible radial mass and energy diffusion;
  • negligible mass and heat transfer in the longitudinal direction; and
  • adiabatic conditions.
The gas is at non-ideal condition and Redlich-Kwong equation of state is considered to predict gas phase property due to high pressure and low temperature conditions. The mass, energy and moment balance equations in the bed could be explained as follows:
d n A d z = a i N ν i r i ρ B A
d T d z = A ρ B n t . C p i M r j × ( Δ H j )
d P d z = 150 μ V ( 1 ε ) 2 φ 2 D p 2 ε 3 + 1.75 ρ V 2 ( 1 ε ) φ D p ε 3
Combining balance equations, kinetic model, auxiliary equations to predict physical and chemical properties, and activity models result in a set of algebraic and partial differential equations. In the developed model, the mass and energy balance equations are written at a steady state condition, while the activity equation is a dynamic model.

5. Optimization Problem

In this research, to calculate the coefficients of the proposed kinetic and activity models, an optimization problem was formulated to minimize the absolute difference of model results with experimental data. The Genetic Algorithm is a powerful method in global optimization and has been selected to handle formulated optimization problems and obtain the coefficients of kinetic and activity models. Genetic algorithms are the most popular evolutionary algorithm, that is inspired by natural selection of the fittest populations to reproduce and move to the next generation [30]. In each generation the fittest population are attained by three operators, consist of selection, crossover and mutation. In the kinetic section, the reaction rate is calculated numerically and the absolute difference between calculated reaction rate by the model and measured rates are minimized. The considered objective function is as:
A M R E = 1 N i = 1 i = N | y e x p ( i ) y m o d e l ( i ) | y e x p ( i ) × 100
To calculate the coefficients of the considered activity model, the outlet acetylene concentration from guard and lead beds is measured and compared with the calculated acetylene concentration by the model. The considered data consists of 48 data point during the process run time.

6. Results and Discussions

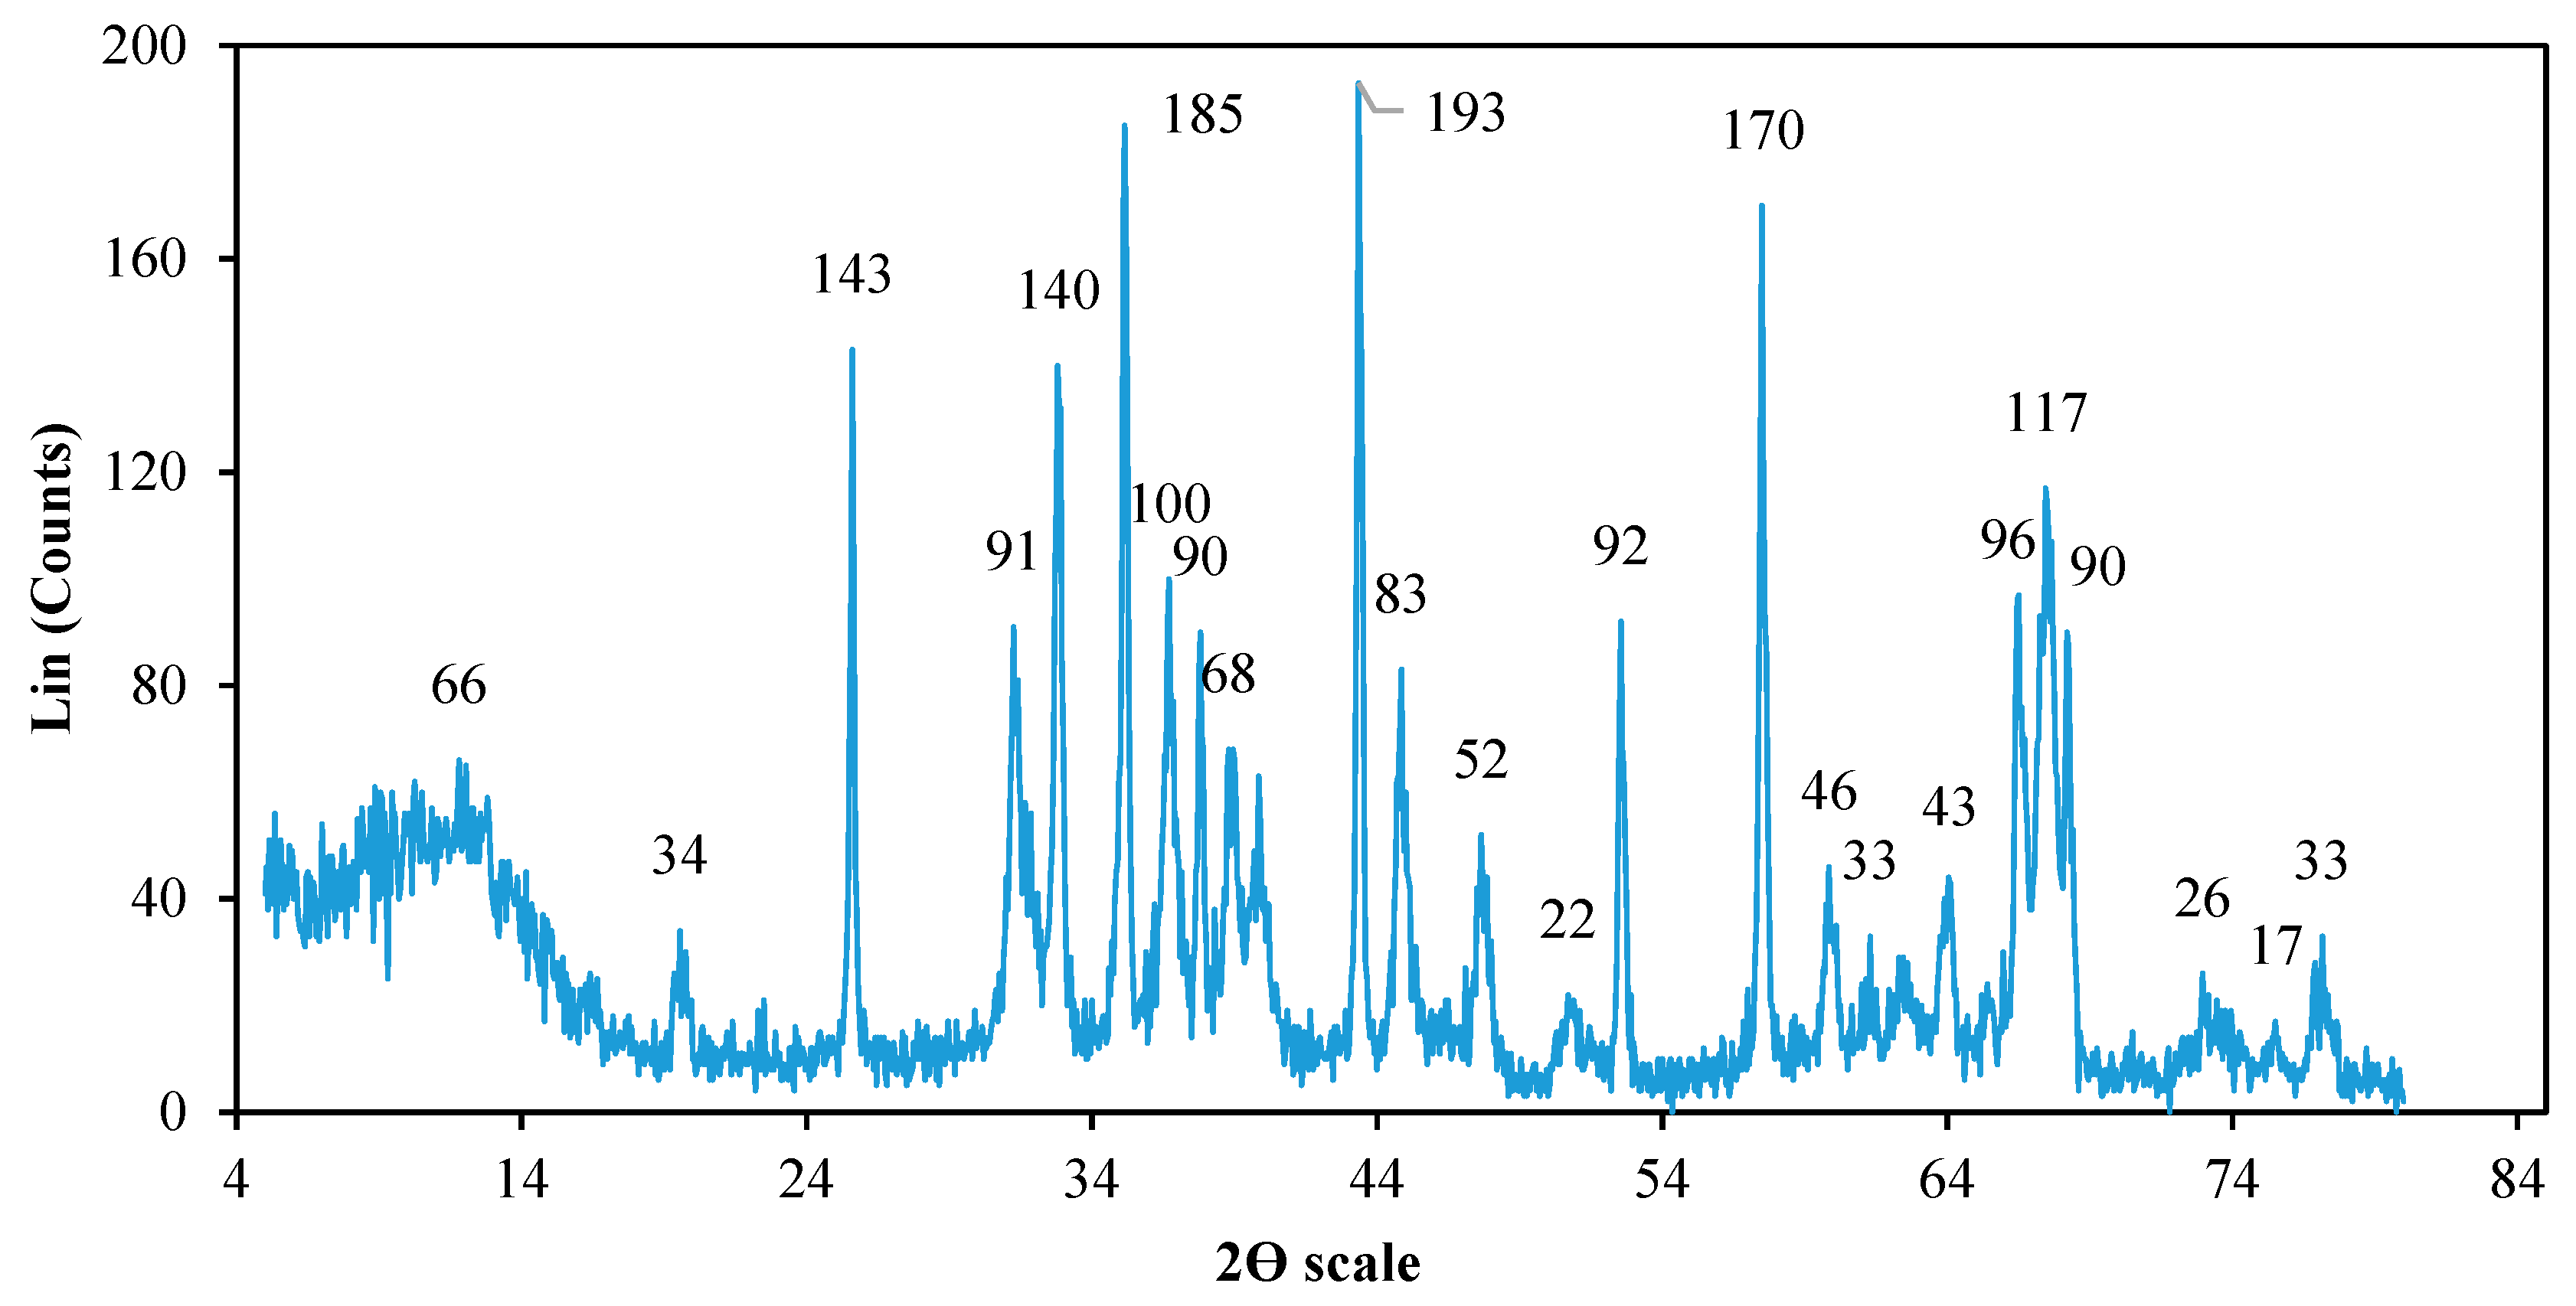
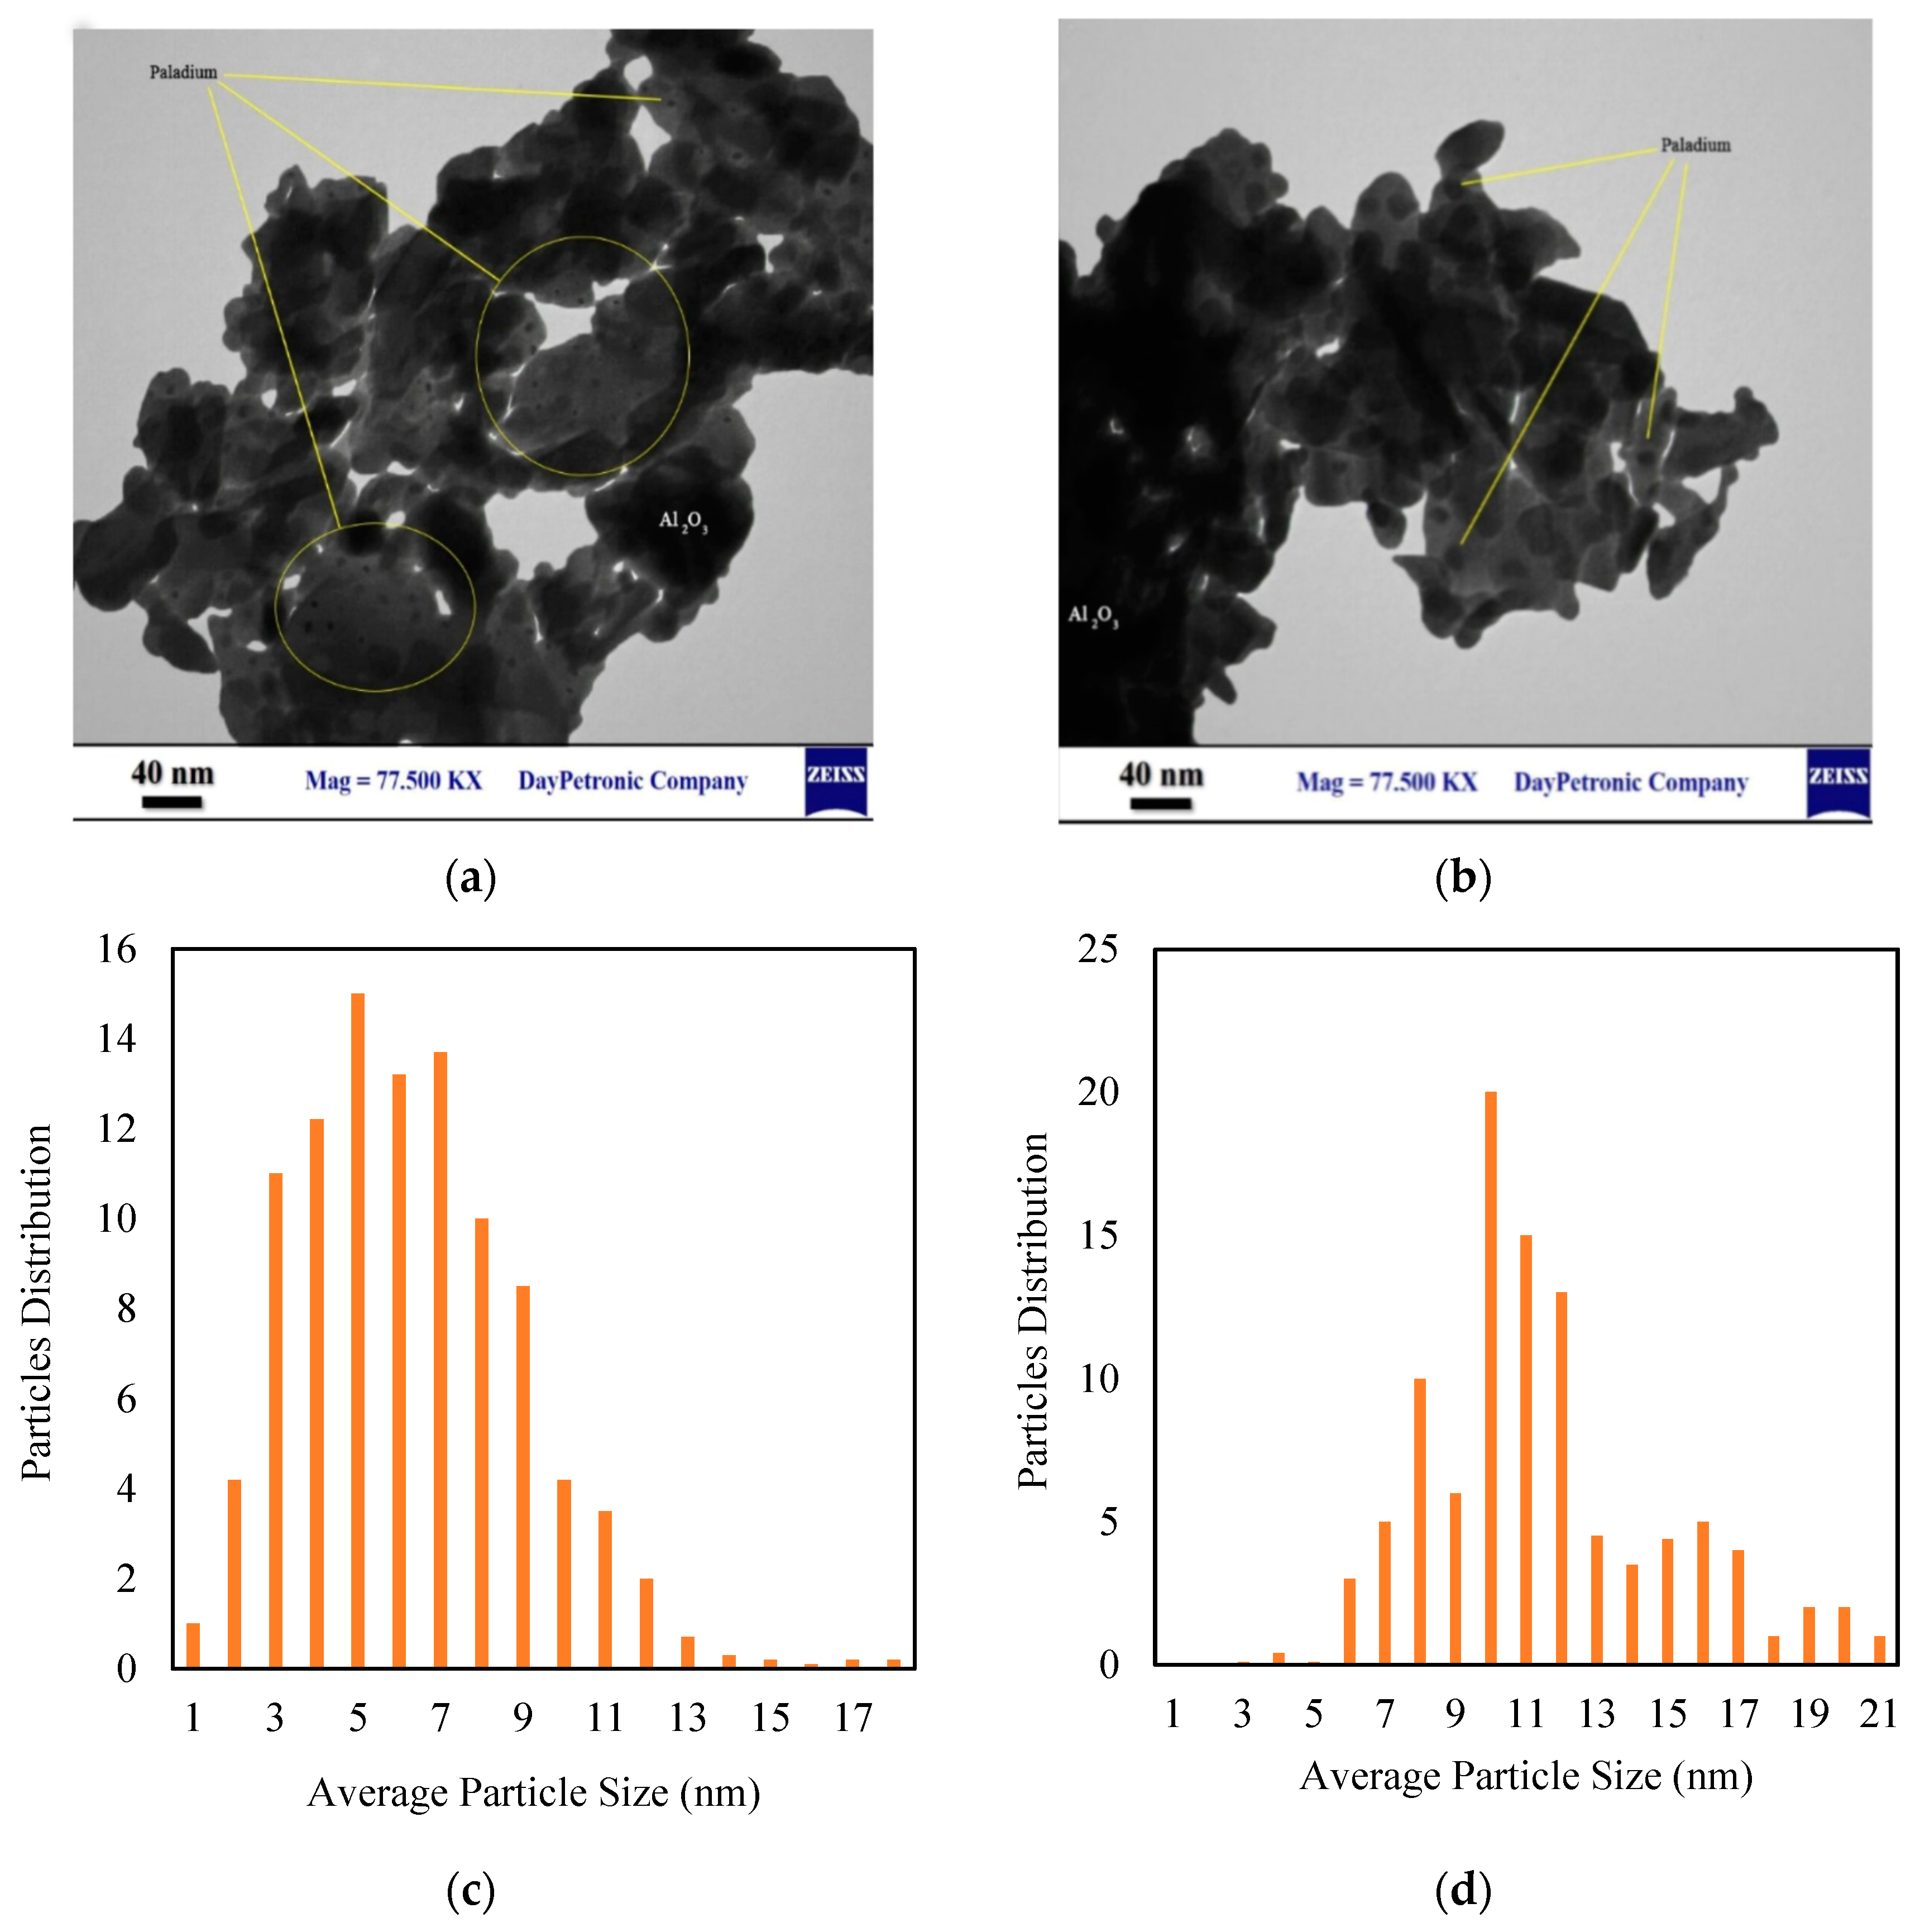
6.1. Catalyst Characteristics

In this section, the results of SEM, TEM, DTG-TGA, XRD, and BET of fresh and spent catalysts, are presented. It is mentioned that a used catalyst in the plant is named spent catalyst. As mentioned, to investigate the surface morphology, the BET analysis is performed on the fresh and spent catalysts. Table 4 shows the BET results of fresh and spent catalysts. The obtained results reveal that BET surface area of fresh and spent catalysts are 24.75, and 30.11 m2g−1, respectively. In addition, the mean pore diameter of fresh and deactivated catalysts are 235.5, and 191.2 Å, respectively. It concludes that, from BET analysis, there is coke build-up on the internal pores and pore blockage by coke decrease mean pore diameter. In addition, coke build-up on the external surface of the catalyst and increases surface area. Figure 2 shows the results of nitrogen adsorption and desorption on the fresh catalyst.
It appears that increasing pressure increases the nitrogen adsorption on the catalyst surface and adsorption pattern, in accordance with the Isotherm Type III. This could be applied on systems in which the interaction between adsorbate molecules is stronger than that between adsorbate and adsorbent. Based on the Isotherm Type III, the uptake of gas molecules is initially slow, and until surface coverage is sufficient, so that the interactions between adsorbed and free molecules begins to dominate the process.
Typically, the XRD analysis is used to identify the crystalline morphology and dimensions of support. Figure 3 shows the XRD results of the fresh catalyst. The broad peak means poor crystalline morphology and the sharp ones indicate a well-crystallized sample. Based on the XRD analysis, the peak is at 32.75°, which proves the presence of Ag2O particles on the support surface, while peaks at 36.7°, 63.98°, and 67.46° show Ag conversion to AgO. In addition, the peaks at 38.9° and 66.2° show the dispersion of Pd on the catalyst surface. Based on these XRD results, the Al2O3 mean crystal size is 24.5 nm.
Figure 4 shows the SEM images of fresh and spent catalysts. The results of SEM images reveal that the bright trace of palladium metal, in fresh catalyst, changes in the dark in the spent catalyst. The darkening of catalyst proves the formation of polymeric compounds and coke build-up on the catalyst surface, which reduces the activity of the catalysts especially. Indeed the surface of the fresh catalyst is completely covered by coke. It concludes from SEM and BET tests that coke build-up on the external surface of the catalyst increases the surface area.
In addition, Figure 5a,b presents TEM image and particle size distribution of fresh and spent catalysts. The results show that palladium particles experience an agglomeration during the reaction run time and mean particle size (c), (d) approaches from 6.2 nm to 11.5 nm. Increasing size of palladium particles, during the run-time, reduces the active sites and results in lower catalyst activity.
Figure 6a,b shows the TGA and DTG results of fresh, spent and regenerated catalysts. Generally, the fresh and regenerated catalysts do not experience weight loss during the TGA test. However, the oxidation of Pd and Ag atoms to PdO and AgO, increases catalyst weight by about 0.6%. The TGA results of deactivated catalysts shows that, increasing the temperature up to 500 °C decreases sample weight gradually and after that, catalysts do not experience weight loss. Typically, coke burning during the TGA analysis is the main reason for the decreased catalyst weight. In addition, it is concluded that the coke is completely burned through catalyst heating up to 500 °C. The two minimum points at 310 and 515 °C on the DTG curve of spent catalyst proves the presence of two different coke types on the catalyst surface. The produced amorphous coke on the external surface of catalyst burns in temperature range of 300 to 400 °C, while the crystalline coke and produced coke in the pores burn in range of 450 to 650 °C.

6.2. Results of Kinetic Model

As previously mentioned, 216 experiments have been designed to find the effect of parameters on the acetylene conversion and product distribution. The list of experiments and results have been tabulated in Supplementary Data Set 1. In this section, the effect of GHSV, temperature, pressure, and hydrogen to acetylene ratio on acetylene conversion, ethylene selectivity, and product distribution is presented.

6.2.1. Effect of GHSV

Figure 7a,b shows the effect of gas hourly space velocity on acetylene conversion, ethylene selectivity, and product distribution. The GHSV is the ratio of gas flow rate in standard condition to the volume of catalyst in the bed. Although increasing GHSV reduces residence time in the reactor, it decreases mass transfer resistance in the bed. The experiments show that increasing GHSV results in higher ethylene selectivity and lower acetylene conversion. Although butene group and 1,3-butadiene could be detected in the outlet stream from the reactor, 1-butene is the dominant side product. It appears that GHSV has a considerable effect on the 1-butene formation and increasing GHSV from 2500 to 6200 decreases 1-butene mole fraction from 0.02 to 0.002. It is concluded that increasing the GHSV led to a reduction in residence time and consequently enhances the risk of leaving unreacted acetylene from the reactor.

6.2.2. Effect of Pressure

Typically, pressure is one of the most effective parameters influencing acetylene conversion and ethylene selectivity. In detail, the pressure could change, both the adsorption coefficients of catalysts and the partial pressure of the participated components on the catalyst. Figure 8a,b shows the effect of operating pressure on acetylene conversion, ethylene selectivity, and product distribution. Based on the experiments, although increasing pressure improves acetylene conversion, selectivity decreases sharply in pressure range 15–18 bar and after that decreases gradually. Typically, pressure increases the diffusivity and adsorption of components in the surface of the catalyst and results in a higher conversion factor. It appears that the main side product is 1-butane and increasing operating pressure increases the rate of side products in the system.

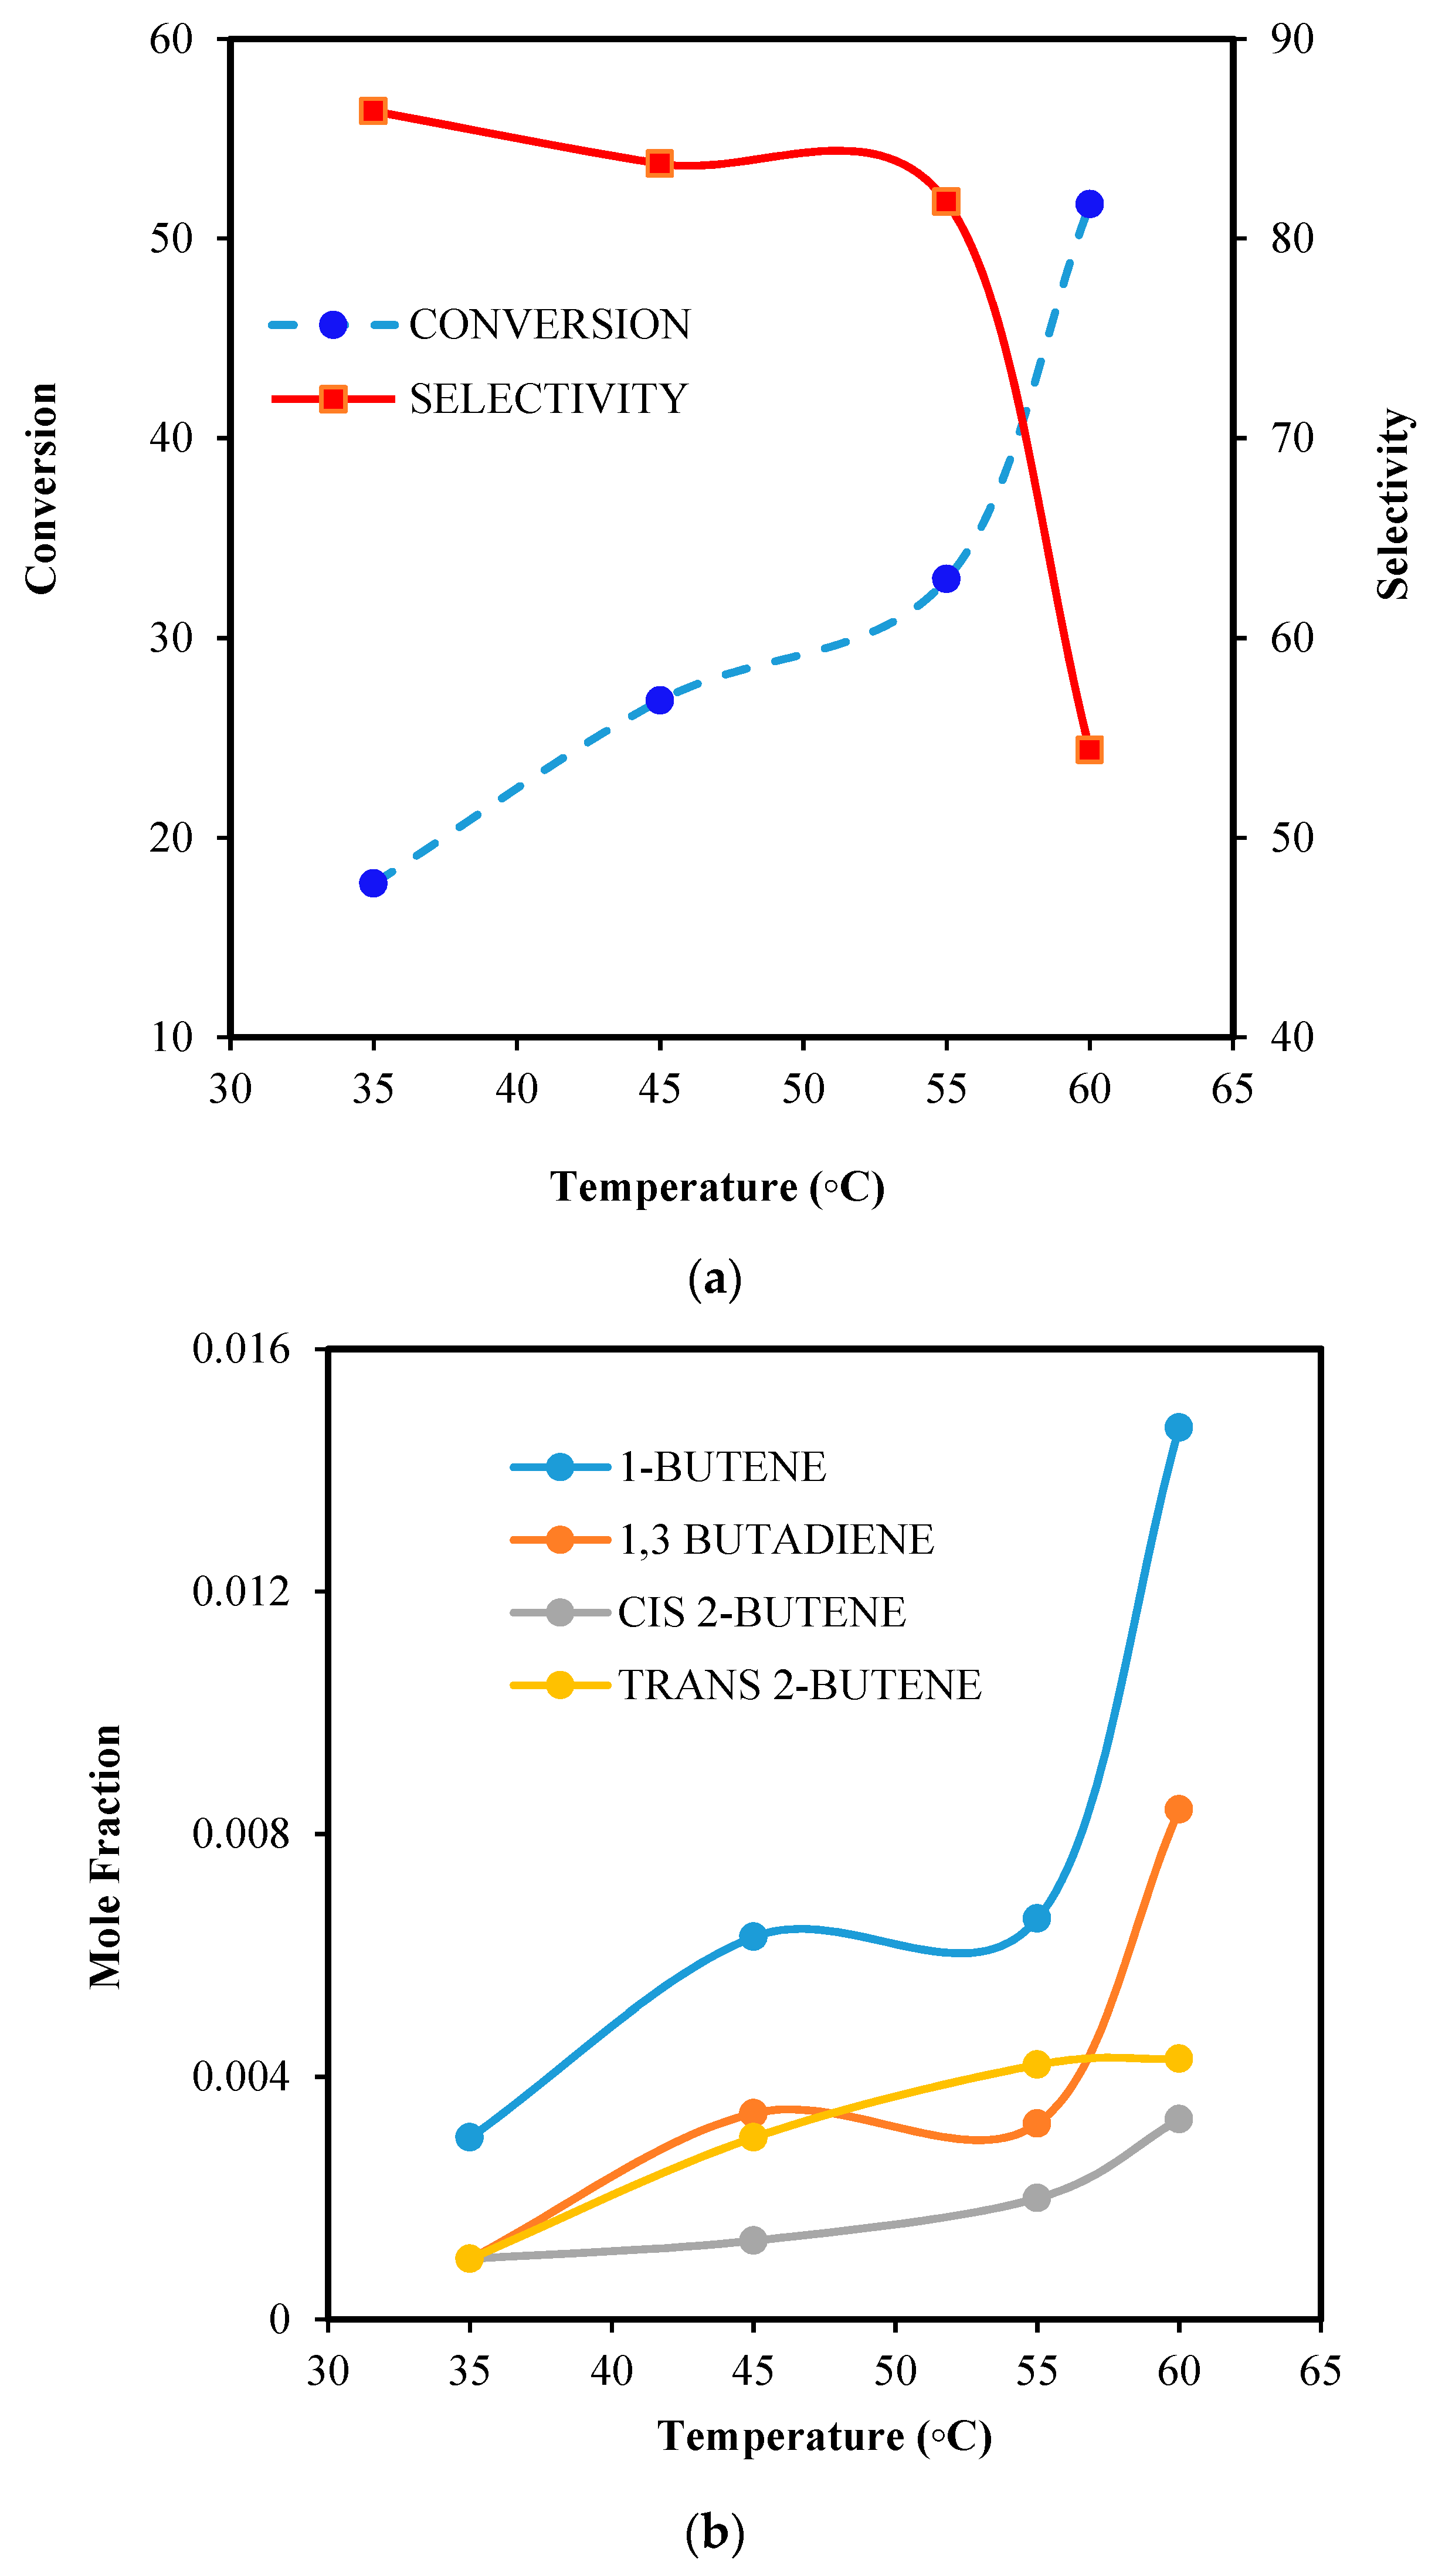
6.2.3. Effect of Temperature

Typically, temperature is the most important parameter and has a direct effect on the selectivity and conversion. Increasing the temperature improves the reaction rate and shifts the reversible exothermic reactions toward lower equilibrium conversion. Figure 9a,b shows the effect of operating temperature on acetylene conversion, ethylene selectivity, and product distribution. Although applying higher temperature increases the rate of acetylene conversion as the main reaction, it increases rate of side reactions. Typically, applying high temperatures on the system has a considerable effect on the side reactions, so butene and butadiene formation increase sharply. Since the increasing temperature decreases selectivity, the effect of operating temperature on side reactions is more significant compared to the main reaction.

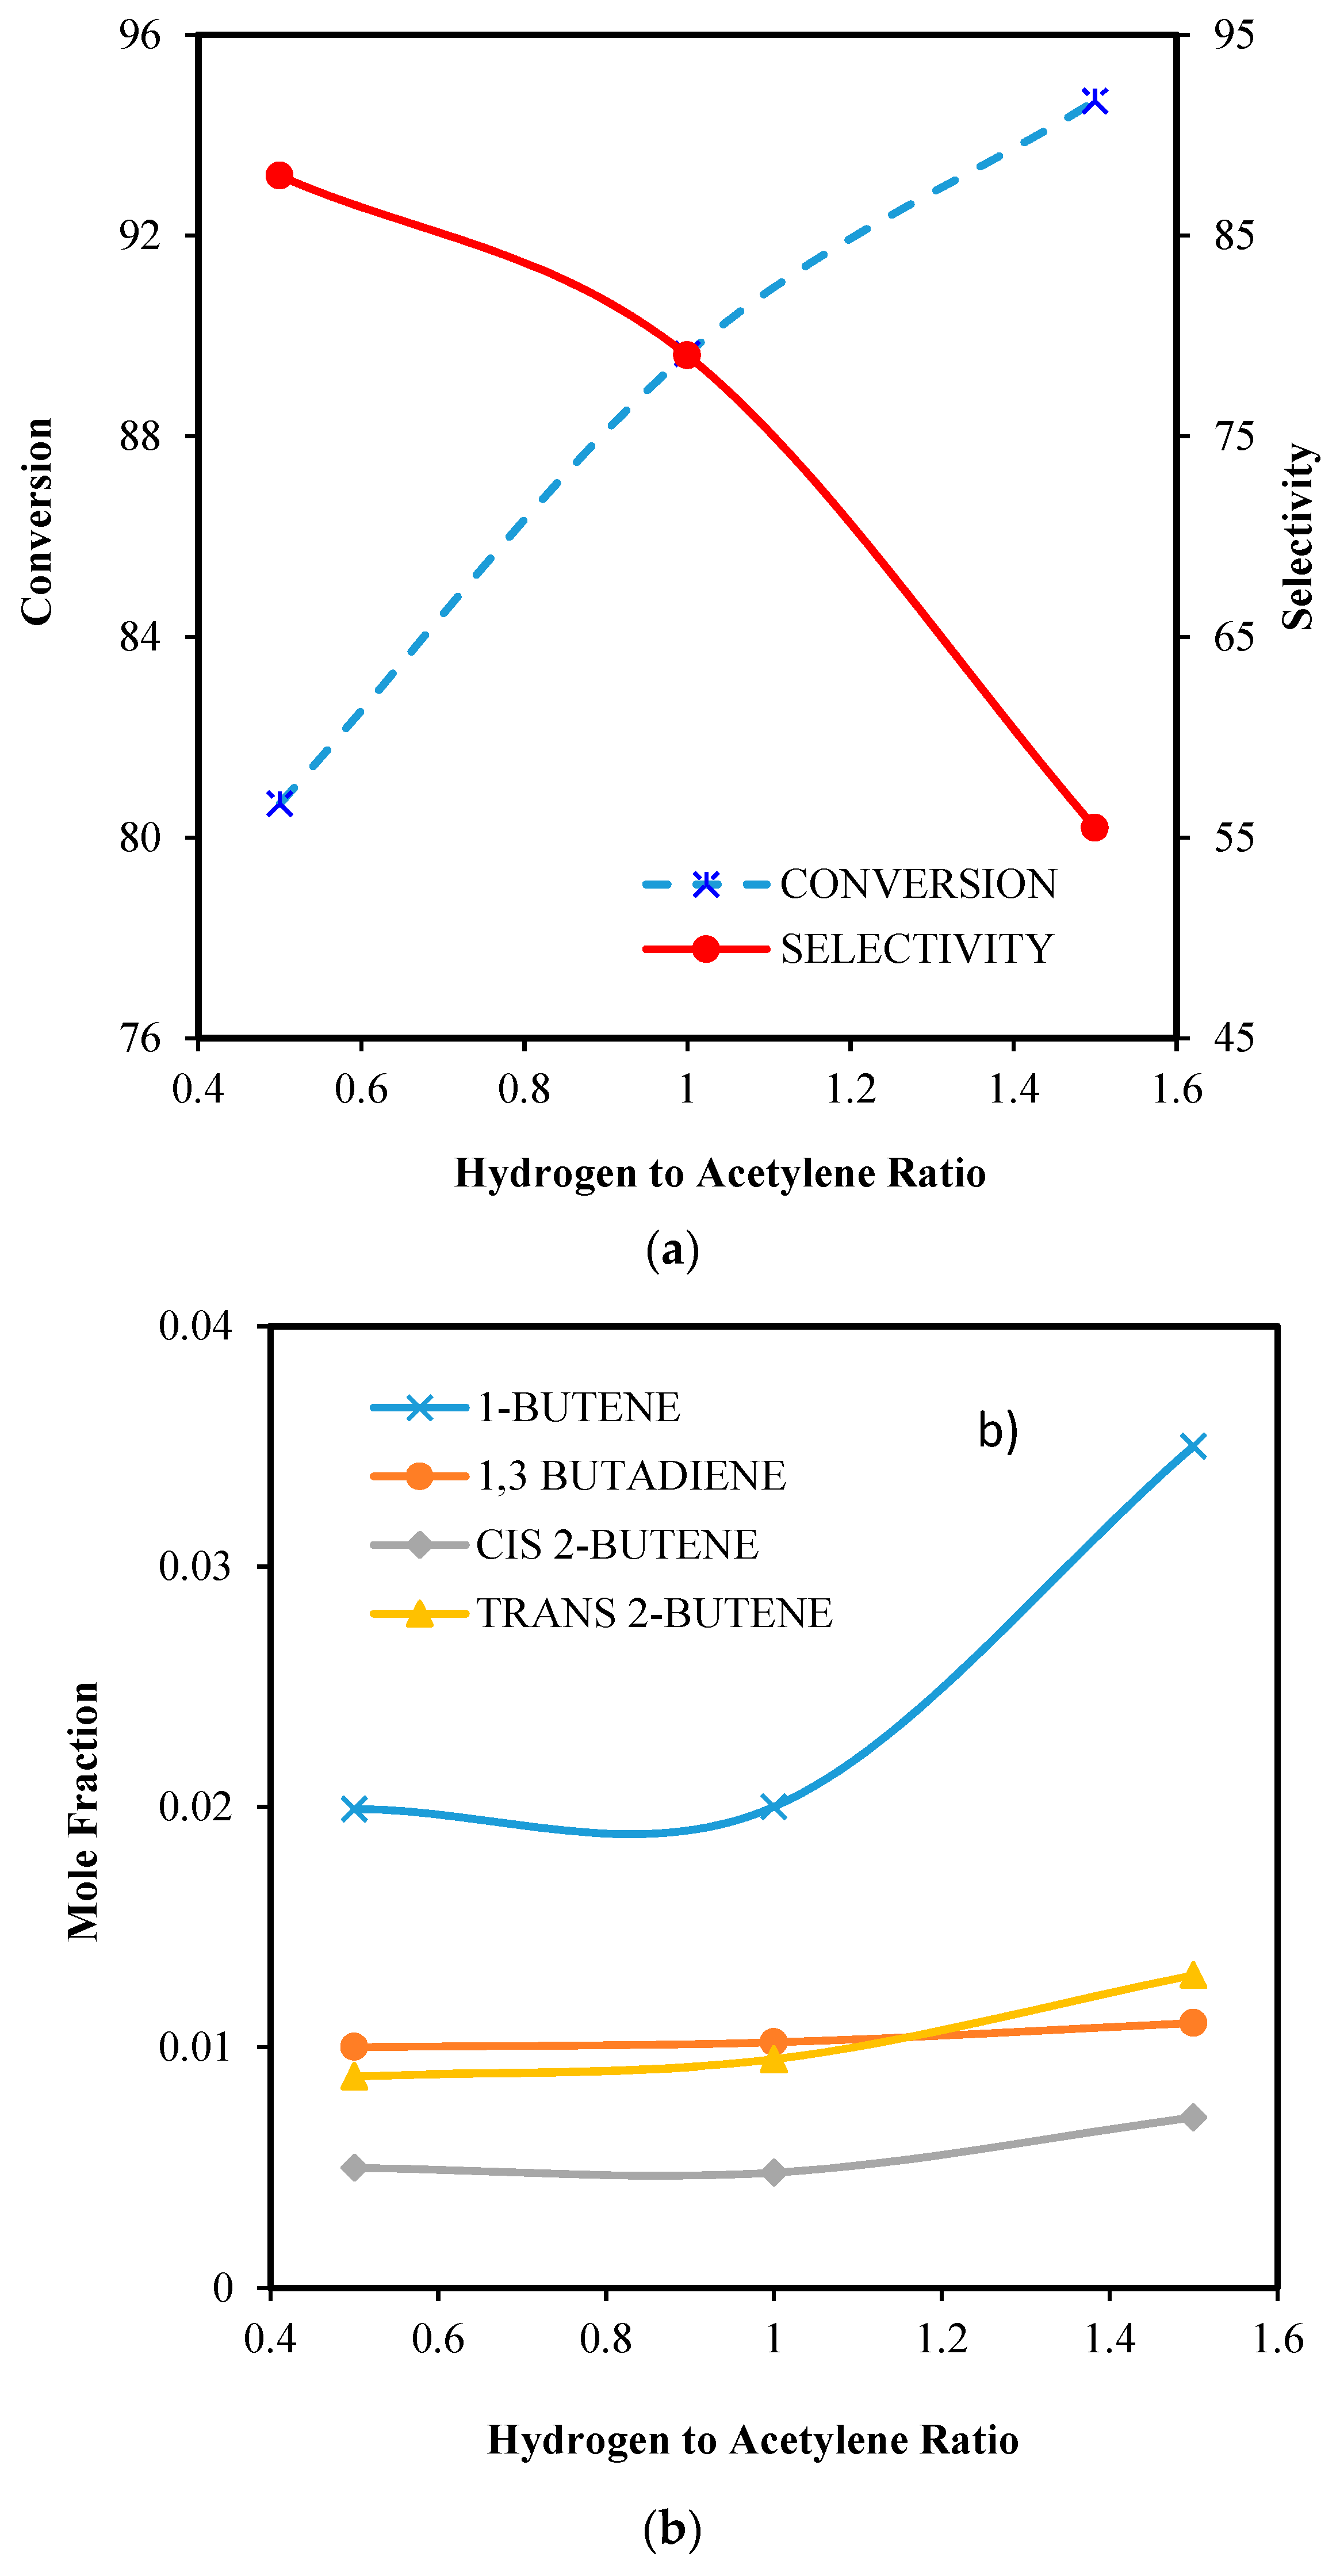
6.2.4. Effect of Hydrogen to Acetylene Ratio

In general, the presence of excess hydrogen in the reactor, reduces coke build-up on the catalyst, and consequently retards the deactivation of catalysts in the hydrogenation process. Figure 10a,b shows the effect of hydrogen to acetylene ratio on acetylene conversion, ethylene selectivity, and product distribution. Increasing hydrogen concentration in the reactor increases the rate of hydrogenation reactions and results in higher acetylene conversion. Although increasing the hydrogen to acetylene ratio enhances the rate of acetylene hydrogenation, it shifts the ethylene hydrogenation toward higher conversion and decreases process selectivity. It appears that applying hydrogen rich stream increases 1-butene concentration in the reactor.

6.2.5. Developed Kinetic and Decay Models

In this section, the proposed kinetic model, which predict the rate of reactions, is presented. In this regard, an optimization problem is formulated and the coefficient of proposed rate equations are determined by considering the absolute difference between experimental data and estimated rate as the objective function. Table 5 shows the reactions and proposed kinetic equations to calculate the reaction rate.
Where
K C 2 H 2 = 2.128 × e 2983.8 R T
K C 2 H 4 = 0.7295 × e 3621 R T
The coefficient of the proposed deactivation model is calculated based on the integration of process model and developed the kinetic model. The proposed activity model is inserted in the developed dynamic model of the acetylene hydrogenation process. Then, an optimization problem is formulated to calculate the parameters of the proposed activity model, Kd, Ed, and n, considering the sum of absolute difference between plant data and simulation results, during a process run-time as the objective function. The industrial data points have been presented in the Supplementary Data Set 2. In addition, the composition of green oil as a deactivation agent is presented in the Supplementary Data Set 3. The obtained deactivation model could be explained as:
d a d t = 0.21   e ( 9504.4 R T ) × a 2.4 × C 0.13

6.3. Results of Process Simulation

In this section, the simulation result presents the accuracy of the developed model and the assumptions are proved at the dynamic condition. Then an optimization problem is formulated and the optimal operating condition of the process is determined to increase process run time.

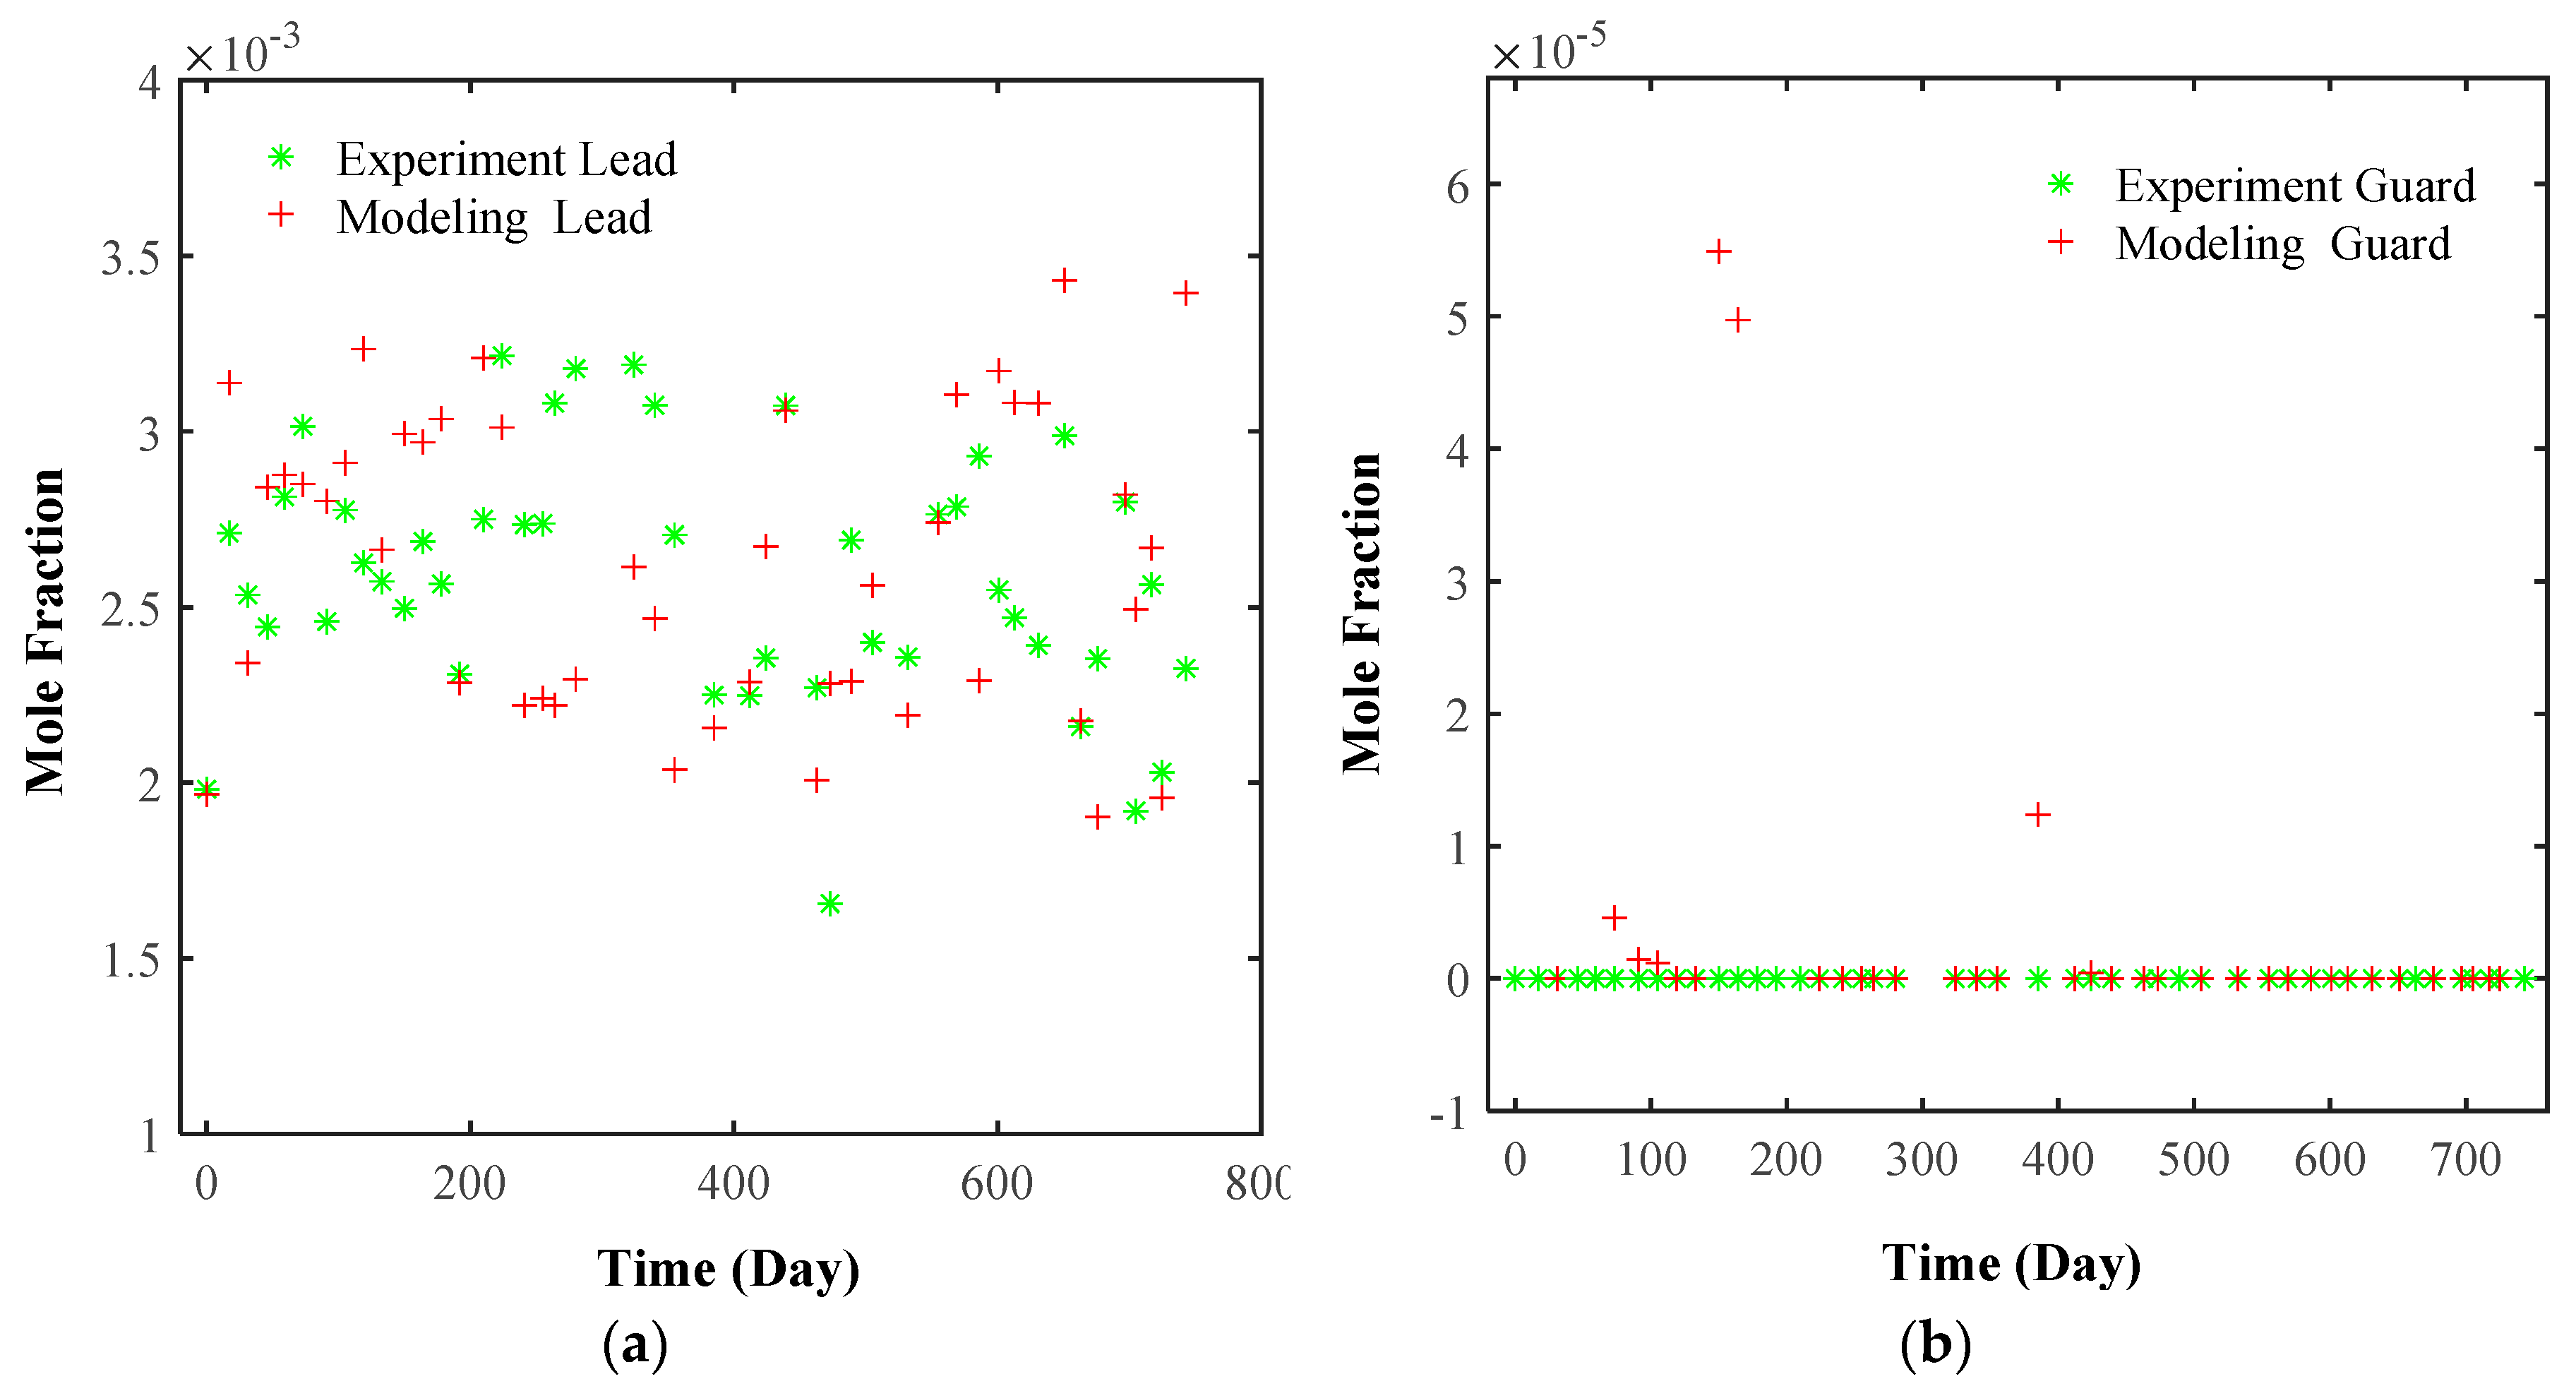
6.3.1. Model Validation

In this research, two different methods are utilized to investigate the accuracy of the developed kinetic model [31]. Thermodynamically, the comparison adsorption constants of compartments and the thermo-dynamic value, present a quality base criterion to investigate validity of kinetic equation. In this regard, combining the entropy concept with gas universal constant provide a procedure for finding the thermodynamic compatibility. In detail, if the overall entropy of the gaseous state of components is higher than the entropy of adsorbed components, the thermo-dynamic compatibility is reached. In more detail, according to this concept, if the kinematic constants match the following equations, it is possible to claim the thermodynamic compatibility:
Δ a d s S i . j 0 = S a d s . i . j 0 S g . i 0 < 0
e x p Δ a d s S i . j 0 R = K j . i
| Δ a d s S i . j 0 | < S g . i 0
| Δ a d s S i . j 0 | > R . ln ϑ i ϑ c r . i 41.8   J / ( m o l . K )
Δ a d s S i . j 0 < 51 J m o l . K + 0.00141 K × Δ a d s H i . j
In addition, to prove the validity of the developed model, the simulation results are compared with the real plant data at the dynamic condition. Figure 11a,b shows the comparison between outlet acetylene concentration from guard bed and calculated concentration by the model. The mean absolute error of the model and plant data is below 3.0%. Thus, the proposed model is a practical tool in predicting the performance of a hydrogenation process.

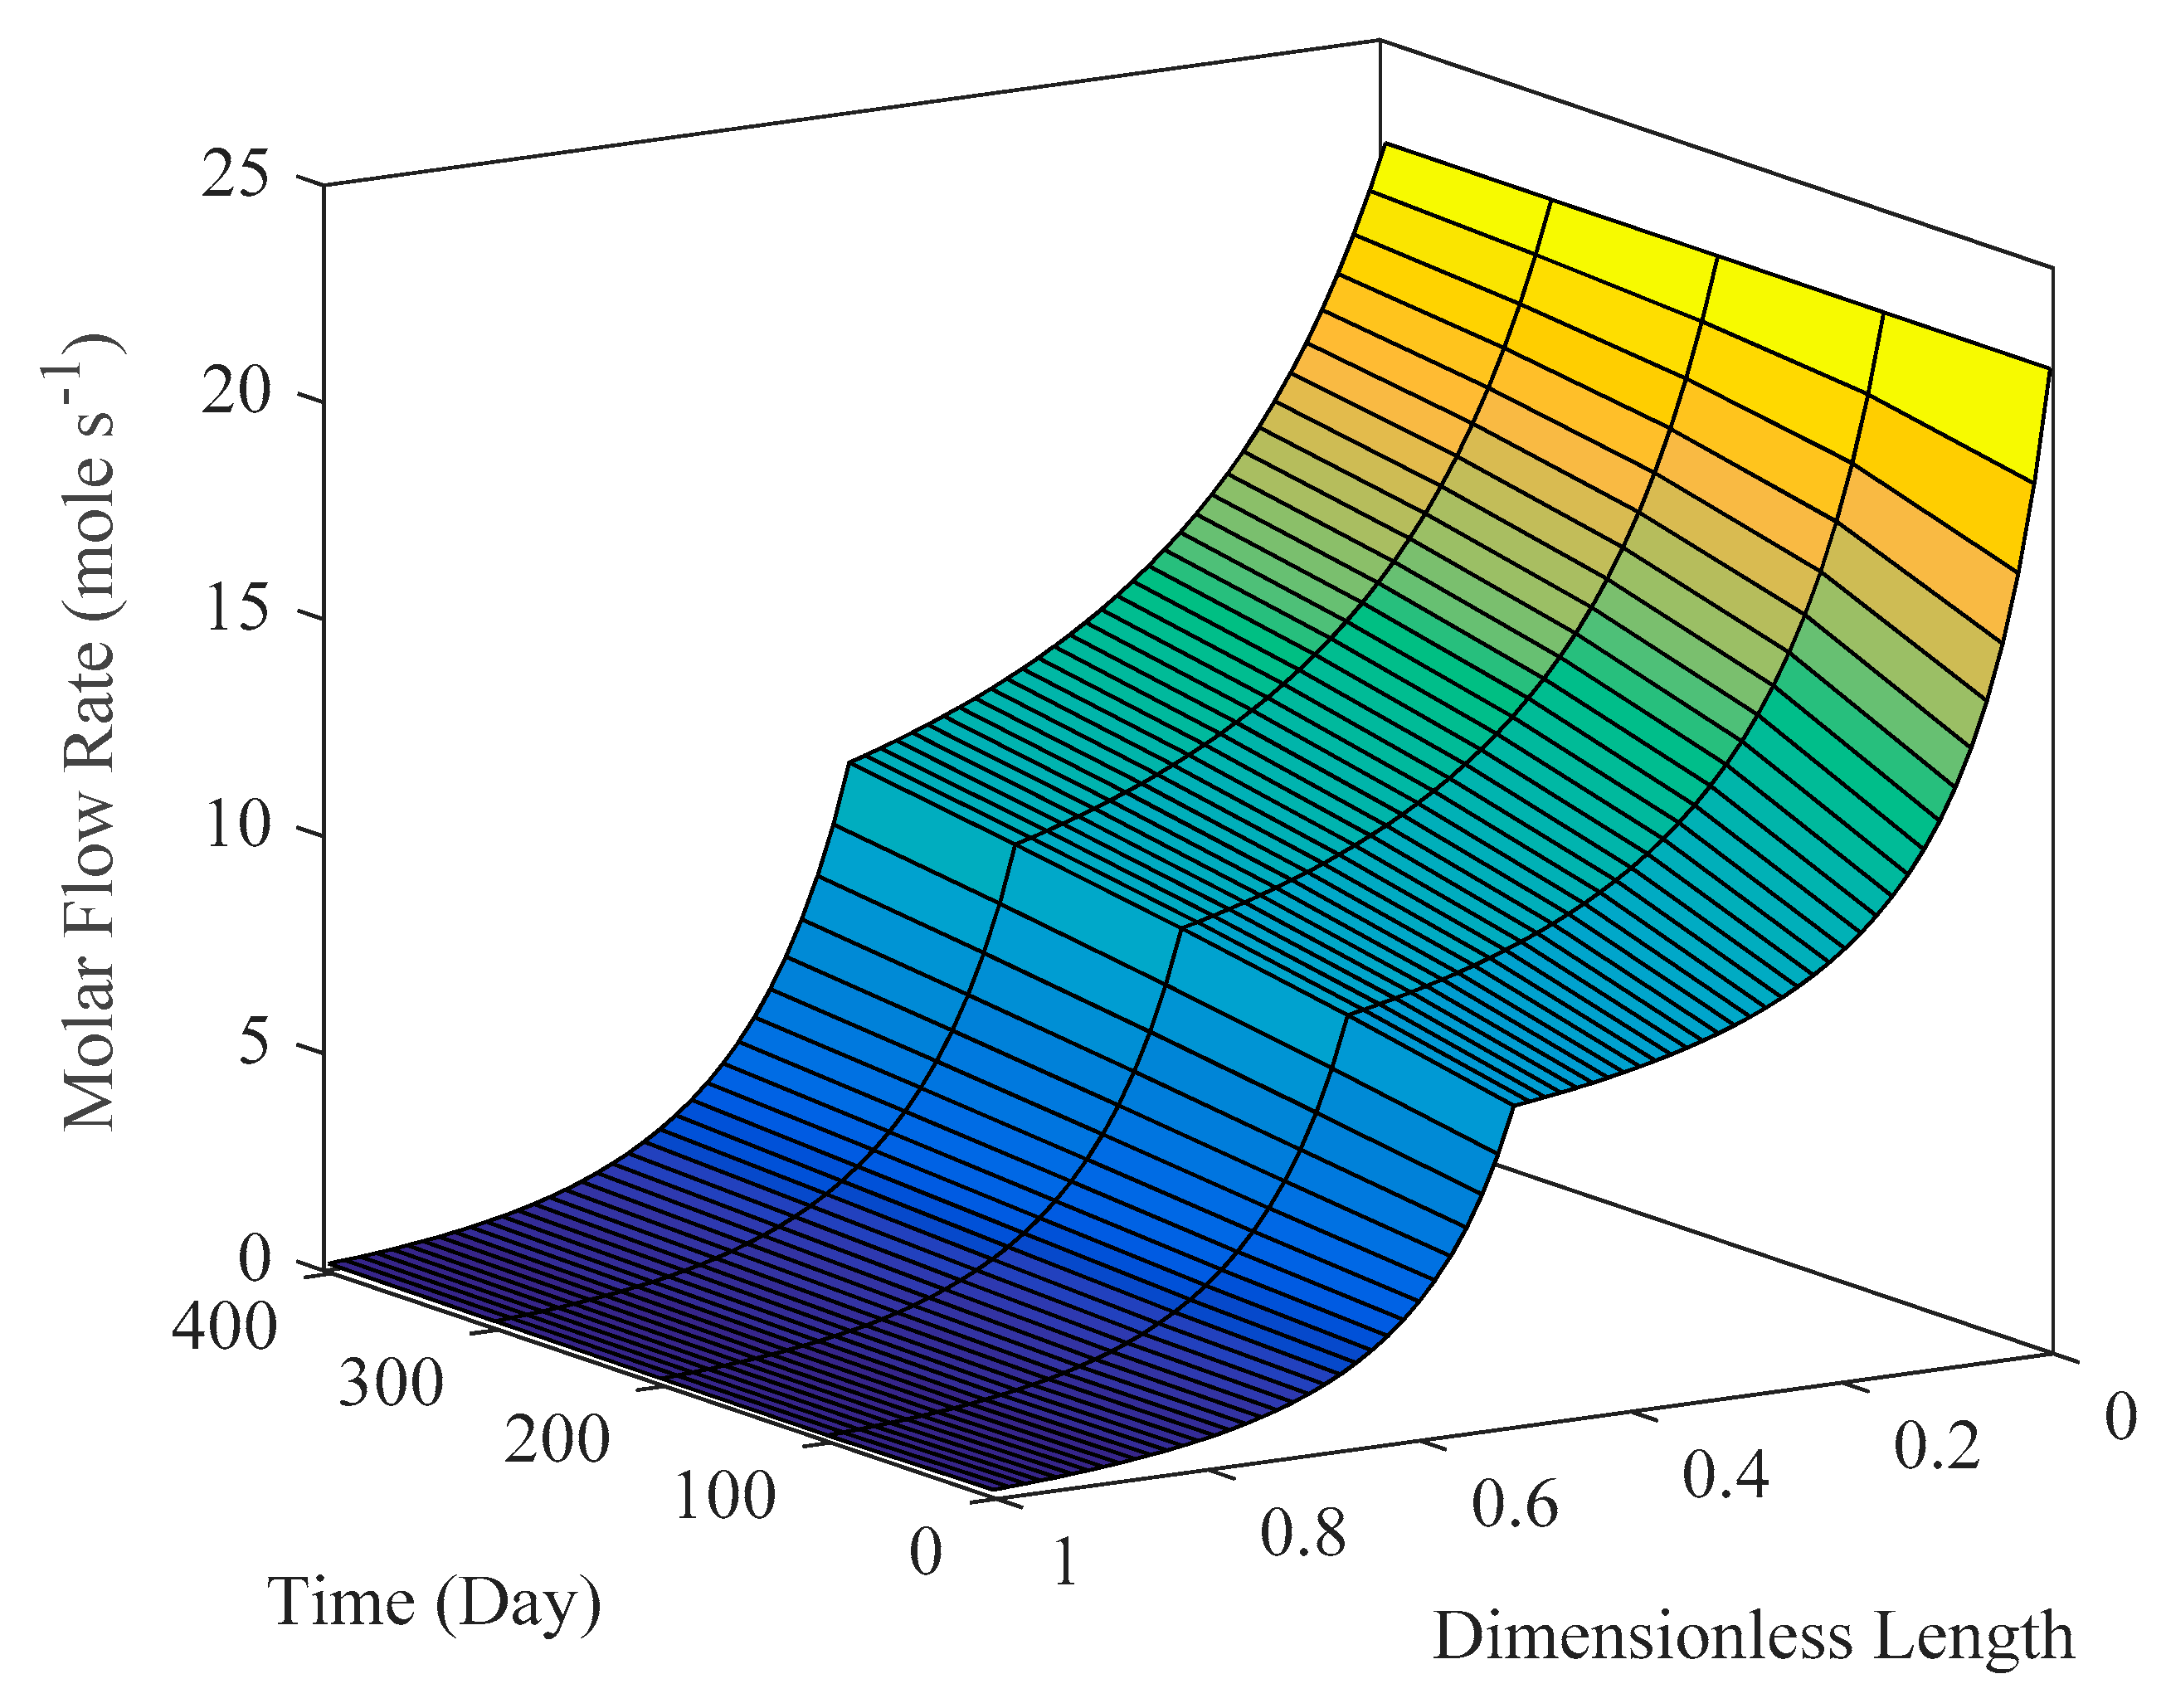
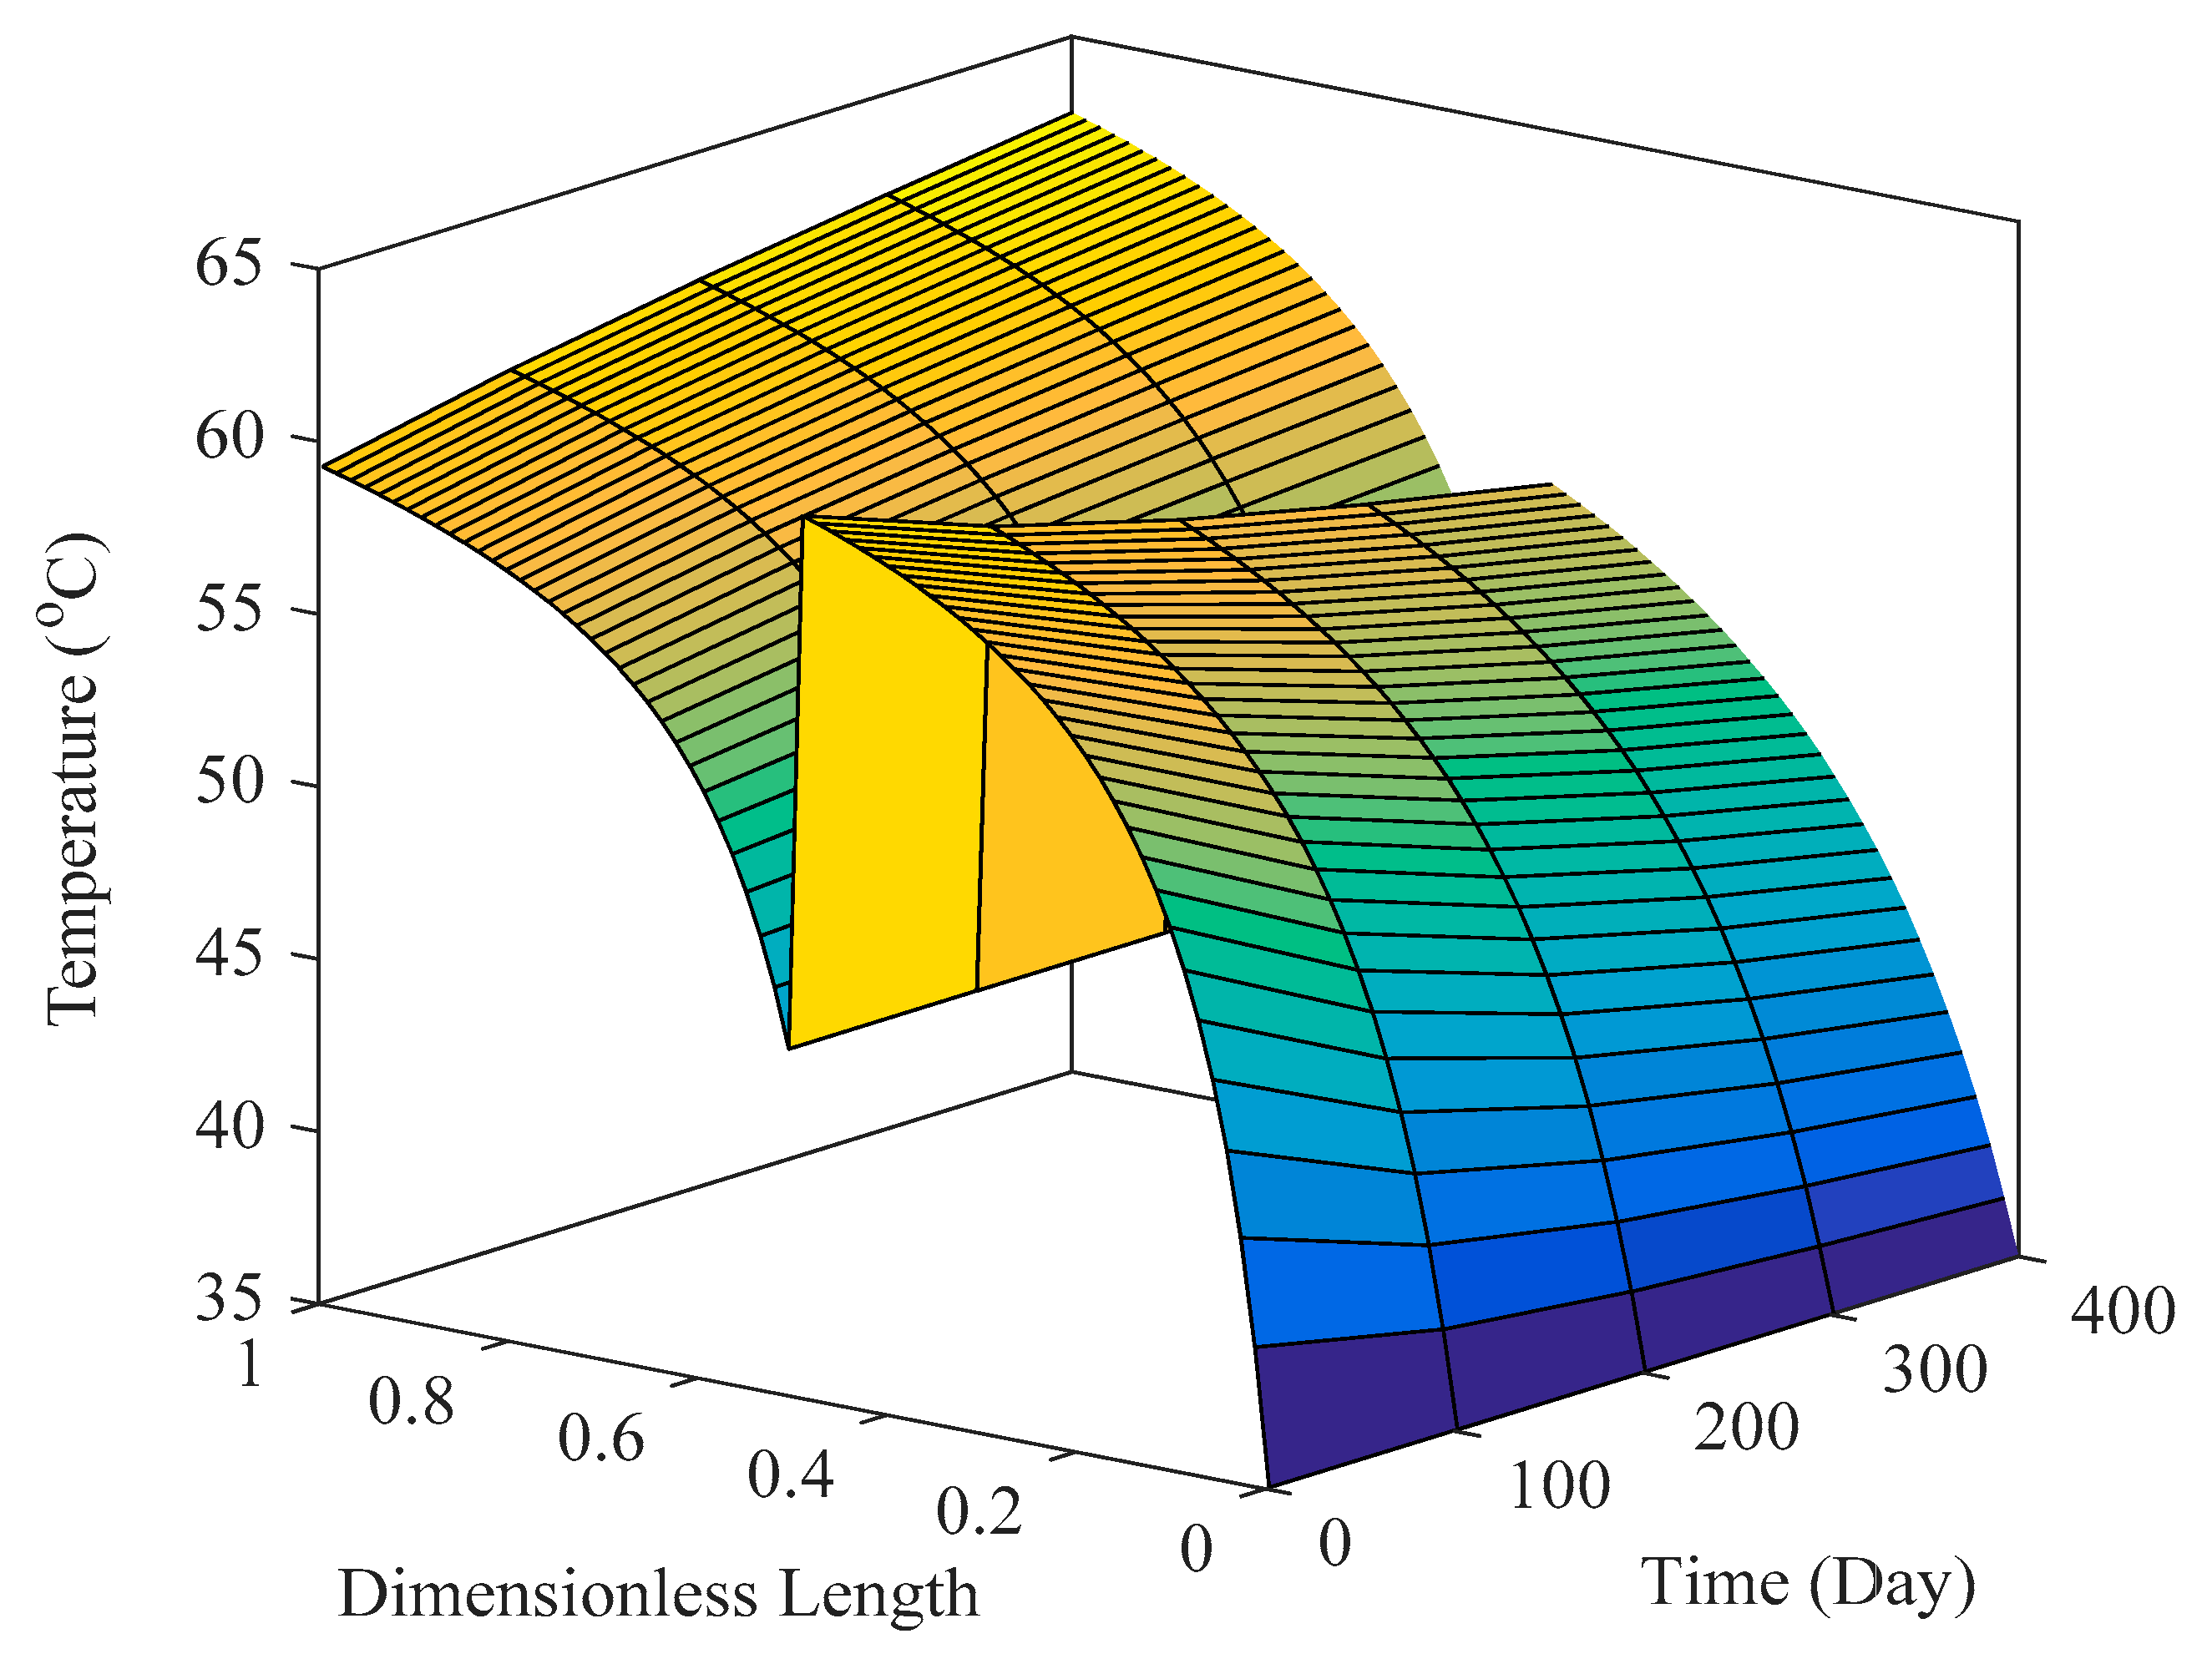
6.3.2. Reactor Simulation

In this section, the concentration and temperature profiles, along the reactors, are presented during the process run-time. Based on the simulation results, after 400 days of continuous operation, the activity of catalyst in the Lead bed decreased to 0.2, while the activity of the catalyst in the Guard bed is 0.5. Figure 12 shows the acetylene molar flow rate along the Lead and guard beds during the process run-time. It appears that the acetylene concentration decreases along the reactor length. Due to catalyst deactivation, the acetylene concentration in the outlet stream from lead bed increases during the process run-time and approaches from 7.43 mol s−1 to 10.09 mol s−1. Typically, the acetylene conversion decreases during the process run-time in the Lead bed and approaches from 67.2% at the start of the run to 55.5% at the end of run. Decreasing acetylene conversion in the Lead bed proves the philosophy of the Guard bed in the acetylene hydrogenation process. The unconverted acetylene is converted to ethane and ethylene in the Guard bed. It appears that acetylene molar flow rate in the outlet stream from the Guard bed increases during the process run-time and approaches from 0.19 to 0.21 mol s−1.
Figure 13 shows the temperature profile along the Lead and Guard beds during the process runtime. Since the acetylene hydrogenation reaction is exothermic, temperature increases along the reactors. Typically, catalyst decay decreases the rate of acetylene hydrogenation in the Lead and guard beds, and the temperature of outlet stream from the Lead and guard beds decreases gradually. Lower acetylene hydrogenation in the Lead and guard beds increases acetylene concentration in the feed of Guard bed reactor during the process run time. Thus, increasing acetylene concentration in the Guard bed increases heat generation through a hydrogenation reaction and temperature increases at the outlet of Guard bed. Generally, lower acetylene conversion in the Guard bed results in the lower temperate rise in the reactor.

7. Conclusions

In this research, the acetylene hydrogenation over Pd-Ag supported α-Al2O3 was investigated in a differential reactor. The full factorial design method, based on the cubic pattern was used to determine the experiments, considering hydrogen to acetylene ratio, temperature, gas hourly space velocity, and pressure as dependent variables. The fresh and spent catalysts were characterized by SEM, TEM, DTG-TGA, XRD, and BET tests. It is concluded from SEM and BET tests, that coke build-up on the external surface of the catalyst increases surface area and decrease pore mean diameter. Then, a detailed reaction network was proposed based on the Langmuir-Hinshelwood-Hougen-Watson approach, considering ethane, 1-butene, and 1,3-butadine as side products. The coefficients of the proposed kinetic model were calculated, based on experimental data. In addition, the industrial Tail-End hydrogenation reactors were modelled, and a decay model was proposed to predict catalyst activity. The results showed that applying hydrogen rich stream increases 1-butene concentration in the reactor. Based on the simulation results the acetylene molar flow rate in the outlet stream from Guard bed increases during the process run-time and approaches from 0.19 to 0.21 mol s−1.

Supplementary Materials

The following are available online at https://www.mdpi.com/2227-9717/7/3/136/s1.

Author Contributions

O.D.: Conceived and designed the analysis, Collected the data, Contributed data or analysis tools, Performed the analysis, Wrote the paper; M.R.R.: Conceived and designed the analysis, Contributed data or analysis tools, Performed the analysis, Wrote the paper; A.S.: Conceived and designed the analysis, Performed the analysis, Wrote the paper.

Conflicts of Interest

The authors confirm that there are no known conflict of interest associated with this publication and there has been no significant financial support for this work that could have influenced its outcome.

Nomenclature

ΔHenthalpy of reaction
MFCmass flow control
TICtemperature indicator controller
PICpressure indicator controller
FICflow indicator controller
ReReynolds number
Lreactor length
Dreactor diameter
dpcatalyst diameter
Qggas flow rate (experimental)
GHSVgas hourly space velocity
rioverall rate of reaction
kconstant of reaction
Kconstant of adsorption
Ppressure
npower of reaction rate nominator
αpower of reaction rate denominator
A0Arrenius type constant
Aijconstant of adsorption
Rgas constant
Rjlocal (component) rate of reaction
Vcatvolume of catalyst
aactivity of catalyst
Ttemperature
ttime
Eactivation energy
Edactivation energy of deactivation equation
kdconstant of deactivation equation
GCgas chromatography
mipower of nominator and denominator of reaction rate equation (i = 1–12)
nipower of nominator of deactivation equation (i = 1–2)
MWmolecular weight
TCcritical temperature
PCcritical pressure
Cpheat capacity
A,B,C,Dconstant of heat capacity equation
μcrcritical viscosity
μviscosity
Asurface area
Zlength
NAmole flux
ρbbulk density
εporosity
MREmean relative error (N: number of component), (exp: experiment)
Zz factor
Svacant site
sEntropy

References

  1. Adams, D.; Blankenship, S.; Geyer, I.; Takenaka, T. Front end & back end acetylene converter catalysts. In Proceedings of the 3rd Asian Ethylene Symposium on Catalyst and Processes, Yokohama, Japan, 4–6 October 2000; pp. 4–6. [Google Scholar]
  2. Barazandeh, K.; Dehghani, O.; Hamidi, M.; Aryafard, E.; Rahimpour, M.R. Investigation of coil outlet temperature effect on the performance of naphtha cracking furnace. Chem. Eng. Res. Des. 2015, 94, 307–316. [Google Scholar] [CrossRef]
  3. Huang, W.; McCormick, J.R.; Lobo, R.F.; Chen, J.G. Selective hydrogenation of acetylene in the presence of ethylene on zeolite-supported bimetallic catalysts. J. Catal. 2007, 246, 40–51. [Google Scholar] [CrossRef]
  4. Miller, S.A. Acetylene: Its Properties, Manufacture, and Uses; Academic Press: Cambridge, MA, USA, 1966; Volume 2. [Google Scholar]
  5. Kadiva, A.; Sadeghi, M.T.; Sotudeh-Gharebagh, R.; Mahmudi, M. Estimation of kinetic parameters for hydrogenation reactions using a genetic algorithm. Chem. Eng. Technol. 2009, 32, 1588–1594. [Google Scholar] [CrossRef]
  6. Mansoornejad, B.; Mostoufi, N.; Jalali-Farahani, F. A hybrid GA–SQP optimization technique for determination of kinetic parameters of hydrogenation reactions. Comput. Chem. Eng. 2008, 32, 1447–1455. [Google Scholar] [CrossRef]
  7. Mostoufi, N.; Ghoorchian, A.; Sotudeh-Gharebagh, R. Hydrogenation of acetylene: Kinetic studies and reactor modeling. In. J. Chem. React. Eng. 2005, 3. [Google Scholar] [CrossRef]
  8. Ravanchi, M.T.; Sahebdelfar, S.; Komeili, S. Acetylene selective hydrogenation: A technical review on catalytic aspects. Rev. Chem. Eng. 2018, 34, 215–237. [Google Scholar] [CrossRef]
  9. Bos, A.; Botsma, E.; Foeth, F.; Sleyster, H.; Westerterp, K. A kinetic study of the hydrogenation of ethyne and ethene on a commercial Pd/Al2O3 catalyst. Chem. Eng. Process. Process Intensif. 1993, 32, 53–63. [Google Scholar] [CrossRef]
  10. Borodziński, A. Hydrogenation of acetylene–ethylene mixtures on a commercial palladium catalyst. Catal. Lett. 1999, 63, 35–42. [Google Scholar] [CrossRef]
  11. Zhang, Q.; Li, J.; Liu, X.; Zhu, Q. Synergetic effect of pd and ag dispersed on Al2O3 in the selective hydrogenation of acetylene. Appl. Catal. A Gen. 2000, 197, 221–228. [Google Scholar] [CrossRef]
  12. Sarkany, A.; Horvath, A.; Beck, A. Hydrogenation of acetylene over low loaded pd and pd-au/SiO2 catalysts. Appl. Catal. A Gen. 2002, 229, 117–125. [Google Scholar] [CrossRef]
  13. Schbib, N.S.; García, M.A.; Gígola, C.E.; Errazu, A.F. Kinetics of front-end acetylene hydrogenation in ethylene production. Ind. Eng. Chem. Res. 1996, 35, 1496–1505. [Google Scholar] [CrossRef]
  14. Flick, K.; Herion, C.; Allmann, H.-M. Supported Palladium Catalyst for Selective Catalytic Hydrogenation of Acetylene in Hydrocarbonaceous Streams. U.S. Patent US5856262A, 5 January 1999. [Google Scholar]
  15. Khan, N.A.; Shaikhutdinov, S.; Freund, H.-J. Acetylene and ethylene hydrogenation on alumina supported pd-ag model catalysts. Catal. Lett. 2006, 108, 159–164. [Google Scholar] [CrossRef]
  16. Aduriz, H.; Bodnariuk, P.; Dennehy, M.; Gigola, C. Activity and selectivity of Pd/α-Al2O3 for ethyne hydrogenation in a large excess of ethene and hydrogen. Appl. Catal. 1990, 58, 227–239. [Google Scholar] [CrossRef]
  17. Pachulski, A.; Schödel, R.; Claus, P. Performance and regeneration studies of Pd–Ag/Al2O3 catalysts for the selective hydrogenation of acetylene. Appl. Catal. A Gen. 2011, 400, 14–24. [Google Scholar] [CrossRef]
  18. Tejeda-Serrano, M.A.; Mon, M.; Ross, B.; Gonell, F.; Ferrando-Soria, J.S.; Corma, A.; Leyva-Pérez, A.; Armentano, D.; Pardo, E. Isolated Fe (iii)–o sites catalyze the hydrogenation of acetylene in ethylene flows under front-end industrial conditions. J. Am. Chem. Soc. 2018, 140, 8827–8832. [Google Scholar] [CrossRef] [PubMed]
  19. Gobbo, R.; Soares, R.d.P.; Lansarin, M.A.; Secchi, A.R.; Ferreira, J.M.P. Modeling, simulation, and optimization of a front-end system for acetylene hydrogenation reactors. Braz. J. Chem. Eng. 2004, 21, 545–556. [Google Scholar] [CrossRef] [Green Version]
  20. Aeowjaroenlap, H.; Chotiwiriyakun, K.; Tiensai, N.; Tanthapanichakoon, W.; Spatenka, S.; Cano, A. Model-based optimization of an acetylene hydrogenation reactor to improve overall ethylene plant economics. Ind. Eng. Chem. Res. 2018, 57, 9943–9951. [Google Scholar] [CrossRef]
  21. Samavati, M.; Ebrahim, H.A.; Dorj, Y. Effect of the operating parameters on the simulation of acetylene hydrogenation reactor with catalyst deactivation. Appl. Catal. A Gen. 2018, 567, 45–55. [Google Scholar] [CrossRef]
  22. Khold, O.D.; Parhoudeh, M.; Rahimpour, M.R.; Raeissi, S. A new configuration in the tail-end acetylene hydrogenation reactor to enhance catalyst lifetime and performance. J. Taiwan Inst. Chem. Eng. 2016, 65, 8–21. [Google Scholar] [CrossRef]
  23. Kirk, R.E. Experimental design. In The Blackwell Encyclopedia of Sociology; Wiley: Hoboken, NJ, USA, 2007. [Google Scholar]
  24. Bos, A.; Westerterp, K. Mechanism and kinetics of the selective hydrogenation of ethyne and ethene. Chem. Eng. Process. Process Intensif. 1993, 32, 1–7. [Google Scholar] [CrossRef] [Green Version]
  25. Oudar, J. Deactivation and Poisoning of Catalysts; CRC Press: Boca Raton, FL, USA, 1985; Volume 20. [Google Scholar]
  26. Fogler, H.S. Elements of Chemical Reaction Engineering; Prentice Hall: Upper Sanddle River, NJ, USA, 1999. [Google Scholar]
  27. Bartholomew, C. Catalyst deactivation and regeneration. In Kirk-Othmer Encyclopedia of Chemical Technology; Wiley: Hoboken, NJ, USA, 2000. [Google Scholar]
  28. Sarkany, A.; Guczi, L.; Weiss, A.H. On the aging phenomenon in palladium catalysed acetylene hydrogenation. Appl. Catal. 1984, 10, 369–388. [Google Scholar] [CrossRef]
  29. Robinson, D. Catalyst regeneration, metal catalysts. In Kirk-Othmer Encyclopedia of Chemical Technology; Wiley: Hoboken, NJ, USA, 2000. [Google Scholar]
  30. Anderson-Cook, C.M. Practical Genetic Algorithms; Taylor & Francis: Abingdon, UK, 2005. [Google Scholar]
  31. Boudart, M.; Djéga-Mariadassou, G. Kinetics of Heterogeneous Catalytic Reactions; Princeton University Press: Princeton, NJ, USA, 2014; Volume 767. [Google Scholar]
Figure 1. The designed reactor to investigate kinetic of acetylene hydrogenation.
Processes 07 00136 g001
Figure 2. The BET results of the fresh catalyst.
Processes 07 00136 g002
Figure 3. The XRD results of the fresh catalyst.
Processes 07 00136 g003
Figure 4. SEM images of fresh catalysts and spent catalysts. (a) Fresh catalyst, (b) Spent catalyst.
Processes 07 00136 g004
Figure 5. (a,b) TEM images of fresh and spent catalysts, (c,d), particle size distribution of fresh and spent catalysts.
Processes 07 00136 g005
Figure 6. (a) TGA results of different catalysts and (b) DTG results of coked catalysts.
Processes 07 00136 g006
Figure 7. Effect of GHSV on (a) acetylene conversion and ethylene selectivity, and (b) product distribution at 15 bar, 35 °C and hydrogen to acetylene ratio 0.5.
Processes 07 00136 g007
Figure 8. Effect of pressure on (a) acetylene conversion, ethylene selectivity, and (b) product distribution at 35 °C and hydrogen to acetylene ratio 0.9 and GHSV 3500 1/h.
Processes 07 00136 g008
Figure 9. Effect of temperature on (a) acetylene conversion, ethylene selectivity, and (b) product distribution at 18 bar, hydrogen to acetylene ratio 1.2 and GHSV 5500 1/h.
Processes 07 00136 g009
Figure 10. The effect of (a) hydrogen to acetylene ratio on acetylene conversion, ethylene selectivity, and (b) product distribution at 20 bar, 45 °C and GHSV 2600 1/h.
Processes 07 00136 g010
Figure 11. Comparison between outlet acetylene concentrations calculated by the model and plant data in (a) lead and, (b) guard beds.
Processes 07 00136 g011
Figure 12. Acetylene flow rate along the Lead and guard beds during the process runtime.
Processes 07 00136 g012
Figure 13. Temperature profile along the Lead and Guard beds during the process runtime.
Processes 07 00136 g013
Table 1. The specification of fresh catalyst.
Bulk Density (kg m−3)720
Size (mm)2–4
ShapeSphere
Pd content (ppm)300
Ag to Pd ratio6
Particle porosity (%)60–70%
Particle tortuosity2.5
BET Surface Area (m2 g−1)30.1062
BJH Adsorption average pore diameter (Å)291.218
Thermal conductivity of catalyst (W m−1 k−1)0.29
Table 2. The composition of the feed stream.
Methane0.014
Acetylene0.738
Ethylene64.594
Propane0.002
Propylene0.199
Ethane34.449
Other C4s0.0023
MAPD0.0005
Cyclopropane<0.0001
C5+ Hydrocarbons<0.0001
1,3 Butadiene<0.0001
Table 3. The variation range and number of data points.
LowerUpperNumber of Levels
Hydrogen to acetylene ratio0.51.53
Pressure (Bar)15203
Temperature35604
GHSV260062006
Table 4. The BET results of fresh and spent catalysts.
FreshSpent
BET surface area (m2 g−1)24.7530.11
Langmuir surface area (m2 g−1)34.1341.86
External surface area (m2 g−1)20.1527.27
Micro pore area (m2 g−1)4.6018 2.84
Adsorption average pore width (Å)235.52191.17
Adsorption cumulative volume of pores (cm3 g−1)0.2290.218
Table 5. Kinetics of reactions and proposed kinetic model.
ReactionProposed Kinetic Model
C 2 H 2 + H 2 C 2 H 4 r i = 0.0197 e 11641.3 R T p C 2 H 2 0.4 × p H 2 0.9 ( 1 + K C 2 H 2 p C 2 H 2 ) 1.1
C 2 H 4 + H 2 C 2 H 6 r i = 0.0098 e 6067.7 R T p C 2 H 2 1.4 × p H 2 1.4 ( 1 + K C 2 H 4 p C 2 H 4 ) 1.6
2   C 2 H 2 + H 2 C 4 H 6 r i = 0.0032 e 14174.1 R T p C 2 H 2 0.4 × p H 2 1.8 ( 1 + K C 2 H 2 p C 2 H 2 ) 2
2   C 2 H 2 + 2 H 2 C 4 H 8 r i = 0.00027 e 21020.1 R T p C 2 H 2 1.1 × p H 2 1.7 ( 1 + K C 2 H 2 p C 2 H 2 ) 1.7

