Vapor Liquid Equilibrium Measurements of Two Promising Tertiary Amines for CO2 Capture


1
Department of Chemical Engineering, Norwegian University of Science and Technology, 7491 Trondheim, Norway
2
Hovyu B.V., Watermunt, 72, 2408 LS Alphen aan den Rijn, The Netherlands
*
Author to whom correspondence should be addressed.
Processes 2019, 7(12), 951; https://doi.org/10.3390/pr7120951
Submission received: 4 November 2019
/
Revised: 27 November 2019
/
Accepted: 2 December 2019
/
Published: 12 December 2019
(This article belongs to the Special Issue Gas, Water and Solid Waste Treatment Technology)
Abstract
:Post combustion CO2 capture is still a rather energy intense, and therefore expensive, process. Much of the current research for reducing the process energy requirements is focused on the regeneration section. A good description of the vapor liquid equilibrium of the solvent is necessary for the accurate representation of the process. 3-(Diethylamino)-1,2-propanediol (DEA-12-PD) and 1-(2-hydroxyethyl)piperidine (12-HEPP) have been proposed as potential components in solvent blends for the membrane contactor. However, there are few available experimental data for these two tertiary amines making difficult to accurate simulate such process. In this work, we provide experimental data on the pure component saturation pressure (383 to 443 K) and on VLE of aqueous solutions of these amines (313 to 373 K) in order to fill part of the data gap. The data were used to estimate model parameters used to represent the data. The saturation pressure was modeled using the Antoine equation and the deviation is calculated lower than 2%. The NRTL model was used in this work to calculate the activity coefficients in the aqueous systems. The deviations in pressure for the aqueous systems were lower than 5% in both systems.
1. Introduction
Chemical absorption is widely used and the most mature technology to remove CO2 from gas streams. However, it is known that the energy consumption to regenerate the solvent is one of the biggest concerns of this type of process. Other major concerns include solvent emissions, stability, and equipment size. Several studies on solvent development (e.g., phase change solvent [1], new blends [2,3] and water lean solvents [4]) and on process modification [5,6] aiming to address these issues have been done since Bottoms patented in 1930 a process to remove acid gases from natural gas.
To design and simulate effectively an absorption process, information is required on both the solvent properties (e.g., physical properties, vapor liquid equilibrium, and absorption kinetics) and the equipment (e.g., absorber type and packing material). Traditionally, in the absorption process, the absorption and desorption are performed in columns: the absorber and the stripper columns, respectively. However, some new designs have been recently proposed. For example, Lin et al. (2016) [7] studied the desorption step using the advanced flash stripper configuration for a 5 m and a 8 m piperazine (PZ) solution. They showed that the process was more energy efficient than the benchmark solvent monoethanolamine (MEA) and previous process configuration, namely the two-staged flash. A reboiler duty of 2.1–2.5 GJ/ton CO2 was achieved. Recently, membrane contactors have been studied to substitute the absorber tower [8]. Using a membrane contactor could potentially reduce significantly the equipment size as calculated in Hoff and Svendsen (2013) [9].
Traditional solvents such as monoethanolamine (MEA), methyldiethanolamine (MDEA), and piperazine (PZ) have been widely studied and their behavior is well represented by several commercial softwares. However, new solvents/solvent blends are being developed to improve the efficiency and safety of the absorption process. In the solvent development the vapor-liquid equilibria, heat of absorption, corrosion tendencies, solvent degradation, absorption kinetics, and solvent volatility are among the properties that are experimentally measured. In recent years, solvent volatility has gained a lot of attention. Volatility causes solvent losses requiring water wash sections to control the emissions. Volatility in combination with mist formation can significantly magnify the solvent losses. There are three strategies to overcome the volatility issue. One is to develop solvents with very low volatility, like aqueous amino acid salt solutions [10]. The second is to develop systems/operations that minimize the formation of mist, like the anti-mist design developed by Aker Solutions [11]. In recent years, a third strategy has been proposed: the use of a non-porous thin composite membrane [8]. This type of membrane can potentially reduce the amine evaporation towards the gas phase.
Independently of the equipment used for the absorption process, a good description of the vapor liquid equilibrium, together with other properties, is essential. 3-(Diethylamino)-1,2-propanediol (DEA-12-PD) and 1-(2-hydroxyethyl)piperidine (12-HEPP) have been proposed as potential components in solvent blends for membrane contactors [12]. Very few experimental data are found for these two tertiary amines. DEA-12-PD had been identified by Chowdhury et al. (2013) [13] as a potential tertiary amine since the absorption rate and capacity were good. Li et al. (2015) [14] studied the reaction kinetics of aqueous solutions of DEA-12-PD with CO2 and it was observed that the reaction was faster than MDEA. They also performed pKa measurements at different temperatures.
Later Hartono et al. (2017) [15] performed a series of screening tests with different solvents that could intensify the formation of bicarbonate. DEA-12-PD and 12-HEPP were among the tested solvent candidates. Knuutila et al. (2019) [3] tested DEA-12-PD and 12-HEPP promoted with primary amines and showed that by using a short cut method [16], the tested solvent blends could be regenerated with reboiler duties 2.5–2.6 MJ/kg CO2. These values are similar to those values measured with several novel solvent blends, 2.5–3.0 MJ/kg CO2 [17,18,19].
No data was found for the vapor liquid equilibrium of aqueous DEA-12-PD and 12-HEPP systems. Understanding the volatility of solvent components is an important parameter as discussed above. The volatility will be influenced by the CO2 loading and the degree of solvent degradation, both depending on the actual industrial application. However, a good estimation of the potential challenges related to volatility can be gained by measuring the vapor–liquid equilibria of non-degraded binary systems.
In this work, we provide experimental data on the pure component saturation pressure and on VLE of aqueous solutions of these amines. The data were then used to estimate model parameters used to represent the data. The saturation pressure was modeled using the Antoine equation and the deviation was calculated lower than 2%. The NRTL model was used in this work to calculate the activity coefficients in the aqueous systems. The deviations in pressure for the aqueous systems were lower than 5% in both systems.
2. Materials and Methods
2.1. Chemicals
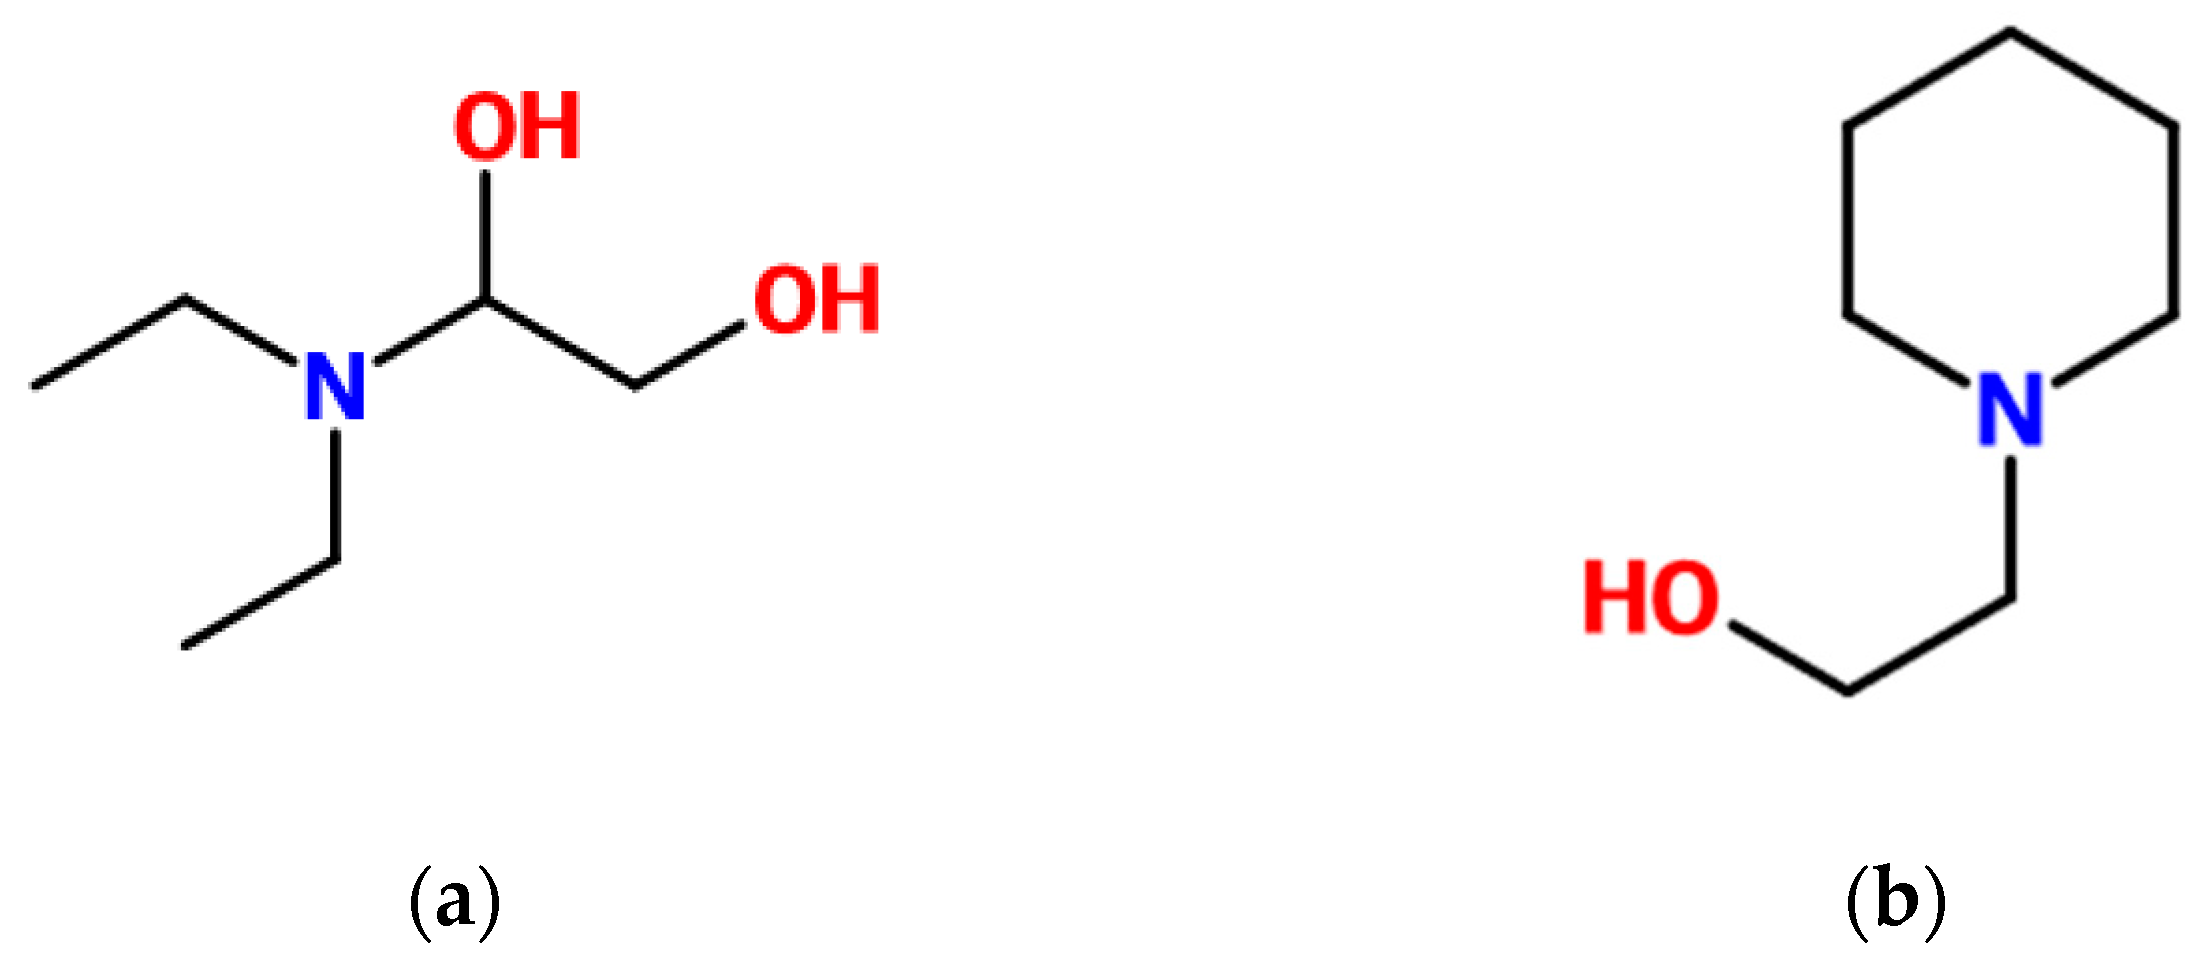
DEA-12-PD and 12-HEPP are tertiary amines and their molecular structures are given in Figure 1. In order to validate the apparatus, measurements with pure water and aqueous solutions of MEA were performed and compared to in-house data and literature. DI-water produced in the lab was used to measure the saturation pressure of pure water and to dilute the chemicals to the desired solution concentration. The suppliers and purities (mass basis) of the purchased chemicals are given in Table 1. The chemicals were used in the experiments without any further purification.
2.2. Apparatus
The modified Swietoslawski ebulliometer previously described in Kim et al. (2008) [20] was used to measure the vapor liquid equilibrium of pure and aqueous solutions. The apparatus was used several times for this type of measurement [21,22] and proven to be accurate and reliable. For further description of the apparatus, the reader is referred to the cited references.
About 80 mL of liquid was added to the ebulliometer for a measurement. When pure component was used, the first solution added was left boiling for some time until it reached the equilibrium at a given temperature. The equilibrium temperature and pressure were recorded as a reference and the solution was later discarded. A new fresh pure liquid solvent was inserted in the apparatus and the procedure was repeated until the equilibrium temperature and pressure from the new round and the old round was the same. This procedure was to ensure that all water trapped in the apparatus was removed and the apparatus was filled with only pure solvent. Usually after the third charge, the measurements of the pure solvent could be started. This procedure was, however, not necessary for aqueous solutions as a small dilution of the initial concentration would not affect the measurements.
Aqueous solutions of approximately 0.2 to 0.8 mol fraction concentration were prepared gravimetrically using a Mettler PM1200 scale () for DEA-12-PD and 12-HEPP. A VLE experiment in this concentration range was performed by inserting the prepared solution into the ebulliometer and setting a desired equilibrium temperature. Once equilibrium was reached, the temperature and pressure were recorded; samples from the gas (approximately 1 mL) and liquid (approximately 5 mL) phases were taken for further alkalinity analysis and a new desired temperature was set. The equilibrium was considered achieved once the temperature and pressure were constant for more than 10 min. After the measurements at all desired temperatures were performed, the solution was removed from the apparatus and a new solution with a different concentration was inserted for a new measurement cycle.
For concentrations lower than 0.2 (mol fraction), the solution was not discarded, but diluted by removing a certain amount of solution from the sampling point and replacing it with DI water at the same sampling point with the help of a syringe. The measurements, then, followed the same procedure as for the more concentrated solutions.
2.3. Analysis
The samples from the solution preparation, gas phase, and liquid phase from the measurements were analyzed using an acid–base titration. This method is described elsewhere (e.g., [23]) and it is an inexpensive, fast, and reliable method to quantify the amine concentration in aqueous solutions. To understand the accuracy of the titration method in case of very dilute samples, 0.05 M and 0.1 M solutions of MEA were prepared by weighing. Then 1 mL of the solutions was analyzed four times. The deviations in the parallels for the 0.1 M and 0.05 M solutions were 1.9% and 9.2%, respectively. There were in total 4 samples where the amine concentration during analyses was below 0.05 M, leading into analytical uncertainty in the gas phase higher than 10%. These were with DEA-12-PD at 40 and 60 °C. In the tables presenting the data, uncertainty of the data is given.
3. Modeling
The Antoine equation, Equation (1), was used to correlate the saturation pressure of both pure DEA-12-PD and 12-HEPP. This correlation is frequently used to represent the saturation pressure of pure components and, in this work, it was chosen to represent the produced data.
In this work, a non-electrolyte non-reactive system was assumed for the representation of the VLE of aqueous DEA-12-PD and 12-HEPP. The phase equilibrium is solved iteratively for the pressure and vapor phase composition by solving the system of equations described in Equation (2). In that equation the subscript stands for H2O and the amine, is the activity coefficient, is the fugacity coefficient, and are the liquid and gas phase mol fractions, respectively, and the exponential term is the so-called Poynting correction factor where the liquid volume was fixed as the respective component molar volume. As expected, since the experiments were carried out under low pressures, the Poynting correction factor for the conditions studied in this work was negligible.
The Peng–Robinson equation of state (EoS) [24] is used to correct the gas phase non-idealities while the non-random two-liquids (NRTL) model [25] is used to account for the liquid phase non-ideal behavior. The Van der Waals mixing rule with all binary parameters set to zeros was used in the Peng–Robinson EoS. As a result, all adjustable parameters are from the NRTL model.
The activity coefficient calculated through the NRTL model is given in Equation (3). The binary energy parameters are assumed to have a temperature dependency as shown in Equation (5) where and are adjustable parameters. The non-randomness parameter can also be used as an adjustable parameter, but in this work it was fixed at a given value.
Besides the rigorous framework, the choice of the set of models used in this work, among others, was based on the ease of exporting the parameters to process simulation software. Most process simulators have the models used in this work already implemented.
3.1. Optimization Routine
The adjustable parameters from the NRTL model were fitted to the experimental data using the particle swarm optimization (PSO) routine with the local best topology. The method is widely used for parameter estimation [23,26,27,28] and information about it can be found elsewhere (e.g., [23,29]). In this work, we fixed the non-randomness parameters at 0.1, 0.2, and 0.3 using four different objective functions. The best results are given in the results section while the results from all optimizations can be found in Appendix B.
Equations (6) and (7) show the general form of the objective functions used in this work. In those equations, the parameter q was set to zero if the vapor phase composition was not included in the objective function. In the case that the vapor phase composition should be considered in the optimization, the parameter was set to one. A total of four objective functions were used per non-randomness parameter, giving a total of 12 optimizations and a set of parameters for each binary system.
The results were evaluated by means of the average absolute relative deviation (AARD) function (Equation (8)) where is the variable from which the deviation is calculated.
3.2. Critical Properties
Since the Peng–Robinson EoS was used, the critical properties of the components were required. These properties were not found for the tertiary amines studied in this work. Therefore, the Joback group contribution method [30] was used for this purpose. For 12-HEPP, the tertiary amine contribution was considered as a “non-ring” tertiary amine contribution since the method has no “ring” tertiary amine contribution. Nevertheless, the estimations given here should be treated with care as these results must be experimentally confirmed. The normal boiling point for the amines was calculated with the Antoine equation fitted with the respective experimental points generated in this work.
As a comparison, the critical properties for MEA were estimated using the Joback group contribution method. Using a normal boiling temperature of 443.97 K, the critical temperature, pressure, and volume were estimated to be 637.1 K, 62.89 bar, and 1.96 m3/mol, respectively. The reported values for the critical temperature, pressure, and volume for MEA [31] are, respectively, 678.2 K, 71.24 bar, and 2.25 m3/mol. This shows that using the Joback group contribution method gives a good initial estimation for the critical point of a substance.
Once the critical properties are known, the acentric factor can be calculated using Equation (9). The results are summarized in Table 2.
4. Results
All experimental data are given in Appendix A.
4.1. Validation
Before the measurements with the unknown tertiary amines, the apparatus was validated by measuring the equilibrium with pure water and aqueous MEA solutions. Equation (10) shows the form of the Riedel equation to calculate the saturation pressure of pure water at a given temperature. Along with previous literature data, the model is used for comparison with the measured data.
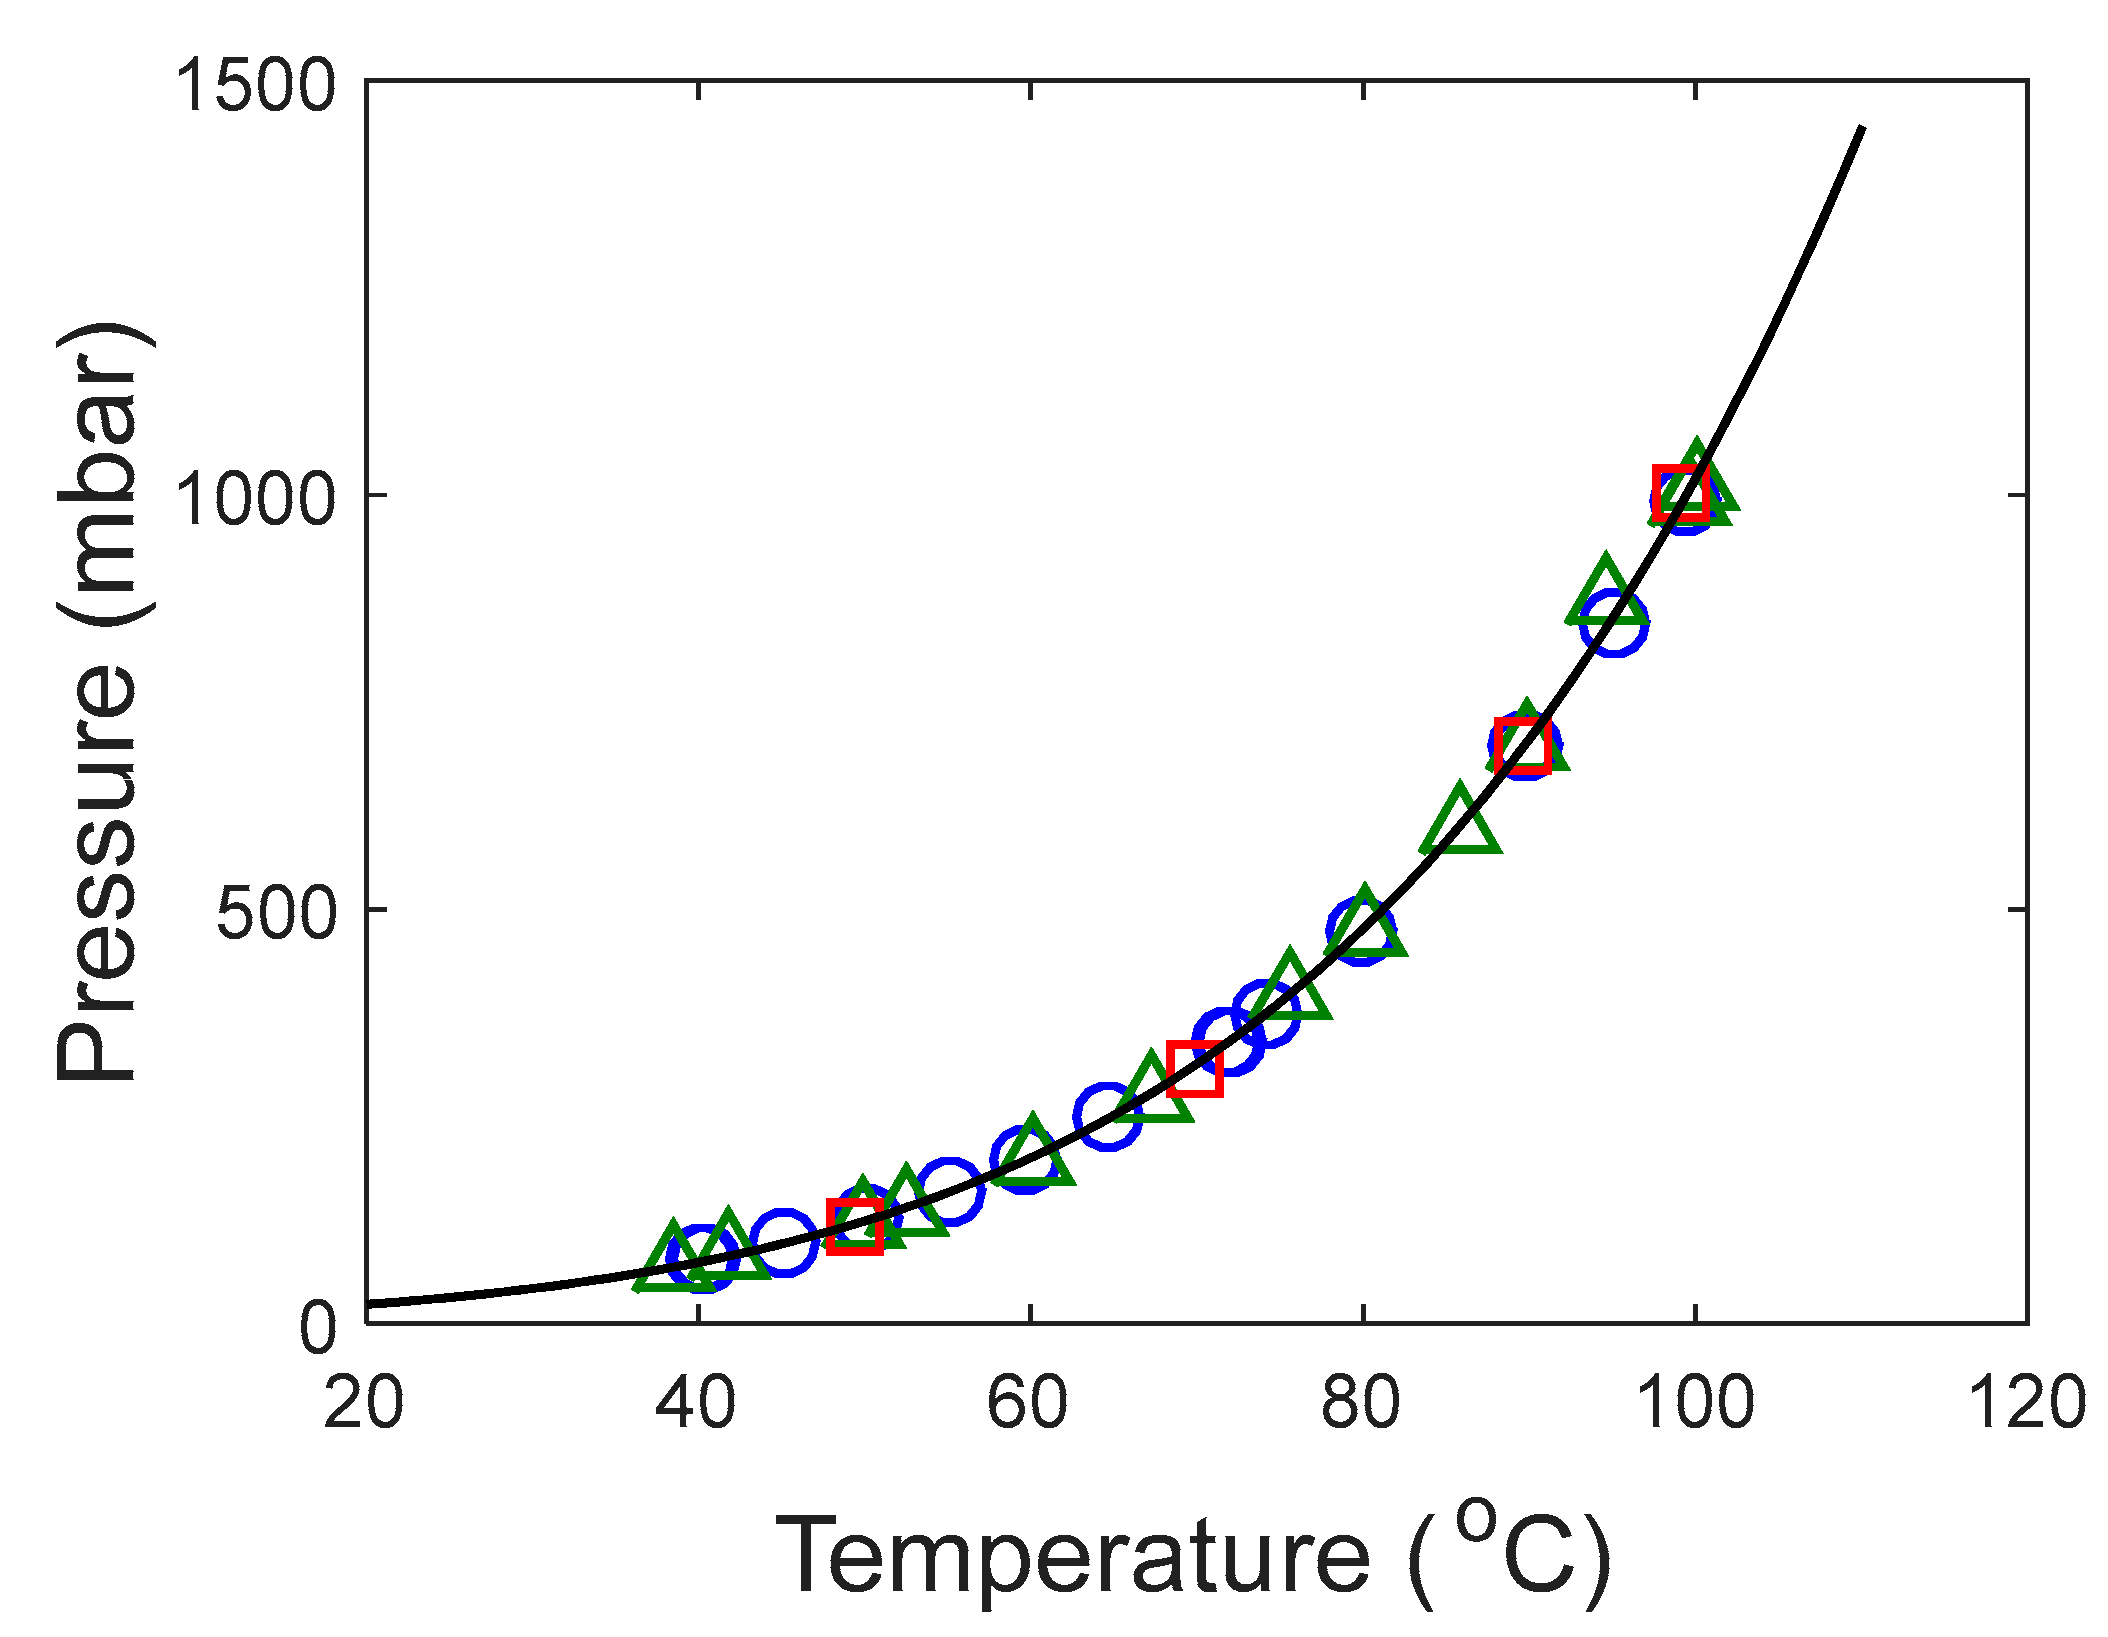
The results from pure water show that the measurements were in line with what was previously reported in the literature. Figure 2 shows the comparison of the different measured data and the Riedel equation for water. The calculated deviation (Equation (8)) from the experimental points generated in this work and the correlation was 0.7%.
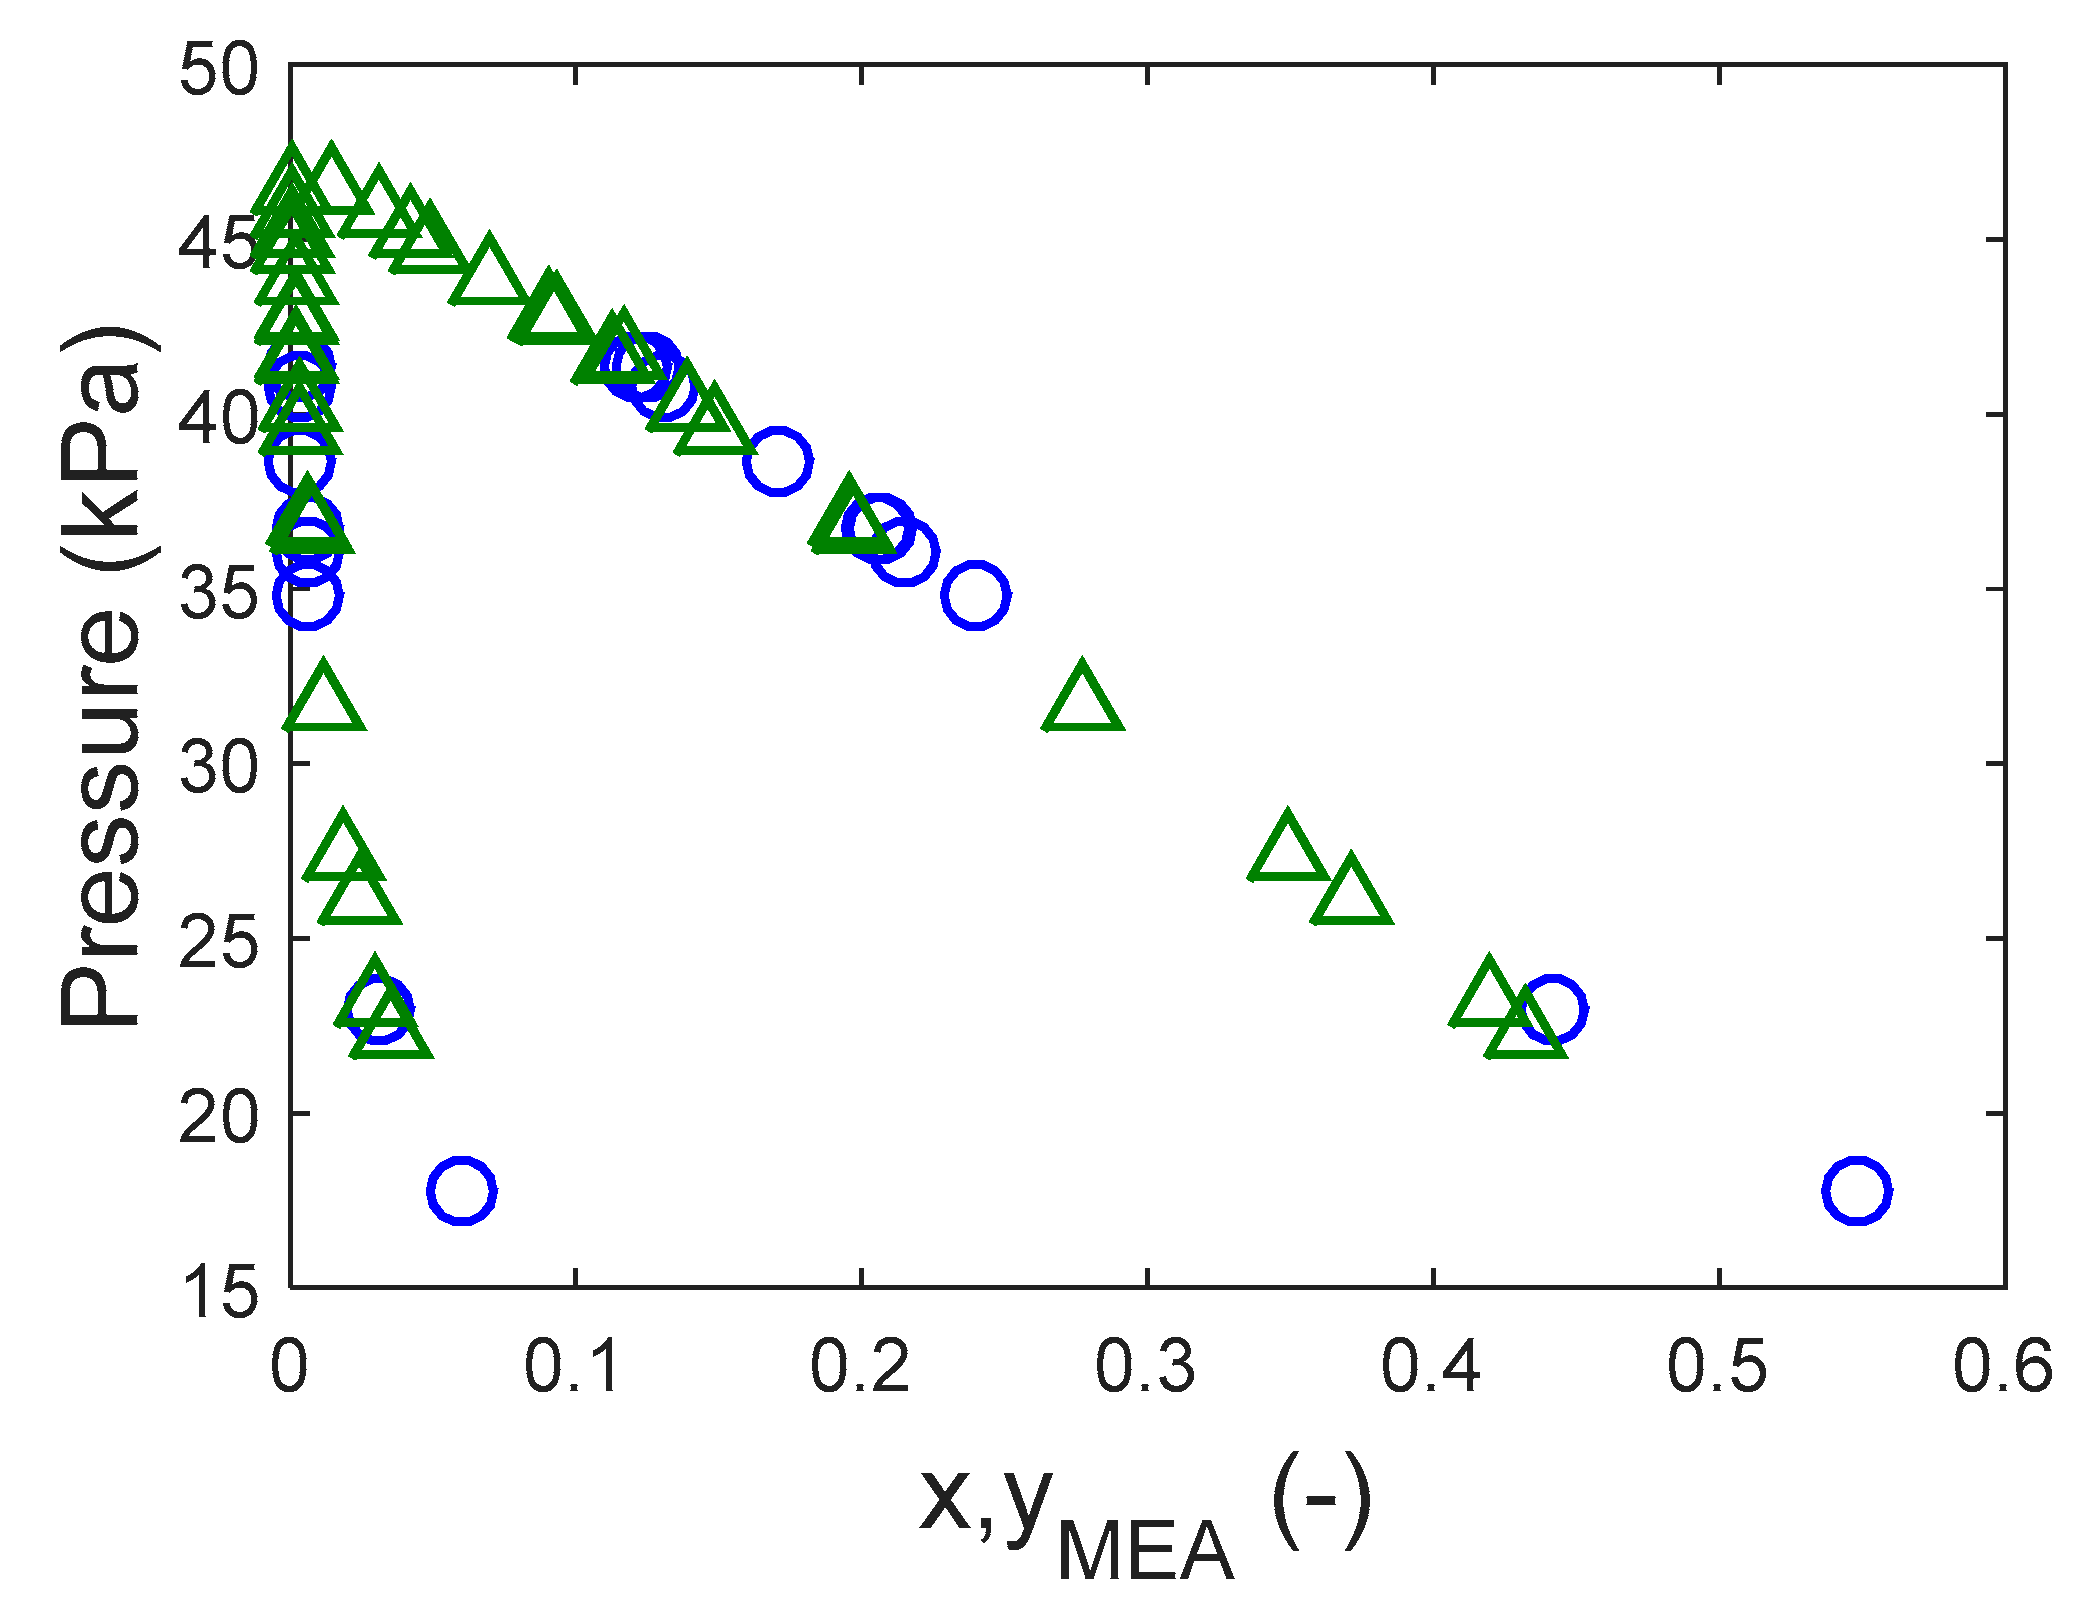
A last validation experiment with an aqueous solution of MEA was performed. The VLE at 80 °C was measured. In this case, samples of the gas and liquid phases were taken and analyzed for amine concentration. The results are shown in Figure 3. It is possible to see that the results from MEA in this work are in excellent agreement with previous results reported in the literature. Given all the validation results, it was possible to conclude that the apparatus was accurate and reliable to measure VLE of pure and aqueous solutions of amines.
4.2. Saturation Pressure of Pure Component
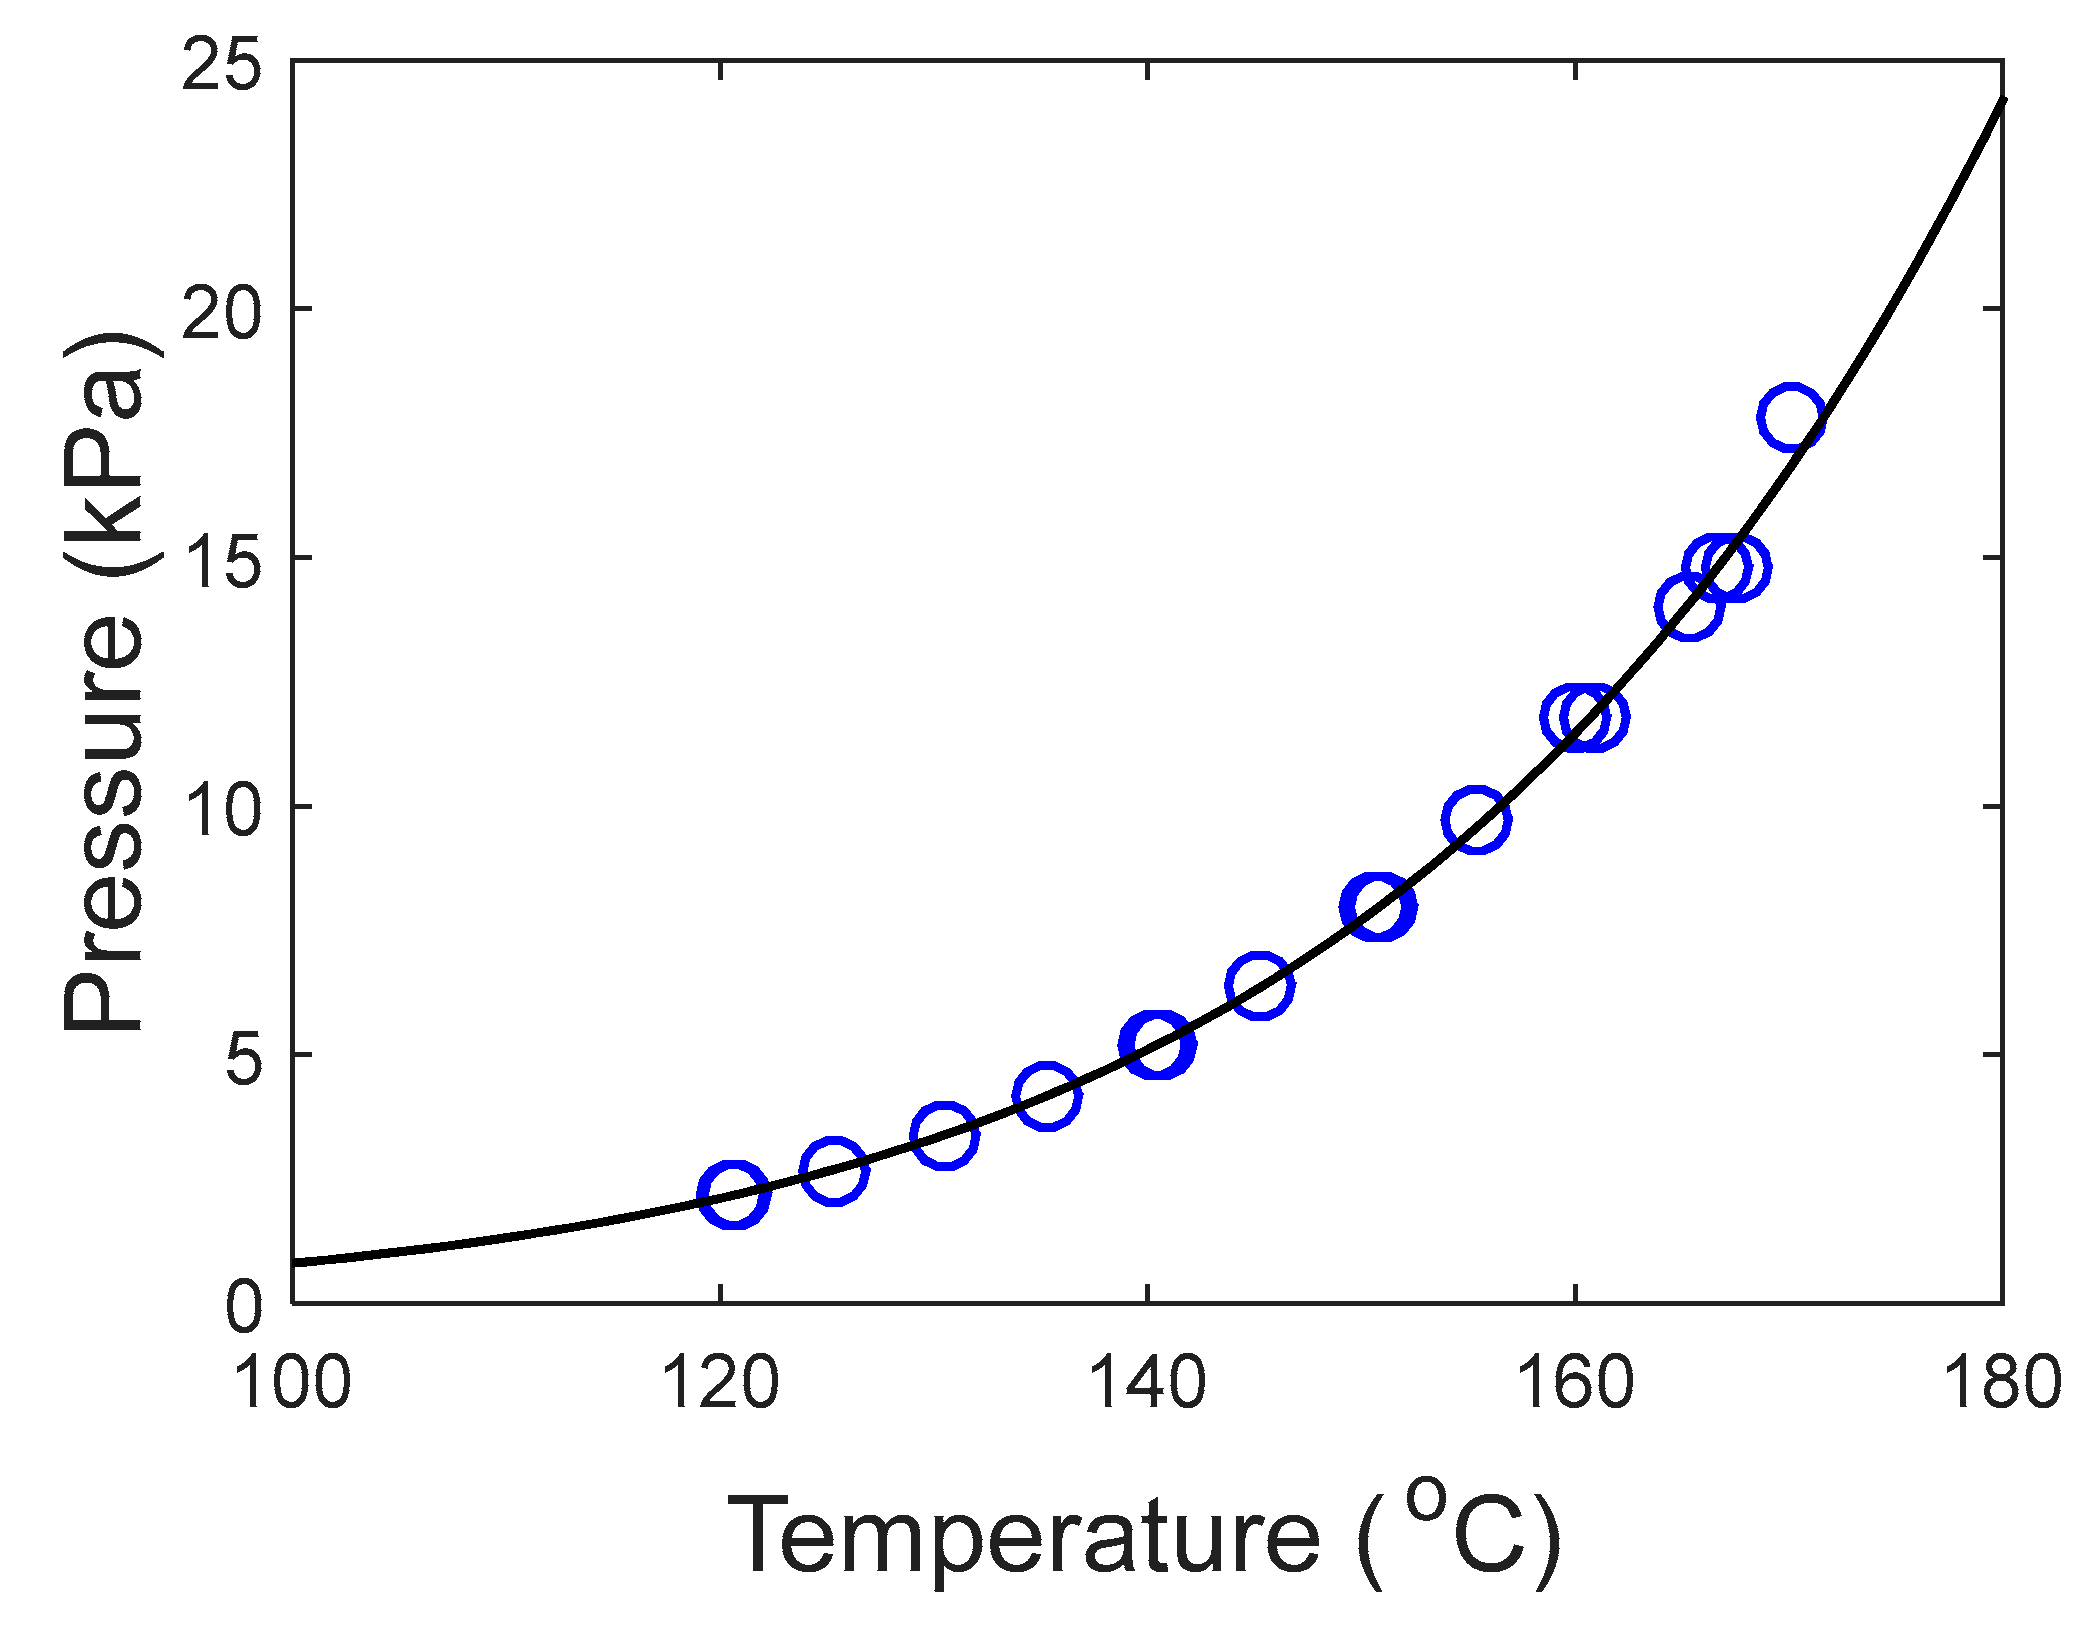
The saturation pressure of the pure tertiary amines was modeled using the Antoine equation (Equation (1)). The optimized parameters together with the deviations are given in Table 3 where the pressure is given in Pa and the temperature in K. Figure 4 and Figure 5 show, respectively, the excellent agreement between the experimental data and the model for DEA-12-PD and 12-HEPP. The calculated deviations are below 2%. Two experiment runs were performed for measuring the pure component volatility. In the first run, the measurements were aimed for a 10 °C temperature interval. This was done in order to identify the lower and upper temperature limits of the apparatus for the specific solvent. For the second run, performed with a fresh solvent, the temperature interval between the measurements was reduced to 5 °C.
It is possible to see from the figures that both runs agree very nicely. Moreover, it can be observed that pure 12-HEPP is more volatile than DEA-12-PD. However, both tertiary amines are less volatile than the benchmark MEA.
4.3. Aqueous Amine Solution
As previously mentioned, 12 optimizations were performed for each system where the objective function and the non-randomness parameter were varied. The optimized parameters are given in Appendix B for DEA-12-PD and 12-HEPP, respectively.
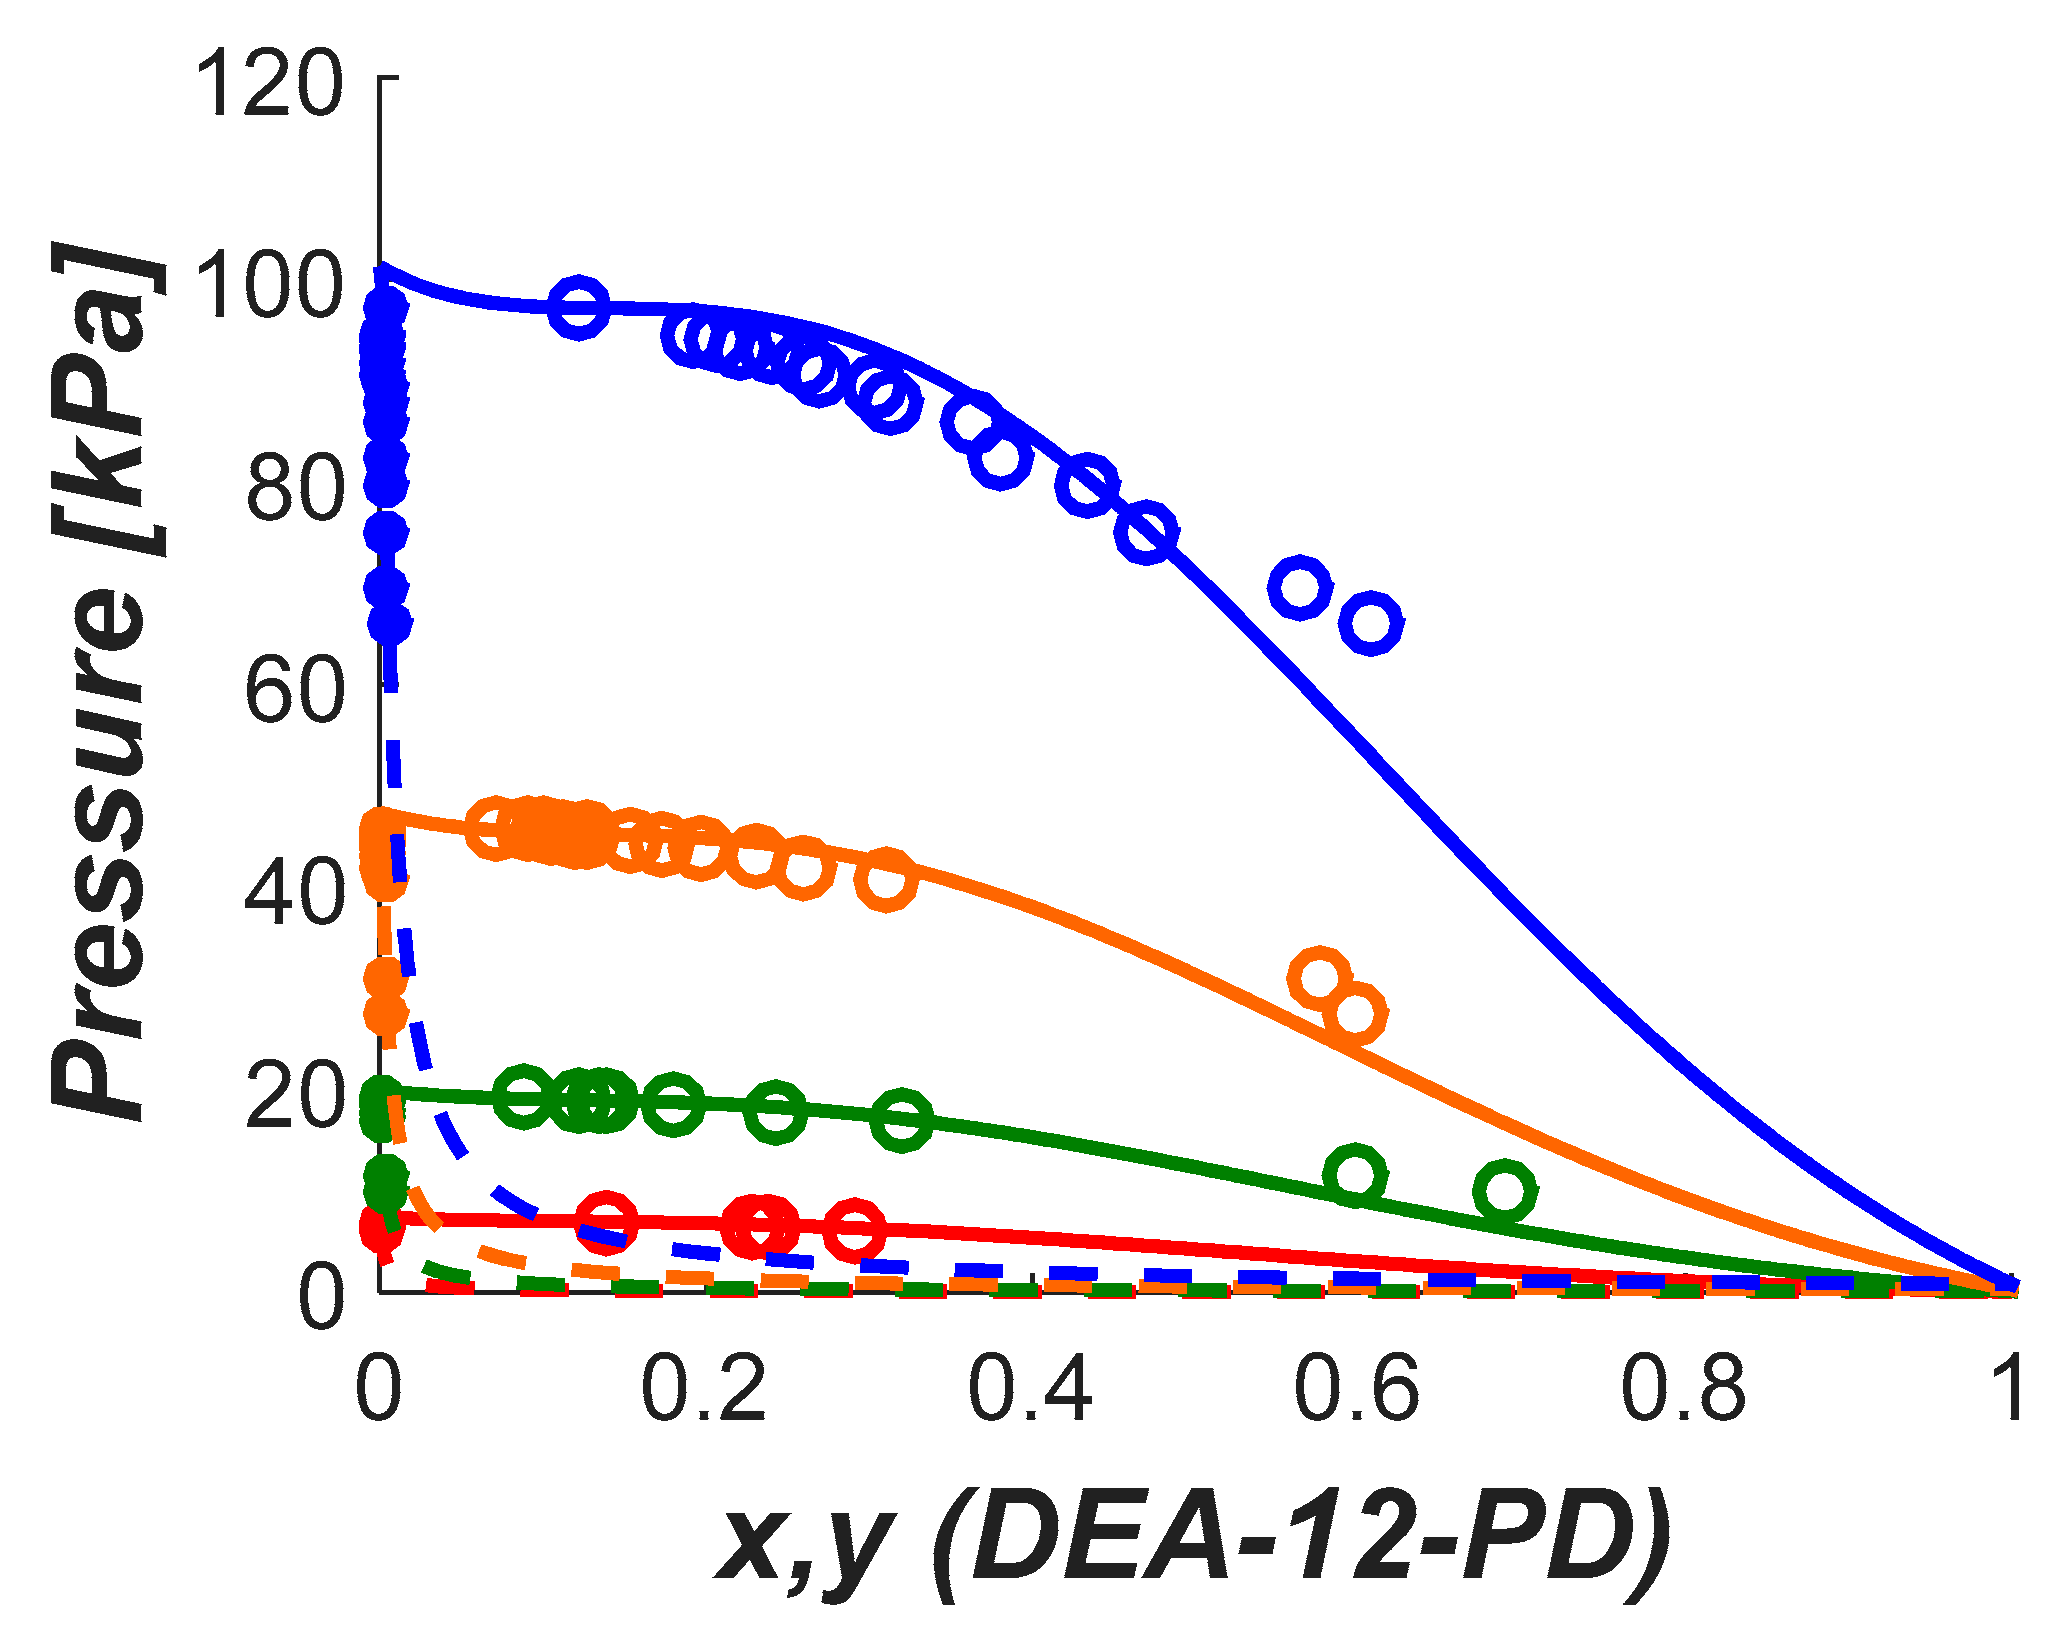
For DEA-12-PD, the calculated deviations in pressure and vapor phase composition are given in Table A7. It is possible to see that using the objective function I and II with (only pressure) and objective function II with produces similar results where the pressure is the variable that is prioritized. When using objective function I with , the optimization tries to balance the deviation in the pressure and the vapor phase composition. This is valid for all non-randomness parameters tested and this same behavior is observed for 12-HEPP. Since a good representation of the vapor phase is also important, we have chosen here to use the best results from the objective function I with . These results are highlighted in bold fonts in the respective tables in Appendix B. For DEA-12-PD the best results were found with a non-randomness parameter value of 0.1.
In Figure 6, it is seen that the model is able to represent the experimental data with good accuracy. It is also seen that the model deviates from the experimental data at high amine concentrations. This is caused due to the objective function used and the way we solve the phase equilibrium (for and ). The mol fraction of DEA-12-PD in the vapor phase is very small. Therefore, it is expected that the deviations calculated for the vapor phase composition is higher compared to the deviation in the pressure and a trade-off must be made. In this case, the deviation in pressure is reasonably good and calculated to be 4.6% while the deviation in the amine vapor composition is around 20%. It is possible to obtain deviations below 2% at the expense of higher deviations in the vapor phase composition (>40%).
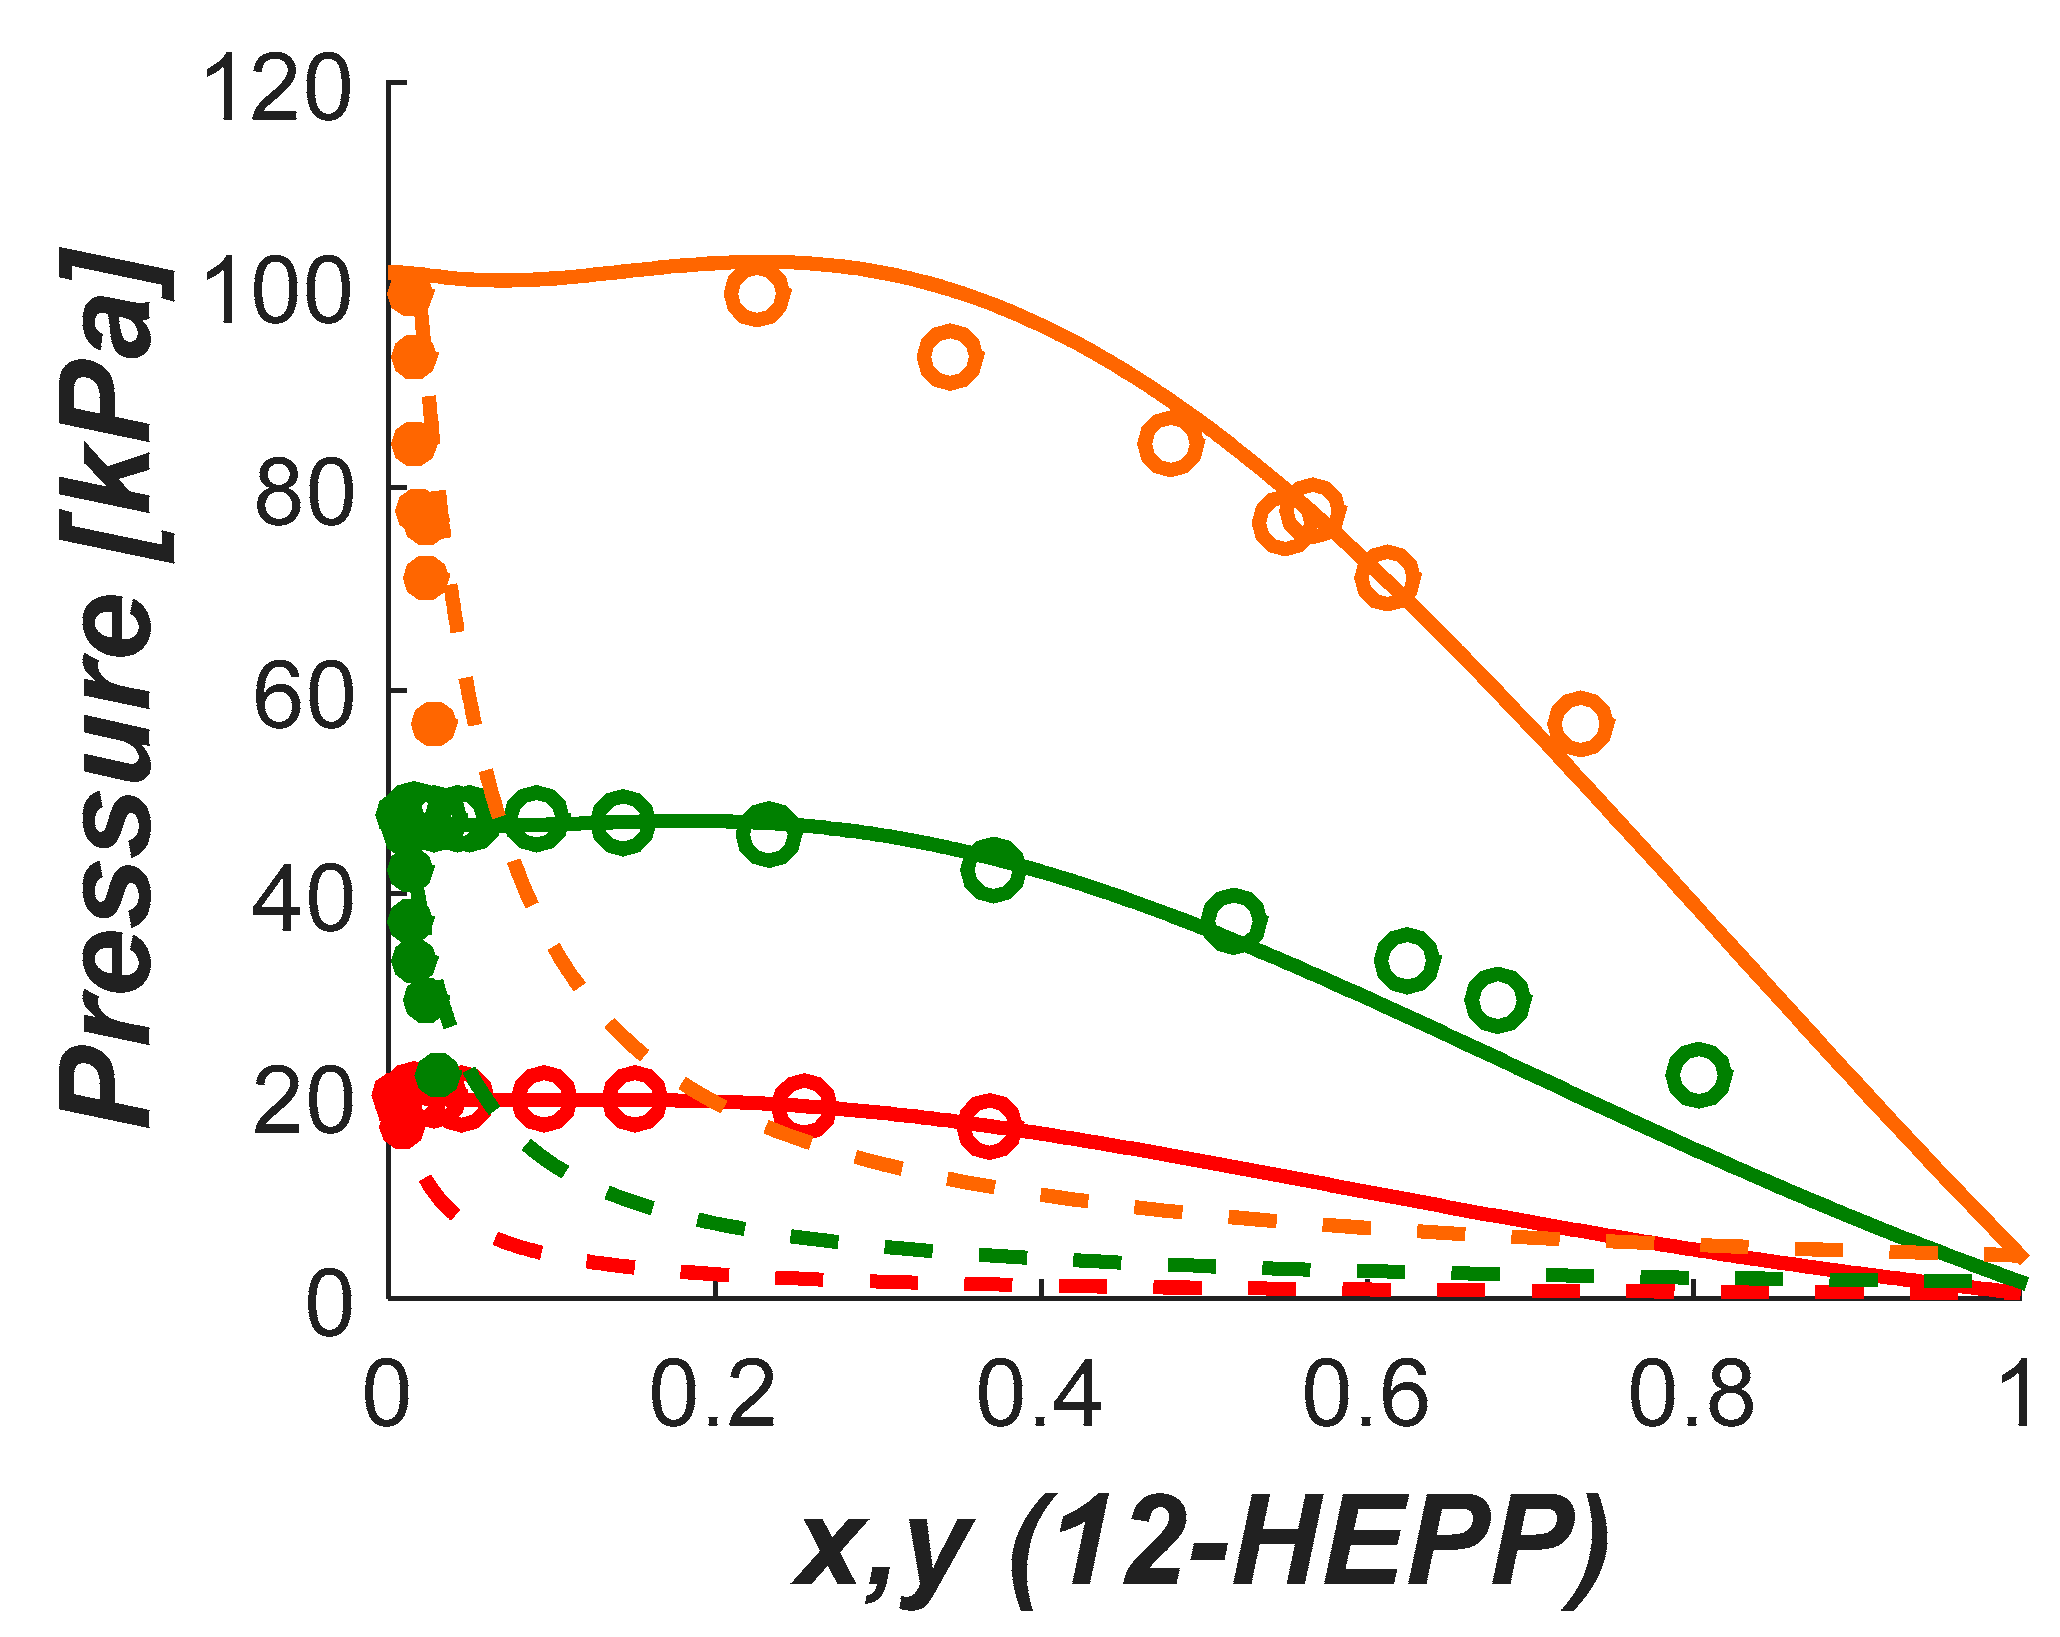
As done for DEA-12-PD, we chose the best results from objective function I with for showing the results of 12-HEPP. In this case, the best result was found using 0.3 as the non-randomness parameter value. Figure 7 shows the good agreement between the model and experimental data for the VLE of 12-HEPP. In aqueous solution, 12-HEPP seems to be more volatile than DEA-12-PD as the vapor phase concentrations are higher. It is also seen that the model does not capture the vapor phase compositions as nicely as for DEA-12-PD.
5. Conclusions
The VLE of two promising tertiary amines for CO2 capture were measured in the ebulliometer apparatus. The apparatus was previously used for this type of measurements with great accuracy. Prior to the measurements, the apparatus was validated by measuring VLE from known components (e.g., water and MEA). The results from the validation confirmed the accuracy and reliability of the ebulliometer. Pure component saturation pressures and VLE of aqueous solutions of DEA-12-PD and 12-HEPP were measured up to atmospheric pressure and temperatures ranging from 40 to 170 °C. The Antoine equation was used to correlate the vapour pressure of the pure component while the NRTL was used to calculate the activity coefficient of the components in aqueous solutions. Both models were able to correlate the experimental data with reasonably accuracy. The vapour pressure was correlated within 2% while the aqueous solutions deviations were lower than 5% deviation with respect to pressure.
Author Contributions
Conceptualization, D.D.D.P. and H.K.K.; methodology, D.D.D.P, H.K.K. and A.H.; supervision, D.D.D.P. and H.K.K.; experimental work, Z.Z. and V.B.; writing—original draft preparation, D.D.D.P. writing—review and editing, D.D.D.P, H.K.K., A.H. and V.B.
Funding
This work is supported by the Research Council of Norway through the CLIMIT program (Project No. 239789, Project: 3rd generation membrane contactor).
Acknowledgments
This work is supported by the Research Council of Norway through the CLIMIT program (Project No. 239789, Project: 3rd generation membrane contactor).
Conflicts of Interest
The authors declare no conflict of interest.
Appendix A. Experimental Data

Table A1.
VLE measurements of pure water.
| Temperature (°C) | Pressure (mbar) |
|---|---|
| Run 1 | |
| 40.47 | 76.9 |
| 50.05 | 124.9 |
| 59.72 | 197.9 |
| 71.93 | 339.9 |
| 79.89 | 472.9 |
| 89.81 | 697.8 |
| Run 2 | |
| 40.20 | 76.9 |
| 45.07 | 97.0 |
| 50.05 | 124.9 |
| 55.02 | 158.0 |
| 59.67 | 198.0 |
| 59.71 | 197.9 |
| 64.74 | 248.2 |
| 71.70 | 340.0 |
| 74.23 | 373.1 |
| 79.88 | 473.0 |
| 89.71 | 698.0 |
| 95.05 | 843.8 |
| 99.50 | 993.3 |
| Uncertainties : ; | |
Table A2.
VLE measurements of aqueous MEA solution.
| Temperature (°C) | Pressure (mbar) | ||
|---|---|---|---|
| 80.09 | 347.9 | 0.2400 | 0.0065 |
| 80.08 | 366.8 | 0.2072 | 0.0065 |
| 80.02 | 386.8 | 0.1706 | 0.0041 |
| 79.91 | 407.8 | 0.1301 | 0.0031 |
| 80.04 | 413.2 | 0.1210 | 0.0036 |
| 80.04 | 413.2 | 0.1254 | 0.0037 |
| 80.08 | 177.8 | 0.5485 | 0.0606 |
| 80.07 | 229.8 | 0.4417 | 0.0305 |
| 80.00 | 360.9 | 0.2156 | 0.0066 |
| 79.97 | 367.9 | 0.2050 | 0.0059 |
| Uncertainties : | |||
Table A3.
VLE measurements of pure DEA-12-PD.
| Temperature (°C) | Pressure (mbar) |
|---|---|
| Run 1 | |
| 120.63 | 21.9 |
| 130.56 | 33.9 |
| 140.62 | 51.9 |
| 150.90 | 79.6 |
| 160.03 | 118.0 |
| 167.49 | 147.90 |
| Run 2 | |
| 120.76 | 21.9 |
| 125.37 | 26.9 |
| 130.57 | 33.9 |
| 135.37 | 41.9 |
| 140.37 | 51.9 |
| 145.27 | 63.9 |
| 150.58 | 79.8 |
| 155.45 | 96.9 |
| 160.87 | 117.9 |
| 160.01 | 118.1 |
| 165.33 | 139.8 |
| 166.62 | 147.8 |
| 170.17 | 178.0 |
| Uncertainties u: ; | |
Table A4.
VLE measurements of pure 12-HEPP.
| Temperature (°C) | Pressure (mbar) |
|---|---|
| Run 1 | |
| 110.18 | 63.9 |
| 119.63 | 93.9 |
| 129.67 | 139.9 |
| 140.60 | 191.8 |
| 149.73 | 249.9 |
| 159.99 | 346.9 |
| 170.48 | 469.9 |
| Run 2 | |
| 109.92 | 63.9 |
| 114.89 | 77.9 |
| 119.50 | 93.9 |
| 125.02 | 117.9 |
| 129.85 | 139.9 |
| 133.70 | 163.0 |
| 140.60 | 191.8 |
| 146.91 | 232.9 |
| 149.51 | 249.9 |
| 155.09 | 297.8 |
| 159.53 | 346.9 |
| 165.08 | 407.8 |
| 170.08 | 469.9 |
| Uncertainties : ; | |
Table A5.
VLE measurements of aqueous DEA-12-PD solutions.
| Temperature (°C) | Pressure (mbar) | ||
|---|---|---|---|
| 39.9 | 67.8 | 0.1387 | 0.5108 |
| 40.0 | 64.7 | 0.2273 | 0.5389 |
| 40.0 | 63.9 | 0.2373 | 1.4471 |
| 40.0 | 61.8 | 0.2901 | 0.6525 |
| 60.0 | 191.3 | 0.0894 | 1.0125 |
| 60.1 | 189.8 | 0.1217 | 0.9385 |
| 60.0 | 187.8 | 0.1346 | 0.7198 |
| 60.1 | 187.8 | 0.1397 | 2.0186 |
| 60.0 | 183.8 | 0.1804 | 0.9504 |
| 60.0 | 177.8 | 0.2425 | 1.1351 |
| 60.0 | 169.8 | 0.3208 | 0.9970 |
| 60.0 | 115.9 | 0.5984 | 4.5560 |
| 60.0 | 98.8 | 0.6896 | 2.9977 |
| 80.1 | 459 | 0.0709 | 1.4838 |
| 80.1 | 456.9 | 0.0911 | 1.3258 |
| 80.1 | 455.9 | 0.1011 | 1.2130 |
| 80.1 | 455.1 | 0.1052 | 1.2267 |
| 80.0 | 452 | 0.1129 | 1.2505 |
| 79.9 | 450.8 | 0.1189 | 1.2185 |
| 80.1 | 452.8 | 0.1257 | 1.5474 |
| 80.0 | 451.6 | 0.1265 | 1.5299 |
| 80.1 | 447.6 | 0.1545 | 1.3028 |
| 80.1 | 443.8 | 0.1729 | 1.3533 |
| 80.1 | 438.8 | 0.1968 | 1.4011 |
| 80.0 | 430.8 | 0.2295 | 1.6782 |
| 80.0 | 416.9 | 0.2604 | 1.7641 |
| 79.9 | 408.9 | 0.3116 | 2.4360 |
| 80.0 | 309.9 | 0.5749 | 3.1407 |
| 80.0 | 275.7 | 0.5989 | 4.5964 |
| 100.0 | 970.3 | 0.1220 | 4.6368 |
| 100.0 | 945.7 | 0.1928 | 2.1977 |
| 100.0 | 941.7 | 0.2059 | 2.1810 |
| 100.1 | 934.7 | 0.2199 | 2.2293 |
| 100.1 | 927.8 | 0.2396 | 2.3456 |
| 100.0 | 917.7 | 0.2599 | 2.3428 |
| 100.0 | 907.7 | 0.2687 | 2.4043 |
| 100.0 | 892.8 | 0.3024 | 2.6490 |
| 100.0 | 877.8 | 0.3121 | 2.6125 |
| 100.0 | 857.8 | 0.3630 | 2.8391 |
| 100.0 | 823.8 | 0.3806 | 3.0852 |
| 99.9 | 797.8 | 0.4343 | 3.4116 |
| 100.0 | 751.8 | 0.4701 | 3.9239 |
| 100.0 | 693.8 | 0.5650 | 4.6368 |
| 100.0 | 661.8 | 0.6085 | 5.4423 |
| Uncertainties : ; ; | |||
Table A6.
VLE measurements of aqueous 12-HEPP solutions.
| Temperature (°C) | Pressure (mbar) | ||
|---|---|---|---|
| 60.1 | 199.9 | 0.0153 | 0.4533 |
| 60.0 | 198.9 | 0.0270 | 0.5184 |
| 60.0 | 197.9 | 0.0439 | 0.5600 |
| 60.0 | 196.9 | 0.0945 | 0.6209 |
| 60.0 | 194.9 | 0.1517 | 0.6483 |
| 60.1 | 189.9 | 0.2539 | 0.7201 |
| 60.0 | 167.9 | 0.3678 | 0.7671 |
| 80.1 | 475.9 | 0.0151 | 0.7230 |
| 80.1 | 474.9 | 0.0267 | 0.8355 |
| 80.1 | 473.9 | 0.0427 | 0.8787 |
| 80.1 | 473.2 | 0.0497 | 0.8782 |
| 80.1 | 471.9 | 0.0902 | 0.9223 |
| 80.1 | 468.9 | 0.1448 | 0.9106 |
| 80.0 | 458.9 | 0.2341 | 1.0020 |
| 80.1 | 420.9 | 0.3718 | 1.2120 |
| 80.0 | 373.9 | 0.5188 | 1.3502 |
| 80.1 | 334.9 | 0.6246 | 1.6388 |
| 80.0 | 294.9 | 0.6789 | 2.2342 |
| 80.0 | 218.9 | 0.8040 | 2.9447 |
| 99.9 | 989.8 | 0.2257 | 1.3699 |
| 100.0 | 928.8 | 0.3449 | 1.5584 |
| 100.0 | 841.8 | 0.4786 | 1.6826 |
| 100.0 | 764.8 | 0.5498 | 2.2406 |
| 100.0 | 776.8 | 0.5655 | 1.8139 |
| 100.0 | 711.8 | 0.6132 | 2.3135 |
| 100.0 | 566.9 | 0.7304 | 2.6767 |
| Uncertainties u: ; | |||
Appendix B. Optimization Results
Table A7.
NRTL optimized parameters for different non-randomness parameters and objective functions (where subscript 1 = H2O and 2 = DEA-12-PD).
Table A7.
NRTL optimized parameters for different non-randomness parameters and objective functions (where subscript 1 = H2O and 2 = DEA-12-PD).
| Objective Function | |||||
|---|---|---|---|---|---|
| Fobj I and | 0.1 | 12.9646 | −5.7143 | −2356.0227 | 884.9709 |
| Fobj II and | 7.8135 | −2.9628 | −734.9812 | 28.0716 | |
| Fobj I and | 5.8630 | −1.0737 | 784.5002 | −1043.7131 | |
| Fobj II and | 8.4954 | −3.0922 | −805.0346 | −13.5152 | |
| Fobj I and | 0.2 | 7.8175 | −2.3517 | −1333.2329 | 285.8961 |
| Fobj II and | 3.002 | 1.1663 | −64.1834 | −691.2653 | |
| Fobj I and | 6.5318 | 0.1695 | −401.8003 | −791.6571 | |
| Fobj II and | 5.5323 | −0.9082 | −526.1700 | −211.7622 | |
| Fobj I and | 0.3 | −5.9015 | 4.7508 | 7991.0547 | −1230.7370 |
| Fobj II and | 5.5323 | −0.9082 | −526.1700 | −211.7622 | |
| Fobj I and | 5.9285 | 1.0922 | −541.2799 | −847.2236 | |
| Fobj II and | 4.1419 | −0.6188 | −329.4525 | −89.4873 |
Table A8.
Calculated deviations for the optimized parameters for aqueous DEA-12-PD systems.
| Objective Function | AARD (%) | |||
|---|---|---|---|---|
| Pressure | ||||
| Fobj I and | 0.1 | 1.9859 | 0.0798 | 42.6090 |
| Fobj II and | 2.0665 | 0.1002 | 54.0863 | |
| Fobj I and | 4.6043 | 0.0534 | 19.5826 | |
| Fobj II and | 2.0626 | 0.0874 | 46.0847 | |
| Fobj I and | 0.2 | 1.8253 | 0.0859 | 45.1207 |
| Fobj II and | 3.6501 | 0.1459 | 80.3952 | |
| Fobj I and | 4.7029 | 0.0566 | 20.7956 | |
| Fobj II and | 1.9447 | 0.0904 | 46.9822 | |
| Fobj I and | 0.3 | 2.3678 | 0.1489 | 66.6363 |
| Fobj II and | 1.9447 | 0.0904 | 46.9822 | |
| Fobj I and | 4.9901 | 0.0594 | 21.5117 | |
| Fobj II and | 1.8613 | 0.0930 | 48.8845 | |
Table A9.
NRTL optimized parameters for different non-randomness parameters and objective functions (where subscript 1 = H2O and 2 = 12-HEPP).
Table A9.
NRTL optimized parameters for different non-randomness parameters and objective functions (where subscript 1 = H2O and 2 = 12-HEPP).
| Objective Function | |||||
|---|---|---|---|---|---|
| Fobj I and | 0.1 | −7.2665 | 3.0658 | 4466.2080 | −1939.0730 |
| Fobj II and | 9.5567 | −5.3598 | −1639.0083 | 1119.2290 | |
| Fobj I and | 8.7617 | 0.9294 | −155.6712 | −1646.4983 | |
| Fobj II and | 7.1458 | −3.3269 | −651.0712 | 328.9348 | |
| Fobj I and | 0.2 | −5.1771 | 2.3299 | 3092.4113 | −1182.4124 |
| Fobj II and | 6.4065 | −3.0141 | −1101.4384 | 758.2339 | |
| Fobj I and | 4.718 | 2.7861 | 263.5349 | −1603.8336 | |
| Fobj II and | 0.9967 | −1.1560 | 684.1510 | 145.7886 | |
| Fobj I and | 0.3 | 3.8504 | −2.5384 | −211.8262 | 732.1378 |
| Fobj II and | 2.2028 | −2.6463 | 107.1788 | 849.8800 | |
| Fobj I and | 0.3148 | 4.2127 | 1400.8632 | −1828.0520 | |
| Fobj II and | 4.3337 | −0.6368 | −502.0548 | 69.7773 |
Table A10.
Calculated deviations for the optimized parameters for aqueous 12-HEPP systems.
| Objective Function | AARD (%) | |||
|---|---|---|---|---|
| Pressure | ||||
| Fobj I and | 0.1 | 2.7415 | 0.9927 | 66.6669 |
| Fobj II and | 2.9052 | 0.9948 | 68.8495 | |
| Fobj I and | 6.6651 | 0.8018 | 39.9976 | |
| Fobj II and | 2.9547 | 0.9627 | 65.1831 | |
| Fobj I and | 0.2 | 2.5836 | 0.9912 | 65.4845 |
| Fobj II and | 2.7575 | 0.9960 | 68.7378 | |
| Fobj I and | 5.7172 | 0.8419 | 42.1513 | |
| Fobj II and | 3.0621 | 1.0516 | 71.6277 | |
| Fobj I and | 0.3 | 2.7795 | 0.9968 | 71.8631 |
| Fobj II and | 2.8971 | 1.0550 | 74.5644 | |
| Fobj I and | 4.7528 | 0.8633 | 43.7299 | |
| Fobj II and | 2.6826 | 0.9653 | 64.6265 | |
References
- Bernhardsen, I.M.; Krokvik, I.R.T.; Perinu, C.; Pinto, D.D.D.; Jens, K.J.; Knuutila, H.K. Influence of pKa on solvent performance of MAPA promoted tertiary amines. Int. J. Greenh. Gas Control 2018, 68, 68–76. [Google Scholar] [CrossRef]
- Pinto, D.D.D.; Zaidy, S.A.H.; Hartono, A.; Svendsen, H.F. Evaluation of a phase change solvent for CO2 capture: Absorption and desorption tests. Int. J. Greenh. Gas Control 2014, 28, 318–327. [Google Scholar] [CrossRef] [Green Version]
- Knuutila, H.K.; Rennemo, R.; Ciftja, A.F. New solvent blends for post-combustion CO2 capture. Green Energy Environ. 2019, 4, 439–452. [Google Scholar] [CrossRef]
- Wanderley, R.R.; Pinto, D.D.D.; Knuutila, H.K. Investigating opportunities for water-lean solvents in CO2 capture: VLE and heat of absorption in water-lean solvents containing MEA. Sep. Purif. Technol. 2020, 231, 115883. [Google Scholar] [CrossRef]
- Pinto, D.D.D.; Knuutila, H.; Fytianos, G.; Haugen, G.; Mejdell, T.; Svendsen, H.F. CO2 post combustion capture with a phase change solvent. Pilot plant campaign. Int. J. Greenh. Gas Control 2014, 31, 153–164. [Google Scholar] [CrossRef]
- Madan, T.; Van Wagener, D.H.; Chen, E.; Rochelle, G.T. Modeling pilot plant results for CO2 stripping using piperazine in two stage flash. Energy Procedia 2013, 37, 386–399. [Google Scholar] [CrossRef] [Green Version]
- Lin, Y.-J.; Chen, E.; Rochelle, G.T. Pilot plant test of the advanced flash stripper for CO2 capture. Faraday Discuss. 2016, 192, 37–58. [Google Scholar] [CrossRef]
- Ansaloni, L.; Rennemo, R.; Knuutila, H.K.; Deng, L. Development of membrane contactors using volatile amine-based absorbents for CO2 capture: Amine permeation through the membrane. J. Memb. Sci. 2017, 537, 272–282. [Google Scholar] [CrossRef]
- Hoff, K.A.; Svendsen, H.F. CO2 absorption with membrane contactors vs. packed absorbers-Challenges and opportunities in post combustion capture and natural gas sweetening. Energy Procedia 2013, 37, 952–960. [Google Scholar] [CrossRef] [Green Version]
- Van Holst, J.; Versteeg, G.F.; Brilman, D.W.F.; Hogendoorn, J.A. Kinetic study of CO2 with various amino acid salts in aqueous solution. Chem. Eng. Sci. 2009, 64, 59–68. [Google Scholar] [CrossRef]
- Bade, O.M.; Knudsen, J.N.; Gorset, O.; Askestad, I. Controlling Amine Mist Formation in CO2 Capture from Residual Catalytic Cracker (RCC) Flue Gas. Energy Procedia 2014, 63, 884–892. [Google Scholar] [CrossRef] [Green Version]
- Ansaloni, L.; Hartono, A.; Awais, M.; Knuutila, H.K.; Deng, L. CO2 capture using highly viscous amine blends in non-porous membrane contactors. Chem. Eng. J. 2019, 359, 1581–1591. [Google Scholar] [CrossRef]
- Chowdhury, F.A.; Yamada, H.; Higashii, T.; Goto, K.; Onoda, M. CO2 Capture by Tertiary Amine Absorbents: A Performance Comparison Study. Ind. Eng. Chem. Res. 2013, 52, 8323–8331. [Google Scholar] [CrossRef]
- Li, J.; Liu, H.; Liang, Z.; Luo, X.; Liao, H.; Idem, R.; Tontiwachwuthikul, P. Experimental study of the kinetics of the homogenous reaction of CO2 into a novel aqueous 3-diethylamino-1,2-propanediol solution using the stopped-flow technique. Chem. Eng. J. 2015, 270, 485–495. [Google Scholar] [CrossRef]
- Hartono, A.; Vevelstad, S.J.; Ciftja, A.; Knuutila, H.K. Screening of strong bicarbonate forming solvents for CO2 capture. Int. J. Greenh. Gas Control 2017, 58, 201–211. [Google Scholar] [CrossRef] [Green Version]
- Kim, H.; Hwang, S.J.; Lee, K.S. Novel Shortcut Estimation Method for Regeneration Energy of Amine Solvents in an Absorption-Based Carbon Capture Process. Environ. Sci. Technol. 2015, 49, 1478–1485. [Google Scholar] [CrossRef]
- Feron, P.; Conway, W.; Puxty, G.; Wardrefrence 32haugh, L.; Green, P.; Maher, D.; Fernandes, D.; Cousins, A.; Shiwang, G.; Lianbo, L.; et al. Amine Based Post-combustion Capture Technology Advancement for Application in Chinese Coal Fired Power Stations. Energy Procedia 2014, 63, 1399–1406. [Google Scholar] [CrossRef] [Green Version]
- Nakamura, S.; Yamanaka, Y.; Matsuyama, T.; Okuno, S.; Sato, H.; Iso, Y.; Huang, J. Effect of Combinations of Novel Amine Solvents, Processes and Packing at IHI’s Aioi Pilot Plant. Energy Procedia 2014, 63, 687–692. [Google Scholar] [CrossRef] [Green Version]
- Knudsen, J.N.; Andersen, J.; Jensen, J.N.; Biede, O. Evaluation of process upgrades and novel solvents for the post combustion CO2 capture process in pilot-scale. Energy Procedia 2011, 4, 1558–1565. [Google Scholar] [CrossRef] [Green Version]
- Kim, I.; Svendsen, H.F.; Børresen, E. Ebulliometric Determination of Vapor−Liquid Equilibria for Pure Water, Monoethanolamine, N-Methyldiethanolamine, 3-(Methylamino)-propylamine, and Their Binary and Ternary Solutions. J. Chem. Eng. Data 2008, 53, 2521–2531. [Google Scholar] [CrossRef]
- Trollebø, A.A.; Saeed, M.; Hartono, A.; Kim, I.; Svendsen, H.F. Vapour-Liquid Equilibrium for Novel Solvents for CO2 Post Combustion Capture. Energy Procedia 2013, 37, 2066–2075. [Google Scholar] [CrossRef] [Green Version]
- Aronu, U.E.; Hoff, K.A.; Svendsen, H.F. Vapor–liquid equilibrium in aqueous amine amino acid salt solution: 3-(methylamino)propylamine/sarcosine. Chem. Eng. Sci. 2011, 66, 3859–3867. [Google Scholar] [CrossRef]
- Monteiro, J.G.M.-S.; Pinto, D.D.D.; Zaidy, S.A.H.; Hartono, A.; Svendsen, H.F. VLE data and modelling of aqueous N,N-diethylethanolamine (DEEA) solutions. Int. J. Greenh. Gas Control 2013, 19, 432–440. [Google Scholar] [CrossRef] [Green Version]
- Peng, D.-Y.; Robinson, D.B. A New Two-Constant Equation of State. Ind. Eng. Chem. Fundam. 1976, 15, 59–64. [Google Scholar] [CrossRef]
- Renon, H.; Prausnitz, J.M. Local compositions in thermodynamic excess functions for liquid mixtures. AIChE J. 1968, 14, 135–144. [Google Scholar] [CrossRef]
- Pinto, D.D.D.; Johnsen, B.; Awais, M.; Svendsen, H.F.; Knuutila, H.K. Viscosity measurements and modeling of loaded and unloaded aqueous solutions of MDEA, DMEA, DEEA and MAPA. Chem. Eng. Sci. 2017, 171, 340–350. [Google Scholar] [CrossRef]
- Pinto, D.D.D.; Svendsen, H.F. An excess Gibbs free energy based model to calculate viscosity of multicomponent liquid mixtures. Int. J. Greenh. Gas Control 2015, 42, 494–501. [Google Scholar] [CrossRef]
- Pinto, D.D.D.; Monteiro, J.G.M.-S.; Bersås, A.; Haug-Warberg, T.; Svendsen, H.F. eNRTL Parameter Fitting Procedure for Blended Amine Systems: MDEA-PZ Case Study. Energy Procedia 2013, 37, 1613–1620. [Google Scholar] [CrossRef] [Green Version]
- Poli, R.; Kennedy, J.; Blackwell, T. Particle swarm optimization. An Overview. Swarm Intell. 2007, 1, 33–57. [Google Scholar] [CrossRef]
- Joback, K.G. A Unified Approach to Physical Property Estimation Using Multivariate Statistical Techniques; Massachusetts Institute of Technology: Cambridge, MA, USA, 1984. [Google Scholar]
- Hessen, E.T. Thermodynamic Models for CO2 Absorption; NTNU: Trondheim, Norway, 2010. [Google Scholar]
- DIPPR The DIPPR Information and Data Evaluation Manager for the Design Institute for Physical Properties. 2004. Available online: https://www.aiche.org/dippr (accessed on 16 December 2019).
- Klepáčová, K.; Huttenhuis, P.J.G.; Derks, P.W.J.; Versteeg, G.F. Vapor Pressures of Several Commercially Used Alkanolamines. J. Chem. Eng. Data 2011, 56, 2242–2248. [Google Scholar] [CrossRef] [Green Version]
Figure 1.
Molecular structure of: (a) 3-(diethylamino)-1,2-propanediol (DEA-12-PD) and (b) 1-(2-hydroxyethyl)piperidine (12-HEPP).
Figure 1.
Molecular structure of: (a) 3-(diethylamino)-1,2-propanediol (DEA-12-PD) and (b) 1-(2-hydroxyethyl)piperidine (12-HEPP).

Figure 2.
Saturation pressure of pure water. Measurements of: (o) This work, (Δ) [20], and (□) [33]. (-) Model calculated with Equation (10).

Figure 3.
Vapor liquid equilibrium of aqueous monoethanolamine (MEA) solutions at 80 °C. Experimental points from: (o) this work and (Δ) [20].
Figure 3.
Vapor liquid equilibrium of aqueous monoethanolamine (MEA) solutions at 80 °C. Experimental points from: (o) this work and (Δ) [20].

Figure 4.
Saturation pressure of DEA-12-PD. (o) Experimental points from this work and (-) model (Equation (1)).
Figure 4.
Saturation pressure of DEA-12-PD. (o) Experimental points from this work and (-) model (Equation (1)).

Figure 5.
Saturation pressure of 12-HEPP. (□) Experimental points from this work and (-) model (Equation (1)).
Figure 5.
Saturation pressure of 12-HEPP. (□) Experimental points from this work and (-) model (Equation (1)).

Figure 6.
VLE of DEA-12-PD at 40 (red), 60 (green), 80 (orange), and 100 °C (blue). (o) Experimental data from this work and (-) model.
Figure 6.
VLE of DEA-12-PD at 40 (red), 60 (green), 80 (orange), and 100 °C (blue). (o) Experimental data from this work and (-) model.

Figure 7.
VLE of 12-HEPP at 60 (red), 80 (green), and 100 (orange). (o) Experimental data from this work and (-) model.
Figure 7.
VLE of 12-HEPP at 60 (red), 80 (green), and 100 (orange). (o) Experimental data from this work and (-) model.

Table 1.
Chemicals used.
| Component | CAS | MW (g/mol) | Purity (%) | Supplier |
|---|---|---|---|---|
| MEA | 141-43-5 | 61.08 | ≥99 | Sigma–Aldrich |
| DEA-12-PD | 621-56-7 | 147.22 | ≥98 | TCI |
| 12-HEPP | 3040-44-6 | 129.20 | ≥99.5 | Sigma–Aldrich |
Table 2.
Thermodynamic and critical properties of compounds.
| Property | H2O a | DEA-12-PD | 12-HEPP d |
|---|---|---|---|
| (K) | - | 496.42 b | 475.11 b |
| (K) | 647.10 | 638.14 c | 655.71 c |
| (bar) | 220.64 | 34.60 c | 39.71 c |
| (cm3/mol) | 55.95 | 477.50 c | 406.50 c |
| ω | 0.3449 | 1.2470 c | 0.7562 c |
a DIPPR [32], b Estimated with Antoine equation (this work), c Joback group contribution method, d Critical properties estimated using non-ring tertiary amine.
Table 3.
Optimized parameters for the Antoine equation (Equation (1))— in K and in Pa.
| Parameter | DEA-12-PD | 12-HEPP |
|---|---|---|
| A | 12.3979 ± 0.4979 | 8.4381 ± 0.1639 |
| B | −4121.3892 ± 476.9160 | −1219.5810 ± 95.6280 |
| C | 61.1149 ± 27.6857 | −119.7961 ± 11.3916 |
| AARD (%) | 1.097 | 1.7831 |
© 2019 by the authors. Licensee MDPI, Basel, Switzerland. This article is an open access article distributed under the terms and conditions of the Creative Commons Attribution (CC BY) license (http://creativecommons.org/licenses/by/4.0/).
Share and Cite
MDPI and ACS Style
Pinto, D.D.D.; Zahraee, Z.; Buvik, V.; Hartono, A.; Knuutila, H.K. Vapor Liquid Equilibrium Measurements of Two Promising Tertiary Amines for CO2 Capture. Processes 2019, 7, 951. https://doi.org/10.3390/pr7120951
AMA Style
Pinto DDD, Zahraee Z, Buvik V, Hartono A, Knuutila HK. Vapor Liquid Equilibrium Measurements of Two Promising Tertiary Amines for CO2 Capture. Processes. 2019; 7(12):951. https://doi.org/10.3390/pr7120951
Chicago/Turabian StylePinto, Diego D. D., Znar Zahraee, Vanja Buvik, Ardi Hartono, and Hanna K. Knuutila. 2019. "Vapor Liquid Equilibrium Measurements of Two Promising Tertiary Amines for CO2 Capture" Processes 7, no. 12: 951. https://doi.org/10.3390/pr7120951
Note that from the first issue of 2016, this journal uses article numbers instead of page numbers. See further details here.