Diffusion in Binary Aqueous Solutions of Alcohols by Molecular Simulation


Chemical Process Engineering Department, Kazan National Research Technological University, Kazan 420063, Russia
*
Author to whom correspondence should be addressed.
Processes 2019, 7(12), 947; https://doi.org/10.3390/pr7120947
Submission received: 11 November 2019
/
Revised: 4 December 2019
/
Accepted: 8 December 2019
/
Published: 12 December 2019
(This article belongs to the Special Issue Thermodynamics: Modeling and Simulation)
Abstract
:Based on the molecular dynamics method, the calculations for diffusion coefficients were carried out in binary aqueous solutions of three alcohols: ethanol, isopropanol, and tert-butanol. The intermolecular potential TIP4P/2005 was used for water; and five force fields were analyzed for the alcohols. The force fields providing the best accuracy of calculation were identified based on a comparison of the calculated self-diffusion coefficients of pure alcohols with the experimental data for internal (Einstein) diffusion coefficients of alcohols in solutions. The temperature and concentration dependences of the interdiffusion coefficients were determined using Darken’s Equation. Transport (Fickian) diffusion coefficients were calculated using a thermodynamic factor determined by the non-random two-liquid (NRTL) and Willson models. It was demonstrated that for adequate reproduction of the experimental data when calculating the transport diffusion coefficients, the thermodynamic factor has to be 0.64. Simple approximations were obtained, providing satisfactory accuracy in calculating the concentration and temperature dependences of the transport diffusion coefficients in the studied mixtures.
1. Introduction
Physicochemical properties of aqueous solutions related to alcohols have for a long time been a subject of close study due to their wide application in various industries and human activity. It is known that aqueous solutions of alcohols, as a rule, are quite imperfect systems. This is due to specific intermolecular interactions that occur between the molecules of alcohol and water. The thermodynamic conditions of interphase equilibrium (vapor-liquid, liquid-liquid), as well as molecular transport coefficients, are important for the analysis of industrial processes related to water-alcohol solutions separation, such as distillation, membrane processes [1,2,3,4], etc. Currently, molecular simulation methods (molecular dynamics, Monte Carlo) are widely used to obtain these data. The accuracy of the data obtained as a result of molecular simulation is largely determined by the force fields used for description of intermolecular interactions. An experimental determination of interaction forces for two molecules is not possible yet [5]; therefore, to describe them, either the quantum-chemical methods [6,7,8] or simulative intermolecular potentials has to be used, where the parameters are identified by the accuracy of the macroscopic properties’ calculation. The latter method has an increased use; however, the question remains as to which set of macroproperties is necessary to determine parameters of the force fields so that they could be universal. Moreover, it is known that the same behavior of the thermodynamic properties of a system can be obtained for a certain set of force field parameters [9]. Currently, there are many large databases on force fields that are focused on the calculation of certain macroproperties, and many scientific papers are published every year where force fields are offered or specified for various substances. This research covers the force fields in the TraPPE database [10] and those offered in research works [11,12,13,14]. The parameters in those research papers, except for [14], have been determined by the thermodynamic conditions of phase equilibrium. The matter of interest is in finding the accuracy of description for the diffusion coefficients using these force fields, because the parameters adjusted according to the equilibrium properties are often unsuitable to describe kinetic properties [12,15].
In the present work, based on molecular dynamic simulation, the diffusion coefficients for water-alcohol mixtures of three alcohols were calculated: ethanol, isopropanol, and tert-butanol. Diffusion coefficients determine the rate of mass transfer processes, and are important for the design of industrial processes intended for the separation of mixtures. For the calculation of separation processes, the transport diffusion coefficients are essential, which determine the relative velocity of the components of the mixture. In addition, based on the mean square path of molecules in a pure liquid and in a mixture, self-diffusion coefficients and internal diffusion coefficients can be obtained, respectively. Establishing a relationship between transport and internal diffusion coefficients is an important task, since the former are easily determined from molecular dynamic simulation, while the latter are measured in labor-intensive physical experiments. In addition, the transport diffusion coefficients in liquid mixtures significantly depend on the composition and temperature, and insignificantly on pressure.
Molecular simulation was widely used to study a mixture of water-alcohol solutions [16]. An article in [17] provides a comparison of various force fields for ethanol in the simulation of water-alcohol solutions. The comparison was carried out for three force fields: OPLS, [18,19], TraPPE [10], and Kirkwood-Buff derived force field [20]; for water, the TIP4P [21] and SPC-E [22] force fields were used. Calculations of the diffusion coefficient at 298 K showed that all three force fields give an overestimation. Also, a review of the results for other force fields and the best description of the force field from [11] were carried out. In [23], simulations of the structure and diffusion coefficient of an ethanol-water mixture were presented. For water, the TIP4P force field was used for ethanol; a model adapted according to the works of Gotlib and Piotrovskaya [24] and Van Leeuwen [25] was used. The presented force field shows an overestimation of the self-diffusion coefficient of both ethanol and water. In addition, correlations for the coefficients linking the diffusion coefficients of the mixture with the diffusion coefficients of pure substances are proposed. However, in practice, the proposed expression is difficult to use, because molecular simulation is required to obtain the parameters of the proposed expressions. In [26], the diffusion coefficients were calculated at a temperature of 298 K for the TraPPE and TIP4P/2005 [27] force fields for ethanol and water, respectively; the calculated values show a slight overestimation. The authors of [28] present calculations of the diffusion coefficient of tert-butanol. The force field of OPLS and TIP4P indicates an overstatement. The best result can be achieved by replacing the force field for water with the TIP4P/2005 force field.
The analysis of literature data showed that the ethanol-water mixture has been more explored than aqueous solutions of isopropanol and tert-butanol. Moreover, they are, as a rule, limited to simulation at one temperature and, less often, to simulation at two temperatures. In most studies, only the coefficients of internal diffusion of self-diffusion are analyzed. It can be noted that the best description of self-diffusion coefficients for water is provided by the TIP4P/2005 force field. For alcohols, the situation with the selection of the force field is not so unambiguous.
In this paper, the main attention was paid to the possibility of an adequate description of the temperature and concentration dependences of the transport coefficients in water-alcohol mixtures. In the paper, based on a comparison of the results of molecular simulation with a physical experiment on the coefficients of self-diffusion and internal diffusion, we analyzed the accuracy of calculating several promising force fields selected on the basis of an analysis of literature data. Next, a relationship between the coefficients of internal and transport diffusion was determined, which ensures adequate reproduction of experimental data. The simulation results obtained over a wide range of temperatures and concentrations made it possible to propose a simple and reliable approximation of the concentration and temperature dependences of the transport coefficients of diffusion. In this work, the influence of structural characteristics and hydrogen bonds on kinetic characteristics will not be revealed. A similar analysis with the use of the all-atom potential for water-alcohol rats was carried out in [28,29,30,31,32,33,34,35,36,37].
2. Molecular Simulation
Molecular simulation was conducted using the GROMACS 2018 package (Stockholm University and the Royal Institute of Technology, Sweden) [38,39,40] under an NPT ensemble. The systems, which comprised of 4000 molecules, were simulated. The Nosé—Hoover thermostat was used to maintain constant temperature; for pressure—Parrinello-Rahman barostat. An integration step for equations of motion was 0.5 fs.
The simulation was conducted in the following sequence: generation of a system comprised of 4000 molecules. The cutoff radius of the intermolecular potential was 2 nm. The simulation was conducted at a temperature 100 K higher than the critical temperature for the given substance and at a pressure of 10,000 bar. Further, the temperature was decreased in several steps, and then the pressure was reduced to the specified values. Each stage took 500 ps. Upon reaching thermodynamic equilibrium, the motion of molecules was calculated over 2000 ps to average the physicochemical properties. Additional simulation information can be found in Supplementary Materials.
The value of the pure components’ self-diffusion coefficient and the components’ internal diffusion coefficient in the mixture was determined by the Einstein’s equation:
where τ is the simulation time, r is the atom position, ⟨...⟩ is averaging across all molecules.
3. Force Fields for Alcohols
To describe the intermolecular interaction of water, the TIP4P/2005 [27] force field was used. This force field, if compared to the others, demonstrated the best description of various macroproperties of pure water [41], including the self-diffusion coefficient.
Five united atoms of force fields have been used to describe the intermolecular interaction of the alcohols. The parameters of the used force fields are shown in Table 1. In parentheses are the names of the substances for calculation of which that data was used. In the table and further in the text, force fields have the following tags: FF-1 (TraPPE) [10], FF-2 from research work [11], FF-3 from research work [12], FF-4 from research work [13], and FF-5 from research work [14]. The cross terms in the potential of intermolecular interaction were determined according to the combining Lorentz Berthelot rules.
Two (FF-1 and FF-4) of the used force fields are classified as transferable, the rest were obtained for the individual alcohols: FF-2 for ethanol, FF-3 for isopropanol, and FF-5 for tert-butanol.
The difference in the molecular structure of the alcohols selected for the simulation was in a different number of CH3 groups, bound to a carbon atom, which had a link with the oxygen. In this case, the difference in parameters, for the transferred force fields, will be only for the CHn group directly bonded to the oxygen atom. For example, for FF-1, an increase in the number of CH3 groups in homologous series results in attractive energy decrease of the CHn group (ε/kB values for CH2, CH and C are equal to 46, 10, and 0.5 K respectively), and diameter increase of this group (σ values for CH2, CH and C are equal to 3.75, 3.95 and 5.8 Å, respectively). For the transferred force fields, it is associated with a contribution weakening of the inner group surrounded by CH3 and OH groups to the intermolecular van der Waals interactions.
FF-1, FF-2, and FF-4 are the force fields of alkanes; therefore, for the intermolecular interactions of alcohols, only the OH group parameters and the charge of the CHn group bound to the oxygen atom was selected. In the FF-3 force field, parameters were identified for all interaction groups in two stages: by vapor-liquid phase equilibrium—the distances between the interaction centers were adjusted to a more accurate description of the transport properties. Thus, the force field can only be used for isopropanol. The FF-5 force field is a distinctive one, where the parameters were determined from quantum chemical calculations for all interaction centers. This explains a significant deviation of the values for FF-5 parameters from the other force fields. For instance, the CH3 group has a small charge.
The force fields FF-2 and FF-4 are based on anisotropic form of the potential. Typically, when using the united atom force fields, the center of interaction is located on the carbon atom. In case of an anisotropic potential, the center of interaction shifts to hydrogen atoms and the distance l Å between the interaction centers varies. In this regard, with an increase in number of CH3 groups in the molecule, the contribution to the total interaction of the central group (C, CH) has a greater contribution, as compared to non-anisotropic potentials.
It should also be noted that in the force fields FF-2, FF-3, and FF-5, the molecule was rigid, and in the FF-1, FF-4, only bonding lengths were fixed (the potentials of valence and torsion angles are given).
A comparison of the calculated self-diffusion coefficients of alcohols with experimental data from research work [42] was conducted in the first stage. The comparison at atmospheric pressure is shown in Figure 1, Figure 2 and Figure 3. For ethanol and isopropanol, qualitative and quantitative alignment for both FF-1 and FF-2 force fields are used. However, force field FF-1 demonstrates a small overshooting. Similarly FF-1 was demonstrated for isopropanol (Figure 2). The best description of the experimental data for ethanol and isopropanol was demonstrated by force field FF-2 and FF-3, respectively. Owing to the acceptable description of self-diffusion coefficients of force fields FF-1, FF-2 for ethanol and of FF-1, FF-3 for isopropanol, all of these force fields have been applied for the study of mixtures.
The force fields FF-1, FF-4, and FF-5 have been used to simulate tert-butanol. FF-4 was the only force field with an acceptable description of the self-diffusion coefficient, demonstrating its slight lowering.
It should be noted that for the FF-1 force field, in the series from ethanol to tert-butanol, there was an increase in error for description related to the self-diffusion coefficient.
4. Diffusion Coefficients in Water-Alcohol Solutions
Several rigorous formulations for the description of diffusion in mixtures are known [43]. The formulations contain different diffusion coefficients: the transport diffusion coefficient in Fick’s equation, the mutual diffusion coefficients in Maxwell-Stefan’s expression, the Onsager coefficients L in relations of non-equilibrium thermodynamics.
To describe the diffusion in water-alcohol mixtures, the approach of independent diffusion for mixture components was applied, according to which the molar flow of each component is expressed as follows:
where, Di is the internal (Einstein) diffusion coefficient determined by Equation (1), μi is the chemical potential, v is velocity of component, w is velocity characterizing the movement of the system as a whole. For the one-component case, the velocity value w coincides with the convective velocity. Using this approach, it is easy to obtain expressions for the coefficient matrix of multicomponent diffusion in any reference system. Thus, in a particular case of the binary mixture, the reference system is set by velocity v:
where is the transferred attribute by the mole of a substance unit (volume, mass, etc.). The diffusion flow in a certain reference system, considering Equation (2), will have an expression as follows:
The mutual diffusion coefficient in this case is determined by the well-known Darken’s Equation:
Thus, using the known coefficients of internal diffusion, one can obtain the coefficients of mutual diffusion in any reference system. It should be noted that this approach has limitations related to the fact that in Darken’s Equation for the cross-correlations of the velocities of different molecules are not considered. As was demonstrated, the effects can indeed be neglected for weakly non-ideal systems; even then, [44,45].
The diffusion flow in Fick’s Equation is usually written either in the average molar reference system [46]:
or in the average volumetric:
In both cases, it can be shown that:
where is a thermodynamic factor.
For non-ideal solutions, it was revealed that the quantitative discrepancies of the mutual diffusion coefficients, calculated using the Darken’s equation with the experimental data, were obtained for example by the Taylor dispersion method. There are various options for adjustment of Equation (8) [47]. The simplest and, in many cases, adequate expression is [48]:
where the recommended value is α = 0.64
The adequacy of Equations (8) and (9) has been analyzed in this research based on data for internal diffusion coefficients related to the binary mixtures of three alcohols (ethanol, isopropanol, tert-butanol) with water.
As noted in many research works [47], the thermodynamic factor largely determines the behavior of the transport diffusion coefficient; therefore, it is desirable to minimize errors in calculation. Usually Γi is determined by the models to calculate the activity coefficients for vapor-liquid equilibrium. For water-alcohol mixtures, the most accurate calculations are provided by the non-random two-liquid (NRTL) [49], Willson [50], and Uniquac [51] models. However, even these models, with parameters being recommended in the literature, may have significant discrepancies in thermodynamic factor at close values of the calculated activity coefficients. For the ethanol-water mixture, significant discrepancies are observed for the NRTL и Willson models, and for mixtures of isopropanol and tredbutanol with water, the NRTL model gives a generally non-physical result— in a certain concentration range. After analyzing the calculation accuracy of vapor-liquid phase equilibrium conditions, it was decided that for ethanol-water, should be calculated according to the NRTL model, and for mixtures of isopropanol and tert-butanol with water, it should be done according to the Willson model. To calculate the activity coefficient of mixtures, the Aspen Hysys [52] (8.4, Aspen Technology Inc., MA, USA) package was used.
5. Ethanol-Water Mixture
Internal diffusion coefficients have been calculated under equilibrium conditions depending on the concentration and temperature for force fields FF-1 and FF-2. The results of the coefficients of internal ethanol and water in a mixture at T = 298 K, as compared to the experimental data [53,54], are shown in Figure 4. It can be seen that the qualitatively calculated data for both force fields are well aligned with the experiment. In this case, force field FF-1 shows the best accuracy for the coefficients of internal diffusion of water and shows slightly higher diffusion coefficients for alcohol. The FF-2 force field shows a reduction, as compared to the experimental data, both for water and ethanol.
Availability of experimental data for internal and transport diffusion coefficients of the ethanol-water mixture make it possible to objectively assess the adequacy of Darken’s equations. According to the analysis, Equation (8) provides lower transport diffusion coefficients, as compared to the experimental data obtained by the Taylor dispersion method [55,56]. However, the calculated data may differ from the experimental one by twice the value. Therefore, Darken’s Equation is not accurate for non-ideal systems, such as solutions of alcohols in water. The calculation accuracy can be improved if we use approach [55], where the thermodynamic factor is taken as 0.64, like in Equation (9). The results of such a comparison are shown in Figure 5, which also provides the calculated transport diffusion coefficients according to Equation (9) for force fields FF-1 and FF-2. It can be seen that the FF-1 force field is best aligned with the experiment; therefore, it was subsequently used to calculate the diffusion coefficients in the ethanol-water mixture for other temperatures.
Figure 6 provides the calculation results of mutual diffusion coefficients using Darken’s Equation (5). There is evidence of weak concentration dependence of these coefficients, excepting regions with low alcohol content. A comparison of the calculated transport diffusion coefficients according to Equation (9) and experimental data [56] is given in Figure 7; good alignment between the calculated and experimental data is visible.
Analysis of the temperature relationship to the coefficients of mutual diffusion has demonstrated its exponential nature. Considering the weak dependence of mutual diffusion coefficients concentration , the approximation was identified as:
The calculation results using Equation (10) are provided in Figure 7 in the form of lines. The deviation in the calculation of the transport diffusion coefficients DT for the ethanol-water mixture is no more than 10% for the temperature range 278–348 K and the entire concentration region, excluding regions with a low concentration of one of the components.
6. Isopropanol-Water Mixture
For the isopropanol-water mixture, calculations were carried out with the FF-3 force field. The experimental data on the internal diffusion coefficients are not known for this mixture. In [57], the transport diffusion coefficients in the isopropane-water mixture were measured on a large scale. The authors revealed an abnormal increase in the transport diffusion coefficient in the region of 0.2 mole fractions of water content in the mixture. However, it was demonstrated later [58] that such growth was absent. The authors of [59] state that when water content is less than 0.2 (which corresponds to mole fraction of 0.45), it is hard to interpret the results. In this regard, experimental data from [57] are provided without this interval.
Figure 8 represents a comparison of the transport diffusion coefficient in the isopropanol-water mixture at a temperature of 298 K for the FF-1 and FF-3 force fields with experimental data [57,58,59]. The thermodynamic factor in Equation (9) was calculated according to the Wilson model. The Figure 8 shows that the FF-3 force field has a lower value. Therefore, calculations are provided for the FF-1 force field with respect to the other temperatures.
For the isopropanol-water mixture, similar to that for ethanol, a weak concentration dependence of the mutual diffusion coefficient was observed. The temperature dependence analysis of the mutual diffusion coefficients, exclusive of the thermodynamic factor, results in the following approximation:
Figure 9 describes the calculation results for a pressure of 1 bar at various temperatures. The lines represent the results of the transport diffusion coefficient calculation by Equation (11). A good alignment between the calculation results and the experimental data is visible.
7. Tert-Butanol-Water Mixture
Figure 10 describes the simulation results of the internal diffusion coefficients for a mixture of tert-butanol and water at a temperature of 298 K using the FF-4 force field. Good alignment was noticed, when compared to the available experimental data [60,61].
Unfortunately, experimental data could not be found in the literature for the transport diffusion coefficient in a tert-butanol–water mixture. There was weak concentration dependence in calculations of mutual diffusion coefficients by Darken’s Equation (5). For the tert-butanol–water mixture, similar to the other mixtures reviewed above, the thermodynamic factor determines the concentration dependence of the transport diffusion coefficients. The temperature dependence analysis of the mutual diffusion coefficients, excluding the thermodynamic factor, results in approximation as follows:
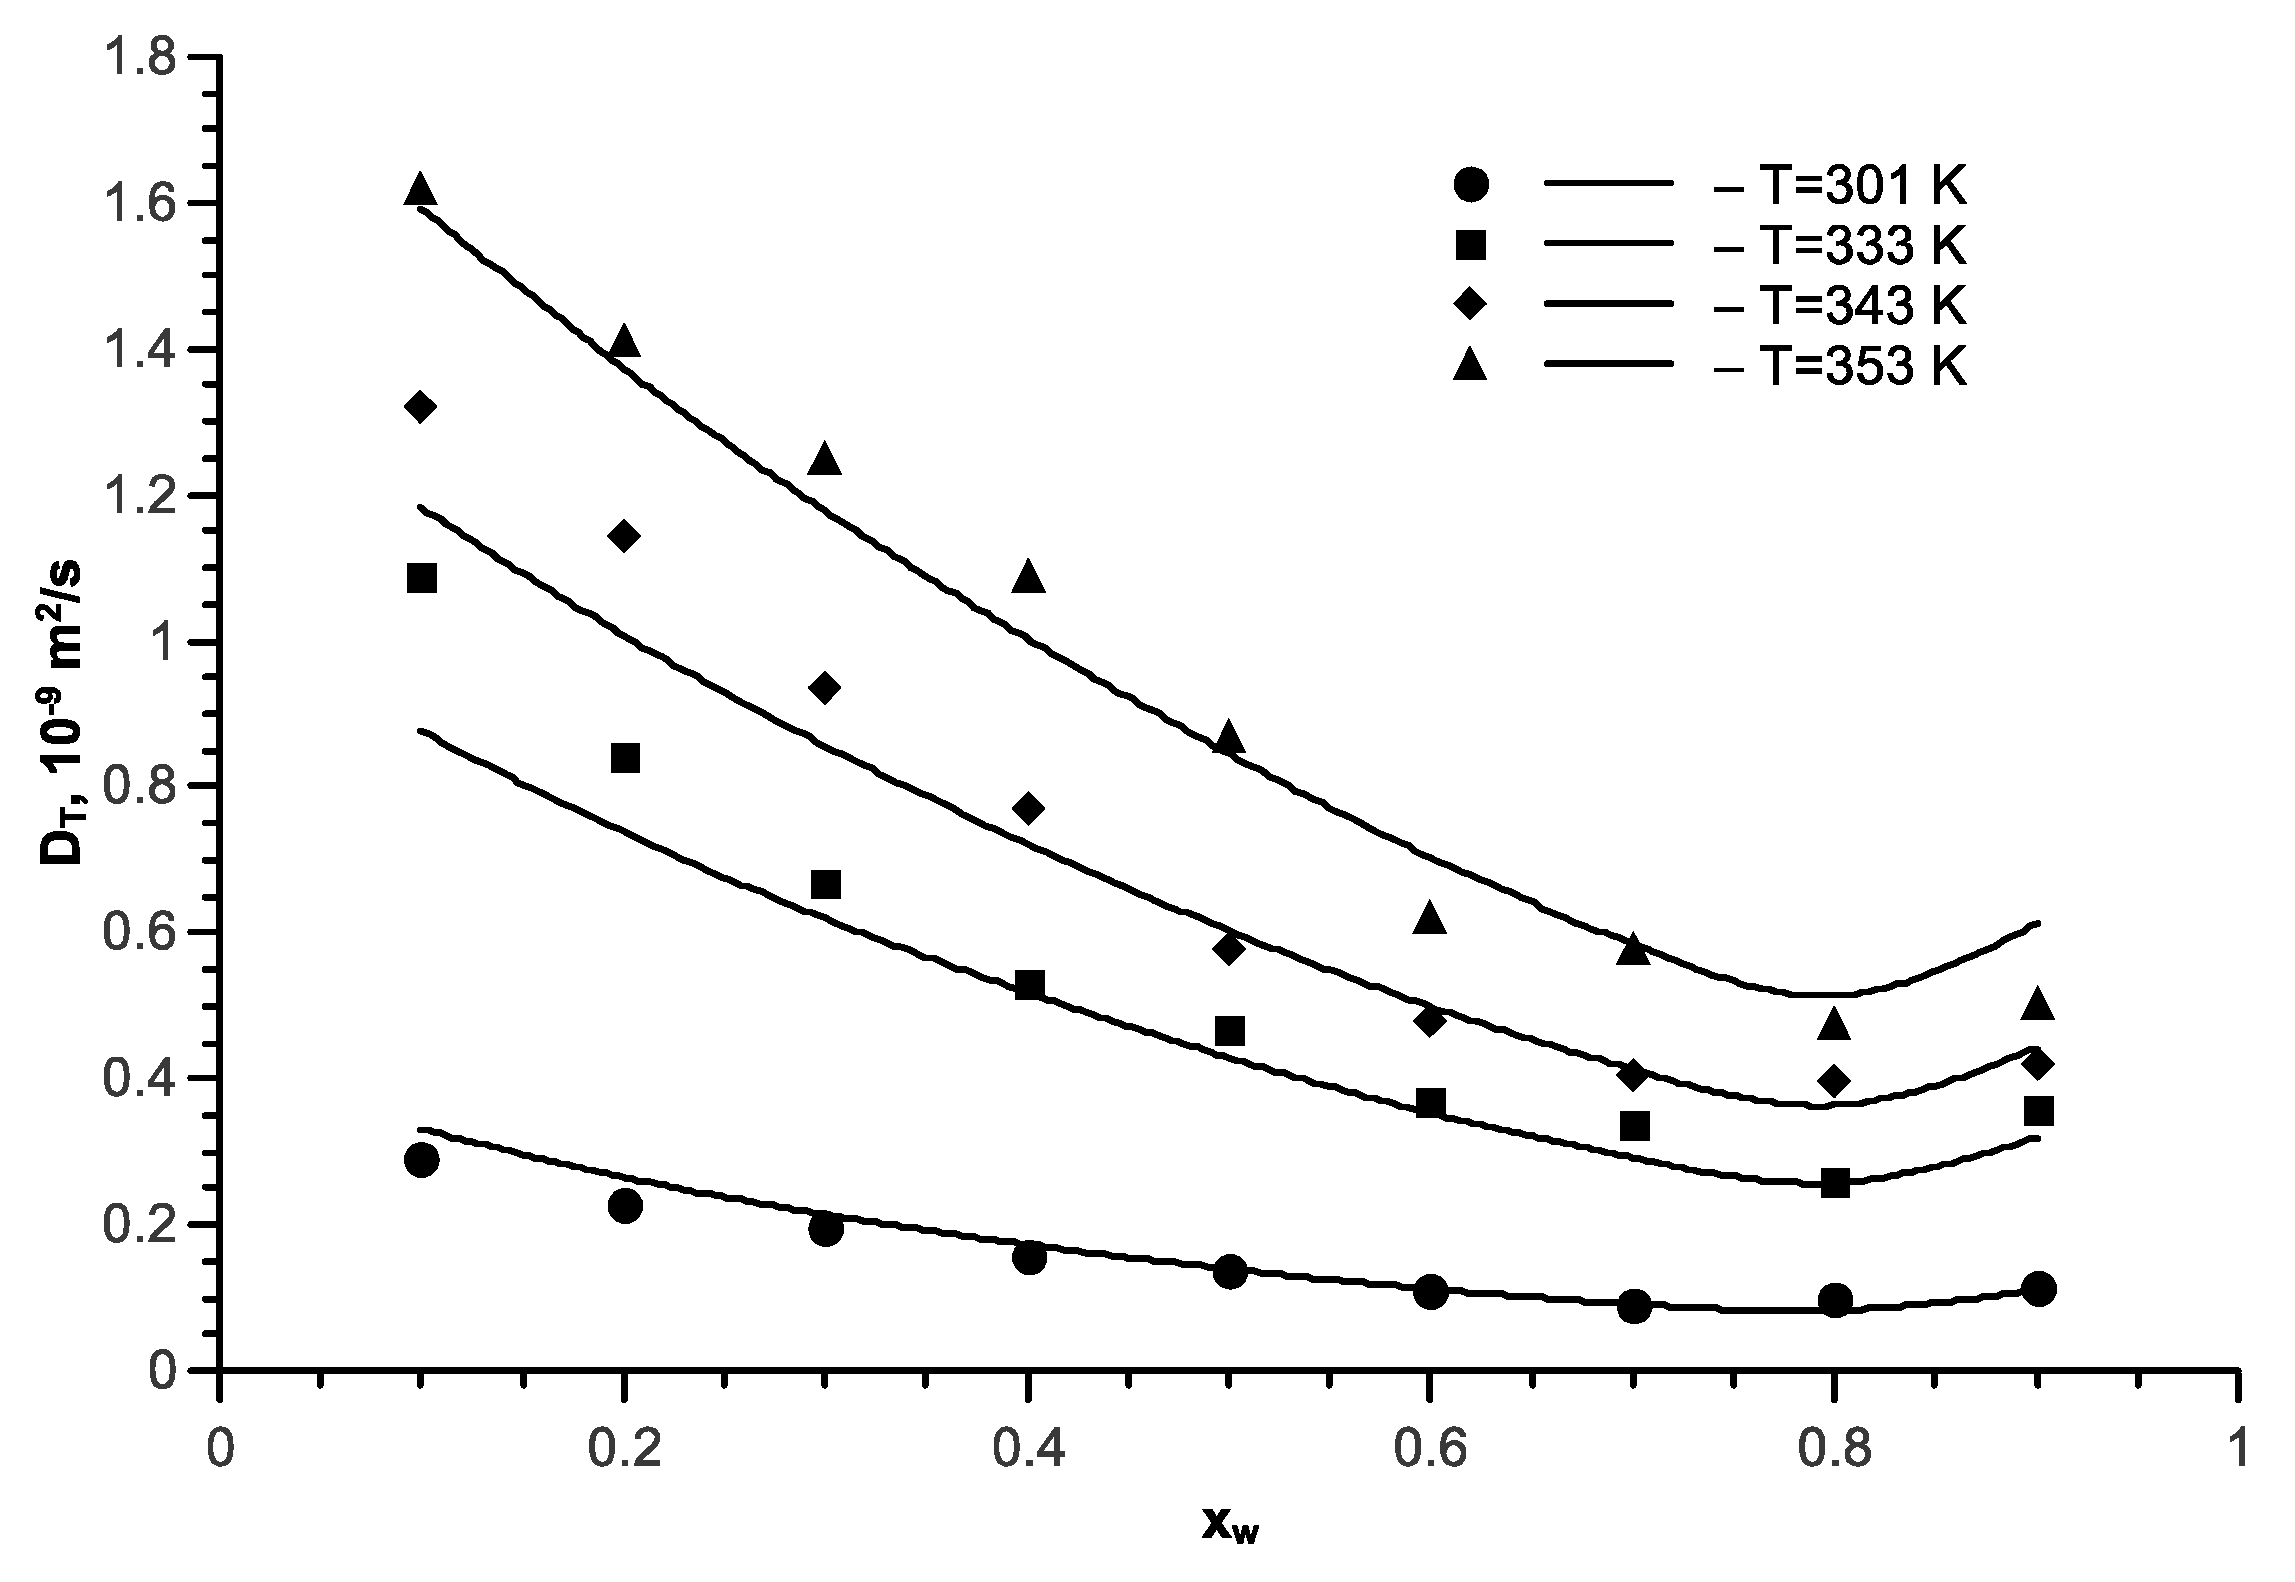
It can be seen that temperature dependence of the mutual diffusion coefficients for the tert-butanol–water mixture is stronger than that for the aqueous ethanol solution. Comparison of the simulation results with the calculation by Equation (12) are presented in Figure 11.
8. Conclusions
Five force fields for intermolecular interactions of three alcohols (ethanol, isopropanol, tert-butanol) were analyzed in this research work when calculating the self-diffusion coefficients and diffusion coefficients in aqueous solutions. Analysis of the calculated self-diffusion coefficients and the internal diffusion coefficients in aqueous solutions for ethanol has demonstrated that the FF-1 FF-2 force fields provide comparable satisfactory accuracy. Furthermore, the calculations with FF-2 lower the result of internal diffusion in the mixture and have greater accuracy for the ethanol self-diffusion coefficient. The values of the internal diffusion coefficients in the mixture obtained with FF-1 have greater accuracy for water and increased values for alcohol. As a result, the accuracy of calculation for the transport coefficients in the ethanol-water mixture by Equation (9) is higher for FF-1. In this regard, the use of the FF-1 force field is recommended for the ethanol-water mixture.
A similar result was found for the isopropanol-water mixture. Among the FF-1 and FF-3 force fields, the best description of a self-diffusion coefficient was provided by FF-3. However, when simulating the water mixtures, this force field demonstrated a lowering in transport diffusion coefficients. Among all studied force fields, the self-diffusion and transport diffusion coefficients for tert-butanol were provided with a good description only by the FF-4 force field.
A reason for the transport diffusion coefficient lowering could be due to the fact that the whole molecule is fixed in force fields FF-2 and FF-3, while the valence and torsion angles are established for force fields FF-1 and FF-4.
Thus, to calculate the internal diffusion coefficients and transport diffusion coefficients by Equation (9) for the ethanol-water and isopropanol-water mixtures, the FF-1 force field (TraPPE) was proven to be the best, and for the tert-butanol-water mixture, it was FF-4. For practical use, transport diffusion coefficients are important, which determine a rate of molecular mass transport by Fick’s Equation. It is promising to establish a behavior between internal diffusion coefficients (the calculation of which has a relatively low complexity) and mutual diffusion coefficients (Stefan-Maxwell). A version of such a behavior was established by Darken’s Equation, being a consequence of the approach for independent diffusion of the mixture components. This equation was analyzed in this research work. The ethanol-water mixture represents the most interest, for which experimental data were available for the internal and transport diffusion coefficients, as well as reliable data on the thermodynamic factor. It was demonstrated that Darken’s Equation provided lowered values for the transport diffusion coefficients. The accuracy of calculation can be improved when using an approach demonstrated in [47], where the thermodynamic factor is raised to the power of 0.64. It was further demonstrated that for all solutions of alcohols in water considered in the research, Equation (9) provides a good alignment between the calculated and the experimental transport diffusion coefficients. An analysis of Equation (9) shows that the main contribution to the concentration dependence of the transport coefficients of diffusion is made by the thermodynamic factor, and temperature dependence is determined by the behavior of the mutual diffusion coefficients calculated by the Darken relation. Assuming that the coefficients of mutual diffusion are independent of the composition, their temperature approximations were obtained for all the considered alcohol solutions—Equations (10)–(12). Thus, the transport coefficients of diffusion can be calculated using the relation in Equation (9) with the approximations in Equations (10)–(12). The error of this calculation does not exceed 10% in a wide concentration region, with the exception of small concentrations of water and alcohol.
Supplementary Materials
The following are available online at https://www.mdpi.com/2227-9717/7/12/947/s1, simulation data files.
Author Contributions
Conceptualization, A.K.; Software, I.A.; Formal Analysis, A.K; Data Curation, I.A.; Writing-Original Draft Preparation, A.K. and I.A.; Writing-Review & Editing A.K. and I.A.; Visualization I.A.
Funding
This research was funded by the Ministry of Science and Higher Education of the Russian Federation grant number 10.6784.2017/8.9.
Conflicts of Interest
The authors declare no conflict of interest.
References
- Raeisi, Z.; Moheb, A.; Sadeghi, M.; Abdolmaleki, A.; Alibouri, M. Titanate nanotubes—Incorporated poly(vinyl alcohol) mixed matrix membranes for pervaporation separation of water-isopropanol mixtures. Chem. Eng. Res. Des. 2019, 145, 99–111. [Google Scholar] [CrossRef]
- Dudek, G.; Turczyn, R.; Gnus, M.; Konieczny, K. Pervaporative dehydration of ethanol/water mixture through hybrid alginate membranes with ferroferic oxide nanoparticles. Sep. Purif. Technol. 2018, 193, 398–407. [Google Scholar] [CrossRef]
- Chaudhari, S.; Kwon, Y.; Moon, M.; Shon, M.; Park, Y.; Nam, S. Melamine-modified silicotungstic acid incorporated into the polyvinyl alcohol/polyvinyl amine blend membrane for pervaporation dehydration of water/isopropanol mixtures. Vacuum 2018, 147, 115–125. [Google Scholar] [CrossRef]
- Miyabe, K.; Guiochon, G. Measurement of the parameters of the mass transfer kinetics in high performance liquid chromatography. J. Sep. Sci. 2003, 26, 155–173. [Google Scholar] [CrossRef]
- Kaplan, I.G. Intermolecular Interactions: Physical Picture, Computational Methods, Model Potentials; Wiley: Hoboken, NJ, USA, 2006; ISBN 978-0-470-86332-9. [Google Scholar]
- Waldrop, J.M.; Song, B.; Patkowski, K.; Wang, X. Accurate ab initio potential for the krypton dimer and transport properties of the low-density krypton gas. J. Chem. Phys. 2015, 142, 204307. [Google Scholar] [CrossRef]
- Bock, S.; Bich, E.; Vogel, E. A new intermolecular potential energy surface for carbon dioxide from ab initio calculations. Chem. Phys. 2000, 257, 147–156. [Google Scholar] [CrossRef]
- Li, A.H.T.; Wang, Y.S.; Chao, S.D. Molecular Dynamics Simulations with ab Initio Force Fields: A Review of Case Studies on CH4, CCl4, CHF3, and CHCl3 Dimers. Multiscale Sci. Eng. 2019, 1, 26–33. [Google Scholar] [CrossRef] [Green Version]
- Anashkin, I.P.; Klinov, A.V. Determining the parameters of the potential of intermolecular interaction by the Zeno line. Russ. J. Phys. Chem. A 2013, 87, 1781–1788. [Google Scholar] [CrossRef]
- Chen, B.; Potoff, J.J.; Siepmann, J.I. Monte Carlo Calculations for Alcohols and Their Mixtures with Alkanes. Transferable Potentials for Phase Equilibria. 5. United-Atom Description of Primary, Secondary, and Tertiary Alcohols. J. Phys. Chem. B 2001, 105, 3093–3104. [Google Scholar] [CrossRef]
- Schnabel, T.; Vrabec, J.; Hasse, H. Henry’s law constants of methane, nitrogen, oxygen and carbon dioxide in ethanol from 273 to 498 K: Prediction from molecular simulation. Fluid Phase Equilibria 2005, 233, 134–143. [Google Scholar] [CrossRef] [Green Version]
- Muñoz-Muñoz, Y.M.; Guevara-Carrion, G.; Vrabec, J. Molecular Insight into the Liquid Propan-2-ol + Water Mixture. J. Phys. Chem. B 2018, 122, 8718–8729. [Google Scholar] [CrossRef] [PubMed]
- Ferrando, N.; Lachet, V.; Teuler, J.M.; Boutin, A. Transferable Force Field for Alcohols and Polyalcohols. J. Phys. Chem. B 2009, 113, 5985–5995. [Google Scholar] [CrossRef] [PubMed]
- Luk’yanchikova, I.A.; Ivlev, D.V.; Kiselev, M.G.; Al’per, G.A. Concentration dependence of the viscosity of tert-butanol-water mixtures: Physical experiment and computer simulation. Russ. J. Gen. Chem. 2004, 74, 1156–1162. [Google Scholar] [CrossRef]
- Muñoz-Muñoz, Y.M.; Guevara-Carrion, G.; Llano-Restrepo, M.; Vrabec, J. Lennard-Jones force field parameters for cyclic alkanes from cyclopropane to cyclohexane. Fluid Phase Equilibria 2015, 404, 150–160. [Google Scholar] [CrossRef]
- Janzen, T. On Diffusion Coefficients of Multicomponent Liquid Mixtures Predicted by Equilibrium Molecular Dynamics Simulation. Ph.D. Thesis, Technische Universität Berlin, Berlin, Germany, 2019. [Google Scholar]
- Mijaković, M.; Polok, K.D.; Kežić, B.; Sokolić, F.; Perera, A.; Zoranić, L. A comparison of force fields for ethanol–water mixtures. Mol. Simul. 2015, 41, 699–712. [Google Scholar] [CrossRef]
- Jorgensen, W.L.; Madura, J.D.; Swenson, C.J. Optimized intermolecular potential functions for liquid hydrocarbons. J. Am. Chem. Soc. 1984, 106, 6638–6646. [Google Scholar] [CrossRef]
- Jorgensen, W.L. Optimized intermolecular potential functions for liquid alcohols. J. Phys. Chem. 1986, 90, 1276–1284. [Google Scholar] [CrossRef]
- Jiao, Y. The Development of Accurate Force Fields for Protein Simulation. Ph.D. Thesis, Kansas State University, Manhattan, NY, USA, 2012. [Google Scholar]
- Jorgensen, W.L.; Chandrasekhar, J.; Madura, J.D.; Impey, R.W.; Klein, M.L. Comparison of simple potential functions for simulating liquid water. J. Chem. Phys. 1983, 79, 926. [Google Scholar] [CrossRef]
- Berendsen, H.J.C.; Grigera, J.R.; Straatsma, T.P. The missing term in effective pair potentials. J. Phys. Chem. 1987, 91, 6269–6271. [Google Scholar] [CrossRef]
- Zhang, C.; Yang, X. Molecular dynamics simulation of ethanol/water mixtures for structure and diffusion properties. Fluid Phase Equilibria 2005, 231, 1–10. [Google Scholar] [CrossRef]
- Gotlib, I.Y.; Piotrovskaya, E.M. Properties of Coexisting Phases for the Ethanol−Ethane Binary System by Computer Simulation. J. Phys. Chem. B 1999, 103, 7681–7686. [Google Scholar] [CrossRef]
- Van Leeuwen, M.E. Deviation from corresponding-states behaviour for polar fluids. Mol. Phys. 1994, 82, 383–392. [Google Scholar] [CrossRef]
- Ghoufi, A.; Artzner, F.; Malfreyt, P. Physical Properties and Hydrogen-Bonding Network of Water—Ethanol Mixtures from Molecular Dynamics Simulations. J. Phys. Chem. B 2016, 120, 793–802. [Google Scholar] [CrossRef] [PubMed]
- Abascal, J.L.F.; Vega, C. A general purpose model for the condensed phases of water: TIP4P/2005. J. Chem. Phys. 2005, 123, 234505. [Google Scholar] [CrossRef]
- Cerar, J.; Jamnik, A.; Pethes, I.; Temleitner, L.; Pusztai, L.; Tomšič, M. Structural, rheological and dynamic aspects of hydrogen-bonding molecular liquids: Aqueous solutions of hydrotropic tert-butyl alcohol. J. Colloid Interface Sci. 2019. [Google Scholar] [CrossRef] [Green Version]
- Pothoczki, S.; Pusztai, L.; Bakó, I. Molecular Dynamics Simulation Studies of the Temperature-Dependent Structure and Dynamics of Isopropanol-Water Liquid Mixtures at Low Alcohol Content. J. Phys. Chem. B 2019, 123, 7599–7610. [Google Scholar] [CrossRef] [Green Version]
- Pothoczki, S.; Pusztai, L.; Bakó, I. Variations of the Hydrogen Bonding and Hydrogen-Bonded Network in Ethanol-Water Mixtures on Cooling. J. Phys. Chem. B 2018, 122, 6790–6800. [Google Scholar] [CrossRef] [Green Version]
- Pothoczki, S.; Pusztai, L.; Bakó, I. Temperature dependent dynamics in water-ethanol liquid mixtures. J. Mol. Liq. 2018, 271, 571–579. [Google Scholar] [CrossRef] [Green Version]
- Lenton, S.; Rhys, N.H.; Towey, J.J.; Soper, A.K.; Dougan, L. Temperature-Dependent Segregation in Alcohol-Water Binary Mixtures Is Driven by Water Clustering. J. Phys. Chem. B 2018, 122, 7884–7894. [Google Scholar] [CrossRef]
- Méndez-Bermúdez, J.G.; Dominguez, H.; Temleitner, L.; Pusztai, L. On the Structure Factors of Aqueous Mixtures of 1-Propanol and 2-Propanol: X-Ray Diffraction Experiments and Molecular Dynamics Simulations. Phys. Status Solidi B 2018, 255, 1800215. [Google Scholar] [CrossRef] [Green Version]
- Gereben, O.; Pusztai, L. Investigation of the Structure of Ethanol-Water Mixtures by Molecular Dynamics Simulation I: Analyses Concerning the Hydrogen-Bonded Pairs. J. Phys. Chem. B 2015, 119, 3070–3084. [Google Scholar] [CrossRef] [PubMed]
- Overduin, S.D.; Patey, G.N. Comparison of simulation and experimental results for a model aqueous tert-butanol solution. J. Chem. Phys. 2017, 147, 024503. [Google Scholar] [CrossRef] [PubMed]
- Overduin, S.D.; Perera, A.; Patey, G.N. Structural behavior of aqueous t-butanol solutions from large-scale molecular dynamics simulations. J. Chem. Phys. 2019, 150, 184504. [Google Scholar] [CrossRef] [PubMed] [Green Version]
- Subramanian, D.; Klauda, J.B.; Collings, P.J.; Anisimov, M.A. Mesoscale Phenomena in Ternary Solutions of Tertiary Butyl Alcohol, Water, and Propylene Oxide. J. Phys. Chem. B 2014, 118, 5994–6006. [Google Scholar] [CrossRef]
- Hess, B.; Kutzner, C.; van der Spoel, D.; Lindahl, E. GROMACS 4: Algorithms for Highly Efficient, Load-Balanced, and Scalable Molecular Simulation. J. Chem. Theory Comput. 2008, 4, 435–447. [Google Scholar] [CrossRef] [Green Version]
- Van Der Spoel, D.; Lindahl, E.; Hess, B.; Groenhof, G.; Mark, A.E.; Berendsen, H.J.C. GROMACS: Fast, flexible, and free. J. Comput. Chem. 2005, 26, 1701–1718. [Google Scholar] [CrossRef]
- Abraham, M.J.; Murtola, T.; Schulz, R.; Páll, S.; Smith, J.C.; Hess, B.; Lindahl, E. GROMACS: High performance molecular simulations through multi-level parallelism from laptops to supercomputers. SoftwareX 2015, 1–2, 19–25. [Google Scholar] [CrossRef] [Green Version]
- Vega, C.; Abascal, J.L.F.; Conde, M.M.; Aragones, J.L. What ice can teach us about water interactions: A critical comparison of the performance of different water models. Faraday Discuss. 2009, 141, 251. [Google Scholar] [CrossRef] [Green Version]
- Suárez-Iglesias, O.; Medina, I.; Sanz, M.D.L.A.; Pizarro, C.; Bueno, J.L. Self-Diffusion in Molecular Fluids and Noble Gases: Available Data. J. Chem. Eng. Data 2015, 60, 2757–2817. [Google Scholar] [CrossRef]
- Dubbeldam, D.; Snurr, R.Q. Recent developments in the molecular modeling of diffusion in nanoporous materials. Mol. Simul. 2007, 33, 305–325. [Google Scholar] [CrossRef]
- Krishna, R.; van Baten, J.M. The Darken Relation for Multicomponent Diffusion in Liquid Mixtures of Linear Alkanes: An Investigation Using Molecular Dynamics (MD) Simulations. Ind. Eng. Chem. Res. 2005, 44, 6939–6947. [Google Scholar] [CrossRef]
- Liu, X.; Schnell, S.K.; Simon, J.M.; Bedeaux, D.; Kjelstrup, S.; Bardow, A.; Vlugt, T.J.H. Fick Diffusion Coefficients of Liquid Mixtures Directly Obtained From Equilibrium Molecular Dynamics. J. Phys. Chem. B 2011, 115, 12921–12929. [Google Scholar] [CrossRef] [PubMed]
- Taylor, R.; Krishna, R. Multicomponent Mass Transfer; Wiley series in chemical engineering; Wiley: New York, NY, USA, 1993; ISBN 978-0-471-57417-0. [Google Scholar]
- Guevara-Carrion, G.; Janzen, T.; Muñoz-Muñoz, Y.M.; Vrabec, J. Mutual diffusion of binary liquid mixtures containing methanol, ethanol, acetone, benzene, cyclohexane, toluene, and carbon tetrachloride. J. Chem. Phys. 2016, 144, 124501. [Google Scholar] [CrossRef] [PubMed]
- D’Agostino, C.; Mantle, M.D.; Gladden, L.F.; Moggridge, G.D. Prediction of binary diffusion coefficients in non-ideal mixtures from NMR data: Hexane-nitrobenzene near its consolute point. Chem. Eng. Sci. 2011, 66, 3898–3906. [Google Scholar] [CrossRef]
- Renon, H.; Prausnitz, J.M. Local compositions in thermodynamic excess functions for liquid mixtures. AIChE J. 1968, 14, 135–144. [Google Scholar] [CrossRef]
- Reid, R.C.; Prausnitz, J.M.; Sherwood, T.K. The Properties of Gases and Liquids, 3rd ed.; McGraw-Hill chemical engineering series; McGraw-Hill: New York, NY, USA, 1977; ISBN 978-0-07-051790-5. [Google Scholar]
- Abrams, D.S.; Prausnitz, J.M. Statistical thermodynamics of liquid mixtures: A new expression for the excess Gibbs energy of partly or completely miscible systems. AIChE J. 1975, 21, 116–128. [Google Scholar] [CrossRef]
- Aspen HYSYS. Available online: https://www.aspentech.com/en/products/engineering/aspen-hysys (accessed on 10 November 2019).
- Harris, K.R.; Newitt, P.J.; Derlacki, Z.J. Alcohol tracer diffusion, density, NMR and FTIR studies of aqueous ethanol and 2,2,2-trifluoroethanol solutions at 25 °C. J. Chem. Soc. Faraday Trans. 1998, 94, 1963–1970. [Google Scholar] [CrossRef]
- Price, W.S.; Ide, H.; Arata, Y. Solution Dynamics in Aqueous Monohydric Alcohol Systems. J. Phys. Chem. A 2003, 107, 4784–4789. [Google Scholar] [CrossRef]
- Harris, K.R.; Goscinska, T.; Lam, H.N. Mutual diffusion coefficients for the systems water-enthanol and water-propan-1-ol at 25 °C. J. Chem. Soc. Faraday Trans. 1993, 89, 1969–1974. [Google Scholar] [CrossRef]
- Pratt, K.C.; Wakeham, W.A. The Mutual Diffusion Coefficient of Ethanol-Water Mixtures: Determination by a Rapid, New Method. Proc. R. Soc. Math. Phys. Eng. Sci. 1974, 336, 393–406. [Google Scholar] [CrossRef]
- Pratt, K.C.; Wakeham, W.A. The Mutual Diffusion Coefficient for Binary Mixtures of Water and the Isomers of Propanol. Proc. R. Soc. Math. Phys. Eng. Sci. 1975, 342, 401–419. [Google Scholar] [CrossRef]
- Leaist, D.G.; Deng, Z. Doubling of the apparent rates of diffusion of aqueous propanols near compositions of maximum refractive index. J. Phys. Chem. 1992, 96, 2016–2018. [Google Scholar] [CrossRef]
- Mialdun, A.; Yasnou, V.; Shevtsova, V.; Königer, A.; Köhler, W.; Alonso de Mezquia, D.; Bou-Ali, M.M. A comprehensive study of diffusion, thermodiffusion, and Soret coefficients of water-isopropanol mixtures. J. Chem. Phys. 2012, 136, 244512. [Google Scholar] [CrossRef]
- Harris, K.R.; Newitt, P.J. Diffusion and Structure in Water-Alcohol Mixtures: Water + tert-Butyl Alcohol (2-Methyl-2-Propanol). J. Phys. Chem. A 1999, 103, 6508–6513. [Google Scholar] [CrossRef]
- Kipkemboi, P.K.; Easteal, A.J. Self-Diffusion Coefficients of Each Component in Water+t-Butyl Alcohol and Water+t-Butylamine Binary Mixtures. Bull. Chem. Soc. Jpn. 1994, 67, 2956–2961. [Google Scholar] [CrossRef]
Figure 1.
Temperature dependence of the ethanol self-diffusion coefficient; open symbols represent the experimental data [42], full symbols represent molecular dynamics simulation.
Figure 1.
Temperature dependence of the ethanol self-diffusion coefficient; open symbols represent the experimental data [42], full symbols represent molecular dynamics simulation.

Figure 2.
Temperature dependence of the isopropanol self-diffusion coefficient; open symbols represent experimental data [42], full symbols represent molecular dynamics simulation.
Figure 2.
Temperature dependence of the isopropanol self-diffusion coefficient; open symbols represent experimental data [42], full symbols represent molecular dynamics simulation.

Figure 3.
Temperature dependence of the terbutanol self-diffusion coefficient; open symbols represent experimental data [42], full symbols represent molecular dynamics simulation.
Figure 3.
Temperature dependence of the terbutanol self-diffusion coefficient; open symbols represent experimental data [42], full symbols represent molecular dynamics simulation.

Figure 4.
The internal diffusion coefficients for ethanol (a) and water (b) in a mixture as a function of the water mole fraction at T = 298 K and p = 1 bar; open symbols are the experimental data [53,54], full symbols are the simulation results.
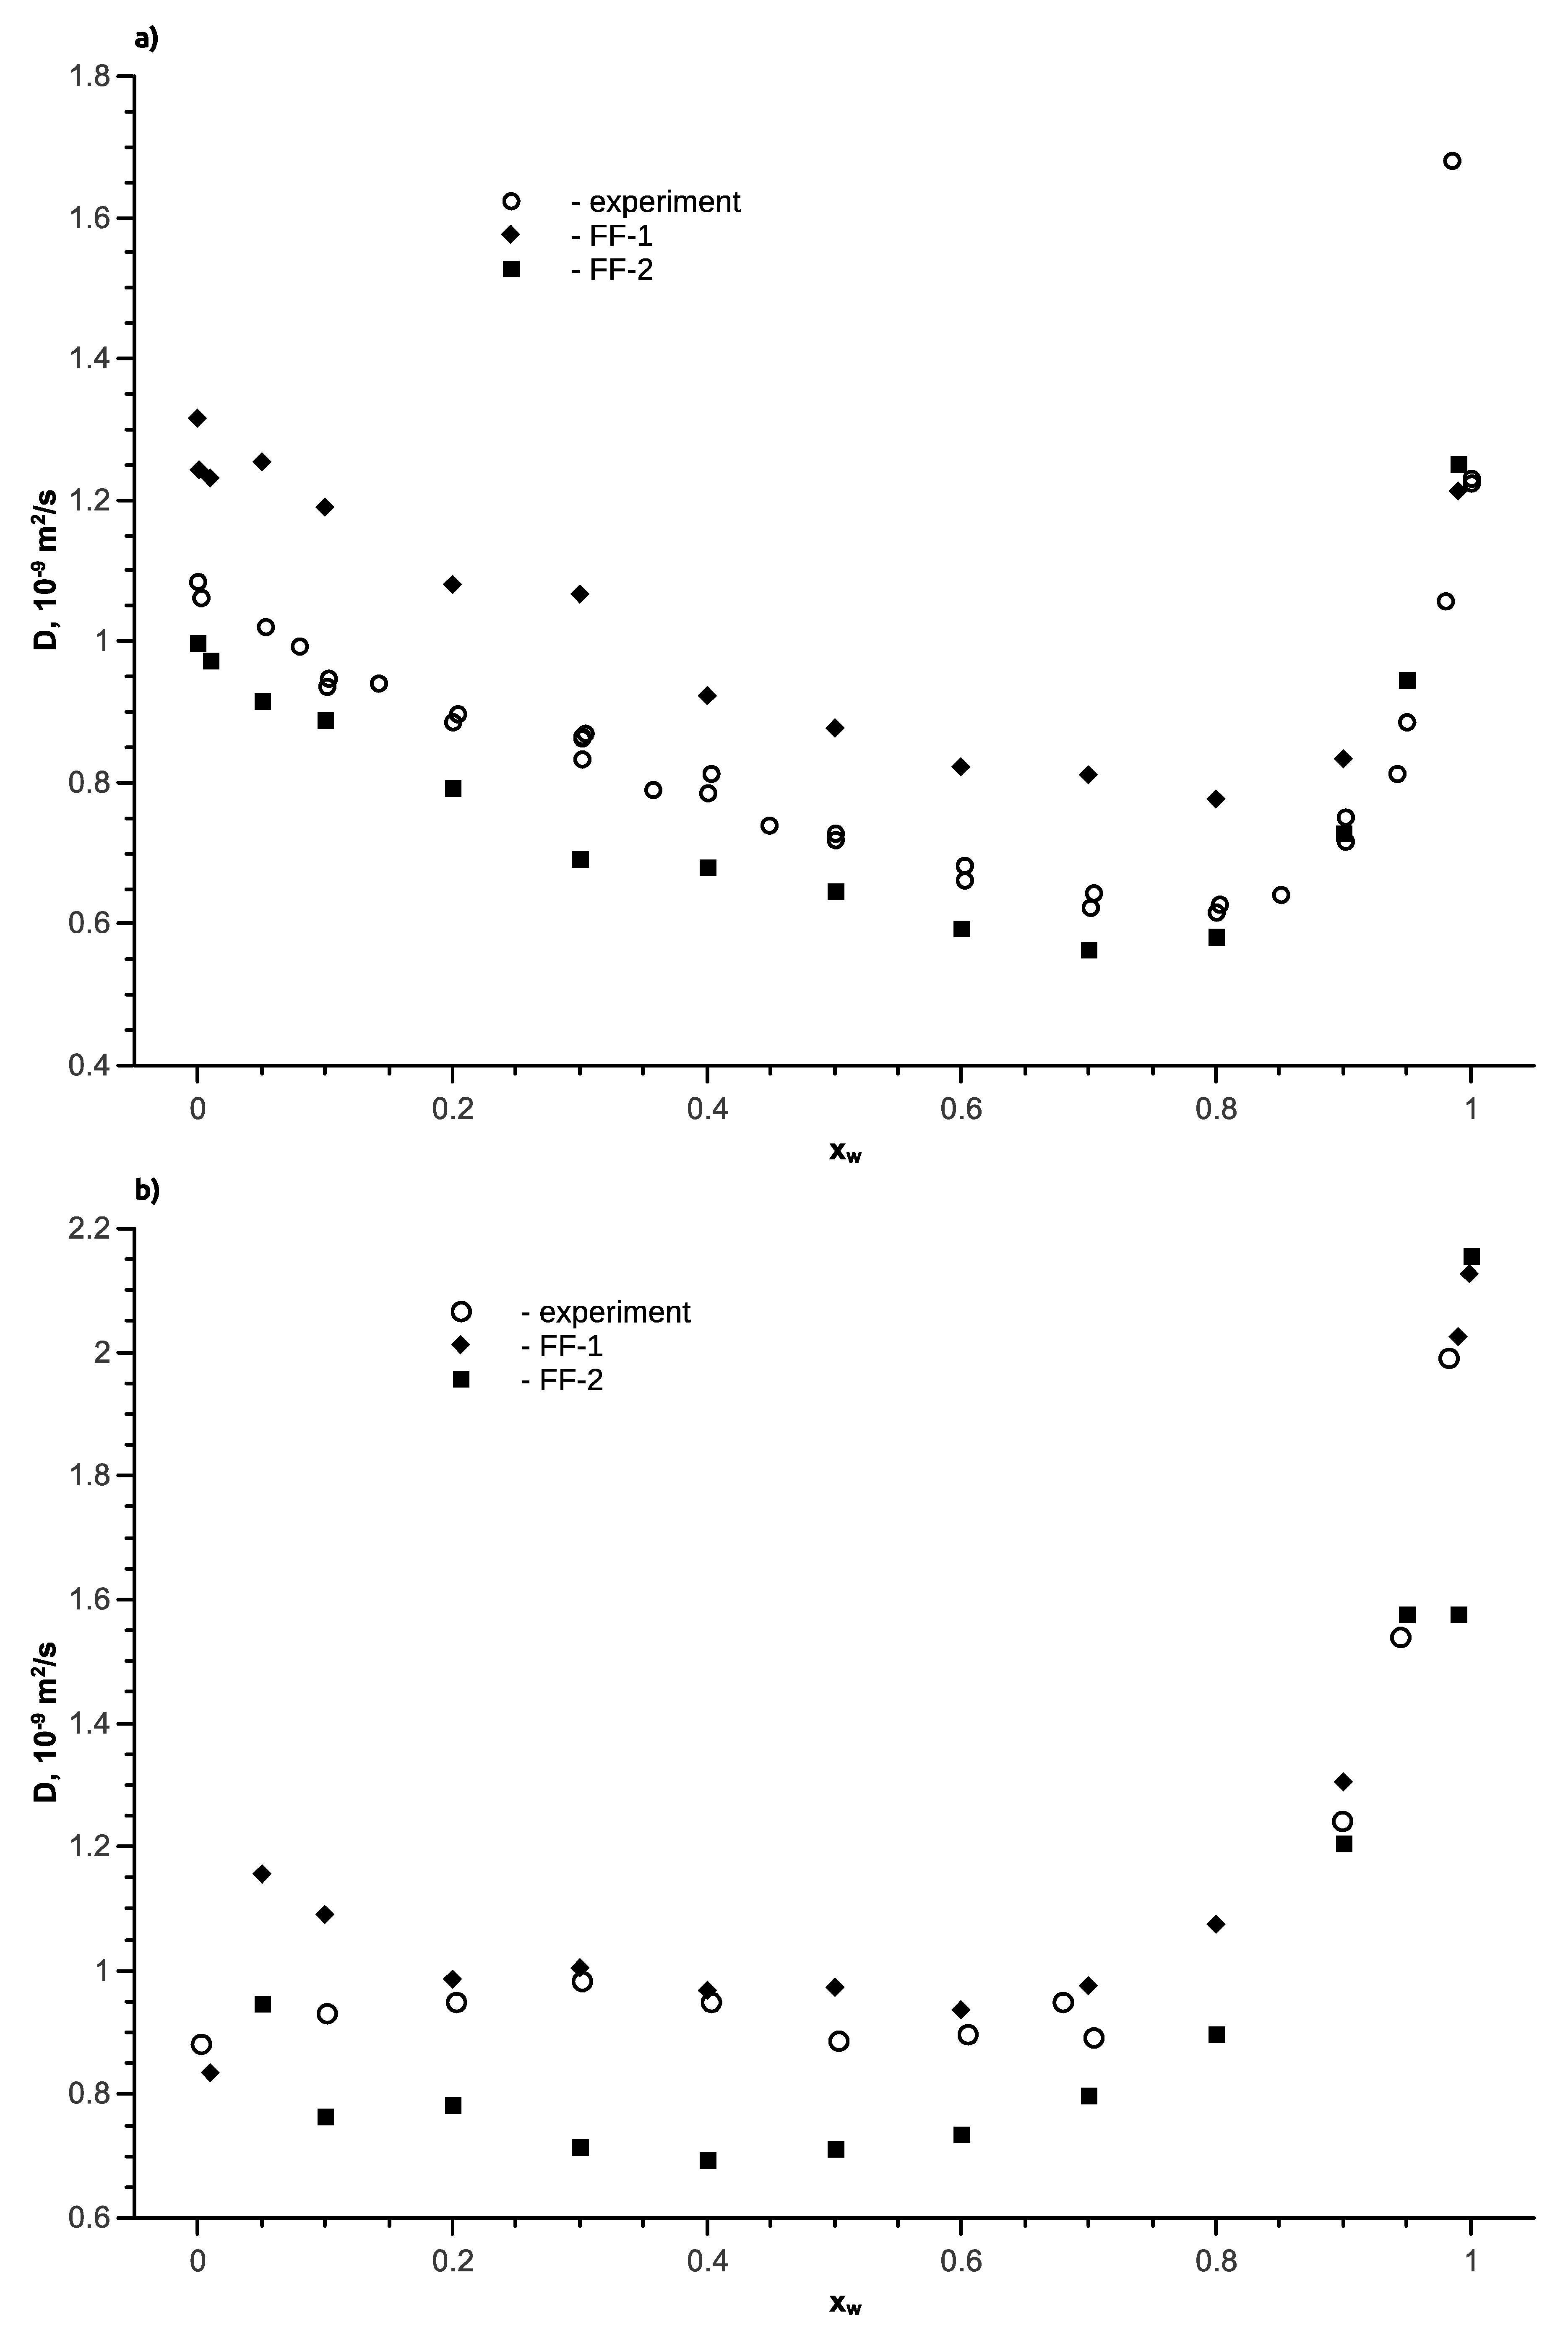
Figure 5.
The transport diffusion coefficient for the water-ethanol mixture as a function of the water mole fraction at T = 298 K, p = 1 bar; open symbols are the experimental data [54,56] (open triangles are the diffusion coefficients calculated by Equation (9) based on experimental data [53] and the non-random two-liquid (NRTL) model), full symbols are the simulation results.
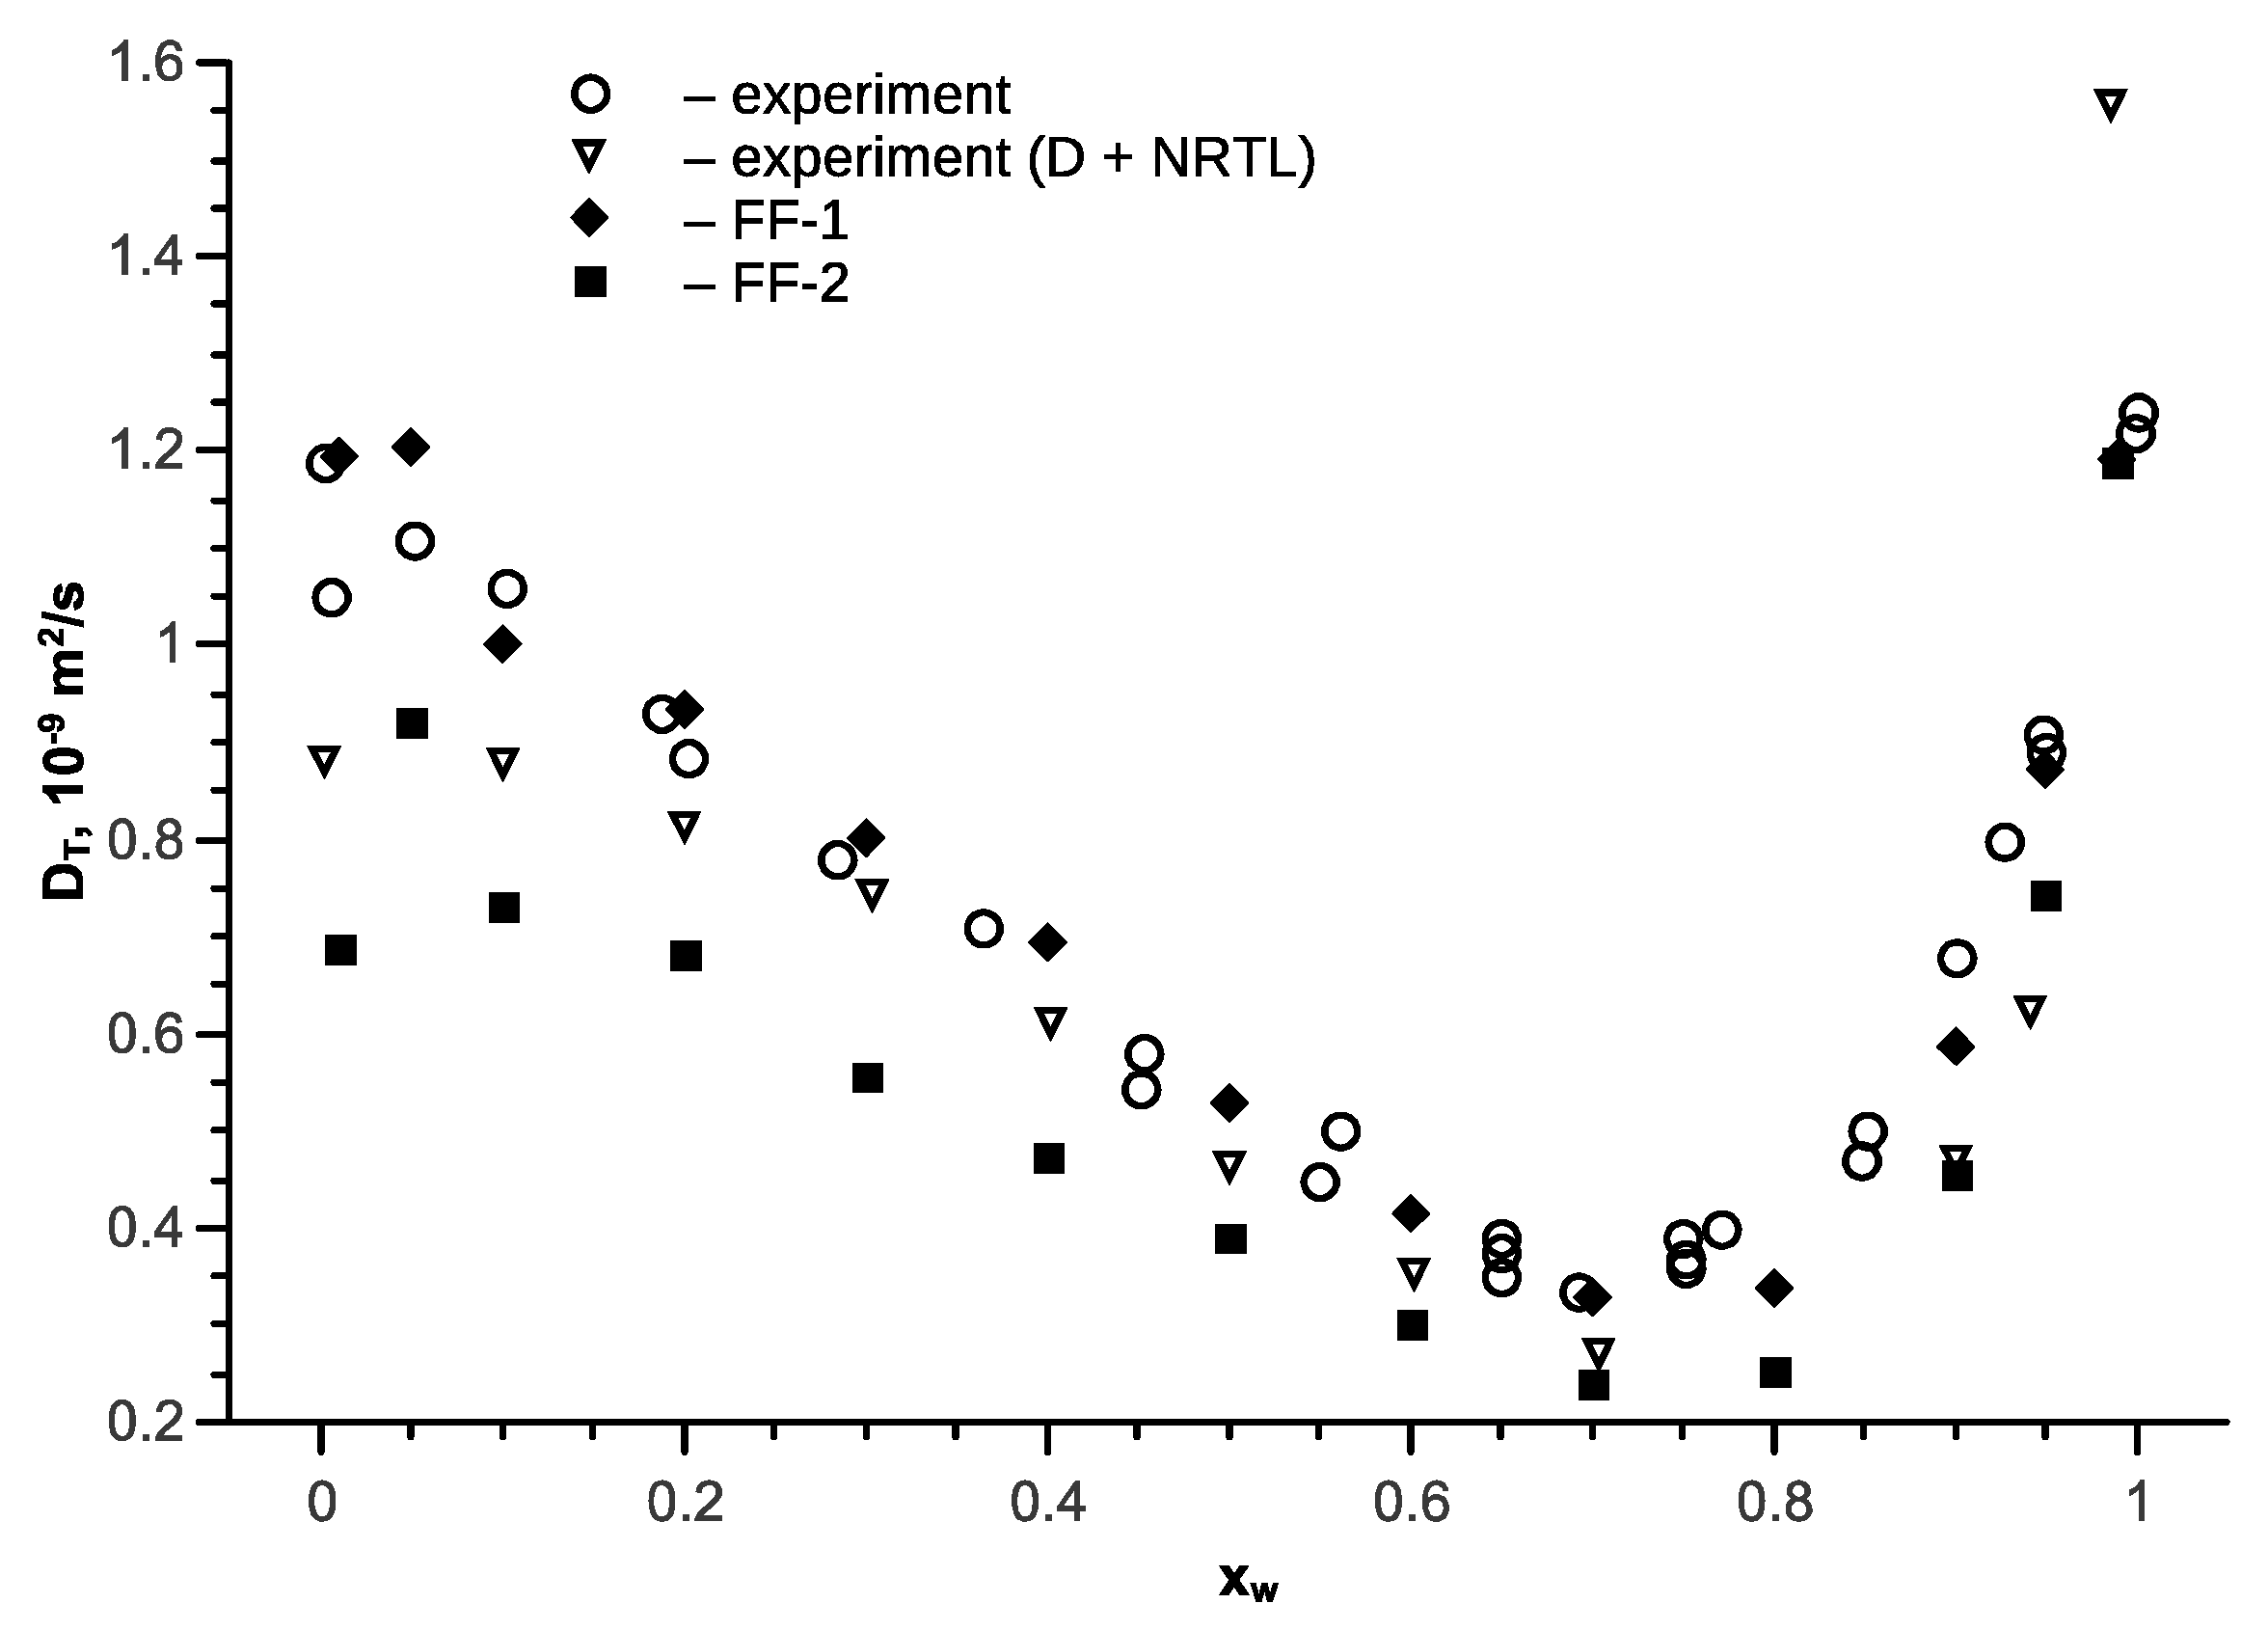
Figure 6.
Dependence of the Darken’s diffusion coefficients D12 on water mole fraction at various temperatures at p = 1 bar; calculations using force field FF-1.
Figure 6.
Dependence of the Darken’s diffusion coefficients D12 on water mole fraction at various temperatures at p = 1 bar; calculations using force field FF-1.

Figure 7.
The transport diffusion coefficient for the water-ethanol mixture versus as a function of water mol fraction at various temperatures and p = 1 bar; open symbols are the experimental data [56], full symbols are the results of simulation with force field FF-1, the lines represent approximation Equation (10) and the NRTL model.
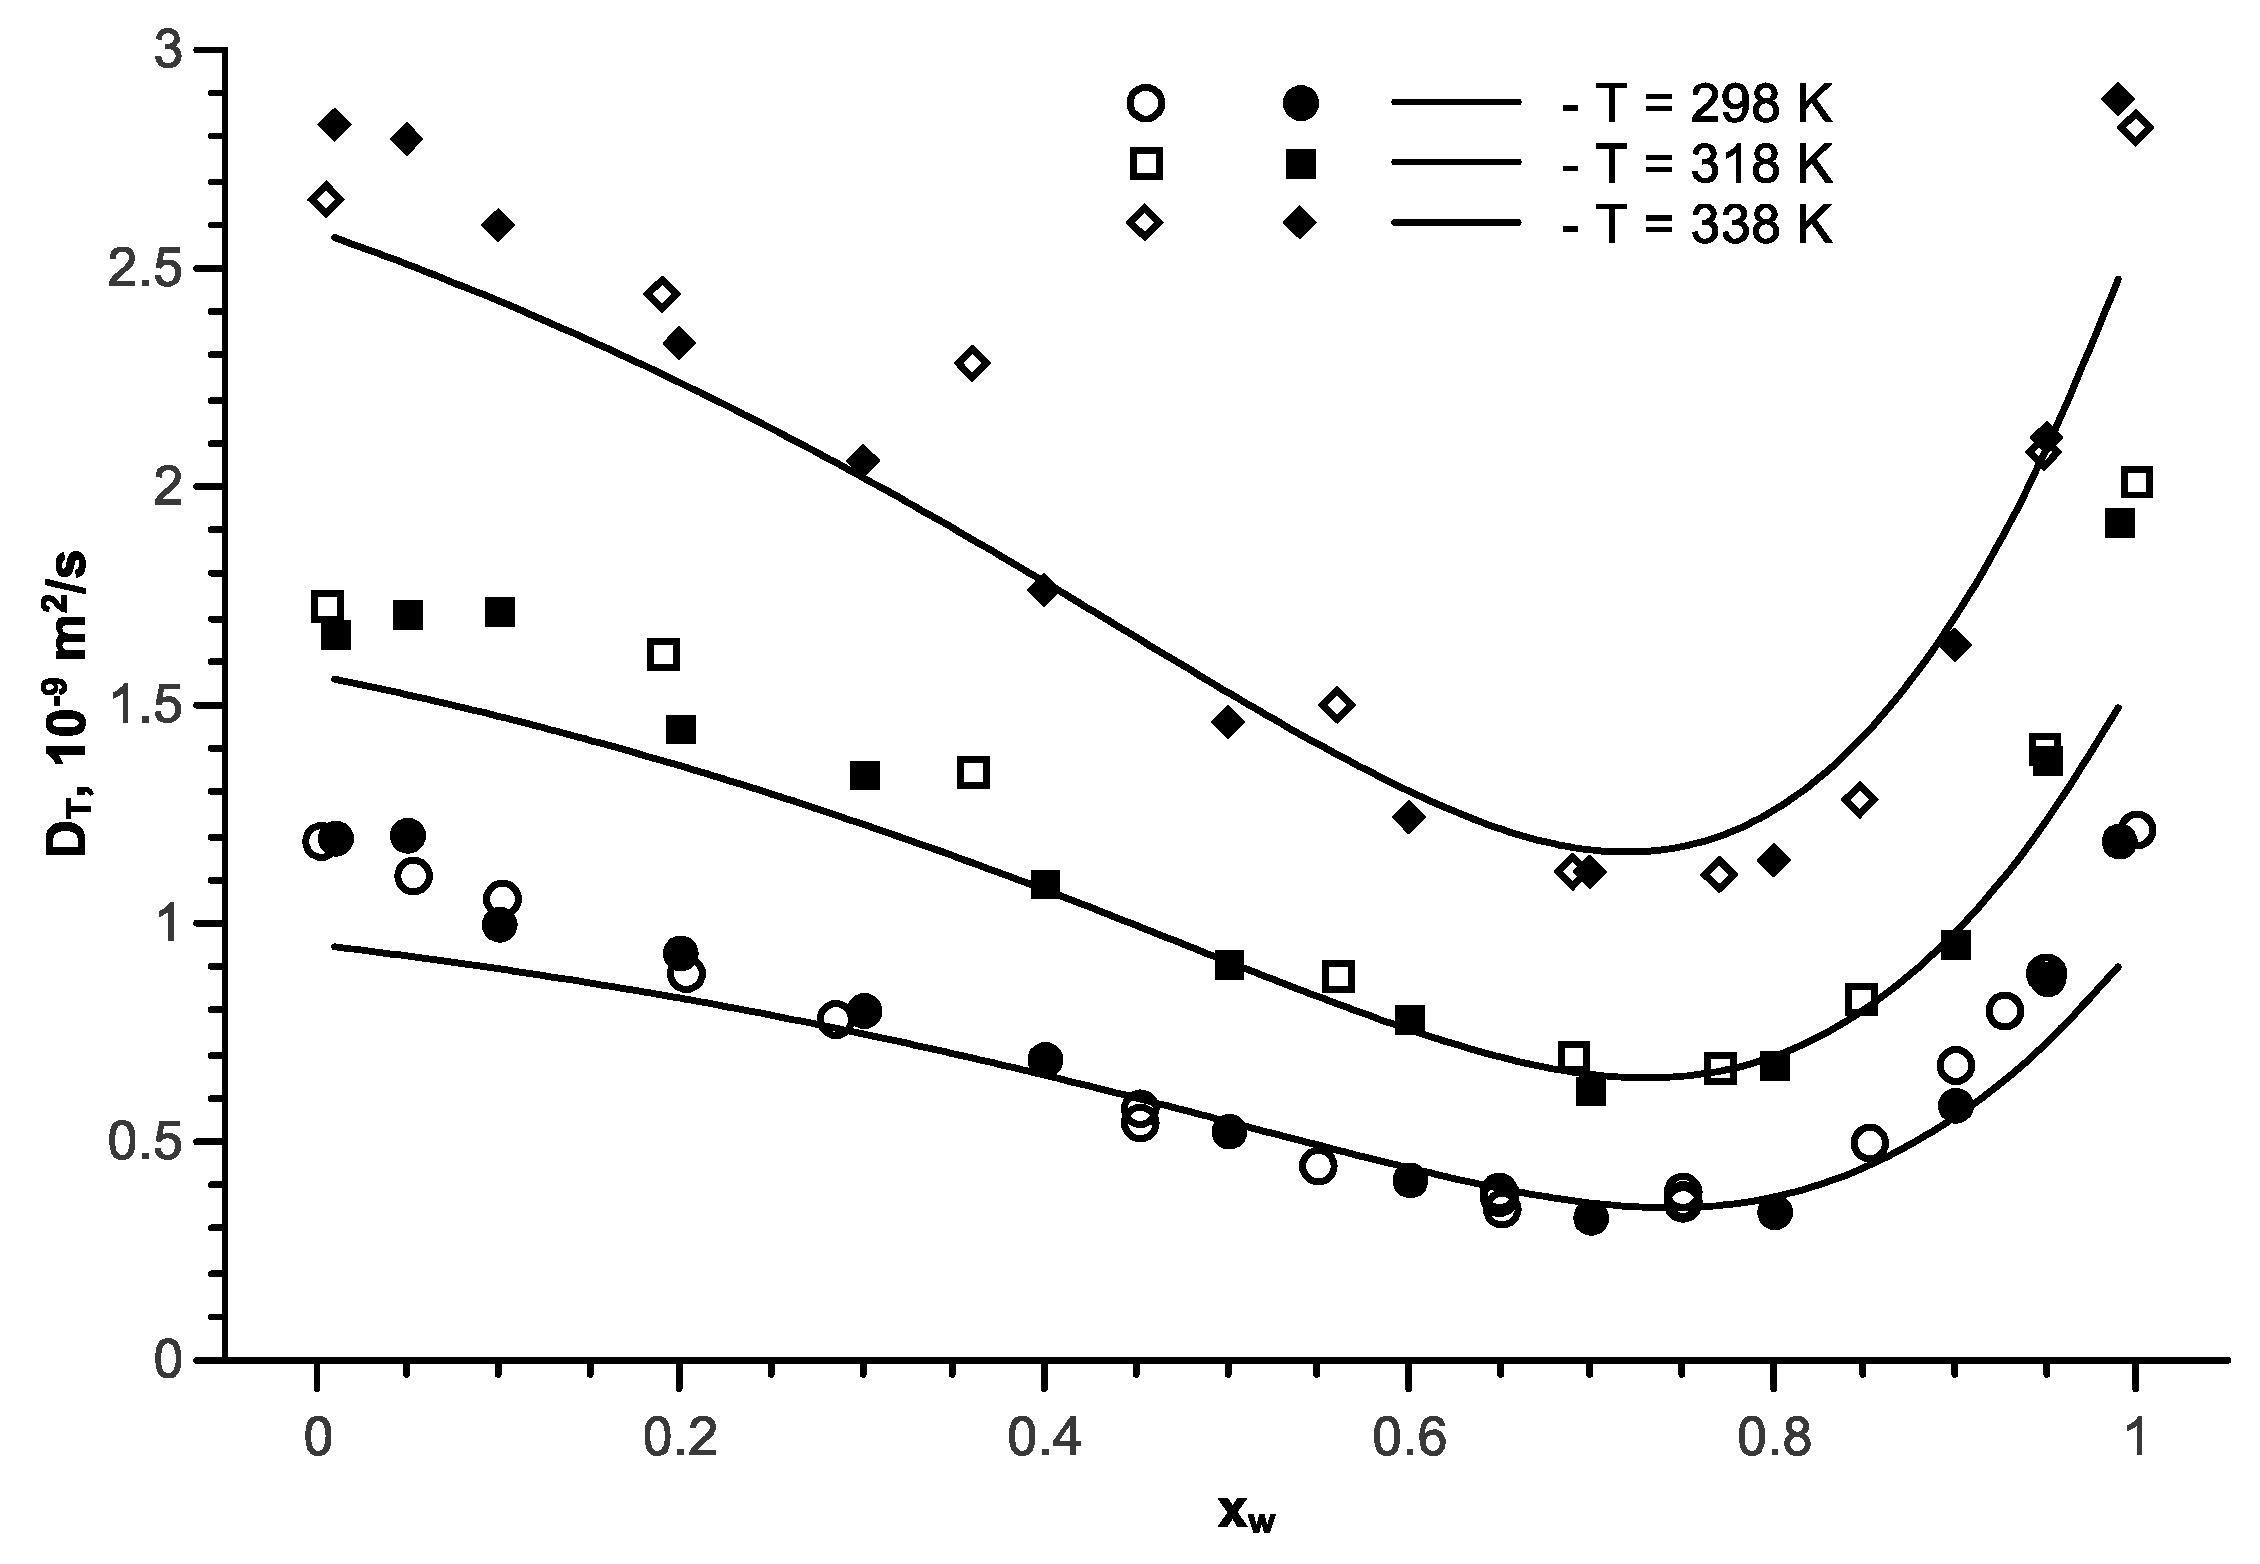
Figure 8.
The transport diffusion coefficient in the isopropanol-water mixture as a function of the water mole fraction at T = 298 K and p = 1 bar; open symbols are the experimental data [57,58,59]; full symbols are the simulation results.
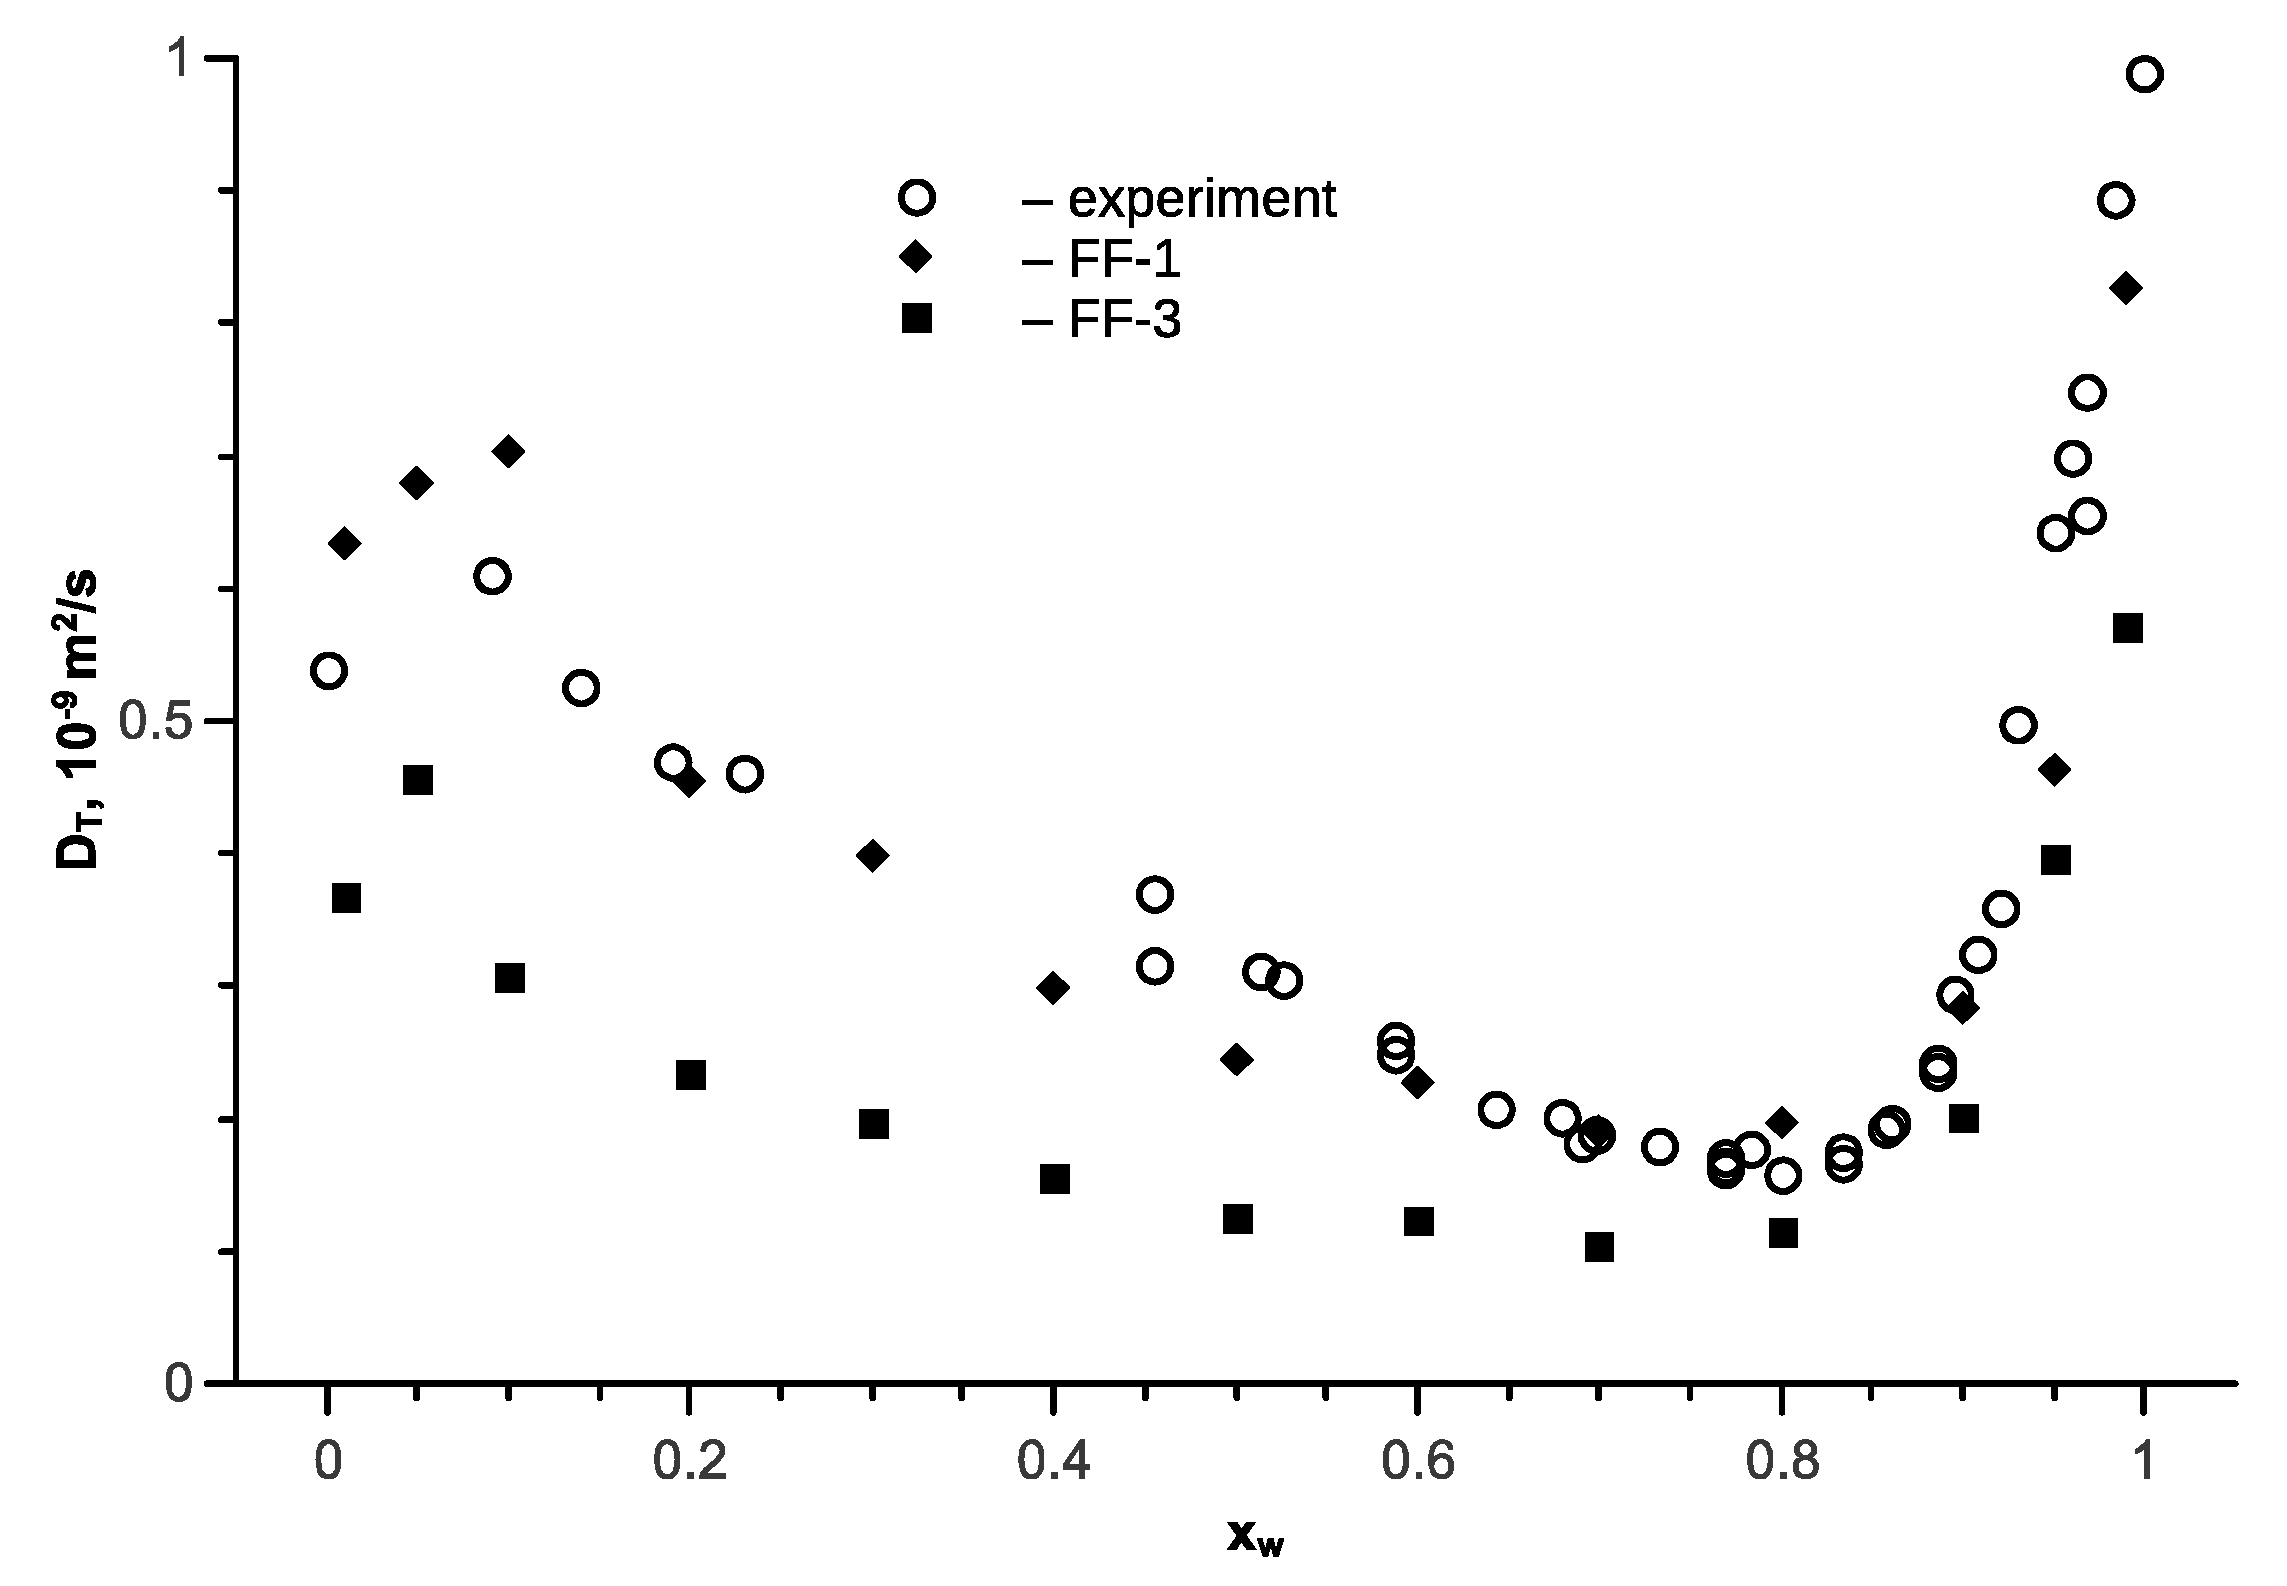
Figure 9.
The transport diffusion coefficient in the isopropanol-water mixture as a function of the water mole fraction at various temperatures and p = 1 bar; open symbols are the experimental data [57]; full symbols are the simulation results; the line represents approximation of Equation (11) for the mutual diffusion coefficient.

Figure 10.
Water mole fraction dependence of the diffusion coefficients of tert-butanol (a) and water (b) at T = 298 K and p = 1 bar; full symbols are FF-4; open symbols are the experimental data [60].
Figure 10.
Water mole fraction dependence of the diffusion coefficients of tert-butanol (a) and water (b) at T = 298 K and p = 1 bar; full symbols are FF-4; open symbols are the experimental data [60].
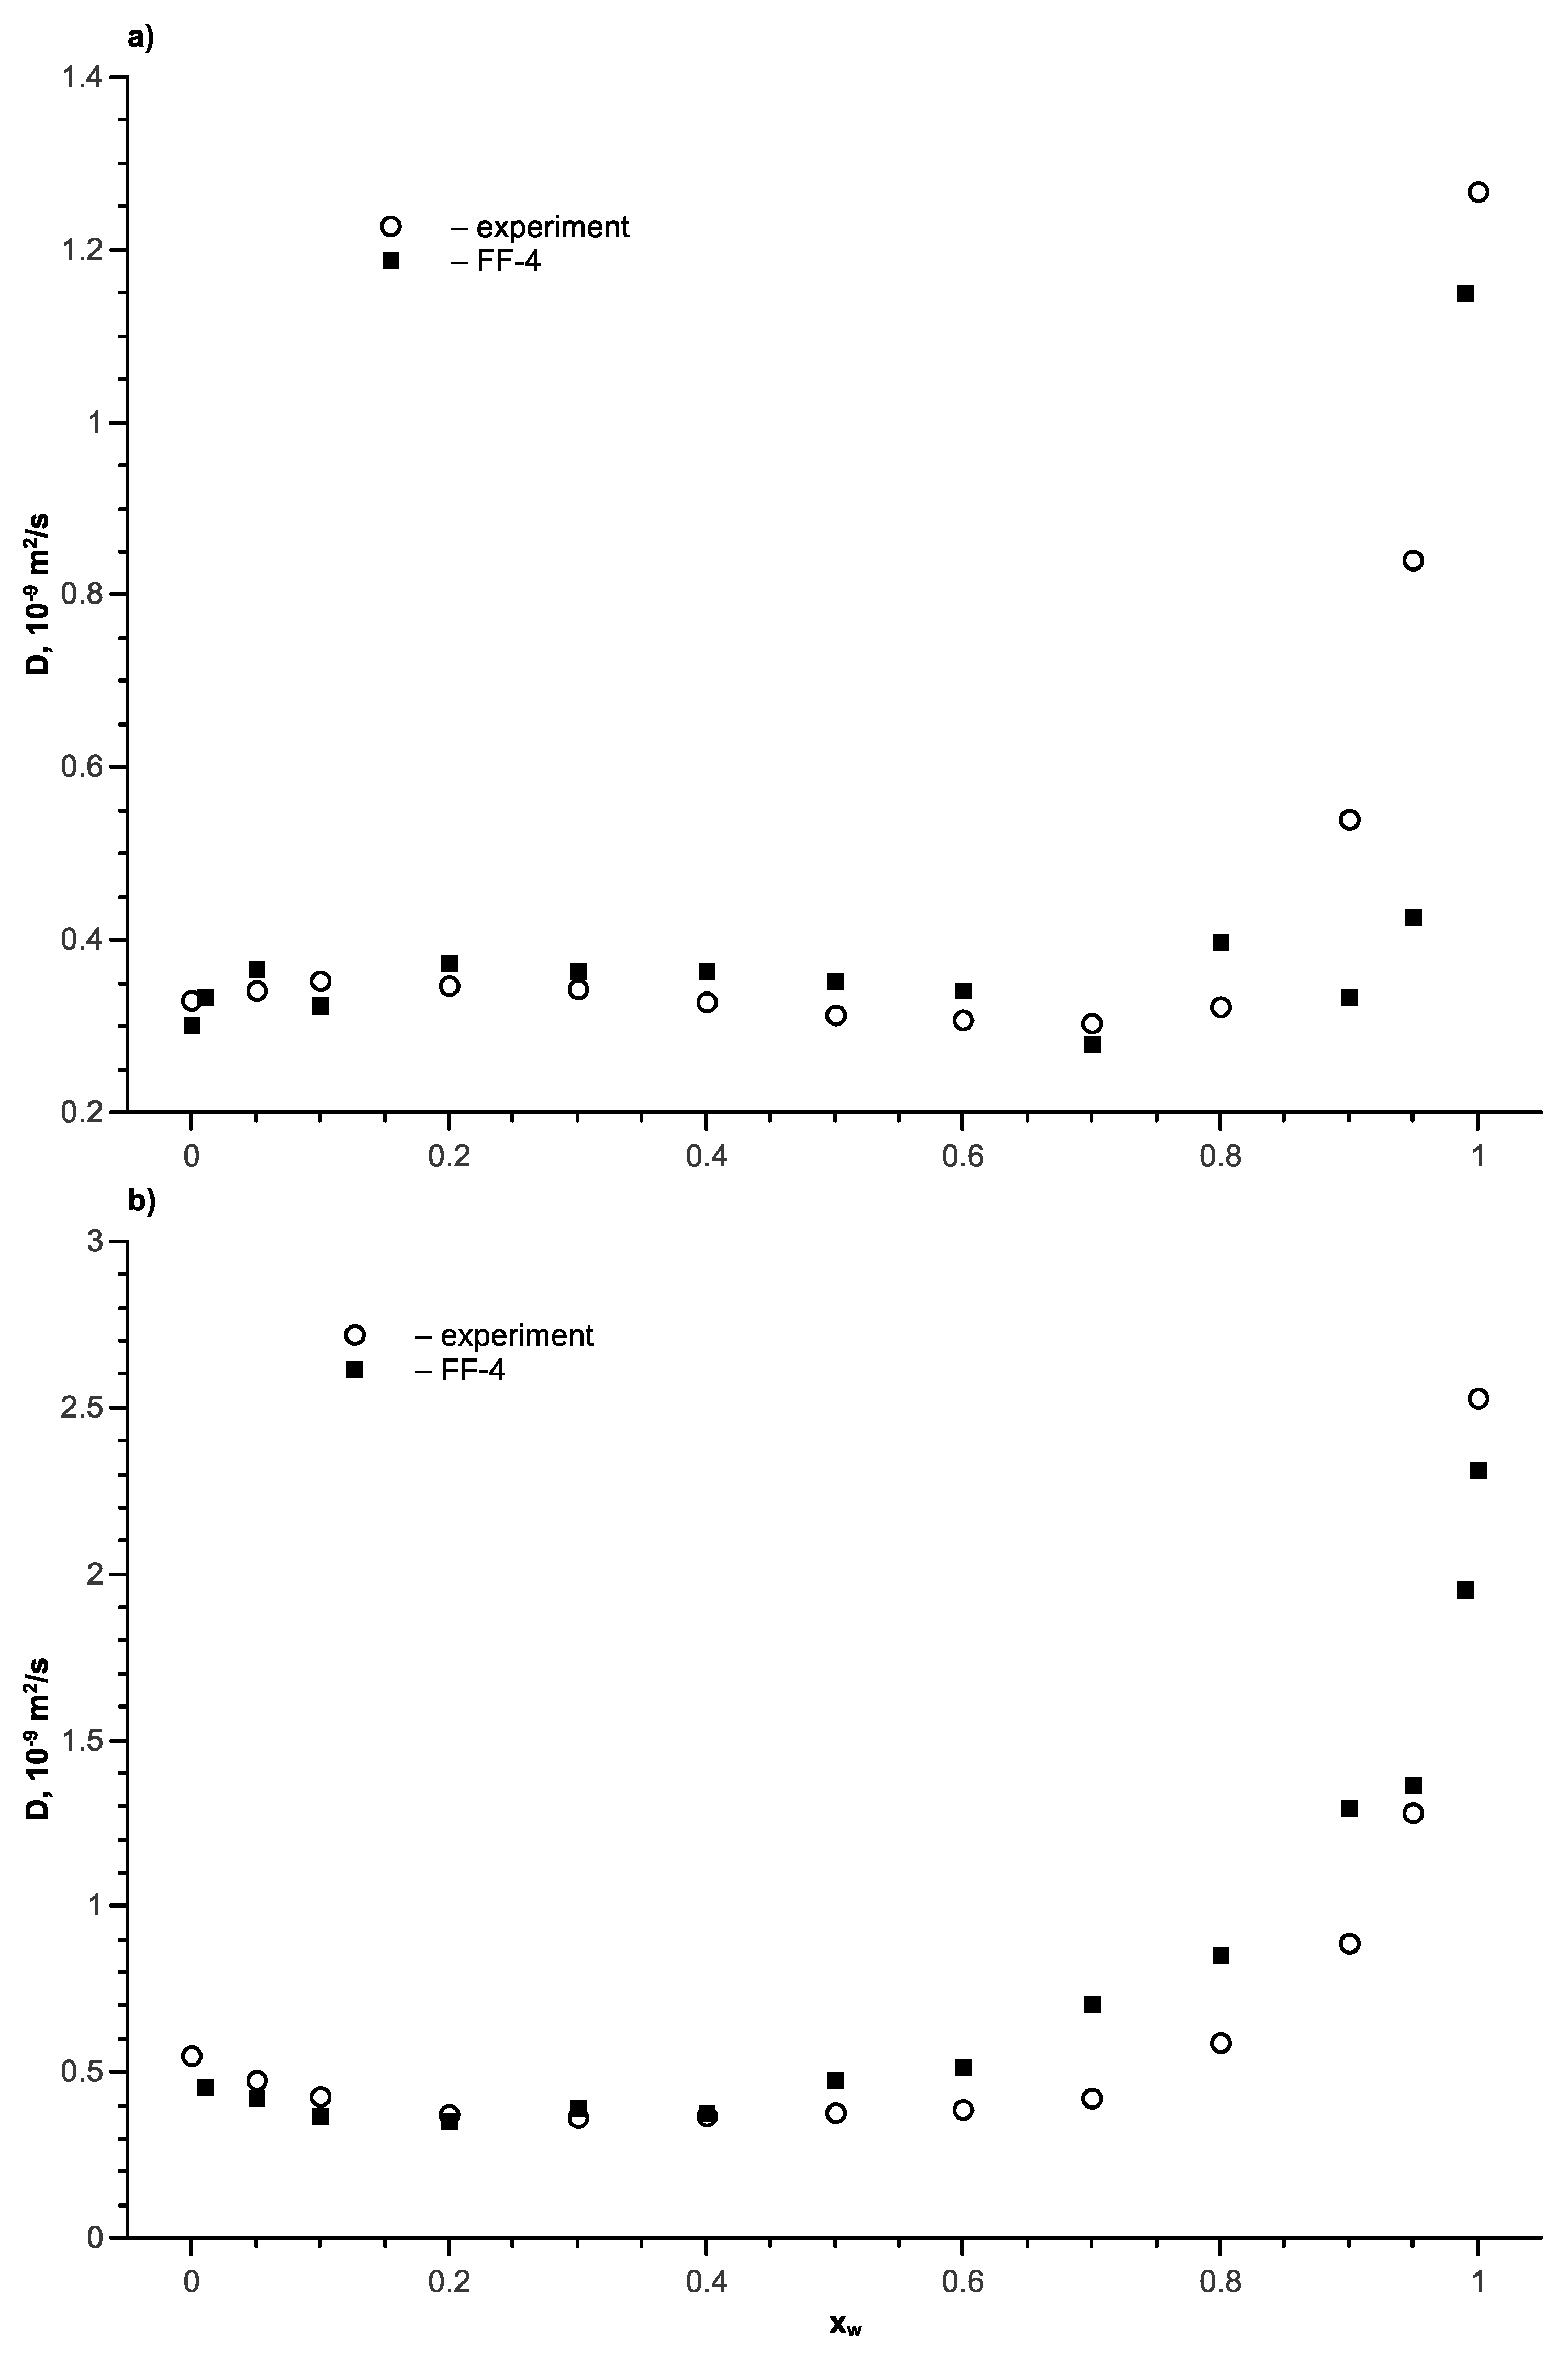
Figure 11.
The transport diffusion coefficients of the tert-butanol–water mixture as a function of the water mole fraction at different temperatures; full symbols are the simulation with force field FF-4, the lines represent approximations of the mutual diffusion coefficient by Equation (12).
Figure 11.
The transport diffusion coefficients of the tert-butanol–water mixture as a function of the water mole fraction at different temperatures; full symbols are the simulation with force field FF-4, the lines represent approximations of the mutual diffusion coefficient by Equation (12).

Table 1.
Parameters of the used force fields.
| Site Property | Parameter | FF-1 (TraPPE) [10] | FF-2 [11] | FF-3 [12] | FF-4 [13] | FF-5 [14] |
|---|---|---|---|---|---|---|
| (Ethanol, Isopropanol, Tert-Butanol) | (Ethanol) | (Isopropanol) | (Tert-Butanol) | (Tert-Butanol) | ||
| transferable | + | − | − | + | − | |
| Site parameters | ||||||
| CH3 | ε/kB, K | 98 | 120.15 | 103.59 | 120.150 | 64.38 |
| σ, Å | 3.75 | 3.6072 | 3.866 | 3.607 | 3.775 | |
| q, ē | 0 | 0 | 0 | 0 | 0.0089 | |
| CH2 | ε/kB, K | 46 | 86.291 | 86.29 | ||
| σ, Å | 3.95 | 3.4612 | 3.261 | |||
| q, ē | 0.265 | 0.2556 | 0.265 | |||
| CH | ε/kB, K | 10 | 20.2 | 50.98 | ||
| σ, Å | 4.33 | 3.238 | 3.363 | |||
| q, ē | 0.265 | 0.31 | 0.265 | |||
| C | ε/kB, K | 0.5 | 15.04 | 73.08 | ||
| σ, Å | 5.8 | 2.44 | 2.93 | |||
| q, ē | 0.265 | 0.265 | 0.293 | |||
| O | ε/kB, K | 93 | 85.053 | 85.9 | 125.010 | 28.52 |
| σ, Å | 3.02 | 3.1496 | 3.154 | 3.081 | 3.25 | |
| q, ē | −0.7 | −0.69711 | −0.747 | −0.700 | −0.7517 | |
| H | Q | 0.435 | 0.44151 | 0.437 | 0.435 | 0.432 |
| bond length | ||||||
| CH3-CH2 | l, Å | 1.54 | 1.9842 | |||
| CH3-CH | l, Å | 1.54 | 1.55 | |||
| CH3-C | l, Å | 1.54 | 1.751 | 1.53 | ||
| CHn-O | l, Å | 1.43 | 1.71581 | 1.465 | 1.44 | 1.42 |
| O – H | l, Å | 0.945 | 0.95053 | 0.969 | 0.945 | 0.95 |
| Constrains | Fixed bonds | Fixed atom coordinates | Fixed atom coordinates | Fixed atom coordinates | Fixed bonds | |
© 2019 by the authors. Licensee MDPI, Basel, Switzerland. This article is an open access article distributed under the terms and conditions of the Creative Commons Attribution (CC BY) license (http://creativecommons.org/licenses/by/4.0/).
Share and Cite
MDPI and ACS Style
Klinov, A.; Anashkin, I. Diffusion in Binary Aqueous Solutions of Alcohols by Molecular Simulation. Processes 2019, 7, 947. https://doi.org/10.3390/pr7120947
AMA Style
Klinov A, Anashkin I. Diffusion in Binary Aqueous Solutions of Alcohols by Molecular Simulation. Processes. 2019; 7(12):947. https://doi.org/10.3390/pr7120947
Chicago/Turabian StyleKlinov, Alexander, and Ivan Anashkin. 2019. "Diffusion in Binary Aqueous Solutions of Alcohols by Molecular Simulation" Processes 7, no. 12: 947. https://doi.org/10.3390/pr7120947
Note that from the first issue of 2016, this journal uses article numbers instead of page numbers. See further details here.