Determination of the Least Impactful Municipal Solid Waste Management Option in Harare, Zimbabwe

1
Department of Chemical Engineering Technology, University of Johannesburgy, Johannesburg 2001, South Africa
2
Department of Chemical, Materials and Metallurgical Engineering, Botswana International University of Science and Technology, Private Mail Bag 16, Palapye, Botswana
*
Author to whom correspondence should be addressed.
Processes 2019, 7(11), 785; https://doi.org/10.3390/pr7110785
Submission received: 12 September 2019
/
Revised: 9 October 2019
/
Accepted: 12 October 2019
/
Published: 1 November 2019
(This article belongs to the Special Issue Gas, Water and Solid Waste Treatment Technology)
Abstract
:Six municipal solid waste management (MSWM) options (A1–A6) in Harare were developed and analyzed for their global warming, acidification, eutrophication and human health impact potentials using life cycle assessment methodology to determine the least impactful option in Harare. Study findings will aid the development of future MSWM systems in Harare. A1 and A2 considered the landfilling and incineration, respectively, of indiscriminately collected MSW with energy recovery and byproduct treatment. Source-separated biodegradables were anaerobically treated with the remaining non-biodegradable fraction being incinerated in A3 and landfilled in A4. A5 and A6 had the same processes as in A3 and A4, respectively, except the inclusion of the recovery of 20% of the recoverable materials. The life cycle stages considered were collection and transportation, materials recovery, anaerobic digestion, landfilling and incineration. A5 emerged as the best option. Materials recovery contributed to impact potential reductions across the four impact categories. Sensitivity analysis revealed that doubling materials recovery and increasing it to 28% under A5 resulted in zero eutrophication and acidification, respectively. Increasing material recovery to 24% and 26% under A6 leads to zero acidification and eutrophication, respectively. Zero global warming and human health impacts under A6 are realised at 6% and 9% materials recovery levels, respectively.
1. Introduction
The annual global municipal solid waste (MSW) generation rate is projected to reach 2.2 billion metric tons per annum by 2025 from 1.3 billion metric tons per annum in 2012 [1]. Member countries of the Organization for Economic Co-operation and Development (OECD) however, are reporting a reduction in MSW generation [2]. Dramatic population increase in urban areas within Africa and Asia was singled out by the United Nations [3] as a typical phenomenon that leads to the astronomical increase in MSW generation. Standards of living, rapid urbanization, ever increasing population and obtaining economic environments in a given locality were cited as some of the factors that influence MSW generation [4,5,6,7]. Dongquing et al. [8] also cited the type and abundance of a region’s natural resources apart from the above mentioned factors as a factor that influences MSW generation.
The best way to identify and manage solid waste streams is the fundamental environmental issue globally, both in industrialised and developing nations [9]. Global initiatives are supporting the prioritization of solid waste management (SWM) because it is viewed an important facet for the sustainable development of any country [10]. Sustainable development is the reduction of ecological footprints while improving quality of life for current and future generations within the earth’s capacity limit [11]. UNDESA [12] Agenda 21 of the Rio Declaration on Environment and Development affirmed the need for environmentally friendly waste management since it is an environmental issue of major concern in maintaining the quality of the earth’s environment.
1.1. Solid Waste Management Dynamics in Developed Nations
Solid waste (SW) mass production characterised human life since the formation of non-nomadic communities around 10,000 BC [13]. Seadon [14] argued that small communities could bury the SW they generated in environments surrounding their settlements or dispose it in rivers, which could not prevent the wide spread of diseases or foul odours from accumulated SW and filth emanating from increased population densities that characterised the formation of non-nomadic communities. Exceptional cases on waste management existed Worrell and Vesilind [13] reported that by 200 BC, organised (SWM) systems had been under implementation in Mohenjo–Daro, an ancient Indus Valley metropolis, and the Chinese had established disposal police to enforce waste disposal laws. Melosi [15] also reported that by 500 BC, the Greeks had issued a decree that banned the disposal of waste in streets and organised first accepted MSW dumps in the Western world.
Middle Ages’ city streets were characterised by odorous mud with stagnant water, soil, household waste and excreta from both humans and animals creating favorable conditions for disease vectors [16]. Therefore, the disposal of biodegradable or organic waste in streets is argued to have partly contributed to the Black Death of the 1300s that occurred in Europe [13,16,17]. Developments in SWM in developed nations were and are initiated to address environmental, land use, natural resources depletion, human health, climate change, waste value, aesthetic, economic, public information and participation issues associated with improper waste disposal [13,16,18,19,20]. SWM has evolved in developed nations driven by historical forces and mechanisms which can possibly inform the development of SWM strategies in developing nations [20]. Marshall and Farahbakhsh [21] noted five drivers for integrated SWM paradigm in developed nations, namely the environment, climate change, resource scarcity, public health and public awareness and participation.
Public health concerns remain a driver of SWM transformation in the developed world characterised with continued review of public health legislation. The need to reduce land, air and water contamination [20,22] was a primary driver of policy changes in SWM development in the 1970s and beyond [20]. Waste control characterised the SWM policy framework between the 1970s and mid-1980s focusing on daily landfill compacting and covering and incinerator retrofitting for dust control. The SWM policies enacted from the 1980s to date focus on increasing technical standards, starting with control of landfill leachate and gas, reduction of incinerator flue gas and dioxin and the current span covering control of odour at composting and anaerobic digestion (AD) facilities [20]. The last decade of the 20th century saw the increased focus and attention towards the adoption of integrative policy due to the inadequacies of advocating for continued increase in environmental protection only from both the technical (engineering and scientific) and environmental perspective without considering the political, economic, social, cultural and institutional dimensions of SWM [20,23,24]. The waste hierarchy upon which the European Union (EU) current policy on waste is based reignited materials recycling and reuse of the 19th century in the 1970s [20,25] in light of the increasing scarcity of resources. The EU’s Second Environment Action Programme of 1977 introduced the waste hierarchy model for SWM priorities derived from the “Ladder of Lansik” [26].
Climate change has also driven the development of SWM from the early 1990s to address greenhouse gas (GHG) emissions from biodegradable waste landfilling, a major contributor of methane gas emissions, complimented with a strong focus on the recovery of energy from SW [20,22]. The concerns by the public on poor SWM practices with their increased awareness have also contributed in driving the developments in SWM [20]. The public became concerned with the location of SWM facilities in the vicinity of their households, ‘not in my backyard’ (NIMBY), though they appreciate the need of SWM facilities. Therefore, effective communication, wide public knowledge of SWM needs, the active engagement of all stakeholders during the entire SWM cycle have been successful in overcoming NIMBY public behavior and opposition to numerous developmental projects [27] thereby acting as drivers for developments in SWM [21].
1.2. Solid Waste Management Dynamics in Developing Nations
Despite the increase in waste generation, global call and acceptance that waste management must take an integrated approach to derive economic benefits while reducing environmental burdens, Africa is still lagging in this regard. This lag is also being witnessed despite the reported increased globalization as poor SWM challenges and their associated public health impacts are affecting urban environments in many developing nations [22,28,29] one and a half centuries after the sanitary revolution in the EU [30]. Unlike developed nations that are concerned with diseases associated with affluence (cancer, cardiovascular disease, alcohol and drug abuse), poor SWM derived public health impacts in developing nations are evidently manifesting in the form of communicable diseases giving the double headache of dealing with both communicable diseases and emerging diseases of affluence [30]. Public health mostly drives SWM development in developing nations, though other factors as in developed nations are considered because the key priority is waste collection and removal from population centres as it was in European and American cities before the 1960s [20,31,32,33]. Wilson [20] noted that environmental protection remained relatively low on the SWM priorities despite the presence of legislation prohibiting unregulated waste disposal with minor changes towards its prioritization taking place. The value of waste as a resource is also another vital driver within developing nations currently providing livelihoods to the urban poor through informal recycling [20,22]. Climate change is a significant driver globally with a number of nations having incorporated the municipal solid waste (MSW) sector amongst the sectors considered for low-emission development strategies (LEDs) on the national emission reduction commitments or targets within the nationally determined contributions (NDCs) framework of the Paris agreement under the United Nations Framework on Climate Change Convention (UNFCCC).
A number of similarities do exist between the current conditions characterizing many cities in developing nations and those experienced in European and American cities during the 19th century with regards to increased urbanisation levels, degraded sanitary environment emanating from lack of adequate sanitation and environmental services, inequalities and social exclusions in SWM systems, unprecedented mortality and morbidity levels due to inadequate sanitation, potable water supply and waste disposal services [30]. Thus, developing nations are likely to go through almost similar SWM development pathways as those developed nations went through. However, Marshall and Farahbakhsh [21] argued that despite these similarities, complex local-level-specific technical, political, social, economic and environmental challenges in developing nations have been created from rapid urbanization, increasing population, the fight for economic growth, institutional, governance and authority issues, international influences, along with their interaction with diverse economic, cultural, political and social dynamics which are bringing associated SWM complexities in developing nations.
In developing countries therefore, SWM is complicated by levels of urbanization, economic growth and inequality as well as socio-economic dimensions, governance, policy and institutional issues coupled with international interferences [21] which limit the application of SWM approaches that succeeded in SWM development pathways for developed nations. The understanding of the origins and critical drivers in the past developments in SWM in developed nations provides contextual knowledge on the current changes occurring in developing nations. Simelane and Mohee [34] identified African social norms with their associated concerns including economic and environmental issues, national and regional legislative deficiencies, technological and human resources developments and historical influences among other factors necessitating this lag. Iriruaga [35], on another note, cited low private investment in infrastructure, industry linkages and academic research as the drivers of Africa’s inability to effectively derive benefits from the waste it generates. Muzenda et al. [36] identified the increased demand for SWM provision, MSW minimization, and recovery of materials for reuse and recycle, constraining factors including physical, land use and environmental constraints, as well as demographic and socio-economic factors as the core drivers for the need of integrated waste management (IWM) techniques.
MSW generation and its disposal are causing enormous environmental and human health challenges in urban environments of developing countries [37,38,39]. It is considered hazardous and to have toxic impacts on the biological environment, thereby affecting lifestyles and economic activities [40]. This, therefore, calls for the need to sustainably manage waste to reduce its impact in the ecosystem and human health [41]. The need to design and develop integrated waste management (IWM) options that seeks to meet the economic, technical, environmental and social constraints of products or production processes has become paramount and urgent. McDougall et al. [42] defined IWM as a combination of technically sound, economically feasible, environmentally sustainable and socially acceptable collection and treatment processes that handle materials constituting MSW.
1.3. Municipal Solid Waste Management in Zimbabwe
Like many developing countries facing enormous MSW generation and disposal associated environmental and human health challenges in urban environments, the Government of Zimbabwe acknowledged that its urban local authorities (city municipalities, town councils, district councils and local boards) are experiencing major challenges in managing MSW due to rapid population growth. Most of Zimbabwe’s local authorities fail to cope with the ever increasing volumes of waste being generated by the public [43]. Several studies have also affirmed that municipal solid waste management (MSWM) is one of the greatest challenges facing urban environments in Zimbabwe [41,44,45,46,47,48,49,50,51,52,53]. In Zimbabwe, about 60% of the MSW generated in urban environments is disposed at official dumpsites with the remaining waste being dumped illegally in undesignated areas namely storm water drains, open spaces, alleys and road verges [45]. The dumping of waste in open and illegal dumpsites is not only an eyesore but creates an environment where disease causing vectors can thrive, contribute to air, soil and water pollution and emit greenhouse gases that cause global warming [43].
MSW problems in Harare specifically are evidently manifesting in the form of both surface and groundwater pollution due to the dumping of MSW in waterways and untreated leachate from dumpsites. The storage capacity of the sole official MSW dumpsite in Harare is expected to reach its limit in the next five years [54]. This calls for the need to redefine future MSWM options as well as redefining the models of operating the MSWM facilities considering biogas recovery for electricity generation as well as the production of saleable products from MSW. To date no or few studies have been carried out focusing on determining the most probable integrated MSWM option with the least environmental impacts for Harare. Such study results could possibly inform future decisions and policies on MSWM considering the increasing population, changing lifestyles, global pressure for the need for sustainable cities, the impacts the current MSWM practices have on both the environment and human health as well as the imminent closure of the existing dumpsite whose service life is anticipated to come to an end in 2020. This study, therefore, is a life cycle-based comparative assessment of the various probable MSWM scenarios to be implemented in Harare. The study seeks to identify the scenario with the least burden with regards to human health, acidification, eutrophication and global warming impact categories.
1.4. Life Cycle Assessment
Life cycle assessment (LCA) is a tool that could be used in the design and development of IWM options. LCA holistically quantifies the environmental burdens and impacts for entire products’ or processes’ life cycles [55]. Winkler and Bilitewski [56] described LCA as a science-based impact assessment methodology for the impacts of a product or system on the environment, which is not purely a scientific tool. LCA application in sustainable MSWM started over two decades ago, as argued by Güereca et al. [57] that it has been applied for MSWM since 1995. The use of LCA for decision making and strategy development in MSWM systems has expanded rapidly over the recent past years as a tool with the capacity to capture and address complexities and interdependencies characterizing modern IWM systems [58]. Mendes et al. [59] noted the appropriateness of LCA application as a tool for decision making and strategy development in MSWM because of the associated wide differences in spatial locations, waste composition and characteristics, sources of energy, waste disposal options available as well as available nature and size of products from various waste treatment methods. Therefore LCA has emerged as an appropriate holistic method increasingly being applied in MSWM decision making and strategy development processes [60].
LCA has been previously applied to assess the associated impacts of MSWM systems thereby assisting in comparing alternative MSWM systems and/or identifying areas of major concerns that need potential improvements [61]. It has been applied to identify and probe likely negative impacts of various MSWM practices [62] because it is capable of calculating and comparing impacts of different MSWM scenarios [63]. It incorporates environmental impact weighing or valuation to estimate the performance of a specific MSWM scenario [62]. The intensification of MSWM policies in Europe and global call for the implementation of LCA methodology ISO 14044: 2006 standards have resulted in a positive trend towards the adoption of life cycle studies on MSWM [64]. To date, numerous studies have been undertaken worldwide applying LCA to the different MSW life cycle stages that cover the entire life cycle of MSW [60,62,63,64,65,66]. Khandelwal et al. [64] reviewed 153 studies that applied LCA on MSWM, undertaken globally and published between 2013 and 2018. The distribution of the selected LCA studies reviewed by continents showed that 72 were in Asia, 53 in Europe, 10 in North America, 9 in South America, 3 in America, 2 in Africa, 2 addressed generic cities assuming MSW generation, characteristics and associated environmental emissions together with other remaining studies that focused on at least one country. Very few life cycle studies on MSWM were found in Africa and poor LCA methodology penetration in Africa was cited as the cause of the limited LCA studies on MSW. The only two LCA studies found for Africa were done in Nigeria.
2. Materials and Methods
2.1. Description of the Study Area
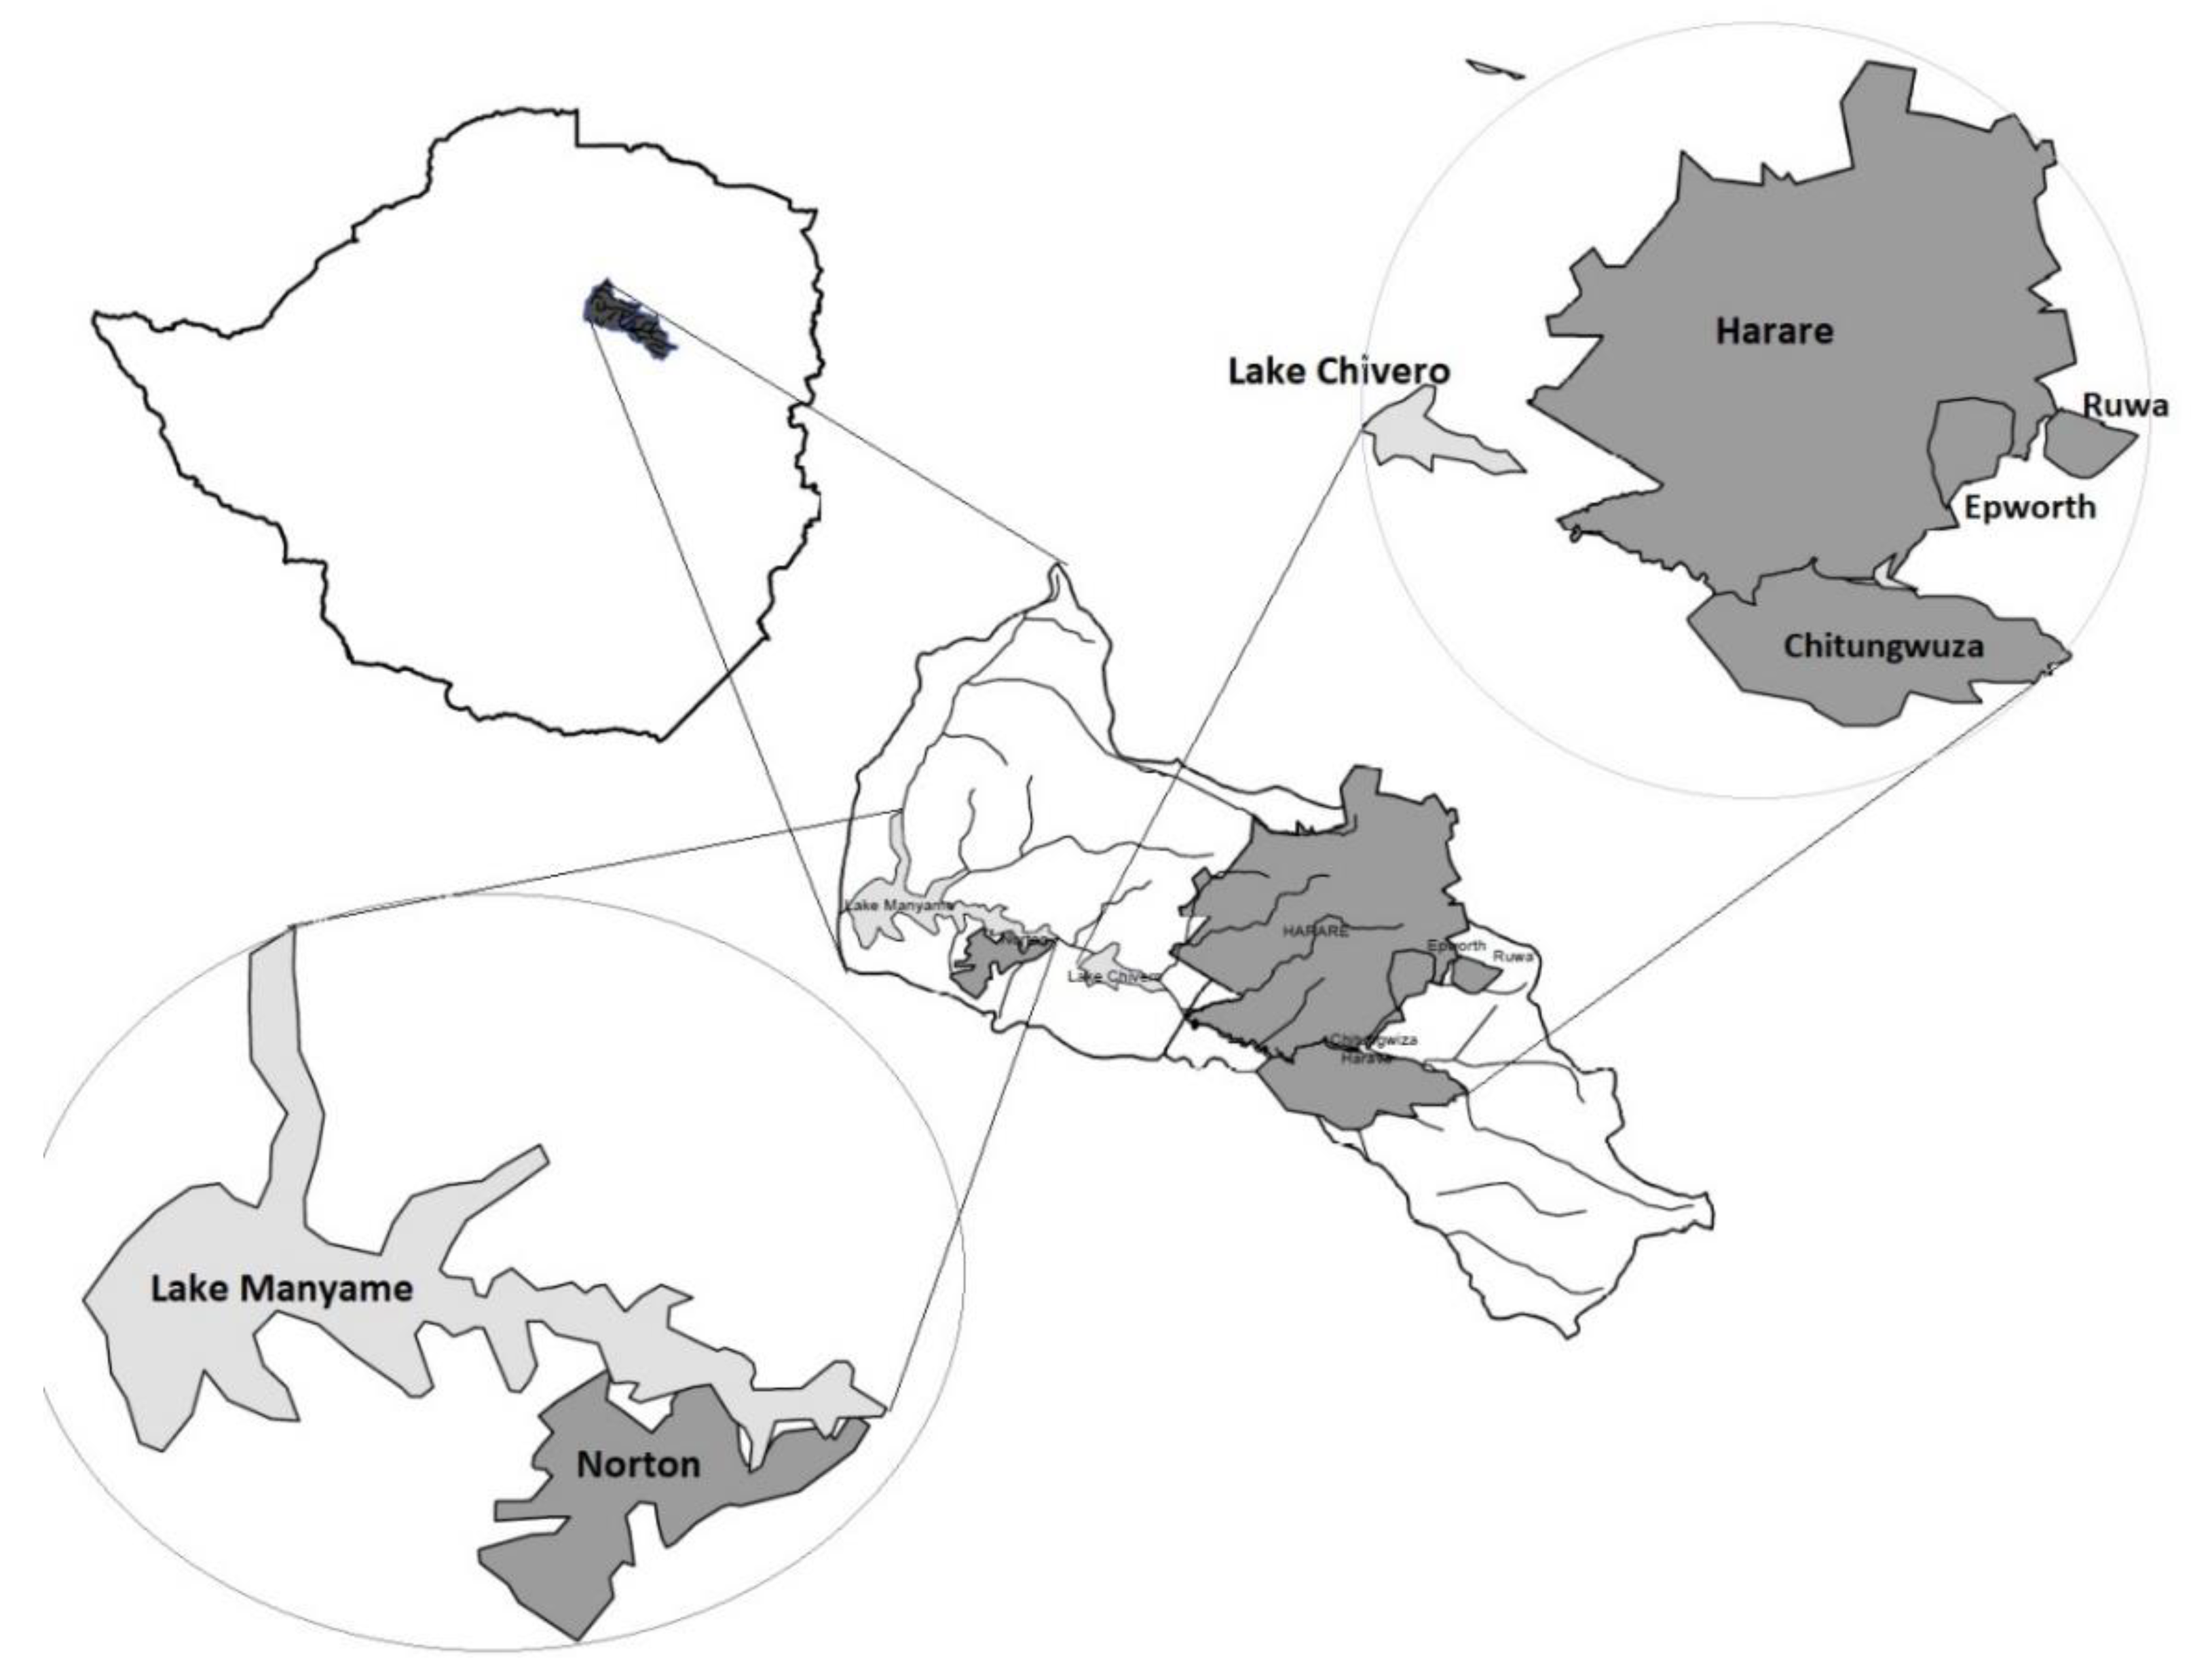
The study area comprises of Harare (the capital city of Zimbabwe), Chitungwiza, Norton, Ruwa and Epworth local boards with an estimated total population of 2,133,802 people, as shown in Table 1. Harare urban, Chitungwiza and Epworth local boards are located within Harare metropolitan province while Ruwa and Norton local boards are located in Mashonaland East and West respectively, as illustrated in Figure 1. An estimated 60% of the MSW generated in the study area is indiscriminately disposed at official dumpsites, except for Norton, whose MSW is disposed in an engineered sanitary landfill. The remaining 40% of the MSW is illegally dumped in undesignated areas, namely storm water drains, open spaces, alleys and road verges [45]. The capacity of the sole official dumpsite for Harare city, Pomona dumpsite, which covers an estimated area of 100 hectares having been operational since 1985 is expected to be exhausted by 2020 [54].
One unique feature of the study area is that it sits on the water catchment that drains into water reservoirs (Lake Chivero and Manyame) that supply the study area with potable water as shown in Figure 1. MSW problems in the study area are evidently manifesting in the form of both surface and groundwater pollution. Lake Chivero has been reported to have reached super eutrophic levels partly due to the deposition of MSW which constitutes in excess of biodegradable waste laden in runoff. The underground water in the study area has also been reported to have been compromised from untreated leachate from dumpsites [52].
2.2. Definition of MSW
Definitions of MSW vary within countries and between countries and regions making it difficult and confusing to estimate MSW generation in various countries [68]. The variations in definitions bring along challenges and difficulties in LCA studies. Therefore for the purpose of this study, MSW is regarded as the waste that is managed by or on behalf of municipalities as a public service [69] comprising waste generated at households, offices, supermarkets and restaurants. Consequently, in Zimbabwe, local authorities are mandated to manage such MSW [70].
2.3. Quantity of MSW Generated in Harare and Its Dormitory Towns
The MSW annual generation for a given locality, communities, cities or countries, is a core indicator of the pressure exerted by MSW on the environment. It is useful for LCA when the annual generation of MSW is considered the functional unit. Obtaining reliable data on estimates and characteristics of MSW generated in developing countries is a challenge due to incomplete data, lack of equipment like weighbridges, rural to urban migration and low efficiency rates of MSW collection [71]. The development of initiatives that derive benefits from the promotion of sustainable use and management of MSW is hindered by the low availability and quality of data regarding MSW generation and management [34]. In Harare, Zimbabwe, quality and reliable MSW data on waste generation, characteristics and composition necessary for LCA that could inform effective planning for sustainable MSWM are unavailable. In addition the unreliable data available are only from official records of MSW collected and delivered at the official dump site. This MSW data does not capture much of the MSW managed outside the dumpsite management process that would have been generated at various sources [72]. Afon [72] further observed enormous variations of MSW generation on temporal scales (weekday, week of month and month of year) across localities highlighting the need for longitudinal collection of MSW generation data measurements over a year at sampled households according to their life styles and levels of income if resources and time permit to acquire reliable MSW data. In this study literature data was considered for the estimation of the annual MSW generation for Harare using literature reported per capita MSW generation figures.
Therefore the average per capita MSW generation rate of 0.6 kg/capita/day (0.5 kg/capita/day [52,73,74], 0.65 kg/capita/day [1,75] and 0.7 kg/capita/day [76]) was considered for the study. The average figure of 0.6 kg/capita per day, though slightly on the higher side of observed figures of 0.42 ± 0.15 kg/capita/day MSW generation in Zimbabwe by Muchandiona et al. [52], it is a reasonable estimate when considering other reported figures from literature. Miezah et al. [77] reported Ghana’s daily MSW generation of 12,710 tons considering a daily per capita waste generation rate of 0.47 kg and a population of 27,043,093. Harare and its dormitory towns have a population of 2,133,802 translating to daily and annual MSW generation of 1280 and 467,303 tons, respectively, as shown in Table 2. Due to uncertainties on population data serviced with MSW collection, MSW data normalisation was assumed to have been enabled in the calculations of the per capita waste generation rate datasets that were used to calculate the daily average per capita (0.6 kg) MSW generation for this study to factor in the effects of population changes as proposed by the European Environment Agency [78].
2.4. Composition of MSW Generated in Harare and Its Dormitory Towns
The composition of MSW is a vital aspect in MSW management as it is necessary for examining sustainable options for MSW reduction, recovery (reuse and recycle) as well for identifying the most appropriate and sustainable treatment and disposal method [79]. Hoornweg and Bhada-Tata [1] observed that organic waste fraction of MSW in developing countries constitutes a much larger fraction as compared to developed countries. However, like MSW generation data, reliable MSW composition data are absent in the study area. Estimates of averages from the Environmental Management Agency and notable literature studies conducted in Harare, Bulawayo and Chinhoyi were considered for the study as illustrated in Table 3.
2.5. Integrated MSW Management Options and Treatment Processes/Life Cycle Stages
The integrated MSWM options and their associated processes or life cycle stages are described in the sections below and summarised in Table 4. The transportation system considered is the municipal waste collection service by municipal waste collection trucks [86]. Transport figures for waste collection were derived from the product of annual MSW generation for Harare and the estimated average distance the waste will be transported to the MSW management facility giving 21,028,500 t·km (product of distance to be travelled by the MSW to the treatment facility and the weight of the MSW transported) as waste collection trucks were estimated to travel an average distance of 90 km to and from the MSW management facility. The return trip was modelled only for an empty waste collection truck for the 22,252 trips of 45 km distance each carried out annually.
The recovery of the recoverable materials considered a mixed bag sorting plant equipped with relevant filters to treat waste gases produced during the recovery of the recoverable materials. The materials considered for recovery are metals, paper, plastics and glass at a recovery rate of 20% of their annual estimated generation. The anaerobic digestion plant considered the anaerobic digestion of the estimated biodegradable fraction of MSW amounting to 196,166 metric tons that is generated annually in Harare and its dormitory towns to produce biogas at an estimated average production rate of 115 m3/metric ton [87,88,89,90]. The biogas produced will be burnt to produce electrical and heat energy. The digestate or solid residue from the anaerobic digestion process will undergo a compositing process to obtain quality compost for sale as a biological fertilizer or soil enhancer. Gases from the anaerobic digestion process will undergo bio-filtration before being scrubbed or washed with sulphiric acid to produce a generally acceptable leachate that is assumed or considered decontaminated. The mixed bag fraction that reaches the incineration plant will be combusted in a furnace. Combustion engines transform the flue gases from the furnace into electrical energy. Combustion furnace bottom ash will be used in road construction as aggregates prior to its treatment with physical chemical treatment methods applied to treat the leachate produced during bottom ash recovery. Gaseous emissions from the combustion furnace are treated using appropriate methods such as lime based dry adsorption, bag house filtration, activated carbon-based adsorption and selective noncatalytic reduction. Mixed bag MSW is landfilled with energy recovery. The landfill leachate undergoes nitrification–denitrification process under pressure. Ultrafiltration is used to separate the sludge from the leachate. The treated leachate is sent to a wastewater treatment plant. The transportation of treated leachate from the landfill to the wastewater treatment plant is considered negligible.
2.6. Life Cycle Assessment
LCA was used to estimate and compare the potential acidification, eutrophication, global warming and human health impacts of the various six MSW management scenarios. ISO 14040 standards [91] were the basis for the LCA study. Several studies have been carried out using LCA to assess different MSW management scenarios in a number of countries, namely Spain [57,92,93], Italy [58,94,95], China [96,97], Brazil [59], Australia [98], Indonesia [99], Canada [100], United States of America [101], Lithuania [102] and Nigeria [103,104] to mention just but a few. LCA was therefore applied to assess the human health, acidification, eutrophication and global warming potential of the various MSW management scenarios in Harare and its dormitory towns of Chitungwiza, Epworth, Norton and Ruwa.
2.6.1. Goal and Scope
LCA was performed to assess the acidification, eutrophication, global warming and human health impact potentials of the proposed six MSWM scenarios that could be implemented in Harare and its dormitory towns. The LCA results could possibly inform decisions for future MSWM in Harare and its dormitory towns considering the increasing population, lifestyles, global pressure for the need for sustainable cities, the impacts the current MSWM option has on both the environment and human health as well as the imminent closure of Pomona dumpsite whose capacity will be exhausted by 2020 [54].
2.6.2. The LCA System Boundaries
The processes that fall under the scope of the study are within the MSWM system boundary as denoted by the dotted line on Figure 2. The entire management processes of all MSW which is not managed by or on behalf of municipalities fall outside the system boundary and study scope. Associated impacts from emissions emanating from the construction of MSWM facilities were assumed negligible compared to those produced from the actual operation of the facilities, hence they were not considered under the study as noted by Mendes et al. [59].
2.6.3. LCA Functional Unit and Software Model
The annual MSW generation for Harare and its dormitory towns of 467,303 tons was considered the functional unit for LCA. Quite a number of studies applied the annual MSW generation as the functional unit [92,95,105]. SimaPro software Version 8.5.2 analyst and its associated database update852 produced by Pre’Sustainability consultants B.V in Amersfoort, Netherlands were used to undertake the LCA. The impacts loads associated with the materials and processes were gathered from the Ecoinvent 3 database (2018) [106]. The detailed input–output pathways for the LCA are as shown in Figure 3.
The anaerobic digestion project database modelled for the rest of the world found on the processing, waste, biowaste and transformation pathway was utilised for the LCA with 2.26 × 10⁷ m3 of biogas produced annually being the inputs for MSWM options A3, A4, A5 and A6 where AD was incorporated. Alternatively the AD project database modelled for the rest of the world on processes, waste treatment, waste, transformation and finally biowaste pathway can also be used if the amount of biowaste to be digested is used as input. For waste incineration, the respective individual waste types i.e., metals, glass, paper, biodegradable and plastics that constituted MSW were modelled using their corresponding project databases modelled for the rest of the world on the product selection pathway processes, waste treatment, waste, transformation, incineration then finally municipal incineration with the specific MSW fraction quantities provided in Table 4 under MSWM options A2, A3 and A5 being the inputs. The reason being that Ecoinvent MSW incineration database modelled for the rest of the world is only recommended to be used for MSW with an average of 92.8% burnable fraction which is not a characteristic of the MSW generated in Harare; MSW generated in Harare has a combustible fraction of just over 75%, as reported by Makarichi et al. [81]. The MSW fraction-specific Ecoinvent database modelled for the rest of the world on the processes, waste treatment, waste, transformation, landfilling and then finally sanitary landfilling pathway was used for landfilling with the waste-specific quantities provided in Table 4 for the scenarios that incorporated landfilling being used as model inputs. Waste collection and transportation average distance of 45 km was considered giving a total of 2.10 × 10⁷ t·km input on the Ecoinvent transport model for the rest of the world on the processes, transport, road and transformation pathway for all the MSWM options.
2.6.4. Life Cycle Impact Assessment (LCIA) Method
The LCIA for all the processes under the MSWM scenarios was undertaken using the ReCiPe 2016 v1.02 endpoint method, Hierarchist version, which is the default ReCiPe endpoint method. ReCiPe 2016 method is a new version of ReCiPe 2008 that was created by RIVM, Radboud University, Norwegian University of Science and Technology and PRé Consultants [107,108]. The method has 22 defined endpoint impact categories which are grouped into three damage categories, namely human health, ecosystems and resources. ReCiPe2016 has characterization factors that are globally representative rather than being representative only for Europe while at the same time providing the possible implementation of characterisation factors at national or continental scale for a handful of impact categories. The choices of values used in deriving characterisation factors and the midpoint characterization factors are provided by Huijbregts et al. [107] with the endpoint characterisation factors directly derived from the midpoint characterisation factors according to Equation (1). Therefore, constant global midpoint to endpoint characterisation factors were determined for all the impact categories save for fossil resource scarcity due to limited cause–effect pathway knowledge. The derivation of individual impact category midpoint to endpoint characterisation factors is provided [107,108].
where; CFe and CFm are the end and midpoint characterisation factors respectively, c is the cultural perspective; a is the area of protection, namely human health, freshwater ecosystems, marine ecosystems, terrestrial ecosystems or resource scarcity; x is the stressor of concern; and FM→,E,c,a is the conversion factor from midpoint to endpoint impact for c and a.
CFex,c,a = CFmx,c × FM→,E,c,a,
3. Results
Figure 3 shows the LCIA results for the acidification, eutrophication, global warming and human health impact potentials for the six MSW management options under consideration. All the MSW management options under consideration lead to a reduction in global warming and human health endpoint impact categories. Detailed results for the endpoint impact categories for acidification, eutrophication, global warming and human health are presented below.
3.1. Acidification
Figure 4, Figure 5, Figure 6 and Figure 7 show that MSW management options A1, A5 and A6 lead to reduction in acidification while A2, A3 and A4 contribute to increased acidification. The acidification impact potential is measured using the species extinction rates (species-years). A6 contributes the highest reduction in acidification potential of −3.9 × 10⁻² species-years, followed by A5 with an acidification potential reduction of −2.97 × 10⁻² species-years. Results show that A1 contributes the least acidification potential of −8.94 × 10⁻³ species-years, which is consistent with findings by Mendes el al. that landfilling with gas recovery and leachate treatment leads to reduced acidification impacts. The recovery of metals plays a crucial role in reducing the eutrophication impacts under A5 and A6 as observed by Beigl and Salhofer [105]. A2 leads to the greatest acidification potential of 4.13 × 10⁻² species-years, with A3 giving an acidification increase of 2.48 × 10⁻² species-years. A4 leads to the least increase in acidification of 8.57 × 10⁻³ species-years. Sensitivity analysis results from Table 5 show that increasing materials recovery levels for A5 and A6 to 28% and 24%, respectively, will result in zero acidification impact potentials.
3.2. Eutrophication
Figure 5 shows that MSW management options A1, A4, A5 and A6 bring about a reduction in eutrophication, with A2 and A3 leading to increased eutrophication. The eutrophication impact potential is measured using the species extinction rate (species-years). A1 has the highest eutrophication reduction potential of −2.16 × 10⁻² species-years followed by A6 with eutrophication potential reduction of −6.12 × 10⁻³ species-years. A4 and A5 have eutrophication reduction potentials of −3.77 × 10⁻³ and −2.81 × 10⁻³ species-years, respectively. A2 and A3 result in eutrophication potential increases of 2.55 × 10⁻⁴ and 1.60 × 10⁻³ species/year, respectively, indicating that the incineration of MSW leads to increased eutrophication, which was also noted by Hong et al. [109]. This confirms that materials recovery contributes to reduced eutrophication potential as it contributes to the reduced eutrophication potential characterizing A5 consisting of incineration, materials recovery and the AD of the biodegradable fraction of MSW. Sensitivity analysis results from Table 5 show that doubling the materials recovery levels under A5 and increasing it to 26% under A6 will result in zero eutrophication impact potentials.
3.3. Global Warming
As shown in Figure 6, all six scenarios lead to reductions in global warming, with A5 having the highest global warming reduction potential estimated at −9.05 × 10⁻¹ species-years followed by A3 that has a reduction potential in global warming of −8.28 × 10⁻¹ species-years. A2 brings about a global warming reduction potential of −7.68 × 10⁻¹ species-years and A1 has a −5.04 × 10⁻¹ species-years reduction potential. A6 has the second from least global warming reduction potential of −2.03 × 10⁻¹ species-years with A4 having the least reduction potential of −1.46 × 10⁻¹ species-years. It is therefore evident that the scenarios that combine other MSW treatment technologies with incineration perform better compared to those combined with landfilling, which is consistent with findings by Wittmaier et al. [110]. The materials recovery also contributed to reduced global warming potential as indicated by the increase in the reductions in global warming potential from A3 to A5 and A4 to A6. Results from Table 5 sensitivity analysis show that no materials recovery effort is necessary under A5 as reduction in global warming impact potential will be realised in its absence. However, under A6, sensitivity analysis indicates that a 6% materials recovery is sufficient to attain zero global warming impact potential.
3.4. Human Health
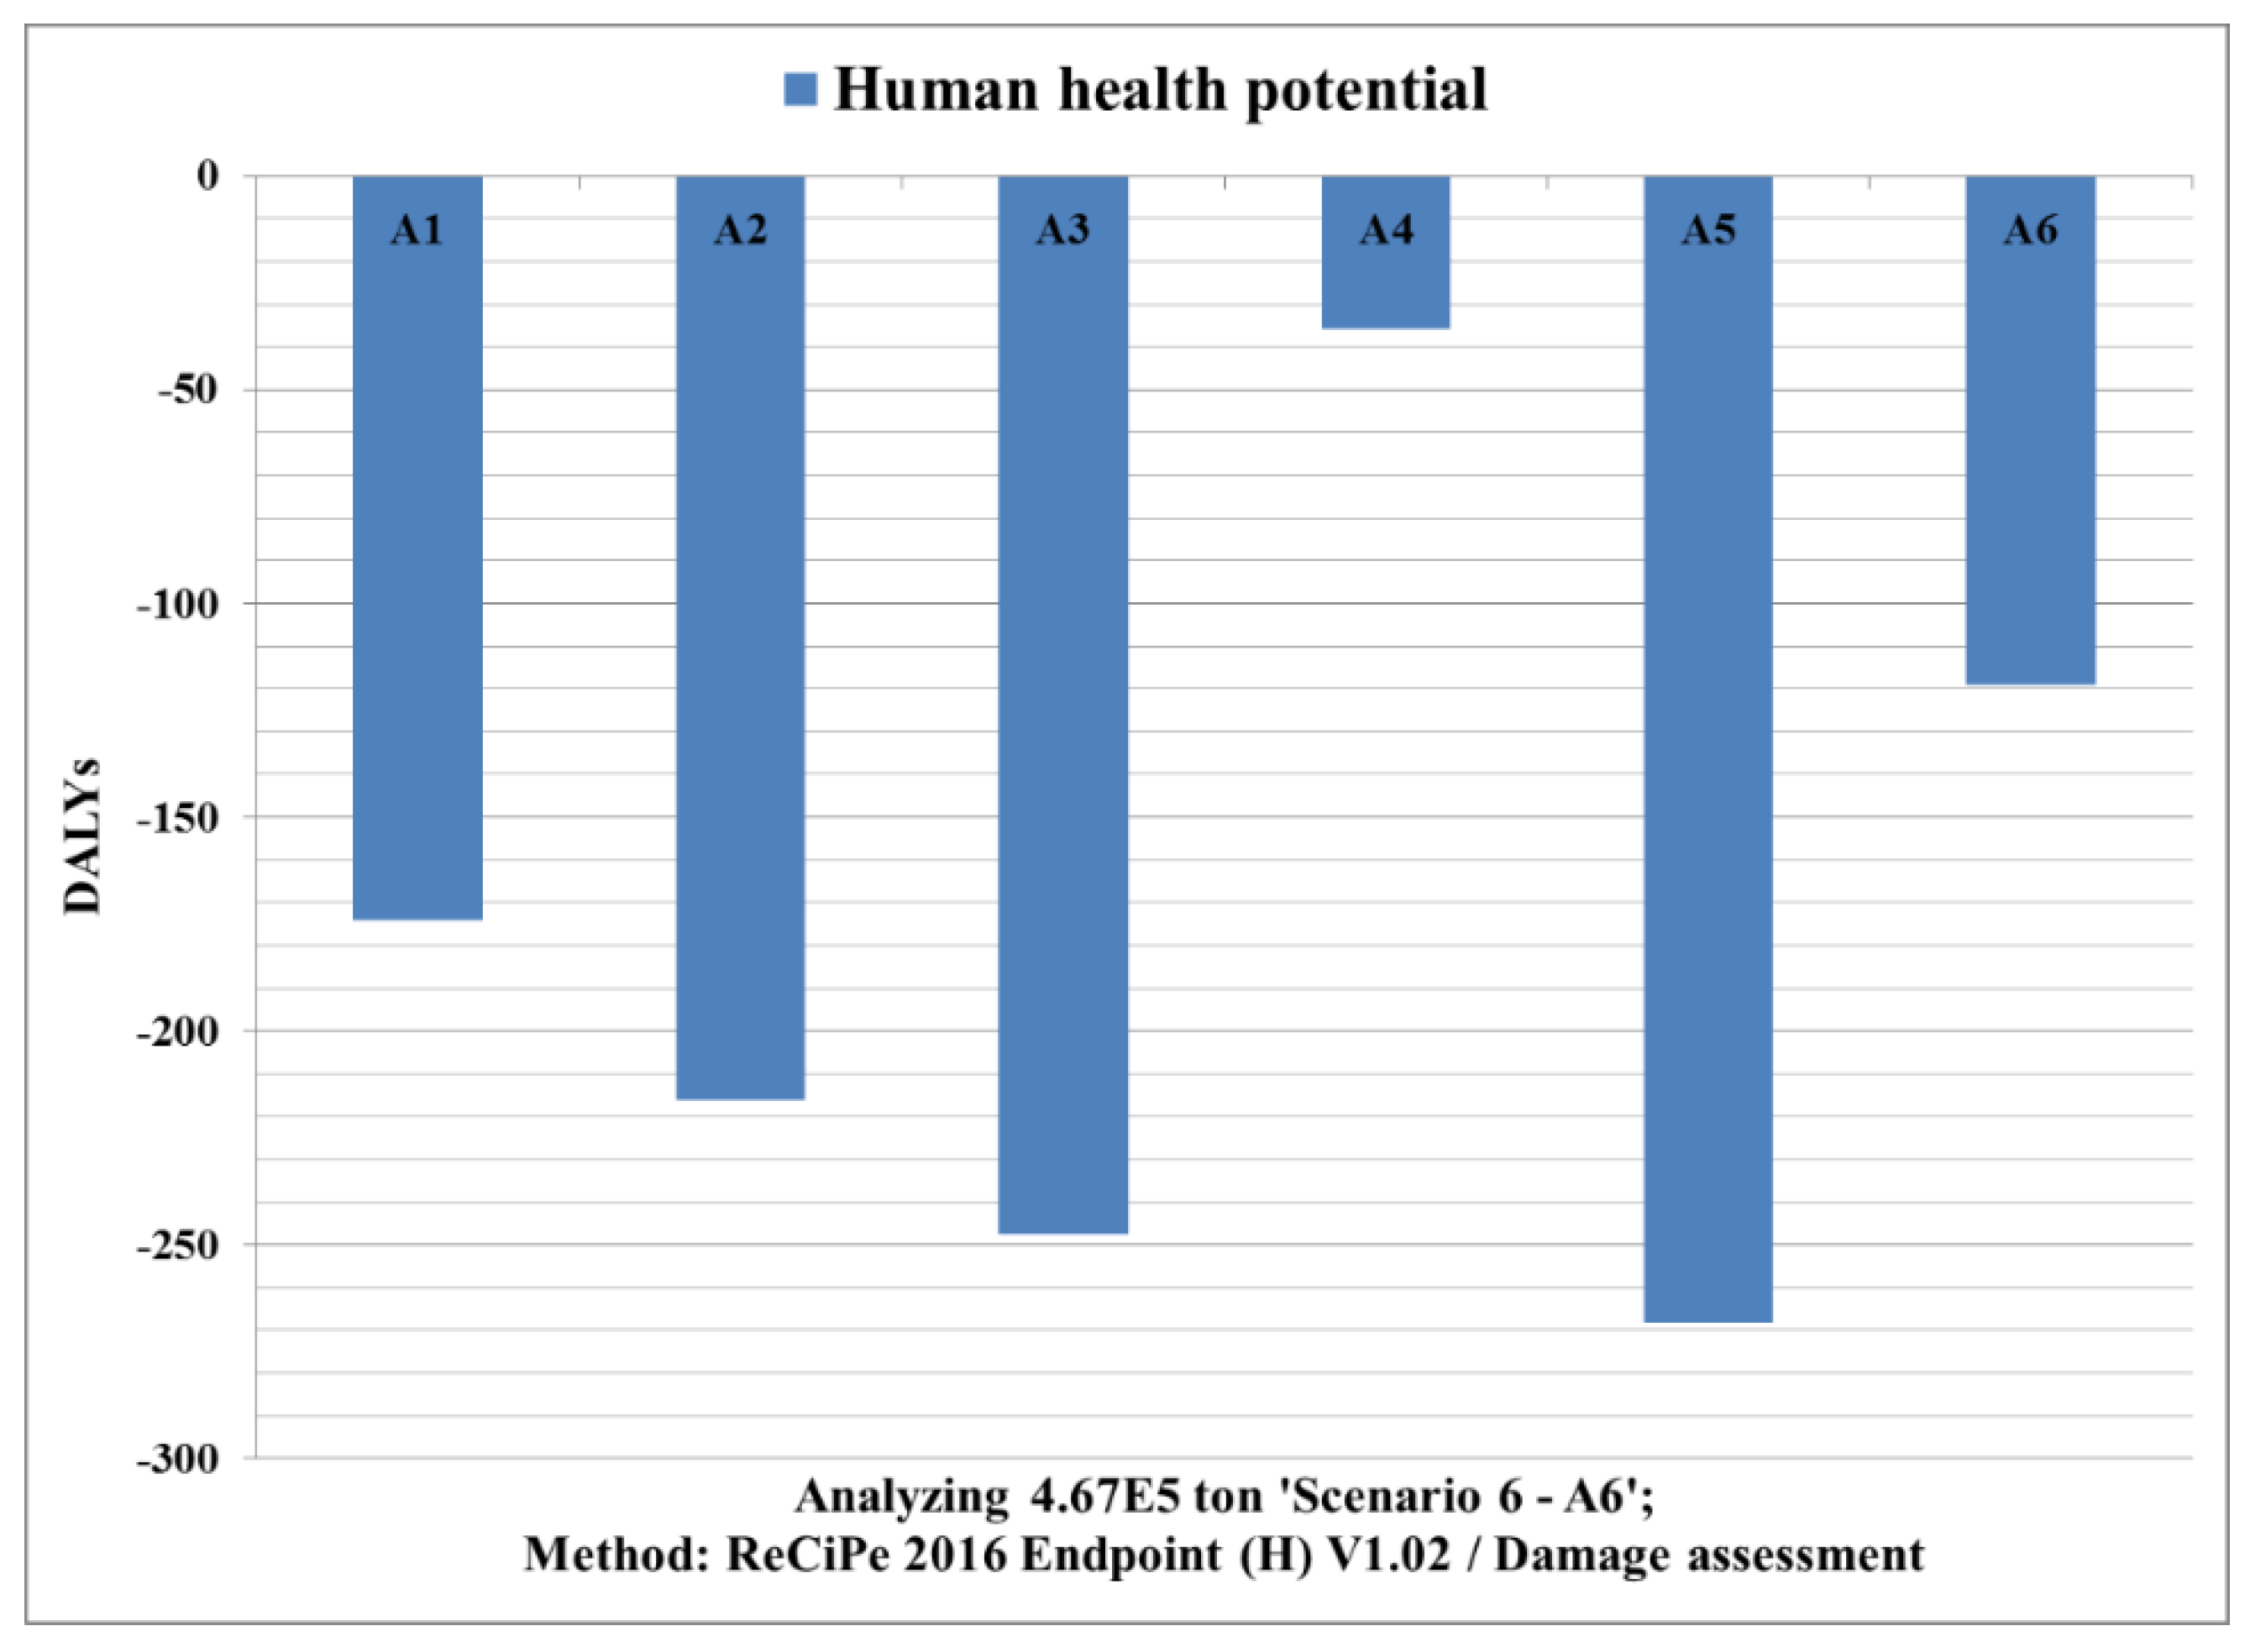
Figure 7 shows that all the MSW management options have negative human health impact potentials with option A5 having the highest reduction of −268 DALYs (an overall disease burden measure quantitatively expressed as the total number of years lost due to ill-health, disability or premature or early death) followed by A3 and A2 with human health reduction potentials of −247 and −216 DALYs, respectively. A1 and A6 have human health reduction potentials of −174 and −119 DALYs, respectively. A4 leads to the least reduction in human health of −36 DALYs. Results from Table 5 sensitivity analysis show that no materials recovery effort is necessary under A5 as reduction in human impact potential will be realised even without materials recovery. However, under A6, sensitivity analysis indicates a 9% materials recovery is sufficient to attain zero human health impact potential.
4. Discussion
LCIA results show that scenario A6 is the best option with regards to acidification while scenario A2 is the worst option. MSWM option A1 is the best scenario considering eutrophication potential and A3 is the worst. In terms of global warming and human health impact potential, A5 is the best option and A4 is the worst MSWM option. Overall, MSWM option A5 emerges as the best option for managing MSW in Harare as shown in Table 6. This is confirmed from findings by Sharma and Chandel [111] that MSWM systems that combines incineration, anaerobic digestion, composting and materials recovery have the least environmental impacts.
The recovery of landfill gas for combined heat and power (CHP) generation under the current study is attributed to the reduction of impact potentials across all the impact categories under consideration, except for A4 under acidification, in the MSWM options that incorporated landfilling because energy recovery from waste bring significant environmental benefits [95,110,112,113,114,115,116]. Khandelwal et al. [64], in their review of 153 LCA based MSWM studies published between 2013 and 2018, had 9 studies concluding the appropriateness of AD compared to biodegradable waste landfilling. The same review noted the conclusions from 11 studies regarding the appropriateness of landfilling with landfill gas recovery for CHP generation. This was also noted by Yadav and Samadder [62] in their review analysis of 91 LCA studies on MSWM undertaken from 2006 to 2017 in Asian countries with 5% of the reviewed studies reporting the relative environmental friendliness and sustainability of landfilling with landfill gas recovery—an observation that was also observed by Menikpura et al. [117].
Yadav and Samadder [62] further observed that incineration was reported as a better option than landfilling by 9% of the reviewed studies largely due to the reduced methane emissions associated with incineration. This observation is in agreement with this study’s conclusions with regards to human health and global warming impact categories since MSWM options A2, A3 and A5 that incorporated incineration bring more global warming and human health impact potential reductions than A1, A4 and A6 which incorporated landfilling. Cleary [65], like Yadav and Samadder [62], also noted the better performance of thermal treatment with regards to global warming, which is consistent with this study’s findings. Thermal treatment was also reported to perform better than landfilling in a critical review of 222 published LCA studies on SWM systems in general, accessed from 216 peer reviewed articles and 15 public reports undertaken by Laurent et al. [63] and Laurent et al. [66].
Overall review results by Yadav and Samadder [62] show that 71% of the reviewed LCAs found landfilling to be the worst or least preferred MSWM treatment option with 8% of the studies concluding incineration to be the worst or least preferred MSW treatment option among other treatment options due to its associated harmful emissions in the form of dioxins and furans as well as human toxicity. Cleary [65], in their review of 20 LCA-based MSWM assessments undertaken and published in peer-reviewed journals between 2002 and 2008, observed that 19 studies confirmed the low environmental performance of landfilling. A review by Abeliotis [60] of 21 LCA studies further observed that landfilling was reported as the worst option for managing and treating MSW, as was observed by Mendes et al. [118], Hong et al. [109], Wanichpongpan and Gheewala [116], Cherubini et al. [95] and Miliūtė and Staniškis [102]. However, despite these reported low environmental performances of landfilling, it performed better than incineration with regards to acidification and eutrophication impact potentials under this study. This is also contrary to observations made by Cleary [65], who noted the better performance of thermal treatment compared to landfilling with regards to eutrophication and acidification impact categories.
The better environmental performance of recycling and thermal treatment of plastics and paper compared to landfilling, as shown by the best performance of A5 which combined incineration and recovery of materials together with AD, was observed by Laurent et al. [63] and Laurent et al. [66] in their reviews consistent with findings by Michaud et al. [119], Lazarevic et al. [120] and Tyskeng and Finnveden [121]. Materials recovery and recycling are environmentally appropriate and sustainable as they lead to reduced environmental impacts potentials [60,62,63,64,65,66,102]. This is confirmed by the better performances of A5 compared to A3 and of A6 compared A4 under this study; sensitivity analysis results that reveal an inverse relation between materials recovery levels and the magnitudes of environmental impact potentials.
Differences in results from LCA studies were observed by Laurent et al. [66] who noted little agreements with regards to the conclusions and no definite agreement except for landfilling with regards to which amongst thermal treatment, anaerobic digestion and recycling is most preferable for managing or treating plastic, paper, organics and metals. De Feo and Malvano [122] observed that the best IMSWM option is subject to the examined impact categories, hence the differences amongst impact categories considered render other MSWM or treatment methods environmentally sustainable while simultaneously rendering others as unsustainable. Khandelwal et al. [64] singled out the heterogeneous nature of MSW as a factor that makes no single MSW treatment method capable to be applied to all the MSW fractions, inevitably resulting in different LCA results from region to region due to differences in MSW generation and composition, MSWM structures, system boundaries, MSWM practices and the choice of impact categories.
5. Conclusions
LCIA results show that scenario A6 is the best option with regards to acidification while scenario A2 is the worst option. MSW management option A1 is the best scenario considering eutrophication potential and A3 is the worst. In terms of global warming and human health impact potential, A5 is the best option and A4 is the worst MSW management option. Overall, MSW management option A5 emerges the best option for managing MSW in Harare as shown in Table 6. This is confirmed from findings by Sharma and Chandel [111] that MSW management that combines incineration, anaerobic digestion, composting and materials recovery has the least environmental impacts. Therefore, the LCA results from this study will inform the design and development of future integrated MSWM systems with reduced environmental and human health impacts. Furthermore, the study will provide a baseline for design and development of further studies to assess economic affordability, social acceptability, renewable energy and job creation potential of the LCA-identified integrated MSWM system with least environmental impact potential. The compositing option for the organic fraction of the MSW instead of anaerobic digestion should also be incorporated in future LCA studies. The study had its own limitations due to the unavailability of quality and reliable data on waste generation and transportation. Therefore, studies to quantify the waste generation and composition in Harare must be undertaken to give reliable data that could be used for further LCIA of MSWM options for Harare.
Author Contributions
The work is part of T.N.’s study towards a PhD under the supervision of E.M. at the University of Johannesburg. T.N. conceptualized the research proposal with E.M. giving guidance regarding the methodological framework. T.N. applied for software from the Life Cycle Initiative in partnership with the UN Environment and Pre-sustainability under the 2017 Life Cycle Awards and his proposal was awarded the Life Cycle award that provided the Simapro 8.5.2 and associated databases. T.N. also applied for research funds from the National Geographic Society under their Early Careers scientist which was awarded to facilitate fieldwork and data collection for the study. E.M. gave guidance in scenario development with T.N. responsible for setting up the input output systems on the Simapro software interface for simulation. T.N. actively analysed the results and undertook sensitivity analysis under the supervision of E.M. T.N. prepared the manuscript with E.M. doing the editing, supervision and reviewing.
Funding
This research was funded by Life Cycle Initiative in partnership with the United Nations Environment Programme (UNEP), PRé Sustainability and Federation of Indian Chambers of Commerce and Industry (FICCI) through the Life Cycle Assessment award. The National Geographic Society funded fieldwork, grant number HJ-170ER-17. The University of Johannesburg funded Trust Nhubu’s PhD studies.
Acknowledgments
The authors acknowledge the Life Cycle Initiative for awarding the project the 2017 Life Cycle award in the form of Simapro software that was used to carry out the LCIA. The authors are also grateful to the National Geographic Society for awarding the project the early career grant. The Zimbabwe Environmental Management Agency, Zimbabwe National Statistical Agency, Harare City Council are greatly appreciated for assistance with data for the study. The University of Johannesburg is greatly appreciated for funding these studies.
Conflicts of Interest
No conflict of interest declared.
References
- Hoornweg, D.; Bhada-Tata, P. What a Waste: A Global Review of Solid Waste Management; Urban Development Series; Knowledge Papers; World Bank: Washington, DC, USA, 2012; Available online: https://openknowledge.worldbank.org/handle/10986/17388License:CCBY3.0IGO (accessed on 22 March 2018).
- OECD. Municipal Waste. In Environment at a Glance 2013: OECD Indicators; OECD Publishing: Paris, France, 2013. [Google Scholar]
- UN. Urban and Rural Areas. 2009. Available online: http://www.un.org/en/development/desa/population/publications/urbanization/urban-rural.shtml (accessed on 14 July 2018).
- UNEP; IETC. Urban Waste Management Strategy; United Nation Environment Programme (UNEP)-International Environment Technology Centre (IETC): Nairobi, Kenya, 2003. [Google Scholar]
- Dickerson, G.W. Solid Waste: Trash to Treasury in an Urban Environment. N. M. J. Sci. 1999, 8, 166–199. [Google Scholar]
- Ndum, E.A.; Busch, G.; Voigt, H. Bottom-Up Approach to Sustainable Solid Waste Management in African Countries. Ph.D. Thesis, Brandenburg University of Technology, Cottbus, Germany, 2013. [Google Scholar]
- Afolayan, O.; Ogundele, F.; Odewumi, S. Spatial variation in landfills leachate solution in urbanized area of Lagos State, Nigeria. Am. Int. J. Contemp. Res. 2012, 2, 178–184. [Google Scholar]
- Dongquing, Z.; Tan, S.; Gersberg, R. A comparison of municipal solid waste management in Berlin and Singapore. Waste Manag. 2010, 30, 921–933. [Google Scholar]
- Twardowska, I. Solid Waste: Assessment, Monitoring and Remediation. Waste Manag. Ser. 2004, 4, 3–32. [Google Scholar]
- UNEP. Thematic Focus: Ecosystem Management, Environmental Governance, Harmful Substances and Hazardous Waste. Municipal Solid Waste: Is It Garbage or Gold? 2013. Available online: http://na.unep.net/geas/getUNEPPageWithArticleIDScript.php? article_id=105 (accessed on 13 February 2018).
- Lundström. Sustainable Waste Management: International Perspectives. In Proceedings of the International Conference on Sustainable Solid Waste Management, Chennai, India, 5–7 September 2007; pp. 1–8. [Google Scholar]
- UNDESA. Agenda 21- Chapter 21 Environmentally Sound Management of Solid Wastes and Sewage-related Issues. Division for Sustainable Development, United Nations Department of Economic and Social Affairs. 2005. Available online: http://www.un.org/esa/sustdev/documents/agenda21/index.htm (accessed on 15 February 2018).
- Worrell, W.A.; Vesilind, P.A. Solid Waste Engineering, 2nd ed.; Cengage Learning; Stamford: Dhaka, Bangladesh, 2011. [Google Scholar]
- Seadon, J.K. Integrated waste management—Looking beyond the solid waste horizon. Waste Manag. 2006, 26, 1327–1336. [Google Scholar] [CrossRef]
- Melosi, M.V. Garbage in the Cities: Refuse, Reform, and the Environment, 1880–1980, 1st ed.; Texas A&M University Press: College Station, TX, USA, 1981. [Google Scholar]
- Louis, G.E. A historical context of municipal solid waste management in the United States. Waste Manag. Res. 2004, 22, 306–322. [Google Scholar] [CrossRef]
- Tchobanoglous, G.; Theisen, H.; Eliassen, R. Solid Wastes: Engineering Principles and Management Issues; Mcgraw-Hill: New York, NY, USA, 1977. [Google Scholar]
- Henry, R.K.; Yongsheng, Z.; Jun, D. Municipal solid waste management challenges in developing countries—Kenyan case study. Waste Manag. 2006, 26, 92–100. [Google Scholar] [CrossRef]
- Nemerow, N.L. Environmental Engineering: Environmental Health and Safety for Municipal Infrastructure, Land Use and Planning, and Industry, 6th ed.; Wiley: Hoboken, NJ, USA, 2009. [Google Scholar]
- Wilson, D.C. Development drivers for waste management. Waste Manag. Res. 2007, 25, 198–207. [Google Scholar] [CrossRef]
- Marshall, R.E.; Farahbakhsh, K. Systems approaches to integrated solid waste management in developing countries. Waste Manag. 2013, 33, 988–1003. [Google Scholar] [CrossRef]
- Rodic, L.; Wilson, D.C.; Scheinberg, A. Solid Waste Management in the World’s Cities; UN-HABITAT: Nairobi, Kenya, 2010. [Google Scholar]
- McDougall, F.; White, P.R.; Franke, M.; Hindle, P. Integrated Solid Waste Management: A Lifecycle Inventory; Blackwell Science Publishing: Oxford, UK, 2001. [Google Scholar]
- van de Klundert, A.; Anschutz, J. Integrated Sustainable Waste Management—The Concept: Tools for Decision-Makers. Experiences from the Urban Waste Expertise Programme (1995–2001); Scheinberg, A., Ed.; WASTE: Gouda, The Netherlands, 2001. [Google Scholar]
- Wolsink, M. Contested environmental policy infrastructure: Socio-political acceptance of renewable energy, water, and waste facilities. Environ. Impact Assess. Rev. 2010, 30, 302–311. [Google Scholar] [CrossRef] [Green Version]
- CEC. Second EC Environment Action Programme; Commission of the European Communities: Brussels, Belgium, 1977. [Google Scholar]
- Noto, F. Overcoming NIMBY Opposition; Public Sector Digest: London, ON, Canada, 2010; pp. 1–5. [Google Scholar]
- Tsiko, R.G.; Togarepi, S. A situational analysis of waste management in Harare, Zimbabwe. J. Am. Sci. 2012, 8, 692–706. [Google Scholar]
- Manzungu, E.; Chioreso, R. Internalising a Crisis? Household Level Response to Water Scarcity in the City of Harare, Zimbabwe. J. Soc. Dev. Afr. 2012, 27, 111. [Google Scholar]
- Konteh, F.H. Urban sanitation and health in the developing world: Reminiscing the nineteenth century industrial nations. Health Place 2009, 15, 69–78. [Google Scholar] [CrossRef] [PubMed]
- Rodic, L.; Scheinberg, A.; Wilson, D.C. Comparing Solid Waste Management in the World’s Cities. In Proceedings of the ISWA World Congress 2010, Urban Development and Sustainability—A Major Challenge for Waste Management in the 21st Century, Hamburg, Germany, 15–18 November 2010. [Google Scholar]
- Coffey, M.; Coad, A. Collection of Municipal Solid Waste in Developing Countries; United Nations Human Settlement Programme—UN-HABITAT: Nairobi, Kenya, 2010. [Google Scholar]
- Memon, M.A. Integrated solid waste management based on the 3R approach. J. Mater. Cycles Waste Manag. 2010, 12, 30–40. [Google Scholar] [CrossRef]
- Simelane, T.; Mohee, R. Future Directions of Municipal Solid Waste Management in Africa; Africa Institute of South Africa (AISA): Pretoria, South Africa, 2012; pp. 1–6. [Google Scholar]
- Iriruaga, E.T. Solid Waste Management in Nigeria. D-WASTE. 2012. Available online: www.d-waste.com (accessed on 17 August 2019).
- Muzenda, E.; Ntuli, F.; Pilusa, T.J. Waste Management, Strategies and Situation in South Africa: An Overview, World Academy of Science, Engineering and Technology. Int. J. Environ. Ecol. Eng. 2012, 6, 552–555. [Google Scholar]
- Ogwueleka, T. Municipal Solid Waste Characteristics and Management in Nigeria, Abuja; University of Abuja: Abuja, Nigeria, 2009. [Google Scholar]
- Senkoro, H. Solid Waste Management in Africa. A WHO/AFRO Perspective. In Proceedings of the CWR Workshop on Solid Waste Collection that Benefits the Urban Poor, St. Gallen, Switzerland, March 2003. [Google Scholar]
- Achankeng, E. Globalisation, Urbanisation and Municipality Solid Waste management in Africa. In Proceedings of the African Studies Association of Australasia and the Pacific, Africa on a Global Scale, Adelaide, Australia, January 2003. [Google Scholar]
- Makwara, E.C.; Snodia, S. Confronting the reckless gambling with people’s health and lives: Urban solid waste mangement in Zambabwe. Eur. J. Sustain. Dev. 2013, 2, 67–98. [Google Scholar]
- Mapira, J. Challenges of solid Waste Disposal and Management in the city of Masvingo. J. Soc. Dev. Afr. 2012, 26, 67–91. [Google Scholar]
- McDougall, F.R.; White, P.R.; Franke, M.; Hindle, P. Integrated Solid Waste Management: A Life Cycle Inventory; John Wiley & Sons: Hoboken, NJ, USA, 2008. [Google Scholar]
- GoZ. Zimbabwe Environment Outlook: Our Environment, Everybody’s Responsibility; Feresu, S.B., Ed.; Government of Zimbabwe (GoZ) Ministry of Environment & Natural Resources Management: Harare, Zimbabwe, 2010.
- Tevera, D.S. Solid waste disposal in Harare and its effects on the environment: Some preliminary observations. Zimb. Sci. News 1991, 25, 9–13. [Google Scholar]
- Masocha, M.; Tevera, D.S. Open waste dumps in Victoria Falls Town: Spatial patterns, environmental threats and public health implications. Geogr. J. Zimb. 2003, 33/34, 9–19. [Google Scholar]
- Mapira, J. Pollution of the Sakubva River, Mutare(Zimbabwe): Culprits, Penalties and Consequences. Zimb. J. Geogr. Res. 2007, 1, 9–19. [Google Scholar]
- Makwara, E.C. Work Related Environmental Health Risks:The Case of Garbage Handlers in the City of Masvingo; Lambert Academic Publishing: Saarbrucken, Germany, 2011. [Google Scholar]
- Mafume, P.N.; Zendera, W.; Mutetwa, M.; Musimbo, N. Challenges of solid waste management in Zimbabwe: A case study of Sakubva high density suburb. J. Environ. Waste Manag. 2016, 3, 142–155. [Google Scholar]
- Musademba, D.; Musiyandaka, S.; Muzinda, A.; Nhemachena, B.; Jambwa, D. Municipality Solid Waste (MSW) Management Challenges of Chinhoyi Town in Zimbabwe: Opportunities of Waste Reduction and Recycling. J. Sustain. Dev. Afr. 2011, 13, 168–180. [Google Scholar]
- Mangizvo, R.V. Challenges of Solid Waste Management in the Central Business District of the City of Gweru in Zimbabwe. J. Sustain. Dev. Afr. 2007, 9, 134–145. [Google Scholar]
- Mangizvo, R.V. Illegal Dumping of Solid Waste in the Alleys in the Central Business District of Gweru, Zimbabwe. J. Sustain. Dev. Afr. 2010, 12, 110–123. [Google Scholar]
- Muchandiona, A.; Nhapi, I.; Misi, S.; Gumindoga, W. Challenges and Opportunities in Solid Waste Management in Zimbabwe’s Urban Councils; University of Zimbabwe: Harare, Zimbabwe, 2013; p. 87. [Google Scholar]
- Tanyanyiwa, V.I. Not In My Backyard (NIMBY)?: The Accumulation of Solid Waste in the Avenues Area, Harare, Zimbabwe. Int. J. Innov. Res. Dev. 2015, 4, 122–128. [Google Scholar]
- Chijarira, S.R. The Impact of Dumpsite Leachate on Ground and Surface Water: A Case Study of Pomona Waste Dumpsite; Department of Geography, Bindura University of Science and Technology: Bindura, Zimbabwe, 2013; p. 63. [Google Scholar]
- Rebitzer, G.; Ekvall, T.; Frischknecht, R.; Hunkeler, D.; Norris, G.; Rydberg, T.; Schmidt, W.P.; Suh, S.; Weidema, B.P.; Pennington, D.W. Life cycle assessment: Part 1: Framework, goal and scope definition, inventory analysis, and applications. Environ. Int. 2004, 30, 701–720. [Google Scholar] [CrossRef]
- Winkler, J.; Bilitewski, B. Comparative evaluation of life cycle assessment models for solid waste management. Waste Manag. 2007, 27, 1021–1031. [Google Scholar] [CrossRef]
- Güereca, L.P.; Gassó, S.; Baldasano, J.M.; Jiménez-Guerrero, P. Life cycle assessment of two biowaste management systems for Barcelona, Spain. Resour. Conserv. Recycl. 2006, 49, 32–48. [Google Scholar] [CrossRef]
- Blengini, G.A.; Fantoni, M.; Busto, M.; Genon, G.; Zanetti, C. Participatory approach, acceptability and transparency of waste Management LCAs: Case studies of Torino and Cuneo. Waste Manag. 2012, 32, 1712–1721. [Google Scholar] [CrossRef]
- Mendes, M.R.; Aramaki, T.; Hanaki, K. Comparison of the environmental impact of incineration and landfilling in Sao Paulo City as determined by LCA. Resour. Conserv. Recycl. 2004, 41, 47–63. [Google Scholar] [CrossRef]
- Abeliotis, K. Life cycle assessment in municipal solid waste management. In Integrated Waste Management; Kumar, S., Ed.; INTECH Open Access Publisher: London, UK, 2011. [Google Scholar]
- Koci, V.; Trecakova, T. Mixed municipal waste management in the Czech Republic from the point of view of the LCA method. Int. J. Life Cycle Assess. 2011, 16, 113–124. [Google Scholar] [CrossRef]
- Yadav, P.; Samadder, S.R. A critical review of the life cycle assessment studies on solid waste management in Asian countries. J. Clean. Prod. 2018, 185, 492–515. [Google Scholar] [CrossRef]
- Laurent, A.; Clavreul, J.; Bernstad, A.; Bakas, I.; Niero, M.; Gentil, E.; Christensen, T.H.; Hauschild, M.Z. Review of LCA studies of solid waste management systems–Part II: Methodological guidance for a better practice. Waste Manag. 2014, 34, 589–606. [Google Scholar] [CrossRef] [PubMed]
- Khandelwal, H.; Dhar, H.; Thalla, A.K.; Kumar, S. Application of life cycle assessment in municipal solid waste management: A worldwide critical review. J. Clean. Prod. 2019, 209, 630–654. [Google Scholar] [CrossRef]
- Cleary, J. Life cycle assessments of municipal solid waste management systems: A comparative analysis of selected peer-reviewed literature. Environ. Int. 2009, 35, 1256–1266. [Google Scholar] [CrossRef] [PubMed]
- Laurent, A.; Bakas, I.; Clavreul, J.; Bernstad, A.; Niero, M.; Gentil, E.; Hauschild, M.Z.; Christensen, T.H. Review of LCA studies of solid waste management systems–Part I: Lessons learned and perspectives. Waste Manag. 2014, 34, 573–588. [Google Scholar] [CrossRef]
- Zimstat. 2012 Zimbabwe Census National Report, Zimbabwe National Statistics Agency. 2013. Available online: www.zimstat.co.zw/sites/default/files/img/publications/Population/National_Report.pdf (accessed on 23 August 2017).
- UNEP; CalRecovery. Solid Waste Management; UNEP: Nairobi, Kenya, 2005. [Google Scholar]
- Hester, R.E.; Harrison, R.M. Environmental and Health Impact of Solid Waste Management Practices; Royal Society of Chemistry: Cambridge, UK, 2002. [Google Scholar]
- EMA. Environmental Management Agency Statutory Instrument 10 of 2007: Environmental Management (Hazardous waste management) Regulations. 2007. Available online: https://www.ema.co.zw/about-us/law/environmental-regulations/item/17-hazardous-waste-management-regulations-si-10-2007 (accessed on 1 September 2019).
- Kawai, K.; Tasaki, T. Revisiting estimates of municipal solid waste generation per capita and their reliability. J. Mater. Cycles Waste Manag. 2015, 2016, 1–13. [Google Scholar] [CrossRef]
- Afon, A. An analysis of solid waste generation in a traditional African city: The example of Ogbomoso, Nigeria. Environ. Urban. 2007, 19, 527–537. [Google Scholar]
- Mshandete, A.M.; Parawira, W. Biogas Technology Research in Selected Sub-Saharan African Countries—A Review. Afr. J. Biotechnol. 2009, 8, 116–125. [Google Scholar]
- Pawandiwa, C.C. Municipal Solid Waste Disposal Site Selection the Case of Harare. Master’s Thesis, University of the Free State, Bloemfontein, South Africa, 2013. [Google Scholar]
- Mbiba, B. Urban solid waste characteristics and household appetite for separation at source in Eastern and Southern Africa. Habitat Int. 2014, 43, 152–162. [Google Scholar] [CrossRef]
- Emenike, C.U.; Iriruaga, E.T.; Agamuthu, P.; Fauziah, S.H. Waste Management in Africa: An Invitation to Wealth Generation. In Proceedings of the International Conference on Waste Management and Environment, ICWME, Kuala Lumpur, Malaysia, 26–27 August 2013; pp. 1–6. [Google Scholar]
- Miezah, K.; Obiri-Danso, K.; Kádár, Z.; Fei-Baffoe, B.; Mensah, M.Y. Municipal solid waste characterization and quantification as a measure towards effective waste management in Ghana. Waste Manag. 2015, 46, 15–27. [Google Scholar] [CrossRef] [PubMed] [Green Version]
- EEA. Managing Municipal Solid Waste—A Review of Achievements in 32 European Countries; European Environment Agency: Copenhagen, Denmark, 2013; Available online: http://www.eea.europa.eu/publications/managing-municipal-solid-waste (accessed on 11 November 2018).
- Al-Khatib, I.A.; Monou, M.; Abu Zahra, A.F.; Shaheen, H.Q.; Kassinos, D. Solid waste characterization, quantification and management practices in developing countries. A case study of Nablus district, Palestine. J. Environ. Manag. 2010, 91, 1131–1138. [Google Scholar] [CrossRef] [PubMed]
- Nyanzou, P.; Steven, J. Solid waste management practices in high density suburbs of Zimbabwe: A focus on Budiriro 3, Harare. Dyke 2014, 8, 17–54. [Google Scholar]
- Makarichi, L.; Kan, R.; Jutidamrongphan, W.; Techato, K.A. Suitability of municipal solid waste in African cities for thermochemical waste-to-energy conversion: The case of Harare Metropolitan City, Zimbabwe. Waste Manag. Res. 2019, 37, 83–94. [Google Scholar] [CrossRef] [PubMed]
- EMA. Waste Generation and Management in Harare, Zimbabwe: Residential Areas, Commercial Areas and Schools; Environmental Management Agency: Harare, Zimbabwe, 2016; in press. [Google Scholar]
- GoZ. Zimbabwe’s Integrated Solid Waste Management Plan; Government of Zimbabwe, Environmental Management Agency, Institute of Environmental Studies, University of Zimbabwe: Harare, Zimbabwe, 2014; pp. 1–98.
- Tirivanhu, D.; Feresu, S. A Situational Analysis of Solid Waste Management in Zimbabwe’s Urban Centres; Institute of Environment Studies, University of Zimbabwe: Harare, Zimbabwe, 2013; pp. 1–153. [Google Scholar]
- Mudzengerere, F.H.; Chigwenya, A. Waste management in Bulawayo City Council in Zimbabwe: In search of sustainable waste management in the city. J. Sustain. Dev. Afr. 2012, 14, 228–244. [Google Scholar]
- Moreno Ruiz, E.; Lévová, T.; Reinhard, J.; Valsasina, L.; Bourgault, G.; Wernet, G. Documentation of Changes Implemented in Ecoinvent Database v3.3; Ecoinvent: Zürich, Switzerland, 2016. [Google Scholar]
- Stucki, M.; Jungbluth, N.; Leuenberger, M. Life Cycle Assessment of Biogas Production from Different Substrates; Final report; Federal Department of Environment, Transport, Energy and Communications, Federal Office of Energy: Bern, Switzerland, 2011. [Google Scholar]
- Achinas, S.; Achinas, V.; Euverink, G.J.W. A technological overview of biogas production from biowaste. Enginering 2017, 3, 299–307. [Google Scholar] [CrossRef]
- GMI. Summary of Findings Anaerobic Digestion for MSW; Global Methane Initiative: Florianopolis, Brazil, 2014. [Google Scholar]
- Kigozi, R.; Aboyade, A.; Muzenda, E. Biogas production using the organic fraction of municipal solid waste as feedstock. Int’l J. Res. Chem. Metall. Civ. Eng. 2013, 1, 107–114. [Google Scholar]
- ISO. (ISO 14044:2006). Ginebra, Suiza. 2006. Available online: www.iso.org/iso/home.htm (accessed on 11 July 2019).
- Fernández-Nava, Y.; Del Rio, J.; Rodríguez-Iglesias, J.; Castrillón, L.; Marañón, E. Life Cycle Assessment (LCA) of different municipal solid waste management options: A case study of Asturias (Spain). J. Clean. Prod. 2014, 81, 178–189. [Google Scholar] [CrossRef]
- Montejo, C.; Tonini, D.; Márquez, M.C.; Astrup, T.F. Mechanical biological treatment: Performance and potentials. An LCA of 8 MBT plants including waste characterization. J. Environ. Manag. 2013, 128, 661–673. [Google Scholar] [CrossRef]
- Arena, U.; Mastellone, M.L.; Perugini, F. The environmental performance of alternative solid waste management options: A life cycle assessment study. Chem. Eng. J. 2003, 96, 207–222. [Google Scholar] [CrossRef]
- Cherubini, F.; Bargigli, S.; Ulgiati, S. Life cycle assessment (LCA) of waste management strategies: Landfilling, sorting plant and incineration. Energy 2009, 34, 2116–2123. [Google Scholar] [CrossRef]
- Han, H.; Long, J.; Li, S.; Qian, G. Comparison of green-house gas emission reductions and landfill gas utilization between a landfill system and an incineration system. Waste Manag. Res. 2010, 28, 315–321. [Google Scholar]
- Song, Q.; Wang, Z.; Li, J. Environmental performance of municipal solid waste strategies based on LCA method: A case study of Macau. J. Clean. Prod. 2013, 57, 92–100. [Google Scholar] [CrossRef]
- Lundie, S.; Peters, G.M. Life cycle assessment of food waste management options. J. Clean. Prod. 2005, 13, 275–286. [Google Scholar] [CrossRef]
- Gunamantha, M.; Sarto. Life cycle assessment of municipal solid waste treatment to energy options: Case study of Kartamantul region, Yogyakarta. Renew. Energy 2012, 41, 277–284. [Google Scholar] [CrossRef]
- Assamoi, B.; Lawryshyn, Y. The environmental comparison of landfilling vs. incineration of MSW accounting for waste diversion. Waste Manag. 2012, 32, 1019–1030. [Google Scholar] [CrossRef]
- Vergara, S.E.; Damgaard, A.; Horvath, A. Boundaries matter: Greenhouse gas emission reductions from alternative waste treatment strategies for California’s municipal solid waste. Resour. Conserv. Recycl. 2011, 57, 87–97. [Google Scholar] [CrossRef]
- Miliute, J.; Kazimieras Staniškis, J. Application of life-cycle assessment in optimisation of municipal waste management systems: The case of Lithuania. Waste Manag. Res. 2010, 28, 298–308. [Google Scholar] [CrossRef]
- Ogundipe, F.O.; Jimoh, O.D. Life Cycle Assessment of Municipal Solid Waste Management in Minna, Niger State, Nigeria. Int. J. Environ. Res. 2015, 9, 1305–1314. [Google Scholar]
- Ayodele, T.R.; Ogunjuyigbe, A.S.O.O.; Alao, M.A. Life cycle assessment of waste-to-energy (WtE) technologies for electricity generation using municipal solid waste in Nigeria. Appl. Energy 2017, 201, 200–218. [Google Scholar] [CrossRef]
- Beigl, P.; Salhofer, S. Comparison of ecological effects and costs of communal waste management systems. Resour. Conserv. Recycl. 2004, 41, 83–102. [Google Scholar] [CrossRef] [Green Version]
- Moreno Ruiz, E.; Valsasina, L.; Brunner, F.; Symeonidis, A.; FitzGerald, D.; Treyer, K.; Bourgault, G.; Wernet, G. Documentation of Changes Implemented in Ecoinvent Database v3.5; Ecoinvent: Zürich, Switzerland, 2018. [Google Scholar]
- Huijbregts, M.A.; Steinmann, Z.J.; Elshout, P.M.; Stam, G.; Verones, F.; Vieira, M.; Zijp, M.; Hollander, A.; van Zelm, R. ReCiPe2016: A harmonised life cycle impact assessment method at midpoint and endpoint level. Int. J. Life Cycle Assess. 2017, 22, 138–147. [Google Scholar] [CrossRef]
- Huijbregts, M.A.J.; Steinmann, Z.J.N.; Elshout, P.M.F.; Stam, G.; Verones, F.; Vieira, M.D.M.; Hollander, A.; Zijp, M.; Van Zelm, R. ReCiPe 2016: A Harmonized Life Cycle Impact Assessment Method at Midpoint and Endpoint Level Report I: Characterization. RIVM Report 2016-0104. 2016. Available online: http://www.rivm.nl/en/Topics/L/Life_Cycle_Assessment_LCA/Downloads/Documents_ReCiPe2017/Report_ReCiPe_Update_2017 (accessed on 27 July2017).
- Hong, R.J.; Wang, G.F.; Guo, R.Z.; Cheng, X.; Liu, Q.; Zhang, P.J.; Qian, G.R. Life cycle assessment of BMT-based integrated municipal solid waste management: Case study in Pudong, China. Resour. Conserv. Recycl. 2006, 49, 129–146. [Google Scholar] [CrossRef]
- Wittmaier, W.; Langer, S.; Sawilla, B. Possibilities and limitations of life cycle assessment (LCA) in the development of waste utilization systems—Applied examples for a region in Northern Germany. Waste Manag. 2009, 29, 1732–1738. [Google Scholar] [CrossRef]
- Sharma, B.K.; Chandel, M.K. Life cycle assessment of potential municipal solid waste management strategies for Mumbai, India. Waste Manag. Res. 2017, 35, 79–91. [Google Scholar] [CrossRef]
- Buttol, P.; Masoni, P.; Bonoli, A.; Goldoni, S.; Belladonna, V.; Cavazzuti, C. LCA of integrated MSW management systems: Case study of the Bologna District. Waste Manag. 2007, 27, 1059–1070. [Google Scholar] [CrossRef]
- Fruergaard, T.; Astrup, T. Optimal utilization of waste-to-energy in an LCA perspective. Waste Manag. 2011, 31, 572–582. [Google Scholar] [CrossRef]
- Khoo, H.H. Life cycle impact assessment of various conversion technologies. Waste Manag. 2009, 29, 1892–1900. [Google Scholar] [CrossRef]
- Liamsanguan, C.; Gheewala, S.H. LCA: A decision support tool for environmental assessment of MSW management systems. J. Environ. Manag. 2008, 87, 132–138. [Google Scholar] [CrossRef]
- Wanichpongpan, W.; Gheewala, S.H. Life cycle assessment as a decision support tool for landfill gas-to energy projects. J. Clean. Prod. 2007, 15, 1819–1826. [Google Scholar] [CrossRef]
- Menikpura, S.N.M.; Sang-Arun, J.; Bengtsson, M. Assessment of environmental and economic performance of Waste-to-Energy facilities in Thai cities. Renew. Energy 2016, 86, 576–584. [Google Scholar] [CrossRef]
- Mendes, M.R.; Aramakib, T.; Hanakic, K. Assessment of the environmental impact of management measures for the biodegradable fraction of municipal solid waste in São Paulo City. Waste Manag. 2003, 23, 403–409. [Google Scholar] [CrossRef]
- Michaud, J.; Farrant, L.; Jan, O.; Kjær, B.; Bakas, I.Z. Environmental Benefits of Recycling—2010 Update; Waste and Resources Action Programme (WRAP): Banbury, UK, 2010. [Google Scholar]
- Lazarevic, D.; Aoustin, E.; Buclet, N.; Brandt, N. Plastic waste management in the context of a European recycling society: Comparing results and uncertainties in a life cycle perspective. Resour. Conserv. Recycl. 2010, 55, 246–259. [Google Scholar] [CrossRef]
- Tyskeng, S.; Finnveden, G. Comparing energy use and environmental impacts of recycling and waste incineration. J. Environ. Eng. 2010, 136, 744–748. [Google Scholar] [CrossRef]
- De Feo, G.; Malvano, C. The use of LCA in selecting the best management system. Waste Manag. 2009, 29, 1901–1915. [Google Scholar] [CrossRef]
Figure 1.
Location of the study area.

Figure 2.
Life cycle assessment (LCA) system boundaries.

Figure 3.
LCA methodological framework.

Figure 4.
Acidification impact potentials.

Figure 5.
Eutrophication impact potentials.

Figure 6.
Global warming impact potentials.

Figure 7.
Human health impact potentials.


Table 1.
Population figures for the study area [67].
Table 1.
Population figures for the study area [67].
| Town/Local Board | Estimated Population (Male) | Estimated Population (Female) | Estimated Total Population |
|---|---|---|---|
| Harare | 716,595 | 768,636 | 1,485,231 |
| Chitungwiza | 168,600 | 188,240 | 356,840 |
| Norton | 32,382 | 35,209 | 67,591 |
| Ruwa | 26,745 | 29,933 | 56,678 |
| Epworth | 83,983 | 83,479 | 167,462 |
| Total | 1,028,305 | 1,105,497 | 2,133,802 |
Table 2.
Estimates of daily and annual municipal solid waste (MSW) generation.
| Town/Local Board | Estimated Population (People) [67] | Estimated Daily MSW Generation (tons) | Estimated Annual MSW Generation (tons) |
|---|---|---|---|
| Harare | 1,485,231 | 891 | 325,266 |
| Chitungwiza | 356,840 | 214 | 78,148 |
| Norton | 67,591 | 41 | 14,802 |
| Ruwa | 56,678 | 34 | 12,412 |
| Epworth | 167,462 | 100 | 36,674 |
| Total | 2,133,802 | 1280 | 467,303 |
Table 3.
Estimates of percentage composition of MSW generated in Harare.
| MSW Fraction | Percentage MSW Composition from Literature Studies Reviewed | Average % Composition | ||
|---|---|---|---|---|
| Harare [80,81,82,83,84] | Bulawayo [85] | Chinhoyi [49] | ||
| Organic | 40 | 40 | 45 | 42 |
| Plastic | 26 | 50 | 24 | 33 |
| Metals | 7 | 3 | 13 | 8 |
| Paper | 15 | 7 | 14 | 14 |
| Glass | 2 | 0 | 3 | 3 |
| Other | 10 | 0 | 1 | 0 |
Table 4.
Description of considered MSW management options.
| MSW Management Scenario | Description of the Life Cycle Stages Considered for the MSW Management Options |
|---|---|
| A1 | This option involves the disposal of 467,303 metric tons of MSW that would have been indiscriminately collected (both organic and nonorganic municipal solid waste) without any prior treatment in a landfill, recovering biogas energy and treating landfill leachate. |
| A2 | The 467,303 metric tons of indiscriminately collected MSW undergoes incineration with recovery of energy and the treatment of the gaseous emissions and leachate produced during bottom ash recovery. |
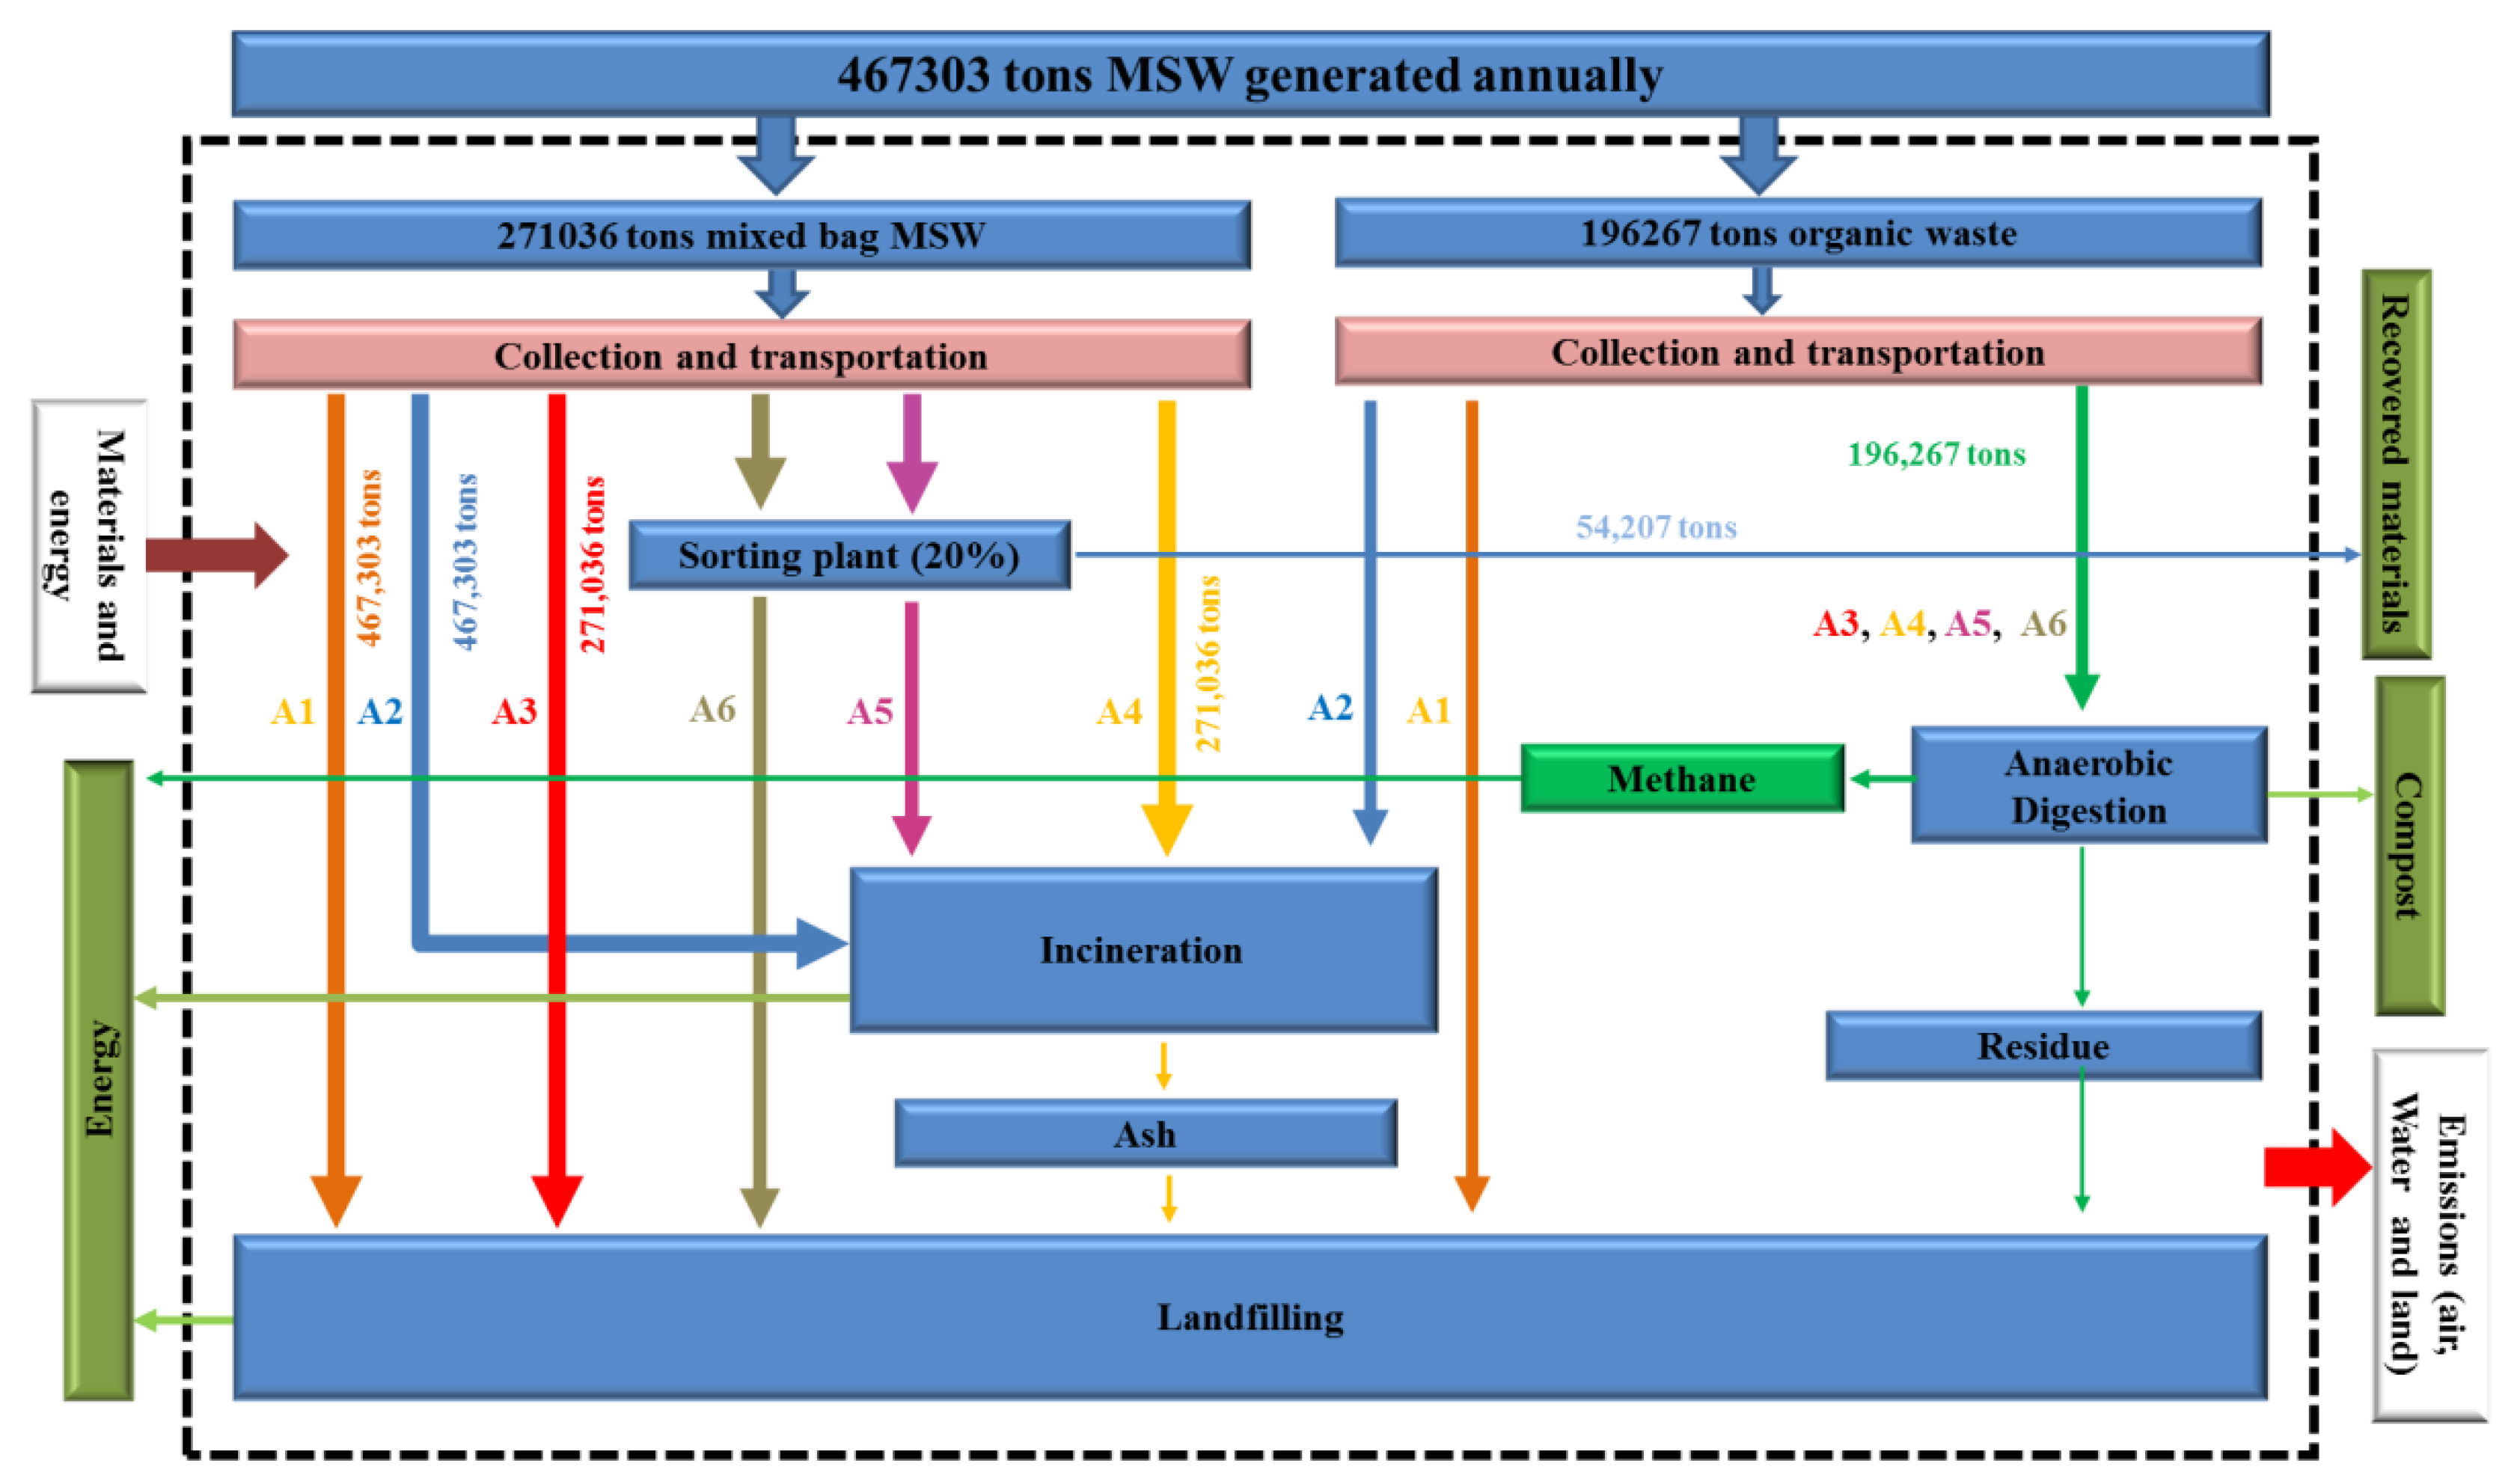
| A3 | Organic fraction of MSW generated amounting to 196,167 metric tons is anaerobically treated to produce biogas. The remaining 271,036 metric tons of mixed bag MSW (154,210 metric tons of plastics, 37,384 metric tons of metals, 65,422 metric tons of paper and 14,019 metric tons of glass) undergo incineration as in A2. |
| A4 | Organic fraction of MSW generated amounting to 196,167 metric tons is anaerobically treated to produce biogas. The remaining 271,036 metric tons of mixed bag MSW (154,210 metric tons of plastics, 37,384 metric tons of metals, 65,422 metric tons of paper and 14,019 metric tons of glass) is landfilled as in A1. |
| A5 | Organic fraction of MSW generated amounting to 196,167 metric tons is anaerobically treated to produce biogas. The 20% of the nonorganic waste amounting to 54,207 metric tons of MSW (30,842 metric tons of plastics, 7477 metric tons of metals, 13,084 metric tons of paper and 2804 metric tons of glass) are recovered for reuse and recycle in the mixed bag sorting plant. 216,829 metric tons of mixed bag MSW (123,368 metric tons of plastics, 17,346 metric tons of metals, 30,356 metric tons of paper and 15,178 metric tons of glass) which is not recovered in the mixed bag sorting plant undergoes incineration as in A2. |
| A6 | Organic fraction of MSW generated amounting to 196,167 metric tons is anaerobically treated to produce biogas. The 20% of the nonorganic waste amounting to 54,207 metric tons of MSW (30,842 metric tons of plastics, 7477 metric tons of metals, 13,084 metric tons of paper and 2804 metric tons of glass) are recovered for reuse and recycle in the mixed bag sorting plant. 216,829 metric tons of mixed bag MSW (123,368 metric tons of plastics, 17,346 metric tons of metals, 30,356 metric tons of paper and 15,178 metric tons of glass) which is not recovered in the mixed bag sorting plant undergoes landfilling as in A1. |
Table 5.
Sensitivity analysis.
| Impact Category | Percentage Materials Recovery Levels for Zero Impact Potential to be Realised | |
|---|---|---|
| A5 | A6 | |
| Acidification | 28 | 24 |
| Eutrophication | 40 | 26 |
| Global warming | 0 | 6 |
| Human health | 0 | 9 |
Table 6.
Ranking of MSW management options.
| Impact Category | Scenario Rank Number | |||||
|---|---|---|---|---|---|---|
| A1 | A2 | A3 | A4 | A5 | A6 | |
| Acidification | 3 | 6 | 5 | 4 | 2 | 1 |
| Eutrophication | 1 | 5 | 6 | 4 | 2 | 3 |
| Global Warming | 4 | 3 | 2 | 6 | 1 | 5 |
| Human health | 4 | 3 | 2 | 6 | 1 | 5 |
| Average Rank | 3.0 | 4.3 | 3.8 | 5.0 | 1.5 | 3.5 |
| Average rank | 2 | 5 | 4 | 6 | 1 | 3 |
© 2019 by the authors. Licensee MDPI, Basel, Switzerland. This article is an open access article distributed under the terms and conditions of the Creative Commons Attribution (CC BY) license (http://creativecommons.org/licenses/by/4.0/).
Share and Cite
MDPI and ACS Style
Nhubu, T.; Muzenda, E. Determination of the Least Impactful Municipal Solid Waste Management Option in Harare, Zimbabwe. Processes 2019, 7, 785. https://doi.org/10.3390/pr7110785
AMA Style
Nhubu T, Muzenda E. Determination of the Least Impactful Municipal Solid Waste Management Option in Harare, Zimbabwe. Processes. 2019; 7(11):785. https://doi.org/10.3390/pr7110785
Chicago/Turabian StyleNhubu, Trust, and Edison Muzenda. 2019. "Determination of the Least Impactful Municipal Solid Waste Management Option in Harare, Zimbabwe" Processes 7, no. 11: 785. https://doi.org/10.3390/pr7110785
Note that from the first issue of 2016, this journal uses article numbers instead of page numbers. See further details here.