Activation Energy Determination in Case of Independent Complex Kinetic Processes


1
Istituto per lo Studio delle Macromolecole (ISMAC)—Sede di Genova, CNR, Via De Marini 6, 16149 Genova, Italy
2
Department of Physical Chemistry, Faculty of Chemical Technology, University of Pardubice, Studentska 573, 532 10 Pardubice, Czech Republic
*
Author to whom correspondence should be addressed.
Processes 2019, 7(10), 738; https://doi.org/10.3390/pr7100738
Submission received: 19 September 2019
/
Revised: 8 October 2019
/
Accepted: 9 October 2019
/
Published: 14 October 2019
(This article belongs to the Section Environmental and Green Processes)
Abstract
:Theoretically simulated kinetic data were used to evaluate the performance of the most common isoconversional methods of kinetic analysis in complex-process scenarios with two independent overlapping processes exhibiting nucleation-growth kinetics, and further expand the conclusions for the autocatalytic kinetic processes with positive asymmetry. In close-to-real-life situations all the integral isoconversional methods provided practically indistinguishable E-α outcomes. The Friedman and incremental modified Vyazovkin methods results in significant over- and undershoots. However, the combined utilization of the integral and differential isoconversional methods was demonstrated to greatly contribute to the interpretation of the E-α dependences and estimation of E1 and E2—the conceptual evaluation involving positions of inflection points and plateaus is introduced. The influence of the range of applied heating rates q+ on the course of E-α dependences was studied. In this regard, the performance of the isoconversional methods changes significantly with both, the consistence of the shape of the complex kinetic curve and weighted presence of full overlaps of the involved sub-processes.
1. Introduction
Methodologies utilized for single-process kinetic analysis of solid-state processes were studied and perfected for decades and discussed in massive numbers of papers. These methods work with the basic kinetic equation [1,2]:
where α is the degree of conversion, t is time, T is temperature, f(α) is a substitute for a kinetic model, I is the integrated area under the kinetic peak (equivalent to, e.g., characteristic enthalpy or mass changes in case of calorimetric and thermogravimetric measurements), A is the pre-exponential factor and E is the apparent activation energy of the process. Enumeration of the quantities listed in Equation (1) can be, methodologies-wise, split into two groups of methods—model-free methods designed for the determination of E and A (being independent from f(α)) and model-based methods dealing with finding the appropriate kinetic model and its parameters. The model-free methods include the equations utilizing the temperature corresponding to the maximum of the kinetic peak Tp, e.g., Kissinger [3], Ozawa [4], or Takhor and Mahadevan [5,6], and isoconversional methods providing the apparent activation energy in dependence on α as, e.g., Friedman [7], Kissinger-Akahira-Sunose (KAS) [8], Starink [9], Ozawa-Flynn-Wall (OFW) [10], or Vyazovkin [11,12,13]. The model-based methods then include the non-fitting methods, such as master plots [14] and the method based on the compensation effect [15], or data-fitting methods, such as the combined kinetic analysis [16], the Koga method [17], or multivariate kinetic analysis (MKA; sometimes also called formal kinetic analysis) [18].
Whereas the functionality of all these methods is perfectly mapped and tested for the single kinetic processes, the theoretical testing of the behavior of these methodologies for the complex process scenarios is not very numerous and divided into rather occasional studies—see, e.g., [19,20,21,22,23,24,25,26,27]. Most of these papers provide qualitative testing of the considered methodologies in only few types of complex process situations. An exception from this trend is the recent study by Muravyev et al. [28], who excellently summarize the current methodological tools utilized in the field of kinetic analysis and test the particular methodologies in various complex-process scenarios. Despite this great paper, we still feel that a highly systematic study, delivered via a series of papers evaluating the performance of the methods of kinetic analysis under various different types of complex-process scenarios (including the influences of, e.g., the number and type of involved reaction mechanisms and overall reaction scheme, as well as the specific simulation conditions such as the degree of overlap, its change with the range of applied heating rates, or relative intensity of the involved sub-processes) may be of use to the thermo-analytic community.
The goal of the present paper (first in the series) is to evaluate the selected most often utilized model-free methodologies (Kissinger, Ozawa, Friedman, KAS, Starink, OFW, Vyazovkin, and the modified incremental Vyazovkin; plus the model-based MKA) based on their performance aimed at evaluation of E in different complex process scenarios (second paper in the series will deal with the combined effect of the pre-exponential factor A and activation energy E). Note that the first six named methods are “old school” rigid ones, but are still mostly used in practice; the modern methods utilizing numerical solving (rather than linearization) are represented by the last three named methods. Additionally, note that the incremental modified Vyazovkin method is the only method derived under the assumption of variable E. All the tests will be performed on the theoretically simulated data (in order to exclude any instrumental errors or inconsistencies of materials behavior). Multiple complex process scenarios involving different degrees of sub-processes overlap, different gaps between the activation energies of the sub-processes, and different magnitudes of the sub-processes (corresponding to the dominating influence on the apparent E value) will be created to map the behavior of the tested model-free methods. The results will be divided into two parts—in the first part, the rather general behavior and accuracy of the methodologies will be tested; the second part will focus on mapping several specific features of the isoconversional methods (namely their influenceability by the selected range of heating rates and the corresponding performance of the differential and integral solutions of the base kinetic equation). Self-made software capable of working with large number of datapoints (both during the data simulation and during their consequent evaluation) will be utilized to assure the sufficient accuracy and precision of the calculations.
Note that in the current article (first in the series), we want to establish the basis for the further (more complex) research, so that we can simplify the further interpretations and use comparisons/generalizations instead of repeating the full-scale explanations. The present paper deals mainly with independent processes exhibiting the nucleation-growth (JMA) asymmetry; the conclusions are further extended for the autocatalytic (AC) model. The concurrent articles will address the performance of the methodologies for more asymmetries (simulated by using most flexible/universal kinetic models) as well as for more complex process dependences (competing, concurrent, reversible, etc.). It should be also noted that one of the main aims of the present paper is to summarize the base knowledge on this topic and introduce it to the wide readership from the fields of thermal analysis and calorimetry, so that the issues discussed in the present paper can be considered and utilized in general practice.
2. Theoretical Simulations
2.1. Software
All the calculations were performed using custom functions written in R-language. They are available in a self-made package named takos (Thermo-Analytical Kinetic analysis,) available to the Comprehensive R Archive Network (CRAN cran.r.project.org) and they are released under GNU General Public License, version 2. The package was designed in order to create a common workflow environment for kinetic data analysis that include the most common methodologies for determining the activation energy from non-isothermal analysis without the need of using multiple proprietary software and that can offer all the advantages of a scripting language.
2.2. Complex Process Datasets
The theoretical simulations utilized to prepare the complex process datasets were based on the standard kinetic equation (Equation (1)) accommodated for the non-isothermal differential setup used in the most common instrumentation of thermal analysis (differential scanning calorimetry (DSC), differential thermal analysis (DTA), and differential thermogravimetry (DTG)):
where q+ is the applied heating rate. The complex nature of the data was introduced in the form of two independent overlapping processes with the Johnson-Mehl-Avrami (JMA) [29,30,31,32] kinetics—see Equations (3)–(6):
where m is the model kinetic exponent corresponding to the dimensionality of the process. Two groups of calculations were performed in order to map the performance of the tested methodologies of kinetic analysis. The first group of complex-process scenarios was designed to map wide spectrum of complex-process features and test the general performance of the methodologies, mainly with regard to the precision of the methods, considering the different ways of feeding the experimental data into the calculations themselves. The second group of complex-process scenarios was then developed with two specific complex kinetics features in mind—firstly, to test the performance of the methodologies when different ranges of heating rates are applied; secondly to investigate the origin (and possible utilization advantages) of the so-called over- and undershoots often observed for the differential isoconversional methods.
2.2.1. First Group of Complex-Process Scenarios
Seven different complex process scenarios were created within the first group; the datasets can be split into two sub-groups—in the first group (datasets A–C), the sub-processes with different activation energies were employed and the influences of the E gap and the sub-processes magnitudes were tested; in the second sub-group (datasets D–G), the sub-processes with similar activation energies were employed and the influence of the different degree of the process overlap is explored. Seven data-curves corresponding to the heating rates 0.5, 1, 2, 5, 10, 20, and 50 °C·min−1 were simulated for each dataset. The kinetic parameters used to create the complex process datasets are listed in Table 1 and the datasets are depicted in Figure 1 and Figure 2.
As mentioned above, the first sub-group of datasets includes overlaps of sub-processes with significantly (datasets A and B), and slightly (dataset C) different E values. In addition, different ratios between the relative magnitudes of the sub-processes are incorporated in the datasets. The overall integrated area of the complex process I is set equal to unity and in each case different I1/I and I2/I are chosen: in dataset A, the dominant peak (I1 = 0.66) is high and narrow, and the wider peak (fully overlapping the dominant peak due to the larger width) is of minor magnitude (I1 = 0.33); in dataset B, the wider peak is dominant (I2 = 0.80) and the narrow peak (which overlaps the dominant peak in only certain region of α1) is of minor magnitude (I1 = 0.20); in dataset C, both peaks are of similar magnitude (I1 = I2 = 0.50) and almost fully overlap throughout whole explored range of q+ due to the similar activation energies. For the datasets D–G, completely similar sets of kinetic parameters (E1 = E2 = 150 kJ·mol−1, JMA kinetics, m1 = m2 = 2, I1 = 0.30, I2 = 0.70, A1 = 1015 s−1) were used, except for the values of A2 pre-exponential factors, which were utilized in the way to create different degrees of sub-processes overlaps (see Figure 2 and Table 1).
All datasets were by default simulated with 10,000 points over the explored temperature interval (the raw data corresponding to these simulations are depicted in Figure 1 and Figure 2). In order to determine the influence of the datapoint density on the accuracy and precision of the activation energy determination, additional simulations utilizing 5000, 20,000, and 50,000 points in the explored temperature intervals were performed.
2.2.2. Second Group of Complex-Process Scenarios
Three sets of kinetic parameters were used to simulate the complex process scenarios within the second group of data-curves. The first set was simulated with E1 = 50 kJ·mol−1, E2 = 300 kJ·mol−1, JMA kinetics, m1 = m2 = 2, I1 = I2 = 0.50, A1 = 102.5 s−1, A1 = 1027 s−1. The second and third sets were simulated with I1 = 0.30 and I2 = 0.70, and I1 = 0.70 and I2 = 0.30, respectively. Within each set the curves for the following heating rates were prepared: 0.5, 1, 2, 3, 4, 5, 6, 8, 11, 13, 16, 25, 50, 75, 100, 150, 200, 300, and 400 °C/min (everything with 10,000 points/curve density). Consequently, these curves were split into different sub-groups (A–H) to cover various scenarios for peaks overlaps as well as the general range of applied heating rates-list of curves included in the particular sub-groups is given in Table 2. The sub-groups (A–H) are depicted in Figure 3.
In this way the common types of overlap are covered. Datasets A–E depict overlaps with different positions of the two sub-peaks, where only moderate change in the overlap shape manifests due to the narrow range of employed q+. Datasets G and H correspond to scenarios with a significantly larger change of the overlap shape change (broader ranges of q+ were included). Finally, dataset F contains all the curves, simulated for the whole q+ range.
3. Results and Discussion
The goal of the present paper was to evaluate behavior of the most common model-free methods utilized for determination of the apparent activation energy E in typical complex-process scenarios. Primarily, the isoconversional methods of Friedman (Equation (7)), KAS (Equation (8)), Starink (Equation (9)), OFW (Equation (10)), and Vyazovkin (Equations (11) and (12)) were tested within this task:
where (dα/dt)α, Tα and Eα are the conversion rate, temperature, and activation energy corresponding to arbitrarily chosen values of conversion α. In addition, we have also tested the advanced non-linear isoconversional method [33] (an incremental isoconversional method) developed by Vyazovkin (further denoted as modified Vyazovkin method). Note that (as in [33]) the integral J in Equations (11) and (12) was evaluated numerically from the experimental data by using the trapezoid rule [34]. The obtained values of the integral J were substituted in Equation (11), and minimization was carried out to find Eα. Brent’s algorithm [34,35] of inverse quadratic interpolation was employed to find the minimum (machine accuracy was double.eps 2.220446 × 10⁻¹⁶).
Note that two types of evaluations were performed for all simulated data. In the first (less accurate) type of evaluation, the appropriate tα/Tα/Φα datapoints were attributed to the pre-selected α values via the “nearest neighbor” method (the data for α value nearest to the pre-selected one were used). The second method employed the proper interpolation of the tα/Tα/Φα data to obtain the true values corresponding to the exact pre-selected α. In general, the difference was completely negligible; the only exception was the modified incremental Vyazovkin method (will be discussed later). The results will be divided into two sub-sections in correspondence with the two groups of complex-process scenarios (see Section 2.2). All E-α dependences are, for better clarity, shown without the corresponding error bars—these can be for the individual dependences utilizing linear fits (Friedman, KAS, OFW, Starink) found in the Supplementary materials (Figures S1–S9). In case of the methods based on iterative optimization algorithms (Vyazovkin and modified Vyazovkin), the methodological errors are in general very small.
3.1. First Group of Complex-Process Scenarios
In this section, the results for the first group of complex process scenarios will be presented—for the corresponding raw data, see Figure 1 and Figure 2. All E-α evaluations in this section were performed via the (probably) more common but less accurate nearest neighbor method to demonstrate the influence of data-density simulation that occurs in case of this type of evaluation. The E-α dependences provided by these methods for the datasets A, B, and C (the datasets with different activation energies of the two sub-processes) are shown in Figure 4—the difference between the results from data-curves composed of 10,000 and 50,000 points is depicted for dataset A. As is apparent, for this resolution and relative scatter magnitude, the results obtained for both data-point densities are indistinguishable, indicating that 10,000 points per curve is enough for derivation of accurate conclusions regarding the shapes and general behavior of the E-α dependences in case of the E1 ≠ E2 complex process scenarios (the scatter in the data resulting from the lower data-point density is much smaller compared to the overall trends in the E-α dependences). It is further apparent that all the methodologies provide a basically similar E-α outcome, making them equally suitable for the general purposes of either revealing the trends in the dependences of activation energy on the degree of conversion or providing the data for kinetic predictions. The only exception is the Friedman equation, which provides significantly different E-α dependences compared to the rest of the tested methods—this is caused by the fact that the Friedman equation belongs among the differential isoconversional methods and its application leads to punctual values of E [36], whereas the integral isoconversional methods are dependent on the history of the system in the 0–α range.
Regarding the general trends in the E-α dependences, the dataset A shows that when a dominant (I1 = 0.66) peak is high and narrow and it is across its full width completely overlapped with a minor (I2 = 0.33) wide peak (the tails of which overreach the width of the dominant peak), the E values for the borderline degrees of conversion (α being close to 0 and 1) are equal to the true E2 value. The dominant nature of the peak No. 1 then leads to the E values in the middle α region being relatively close to the true E1 value, although never truly reaching it due to the overlap with E2 dragging the overall numbers down. Interestingly, the E-α dependences provided by the Friedman method touch the true E2 values in this particular case but this method also leads to an unnatural undershoot in the (α = 0.75–1) region. Opposite situation arises in case of the dataset B, where high and narrow peak is of a minor integral area (I1 = 0.20) and the dominant peak (I2 = 0.80) is wide, fully overlapping the minor peak across its whole width in case of all applied q+. In such a case, the provided E-α dependences are much closer to the true E2 value in the whole α range, but only touching the true E2 value at the borderline α limits. The Friedman method again results in the typical undershoot in the high-α range, but similarly as the other applied methods does not even remotely reach E1. The results for dataset C, where two equally large kinetic peaks with close activation energies overlap, show a gradual transition between the two true activation energy values (E1 and E2), correctly determining these kinetic parameters—this appears to be the result of a similar degree of the sub-peaks partial overlap being present in case of all evaluated datacurves (see Figure 1c). The Friedman method also correctly determines E1 and E2 in the low-α and high-α ranges, respectively, but the transition exhibits E increase outside the <E1, E2> range, which is not physically meaningful.
In the second group of datasets (D–G) the two overlapping sub-processes were simulated with similar activation energies E1 = E2 = 150 kJ·mol−1. In such case all potential E-α trends were expected to be very subtle and the accuracy and precision of the calculations had to be verified with respect to the number of points used for initial datacurves simulations (bear in mind that the evaluations in this section employed the nearest neighbor selection method for the α values, for the which the data-density significantly influences the precision of the results). These results are demonstrated for the dataset F in Figure 5. It is apparent that in such extreme case, when trends with the magnitude <1% are evaluated, the number of points used for the simulations plays significant role. In the case of the 5000 points/curve, the scatter in the E values is too large for the trends to be well recognizable.
Considering that the E-α trends is apparent in the second group of datasets (dataset F in Figure 5; datasets D, E and G in Figure 4), several conclusions can be drawn. Firstly, the Friedman, Starink, and Vyazovkin methods provide very accurately the true value of the activation energy (E1 = E2 = 150 kJ·mol-1) in the whole α region. Secondly, the results from the KAS method are indeed slightly shifted, leading to the approximately 0.15% lower E values (hence the later correction by Starink)—however, note that all the integral isoconversional methods (KAS, OFW, Starink) differ only by the level of imperfections introduced into the calculation during the integration of the temperature integral [37]. Thirdly, the OFW method leads to even significantly larger errors, reaching approximately 0.8% in the present cases; in addition the OFW equation does not lead to a constant E value in the whole α interval but shows a significant E-α trend. This trend, interestingly, depends on the mutual position of the kinetic peaks. In case of well-separated peaks (datasets D and G), the E-α dependences exhibit a “bump” (a sudden step-like change) in the α region, corresponding to the main overlap of the two sub-processes. On the other hand, datasets with a large degree of overlap (datasets E and F) show rather smooth monotonic E-α dependences. However, the existence of this effect is of little practical use, as it occurs only when both kinetic peaks are well-separated and thus well distinguishable and separable—it may simplify/accelerate the determination of the I1/I2 ratio in cases when the deconvolution methods are not accessible. The last conclusion concerns with the data-point requirements again, whereas the 10,000 point simulations are well suited for recognition and unambiguous identification of most E-α trends, the step-like change found in case of the OFW method is reliably recognizable only when high points/curve option was used—which would be the requirement for such utilization.
Furthermore, with regard to the points/curve optimization, the modified Vyazovkin non-linear isoconversional method [33] was used to evaluate E from the prepared datasets. Contrary to all other tested methods, the modified Vyazovkin method appears to be very sensitive to the correct correspondence of the tα/Tα/Φα data to the pre-selected degree of conversion α. As such, if the “nearest neighbor” type of evaluation is being employed, the method is extremely sensitive to the time/temperature displacement of the individual datapoints attributed to the specific pre-selected α values (via selecting the nearest experimentally obtained datapoint). On the other hand, if the experimental curve is recalculated with iterative interpolation being used to gain the correct tα/Tα/Φα values exactly corresponding to the pre-selected α values, the E-α dependences smooth out, mirroring the results provided by the Friedman method. This is depicted in the bottom four graphs in Figure 5 for the data from group 2, dataset B (we found this dataset to best demonstrate the scatter pattern; since the matter is a continuation of the discussion regarding the precision, started for the data from group 1, the present text is included here instead of it being delayed for Section 3.2). As can be seen, with an increasing points/curve resolution, the scatter in the data decreases, as there is a higher chance for the nearest experimentally obtained value to be closer to the actually needed pre-selected α. However, even at excessive data density (50,000 points/curve), the scatter in the data is nowhere close to the smoothness obtained in case of the proper evaluation based on the interpolation of the tα/Tα/Φα experimental data (depicted by the red points in the Figure 5 graphs). Therefore, it is imperative to use the modified Vyazovkin method only via employing the interpolation of the raw experimental data during the evaluation. Regarding the actual performance, the method works essentially the same as the differential Friedman method, exhibiting similar over- and undershoot effects (characteristic for the Friedman method [38])—this will be further discussed in Section 3.2.
In addition to the isoconversional methods the standard Kissinger method (Equation (13)) and the multivariate kinetic analysis MKA (Equations (14) and (15)) were used to evaluate the data:
where Tp is the temperature corresponding to the maximum of the kinetic peak, RSS is the sum of squared residua, n is number of simulated curves, j is index of the given simulated curve, Firstj is the index of the first point of the given curve, Lastj is the index of the last point of the given curve, Yexpj,k is the experimental value of the point k of curve j, Ycalj,k is the calculated value of the point k of curve j, and wj is weighting factor for curve j. As expected, the standard Kissinger method (with the temperature Tp corresponding to the maximum of the kinetic peak being evaluated always for the absolute maximum of the simulated complex signal) provided results quite accurately corresponding to the activation energy of the sharper (higher) kinetic peak: EA = 119.35 kJ·mol−1 (true EA = 120 kJ·mol−1), EB = 115.00 kJ·mol−1 (true EA = 120 kJ·mol−1) and EC = 108.47 kJ·mol−1 (true EA = 110 kJ·mol−1). The results for the A–C datasets are always slightly shifted to lower values, similarly to the KAS method (as discussed in case of the D–G datasets), due to the same foundation of the two methods. This is even more apparent for the D–G datasets, where the standard Kissinger method provides the same results as the KAS method: ED = 149.83 kJ·mol−1, EE = 149.85 kJ·mol−1, EF = 149.88 kJ·mol−1, and EG = 149.85 kJ·mol−1 (the true activation energy was in all cases 150 kJ·mol−1). This undoubtedly confirms that the standard Kissinger method is indeed useful for the determination of E in case of the complex data (at least for the dominant/sharp sub-process)—note that none of the isoconversional methods reliably estimated E1 in the case of the A and B datasets (see Figure 4). The optimization via multivariate kinetic analysis was then found to be (as assumed) the best option, accurately determining E1 and E2 in case of all datasets; the errors originating mostly from the data scatter were lower than 0.03% in all cases. It should be however noted that this method not only requires correct (and sometimes tediously obtained) model-based information, i.e., the reaction scheme and suitable kinetic model suggestion, but it may be also quite sensitive to any data-distortive effects that may occur in case of real-life kinetic data (unlike the isoconversional methods, which is their main advantage in this comparison).
3.2. Second Group of Complex-Process Scenarios
In this section, the results for the second group of complex process scenarios will be presented—for the corresponding raw data, see Figure 3. The goal is to map the behavior of the particular isoconversional methods with respect to the different types of the complex kinetics as well as to the range of heating rates evaluated within the given calculation. Accordingly, the evaluations based on the interpolated tα/Tα/Φα data were performed for the second group of complex-process scenarios to avoid any interference of the accuracy/precision of the calculations themselves. As the KAS and OFW methods were in the previous section demonstrated to perform qualitatively similarly but quantitatively significantly worse compared to the improved Starink equation, they are omitted from the graphs presented in the current section for better clarity. The following terminology will be used throughout the present section: full overlap = situation when process No. 2 (high and narrow peak) overlaps through the whole range of α2 with process No. 1 (see Figure 3c for typical examples); prediction ability = ability of the given isoconversional method to provide estimates of the activation energies corresponding to the involved sub-processes (E1 and E2).
The results of the tested isoconversional methods are for the second group of complex process scenarios and I1 = I2 = 0.50 displayed in Figure 6. Starting with the datasets, where barely any overlap of the two sub-processes exists (sets A and E; see Figure 3), all methods perform very similarly, showing a sharp transition between the two values of the true activation energies E1 and E2. The Friedman and modified Vyazovkin methods show for datasets A and E very sharp (high with respect to E and narrow with respect to α) over- and undershoots, respectively (the direction of the overshoot is given by the transition between the two E values in as α increases). Moving to the set B, the majority of the simulated data (see Figure 3) shows partial overlap of the two sub-peaks but in no case does process 1 (smaller, wide peak) overreach to the high-α side of the peak No. 2, i.e., no full overlap is present in the data. In this case, the E-α dependences calculated for dataset B (see Figure 6) are fairly reminiscent of those obtained for dataset A but the transition between E1 and E2 is not as sharp and, correspondingly, the overshoots resulting from the Friedman and modified Vyazovkin methods are significantly broader and more pronounced. The datasets C and D then represent situations where majority and minority (respectively) of the kinetic curves exhibit full overlap of the two sub-processes. In these situations the Starink and Vyazovkin methods correctly estimate the activation energy for the broader kinetic peak E1 but fail to predict the value of E2—the reliability of E1 determination also worsens as the degree of full overlap increases. An even worse situation arises in case of the Friedman (and modified Vyazovkin) method, where the existence of over- and undershoots prevents any reliable prediction of either E1 or E2 as the degree of full overlap increases within the dataset.
Whereas the results from datasets A–E can be treated as different complex-process scenarios, it is already apparent that it is specifically the presence of the full overlap of the involved sub-processes that causes the main distortion of the E-α dependences. To further explore this issue, we have combined more kinetic curves into larger datasets. The dataset F (see Figure 3) combines all data from datasets A–E. The resulting E-α dependences displayed in Figure 6f clearly indicate that the major factor responsible for the course of E-α dependence is the mean distribution of E in α (weighted by number of curves n and also by the integral area I—this effect is very well shown for datasets A and B from the first group of scenarios in Figure 4) with respect to all the involved datacurves. In other words, the presence of a large number of datacurves with minimum overlap does not help (but only worsens the result), if the overlaps happen on both sides of the kinetic peak with higher activation energy. During further exploration, we have focused on the situations where only one-sided overlaps happen. The dataset G is similar to the dataset B but enriched with 2 q+-closest curves from the set C, and indeed, the prediction-driven performance of the isoconversional methodologies increases as follows: C < G < B. However, considering another similar case (dataset H), where dataset D was enriched with 2 q+-closest curves from the set C, the predictive performance of the isoconversional methods is actually worst for this new dataset: H < C < D. This indicates that the consistence of complex kinetic shape is (with respect to the prediction ability of the isoconversional methods) less important than the repeated/increased presence of the full overlap.
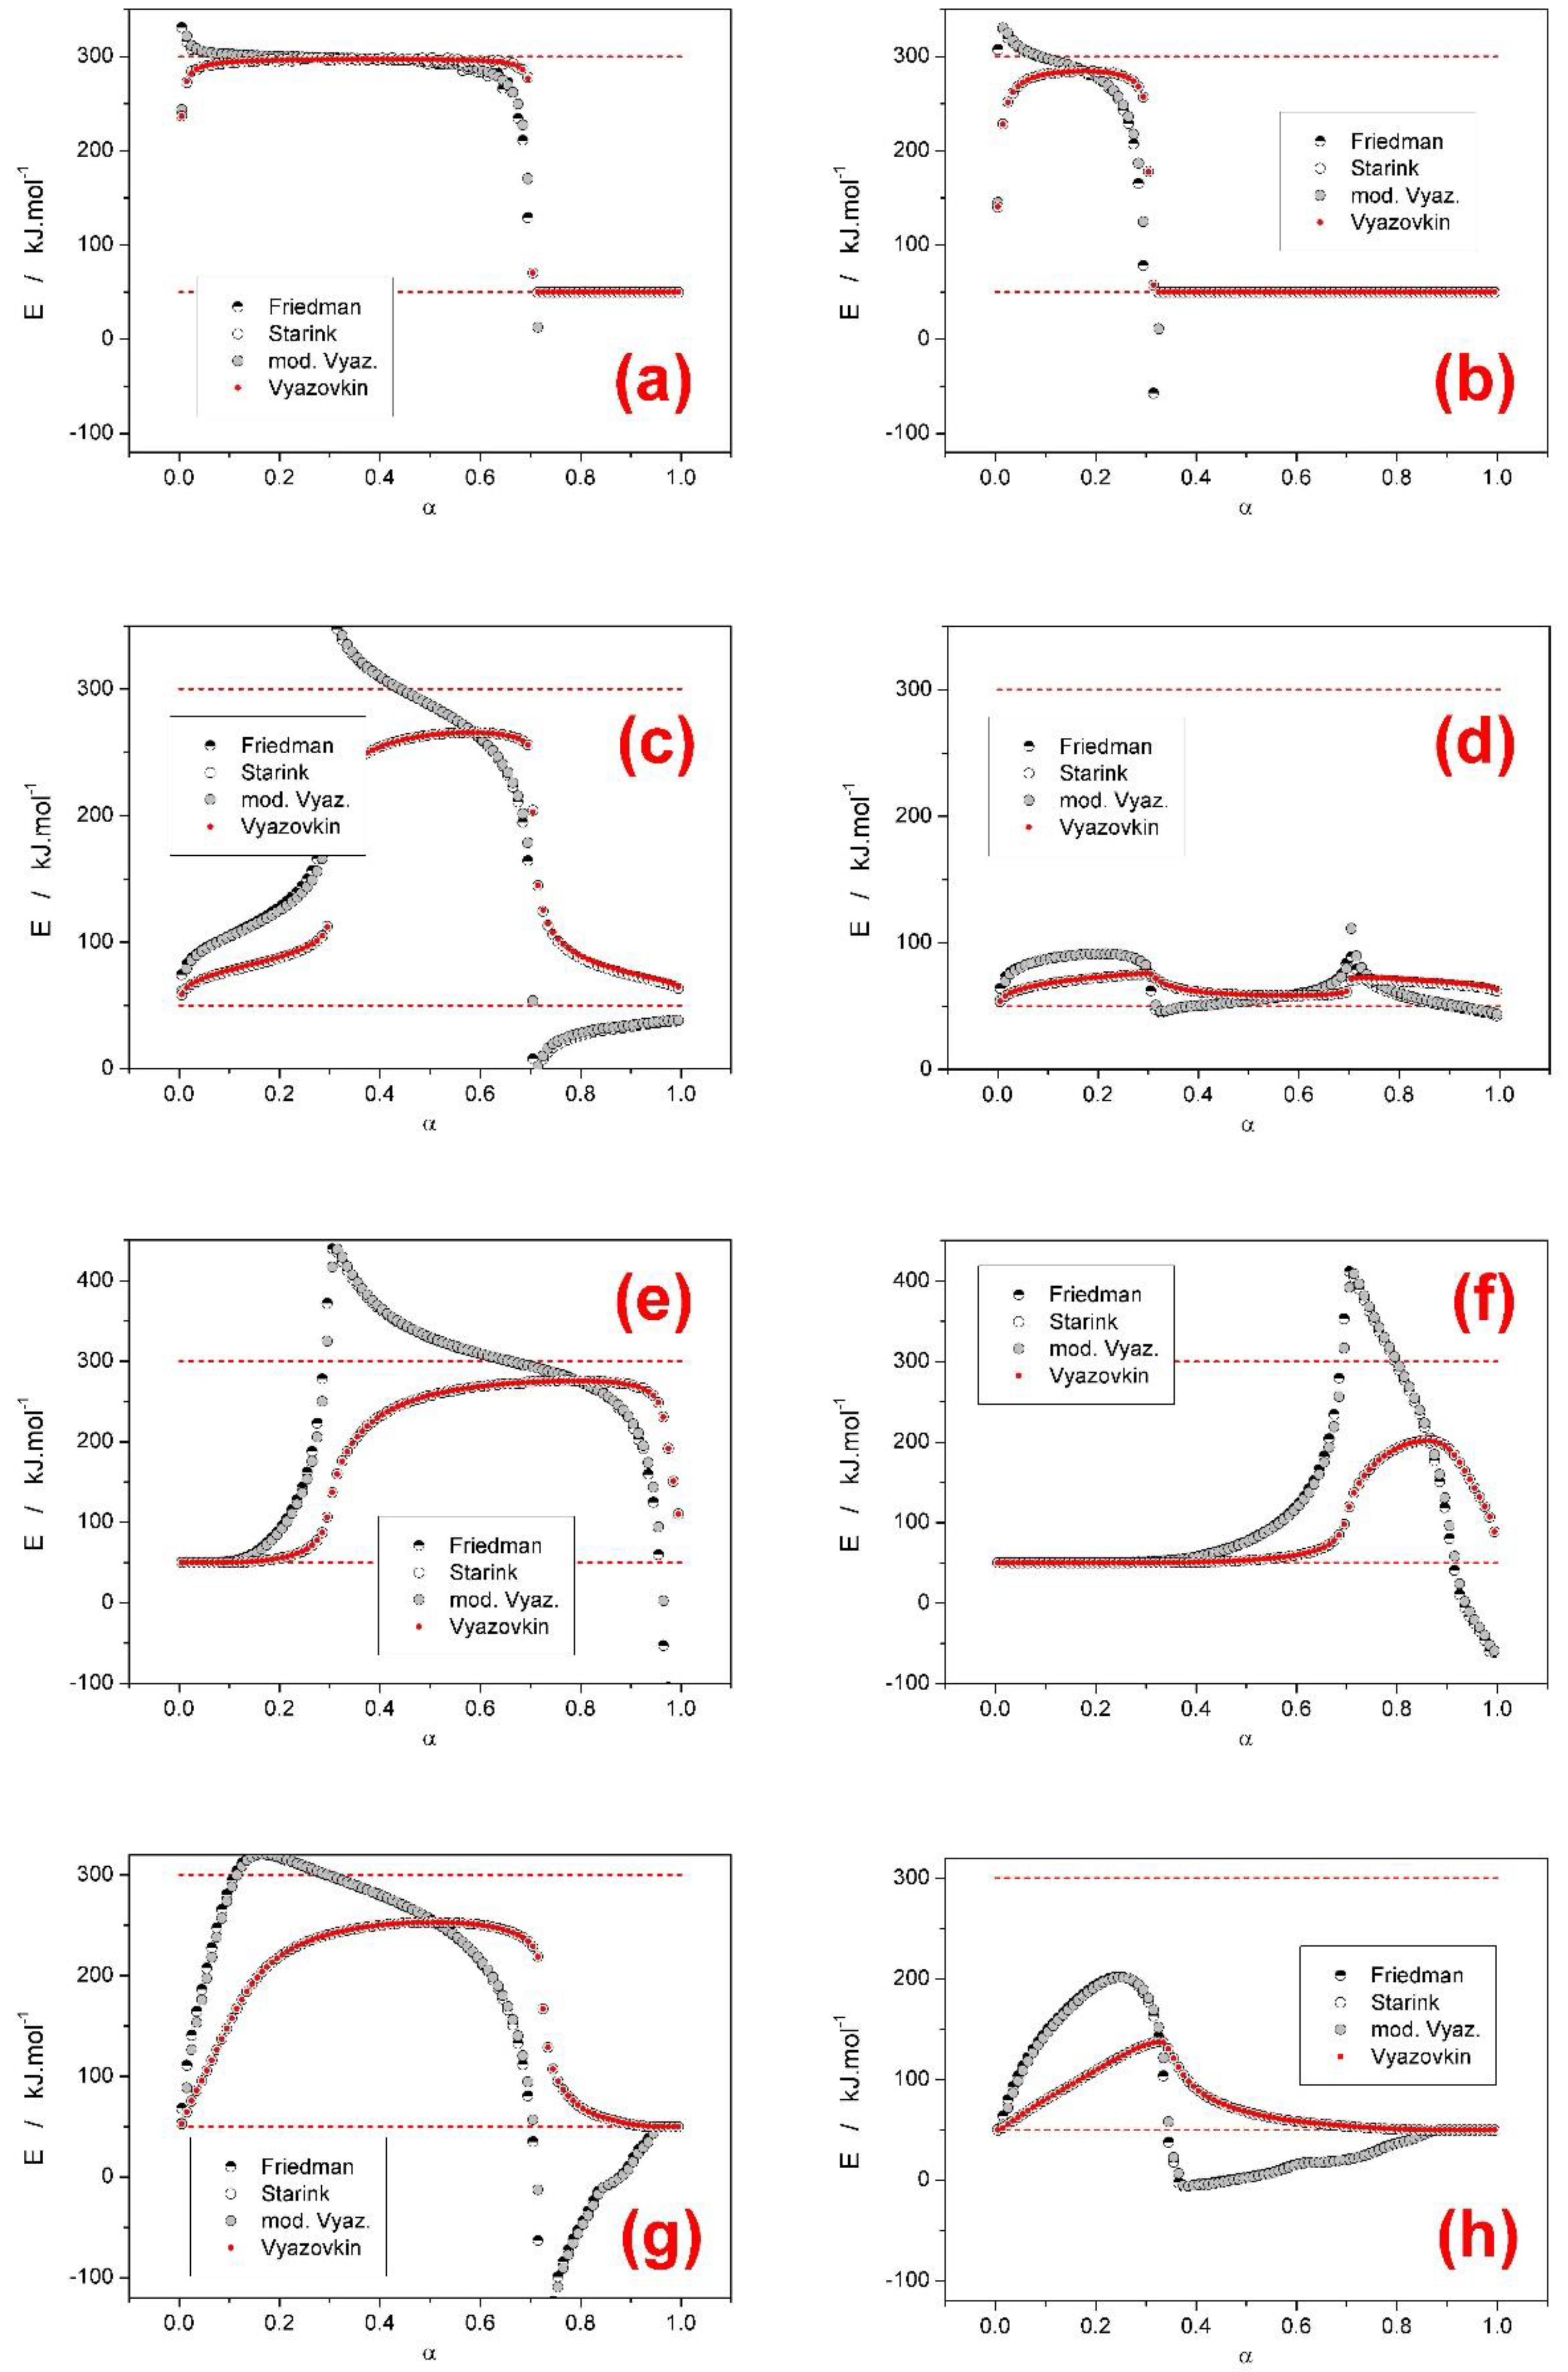
Similar conclusions can be derived from the other two datasets examined within the framework of the second group of complex process scenarios. In Figure 7 and Figure 8 the results for the cases with I1 = 0.30 and I2 = 0.70, and I1 = 0.70 and I2 = 0.30 are directly compared (left versus right column) for all eight sub-sets (A–H). Interestingly, depending on the degree and type of the overlap, in most cases the borderline ratio of the particular integrated areas corresponding to the involved sub-processes (α equal to 0.30 or 0.70) can be well recognized from the E-α dependences—the positions of the over- and undershoots manifesting via the Friedman and modified Vyazovkin methods are particularly convenient for this purpose. With respect to the predictive abilities of the E-α dependences (considered towards the true values of E1 and E2), four typical situations can arise. Firstly, at small-to-none overlaps the E-α dependences exhibit large plateaus at the correct E1 and E2 values (see, e.g., Figure 6a,e). Secondly, slightly larger overlaps result in a plateau for the integral isoconversional methods, and a characteristic sharp-onset overshoot for the differential methods (see, e.g., Figure 7c,d, or Figure 8e,f). In this case, the integral methods may exhibit their plateau at an incorrect (lower) E2 value, but the differential methods seem to have the point of inflection on the decreasing side of the overshoot always positioned very close to the true value of E2. Thirdly, at even larger overlaps, the differential methods start to exhibit rather round maximum (often with negative asymmetry) followed by a more pronounced undershoot (see, e.g., Figure 6c,h, or Figure 7f,h). In such cases the prediction becomes more unreliable, but generally the maximum of the round E-α dependence exhibited by the differential methods is close below the true E2 value. Lastly, in the extreme cases when the integral methods do not exhibit any E-α plateaus but rather pointed maxima (see, e.g., Figure 6f, or Figure 8d,h), this is the indication that the higher of the activation energies cannot be determined by any isoconversional method. Note the continuous transition between the third and fourth cases represented by Figure 7f.
The above-described concept offers a reliable way how to quickly and easily interpret the E-α dependences provided by the isoconversional methods of kinetic analysis in case of complex kinetic processes. It demonstrates that the combined utilization of the integral and differential isoconversional methods can provide additional information regarding the estimates of true E values corresponding to the involved sub-processes. However, note that the present simulations and consequent interpretations were based solely on the two independent processes with JMA asymmetry (i.e., kinetic peaks with negative asymmetry of approximately −0.3). In order to generalize the findings for processes with different asymmetries, the second group of complex process scenarios (see Section 2.2.2) was simulated for two independent autocatalytic Šesták-Berggren (AC, see Equation (16)) processes [1] with the following kinetic parameters: E1 = 80 kJ·mol−1, E2 = 300 kJ·mol−1, M1 = M2 = 1, N1 = N2 = 2, I1 = I2 = 0.50, A1 = 106.3 s−1, A1 = 1027 s−1 (again, the second and third sets were simulated with I1 = 0.30 and I2 = 0.70, and I1 = 0.70 and I2 = 0.30, respectively). Note that these processes exhibit opposite (positive) asymmetry compared to the above-described JMA datasets.
The results are for the AC datasets A–H (for the three I1/I2 ratios) included in the Supplementary materials (Figures S10–S13); for simplicity the E values corresponding to only one differential and one integral method are displayed. It was indeed found, that all above-discussed conclusions derived for the JMA data are valid also for the AC kinetics with the opposite asymmetry. Based on these findings, it is reasonable to assume that the major conclusions can be extended to all asymmetries in-between the two tested in the present paper. Further generalization of the above-described interpretation for the different (physically meaningful) asymmetries as well as for different sub-process dependences will be subject of further research.
4. Conclusions
- (a)
- Based on theoretical simulations the behavior and performance of the most common isoconversional methods of kinetic analysis were tested in various complex process scenarios. In general situations, when two overlapping sub-processes with different activation energies occurred, most tested methods (KAS, Starink, OFW, and Vyazovkin) performed very similarly and with respect to the E-α outcome (being considered with the general trends or predictive ability in mind) were perfectly interchangeable. On the other hand, the Friedman method and the incremental modified Vyazovkin method provided (as expected) a different course of E-α dependence, which was found to almost always cover the whole E1–E2 range. Similar conclusion was reported also in [28] for overlaps of sub-processes with opposite I values.
- (b)
- Based on the presence and shape of the over- and undershoots manifesting from the integral and differential isoconversional methods, a guide to estimation of the true E1 and E2 values utilizing a combined interpretation of the integral and differential approaches was introduced for the JMA asymmetry and confirmed also for AC model with opposite (positive) asymmetry. The suggested procedure is based on combined interpretation of the positions of the overshoots produced by the differential methods and of the plateaus provided by the integral methods. Development and extensive testing of this methodology is subject of continued research.
- (c)
- In the case of a larger difference between the activation energies of the overlapping sub-processes, the range of applied heating rates was found to drastically influence the course of E-α dependences. The range of applied heating rates should be always optimized with respect to the applied methodology. The Tp-based methods (e.g., Kissinger) generally favor the widest possible ranges of q+. The full-scale non-linear optimization methods (e.g., MKA) usually need to adopt the single-curve-fit approach with fixed E values (see, e.g., [39]) due to the complex kinetics being often T/q+-dependent [40]. On the other hand, the sensitivity of isoconversional methods to the applied q+ range and their consequent performance towards the estimation of the true values of activation energies corresponding to the involved sub-processes depend on two factors: consistence of the shape of the complex kinetic curve (the breakpoint being the complete switch of the positions of the involved kinetic sub-peaks within the range of applied q+) and the weighted (over both n and I) presence of the full overlaps of the involved sub-processes.
- (d)
- With regard to the methods accuracies (tested on datasets D–G from the first group of scenarios, where both sub-processes had the same activation energy), the Friedman, Starink, and Vyazovkin methods provided correct and accurate values of E, the KAS method was off by approximately 0.15%, and the OFW method provided data with error up to 0.8% (contrary to all other methods, the OFW method provided a non-constant E-α dependence). These conclusions confirm the similarity between the single process scenario and complex process situation where all the sub-processes have the same apparent activation energy. Moreover, the two main evaluation algorithms for determining tα/Tα/Φα values (nearest value versus interpolation approach) were compared—most tested methods are insensitive to the way of evaluation. The only exception was the modified incremental Vyazovkin method, which exhibited large scatter in the E-α results, if the latter, less accurate approach (assignment of the nearest tα/Tα/Φα values) was used.
Supplementary Materials
The following are available online at https://www.mdpi.com/2227-9717/7/10/738/s1: Figure S1: Errors for the group 1 datasets A and G simulated for 10 k and 50 k points/curve. Figure S2: Errors for the group 1 datasets B, C, D and E simulated for 10 k points/curve. Figure S3: Errors for the group 1 dataset F simulated for 5, 10, 20 and 50 k points/curve. Figure S4: Errors for the group 2 datasets A, B, C and D simulated for I1/I2 = 50/50. Figure S5: Errors for the group 2 datasets E, F, G and H simulated for I1/I2 = 50/50. Figure S6: Errors for the group 2 datasets A, B, C and D simulated for I1/I2 = 30/70. Figure S7: Errors for the group 2 datasets E, F, G and H simulated for I1/I2 = 30/70. Figure S8: Errors for the group 2 datasets A, B, C and D simulated for I1/I2 = 70/30. Figure S9: Errors for the group 2 datasets E, F, G and H simulated for I1/I2 = 70/30. Figure S10: Example AC data-curve simulated for 5 °C/min. Figure S11: E-α dependences obtained for AC data with I1/I2 = 30/70. Figure S12: E-α dependences obtained for AC data with I1/I2 = 50/50. Figure S13: E-α dependences obtained for AC data with I1/I2 = 70/30.
Author Contributions
Conceptualization, R.S.; software, G.L.; validation, R.S.; formal analysis, G.L.; data curation, G.L.; writing—review and editing, R.S.
Funding
This research was funded by the Czech Science Foundation, grant number 17-11753S.
Acknowledgments
We gratefully acknowledge the support of NVIDIA Corporation with the donation of the Titan Xp GPU used for this research for performing calculations.
Conflicts of Interest
The authors declare no conflict of interest.
References
- Šesták, J. Thermophysical Properties of Solids, Their Measurements and Theoretical Analysis; Elsevier: Amsterdam, The Netherlands, 1984. [Google Scholar]
- Šesták, J. Science of Heat and Thermophysical Studies: A Generalized Approach to Thermal Analysis; Elsevier: Amsterdam, The Netherlands, 2005. [Google Scholar]
- Kissinger, H.E. Reaction kinetics in differential thermal analysis. Anal. Chem. 1957, 29, 1702–1706. [Google Scholar] [CrossRef]
- Ozawa, T. A new method of analyzing thermogravimetric data. Bull. Chem. Soc. Jpn. 1965, 38, 1881. [Google Scholar] [CrossRef]
- Takhor, R.L.; Hench, L.L.; Freiman, S.W. (Eds.) Advances in Nucleation and Crystallization of Glasses; American Ceramic Society: Columbus, OH, USA, 1971; pp. 166–172. [Google Scholar]
- Mahadevan, S.; Giridhar, A.; Singh, A.K. Calorimetric measurements on as–sb–se glasses. J. Non-Cryst. Solids 1986, 88, 11–34. [Google Scholar] [CrossRef]
- Friedman, H.L. Kinetics of thermal degradation of char-forming plastics from thermogravimetry. Application to a phenolic plastic. J. Polym. Sci. Part C 1964, 6, 183–195. [Google Scholar] [CrossRef]
- Akahira, T.; Sunose, T. Method of determining activation deterioration constant of electrical insulating materials. Res. Rep. Chiba Inst. Technol. (Sci. Technol.) 1971, 16, 22–31. [Google Scholar]
- Starink, M.J. The determination of activation energy from linear heating rate experiments: A comparison of the accuracy of isoconversion methods. Thermochim. Acta 2003, 404, 163–176. [Google Scholar] [CrossRef]
- Flynn, J.H.; Wall, L.A. General treatment of the thermogravimetry of polymers. J. Res. Nat. Bur. Stand. 1966, 70, 487–523. [Google Scholar] [CrossRef]
- Vyazovkin, S.; Dollimore, D. Linear and nonlinear procedures in isoconversionalcomputations of the activation energy of thermally induced reactions in solids. J. Chem. Inf. Comp. Sci. 1996, 36, 42–45. [Google Scholar] [CrossRef]
- Vyazovkin, S. Evaluation of the activation energy of thermally stimulated solidstate reactions under an arbitrary variation of the temperature. J. Comput. Chem. 1997, 18, 393–402. [Google Scholar] [CrossRef]
- Vyazovkin, S. Advanced isoconversional method. J. Therm. Anal. Calorim. 1997, 49, 1493–1499. [Google Scholar] [CrossRef]
- Malek, J. The kinetic-analysis of nonisothermal data. Thermochim. Acta 1992, 200, 257–269. [Google Scholar] [CrossRef]
- Vyazovkin, S. A unified approach to kinetic processing of nonisothermal data. Int. J. Chem. Kinet. 1996, 28, 95–101. [Google Scholar] [CrossRef]
- Perez-Maqueda, L.A.; Criado, J.M.; Sanchez-Jimenez, P.E. Combined kinetic analysis of solid-state reactions: A powerful tool for the simultaneous determination of kinetic parameters and the kinetic model without previous assumptions on the reaction mechanism. J. Phys. Chem. A 2006, 110, 12456–12462. [Google Scholar] [CrossRef] [PubMed]
- Kitabayashi, S.; Koga, N. Thermal Decomposition of Tin(II) Oxyhydroxide and Subsequent Oxidation in Air: Kinetic Deconvolution of Overlapping Heterogeneous Processes. J. Phys. Chem. C 2015, 119, 16188–16199. [Google Scholar] [CrossRef] [Green Version]
- Opfermann, J. Kinetic analysis using multivariate non-linear regression. I. basic concepts. J. Therm. Anal. Calorim. 2000, 60, 641–658. [Google Scholar] [CrossRef]
- Sbirrazuoli, N.; Girault, Y.; Elegant, L. Simulations for evaluation of kinetic methods in differential scanning calorimetry. Part 3. Thermochim. Acta 1997, 293, 25–37. [Google Scholar] [CrossRef]
- Cai, J.; Wu, W.; Liu, R. Isoconversional Kinetic Analysis of Complex Solid-State Processes: Parallel and Successive Reactions. Ind. Eng. Chem. Res. 2012, 51, 16157–16161. [Google Scholar] [CrossRef]
- Vyazovkin, S.V.; Goryachko, V.I.; Lesnikovich, A.I. An approach to the solution of the inverse kinetic problem in the case of complex processes. Part III. Parallel independent reactions. Thermochim. Acta 1992, 197, 41–51. [Google Scholar] [CrossRef]
- Criado, J.M.; Gonzalez, M.; Ortega, A.; Real, C. Discrimination of the kinetic model of overlapping solid-state reactions from non-isothermal data. J. Therm. Anal. 1988, 34, 1387. [Google Scholar] [CrossRef]
- Vaganova, N.I.; Rozenband, V.I.; Barzykin, V.V. Thermoanalytical studies of the kinetic of reversible reactions. J. Therm. Anal. 1988, 34, 949–962. [Google Scholar] [CrossRef]
- Vyazovkin, S.V.; Lesnikovich, A.I. An approach to the solution of the inverse kinetic problem in the case of complex processes 1. Thermochim. Acta 1990, 165, 273–280. [Google Scholar] [CrossRef]
- Criado, J.M.; Sanchez-Jimenez, P.E.; Perez-Maqueda, L.A. Critical study of the isoconversional methods of kinetic analysis. J. Therm. Anal. Calorim. 2008, 92, 199–203. [Google Scholar] [CrossRef] [Green Version]
- Cai, J.M.; Chen, S.Y. A new iterative linear integral isoconversional method for the determination of the activation energy varying with the conversion degree. J. Comput. Chem. 2009, 30, 1986–1991. [Google Scholar] [CrossRef]
- Perejon, A.; Sanchez-Jimenez, P.E.; Criado, J.M.; Perez-Maqueda, L.A. Kinetic analysis of complex solid-state reactions. A new deconvolution procedure. J. Phys. Chem. B 2011, 115, 1780–1791. [Google Scholar] [CrossRef]
- Muravyev, N.V.; Pivkina, A.N.; Koga, N. Critical appraisal of kinetic calculation methods applied to overlapping multistep reactions. Molecules 2019, 24, 2298. [Google Scholar] [CrossRef]
- Johnson, W.A.; Mehl, K.F. Reaction kinetics in processes of nucleation and growth. Trans. Metall. Soc. AIME 1939, 135, 416–442. [Google Scholar]
- Avrami, M. Kinetics of phase change I—General theory. J. Chem. Phys. 1939, 7, 1103–1112. [Google Scholar] [CrossRef]
- Avrami, M. Kinetics of phase change. II—Transformation-time relations for random distribution of nuclei. J. Chem. Phys. 1940, 7, 212–224. [Google Scholar] [CrossRef]
- Avrami, M. Granulation, phase change, and microstructure—Kinetics of phase change III. J. Chem. Phys. 1941, 7, 177–184. [Google Scholar] [CrossRef]
- Vyazovkin, S. Modification of the integral isoconversional method to account for variation in the activation energy. J. Comput. Chem. 2001, 22, 178–183. [Google Scholar] [CrossRef]
- Press, W.H.; Flannery, B.P.; Teukolsky, S.A.; Veterling, W.T. Numerical Recipes in Pascal; Cambridge University Press: Cambridge, UK, 1989. [Google Scholar]
- Brent, R.P. Algorithms for Minimization without Derivatives; Prentice Hall: Englewood Cliffs, NJ, USA, 1973. [Google Scholar]
- Budrugeac, P.; Homentcovschi, D.; Segal, E. Critical considerations on the isoconversional methods III. J. Therm. Anal. Calorim. 2001, 66, 557–565. [Google Scholar] [CrossRef]
- Šimon, P.; Thomas, P.; Dubaj, T.; Cibulková, Z.; Peller, A.; Veverka, M. The mathematical incorrectness of the integral isoconversional methods in case of variable activation energy and the consequences. J. Therm. Anal. Calorim. 2014, 115, 853–859. [Google Scholar] [CrossRef]
- Golikeri, S.V.; Luss, D. Analysis of activation energy of grouped parallel reactions. AIChE J. 1972, 18, 277–282. [Google Scholar] [CrossRef]
- Brandová, D.; Svoboda, R.; Olmrová Zmrhalová, Z.; Chovanec, J.; Bulánek, R.; Romanová, J. Crystallization kinetics of glassy materials—the ultimate complexity? J. Therm. Anal. Calorim. 2018, 134, 825–834. [Google Scholar] [CrossRef]
- Svoboda, R.; Brandová, D. Crystal growth from mechanically induced defects: A phenomenon observed for glassy materials. J. Therm. Anal. Calorim. 2017, 127, 799–808. [Google Scholar] [CrossRef]
Figure 1.
First sub-group of base sets of simulated data; the simulations were performed with 10,000 points/curve density. The kinetic parameters are listed in Table 1. Each graph depicts set of seven complex kinetic curves simulated for the heating rates 0.5, 1, 2, 5, 10, 20, and 50 °C·min−1. (a) set A; (b) set B; (c) set C.
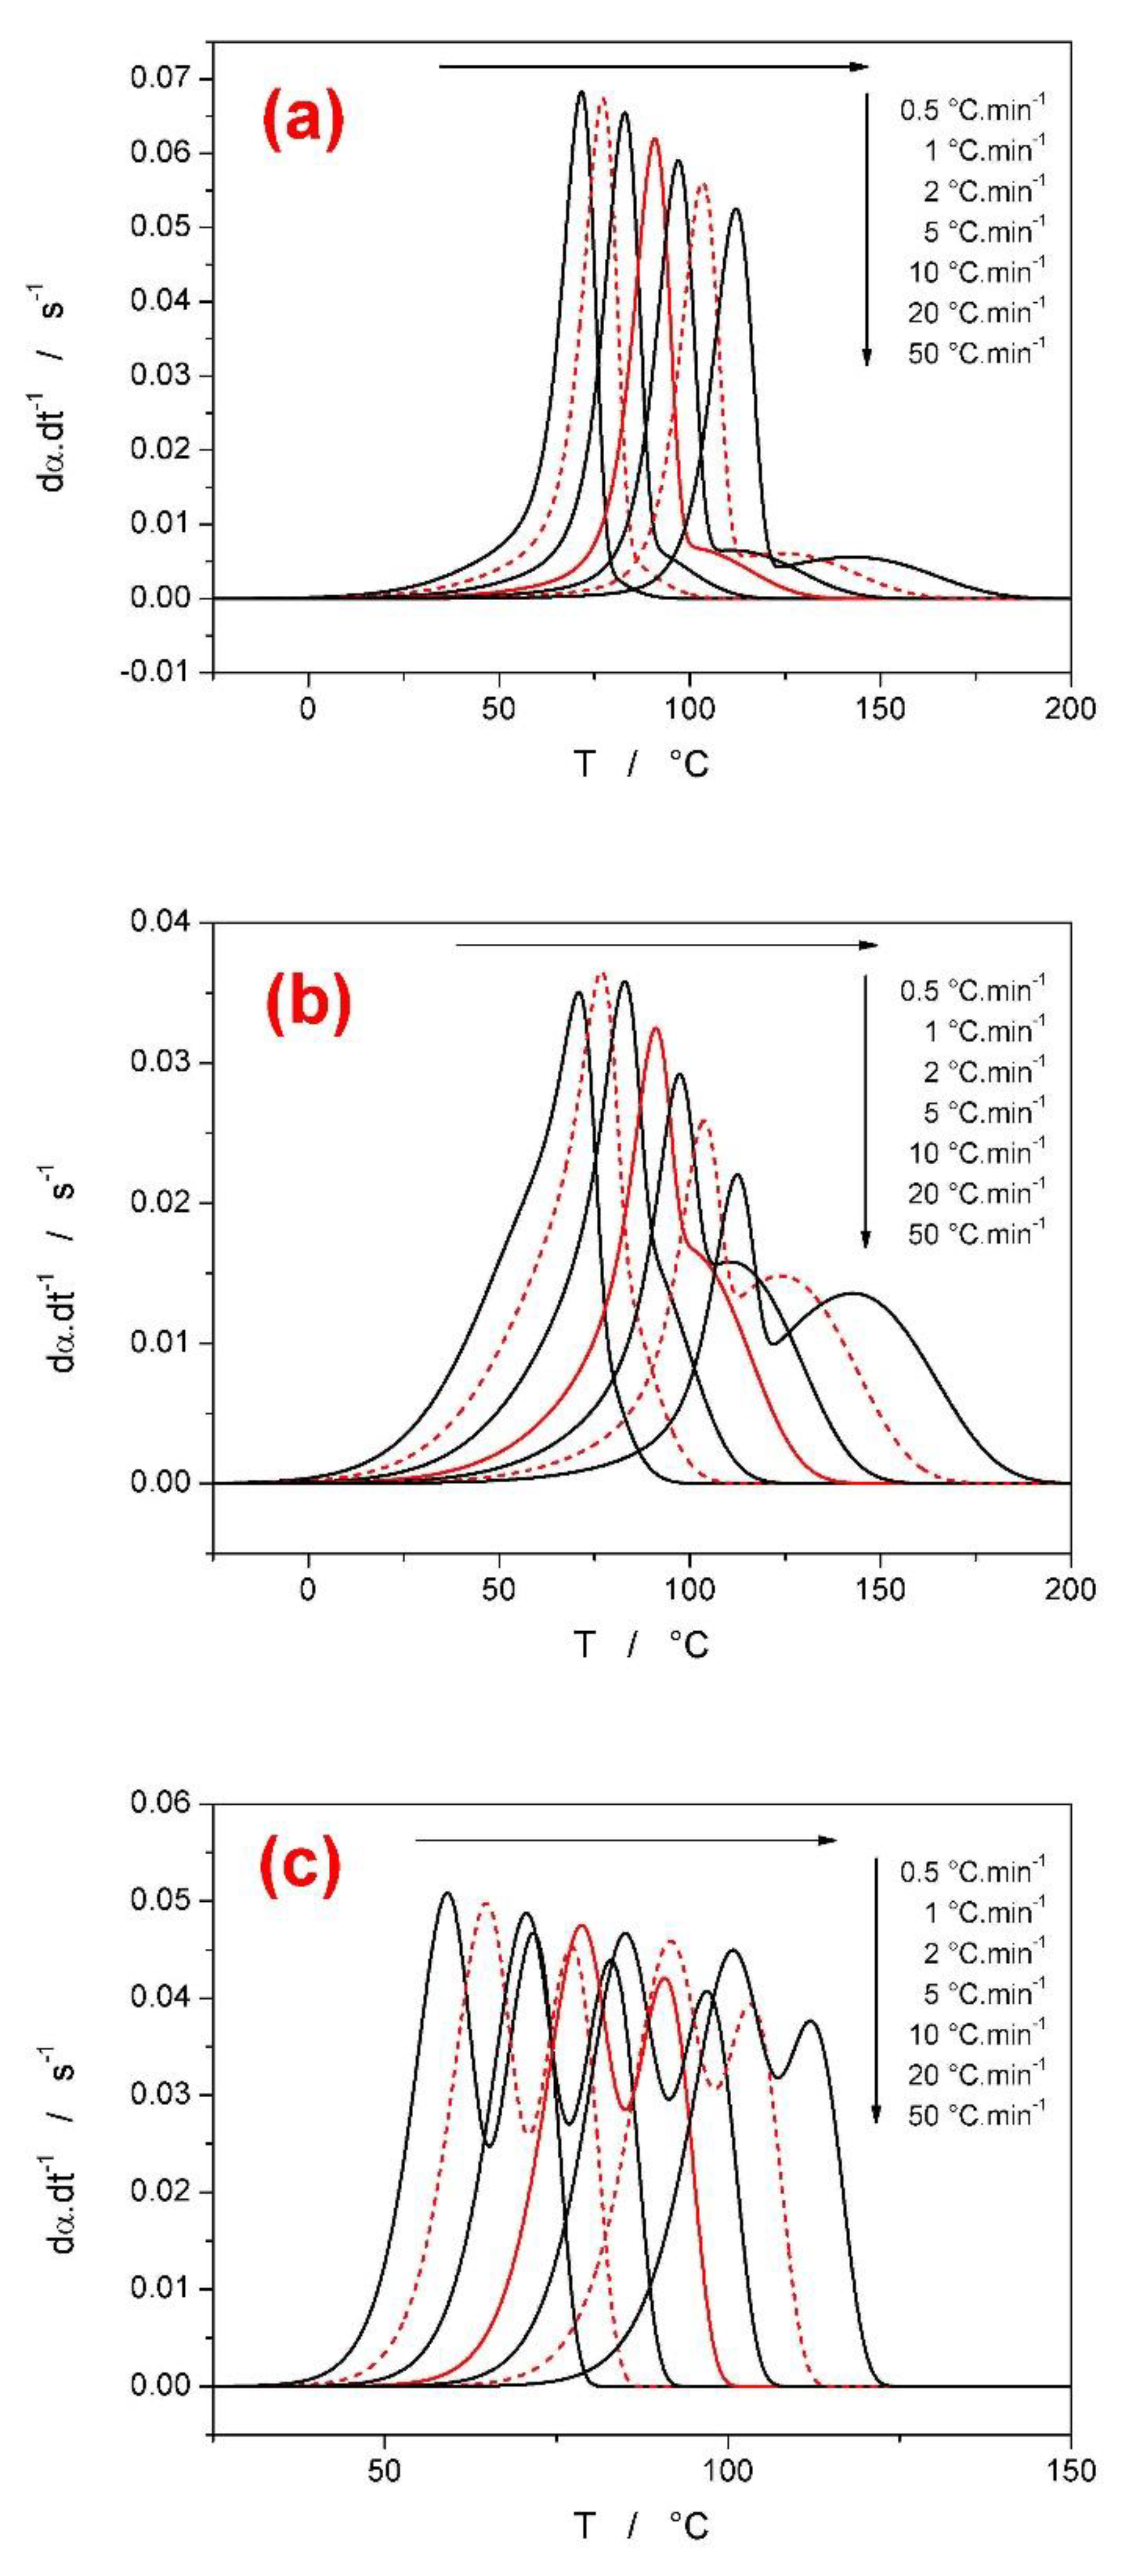
Figure 2.
Second sub-group of base sets of simulated data; the simulations were performed with 10,000 points/curve density. The kinetic parameters are listed in Table 1. Each graph depicts set of seven complex kinetic curves simulated for the heating rates 0.5, 1, 2, 5, 10, 20, and 50 °C·min−1. (a) set D; (b) set E; (c) set F; (d) set G.
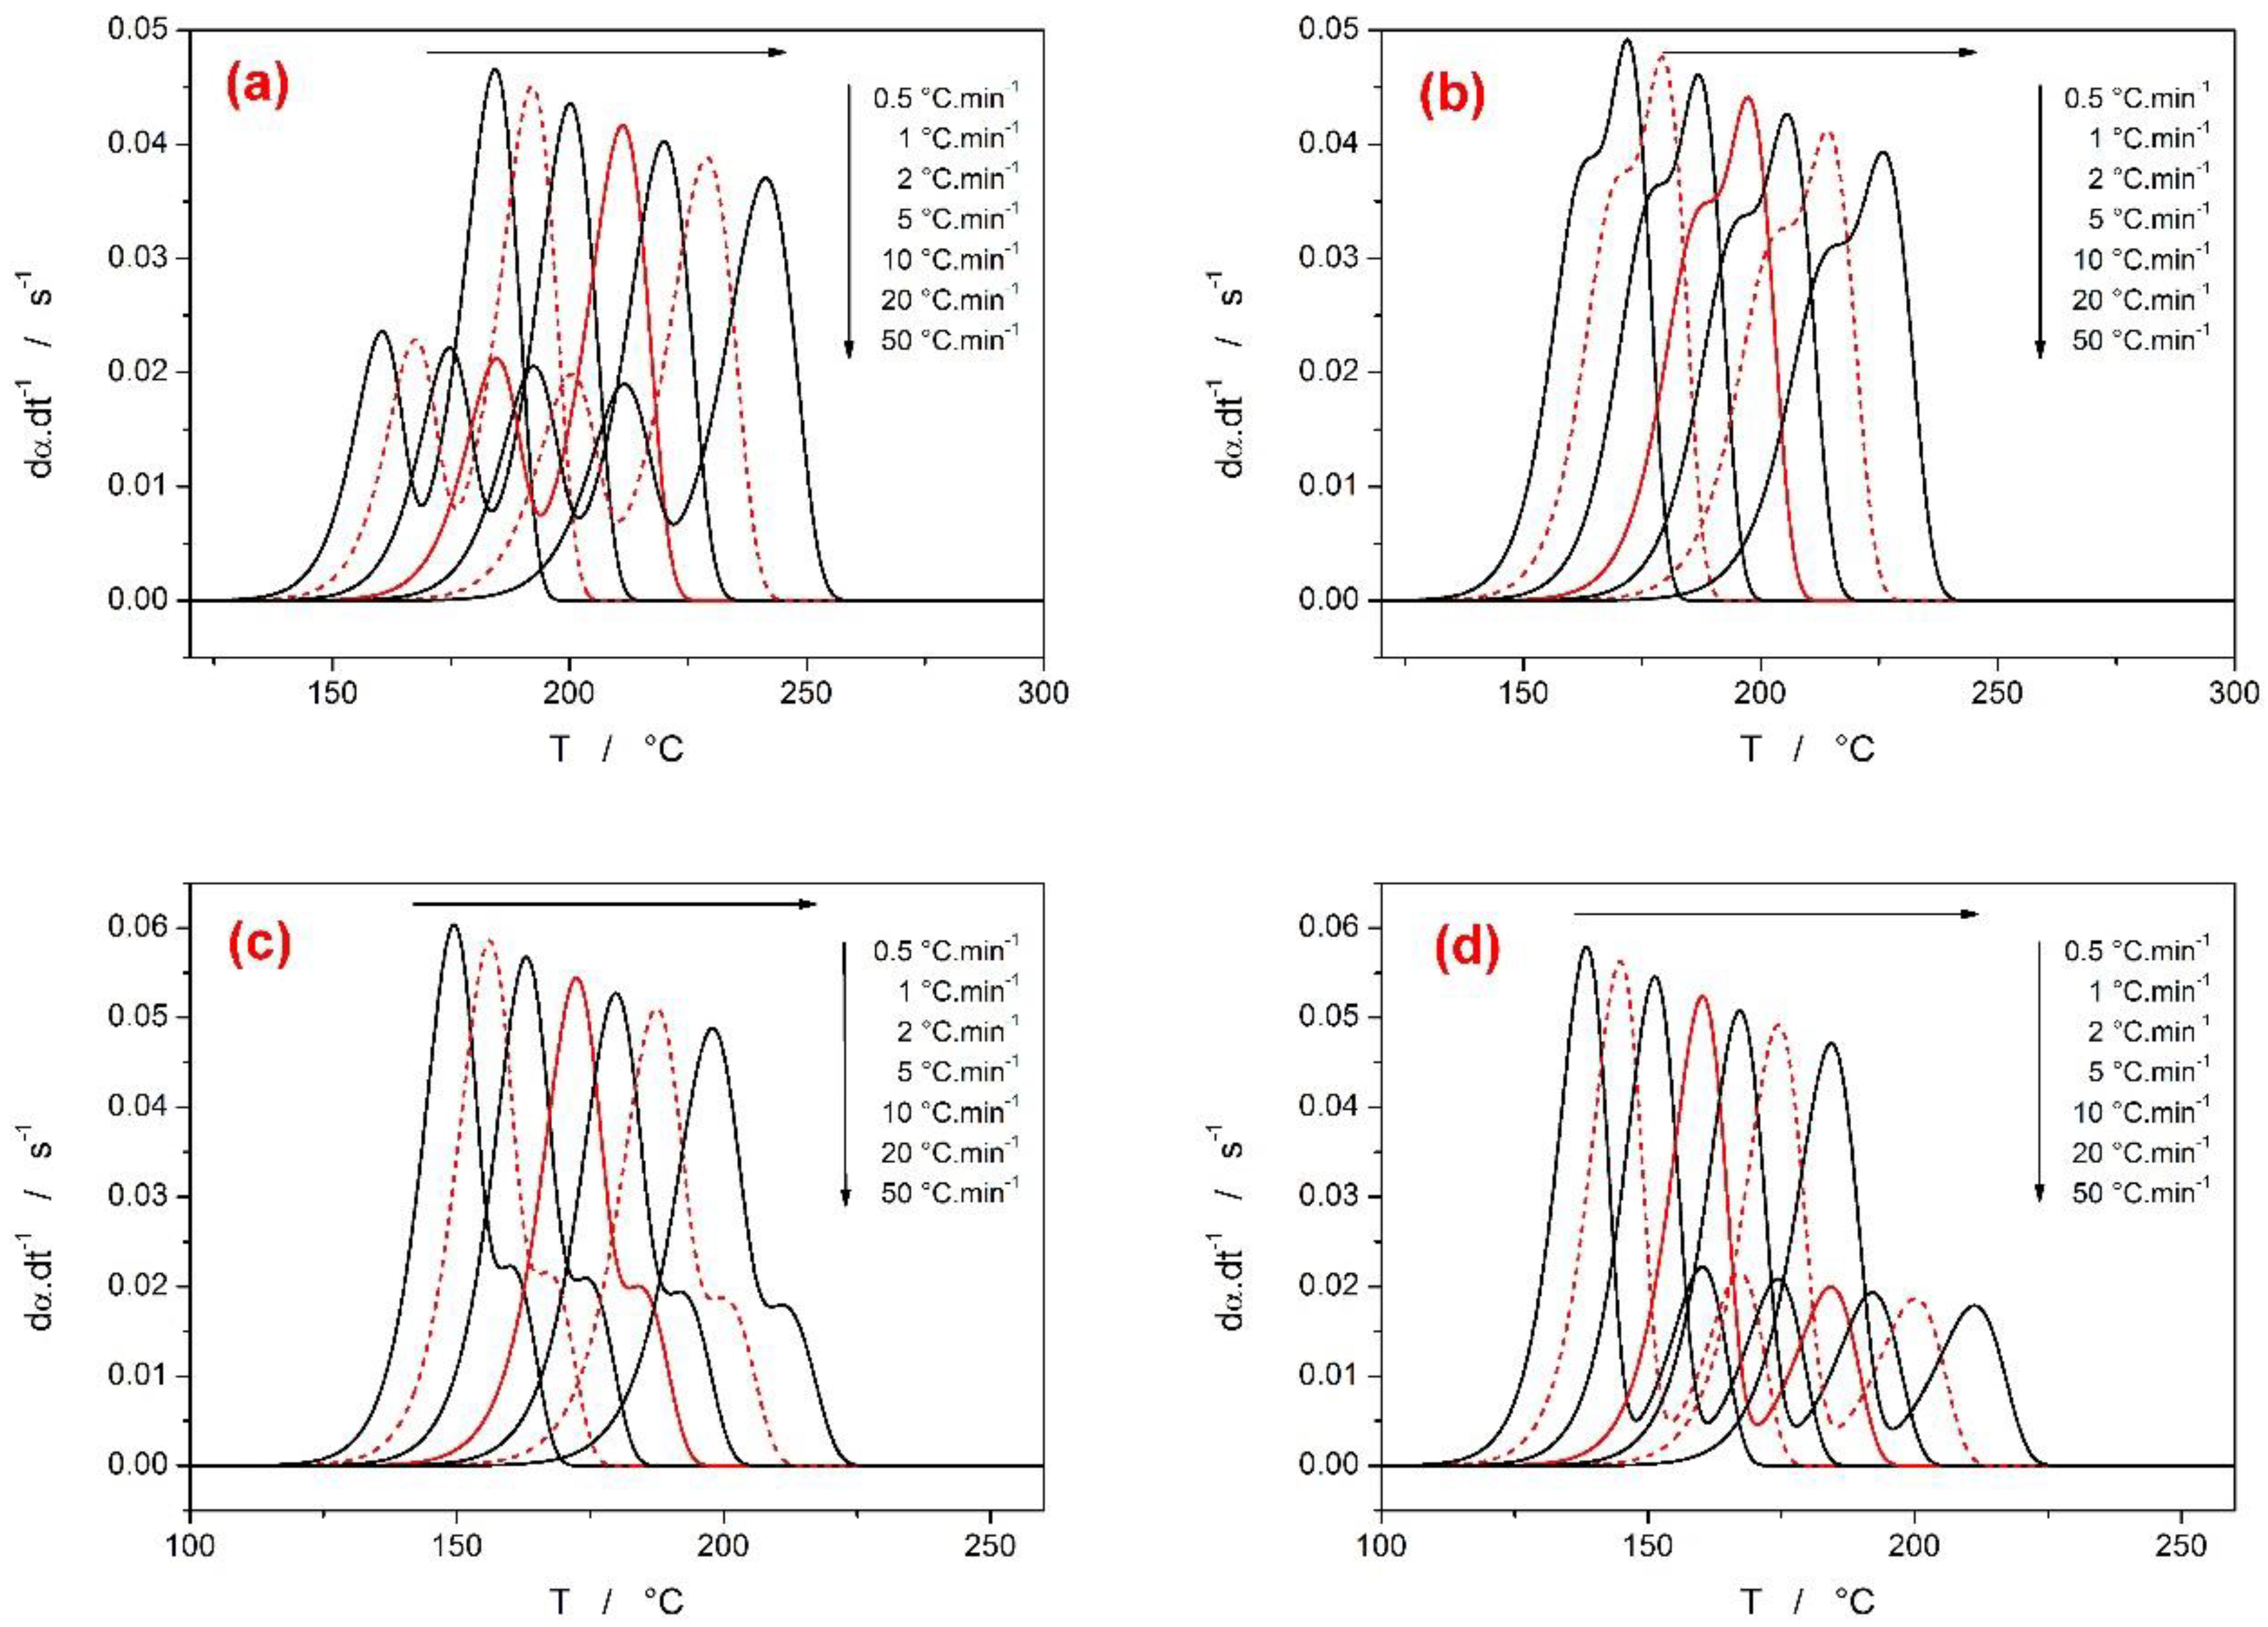
Figure 3.
Datasets simulated within the second group of data for the following parameters E1 = 50 kJ·mol−1, E2 = 300 kJ·mol−1, JMA kinetics, m1 = m2 = 2, I1 = I2 = 0.50, A1 = 102.5 s−1, A1 = 1027 s−1, 10,000 points/curve density. (a) set A; (b) set B; (c) set C; (d) set D; (e) set E; (f) set F; (g) set G; (h) set H.
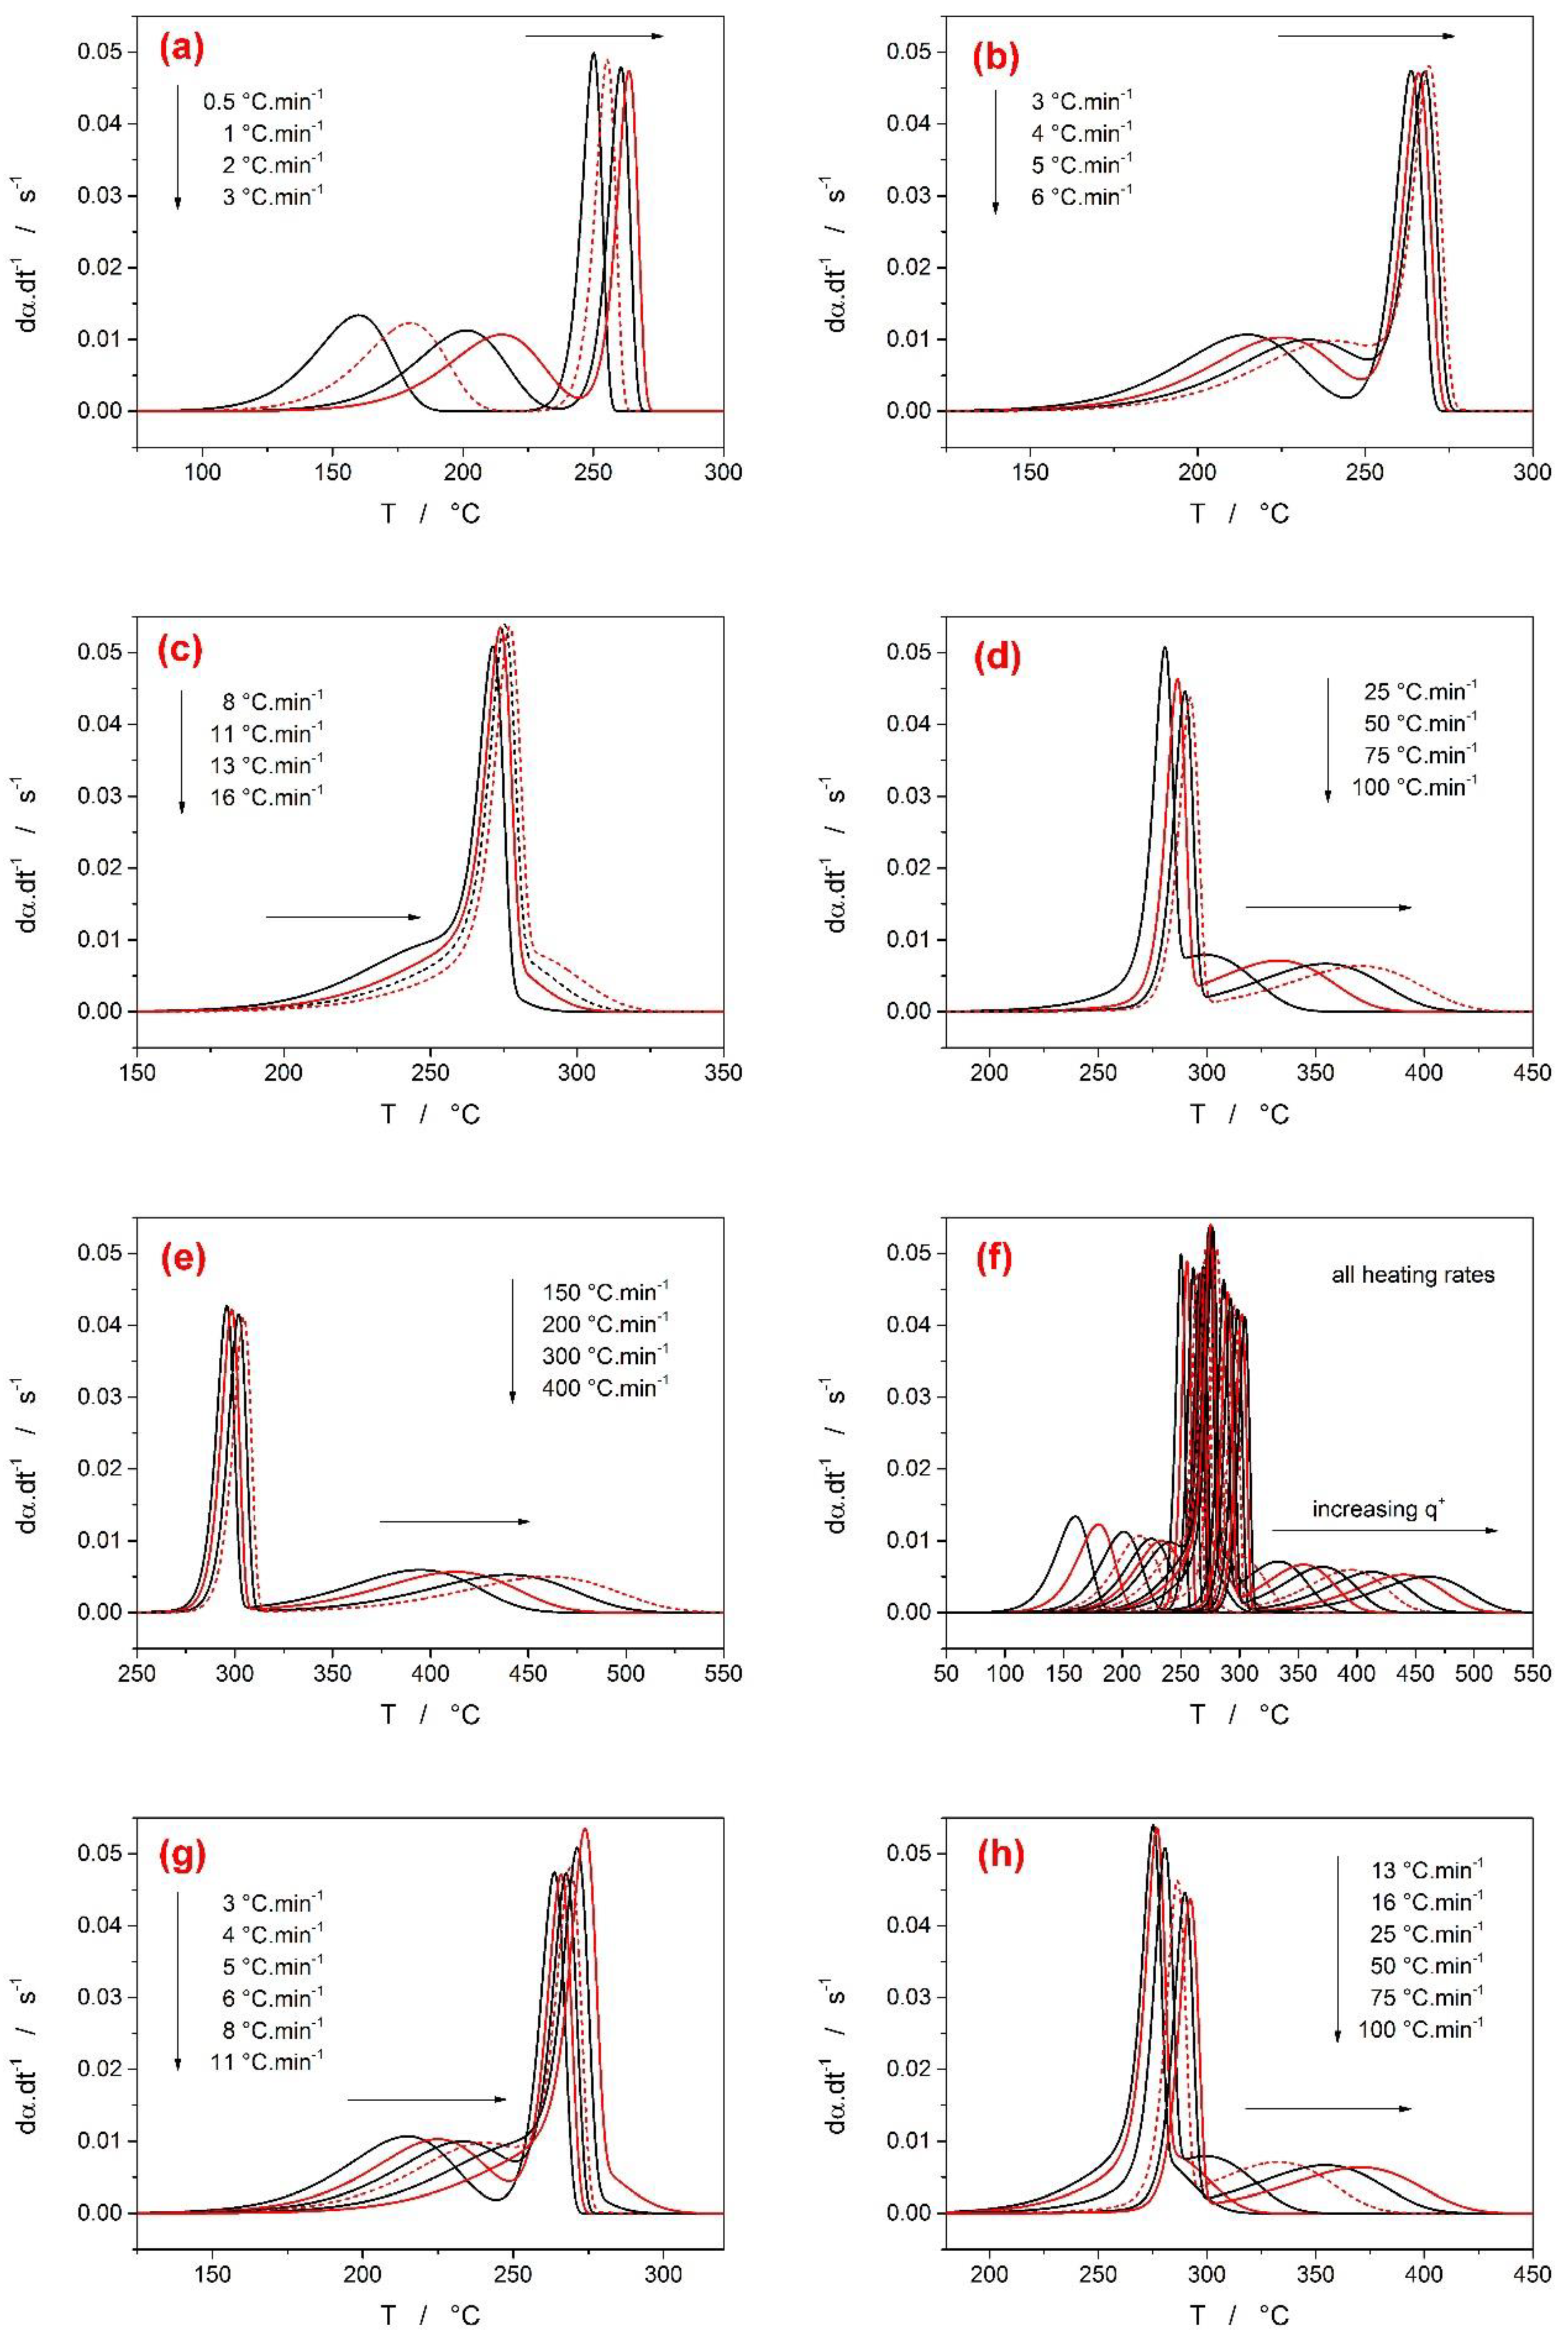
Figure 4.
Results of the Friedman, KAS, Starink, OFW, and Vyazovkin analyses applied to the datasets A, B, C, D, E, and G (group 1) simulated with the 10,000 points/curve density. Results for datasets A and G are also shown for simulations with 50,000 points/curve density. The horizontal red dashed lines in each graph represent the true E1 and E2 values input into the simulations. (a) set A, 10 k; (b) set A, 50 k; (c) set B, 10 k; (d) set C, 10 k; (e) set D, 10 k; (f) set E, 10 k; (g) set G, 10 k; (h) set G, 50 k.
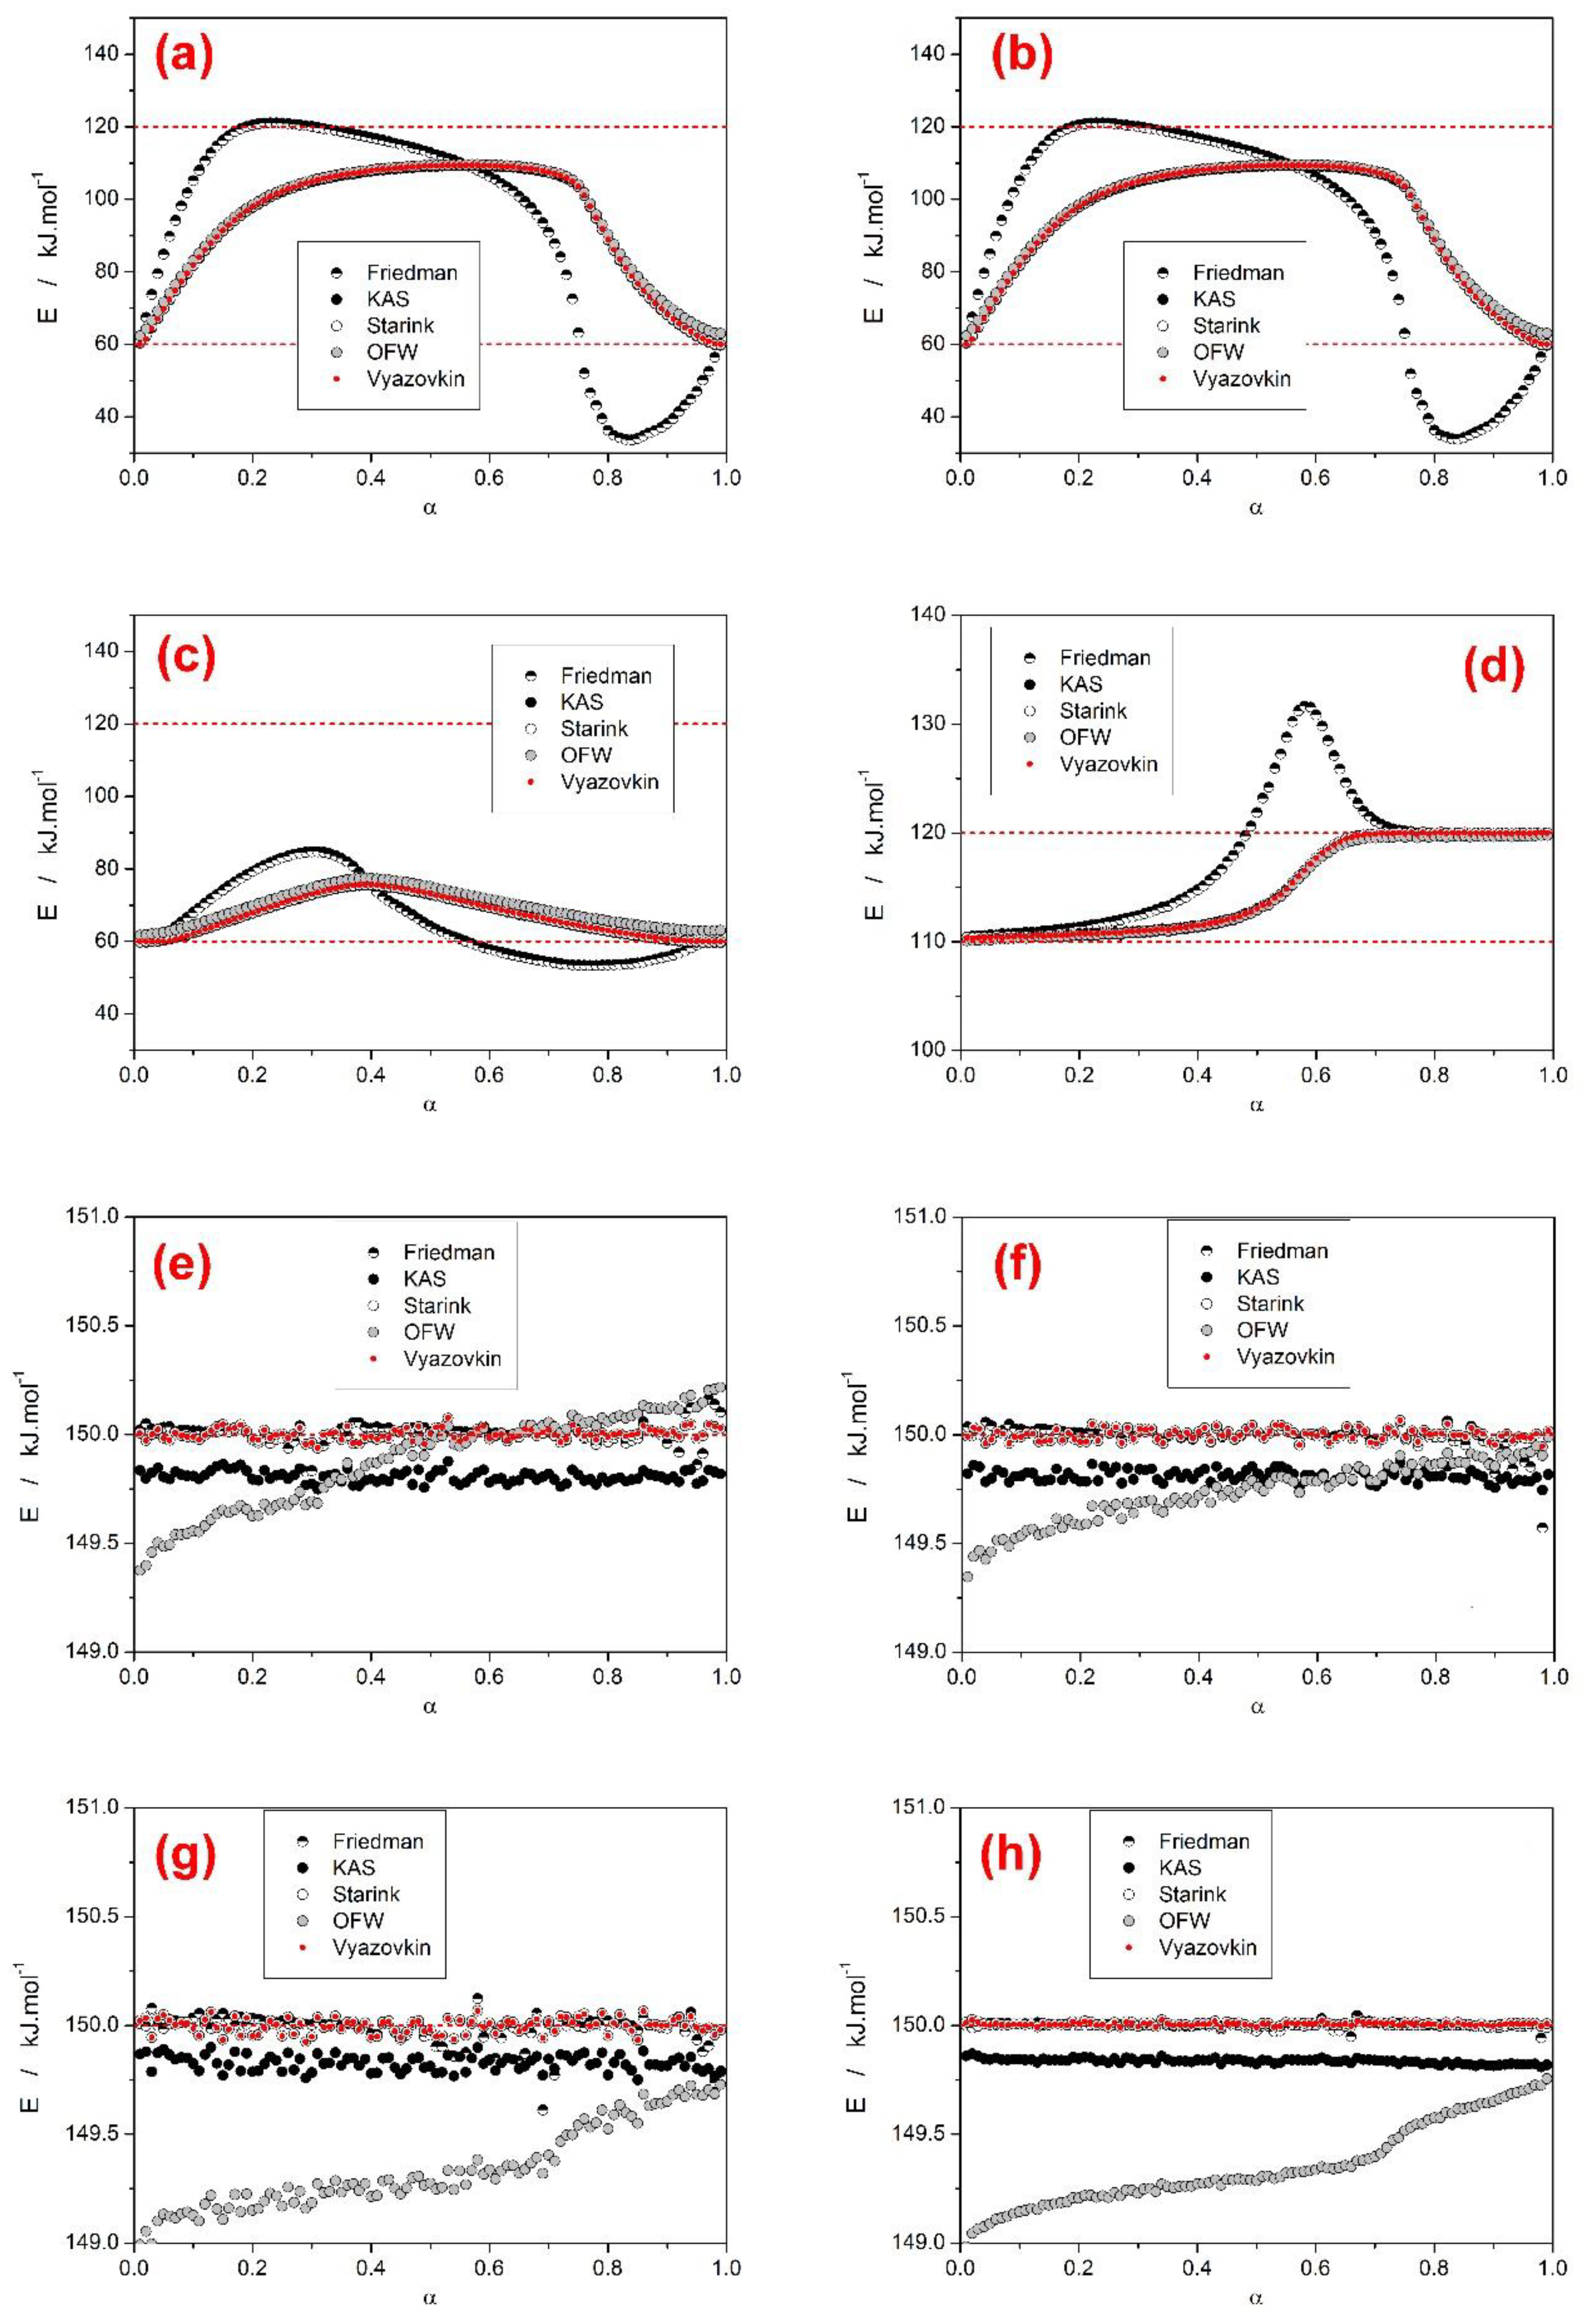
Figure 5.
Upper four graphs: Results of the Friedman, KAS, Starink, OFW and Vyazovkin analyses applied to the dataset F (group 1). Each graph represents evaluation made from the dataset simulated with different (5000, 10,000, 20,000, and 50,000) points/curve density. The horizontal red dashed line in each graph represents the true E value input into the simulations. (a) set F, 5 k; (b) set F, 10 k; (c) set F, 20 k; (d) set F, 50 k. Bottom four graphs: results of the modified Vyazovkin method applied to the dataset B (group 2) and the I1 = I2 = 0.50 simulated at 5000, 10,000, 20,000 and 50,000 points/curve density. Data for the evaluations based on the nearest t/T values attribution versus proper interpolation are shown. From the 10,000 points/curve option, the trends are already clearly visible and quantifiable; as the number of points per curve increases, the smoothness of the E-α dependences rises and at 50,000 points/curve all the trends are unambiguous. (e) resolution 5 k; (f) resolution 10 k; (g) resolution 20 k; (h) resolution 50 k.
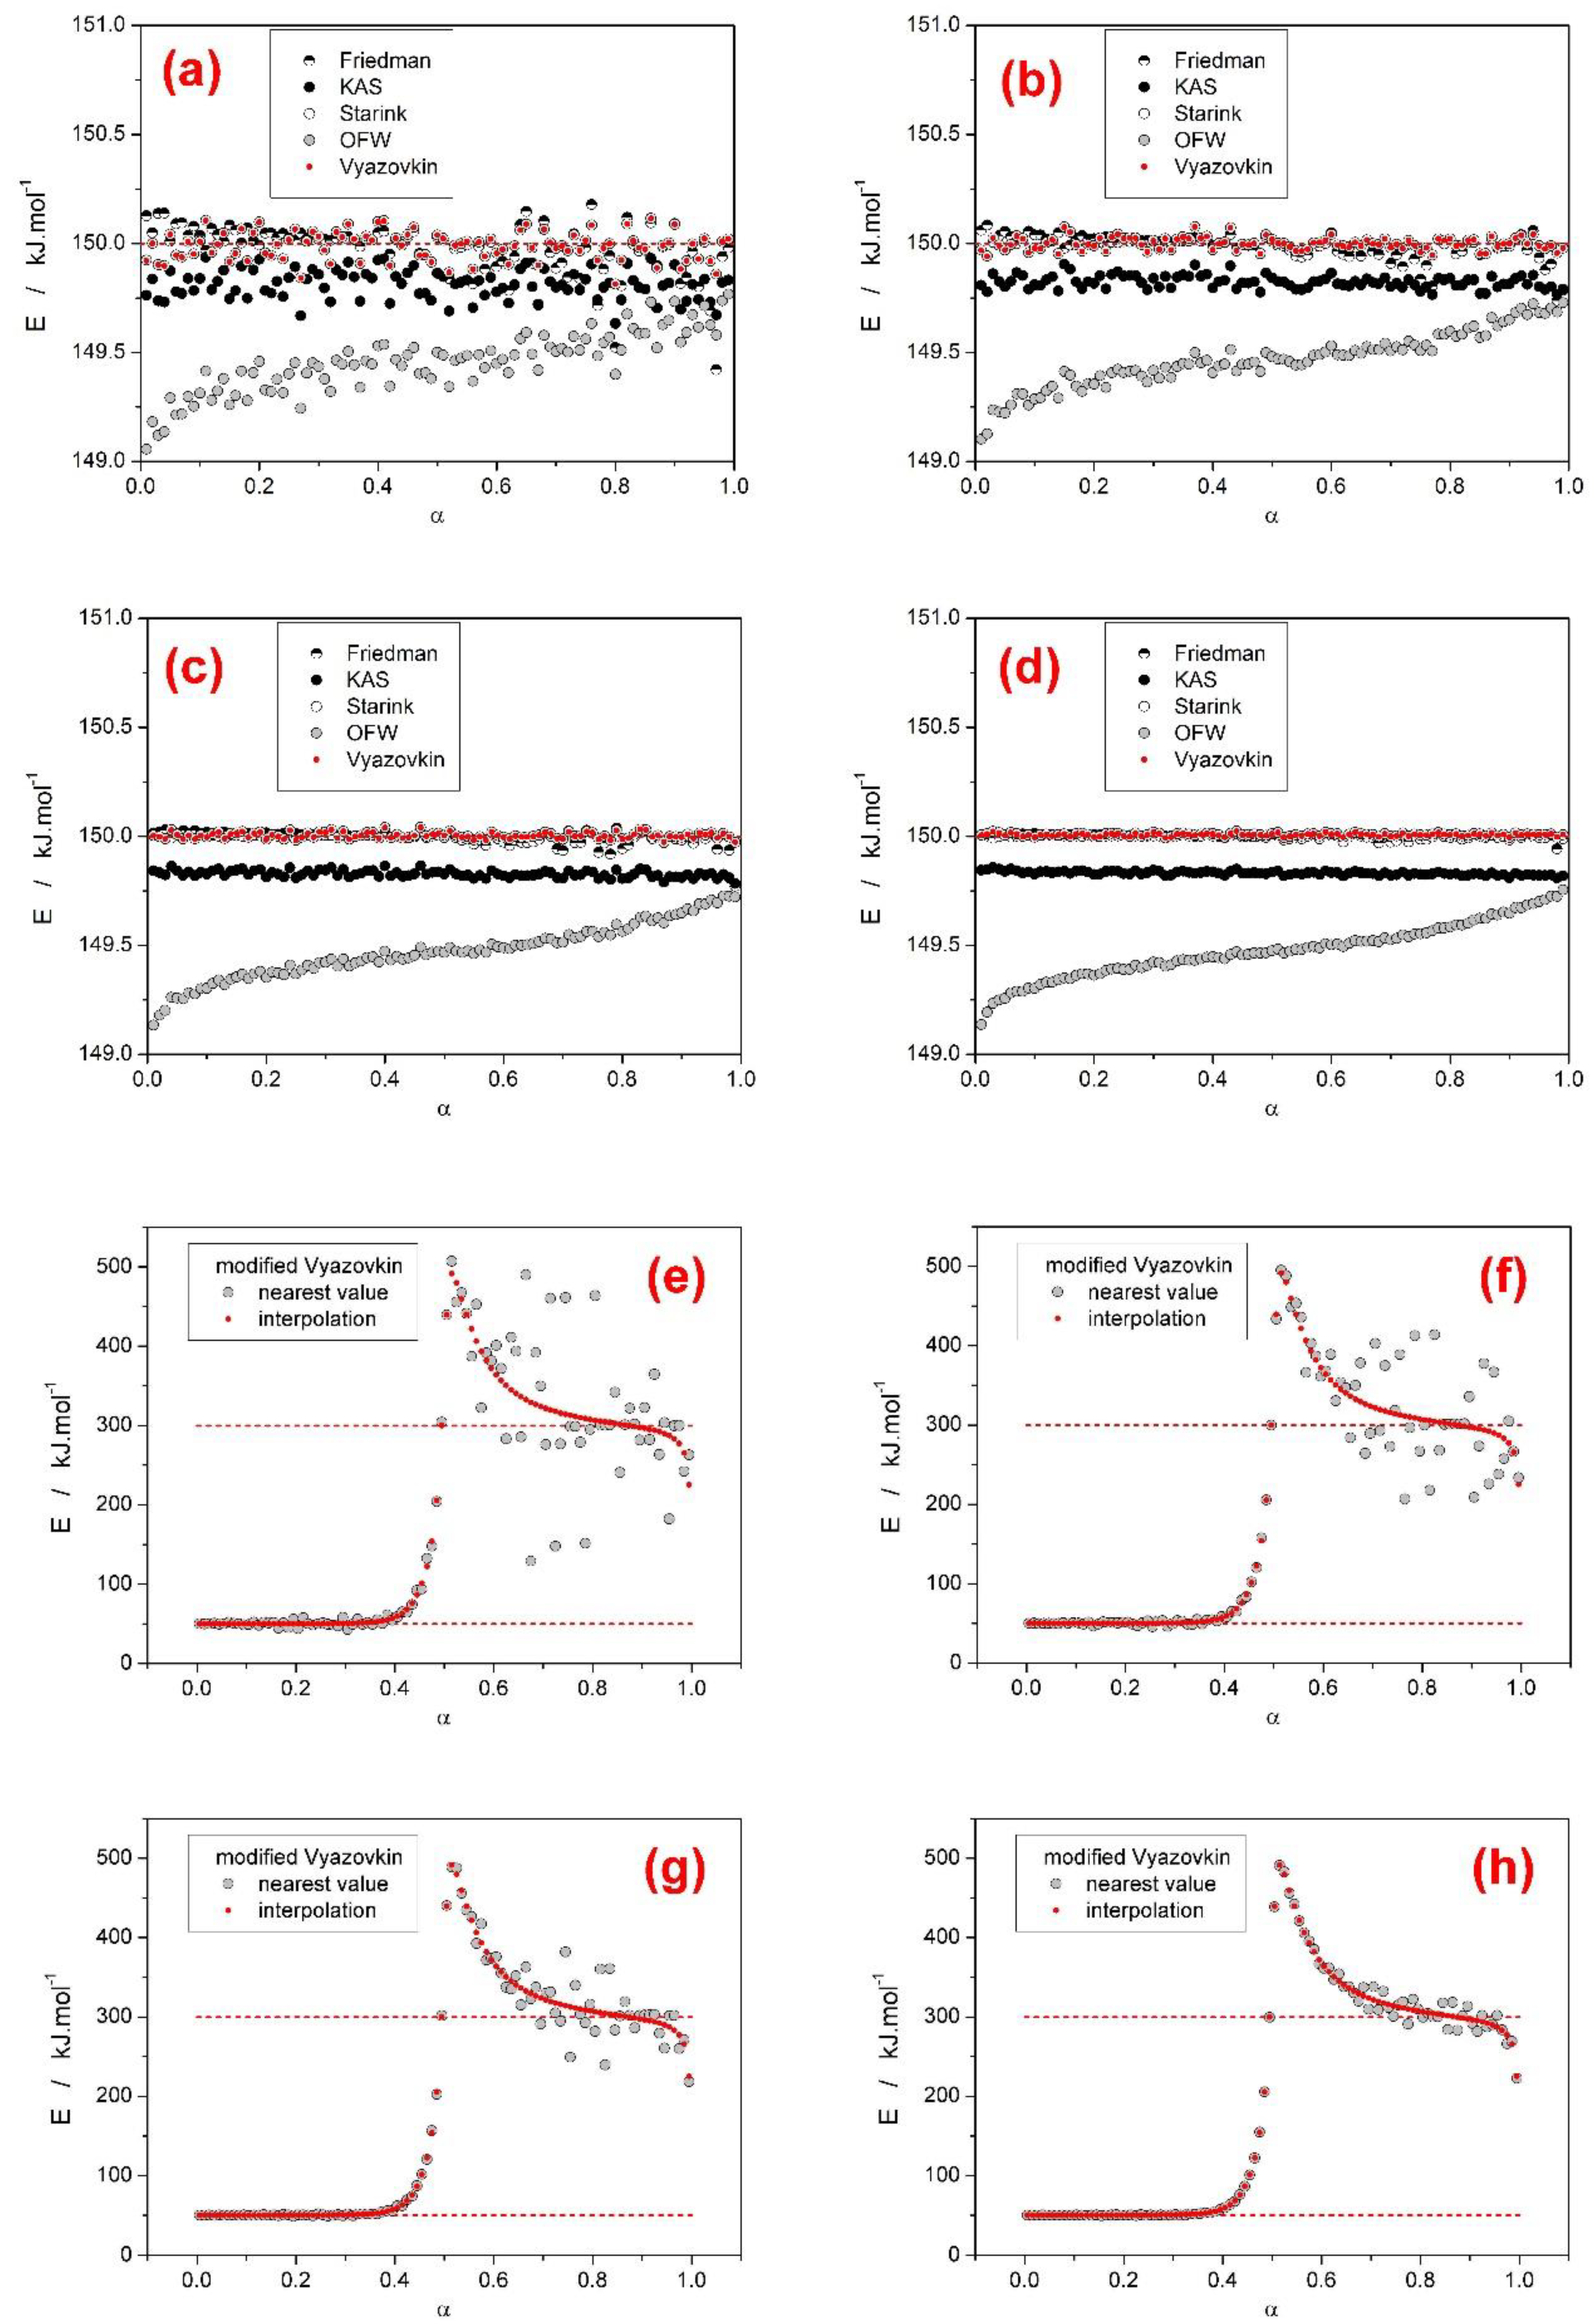
Figure 6.
Results of the Friedman, Starink, Vyazovkin and modified incremental Vyazovkin analyses applied to the datasets A–H (group 2) and the I1 = I2 = 0.50 simulated at 10,000 points/curve density. The horizontal red dashed lines in each graph represent the true E1 and E2 values input into the simulations. (a) set A; (b) set B; (c) set C; (d) set D; (e) set E; (f) set F; (g) set G; (h) set H.

Figure 7.
Results of the Friedman, Starink, Vyazovkin, and modified incremental Vyazovkin analyses applied to the datasets A–D (group 2) and the I1 = 0.30, I2 = 0.70, and I1 = 0.70, I2 = 0.30 simulated at 10,000 points/curve density. The horizontal red dashed lines in each graph represent the true E1 and E2 values input into the simulations. (a) set A, I1 = 0.30, I2 = 0.70; (b) set A, I1 = 0.70, I2 = 0.30; (c) set B, I1 = 0.30, I2 = 0.70; (d) set B, I1 = 0.70, I2 = 0.30; (e) set C, I1 = 0.30, I2 = 0.70; (f) set C, I1 = 0.70, I2 = 0.30; (g) set D, I1 = 0.30, I2 = 0.70; (h) set D, I1 = 0.70, I2 = 0.30.
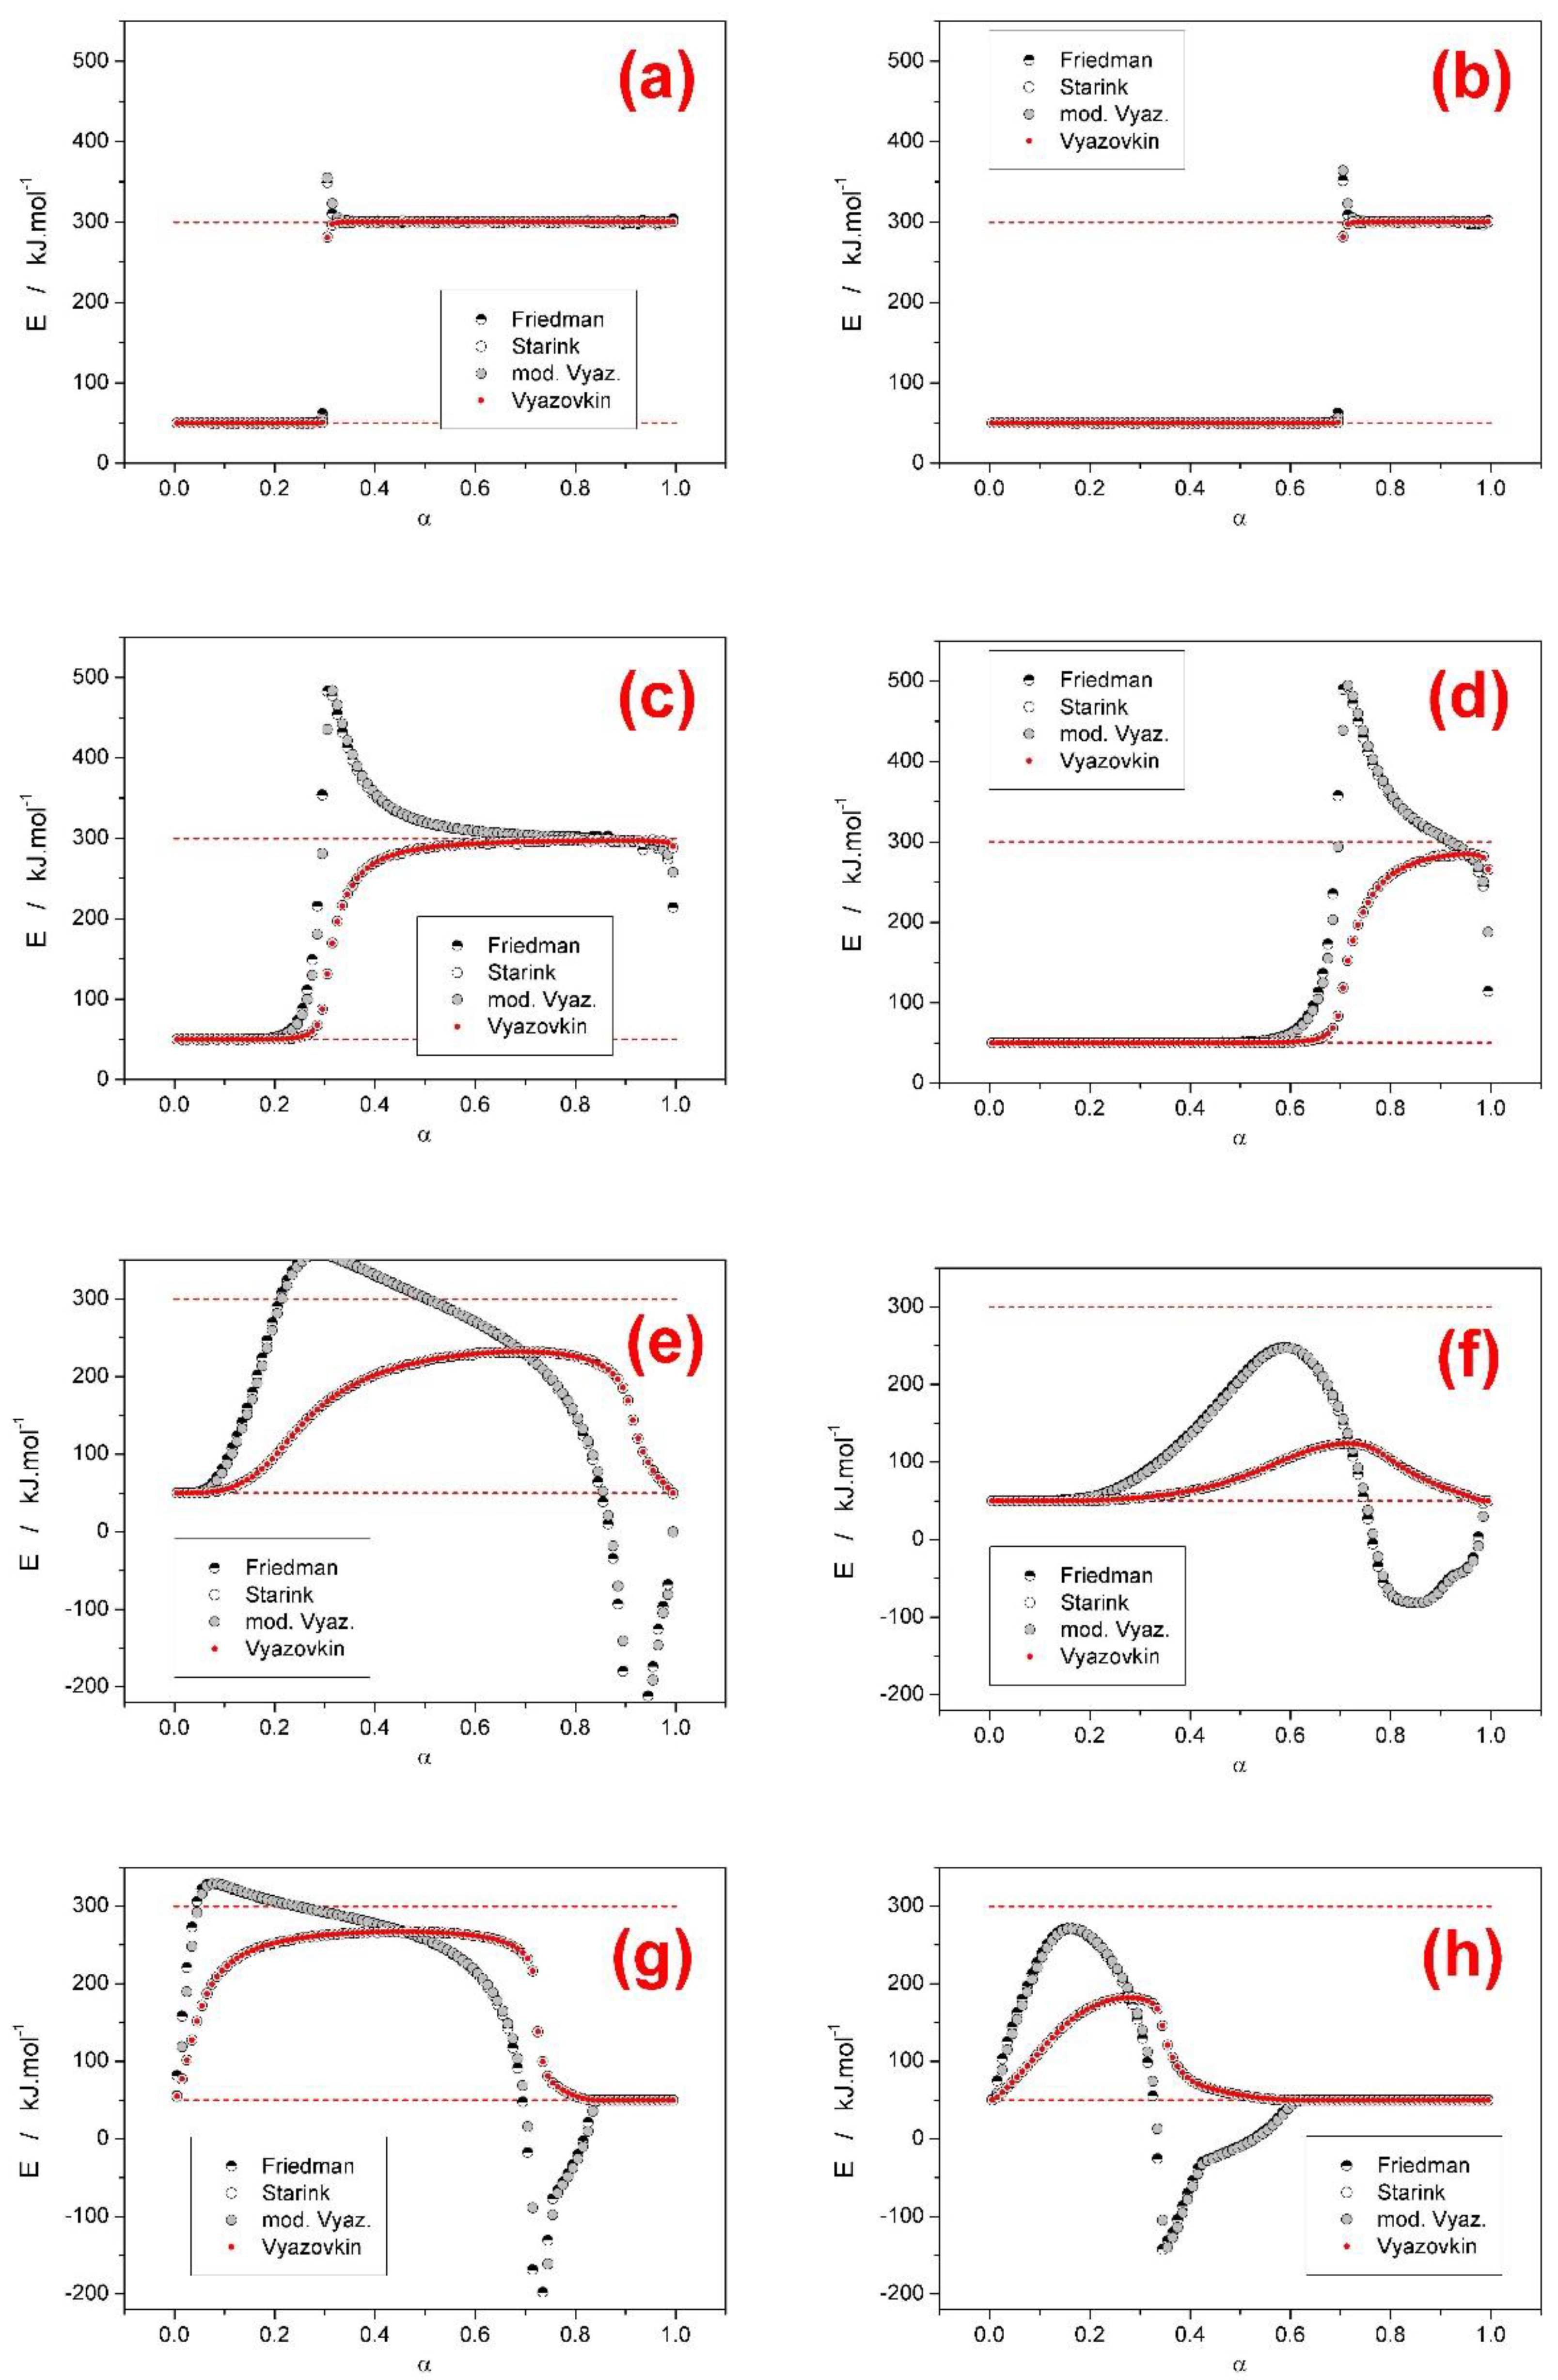
Figure 8.
Results of the Friedman, Starink, Vyazovkin, and modified incremental Vyazovkin analyses applied to the datasets E–H (group 2) and the I1 = 0.30, I2 = 0.70, and I1 = 0.70, I2 = 0.30 simulated at 10,000 points/curve density. The horizontal red dashed lines in each graph represent the true E1 and E2 values input into the simulations. (a) set E, I1 = 0.30, I2 = 0.70; (b) set E, I1 = 0.70, I2 = 0.30; (c) set F, I1 = 0.30, I2 = 0.70; (d) set F, I1 = 0.70, I2 = 0.30; (e) set G, I1 = 0.30, I2 = 0.70; (f) set G, I1 = 0.70, I2 = 0.30; (g) set H, I1 = 0.30, I2 = 0.70; (h) set H, I1 = 0.70, I2 = 0.30.

Table 1.
Kinetic parameters used to simulate the datasets within the first group of scenarios.
| Set | E1 | A1 | m1 | I1 | E2 | A2 | m2 | I2 |
|---|---|---|---|---|---|---|---|---|
| kJ·mol−1 | s−1 | - | - | kJ·mol−1 | s−1 | - | - | |
| A | 120 | 1015.2 | 2 | 0.66 | 60 | 106.08 | 1 | 0.33 |
| B | 120 | 1015.2 | 2 | 0.20 | 60 | 106.08 | 1 | 0.80 |
| C | 120 | 1015.2 | 2 | 0.50 | 110 | 1014.33 | 2 | 0.50 |
| D | 150 | 1015 | 2 | 0.30 | 150 | 1014 | 2 | 0.70 |
| E | 150 | 1015 | 2 | 0.30 | 150 | 1014.5 | 2 | 0.70 |
| F | 150 | 1015 | 2 | 0.30 | 150 | 1015.5 | 2 | 0.70 |
| G | 150 | 1015 | 2 | 0.30 | 150 | 1016 | 2 | 0.70 |
Table 2.
Kinetic curves included in datasets simulated within the second group of scenarios.
| Set | Included Heating Rates (in °C·min−1) |
|---|---|
| A | 0.5, 1, 2, 3 |
| B | 3, 4, 5, 6 |
| C | 8, 11, 13, 16 |
| D | 25, 50, 75, 100 |
| E | 150, 200, 300, 400 |
| F | 0.5, 1, 2, 3, 4, 5, 6, 8, 11, 13, 16, 25, 50, 75, 100, 150, 200, 300, 400 |
| G | 3, 4, 5, 6, 8, 11 |
| H | 13, 16, 25, 50, 75, 100 |
© 2019 by the authors. Licensee MDPI, Basel, Switzerland. This article is an open access article distributed under the terms and conditions of the Creative Commons Attribution (CC BY) license (http://creativecommons.org/licenses/by/4.0/).
Share and Cite
MDPI and ACS Style
Luciano, G.; Svoboda, R. Activation Energy Determination in Case of Independent Complex Kinetic Processes. Processes 2019, 7, 738. https://doi.org/10.3390/pr7100738
AMA Style
Luciano G, Svoboda R. Activation Energy Determination in Case of Independent Complex Kinetic Processes. Processes. 2019; 7(10):738. https://doi.org/10.3390/pr7100738
Chicago/Turabian StyleLuciano, Giorgio, and Roman Svoboda. 2019. "Activation Energy Determination in Case of Independent Complex Kinetic Processes" Processes 7, no. 10: 738. https://doi.org/10.3390/pr7100738
Note that from the first issue of 2016, this journal uses article numbers instead of page numbers. See further details here.