The Seepage Control of the Tunnel Excavated in High-Pressure Water Condition Using Multiple Times Grouting Method
by
 , ,
, ,
Bin Gong
1,2,3 ,
,
Yujing Jiang
1,2,3 ,
,
Keisuke Okatsu
3,
Xuezhen Wu
4,*,
Jin Teduka
5 and
Koichi Aoki
5 1
State Key Laboratory of Mining Disaster Prevention and Control, Shandong University of Science and Technology, Qingdao 266590, China
2
Department of Mining Engineering, College of Mining and Safety Engineering, Shandong University of Science and Technology, Qingdao 266590, China
3
Department of Geotechinical Engineering, Graduate School of Engineering, Nagasaki University, Nagasaki 852-8521, Japan
4
Department of Underground Engineering, College of Civil Engineering, Fuzhou University, Fuzhou 350108, China
5
Kumagai Gumi Company Limited, Tokyo 162-0821, Japan
*
Author to whom correspondence should be addressed.
Processes 2018, 6(9), 159; https://doi.org/10.3390/pr6090159
Submission received: 20 August 2018
/
Revised: 31 August 2018
/
Accepted: 2 September 2018
/
Published: 5 September 2018
Abstract
:Groundwater can cause many hazardous problems when a tunnel is excavating. Seepage force acting on the support structure and the tunnel surface cannot be negligible. Under high groundwater table condition, the seepage situation becomes more complex and it is more difficult to control the leakage of groundwater to flow into a tunnel. In the paper, a multiple times grouting method is proposed, and the mechanical deformation behavior of surrounding rock is analyzed using the FLAC3D (Fast Lagrangian Analysis of Continua in 3 Dimensions) software according to the high groundwater table condition of the Hokusatsu tunnel. The results present that multiple times grouting can control leakage and the rock deformation well, compared with one-time grouting condition in rock breaking and high water pressure area. The seepage force decrease around the tunnel and the displacement is controlled effectively. The pore pressure reduces inside the grouting zone using a new kind of grouting material, which is high permeability ultramicro particle cement (average particle size 1.5 μm). In the test fieldwork, the grouting scheme reduces the maximum discharge from 300 t/h to 40 t/h, and there is not obvious deformation and abnormal stress in the tunnel. The multiple times grouting method proposed in this research is verified effectively and can supply a positive experience to on-site construction.
1. Introduction
There are many factors that will influence the tunneling process, in which the existence of groundwater is the most important factor. The stress distribution around the tunnel will be changed greatly when tunneling under high groundwater table. The pore pressure will be redistributed and groundwater will inflow into tunnels through some fractures and faults. Groundwater inflow inevitably induces additional stress on the tunnel surface, tunnel face, and support structure [1,2,3,4]. It will cause bad geohazards if the water flow or the water pressure is too large. It seriously threatens the safety of workers and slows down the excavation speed. Nowadays, more and more road tunnels under high groundwater table condition are constructed in mountainous areas all over the world. Therefore, groundwater inflow and leakage problems are the most important problems that should be solved in tunneling [5]. The high groundwater pressure will not only accelerate the rock damage but also cause significant damage to the tunnel support structure [6,7]. If the flow of water into the tunnel can be controlled, the working environment and related safety problems will be improved greatly.
On the one hand, an uncontrolled drop in the pore pressure will trigger the closure of pores and fractures near the tunnel and cause damage to the buildings and infrastructure as a result of ground settlements. In order to prevent this, the groundwater with high pressure and inflow velocity should not be allowed to drain into the interior of the tunnel. Preventing the water gushing, which is induced by groundwater drainage through the tunnels, can be achieved by applying cement materials injection. Grouted bolts are widely used to protect the tunnel section against excessive deformation when a tunnel beneath high groundwater table is excavated. The grouted bolts not only reinforce the fragmented rock but also inject cement materials to reduce the groundwater flow. The deformation of the tunnel can be controlled significantly because of the grouted zone generation. Furthermore, the seepage force will be acted on the rock-grouting interface around the tunnel because the permeability of the grouted zone is reduced by cement grout injection in rock pores. On the other hand, the excessive interception of large groundwater inflows from saturated ground rock can induce some disastrous accidents in tunneling [8,9].
The seepage force will induce the additional displacement in the radial direction of the tunnel during tunnel excavation and it should be considered as an additional body force acting on tunnel face and support structure along the groundwater flow direction. Furthermore, the interaction between tunnel supports and groundwater can affect the overall stability of the tunnel. Although the seepage force can be calculated based on the depth of the water table from groundwater level to the tunnel, the effect of groundwater on tunnel supports should be carefully considered in the design and construction stages [10].
Analytical and numerical solutions of the hydraulic-mechanical coupling system in tunnel projects are widely researched [11,12,13,14,15,16,17,18,19,20,21,22,23,24]. Mohamed El Tani [25], and Kolymbas and Wagner [26], derived the analytical solution of the groundwater inflow based on Fourier series and Mobius transformation. The solution can be used to predict groundwater inflow for deep and shallow tunnels. Lee [27] researched the effect of seepage forces on tunnel face stability and proposed that effective stress and seepage force are the two main factors. The minimum support stress can be designed based on the sum of the effective support stress. The average seepage force is a positive correlation with hydrostatic pressure acting on the tunnel face. Based on the conformal mapping of the complex method, Ming [28] derived an analytical solution for a two-dimensional and horizontal tunnel under homogeneous, isotropic, and fully saturated geological surroundings. Carranza-Torres [29] considered the long-term mechanical effect of changes in pore pressure due to drainage of the ground around the tunnel. Fahimifar and Zareifard [30] presented an analytical solution of tunnels below groundwater level in plane strain axisymmetric condition based on the strain-softening behavior model and Hoek-Brown empirical strength criterion. It shows that the stability of tunnels depends on the seepage force and the pore water pressure around tunnels.
The seepage force and the pore pressure around tunnels can influence the stability of tunnel linings significantly. Arjnoi et al. [31] studied the effect of different drainage conditions on pore water pressure distribution and lining stresses of drained tunnels. The effect of pore water pressure distributions on lining stress can be negligible. Shin [32] investigated the interaction between tunnel supports and ground convergence considering seepage forces. Theoretical analysis is performed on the ground reaction curve reinforced by bolts and grouting under steady-state condition. It shows that the ground reaction curve is deformed greater in radial direction under groundwater pressure condition than that of dry condition at the same internal pressure level. Nam [33] proposed the relative permeability factor to evaluate the pore water pressure increment in the support layers of the tunnel below the water table and investigated the linear stresses distribution with consideration of seepage force in deep tunnels. The pore water pressure behind the support layers will increase when the permeability factor decreases.
Most of the previous research focuses on the hydraulic-mechanical coupling interaction between support layers and ground near to the tunnel surface. In some cases, the grouting area may not be near to the tunnel surface. The forces acting on the support of tunnels with porewater pressure consideration will be different with tunnels around where the grouting area is in the shallow rock mass.
In the present study, first, the numerical model of Hokusatsu tunnel is generated according to the construction process. Then, two different cases are set; one-time grouting case and multiple times grouting case. The deformation behavior of surrounding rock and support structures are compared in the two different cases. Finally, the multiple times grouting method and new grouting material are tested in on-site construction. The multiple times grouting method is verified validly. The leakage problem is controlled effectively, and the deformation is decreased obviously.
2. Materials and Methods
2.1. Description of the Hokusatsu Tunnel
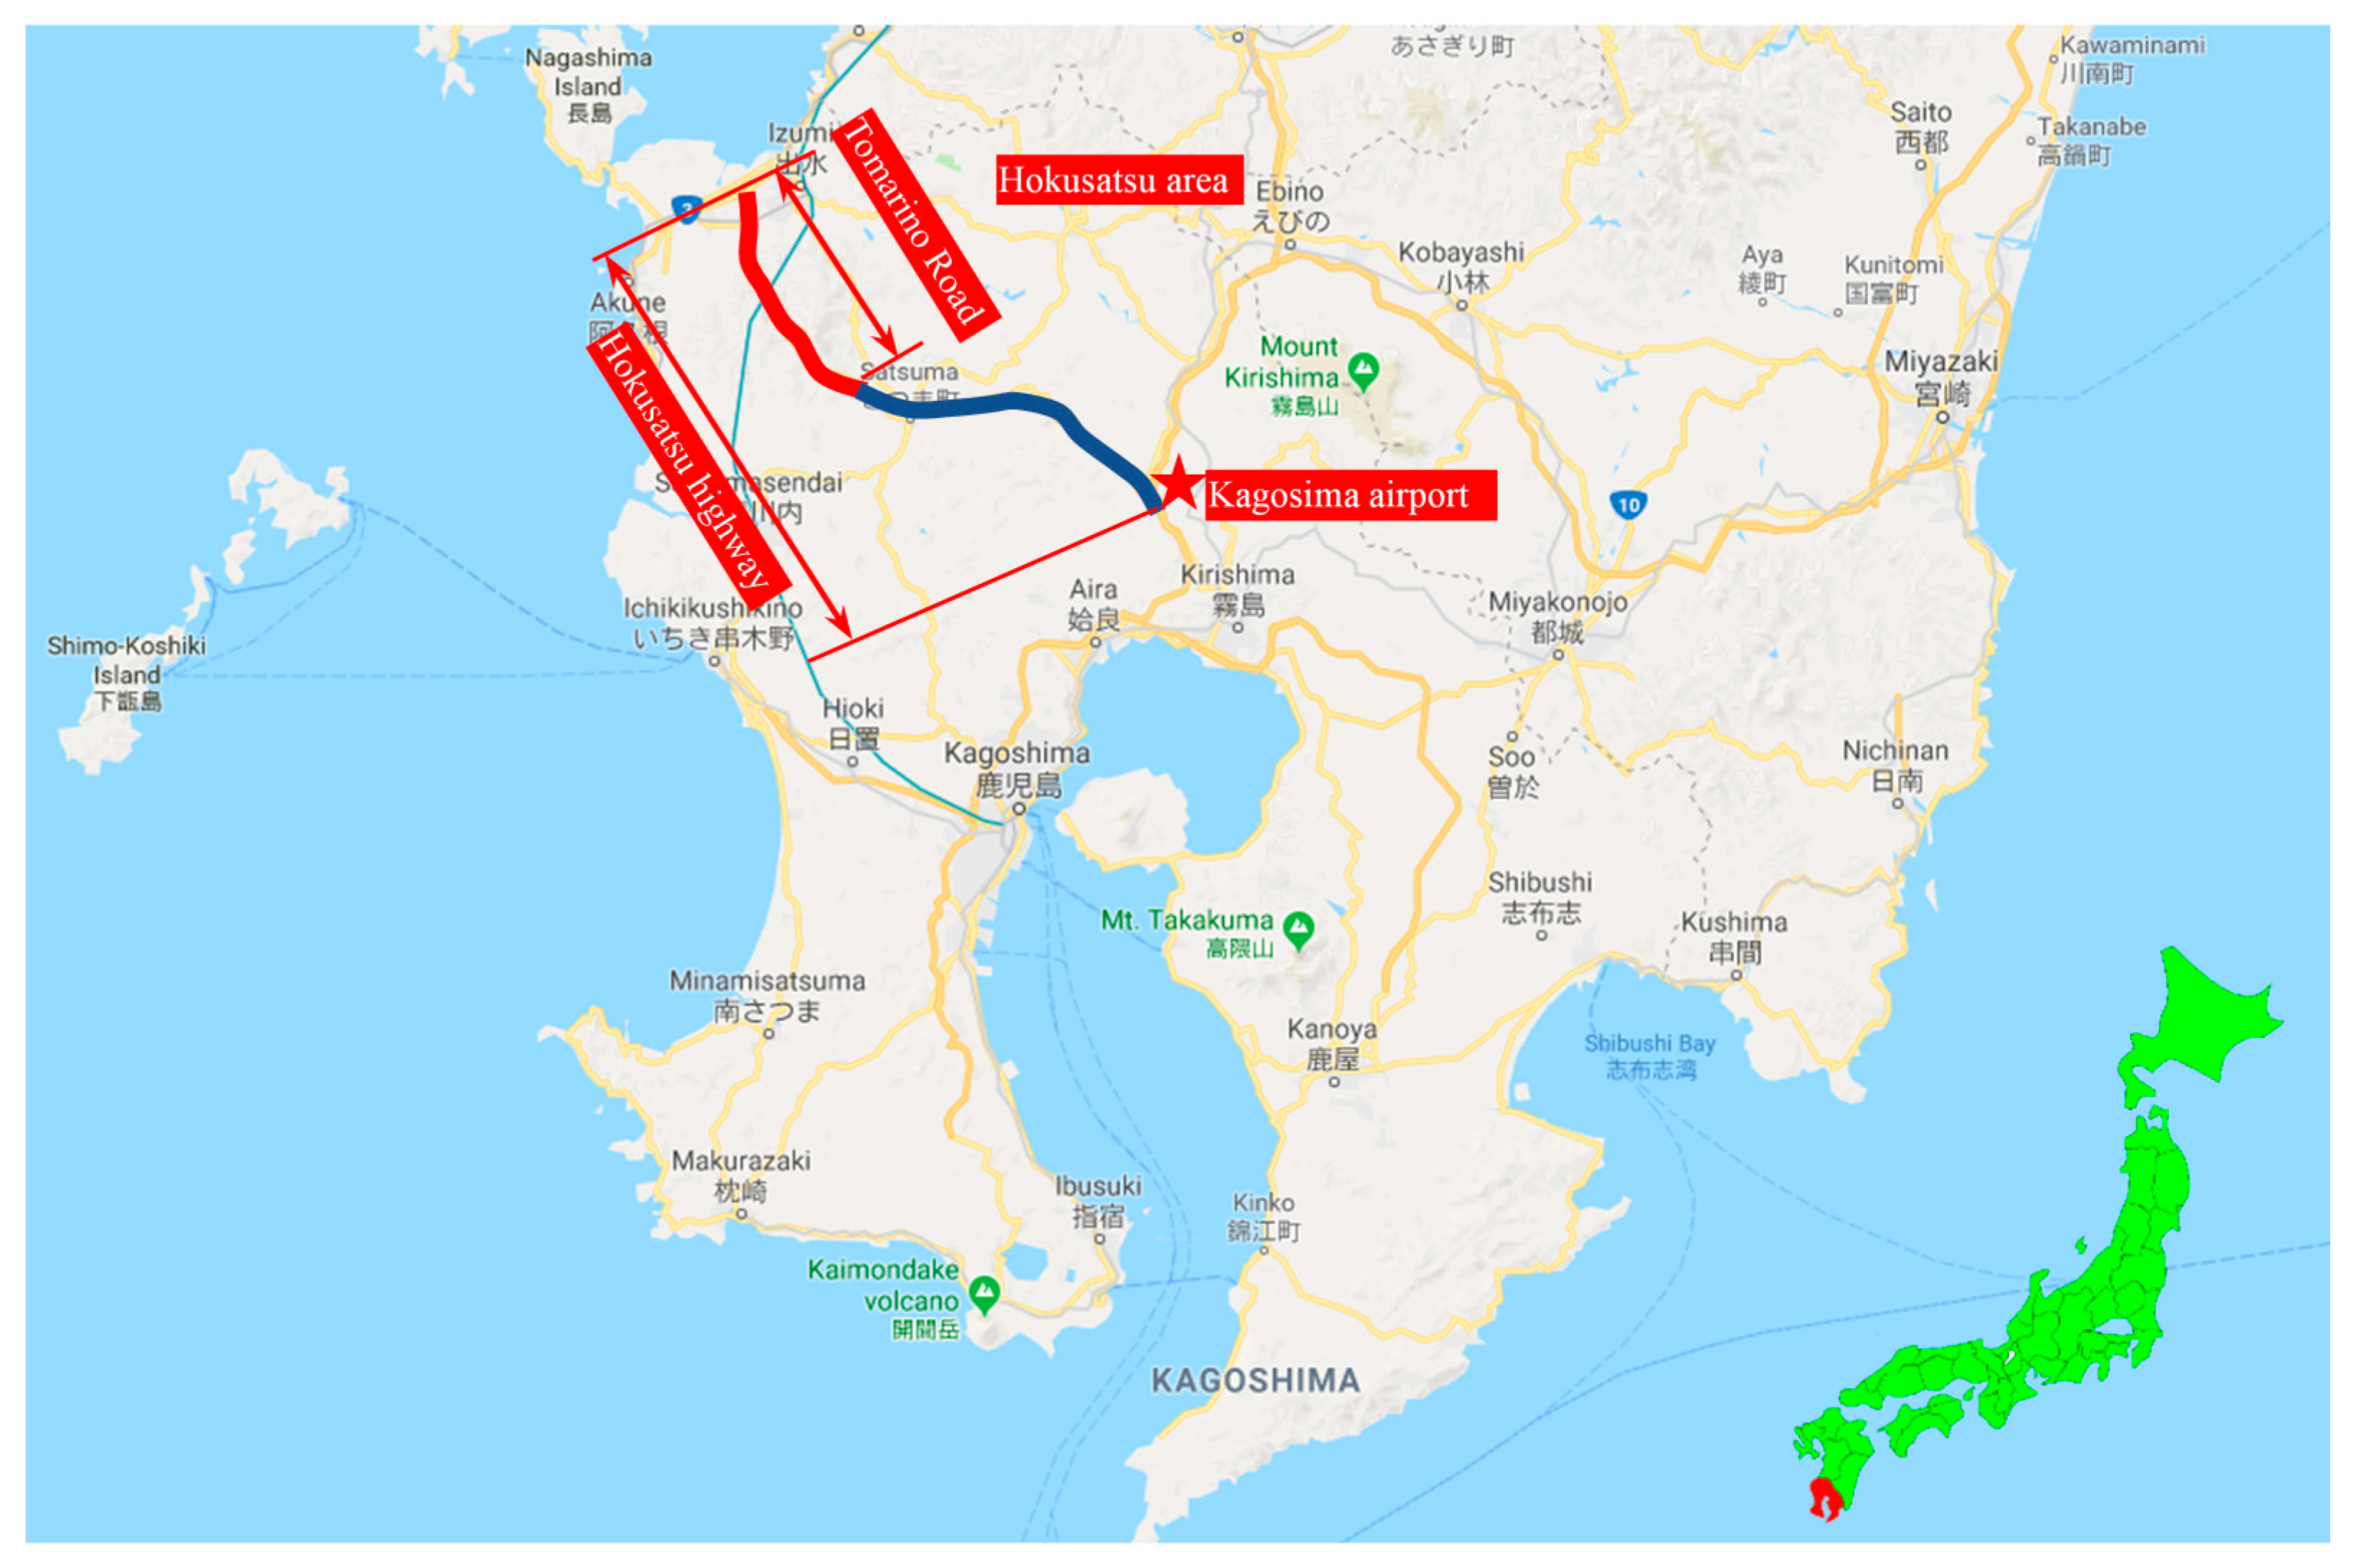
There are a lot of mountains in Japan. It will increase construction costs to bypass mountains when new expressways or railways are built. Therefore, many tunnels need be excavated for expressways or railway lines. Most of the tunnels are under groundwater condition, especially in the south of Japan. The Hokusatsu highway is located in Kagoshima Province, which is the southern province of Japan. The highway connects the Hokusatsu area with the center of Kagoshima. The total length of the highway is 70 km, more than 10 km of which are tunnels. It plays an important role in making a link between Kagoshima airport and the Hokusatsu area. Figure 1 shows the location of the Hokusatsu highway in Japan.
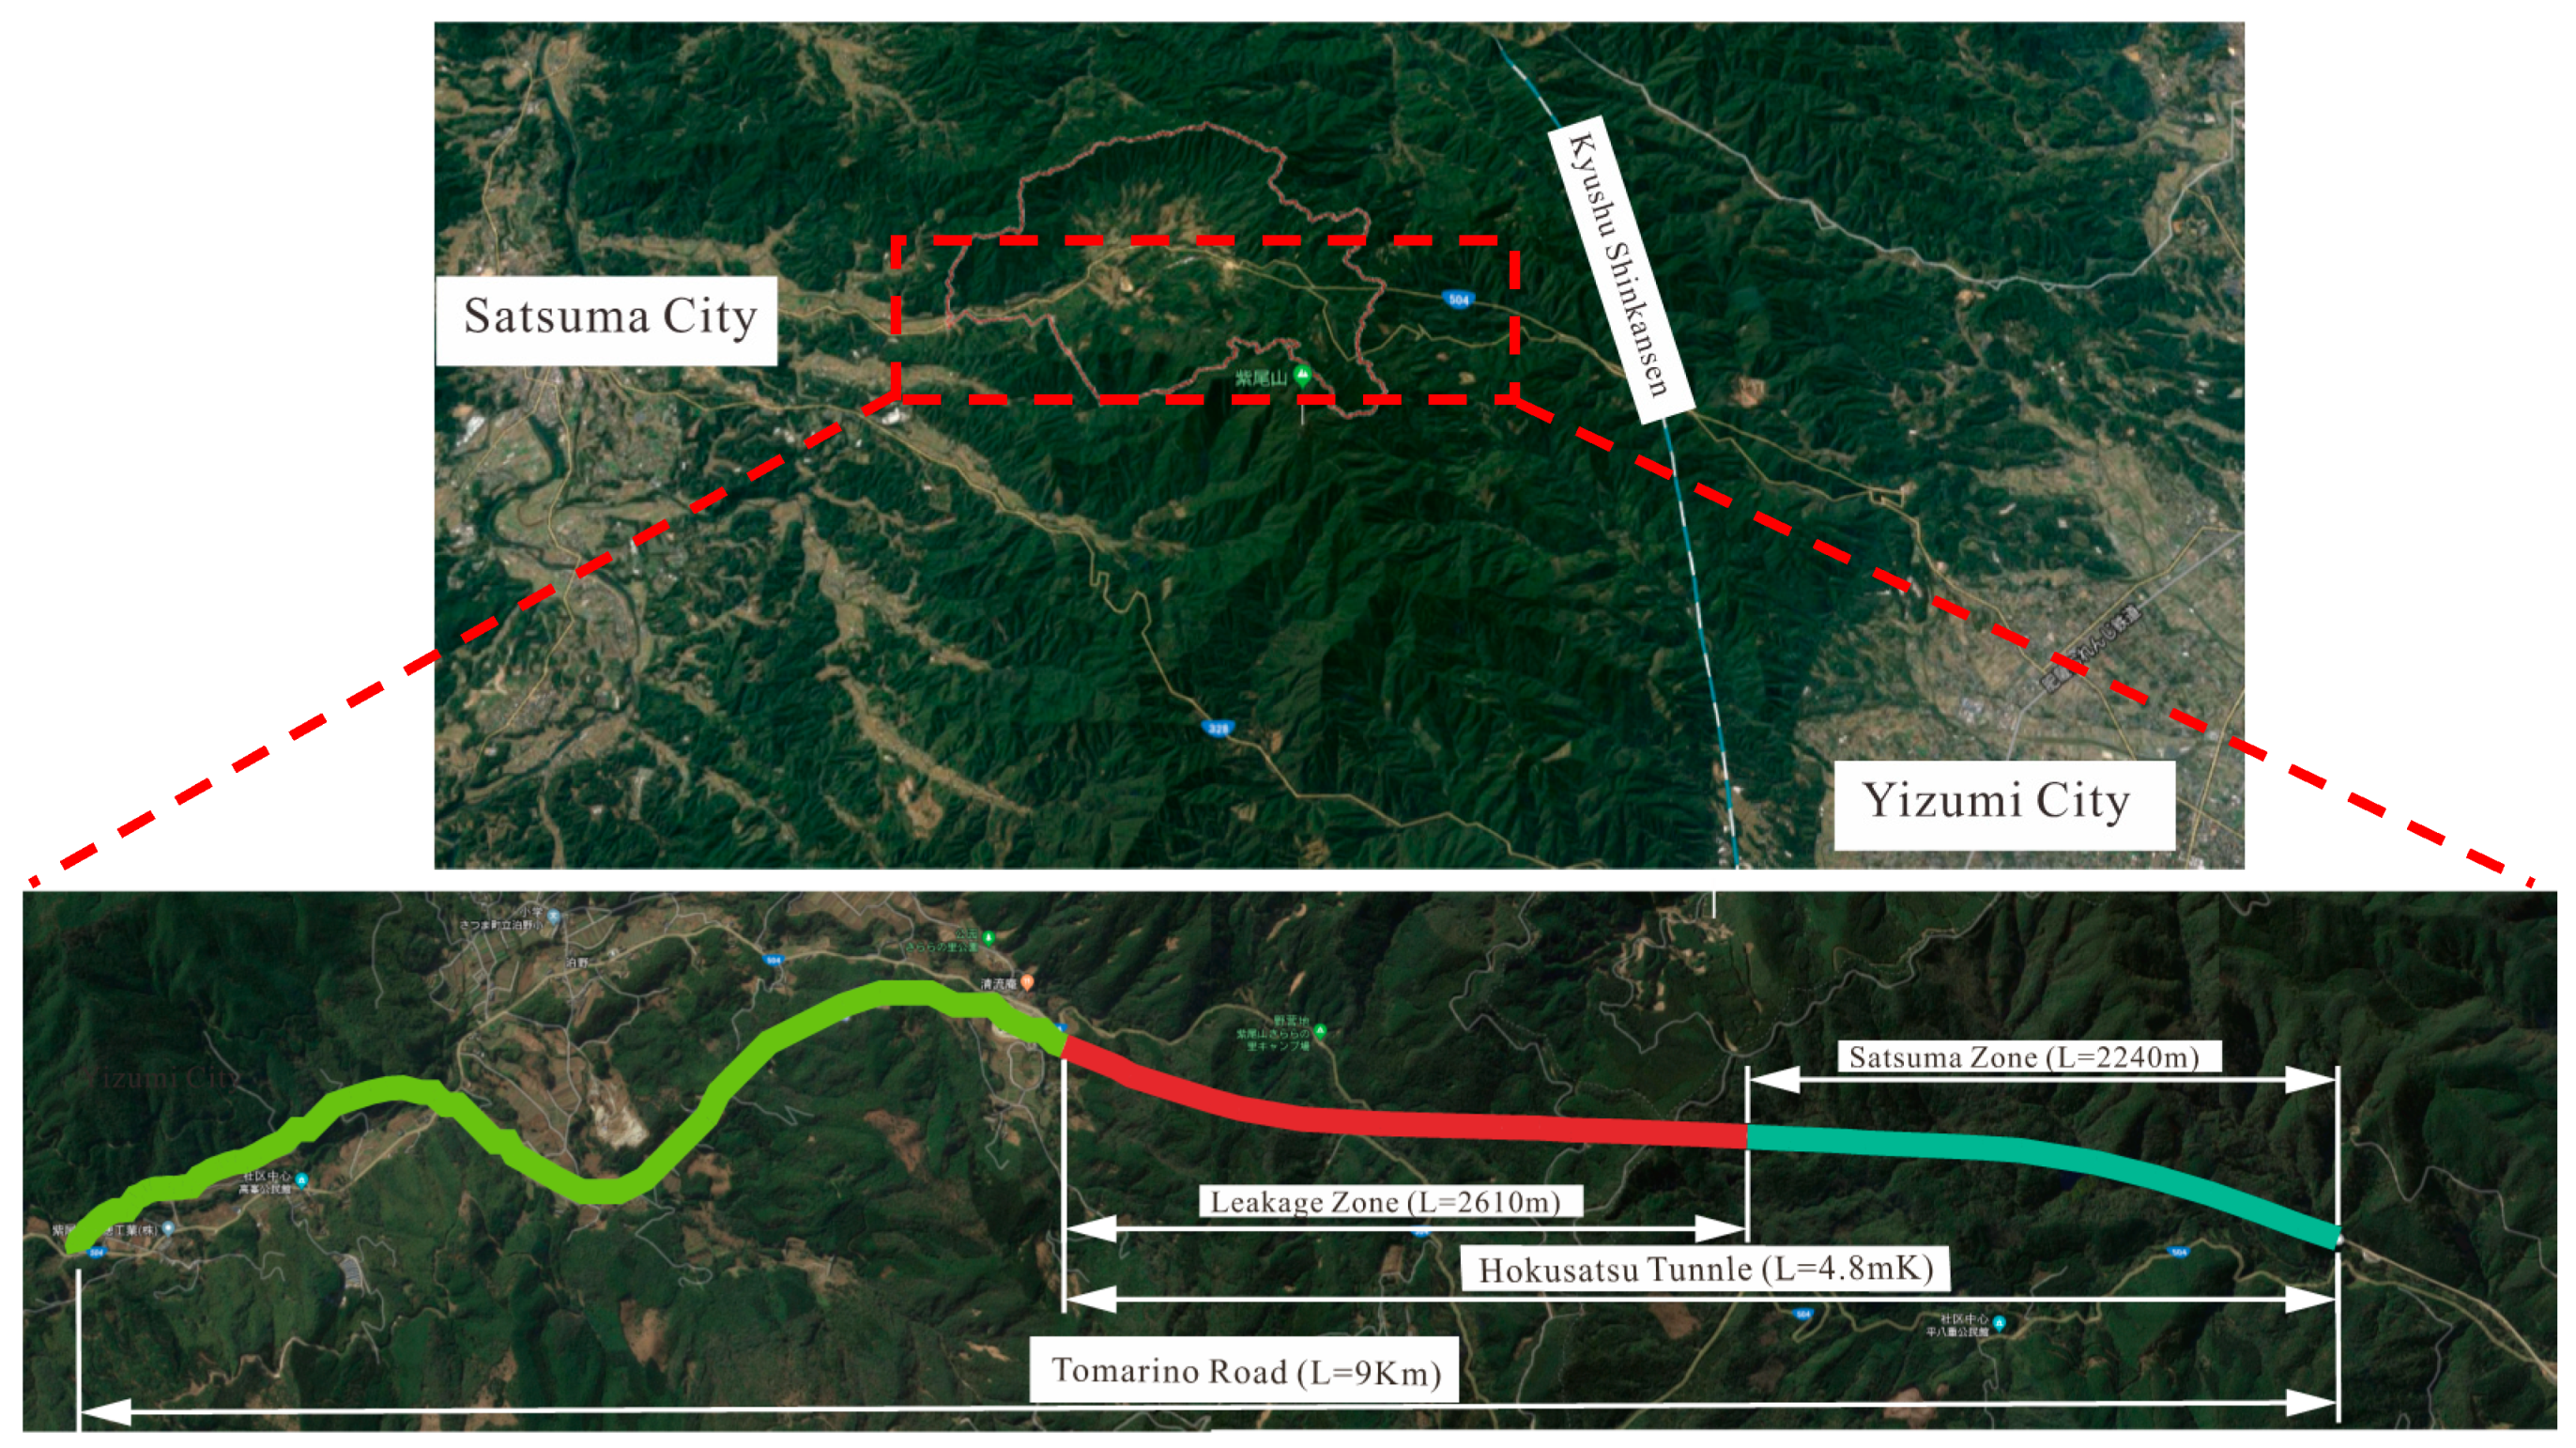
Tomarino Road plays an important role in bringing a prosperous solution to the traffic of Satuma city to Yizumi city. As shown in Figure 2, the length of the road is around 9 km and the length of the Hokusatsu tunnel is 4.8 km. The leakage zone is 2610 m in length, about 54% of the whole tunnel.
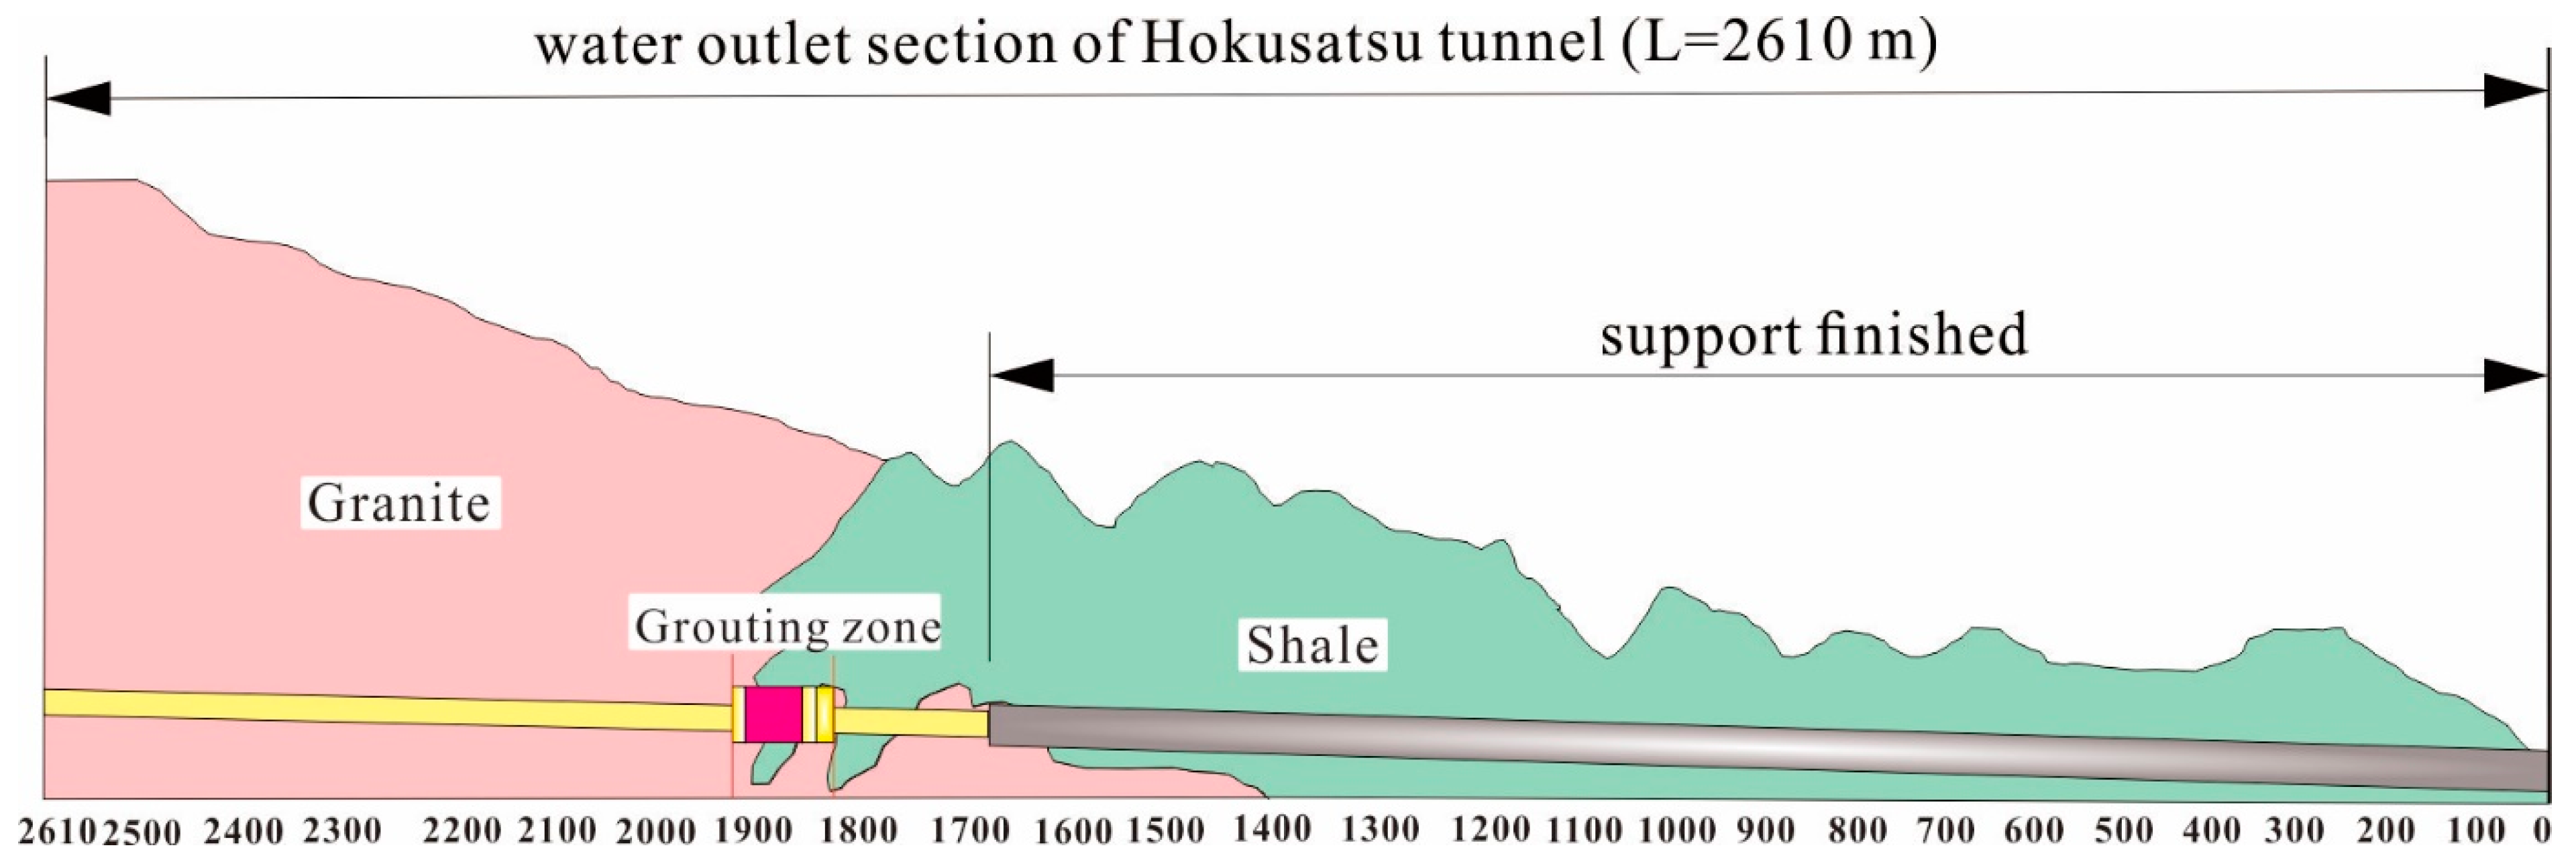
Waterflows into tunnels can cause a lot of problems, not only under construction but also in the long-term operation. The Hokusatsu tunnel of the Tomarino Road is located in mountainous areas in Kagoshima Province. According to the geological condition, the left part is granite and the right part is shale, as shown in Figure 3. The overlying bedrock is in the joint part and the thickness is approximately 200 m. When tunnel excavation approaches the joint of two rocks, the invasion of groundwater causes serious unstable problems in the tunnel.
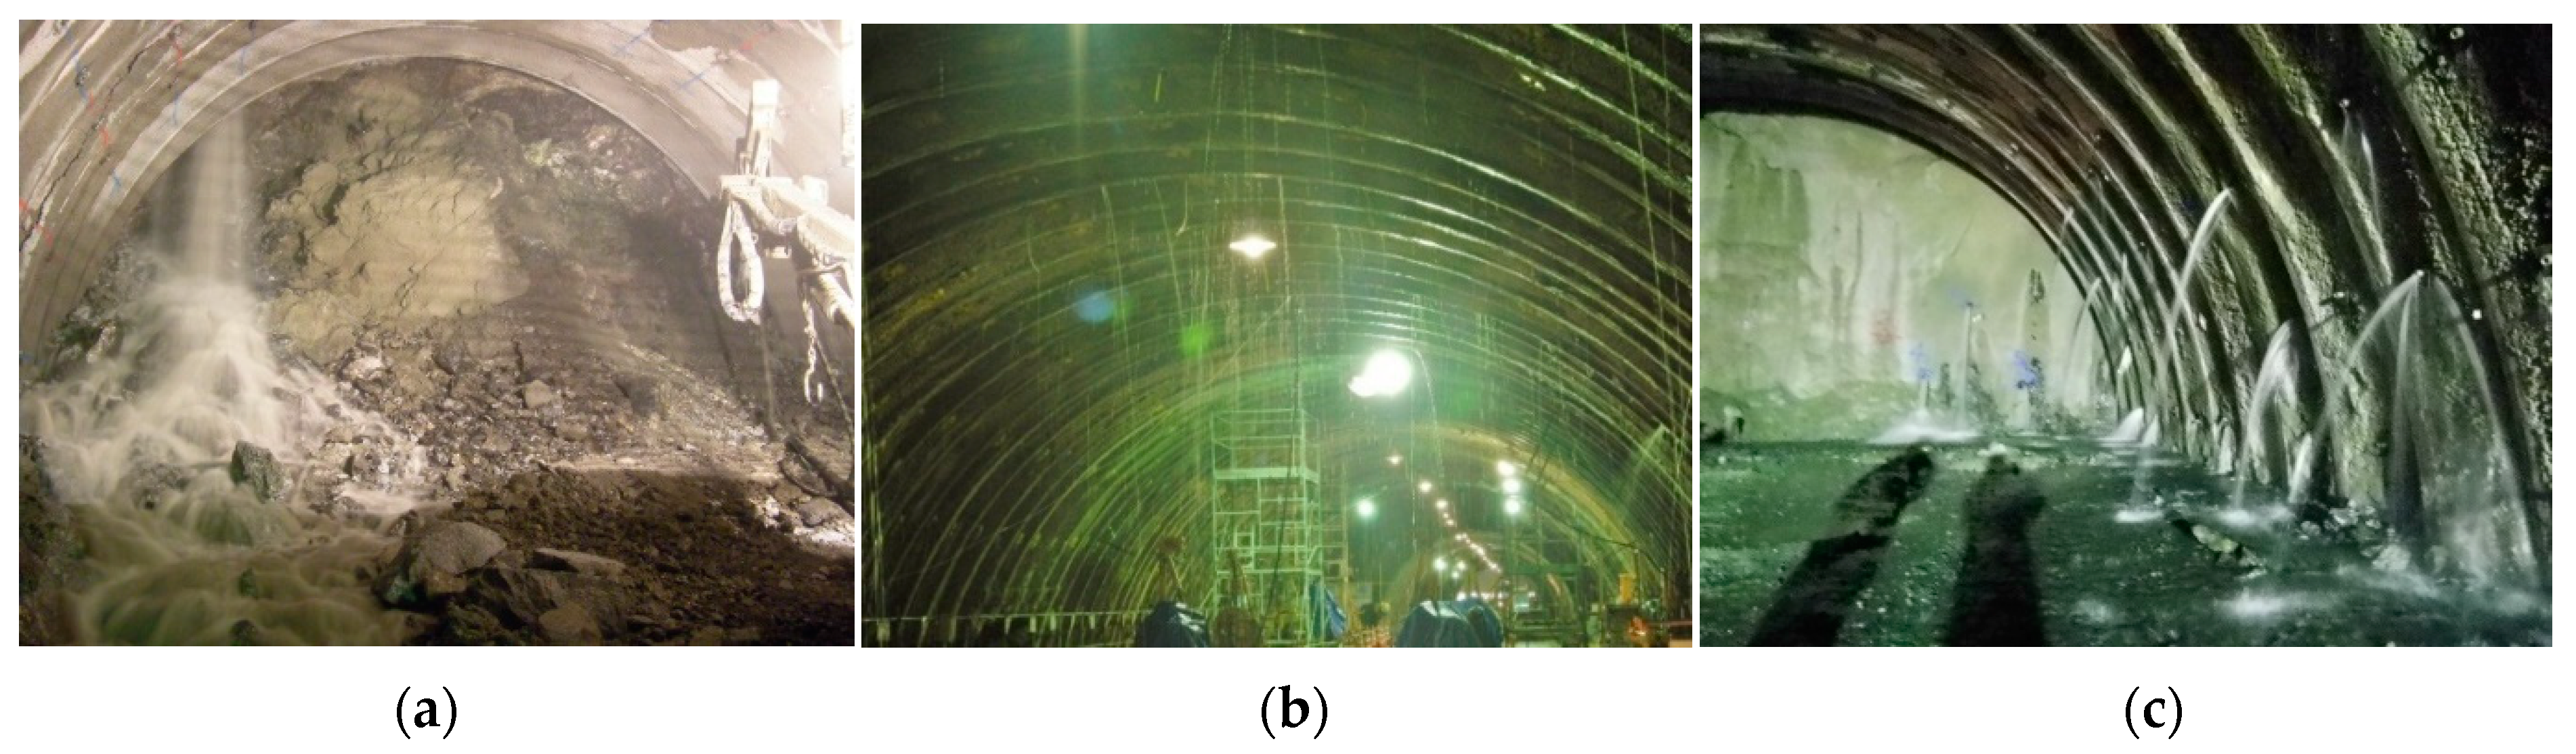
After a thorough investigation project and field observations, it was found that there were three types of water inflows in Hokusatsu tunnel:
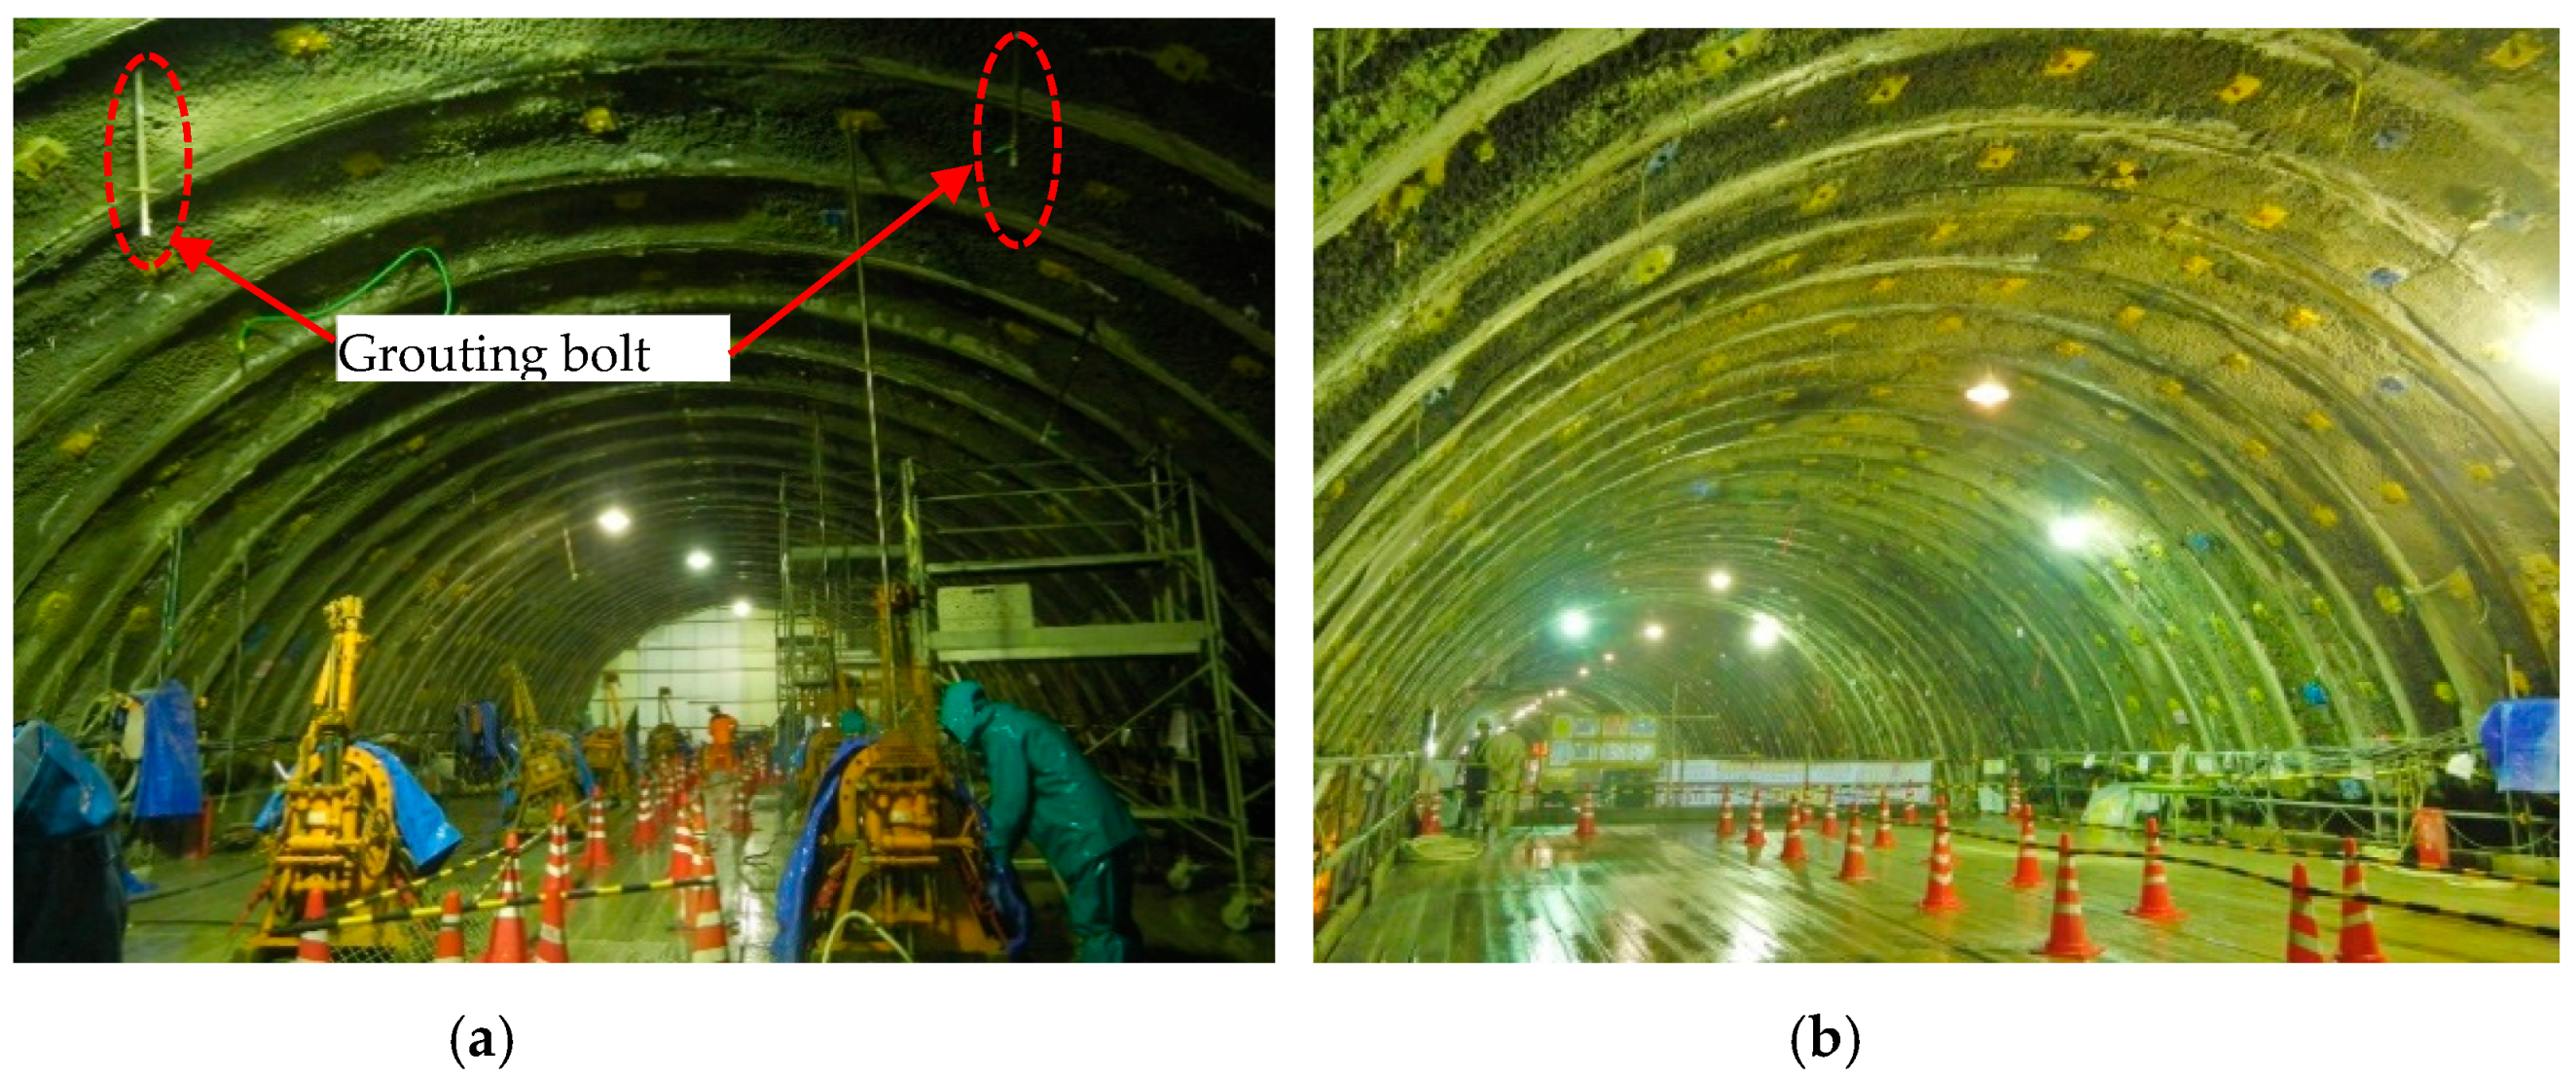
(1) Groundwater inrush: This type of water inflow would cause a rock collapse in the tunnel face. This kind of collapse is a big problem for tunnel construction, but it does not happen very often. It occurs only when abnormal geological structures, like aquifer faults, are exposed on the tunnel face. This type of incident happened in the Hokusatsu tunnel where the joint of different rocks led to a big hole in the roof, close to the tunnel face, as Figure 4a shows.
(2) Groundwater inflow and water drops occurred at the roof of the tunnel. Figure 4b shows the potential permeable place and the water leakage.
(3) Groundwater inflow occurred in the position of ‘I’ steel sets, which were the major support elements of the tunnel. Because the groundwater was not well drained by the drainage pipes, the high water pressure resulted in seepage problem along ‘I’ steel, as Figure 4c shows.
In response, construction units carried out the improved waterproof treatment between 1800 m to 1900 m away from the origin. This section has already been excavated and is 100 m long.
At first, Foam consolidation material (Minova agency, Dortmund, Germany, CarboPur WF) was used. The chemical injection is in the zones that are 3.6 m distance from tunnel support. Groundwater inrush was prevented. However, invert has a large displacement in the vertical direction. The groundwater inrush has been held back, however, as groundwater level was rising, the pore pressure has been increased, and some small groundwater inflow occurred. The groundwater should be prevented and the displacement of the support and the rock around the tunnel should be controlled as well as possible. Therefore, the grouting method should be redesigned before it is used in the field application.
2.2. Numerical Simulation of Groundwater Control in the Hokusatsu Tunnel
In the following sections, the Hokusatsu tunnel is numerically modeled to investigate its ground deformation behavior under high groundwater level using finite-difference software FLAC3D, Version 5.01 (Fast Lagrangian Analysis of Continua in 3 Dimensions) [34] in two kinds of grouting conditions.
2.2.1. Numerical Model and Boundary Conditions
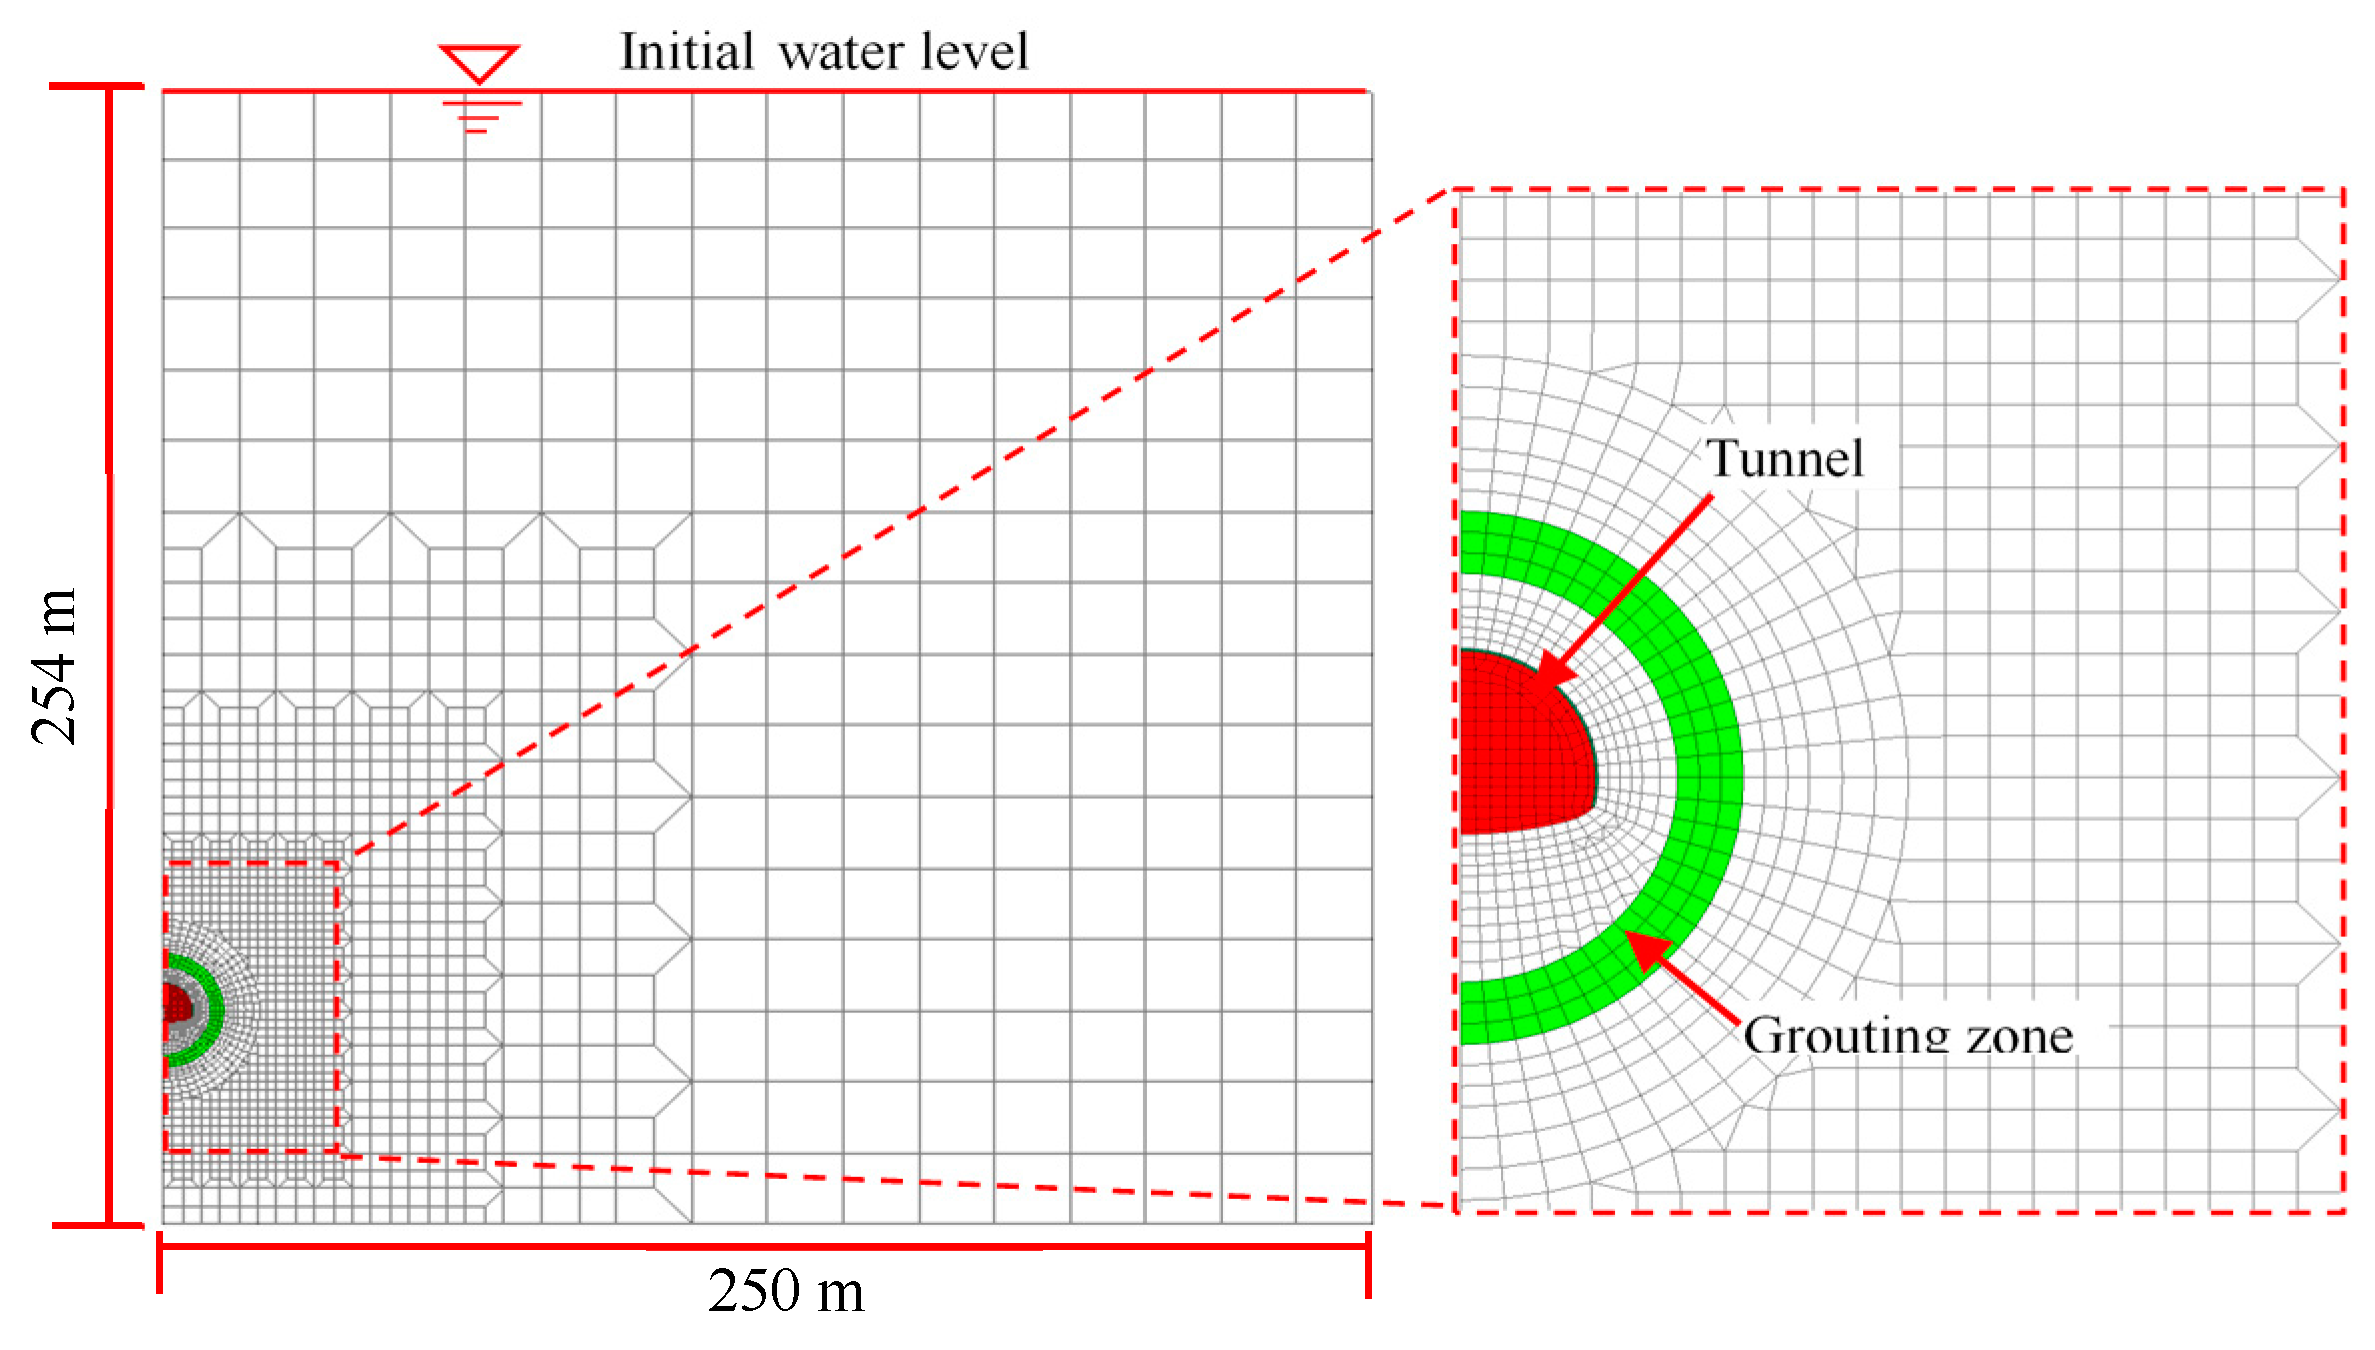
The sketch of the model and tunnel profile is shown in Figure 5. Due to the assumption of vertical symmetry in the problem, only half of the problem was modeled.
The model boundary was 254 m by 250 m, the tunnel had a buried depth of 200 m. For the mechanical boundary conditions, the horizontal displacement at the left and far-field boundaries and the vertical displacement at the bottom boundary were fixed. For the hydraulic boundary conditions, the pore pressure was free to change at the left, far-field, and bottom boundaries but set to zero at the top of the model (initial groundwater level) and the pore pressure was fixed at the far-field.
2.2.2. Rock Parameters and Reinforced Concrete Lining Properties
2.2.3. Numerical Simulation Cases and Procedure
The tunnel had not been excavated, and the state of initial equilibrium and the initial in-situ stresses were generated in the model based on the gravitational loading. (Side stress coefficient: K = 1.1)
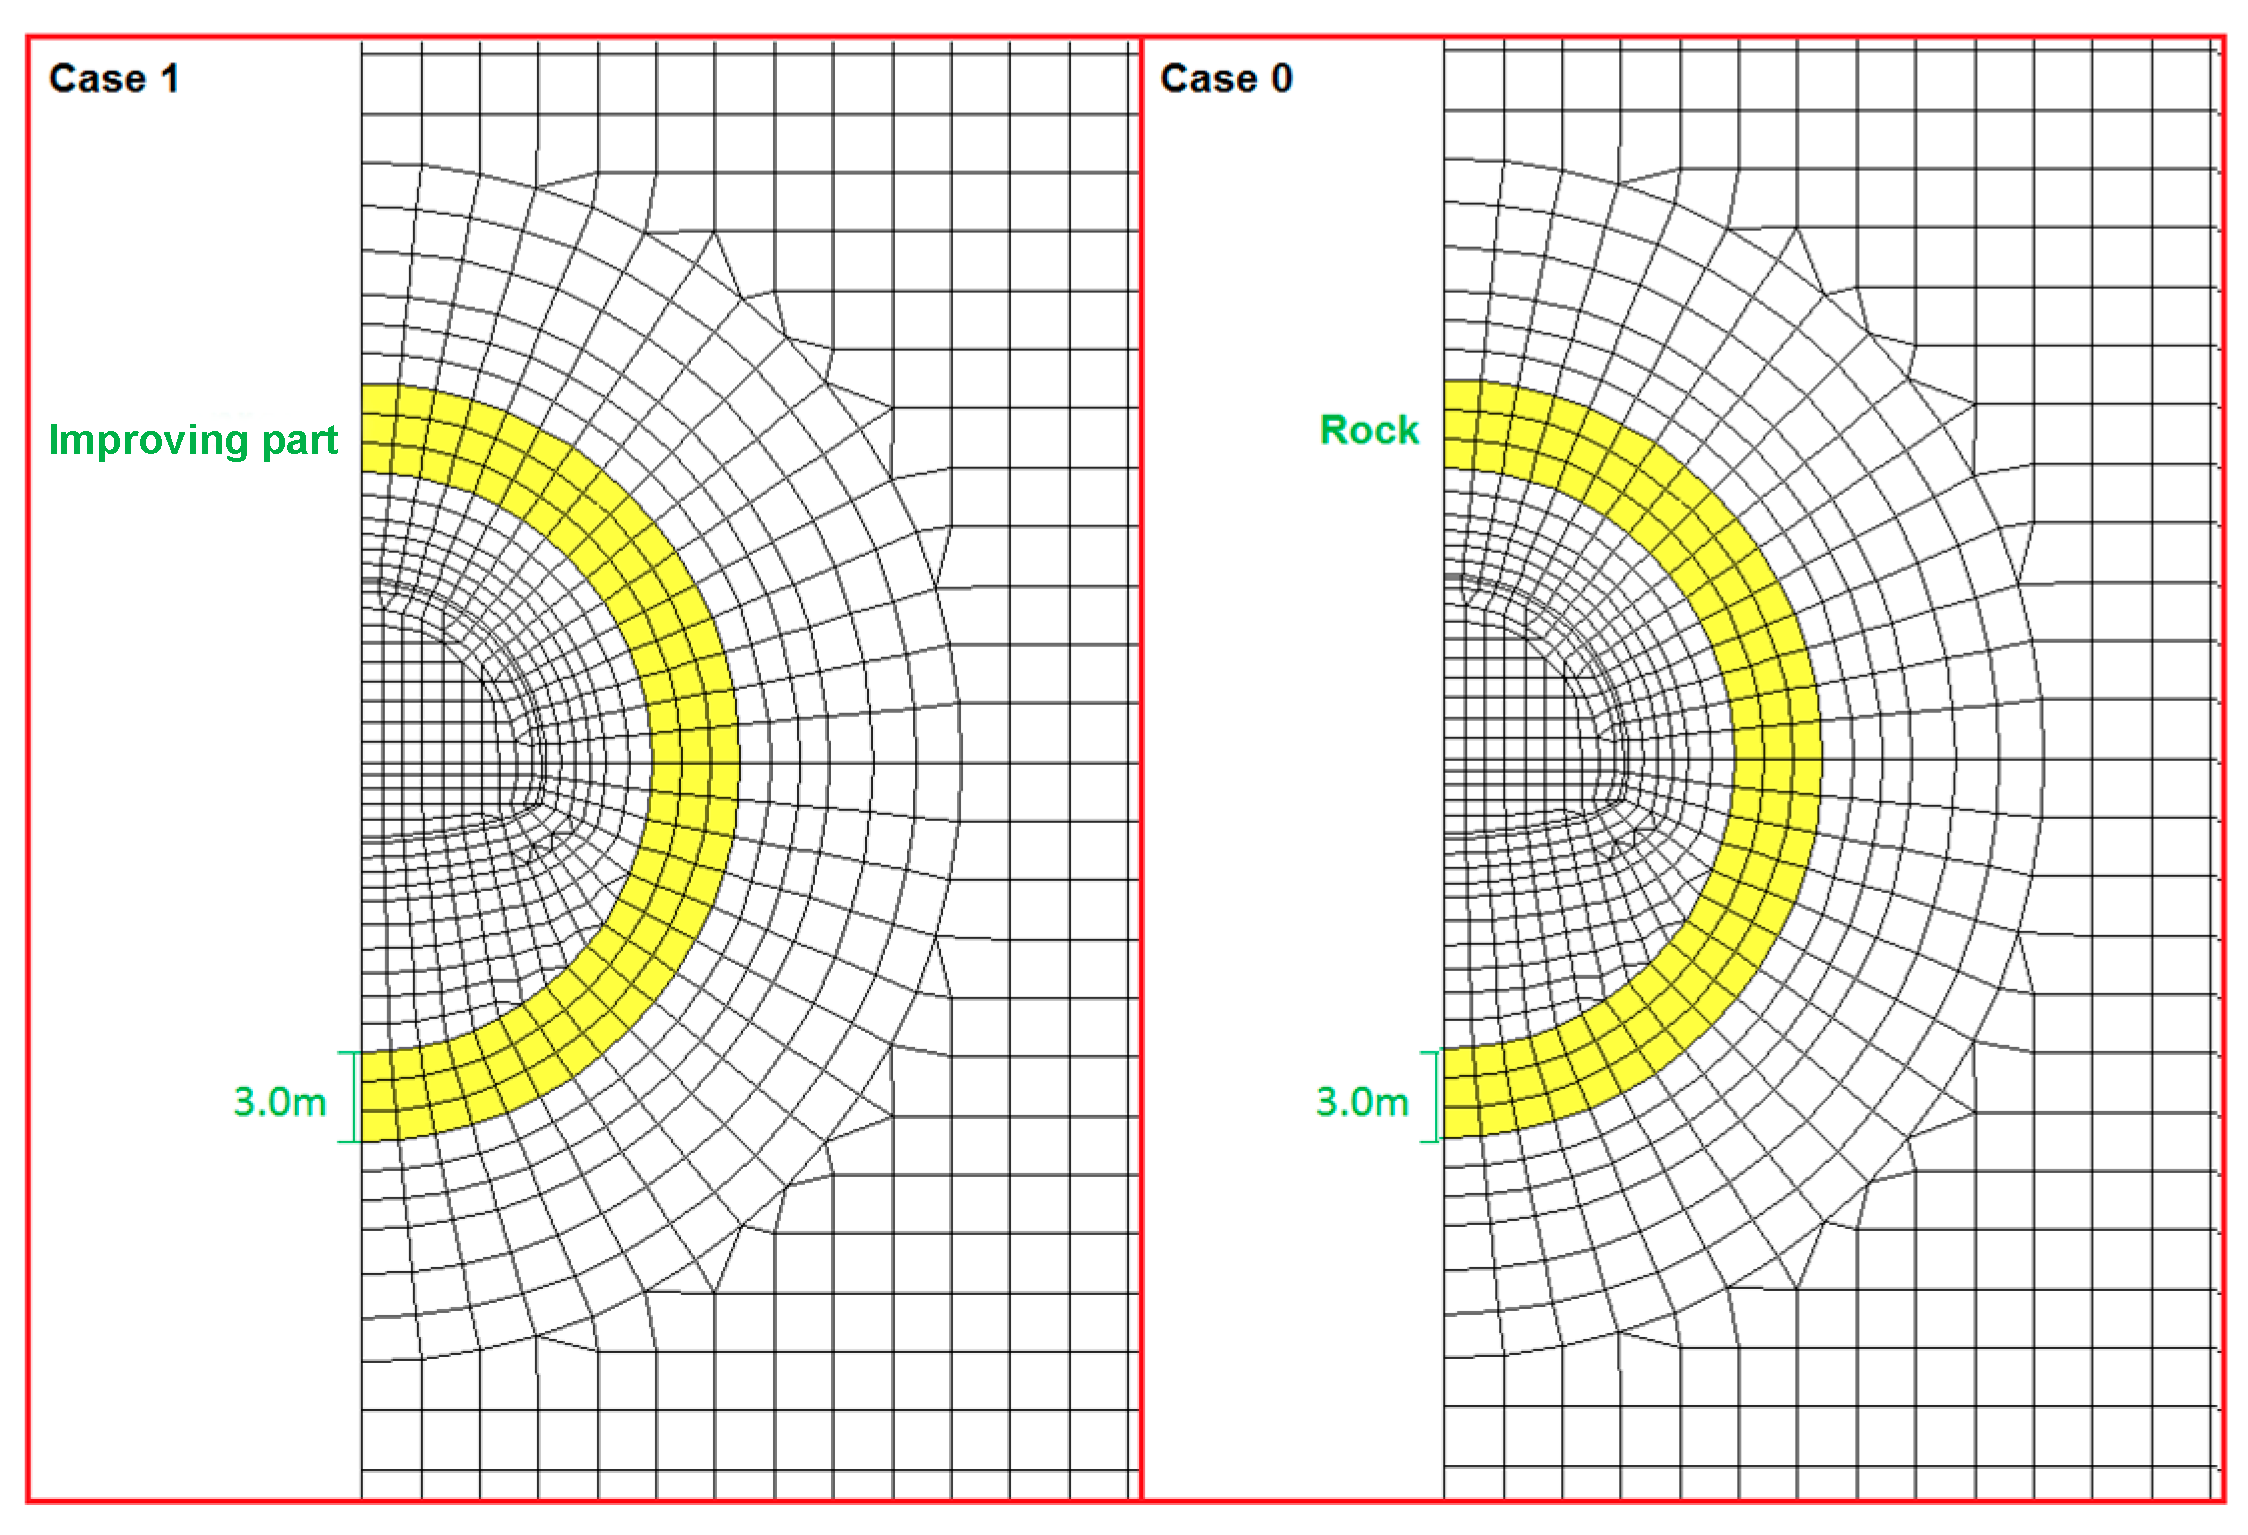
As shown in Figure 6, numerical analyses were performed in two cases. Two cases were divided by the permeability of the improved part. All the mechanical parameters are the same except the permeability.
Case 1: the permeability of improving part is 4 × 10⁻⁶, it is smaller than surrounding rocks.
Case 0: the permeability of improving part is 4 × 10⁻⁴, it is equal to surrounding rocks.
The simulation procedure is shown as Table 3.
For the permeable shotcrete layer, the steady-state flow was established from the exterior boundary, where the pore pressures were equal to the far-field values, to the tunnel, where the pore pressures were zero. For the impermeable reinforced concrete lining, the pore pressures were equal to the ambient pore pressures everywhere in the ground.
3. Results and Discussion
3.1. The Failure Behavior Surrounding the Tunnel
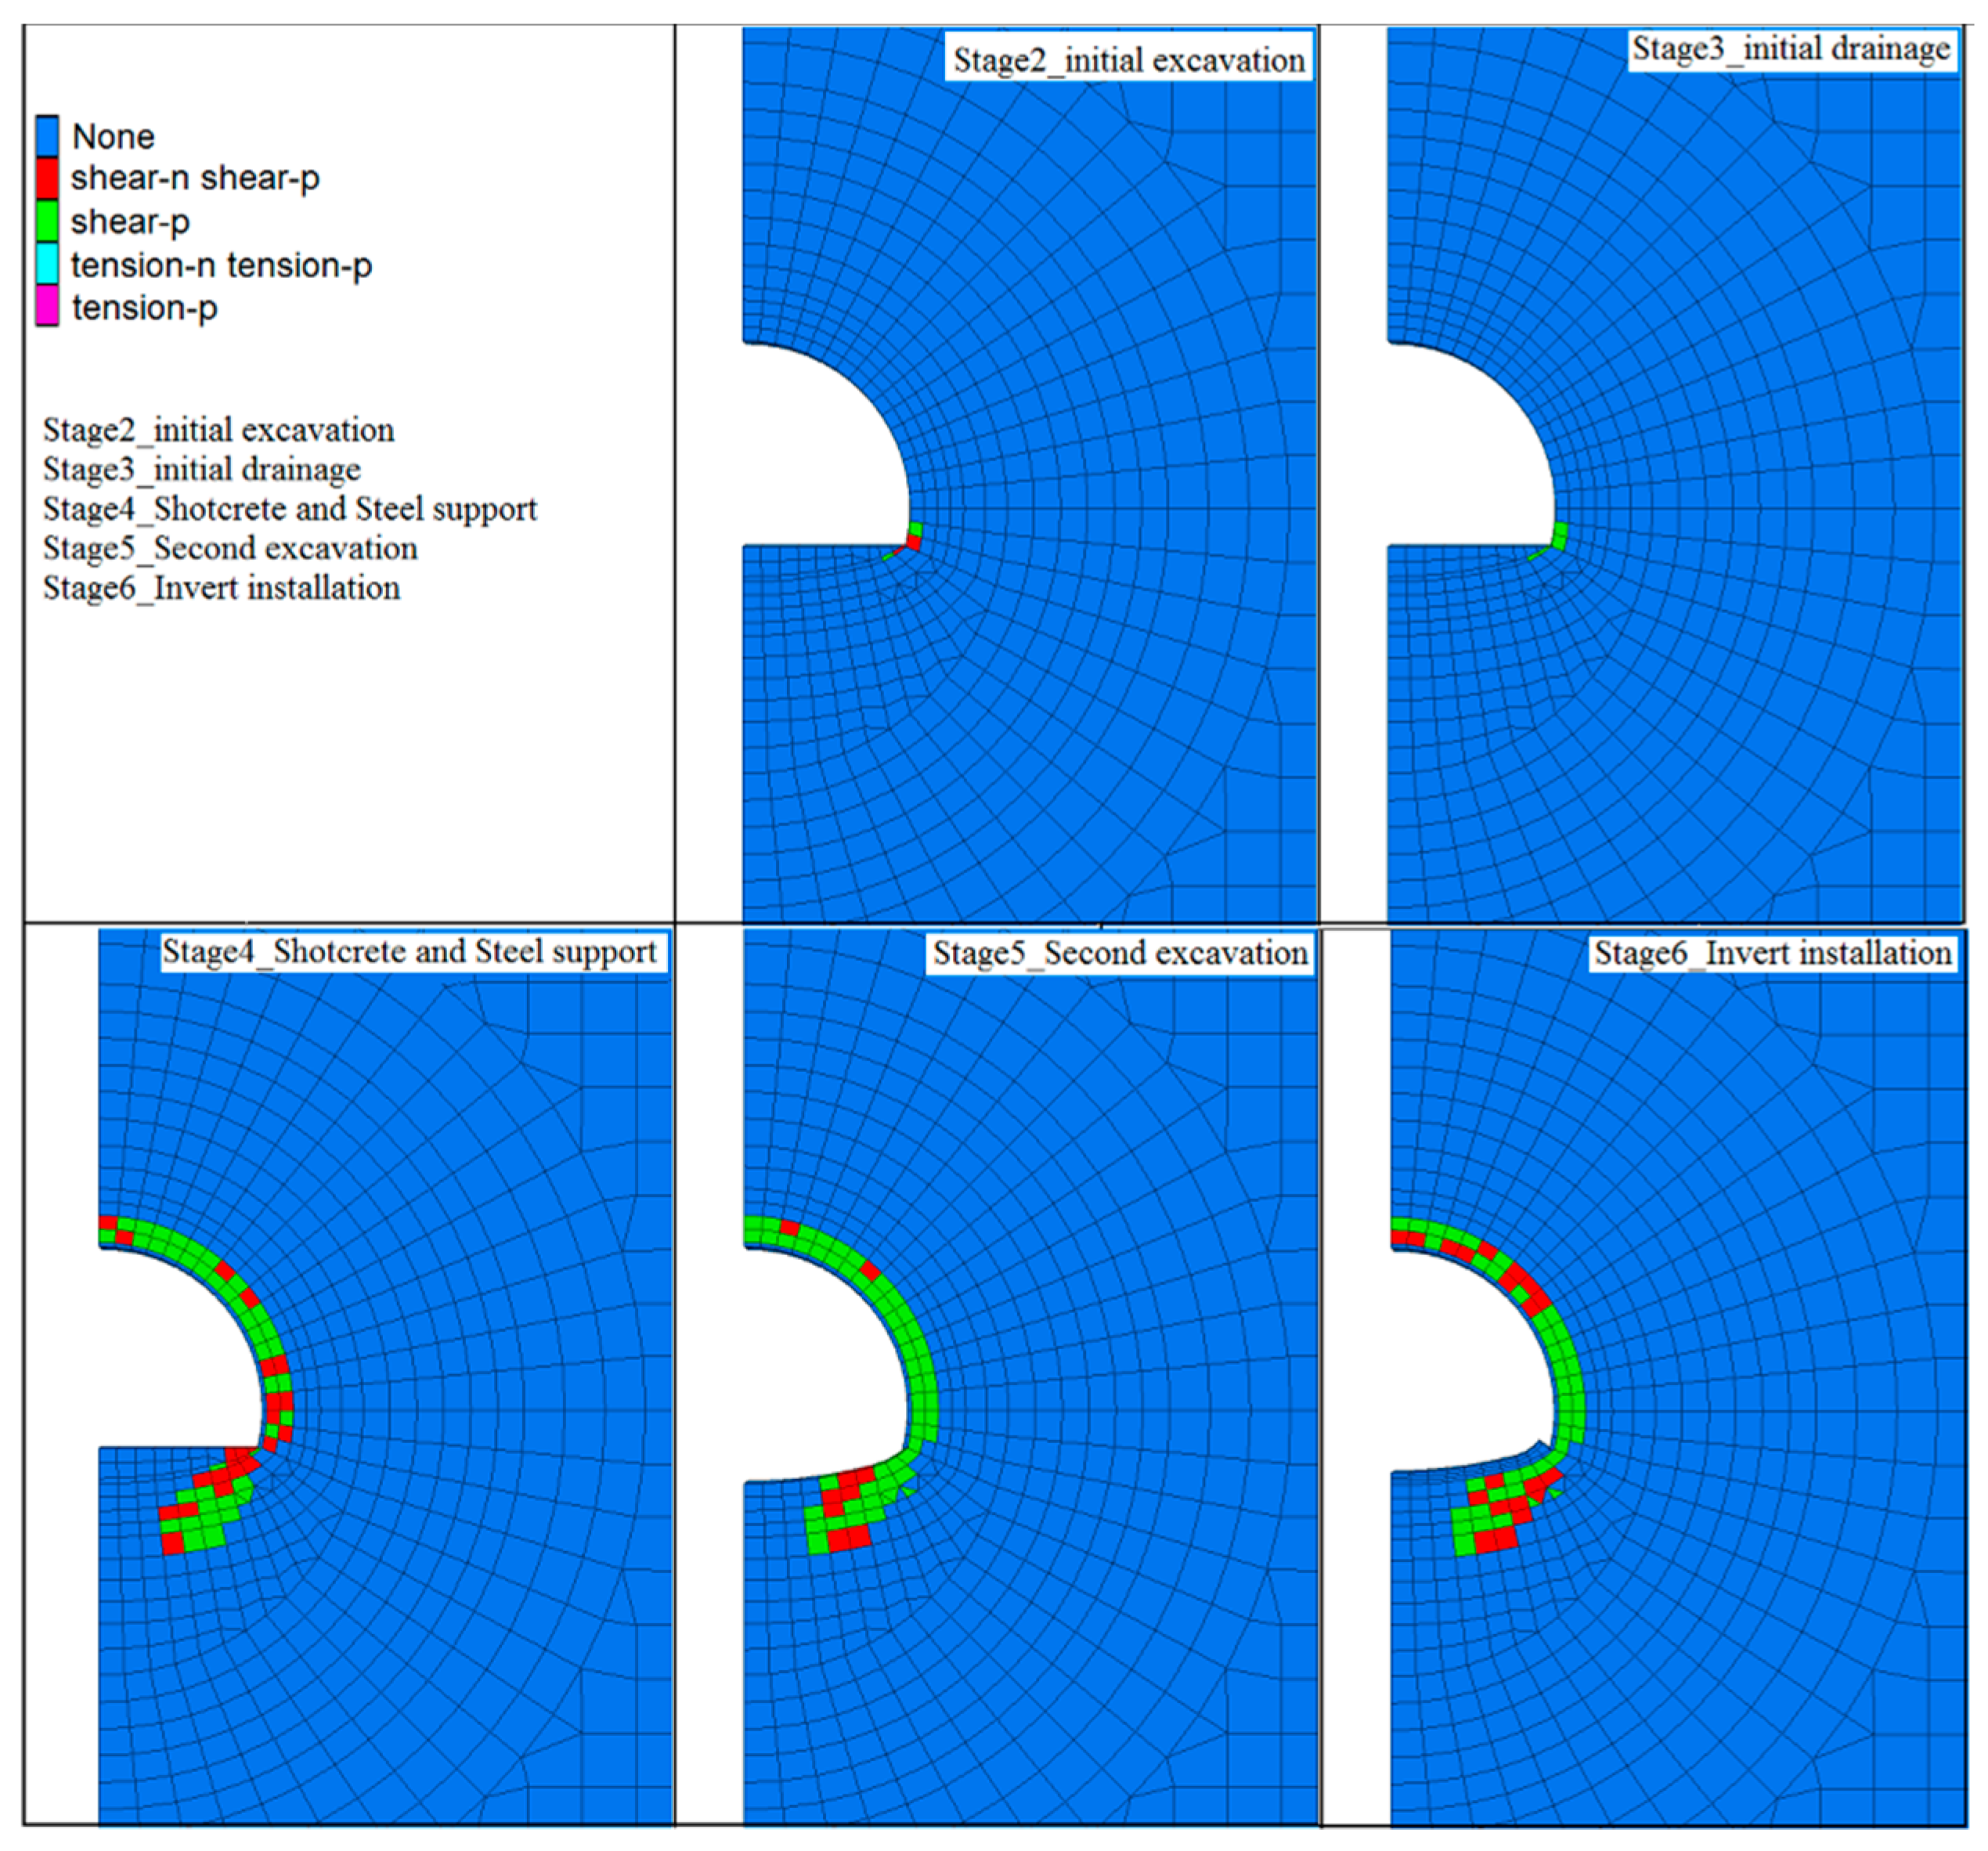
The state and extent of failure zones play important roles in the study of the failure mechanism and support performance. Figure 7 displays the shear and tensile failure zones around the excavated tunnel. These results are obtained after the excavation and support of the tunnel. It is very clear that the failure zones appear after the excavation of the tunnel. The failure zones become broad obviously after the tunnel is supported by shotcrete and steel bolts. The failure zones at the bottom of the tunnel section change more obviously. The proportion of shear failure is bigger after the inverted-arch installation than that before the inverted-arch installation.
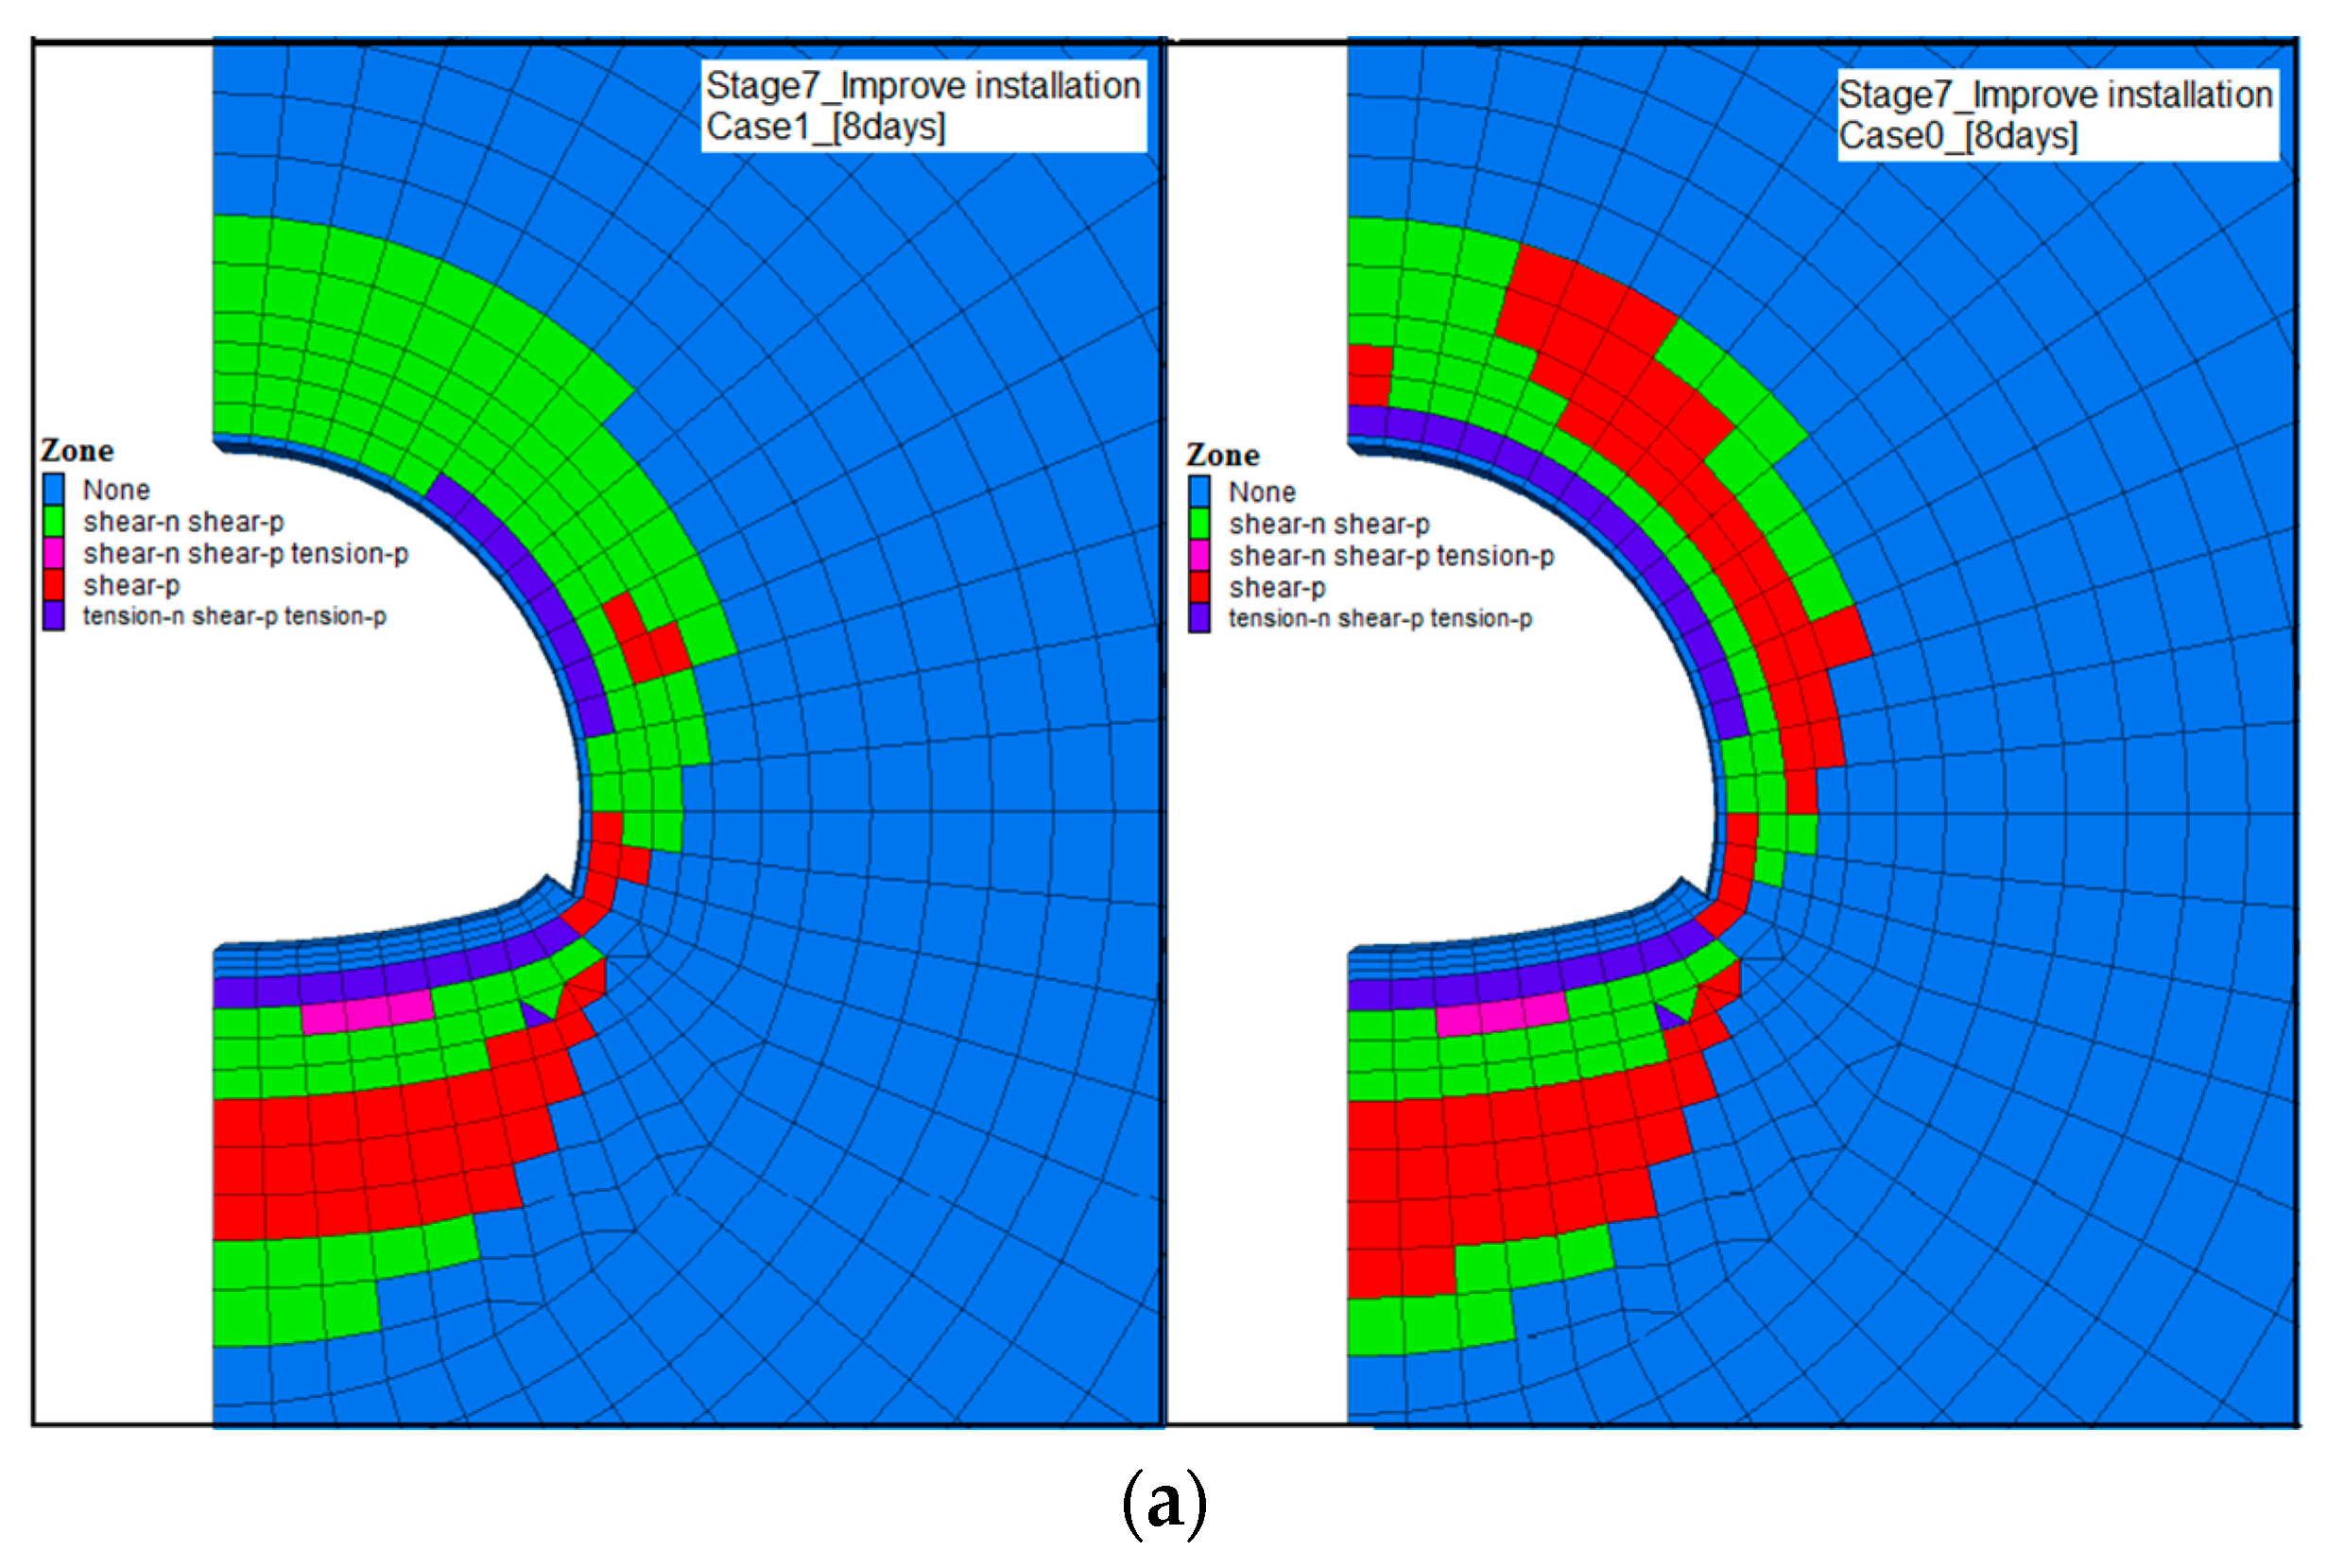
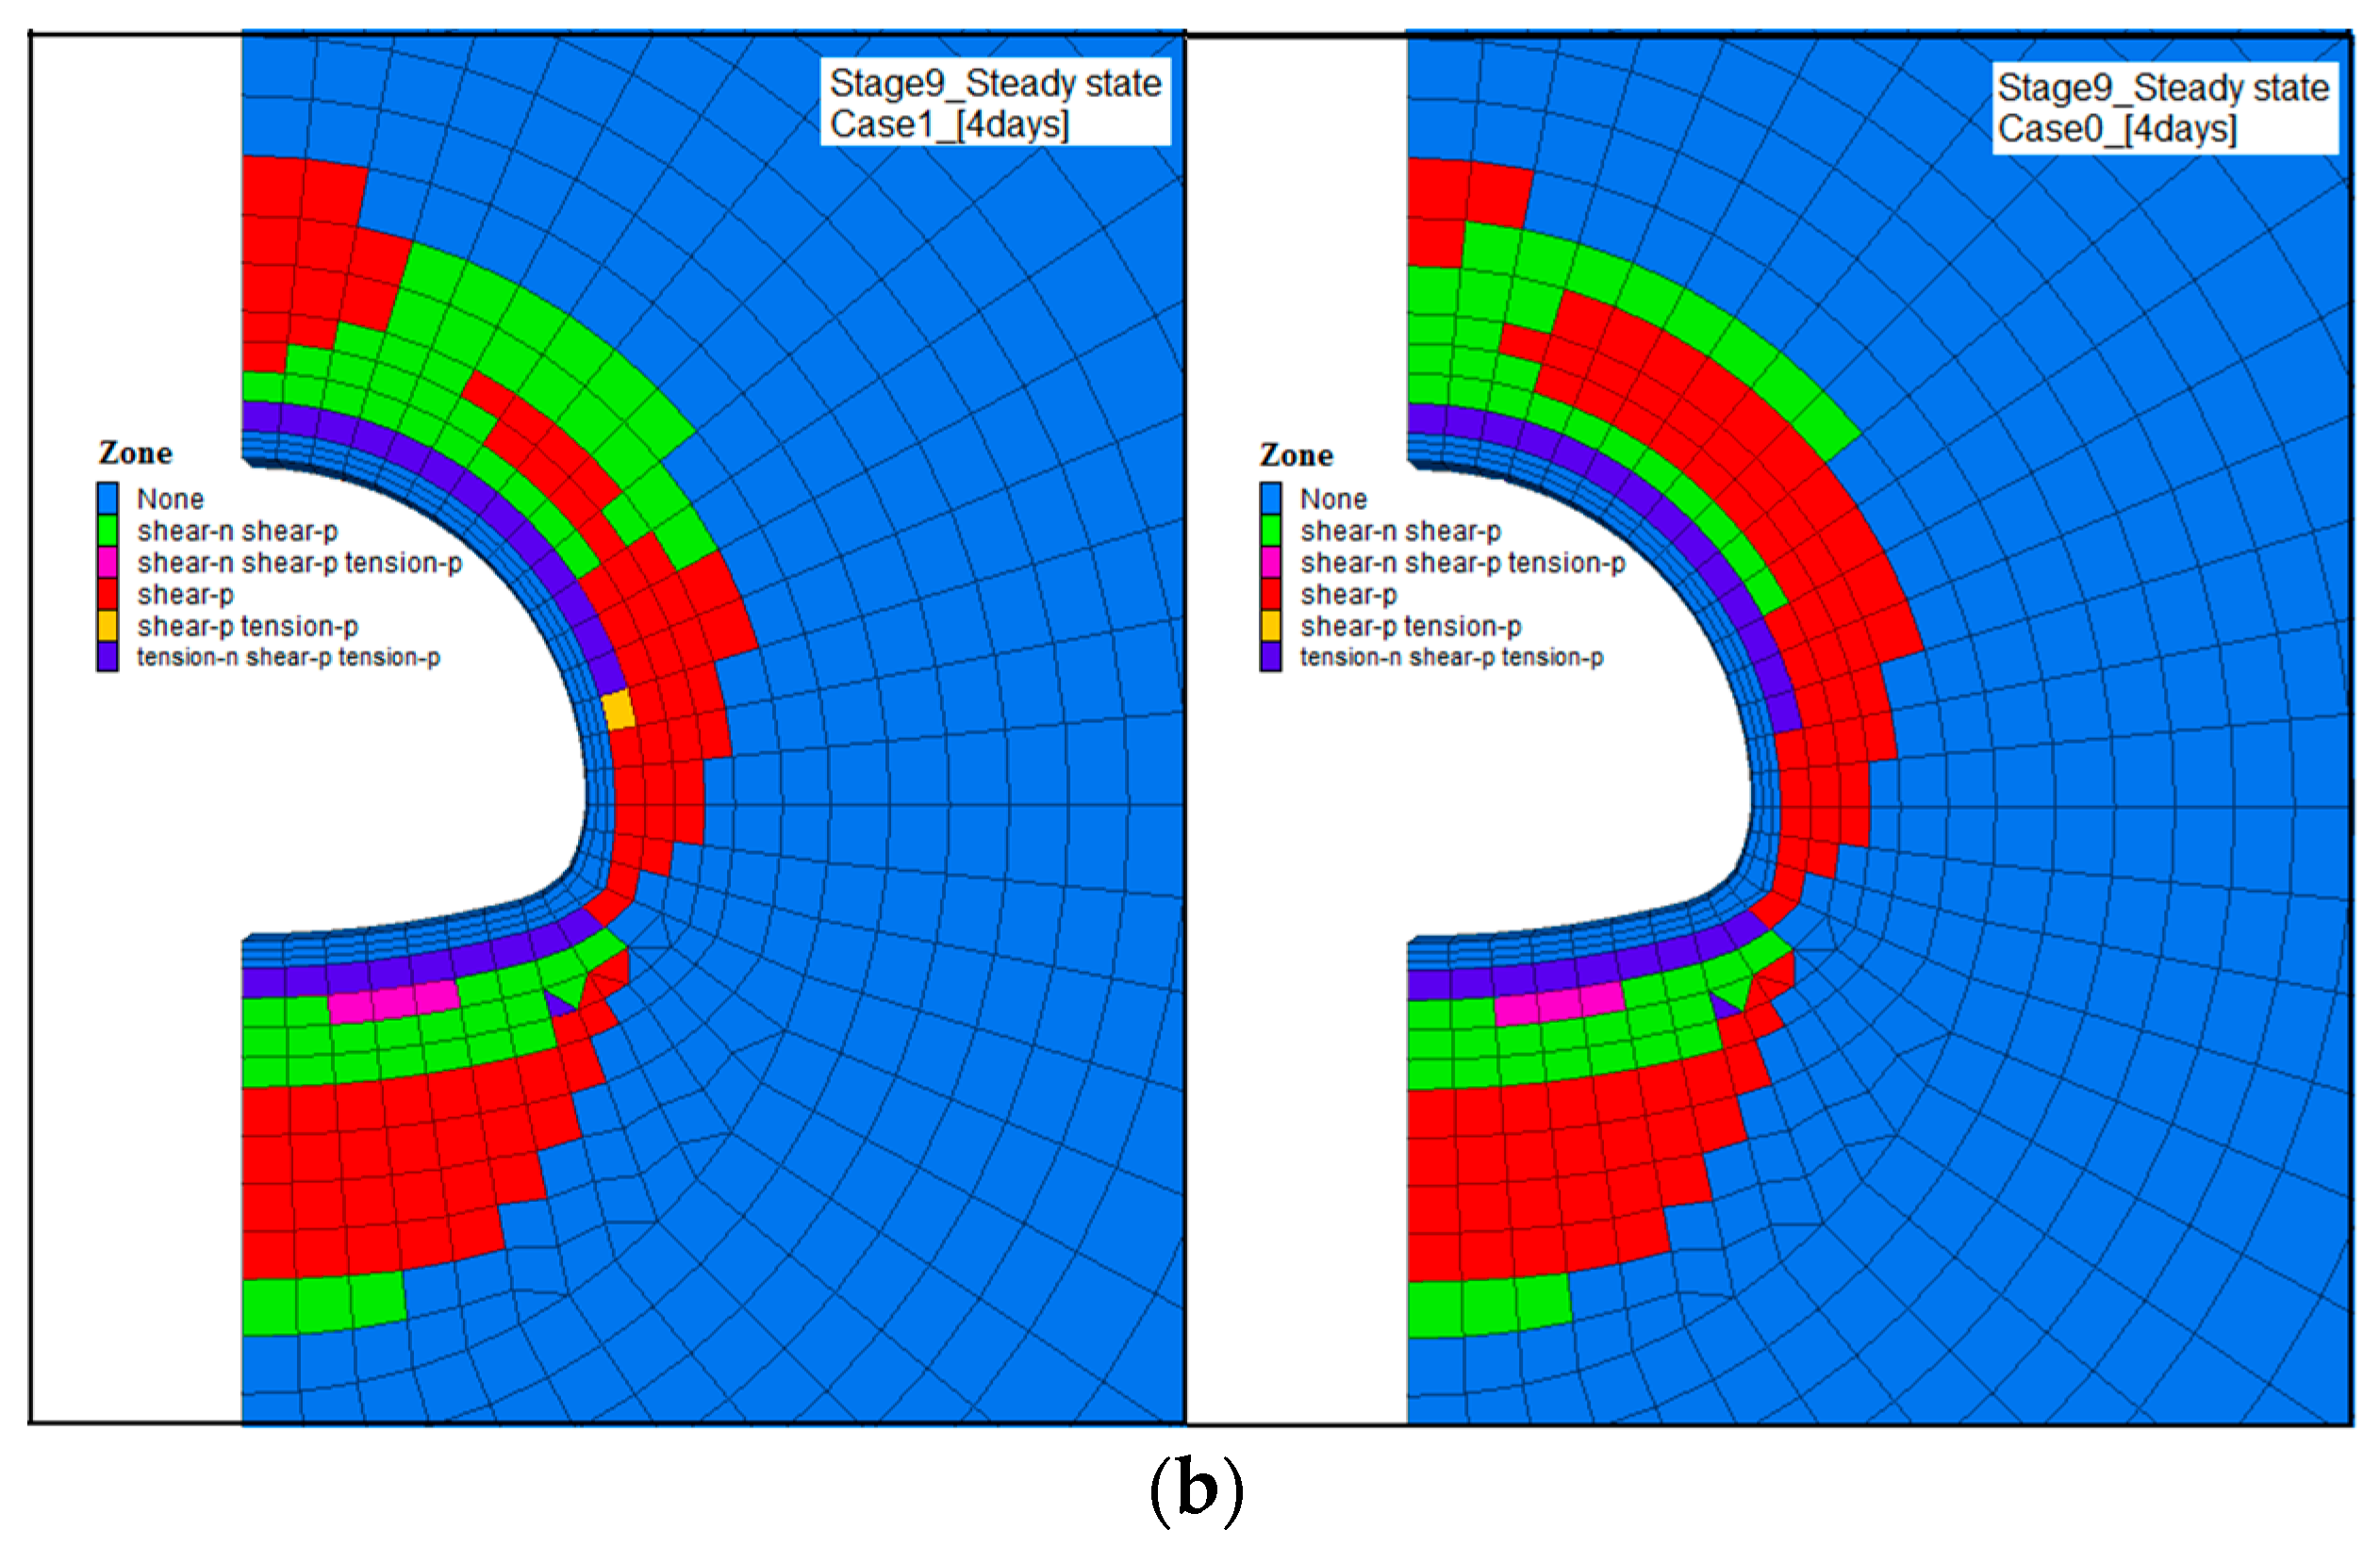
Obviously, if the groundwater is permitted to continue to flow into the tunnel, larger failure is expected to occur. Therefore, it was decided to take measures to stop the drainage of groundwater through the tunnel walls to prevent the tunnel from greater damage. The distribution of failure zones in the two different cases are shown in Figure 8. The same simulation time is set in the two cases after improving part installation. In stage 9, the simulation time is four days in the two cases. In two stages, there are more distinct failures in Case 0 than that in Case 1. It illustrates water-reducing measures play an important role in the stability of tunnel support. During the drainage process, the evolution of tension failure of the tunnel surrounding rock in Case 1 is slower than that in Case 0.
3.2. The Deformation and Pore Pressure Distribution around the Tunnel
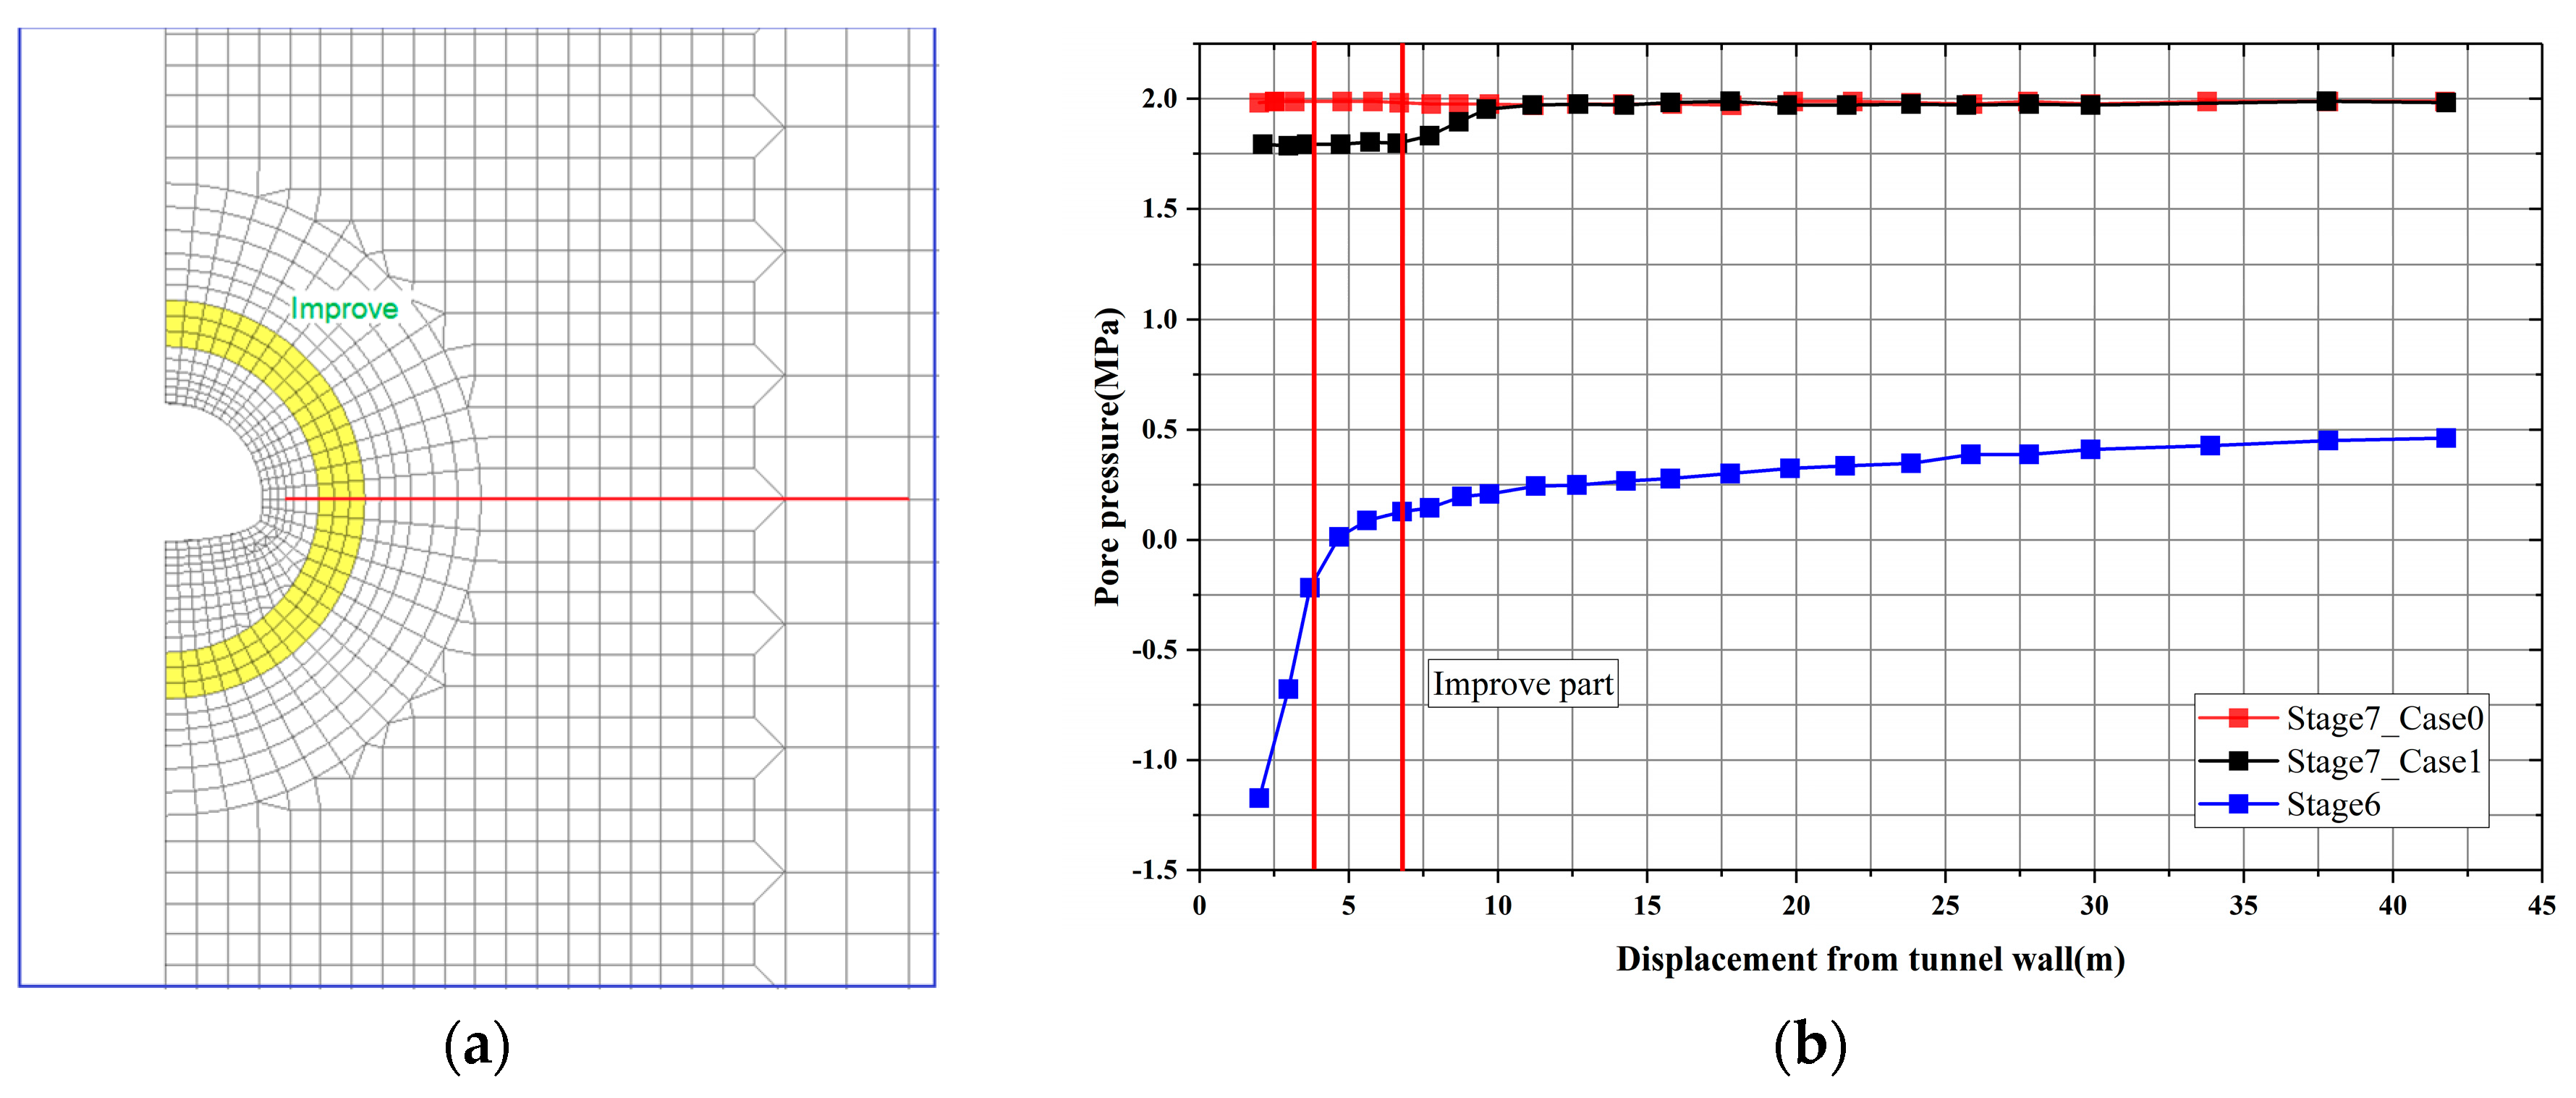
The rock stress and pore pressure around the tunnel are investigated in Figure 9. The observed location is a red horizontal line as shown in Figure 9a,b which shows the effect of improving part on the pore pressure along the horizontal direction. The pore pressure is about 2.0 MPa in Case 0 and it decreases to 1.75 MPa in Case 1 after the improving installation. The decreased proportion of pore pressure is about 12.5%. It indicates that the improving part reduces the groundwater penetration into grouting annulus to a certain extent.
(1) The stress and pore pressure around the tunnel.
The rock stress around the tunnel, including total stress and effective stress obtained in stage 7, are represented in Figure 10. There is a difference between Case 0 and Case 1 in regard to the distribution of stresses generated in the ground. The total stress and effective stress of rock in Case 1 are shown in Figure 10a,c, respectively. Correspondingly, the total stress and effective stress distribution are shown in Figure 10b,d. Comparing the stress distribution in two cases, the total stress and the effective stress in Case 1 are obviously smaller than that in Case 0. The major principal stress, both the total stress and the effective stress, is decreased by about 20% in Case 1 in improving part. The minor principal stress is decreased by about 12% in Case 1 in improving part.
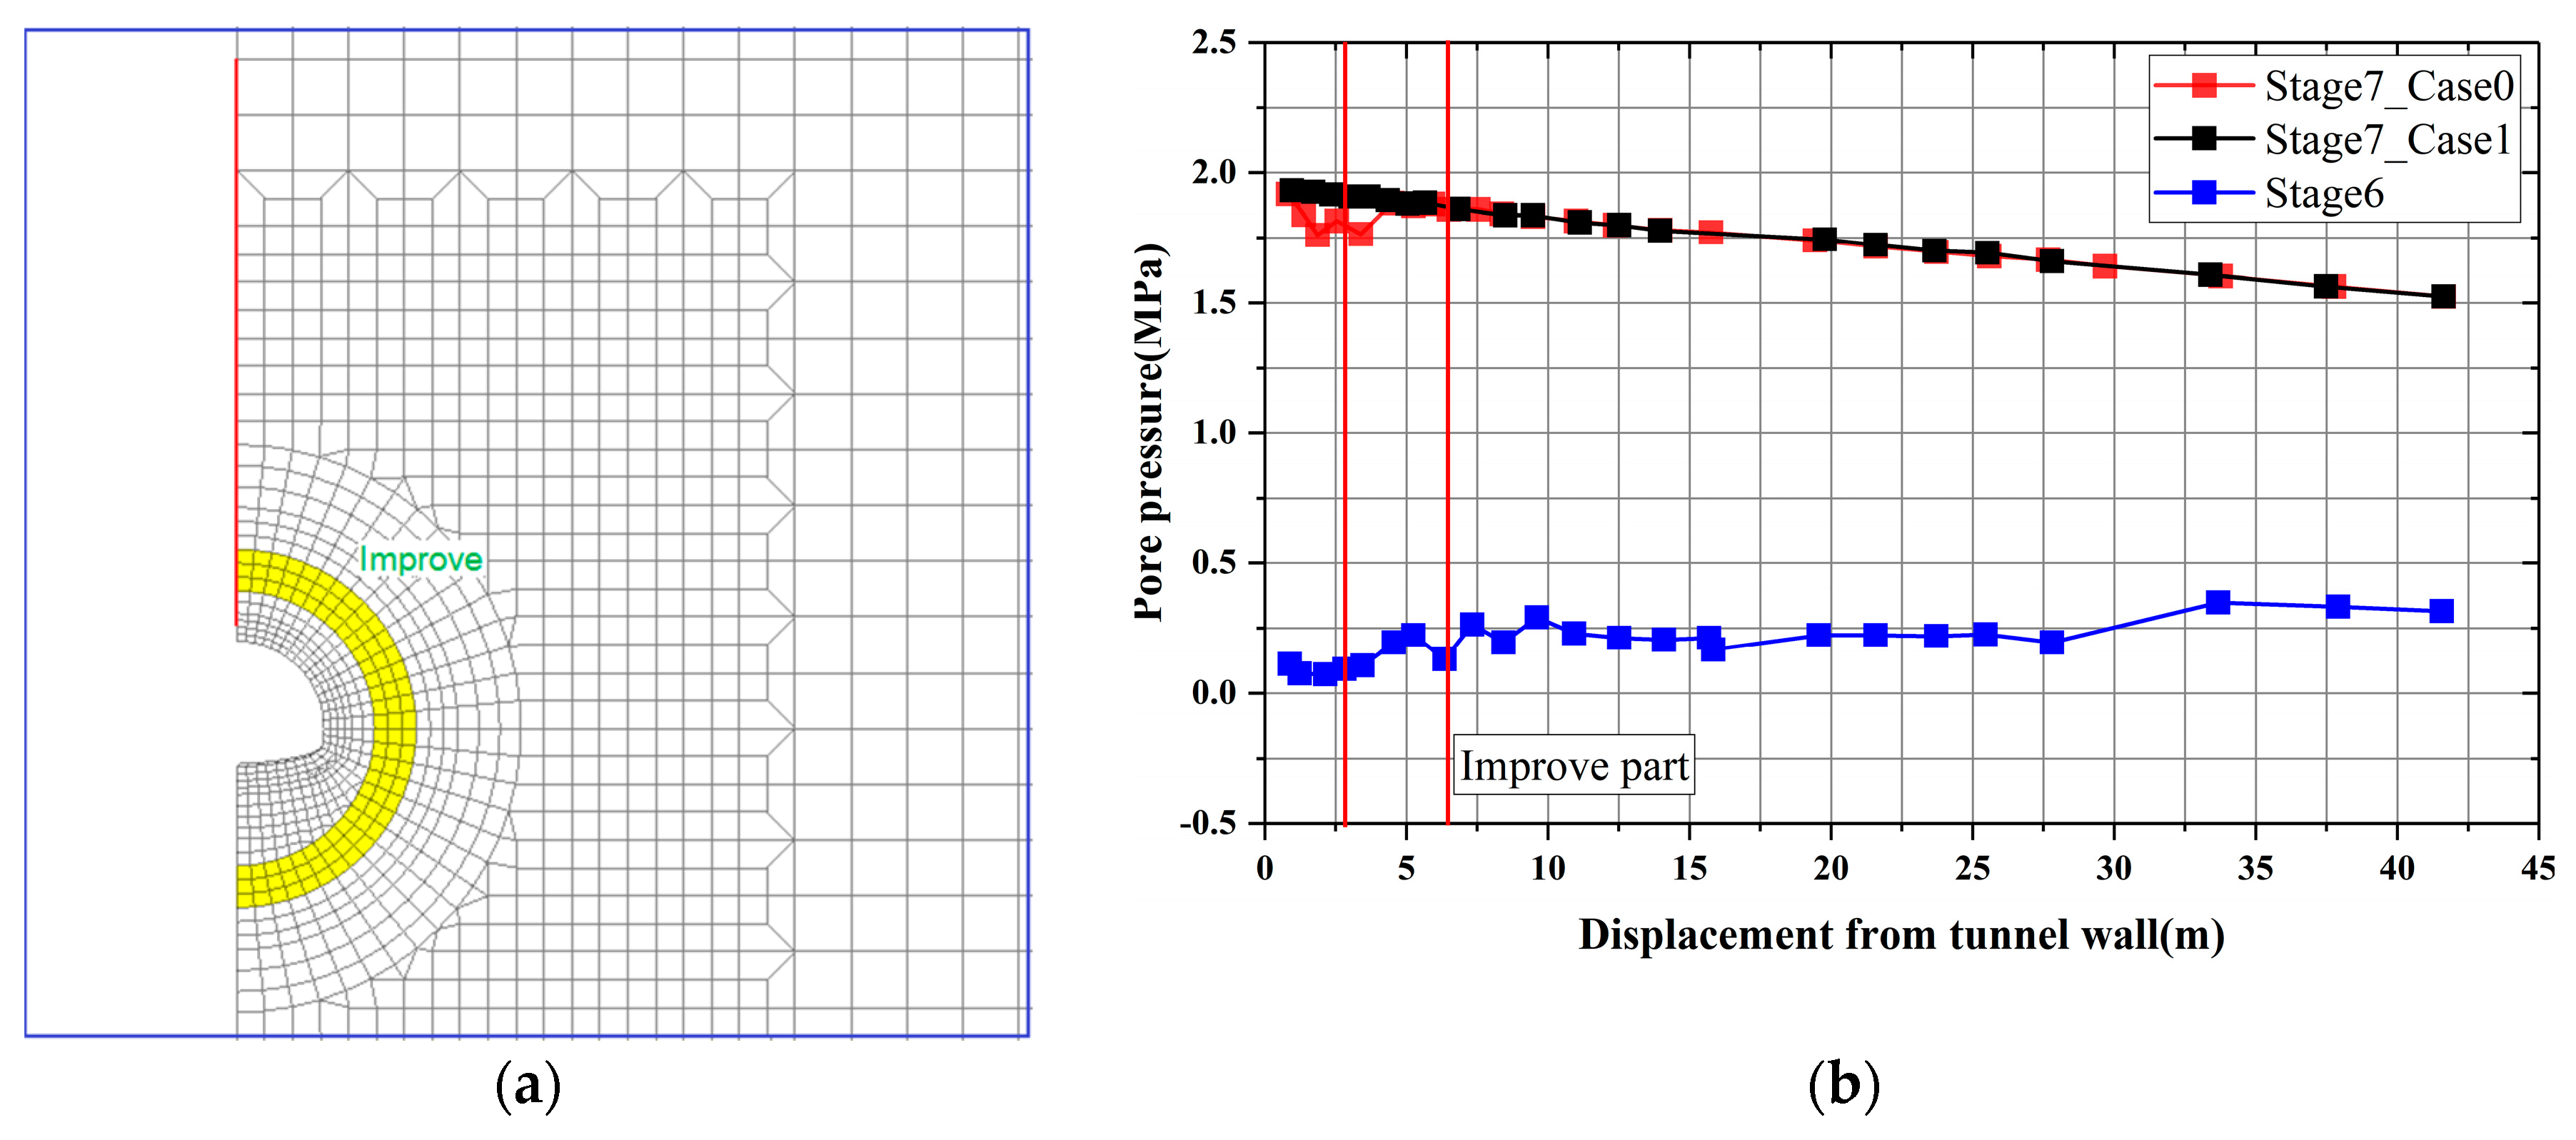
The rock stress and pore pressure around the tunnel in the vertical direction are investigated in Figure 11. The observed location is a red vertical line as shown in Figure 11a. The law of pore pressure change is very similar in the vertical direction with the law in the horizontal direction. Because of the improving part installation, the pore pressure is decreased in this area. In the vertical direction, the decreased proportion of pore pressure is about 5% as shown in Figure 11b. The improving part can prevent the groundwater from penetrating into the tunnel.
The rock stress around the tunnel, including total stress and effective stress in vertical direction obtained in stage 7, are represented in Figure 12. There is a difference between Case 0 and Case 1 in regard to the distribution of stresses generated in the ground. The total stress and effective stress of rock in Case 1 are shown in Figure 12a,c, respectively. Correspondingly, the total stress and effective stress distribution are shown in Figure 12b,d. Comparing the stress distribution in two cases, the total stress and the effective stress in Case 1 are obviously smaller than that in Case 0. The major principal stress of the total stress is decreased by about 11.5% and the decreased proportion of effective stress is about 16.7% in Case 1 in grouting annulus. The minor principal stress is decreased by about 14% in Case 1 in improving part.
(2) The Minor Principal Stress of Supporting Structure.
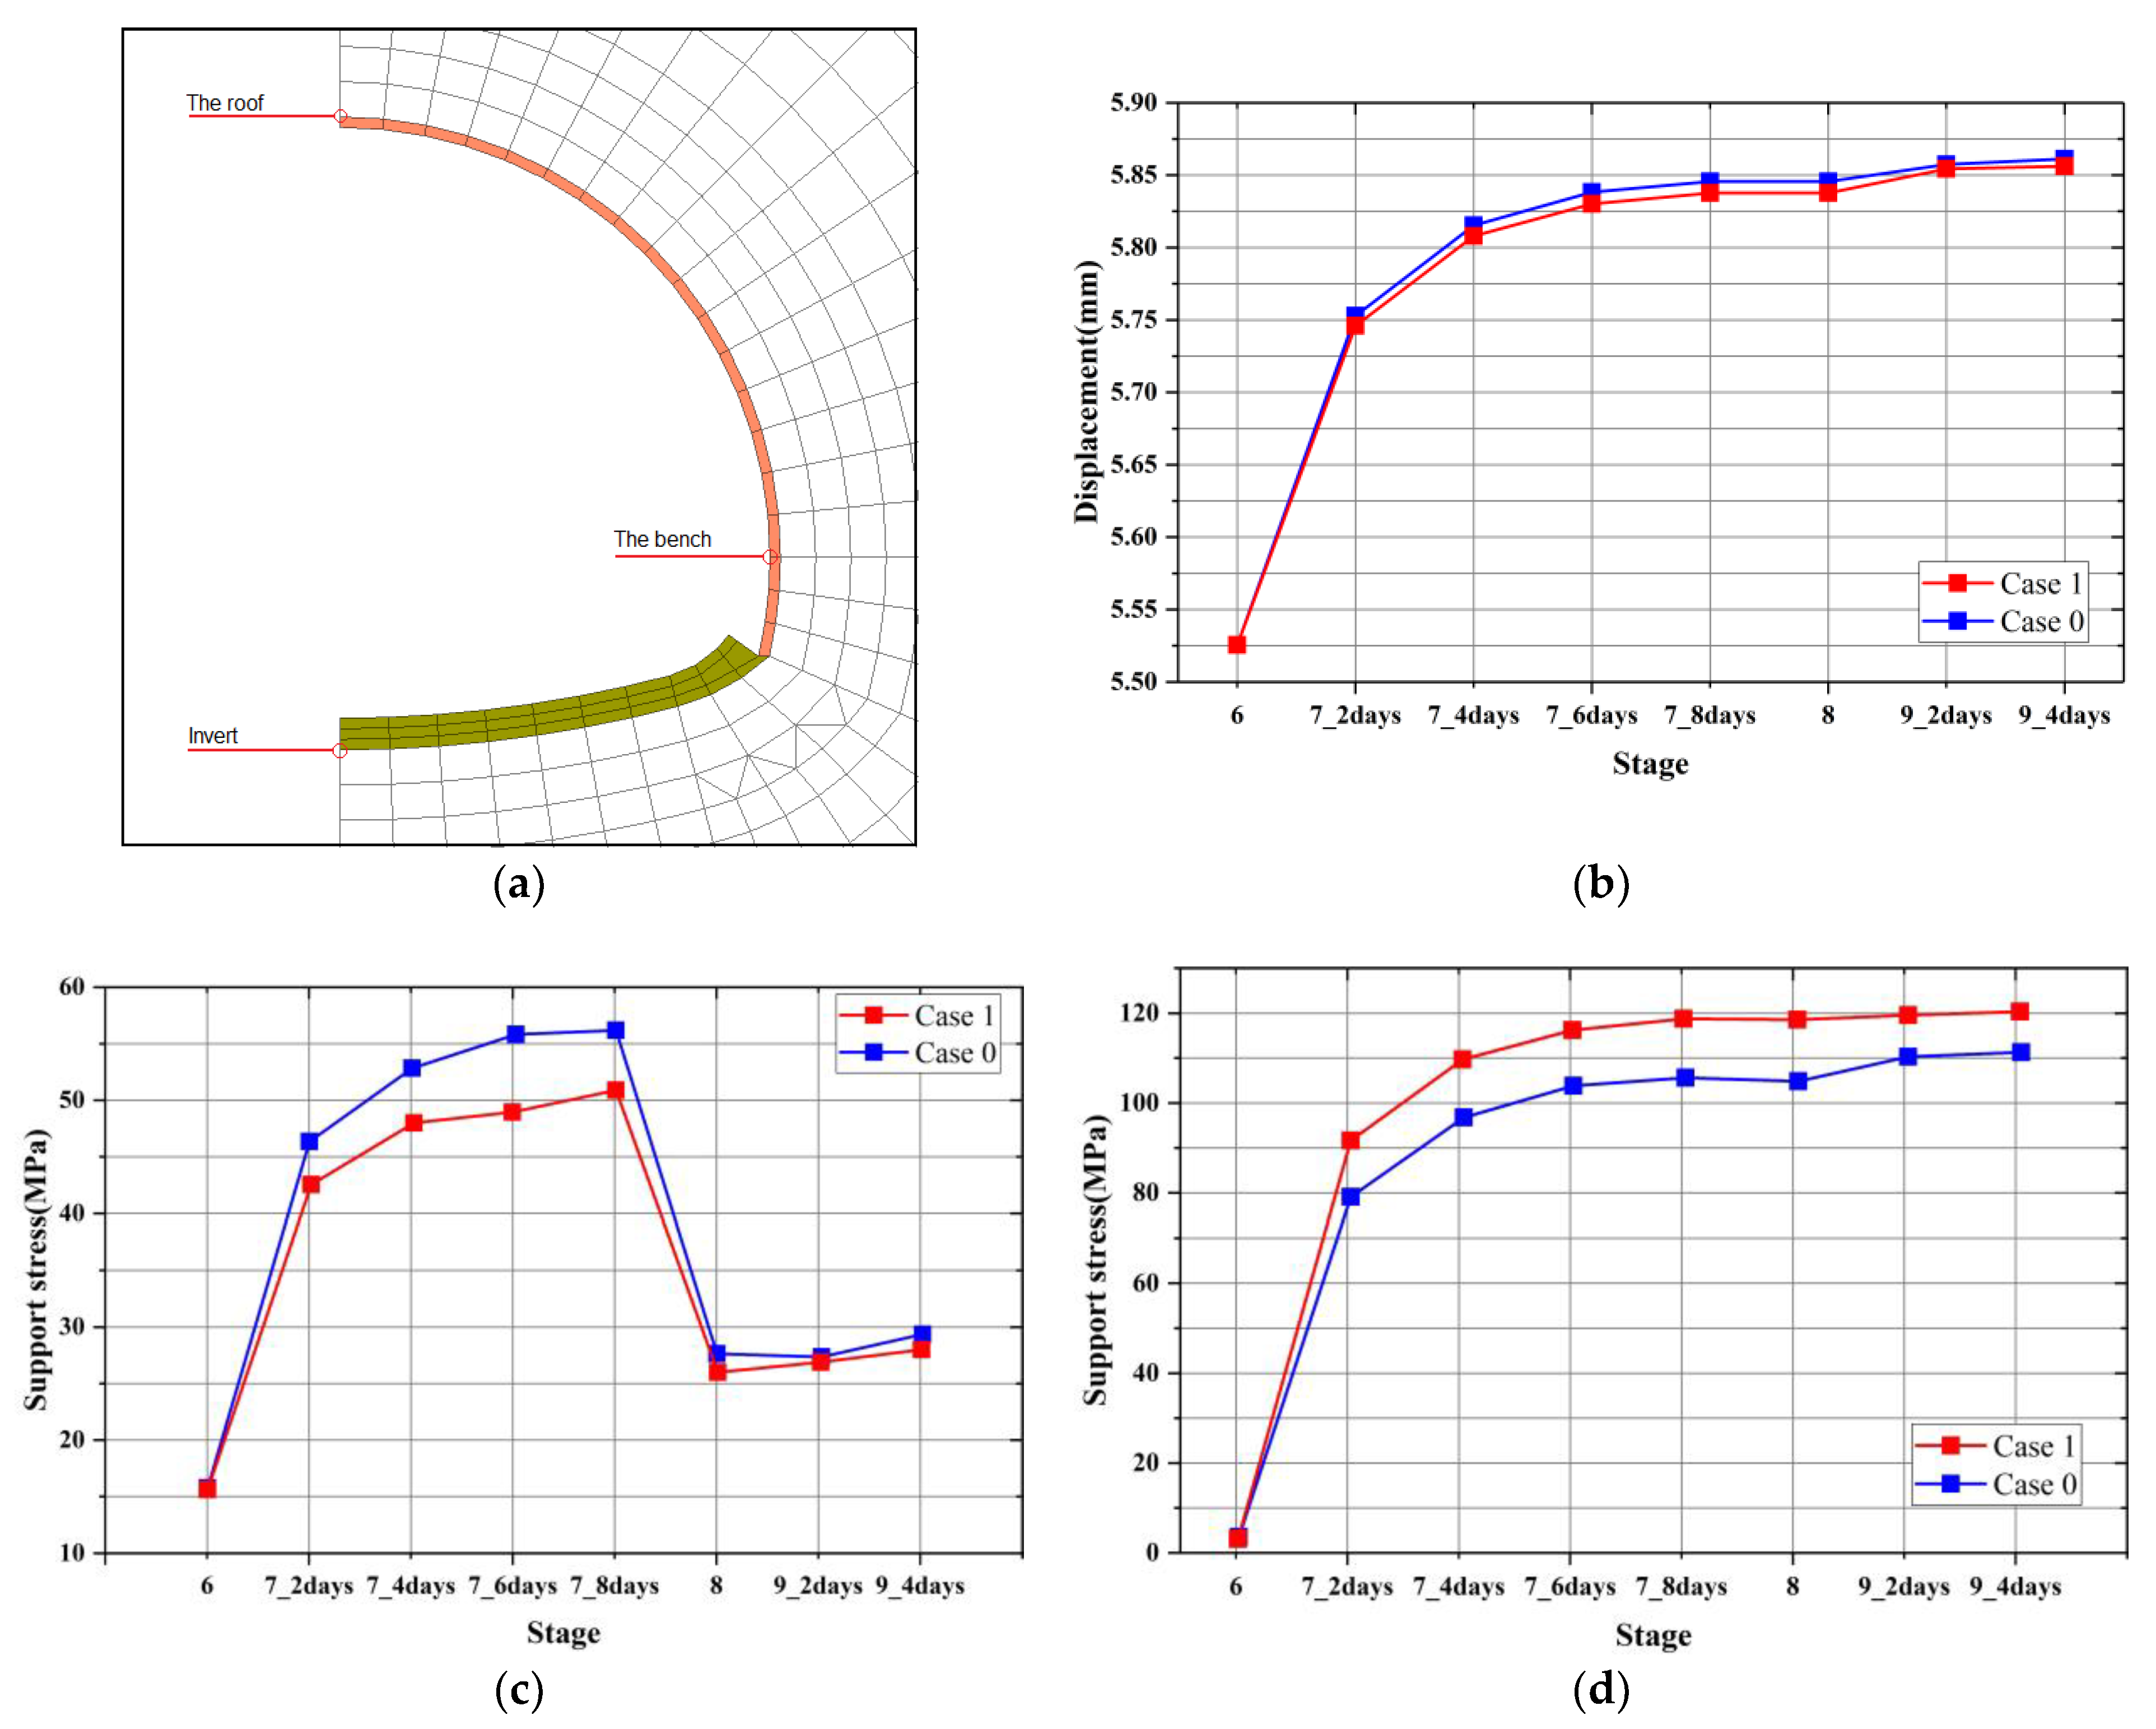
The observation for the minor principal stress in the tunnel surrounding ground is conducted and the result is shown in Figure 13. Three observation points in different parts around the tunnel were selected, as Figure 13a shows. After the improving part installation, the displacement of the tunnel roof becomes smaller than that in Case 0, as shown in Figure 13b. The stress in the bench of the shotcrete has the same change law in two cases and the magnitude of the stress is smaller in Case 1 than that in Case 0, as shown in Figure 13c. However, as shown in Figure 13d, the stress of invert part of the tunnel in Case 1 is bigger than that in Case 0. It implies that the groundwater pressure transfers from other ground parts around the tunnel and the invert part should be reinforced to a certain extent.
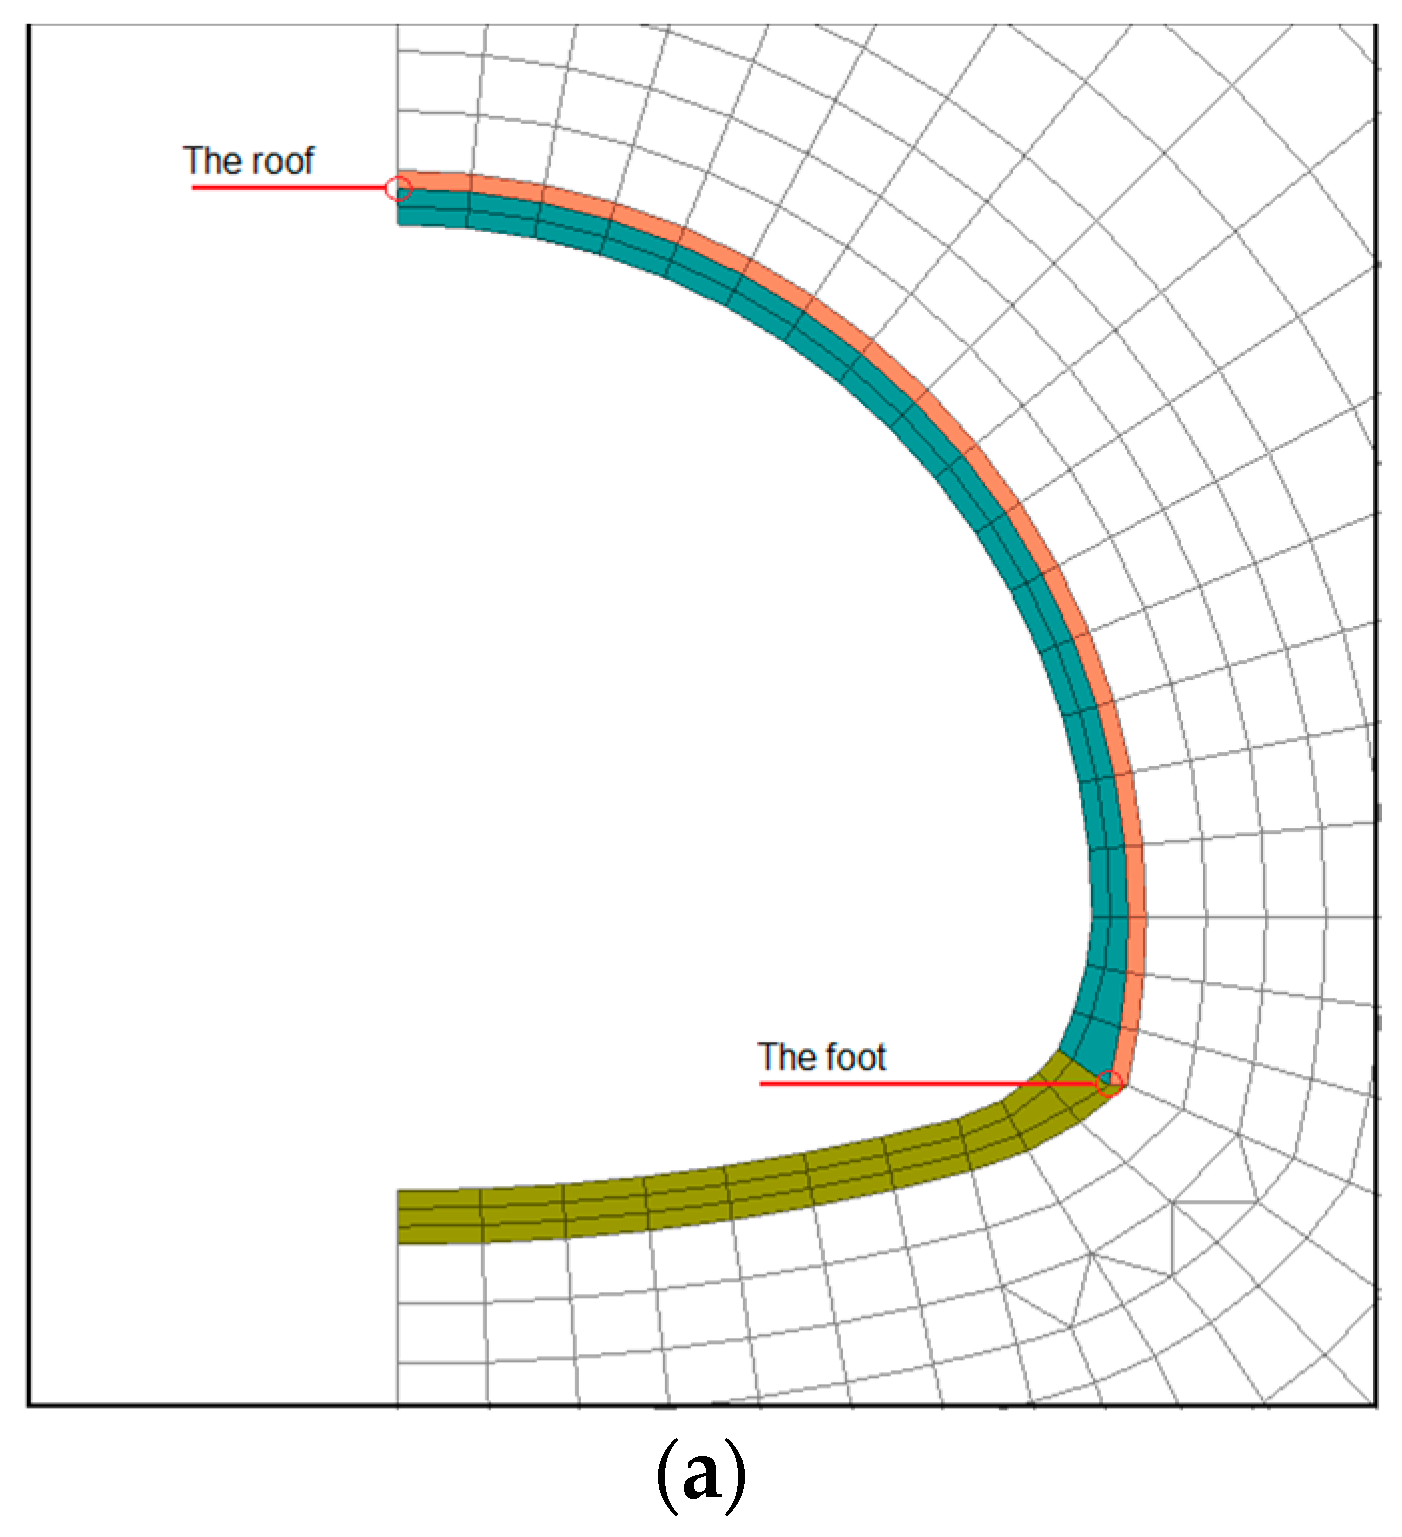
As a primary support of tunnel surface, concrete lining serves a number of functions, such as supporting adjacent ground and resisting ground erosion and degradation. The minor principal stress of the reinforced concrete lining in the roof part and the foot part are presented in Figure 14b,c, respectively. The minor principal stress is reduced in the lining structure after the improving part installation. The pore pressure in the permeable shotcrete layer is maintained at zero around the liners before the lining is applied. The pore pressure in the impermeable lining structure attempts to reach linear hydrostatic values.
(3) The Supporting Structure Displacement.
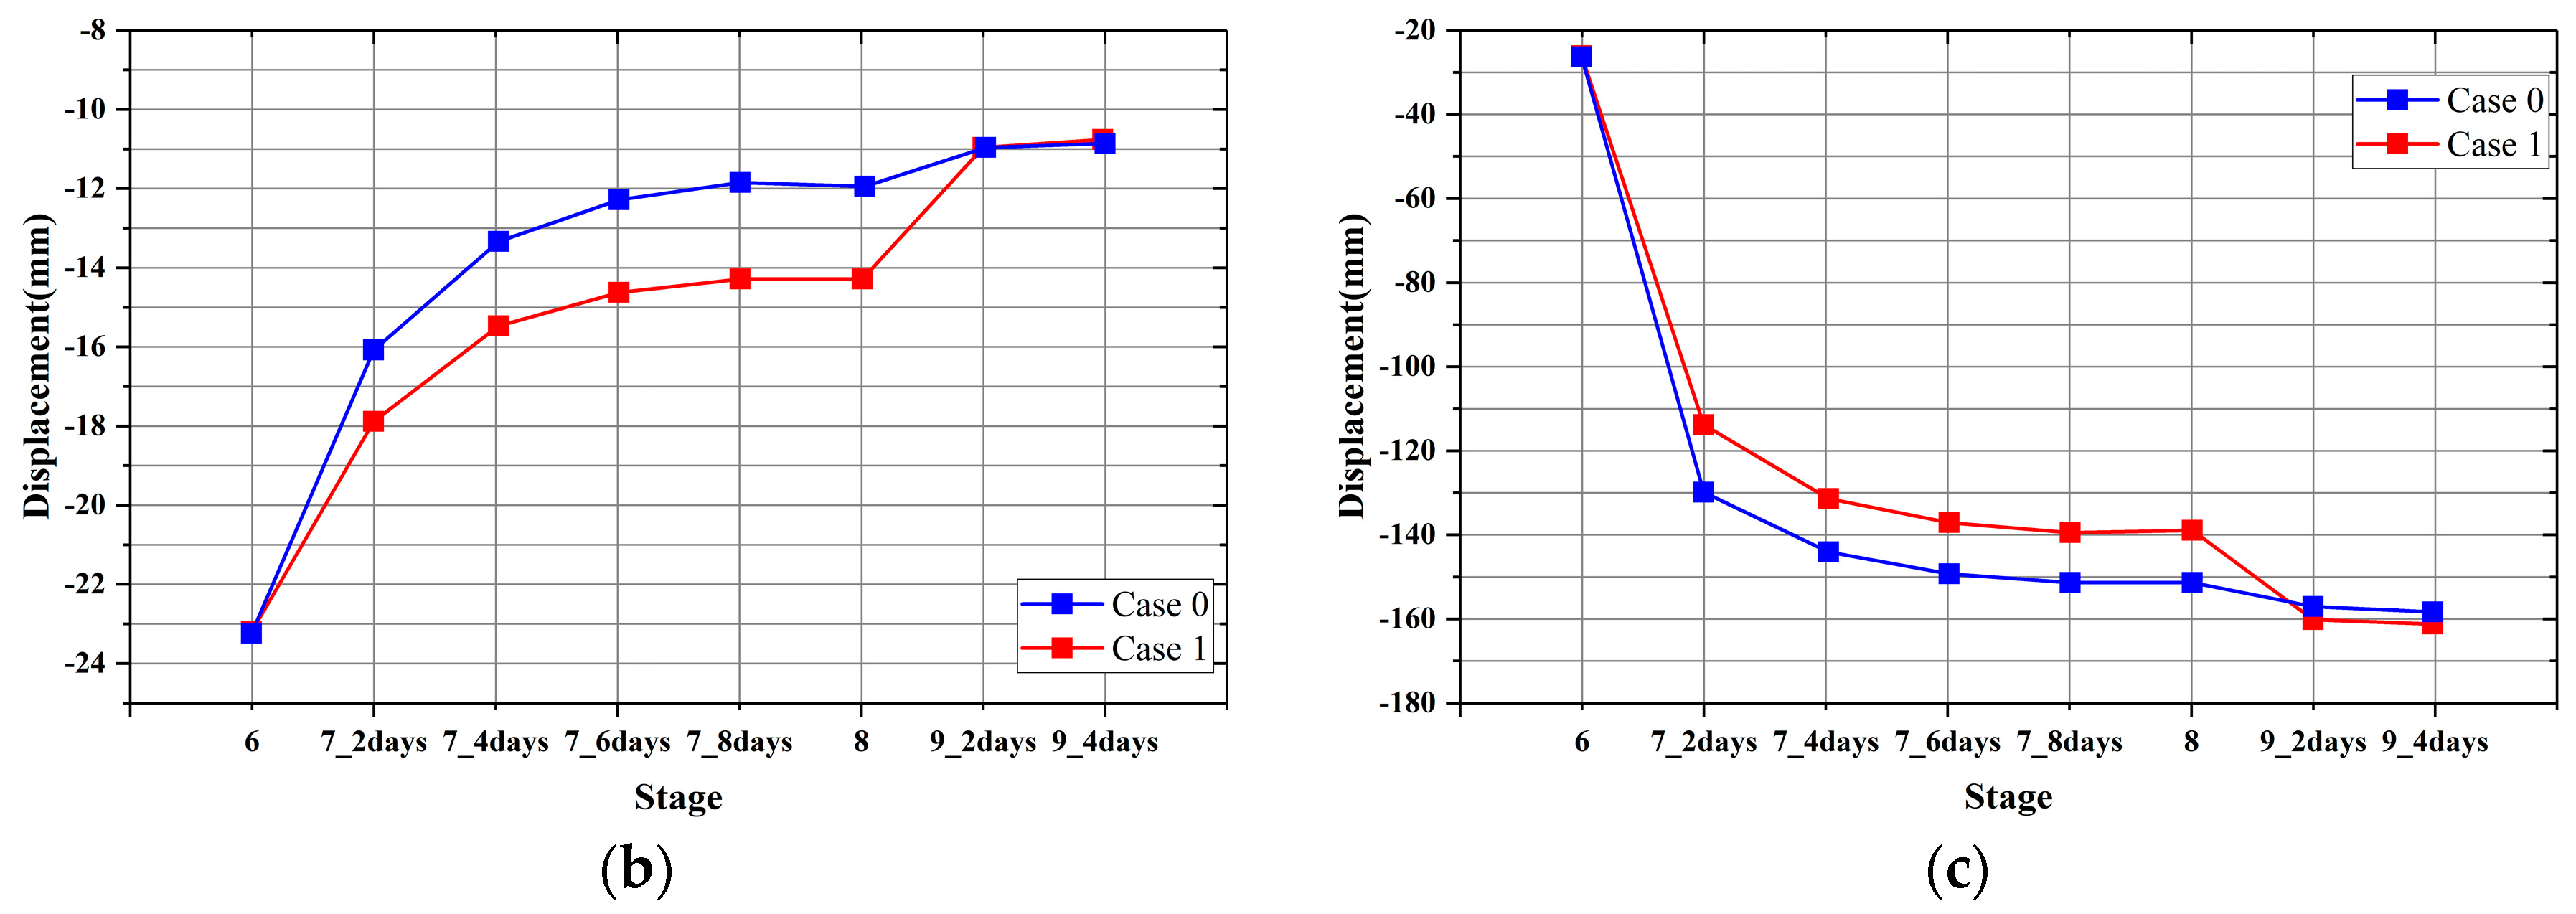
The observation, in which the radial displacement and relative vertical displacement at the tunnel lining are shown in Figure 15b,c, reveals clearly that the tunnel construction work causes the magnitude variation of displacements in the tunnel cross-section. After improving part installation, the horizontal displacement caused by the seepage flow of the tunnel in the cross-section decreases, while the reduction of Case 0 is greater than Case 1. Meanwhile, the vertical displacement caused by the seepage flow of the tunnel in the cross-section increases, and the increment of Case 0 is greater than Case 1. This phenomenon shows that the tunnel cross-section is compressed in the vertical direction during improvement installation. In steady state, the tunnel drainage is conducted after the impermeable lining is installed. The observation of the displacement variation shows that compressive circumferential stress and radial displacement will be induced by hydrostatic water pressure in the lining if the outer surface of the lining is sealed.
After all the analysis above, it confirms that the grouting strategy is reliable. The groundwater flow and porewater pressure are decreased distinctly after the new improving part installation. With rock mass between tunnel support and improvement part consideration, the deformation of support and pore pressure are reduced significantly after grouting. It takes seepage force and rock body force acting on the support structures into consideration. The distribution of failure zones around the tunnel model becomes smaller after improvement installation. In the next section, the verification of the support design will be introduced.
3.3. Validation with Field Application
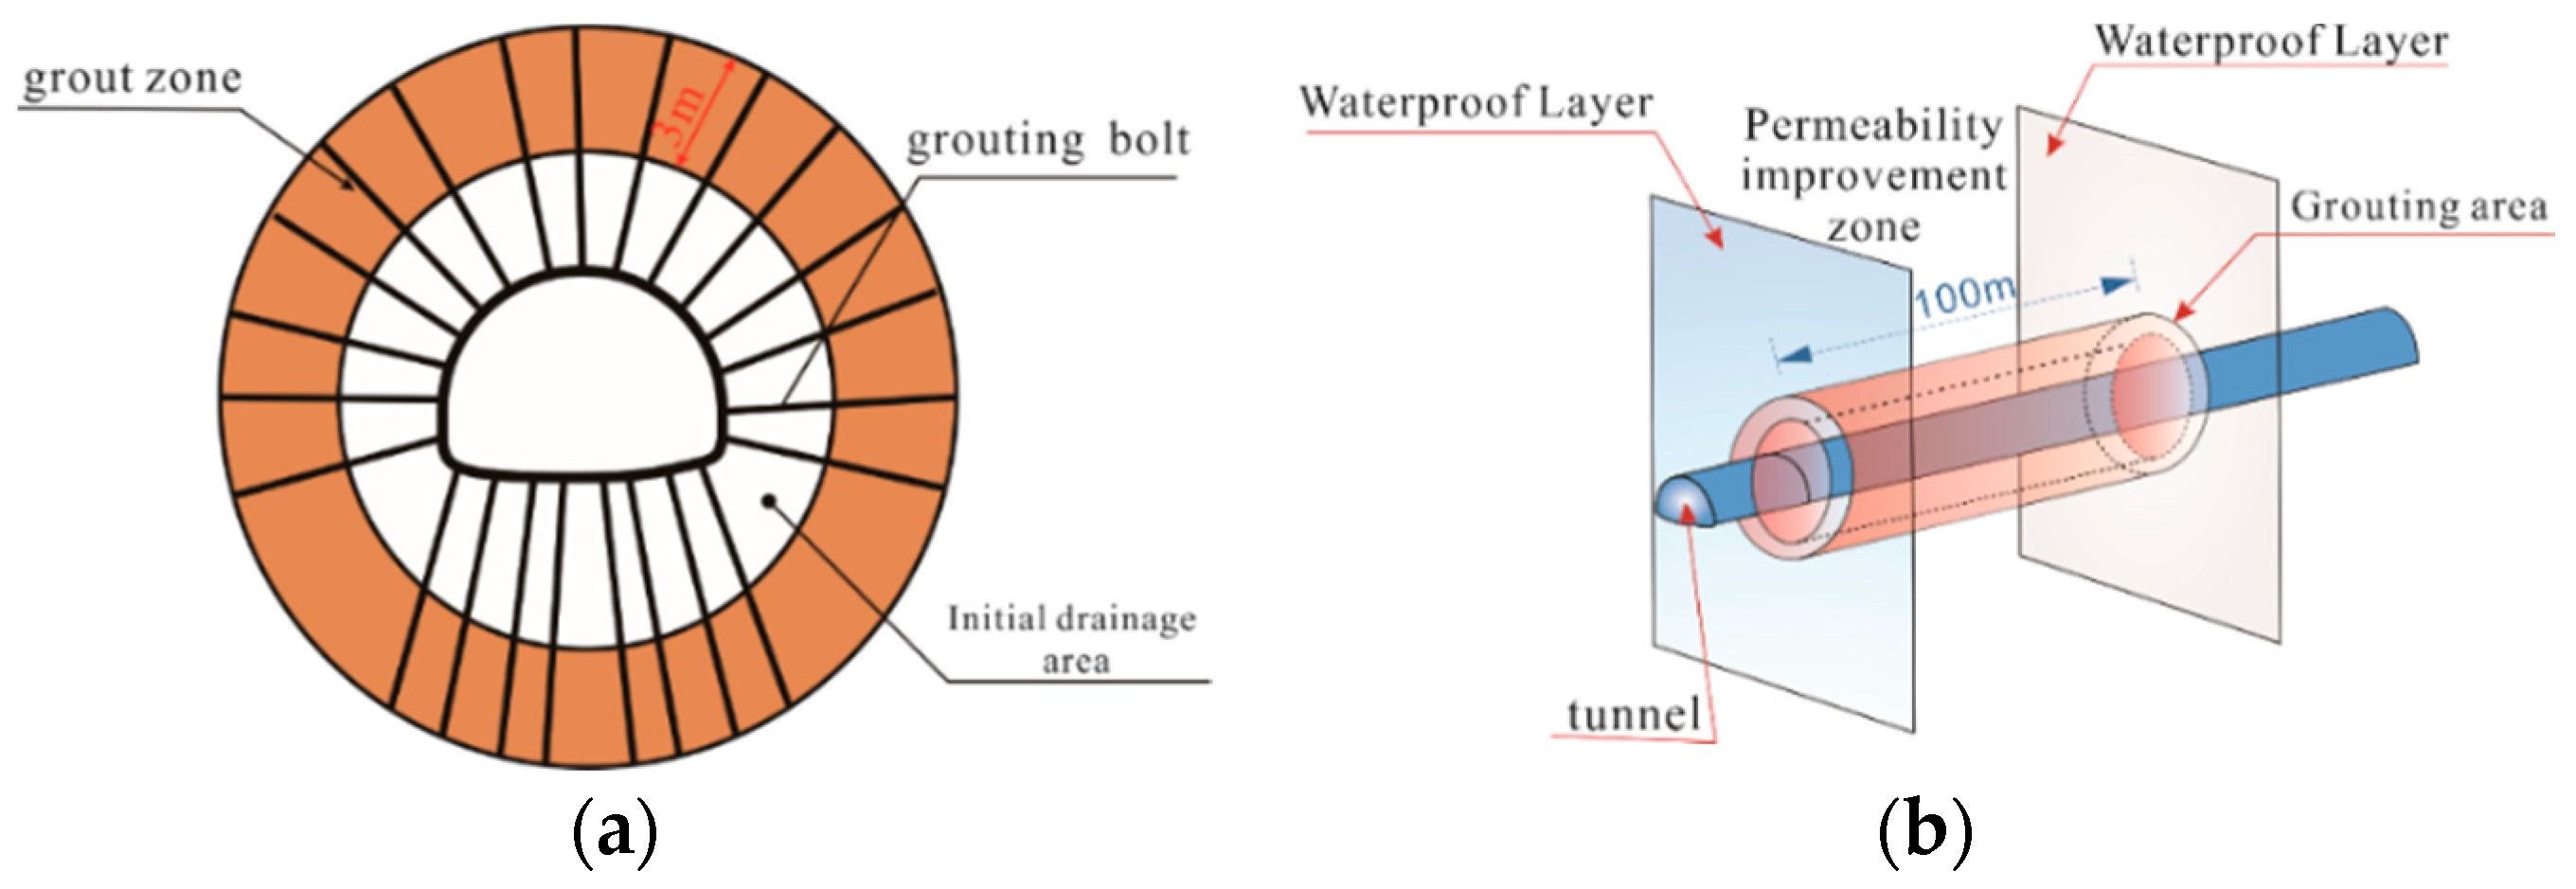
The section constructed as the initial drainage zone is covered by rock over 200 m; the rock and groundwater generate the high pressure which would make it difficult to tunnel further to support construction. Therefore, the improved method is shown in Figure 16a. Around the initial injection outside, the improved waterproof treatment was proposed to prevent groundwater inflow. The main filling material is a kind of high permeability ultramicro particle cement (average particle size 1.5 μm). The improved zones in the tunnel section are shown in Figure 16b.
Before chemical injection in the improved zone, the maximum discharge is almost 300 t/h, even after the tunnel goes through, it is also 600 t/h. Then the chemical injection changes the situation, the maximum discharge decreases from 300 t/h to 40 t/h, and there is not obvious deformation and abnormal stress in the tunnel. Figure 17 shows the improved method of retaining groundwater efficiently.
4. Conclusions
Groundwater inflow control is an unavoidable problem in tunneling. As the geological condition is various, the control method should be flexible when the support program is designed. In some mountainous areas, the groundwater is very abundant and the pore water pressure is very high in the ground excavated by tunnels. The grouting process may be very difficult because of the outflow of grouting materials and the existence of large opening cracks. In this paper, the multiple times grouting method is proposed and discussed in Hokusatsu tunnel excavation process because the tunnel is excavated through a very fractural zone and pore water pressure is high. A numerical model is constructed in FLAC3D software and verifies the multiple times grouting method by contrasting the mechanical behaviors of support structures and rock around the tunnel in the one-time grouting condition (Case 0) and in the multiple times grouting condition (Case 1).
The result shows the yield zone decreases after the multiple times grouting contrasted with the one-time grouting. It indicates that the ground is more stable in Case 1 condition than that in Case 0 condition. The principal stress and the pore water pressure are reduced significantly because of the two-time grouting zone installation. The effective stress acting on the structure at different locations of the support structure decreases correspondingly. The deformation of the support structures in the vertical direction and in the horizontal direction are detected relatively. Contrasting the deformations in the two case conditions, the tunnel supports have a significant deformation in Case 0. It declares that the multiple times grouting method can sustain the long-term stability of the tunnel validly. During field tests in the Hokusatsu tunnel, the groundwater flow is controlled effectively, the maximum discharge decreased from 300 t/h to 40 t/h, and there is not obvious deformation and abnormal stress in the tunnel.
This study proposed the new grouting method to control the tunnel leakage problem, which is a complex hydraulic-mechanical coupling problem different from the conventional grouting process. Therefore, in the future, we will conduct some experimental test in the laboratory and derive the analytical solution of the new grouting method and reveal the deformation mechanism of the special hydraulic-mechanical coupling system.
Author Contributions
Y.J. conceived of the presented idea. B.G. designed the model and the computational framework and wrote the manuscript. K.O. analyzed the data. Y.J., B.G. and X.W. verified the analytical data. X.W. and B.G. acquired the funding support. J.T. and K.A. supplied the on-site data and verified the model in the on-site test.
Funding
This research was funded by the Graduate Technology Innovation Foundation of Shandong University of Science and Technology (Grant No. SDKDYC180102) and the open found research project of State Key Laboratory Breeding Base for Mining Disaster Prevention and Control (Grant No. MDPC201812). The authors are grateful for their support.
Conflicts of Interest
The authors declare no conflict of interest.
References
- Wang, X.; Wang, M.; Zhang, M. Theoretical and experimental study of external water pressure on tunnel lining in controlled drainage under high water level. Tunn. Undergr. Space Technol. 2008, 23, 552–560. [Google Scholar] [CrossRef]
- Arjnoi, P.; Jeong, J.H.; Kim, C.Y.; Park, K.H. Effect of drainage conditions on porewater pressure distributions and lining stresses in drained tunnels. Tunn. Undergr. Space Technol. 2009, 24, 376–389. [Google Scholar] [CrossRef]
- Zingg, S.; Anagnostou, G. An investigation into efficient drainage layouts for the stabilization of tunnel faces in homogeneous ground. Tunn. Undergr. Space Technol. 2016, 58, 49–73. [Google Scholar] [CrossRef]
- Sun, W.; Zhang, S.; Guo, W. Physical simulation of high-pressure water inrush through the floor of a deep mine. Mine Water Environ. 2017, 36, 542–549. [Google Scholar] [CrossRef]
- Li, D.Y.; Li, X.B.; Charlie, C.L. Case studies of groundwater flow into tunnels and an innovative water-gathering system for water drainage. Tunn. Undergr. Space Technol. 2009, 24, 260–268. [Google Scholar] [CrossRef]
- Zhang, S.; Guo, W.; Li, Y. Experimental simulation of fault water inrush channel evolution in a coal mine floor. Mine Water Environ. 2017, 36, 443–451. [Google Scholar] [CrossRef]
- Kucuk, K.; Genis, M.; Onargan, T.; Aksoy, C.O.; Guney, A.; Altındag, R. Chemical injection to prevent building damage induced by groundwater drainage from shallow tunnels. Int. J. Rock Mech. Min. Sci. 2009, 46, 1136–1143. [Google Scholar] [CrossRef]
- Piotrowski, J.A. Subglacial hydrology in north-western Germany during the last glaciation: Groundwater flow, tunnel valleys and hydrological cycles. Quat. Sci. Rev. 1997, 16, 169–185. [Google Scholar] [CrossRef]
- Maleki, M.R. Groundwater Seepage Rate (GSR). a new method for prediction of groundwater inflow into jointed rock tunnels. Tunn. Undergr. Space Technol. 2018, 71, 505–517. [Google Scholar] [CrossRef]
- Lee, S.W.; Jung, J.W.; Nam, S.W.; Lee, I.M. The influence of seepage forces on ground reaction curve of circular opening. Tunn. Undergr. Space Technol. 2007, 21, 28–38. [Google Scholar] [CrossRef]
- Polubarinova-Kochina, P.Y. Russian Translation. (Book Reviews: Theory of Ground Water Movement). Science 1963, 139, 820–821. [Google Scholar] [CrossRef]
- Sundaram, P.N.; Goodman, R.E.; Wang, C.Y. Precursory and coseismic water-pressure variations in stick-slip experiments. Geology 1976, 4, 108–110. [Google Scholar] [CrossRef]
- Freeze, R.A.; Witherspoon, P.A. Theoretical analysis of regional groundwater flow: 2. Effect of water-table configuration and subsurface permeability variation. Water Resour. Res. 1967, 3, 623–634. [Google Scholar] [CrossRef]
- Custodio, E.; Galofre, A. Hidráulica de captaciones de agua subterránea. Hidrología Subterránea 1983, 2, 91–99. [Google Scholar]
- Zhang, L.; Franklin, J.A. Prediction of water flow into rock tunnels: An analytical solution assuming an hydraulic conductivity gradient. Int. J. Rock Mech. Min. Sci. 1993, 30, 37–46. [Google Scholar] [CrossRef]
- Lei, S. An analytical solution for steady flow into a ttonnel. Groundwater 1999, 37, 23–26. [Google Scholar] [CrossRef]
- Toth, J. A theoretical analysis of groundwater flow in small drainage basins. J. Geophys. Res. 1963, 68, 4795–4812. [Google Scholar] [CrossRef]
- Battermann, A.; Gablonsky, J.M.; Patrick, A. Solution of a groundwater control problem with implicit filtering. Optim. Eng. 2002, 3, 189–199. [Google Scholar] [CrossRef]
- Davis, G.M.; Horswill, P. Groundwater control and stability in an excavation in Magnesian Limestone near Sunderland, NE England. Eng. Geol. 2002, 66, 1–18. [Google Scholar] [CrossRef]
- Fahimifar, A.; Zareifard, M.R. A new elasto-plastic solution for analysis of underwater tunnels considering strain-dependent permeability. Struct. Infrastruct. Eng. 2014, 10, 1432–1450. [Google Scholar] [CrossRef]
- Cesano, D.; Bagtzoglou, A.C.; Olofsson, B. Quantifying fractured rock hydraulic heterogeneity and groundwater inflow prediction in underground excavations: The heterogeneity index. Groundwater 2003, 18, 19–34. [Google Scholar] [CrossRef]
- Perrochet, P.; Dematteis, A. Modeling transient discharge into a tunnel drilled in a heterogeneous formation. Groundwater 2007, 45, 786–790. [Google Scholar] [CrossRef] [PubMed]
- Hwang, J.H.; Lu, C.C. A semi-analytical method for analyzing the tunnel water inflow. Tunn. Undergr. Space Technol. 2007, 22, 39–46. [Google Scholar] [CrossRef]
- Park, K.H.; Owatsiriwong, A.; Lee, J.G. Analytical solution for steady-state groundwater inflow into a drained circular tunnel in a semi-infinite aquifer: A revisit. Tunn. Undergr. Space Technol. 2008, 23, 206–209. [Google Scholar] [CrossRef]
- Mohamed, E.T. Circular tunnel in a semi-infinite aquifer. Tunn. Undergr. Space Technol. 2003, 18, 49–55. [Google Scholar] [CrossRef]
- Kolymbas, D.; Wagner, P. Groundwater ingress to tunnels–the exact analytical solution. Tunn. Undergr. Space Technol. 2007, 22, 23–27. [Google Scholar] [CrossRef]
- Lee, I.M.; Nam, S.W.; Ahn, J.H. Effect of seepage forces on tunnel face stability. Can. Geotech. J. 2003, 40, 342–350. [Google Scholar] [CrossRef]
- Shin, J.H.; Potts, D.M.; Zdravkovic, L. The effect of pore-water pressure on NATM tunnel linings in decomposed granite soil. Can. Geotech. J. 2005, 42, 1585–1599. [Google Scholar] [CrossRef]
- Huangfu, M.; Wang, M.S.; Tan, Z.S.; Wang, X.Y. Analytical solutions for steady seepage into an underwater circular tunnel. Tunn. Undergr. Space Technol. 2010, 25, 391–396. [Google Scholar] [CrossRef]
- Carranza, T.C.; Zhao, J. Analytical and numerical study of the effect of water pressure on the mechanical response of cylindrical lined tunnels in elastic and elasto-plastic porous media. Int. J. Rock Mech. Min. Sci. 2009, 46, 531–547. [Google Scholar] [CrossRef]
- Fahimifar, A.; Zareifard, M.R. A theoretical solution for analysis of tunnels below groundwater considering the hydraulic–mechanical coupling. Tunn. Undergr. Space Technol. 2009, 24, 634–646. [Google Scholar] [CrossRef]
- Shin, Y.J.; Song, K.I.; Lee, I.M.; Cho, G.C. Interaction between tunnel supports and ground convergence—Consideration of seepage forces. Int. J. Rock Mech. Min. Sci. 2011, 48, 394–405. [Google Scholar] [CrossRef]
- Nam, S.W.; Bobet, A. Liner stresses in deep tunnels below the water table. Tunn. Undergr. Space Technol. 2006, 21, 626–635. [Google Scholar] [CrossRef]
- Itasca. FLAC3D Software Version 5.01, Advanced Three Dimensional Continuum Modelling for Geotechnical Analysis of Rock, Soil and Structural Support. In User’s Manual 2015. Available online: http://www.itasca.co.uk/sites/itascacg.com/files/ICG13-BRO-FLAC3D-501-101.pdf (accessed on 2 September 2018).
Figure 1.
The location of Hokusatsu highway.

Figure 2.
The location of leakage tunnel.

Figure 3.
Simplified geological profile along the tunnel axis.

Figure 4.
Leakage problems during the tunnel excavation: (a) Sudden water inrush during tunneling; (b) Groundwater inflow and water drops; (c) Gushing water in the tunnel.
Figure 4.
Leakage problems during the tunnel excavation: (a) Sudden water inrush during tunneling; (b) Groundwater inflow and water drops; (c) Gushing water in the tunnel.

Figure 5.
The sketch of the simulation model.

Figure 6.
Case marks.

Figure 7.
Failure zones of the surrounding rock from stage 1 to stage 6. In this figure, None: no-failure zone; Shear-n: the region failed under shear loading and failure process is still in progress; Shear-p: the region failed under shear loading and failure process is ceased due to lowered amount of shear forces; Tension-n: the region failed under tensile loading and failure process is still in progress; Tension-p: the region failed under tensile loading and failure process is ceased due to lowered amount of tensile forces.

Figure 8.
Failure zones comparison from stage 7 to stage 9. (a) Failure zones in stage 7; (b) Failure zones in stage 9.
Figure 8.
Failure zones comparison from stage 7 to stage 9. (a) Failure zones in stage 7; (b) Failure zones in stage 9.


Figure 9.
Comparison of pore pressure distributions along the horizontal direction. (a) Observed location; (b) simulation results.
Figure 9.
Comparison of pore pressure distributions along the horizontal direction. (a) Observed location; (b) simulation results.

Figure 10.
Stress distribution in a horizontal line. (a) The total stress in Case 1; (b) the total stress in Case 0; (c) the effective stress in Case 1; (d) the effective stress in Case 0. (Sig1: the major principal stress; Sig3: the minor principal stress.)
Figure 10.
Stress distribution in a horizontal line. (a) The total stress in Case 1; (b) the total stress in Case 0; (c) the effective stress in Case 1; (d) the effective stress in Case 0. (Sig1: the major principal stress; Sig3: the minor principal stress.)
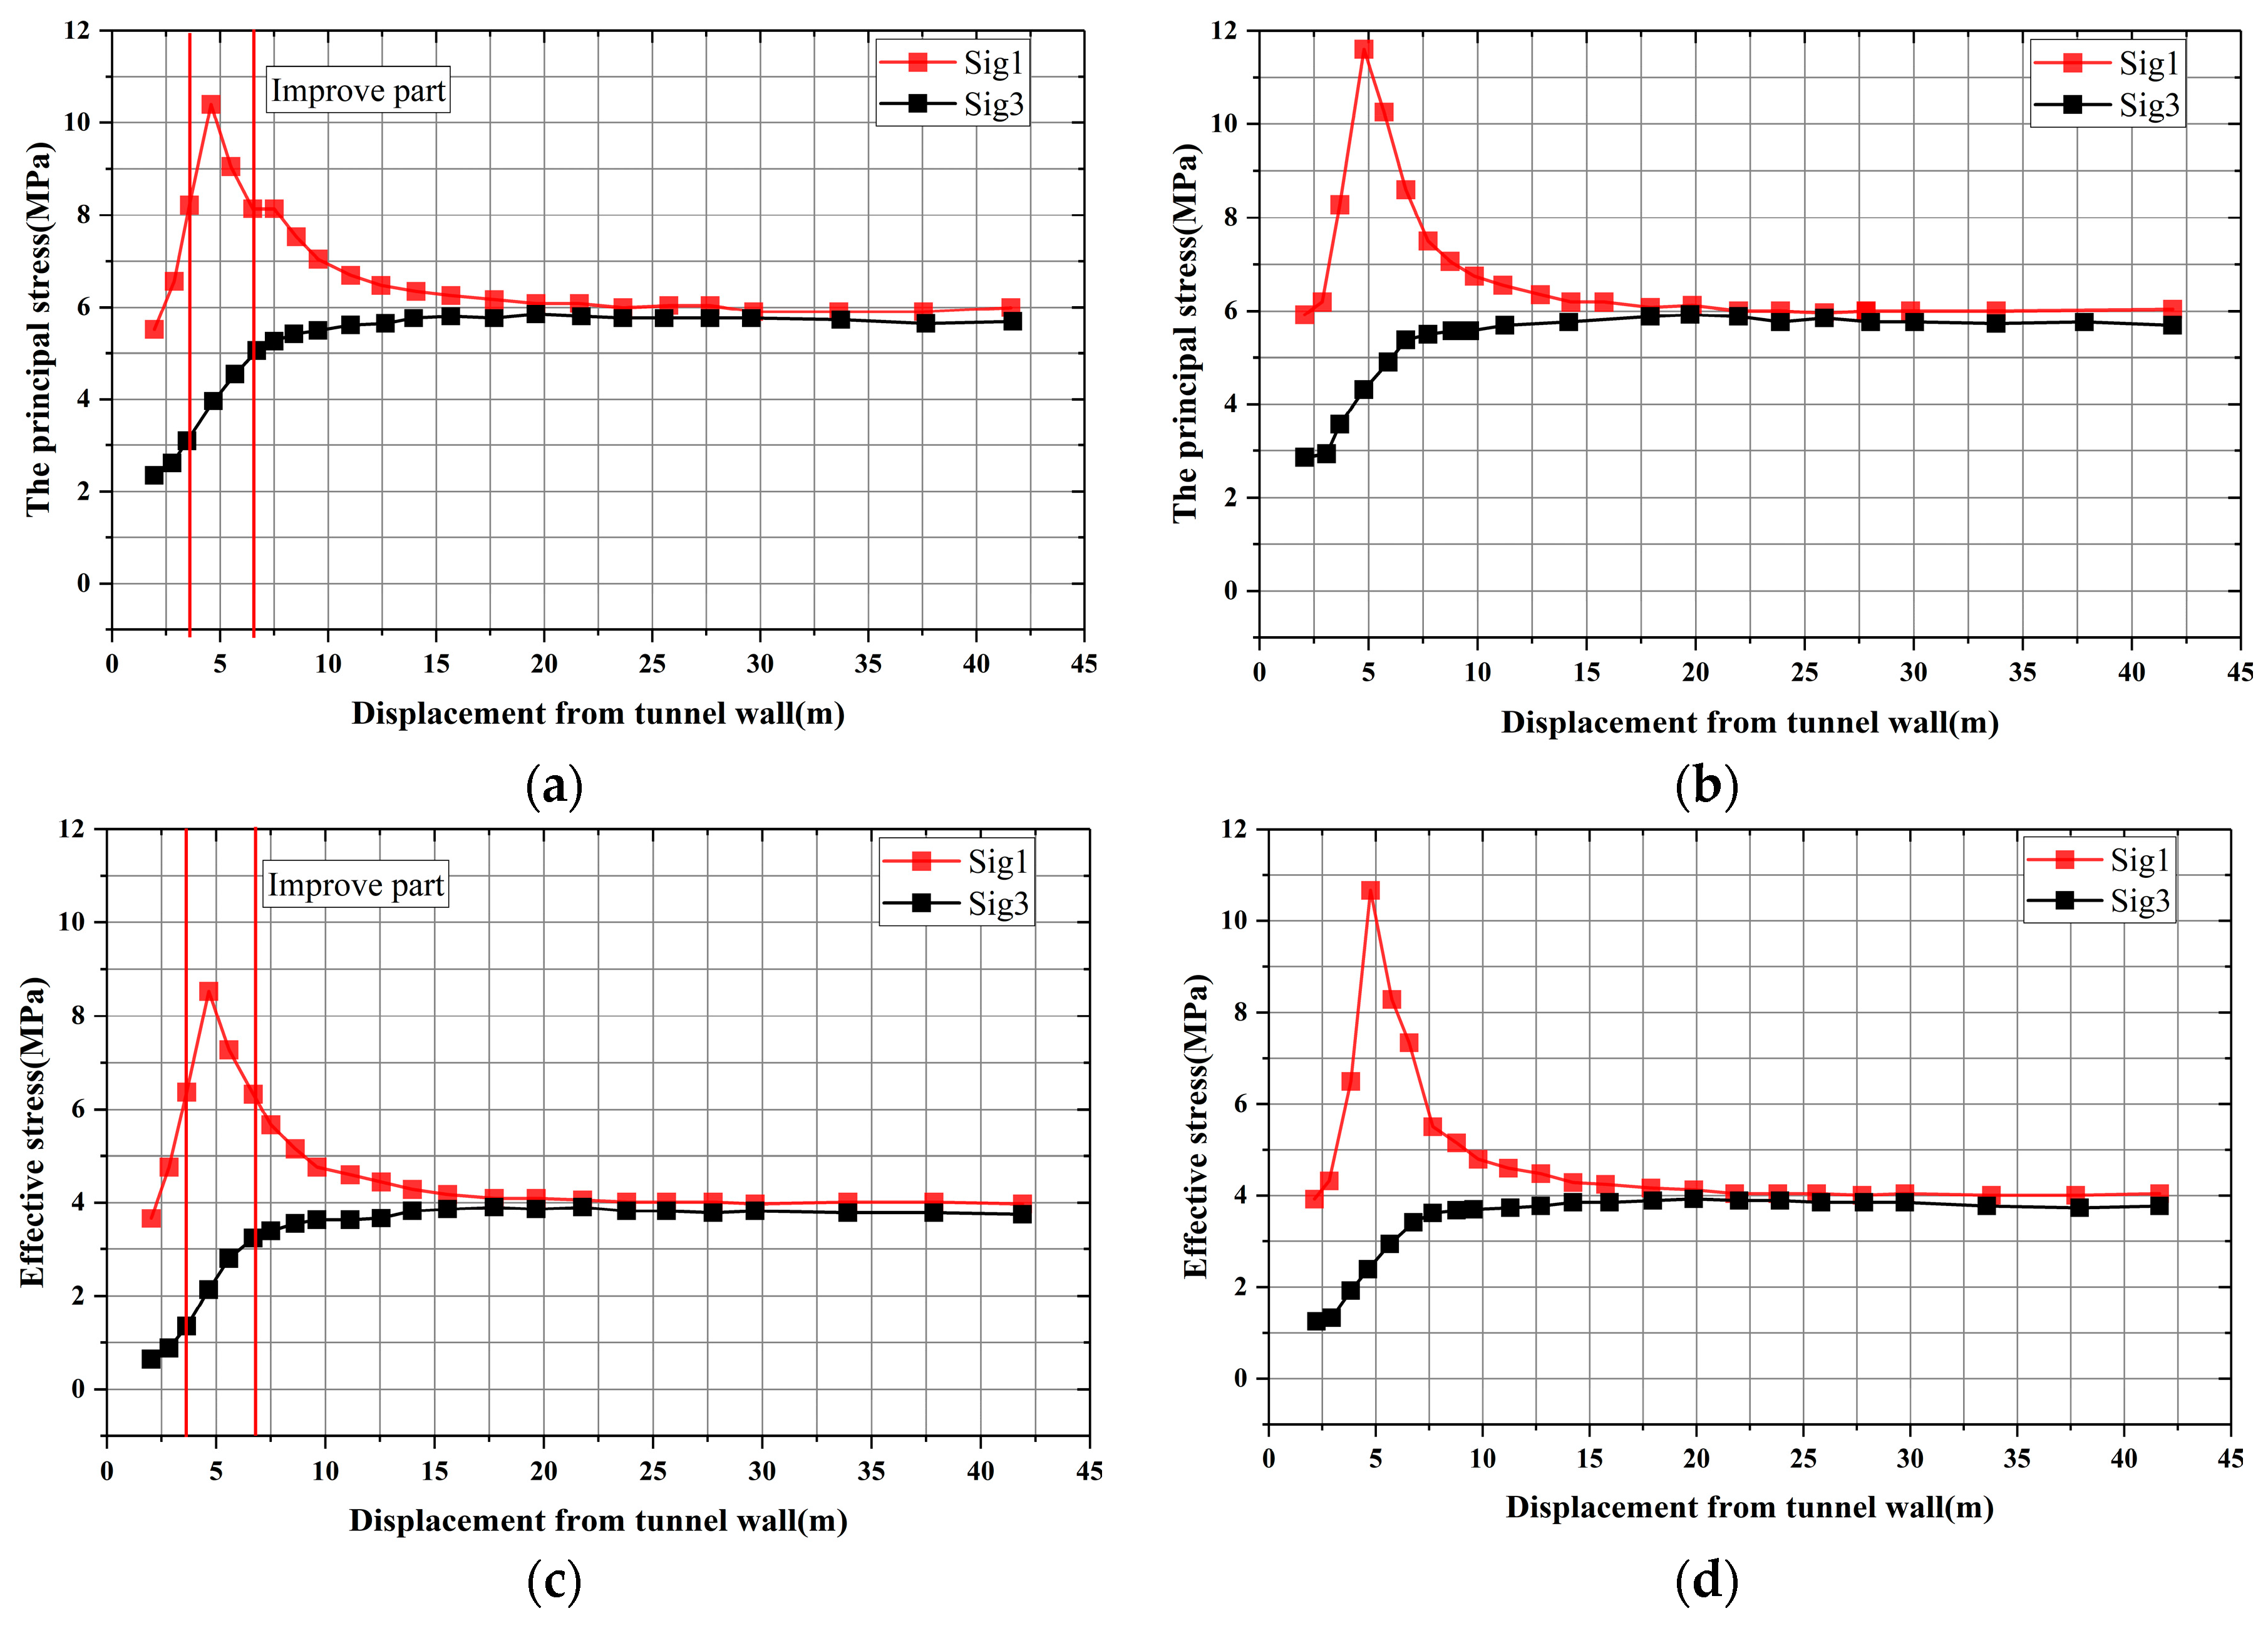
Figure 11.
Comparison of pore pressure distributions along the vertical direction. (a) Observed location; (b) simulation results.
Figure 11.
Comparison of pore pressure distributions along the vertical direction. (a) Observed location; (b) simulation results.

Figure 12.
Stress distribution in horizontal line. (a) The principal stress in Case 1; (b) the effective stress in Case 0; (c) the principal stress in Case 1; (d) the effective stress in Case 0.
Figure 12.
Stress distribution in horizontal line. (a) The principal stress in Case 1; (b) the effective stress in Case 0; (c) the principal stress in Case 1; (d) the effective stress in Case 0.
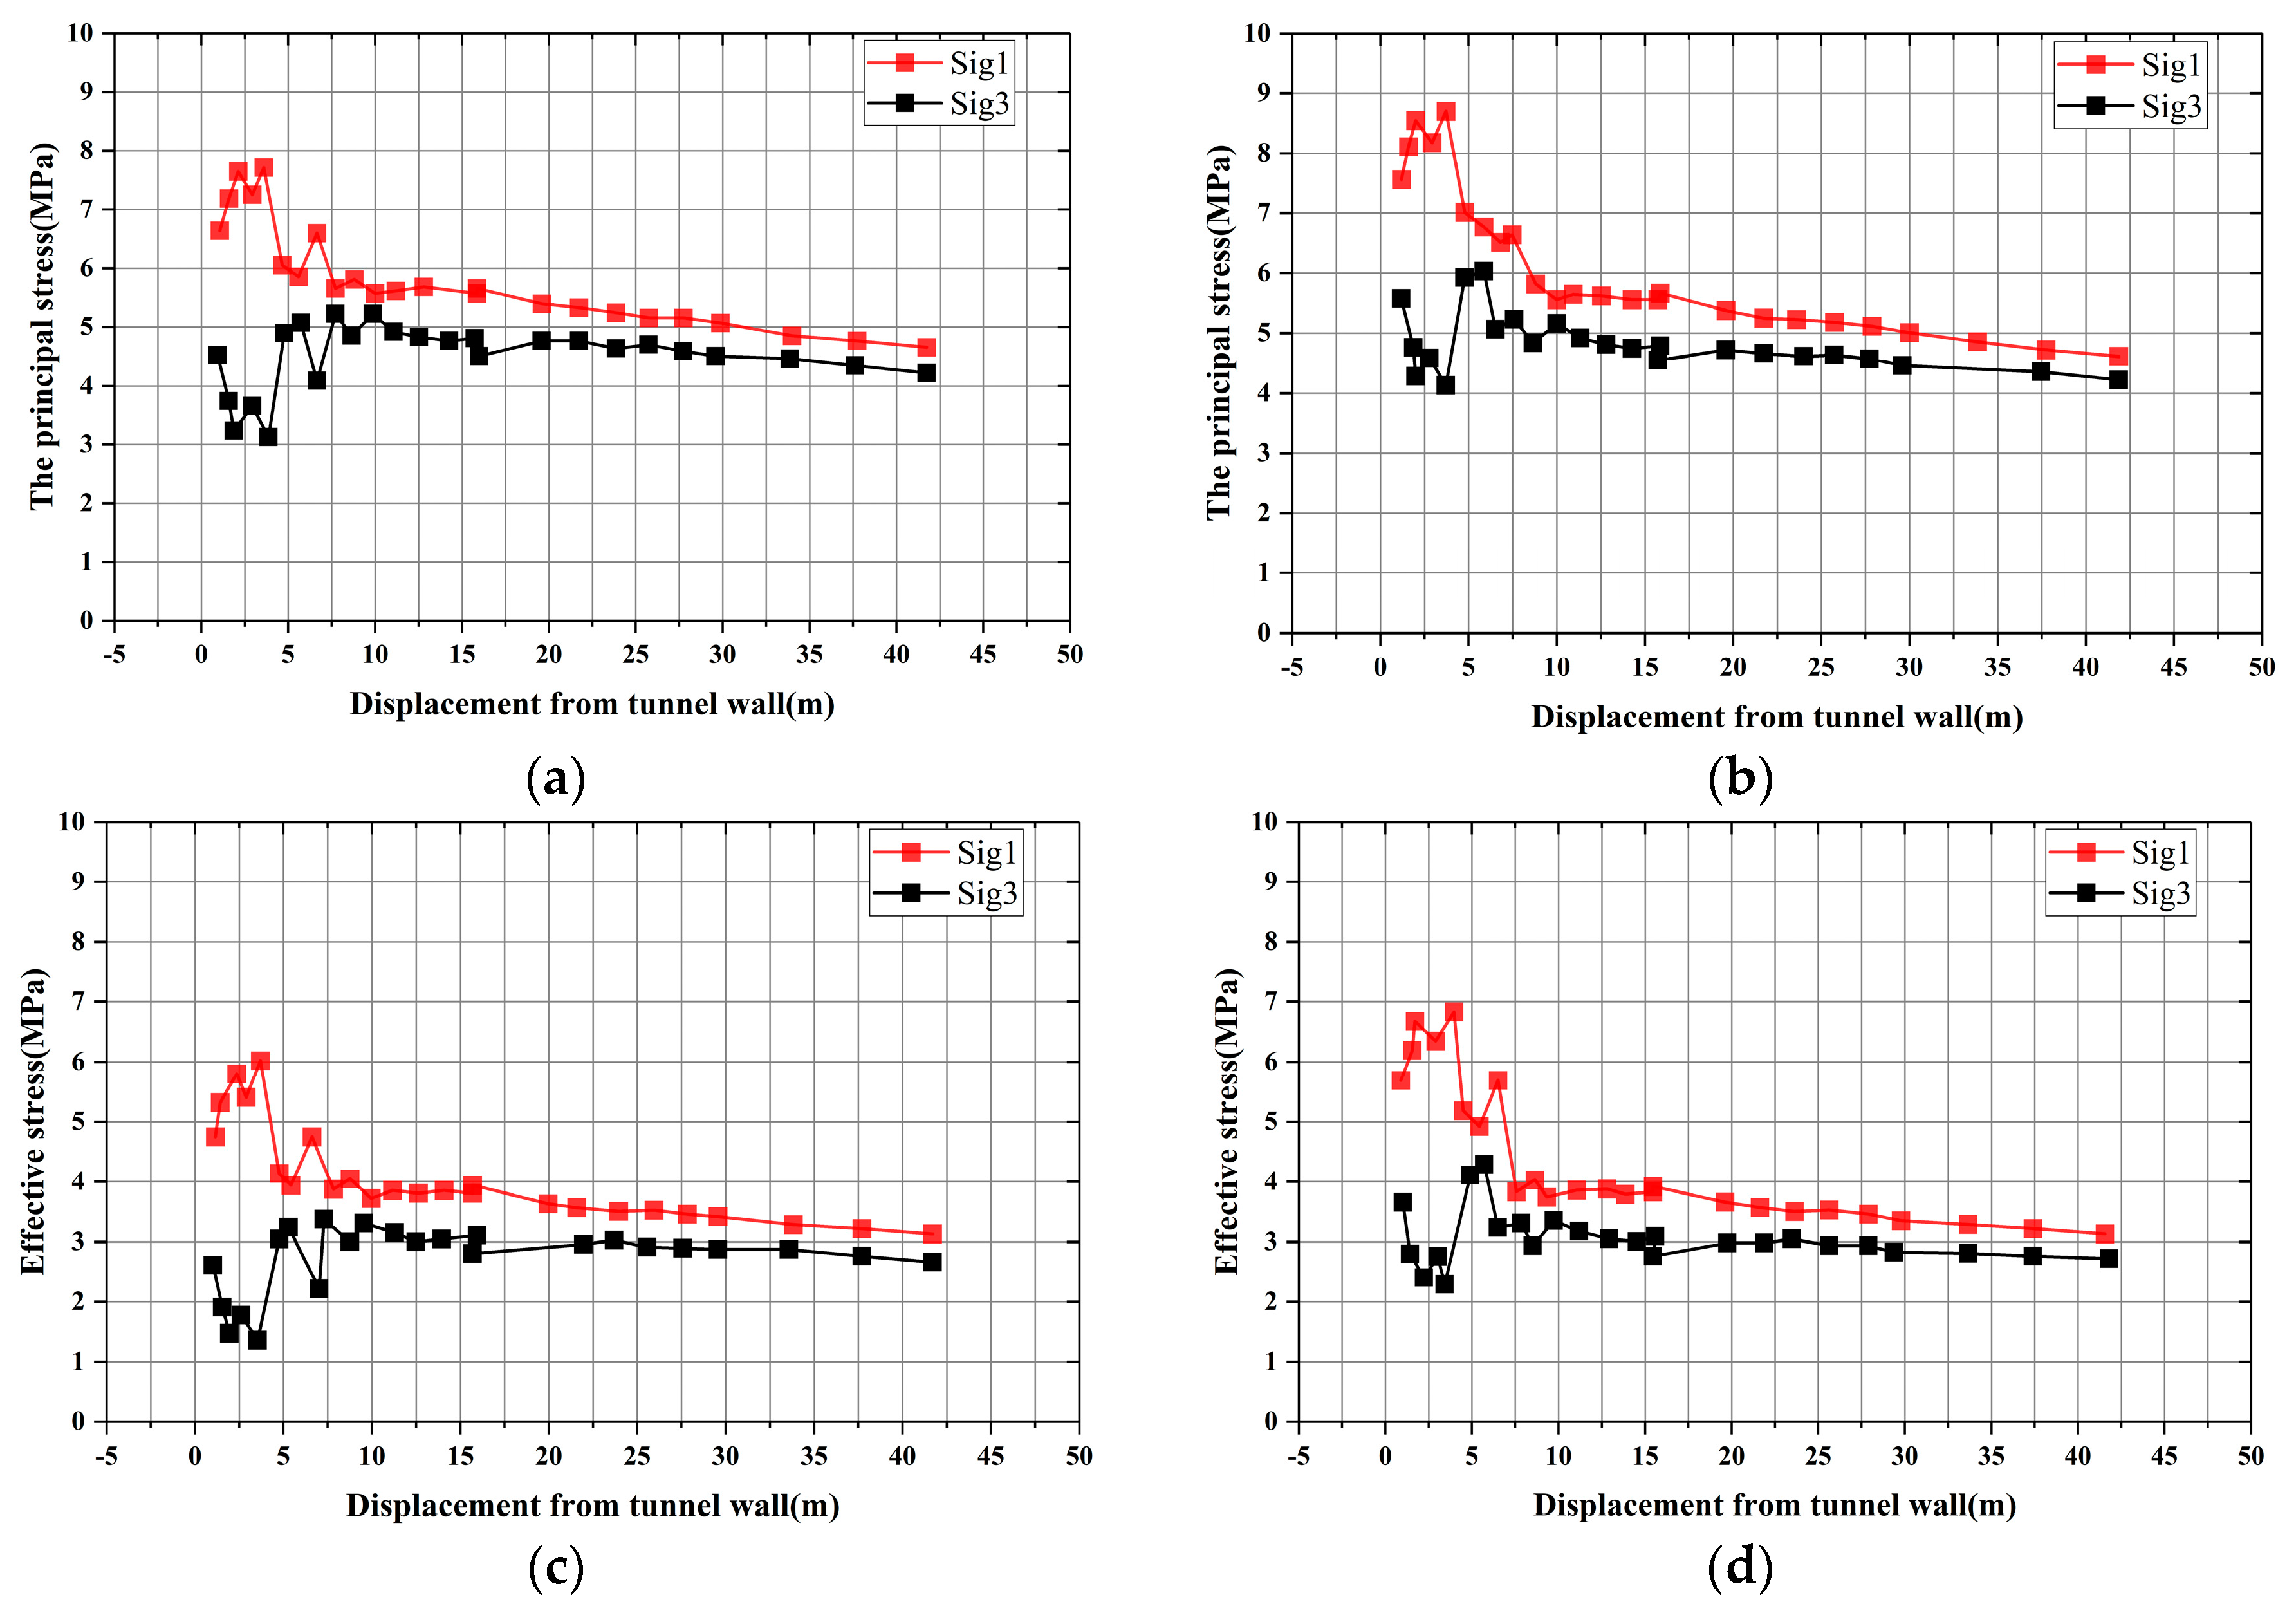
Figure 13.
The minor principal stress of the roof. (a) Monitoring points plot; (b) the displacement of the roof; (c) the support stress of the bench; (d) the support stress of the invert.
Figure 13.
The minor principal stress of the roof. (a) Monitoring points plot; (b) the displacement of the roof; (c) the support stress of the bench; (d) the support stress of the invert.

Figure 14.
The minor principal stress. (a) Monitoring lining points plot; (b) the minor principal stress of the roof; (c) the minor principal stress of the foot.
Figure 14.
The minor principal stress. (a) Monitoring lining points plot; (b) the minor principal stress of the roof; (c) the minor principal stress of the foot.

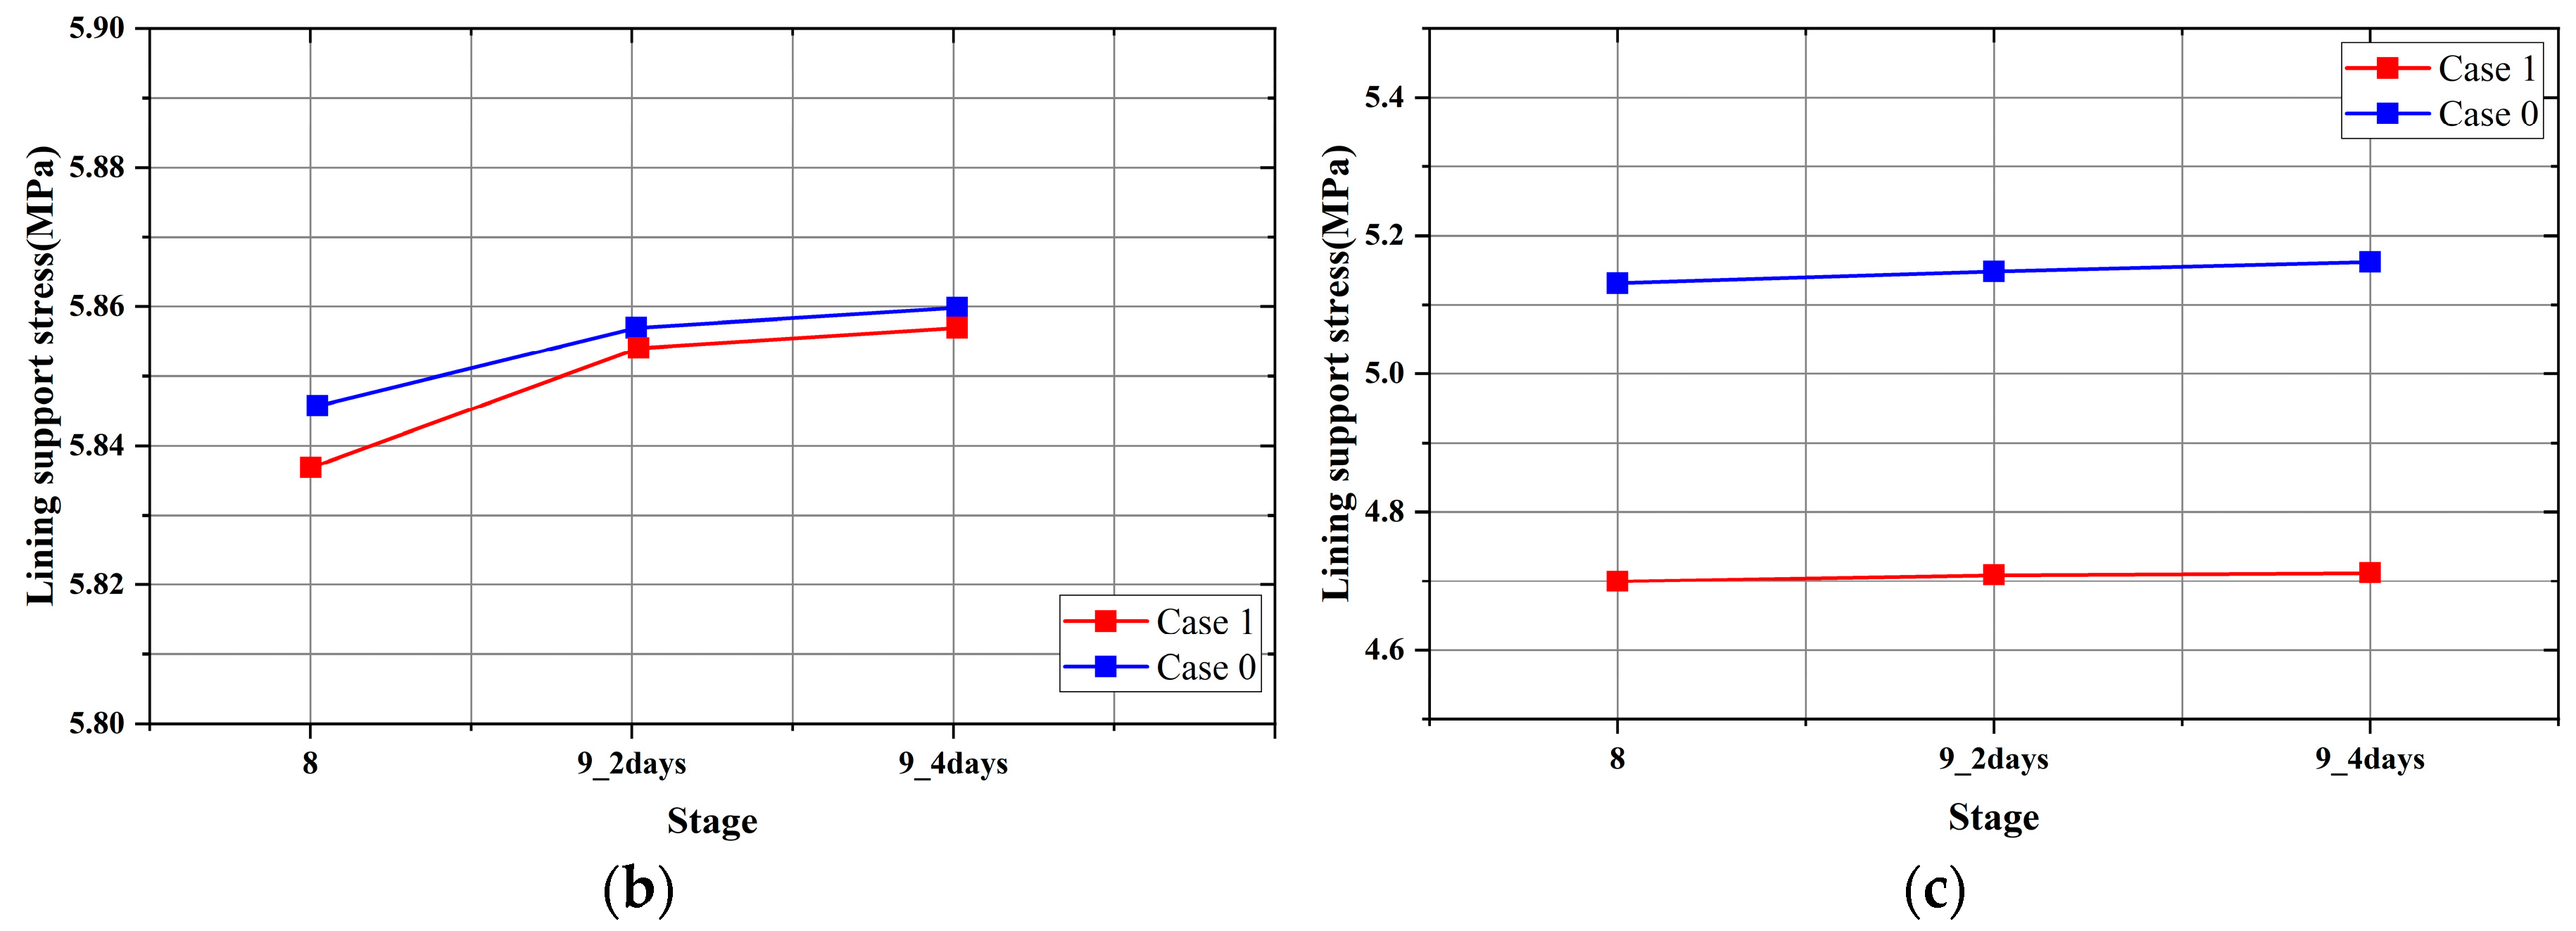
Figure 15.
The displacement of supporting structures. (a) Monitoring lining points plot; (b) horizontal displacement of the bench; (c) relative vertical displacement changes.
Figure 15.
The displacement of supporting structures. (a) Monitoring lining points plot; (b) horizontal displacement of the bench; (c) relative vertical displacement changes.
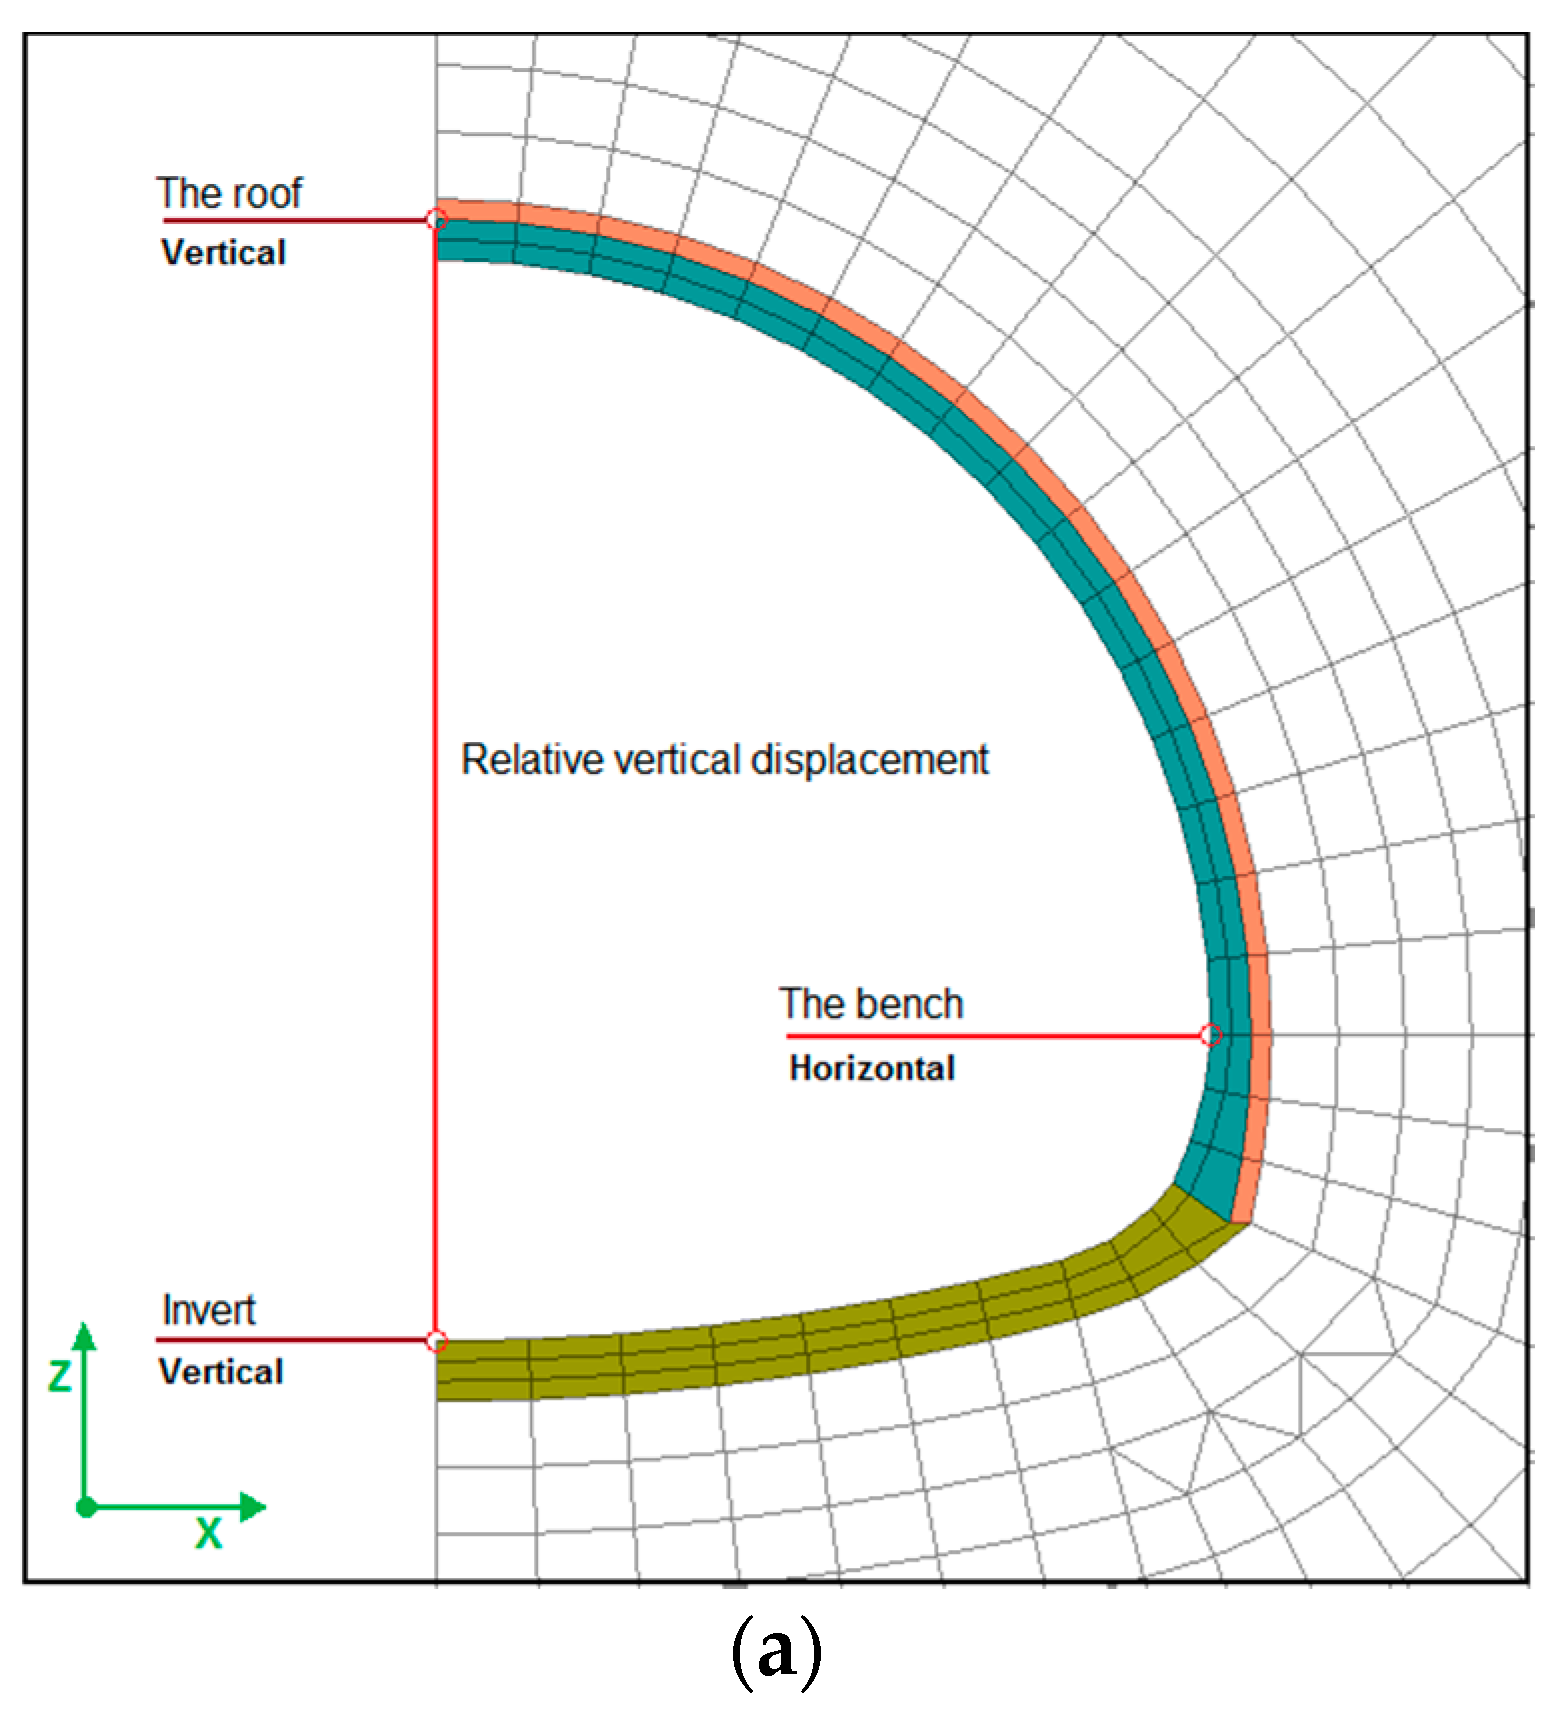

Figure 16.
The schematic diagram of the multiple times grouting in the on-site test. (a) Grouting bolts layout; (b) grouting rendering.
Figure 16.
The schematic diagram of the multiple times grouting in the on-site test. (a) Grouting bolts layout; (b) grouting rendering.

Figure 17.
The effect of the new grouting method. (a) The grouting process; (b) the effect after grouting.
Figure 17.
The effect of the new grouting method. (a) The grouting process; (b) the effect after grouting.

Table 1.
The input parameters regarding rock mass used in numerical modeling.
| Rock | Improve | |
|---|---|---|
| Modulus of Elasticity (GPa) | 1000 | |
| Poisson’s ratio | 0.4 | |
| Density (kN/m3) | 27 | |
| Cohesion (MPa) | 0.4 | |
| Friction angle (deg) | 35 | |
| Porosity | 0.2 | |
| Permeability (cm/sec) | 4 × 10⁻⁴ | 4 × 10⁻⁶ |
Table 2.
The input parameters regarding the liner used in numerical modeling.
| Shotcrete Layer | Lining Invert | Beam | Rock Bolts | |
|---|---|---|---|---|
| Modulus of Elasticity (MPa) | 4000 22,000 (hardened) | 22,000 | 200,000 | 210,000 |
| Poisson’s ratio | 0.2 | 0.2 | 0.3 | – |
| Thickness (m) | 0.15 | 0.3 | – | – |
| Permeability (cm/sec) | 4 × 10⁻⁸ | 4 × 10⁻⁸ | – | – |
| Sectional area (m2) | – | – | 30 × 10−4 | 3.0 × 10⁻⁴ |
| Second axial moment of area (m4) | – | – | 839 × 10−8 | – |
Table 3.
The simulation procedure.
| Summary | Calculation Mode | Content | |
|---|---|---|---|
| Stage 1 | Initial equilibrium | – | Calculation for the stress distribution of surrounding rock before excavation. |
| Stage 2 | Top heading excavation | Mechanical | Excavation for the top heading of the tunnel and release of the stress by 40%. |
| Stage 3 | Top heading drainage | Hydraulic–mechanical coupling | The pore pressure along the top heading is set to 0 MPa, the model begins to discharge (4 days) 2. |
| Stage 4 | Shotcrete Steel support | Mechanical | Shotcrete layer and set steel support (beam, rock bolt) 1, release the stress by 100%. |
| Stage 5 | Lower bench excavation | Mechanical | Excavation for the lower bench and release the stress of the invert part by 40%. |
| Stage 6 | Invert installation | Mechanical | Invert installation and release the stress of the invert by 100%. |
| Stage 7 | Improve installation | Hydraulic–mechanical coupling | Discharge the groundwater (8 days) and initiate improve part. |
| Stage 8 | Liner installation | Mechanical | Liner installation. |
| Stage 9 | Steady state | Hydraulic–mechanical coupling | The coupled, drained simulation is executed until the steady-state condition was reached for each case (4 days) 2. |
1. In stage 4, simulation for the tunnel steel support. 2. In stage 3, stage 9, groundwater discharge into tunnels through the tunnel excavation circumambient face, different draining surface in each step.
© 2018 by the authors. Licensee MDPI, Basel, Switzerland. This article is an open access article distributed under the terms and conditions of the Creative Commons Attribution (CC BY) license (http://creativecommons.org/licenses/by/4.0/).
Share and Cite
MDPI and ACS Style
Gong, B.; Jiang, Y.; Okatsu, K.; Wu, X.; Teduka, J.; Aoki, K. The Seepage Control of the Tunnel Excavated in High-Pressure Water Condition Using Multiple Times Grouting Method. Processes 2018, 6, 159. https://doi.org/10.3390/pr6090159
AMA Style
Gong B, Jiang Y, Okatsu K, Wu X, Teduka J, Aoki K. The Seepage Control of the Tunnel Excavated in High-Pressure Water Condition Using Multiple Times Grouting Method. Processes. 2018; 6(9):159. https://doi.org/10.3390/pr6090159
Chicago/Turabian StyleGong, Bin, Yujing Jiang, Keisuke Okatsu, Xuezhen Wu, Jin Teduka, and Koichi Aoki. 2018. "The Seepage Control of the Tunnel Excavated in High-Pressure Water Condition Using Multiple Times Grouting Method" Processes 6, no. 9: 159. https://doi.org/10.3390/pr6090159
Note that from the first issue of 2016, this journal uses article numbers instead of page numbers. See further details here.