1. Introduction. A Framework for the Energy Efficiency Improvement
Manufacturing companies, and process plants within them, can define their strategies and competitive priorities on different key performance indicators for their production systems: flexibility, productivity, quality, but also safety, environmental protection, and energy efficiency.
Maintenance is fundamental in assuring the availability and reliability of production facilities; thus, if Companies design proper maintenance policies—which are a set of rules describing the triggering mechanism for the different maintenance actions—they could more easily reach their productivity goals and guarantee plants efficiency. Complex process plants contain several major-energy consuming equipment, and thus offer multiple opportunities for energy saving, that Worrell et al. [
1] linked to a significant boost to the overall industrial productivity, as demonstrated by the review of more than 70 industrial case studies. As stated in [
2], evidences suggest that energy efficiency measures imply improvements in economic performances.
To gain the above discussed benefits, most of all for plants where the energy efficiency policy is still under development, it is important to define a prioritization criterion for the multiple energy efficiency measures that could be identified, leading to a maximization of the implemented measures efficacy.
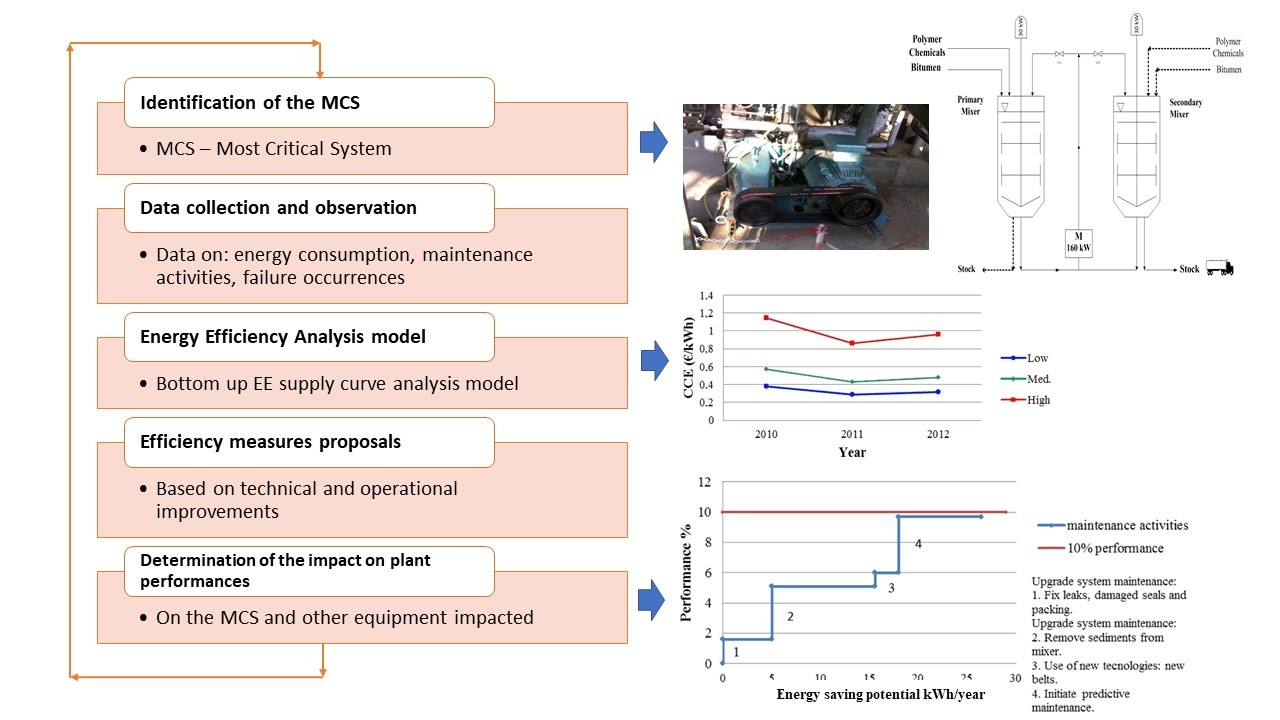
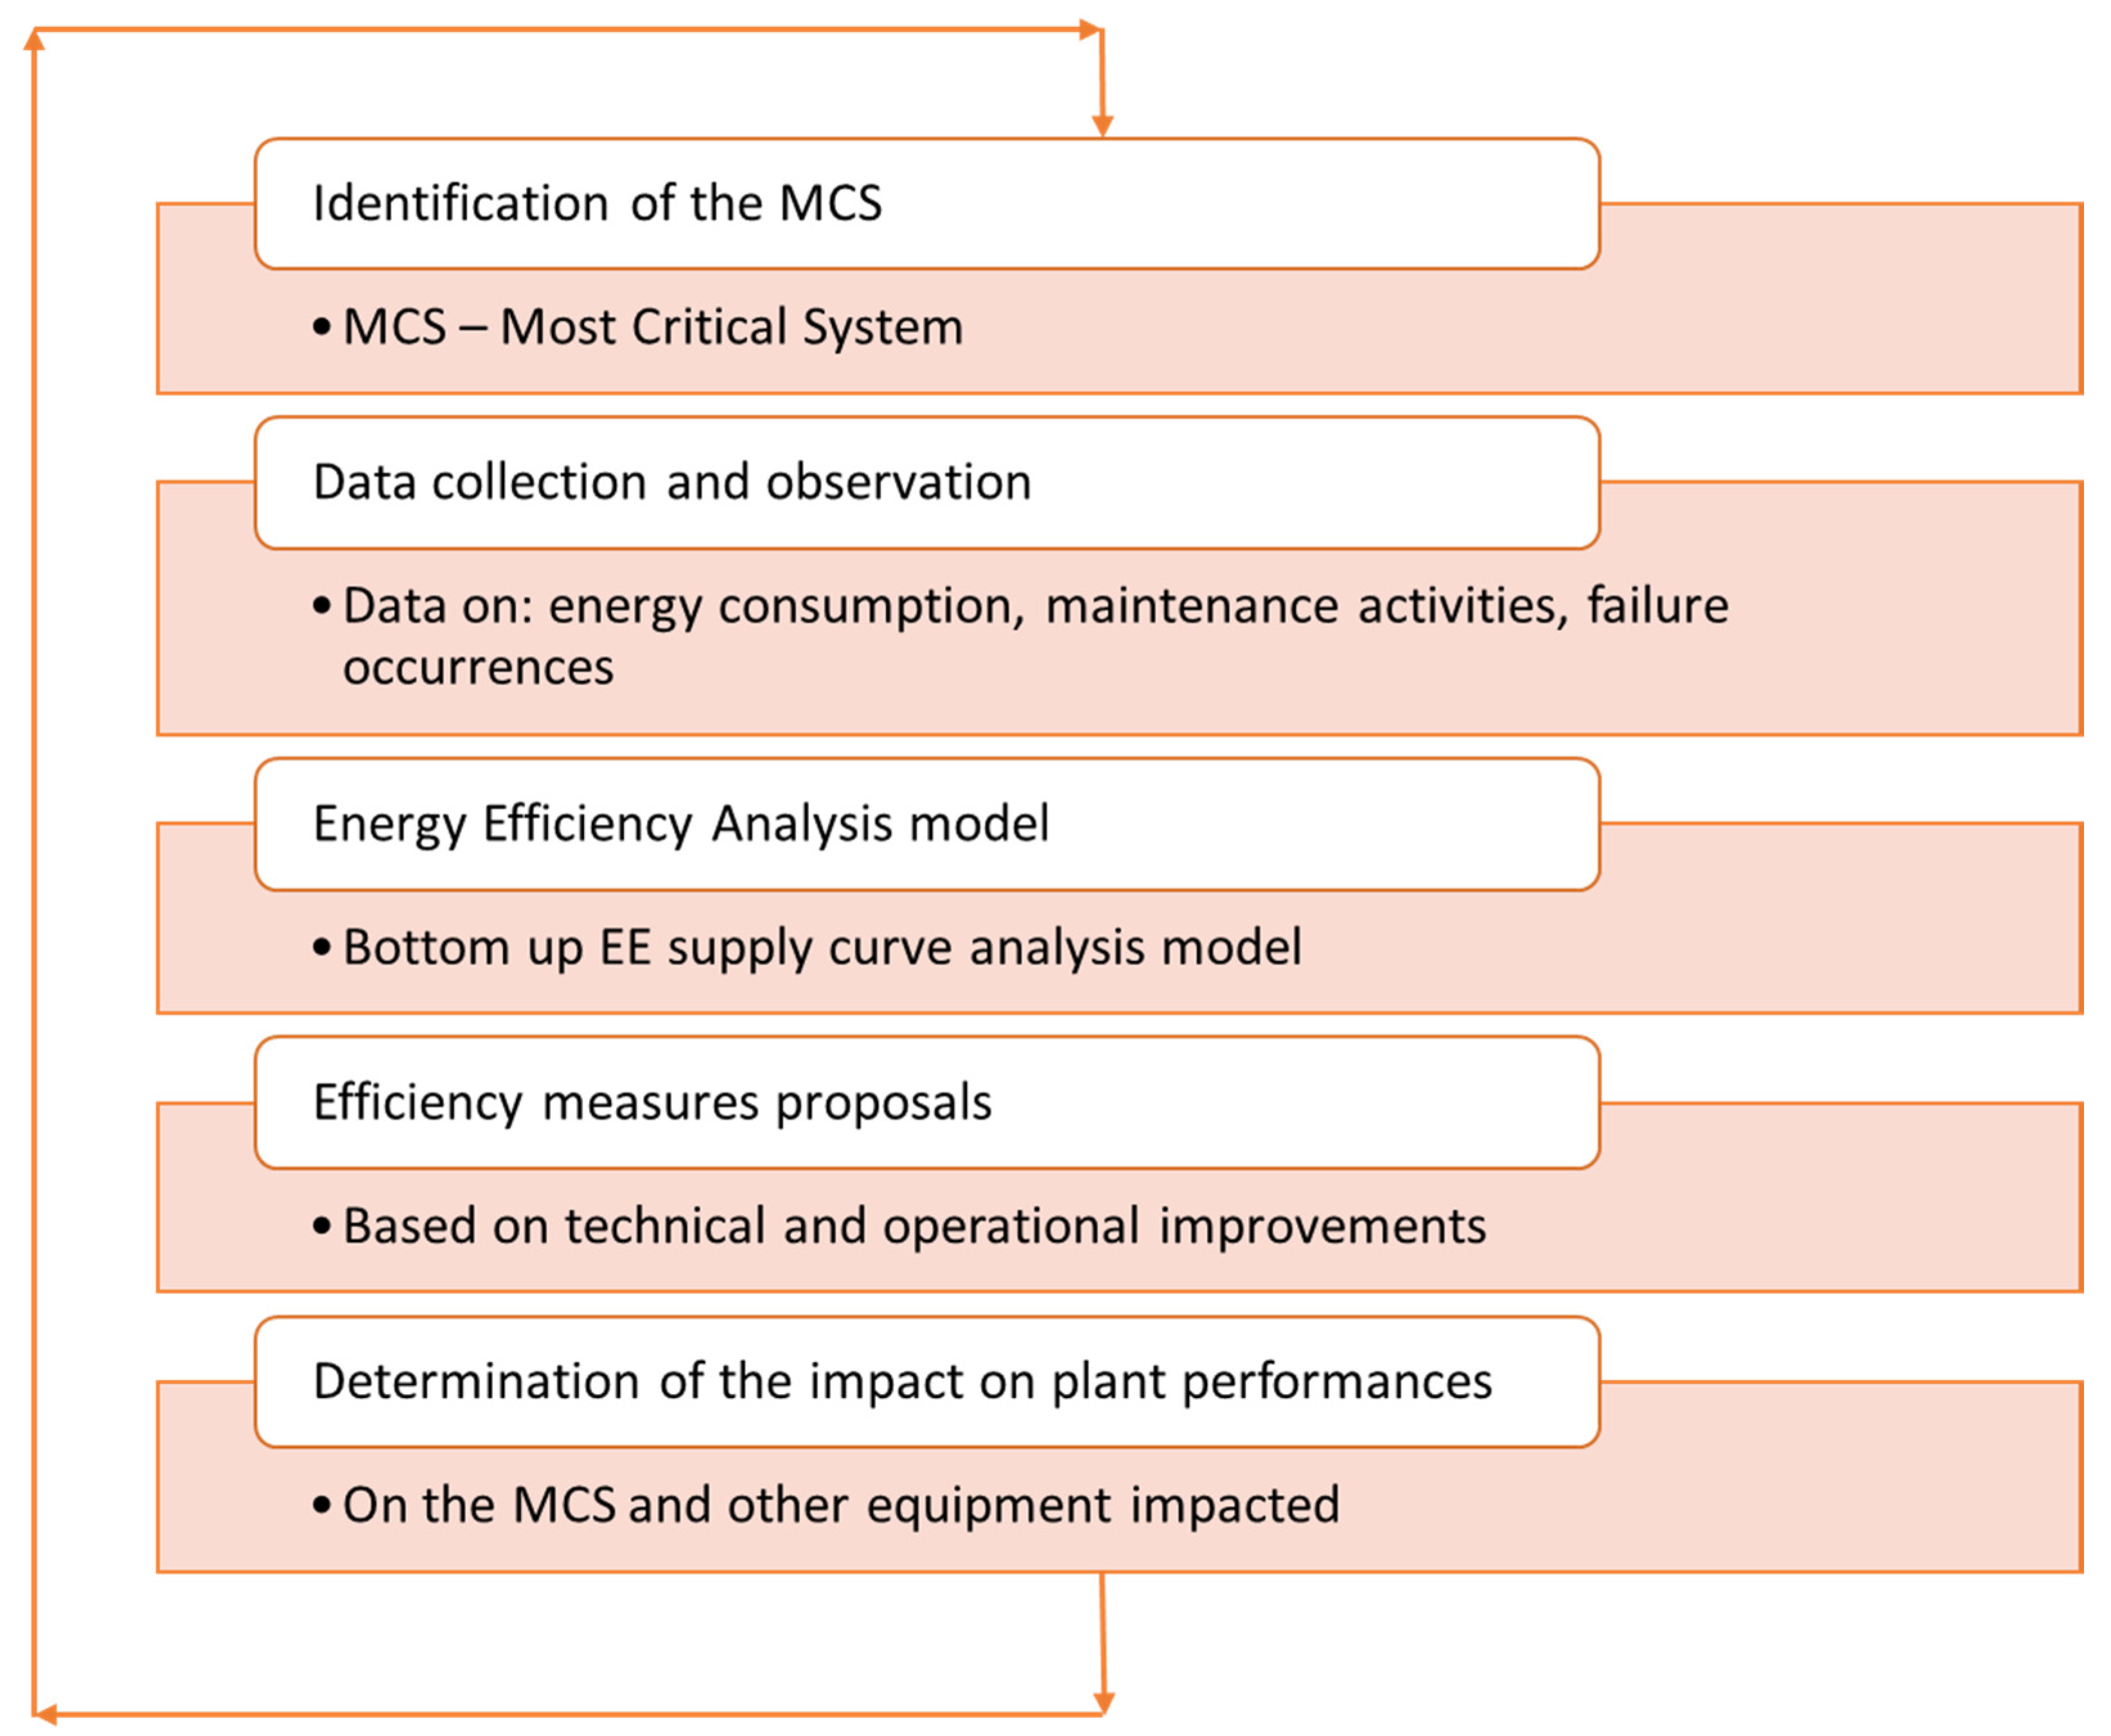
In this paper, a framework is proposed (
Figure 1) that is able to guide plant technicians in initiating and following up this course, through the exploitation of the full set of information available in the plant.
The scheme in
Figure 1 can be summarized as follows:
Identification of the most critical system. Depends on the energy consumed by the single equipment or system.
Data collection and observation. Lifetime observation and data collection about energy consumption, corrective and preventive maintenance activities, and failures occurrence. It includes the maintenance costs estimation, the economic evaluation of maintenance policies, and the estimation of the operating costs of the system.
Energy Efficiency model. Analysis of the energy efficiency benefits, using an energy efficiency model, as further discussed in
Section 2.
Efficiency measures proposal. Definition of scenarios and efficiency measures.
Determination of the impact of the proposed measures on the performance of the plant, when considering both the equipment under analysis and other pieces of equipment or systems that could be affected by the measures implemented.
The analysis is then reiterated for all the energy critical systems of the plant.
Points D. and E. will be detailed in
Section 3, while
Section 4 will demonstrate the whole process through the application to a bituminous material process plant.
2. Energy Efficiency Models
Current analysis of energy consumption in process plants is mostly performed through process simulations, allowing for considering the effect of some factors affecting energy consumption, as operating conditions, raw materials, fuel, and yield [
3]. These methodologies require a huge amount of data and are recognized to be inefficient in speculating factors that affect energy consumption.
The same authors thus discussed different index analysis methods to analyze energy efficiency—as Data envelopment analysis (DEA), which gained great popularity in energy literature because it is a non-parametric approach dealing with multiple inputs and outputs that allow assessing relative energy efficiency [
4]. However, they were judge unable to produce a complete picture of the energy efficiency measures impact in terms of energy consumption, energy saving potential, and economical gain.
The proposed solution in [
3] is an integrated approach, which uses IDA—Index Decomposition Analysis [
5]—to analyze changes in energy consumption over time and energy saving potential method [
6], in order to highlight both the technological and the structure energy-saving potential. This approach was applied to an ethylene production case, identifying the improving measures for raw materials; however, it could not determine the specific improvement for the production structure. Furthermore, the application of the system appeared quite complex and data intensive.
A simpler approach is the CSC (Conservation Supply Curve), which assesses the cost effectiveness and the technical chances for energy efficiency. The energy conservation potential is shown as a function of the marginal CCE (Cost of Conserved Energy), and provides a clear visualization of energy efficiency.
CSCs were first introduced by Meier at Lawrence Berkeley National Laboratory [
7]. Later, they were used in various studies to capture energy efficiency potentials in different economic and industrial sectors [
8,
9,
10,
11,
12]. CSC was chosen for the purpose of the present analysis framework.
CCE allow for making explicit the impact of maintenance and productivity optimization on energy saving, according to Equations (1) and (2).
CCE is the cost of conserved energy for the energy efficiency measure in €/kWh, I is the capital cost in €, q is the capital recovery factor, y−1, M&O is the annual change in Maintenance and Operation costs in €/y, S is the annual energy saving in kWh/year, d is the discount rate, and n is the lifetime of the conservation measure, in y.
Maintenance and operations optimization can bring to a reduction in M&O, but also in capital costs, I, with an increased effect on CCE.
Three classes of costs compose the
M&
O factor: (i) Fixed operational costs; (ii) Variable operational costs; and, (iii) Unavailability costs [
13], as shown in Equation (3):
Fixed costs for Maintenance and Operation include plant operator’s wages, general and equipment maintenance costs, insurance and taxes. The variable part of M&O costs includes expenses that are dependent on the amount of production or on the equipment operation time. Both classes strictly depend on the maintenance policy of the process plant. Unavailability costs are related to the failure of the equipment and on the lack of production following the plant stop.
3. Energy Efficiency Measures Identification and Optimization
The procedure for the identification of the efficiency measures and their optimization on the basis of CCE is here described. With respect to literature methodologies, our research focused the attention not only on the technical measures to increase energy efficiency, but also on the effect of maintenance and operational management of the plant itself. Thus, it has to be considered that, depending on the initial level of maintenance policy and operational management, the energy recovery capabilities will change, decreasing at the increasing of the maintenance and operational management capacity of the company considered.
Three different base case scenarios—Low, Medium, and High—were hypothesized for energy efficiency, each of them with a decreasing potential energy recovery related to the optimization of maintenance activities and operating procedures, as in
Table 1.
The levels of efficiency base case scenarios, with their relative potential of electricity power recovery based on maintenance activities, are defined through expert opinion and data obtained from the literature.
In general terms,
Table 1 should be built for each piece of equipment or system to be considered for optimization, combining observable data with expert opinions to allow for developing energy efficiency supply curves.
The first step should be a literature review to gain an initial set of information, to be enriched with expert knowledge. The procedure could be summarized as follows:
- (1)
development of a baseline information from literature and technical data;
- (2)
energy audit and data collection;
- (3)
expert knowledge input; and,
- (4)
definition of base efficiency scenarios and proposal of operational and technical measures of improvement.
After calculating the CCE for all of the energy efficiency measures proposed, the measures are ranked in ascending order of CCE, against an energy price line. All measures that fall below the energy price line are cost-effective. On the curves, the width of each measure (plotted on the x-axis) represents the annual energy saved by that measure. The height (plotted on the y-axis) shows the measure’s cost of conserved energy.
Scientific and technical literature can be used for an initial screening, e.g., in Abdelaziz et al. [
14] and Bunse at al. [
15] or Therkelsen and McKane [
16] a general dissertation of the energy efficiency measures that can be adopted in the industrial domain can be found.
The measures related to the maintenance and operational control could be summarized in three main families:
enhancement and upgrading of existing maintenance procedures;
adoption of new technologies and more efficient devices; and,
design of a predictive maintenance program.
A growing interest is evident in the development and modeling of maintenance activities, as in Zio and Compare [
17] or Faccio et al. [
18]. Predictive maintenance requires that models and tools able to predict the breakdown of the system to be maintained, by detecting early signs of failure, as in Rosmaini and Kamaruddin [
19]. Acting before failure allows for solving any fault, even if there is no immediate danger; this proactive maintenance ensures smooth operation and reduces energy consumption. Predictive maintenance techniques are closely associated with sensor technologies, but a comprehensive approach, integrating sensing with subsequent maintenance activities, is needed to increase their efficiency.
Recent advances in information, communication, and computer technologies, as Internet of Things and RFID (radio-frequency identifications), support prognostic and health management philosophy and make predictive maintenance applications more efficient, applicable, affordable, and consequently more common and available for different industrial domains [
20].
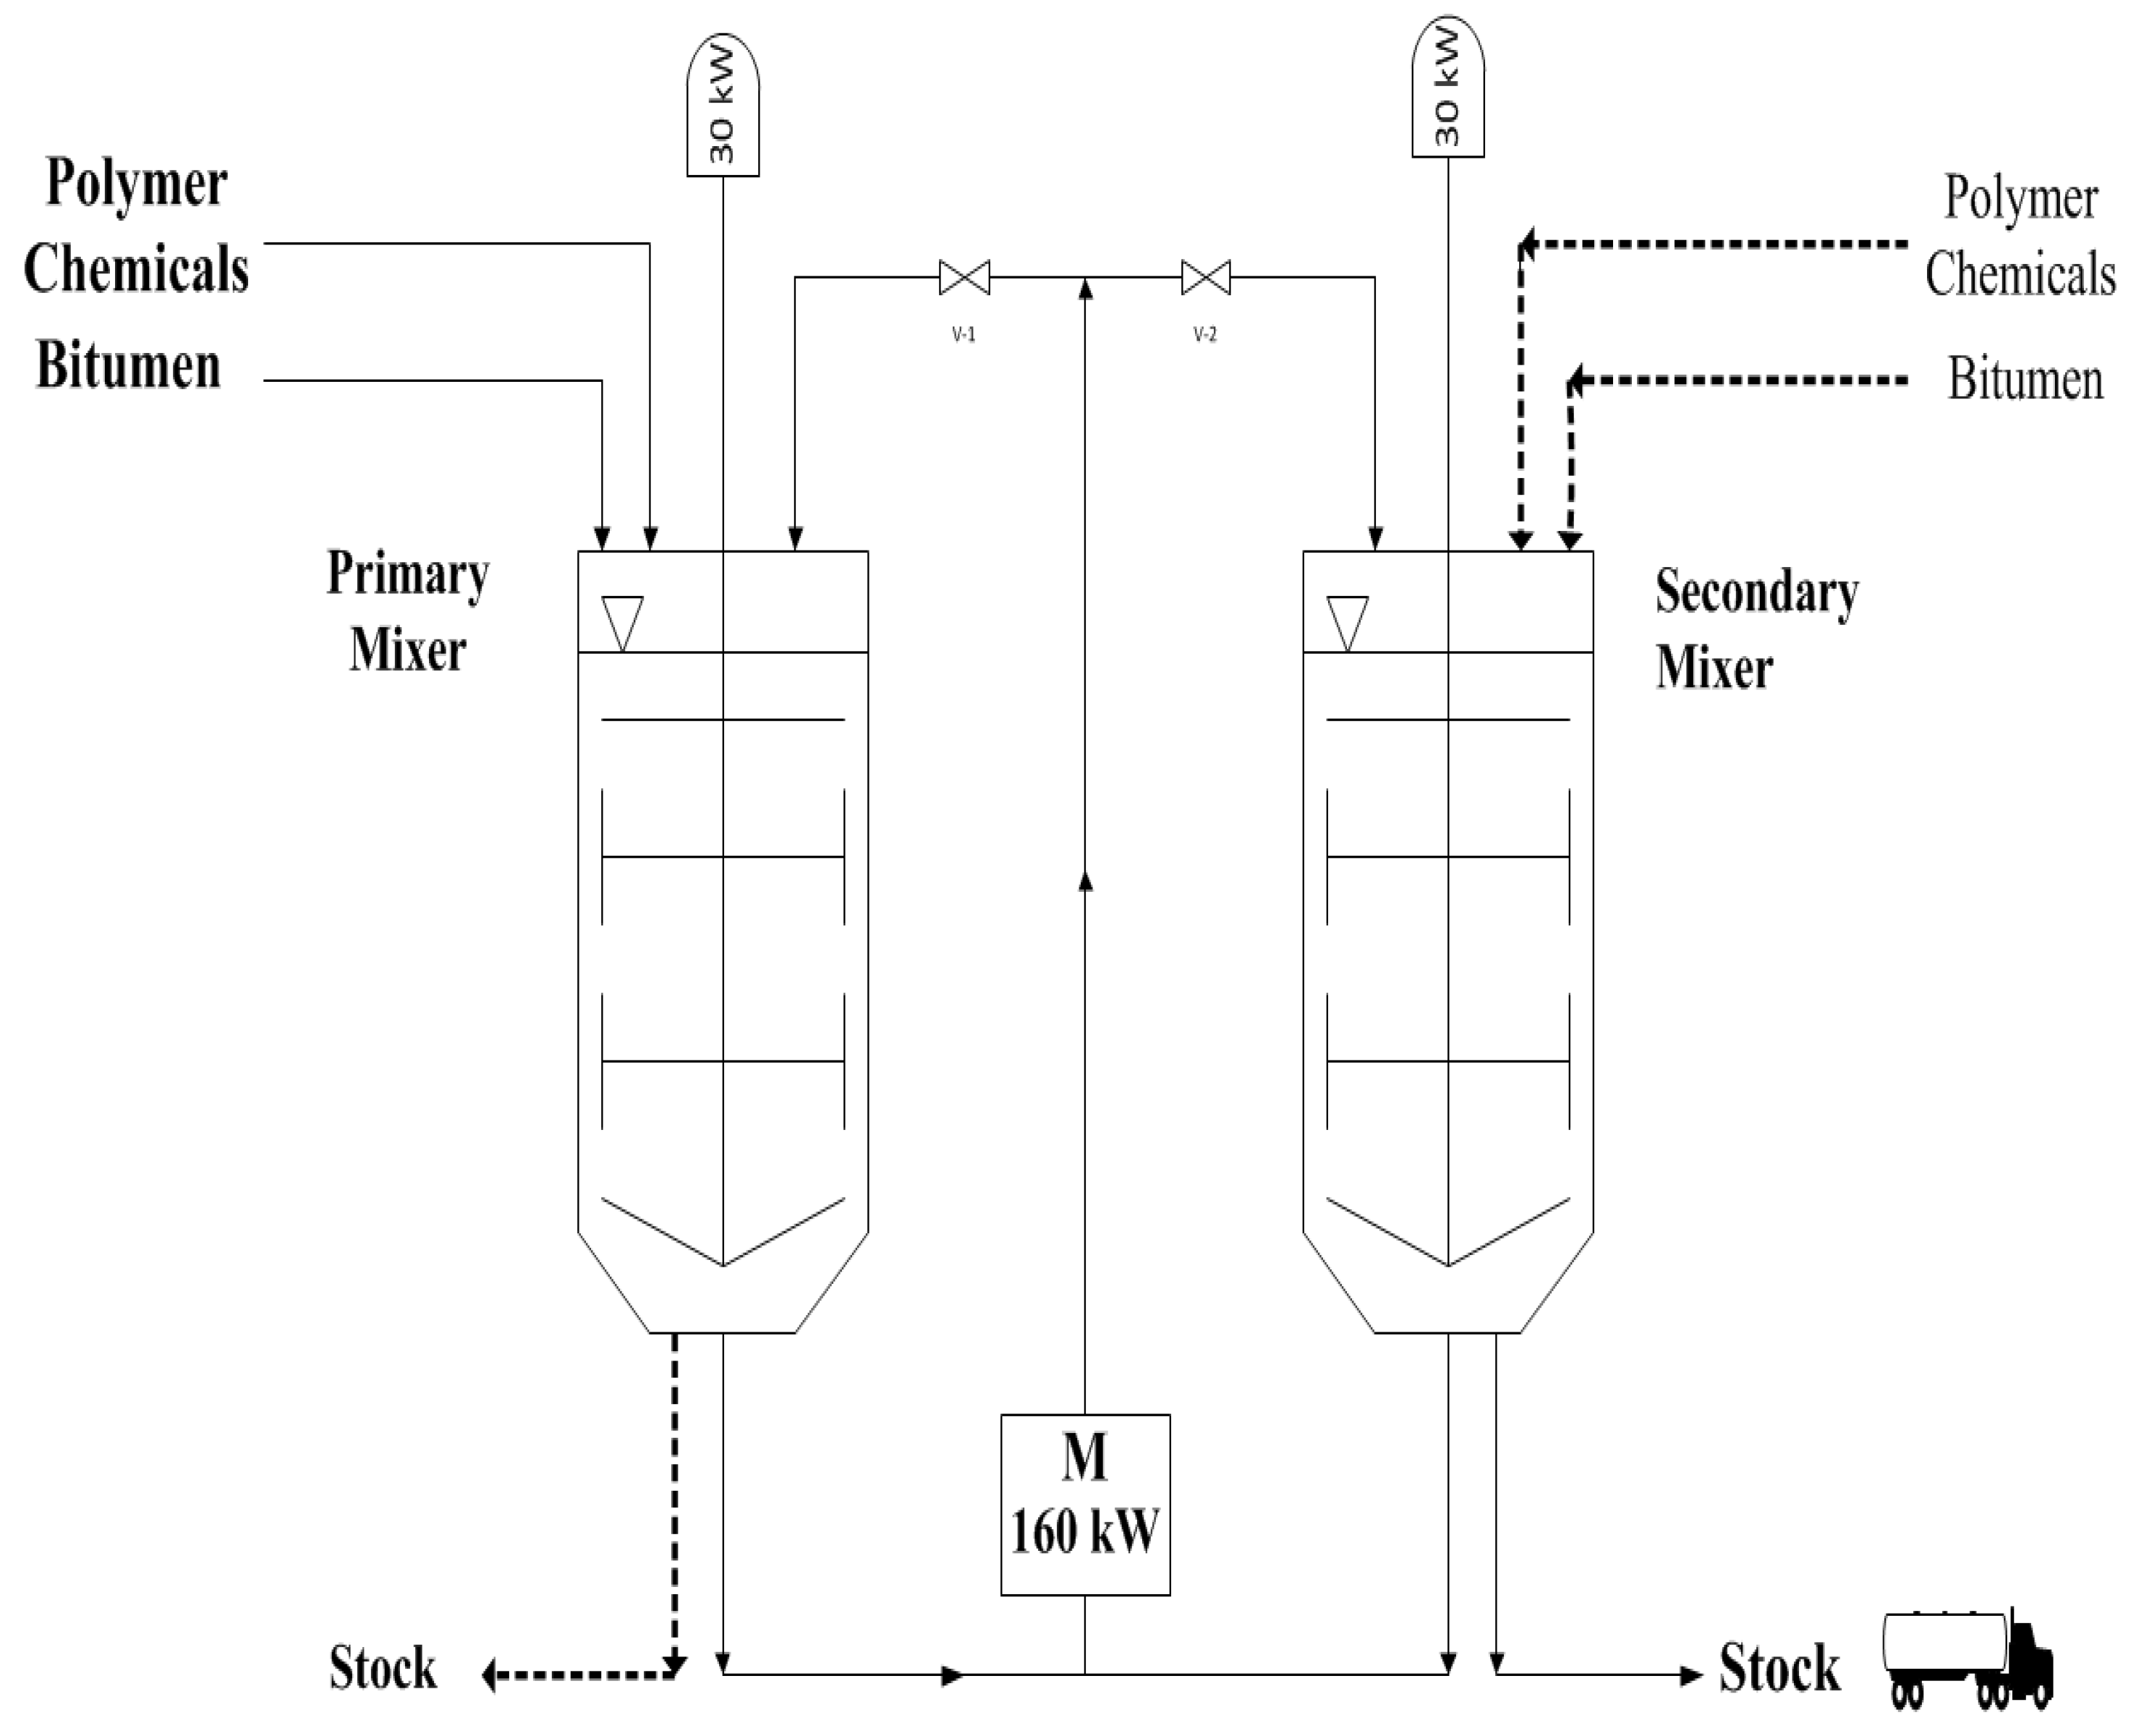
4. Bitumen Processing Case Study
The plant object of the study is a process to produce modified bitumen, as in
Figure 2.
It produces 20–21 t/h of modified bitumen. The plant is made of two mixers, the primary and the secondary one. The operation of the mixers is switched every year.
Bitumen, together with polymer and other chemical additives, is fed to the primary mixer and mixed up until the expected quality of the product is obtained.
In the end, the mixture passes in the secondary mixer, which operates the final homogenization: the final product is modified bitumen with high quality and performances.
After a laboratory quality control, the product is stored waiting for the delivery to the costumers.
4.1. Data Collection and Observation
With reference to the framework detailed in
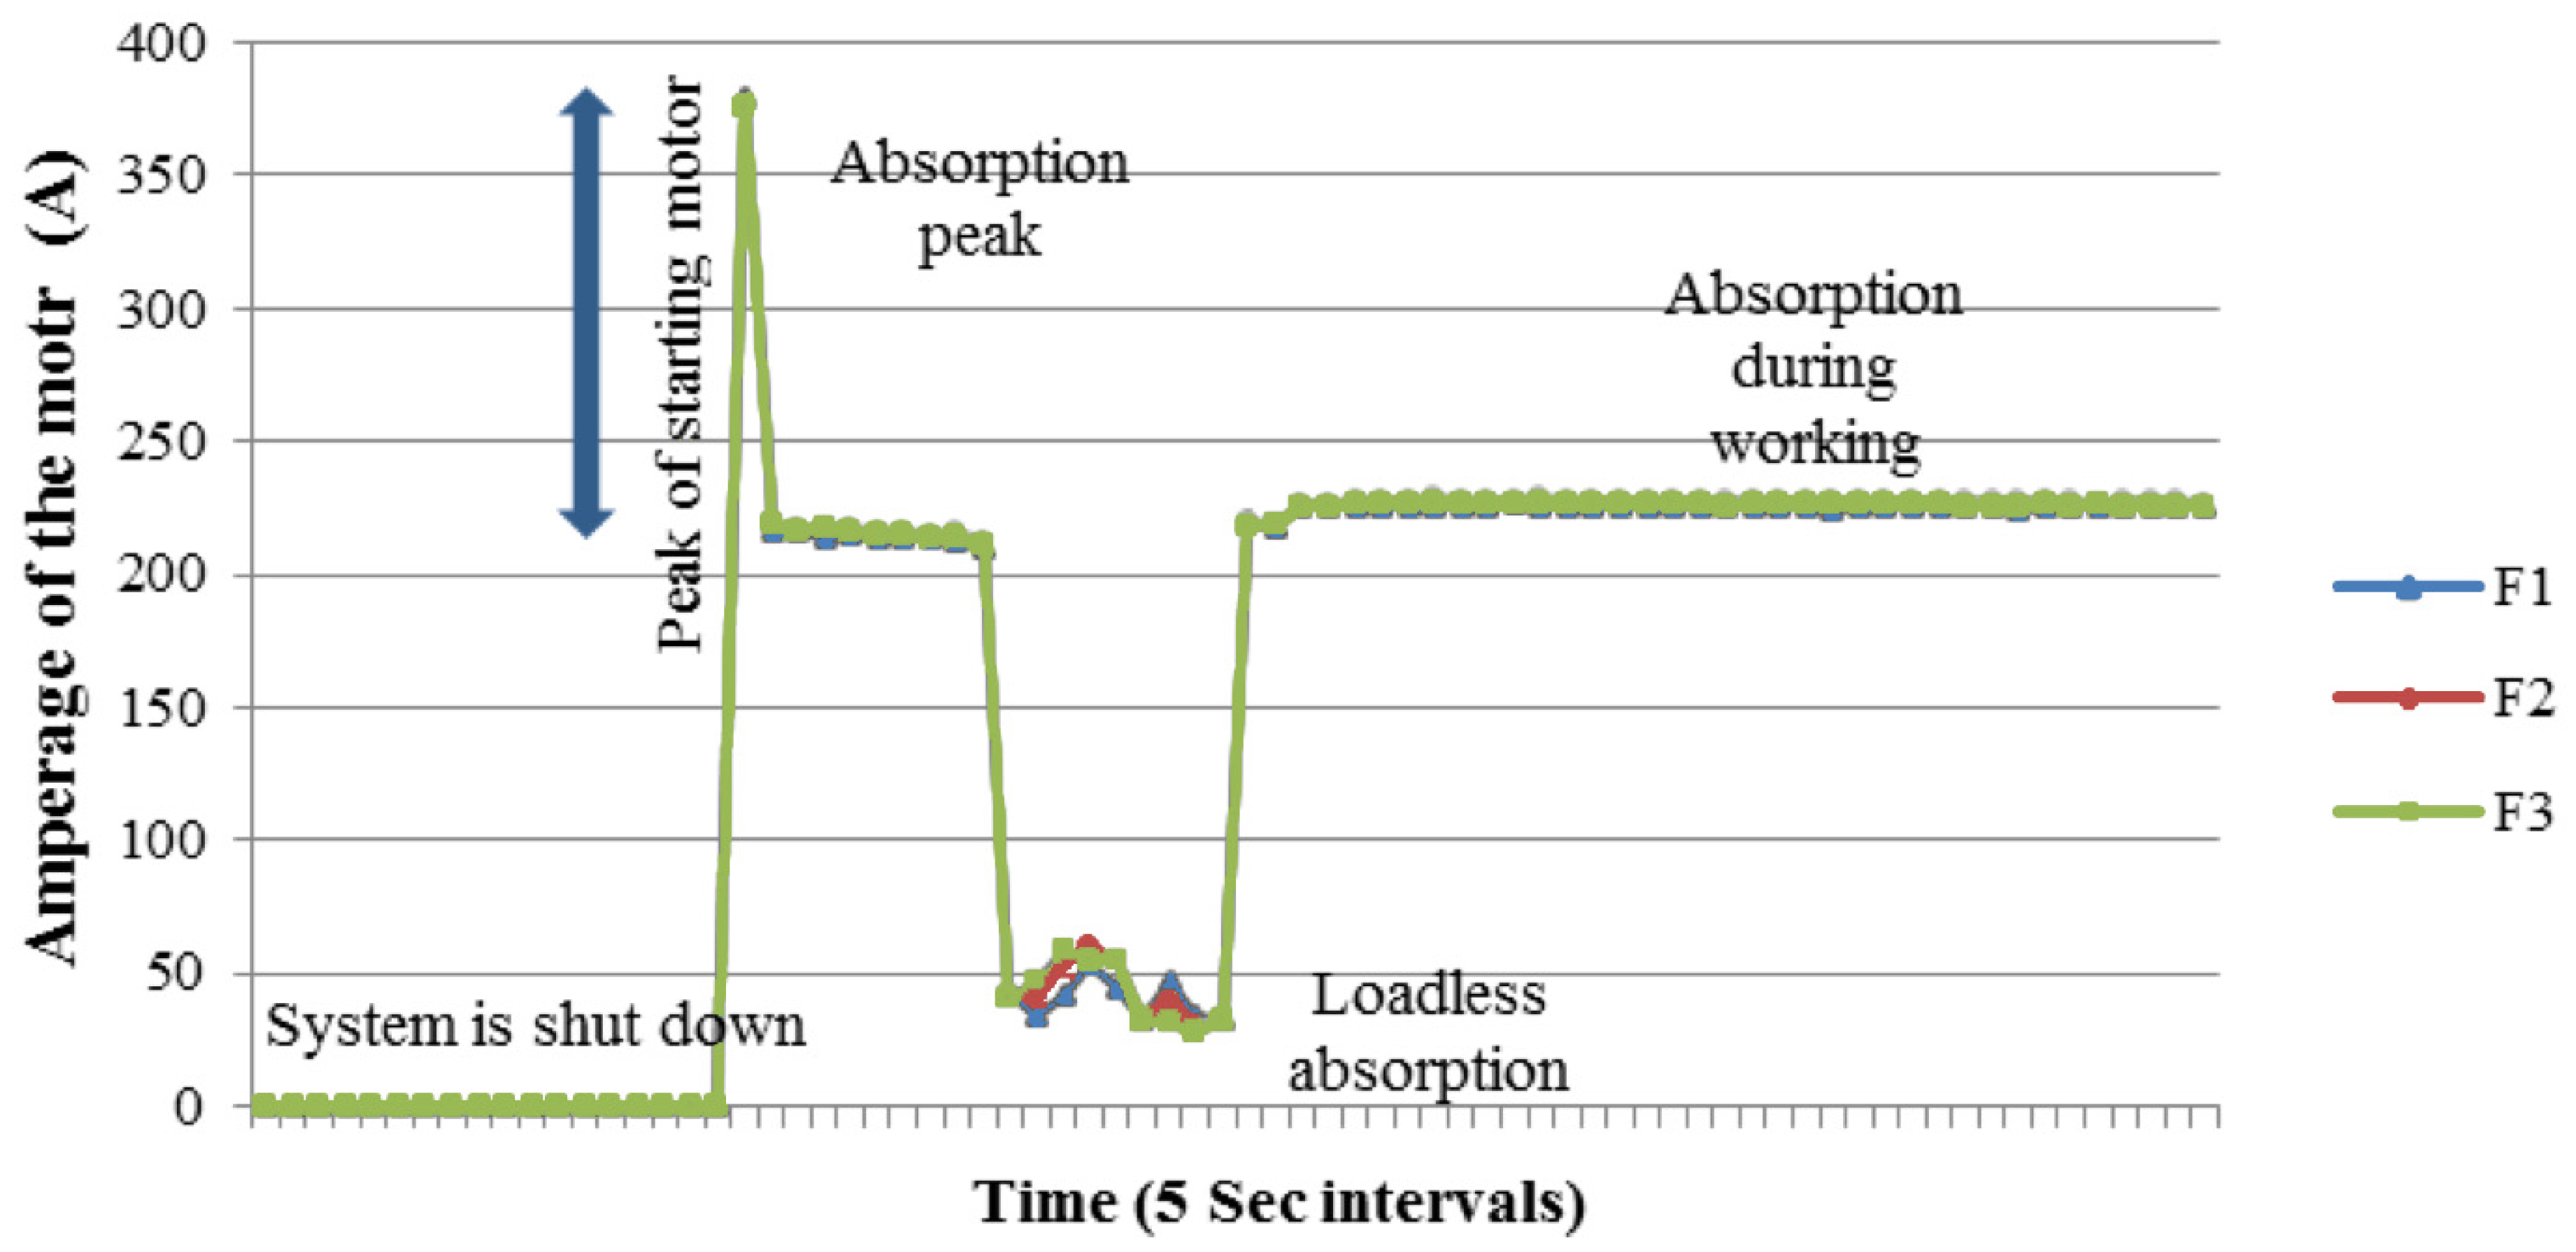
Section 1, the most critical system was identified: a three-phases electric motor was the main energy consumer in the analyzed process. The motor drags the mill for the polymer homogenization to a rotation speed of about 1800 rpm.
Typical motor energy absorption is shown in
Figure 3. A peak of energy absorption of about 400 A is present at the startup of the motor, for around 5 s. In case the motor works unloaded, it absorbs little electricity power, while when it works under load it shows an almost constant absorption, which depends on the motor efficiency, the viscosity of the product, and other parameters.
The company was already monitoring the energy absorption of the plant, but these data were not employed for decision making in terms of process optimization.
Thus, in this research, the recorded data were used to analyze the energy footprint and to define possible efficiency measures to increase the performances of the system. This knowledge was integrated with the analysis of the maintenance activities and failures occurrence related to the observed motor system.
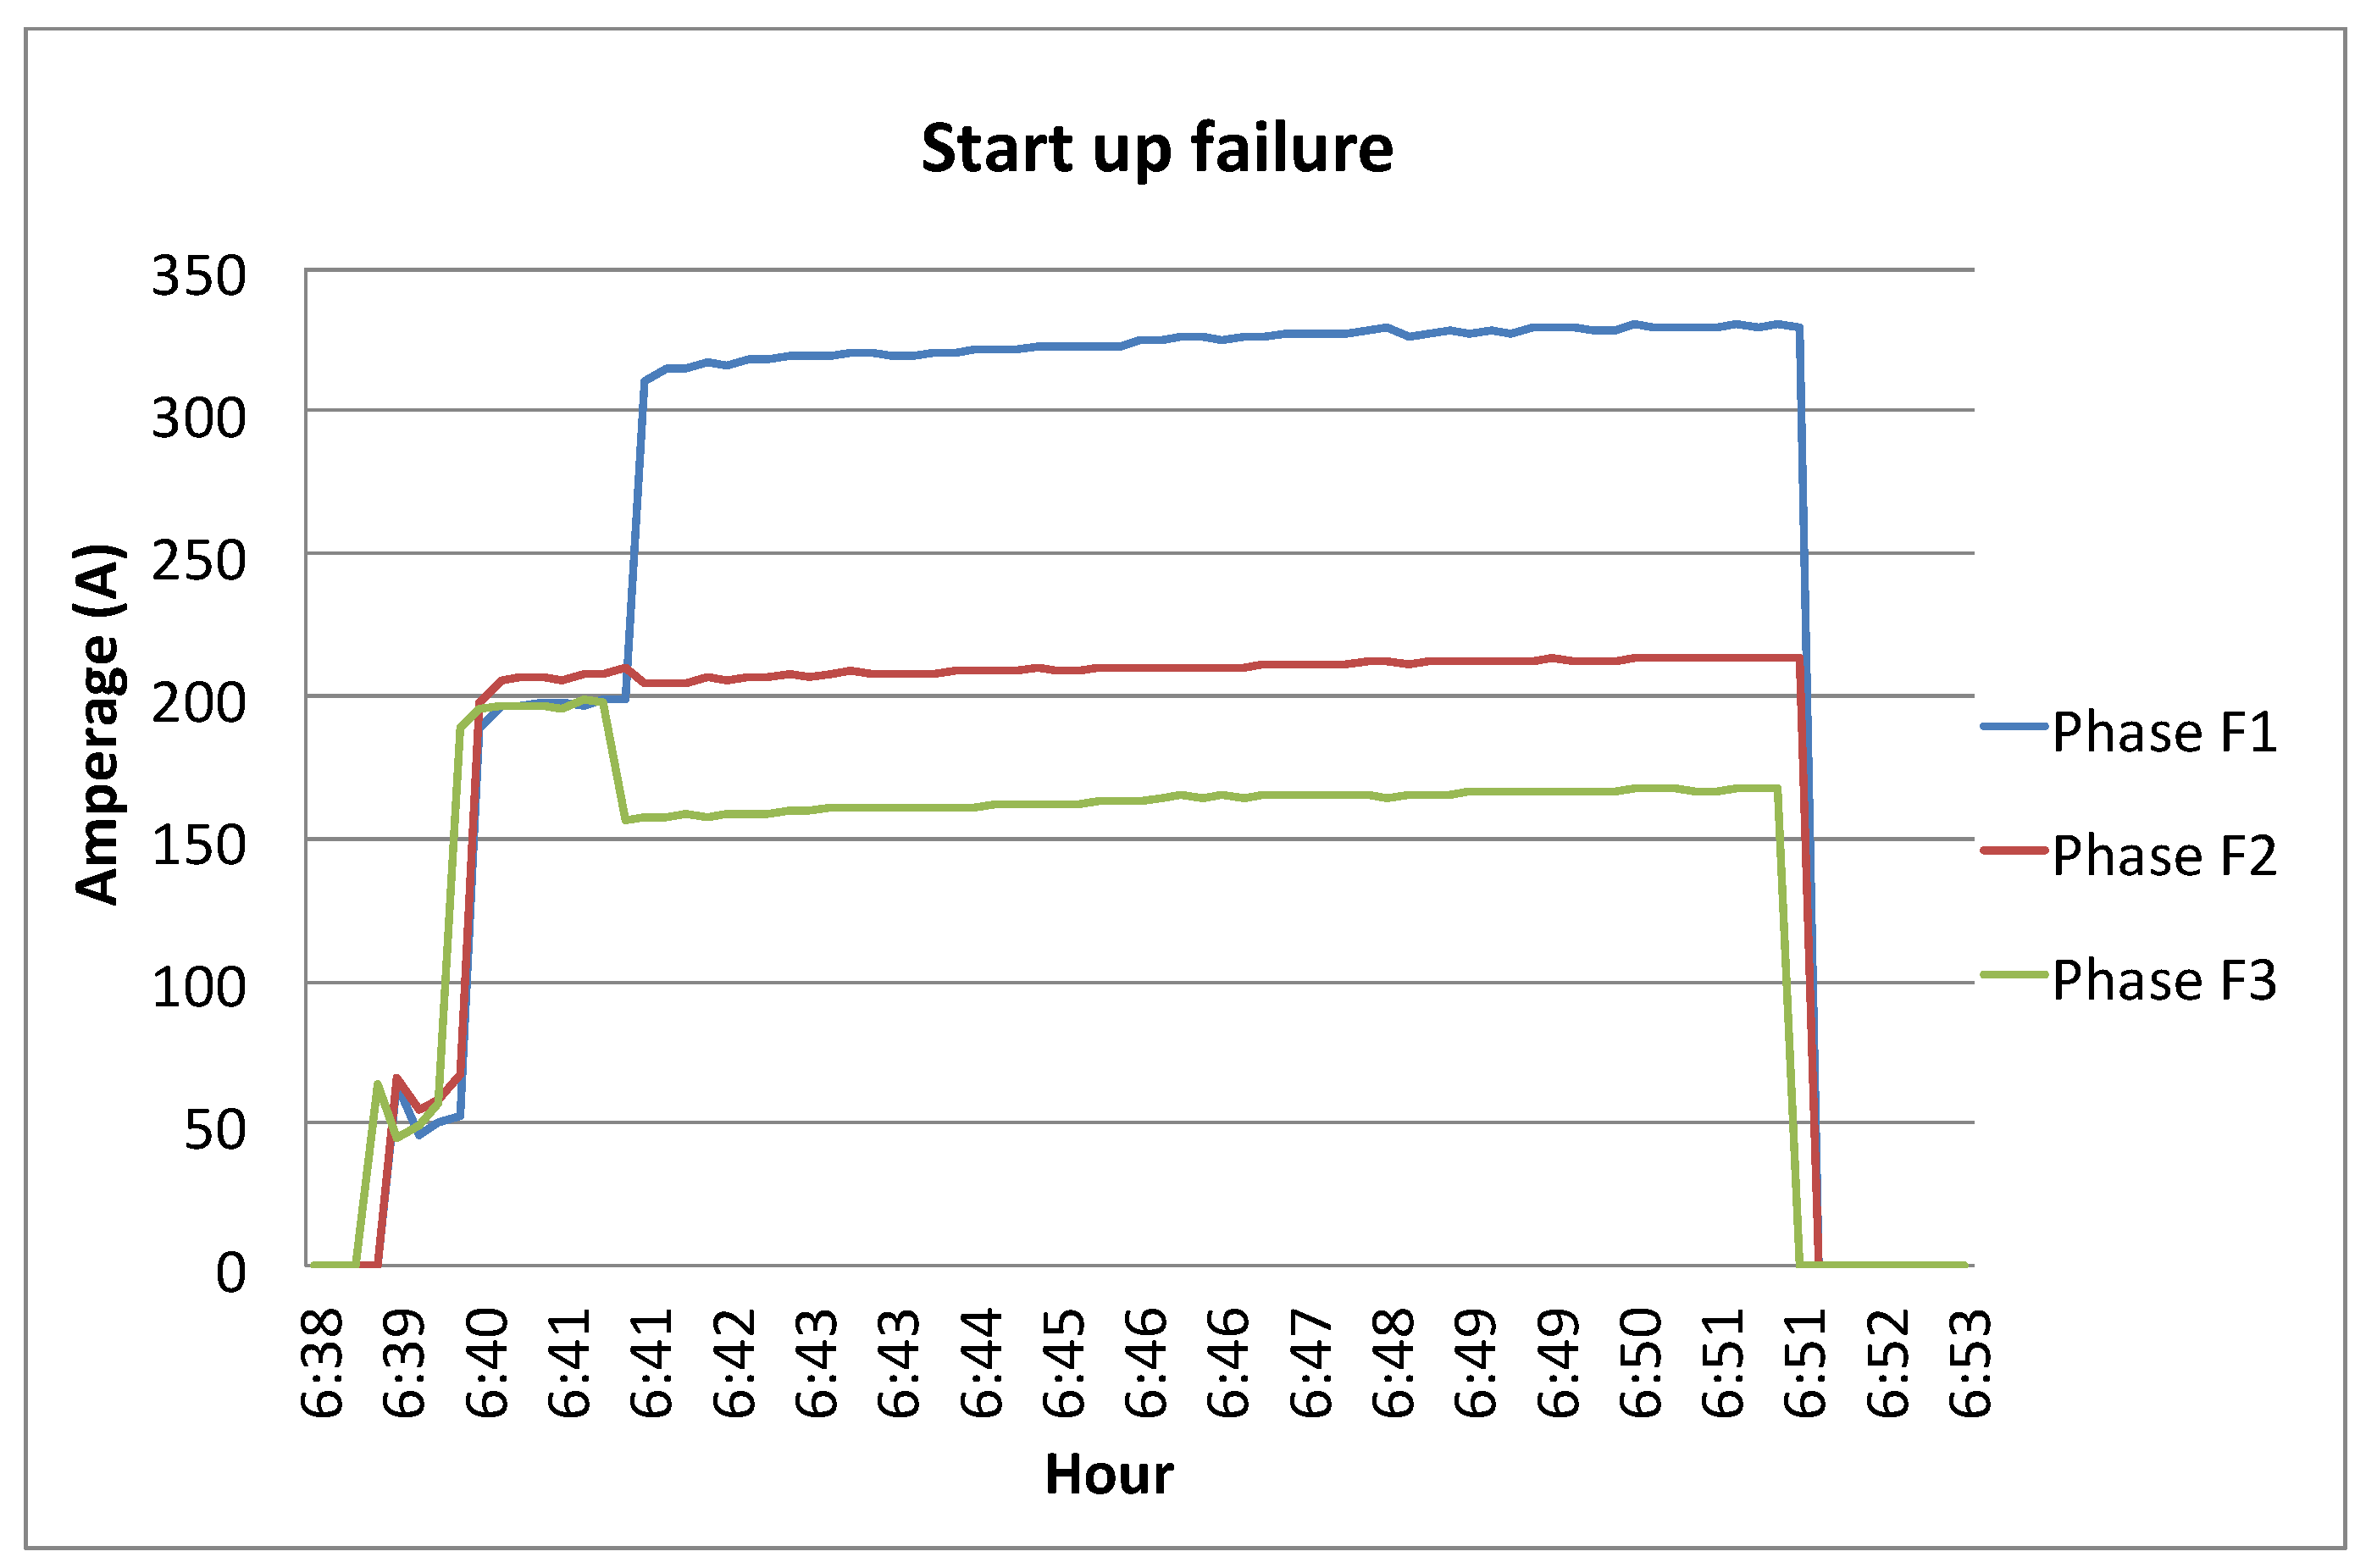
In July 2010, the motor failed after 8000 h (4 years) working: moisture inside the motor dripped on the terminal block burning it. During the starting, the motor showed anomalies, particularly in one of the phases, and after few minutes, it stopped.
A new motor was available in the stock, so the loss of production following the failure was limited to the 10 h that was needed for the substitution.
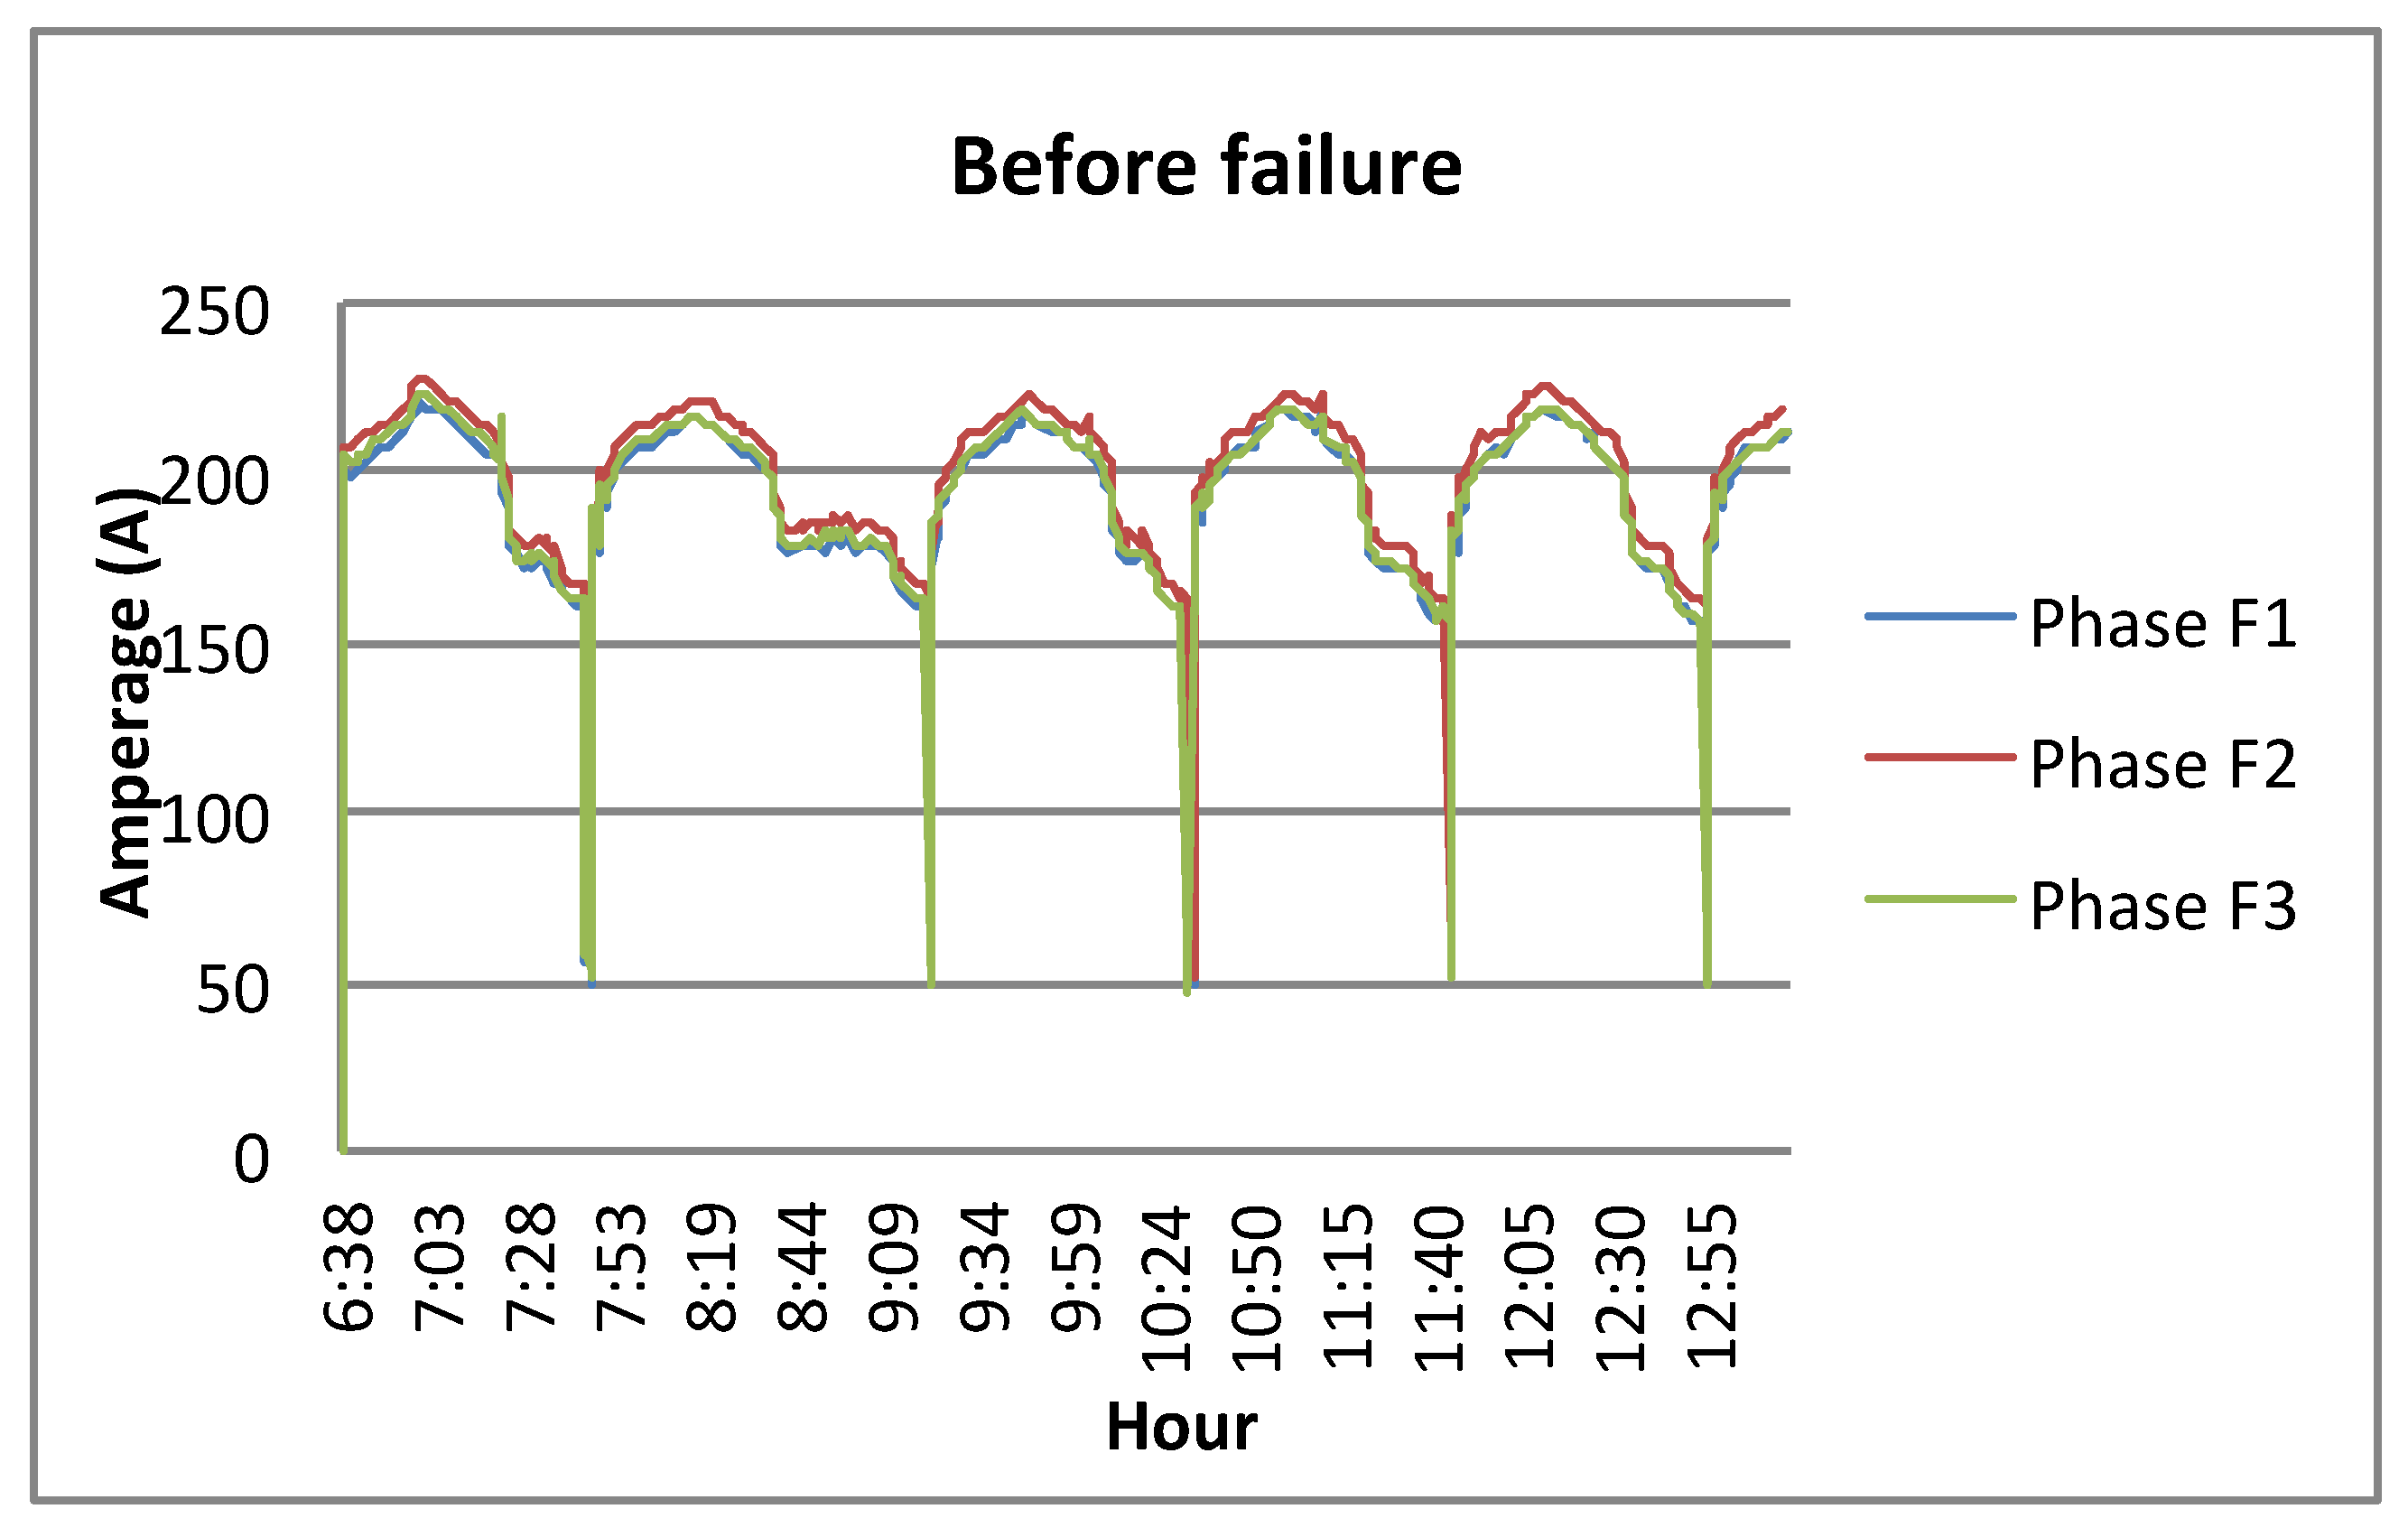
Figure 4 shows the electric energy absorption trend of the motor, before failure. It shows regular cycles, each of 1 h, with a maximum consumption of 230 A.
The motor efficiency was about 89%, as estimated by plant technicians.
Figure 5 shows the trend of energy absorption of the motor when the failure occurred:
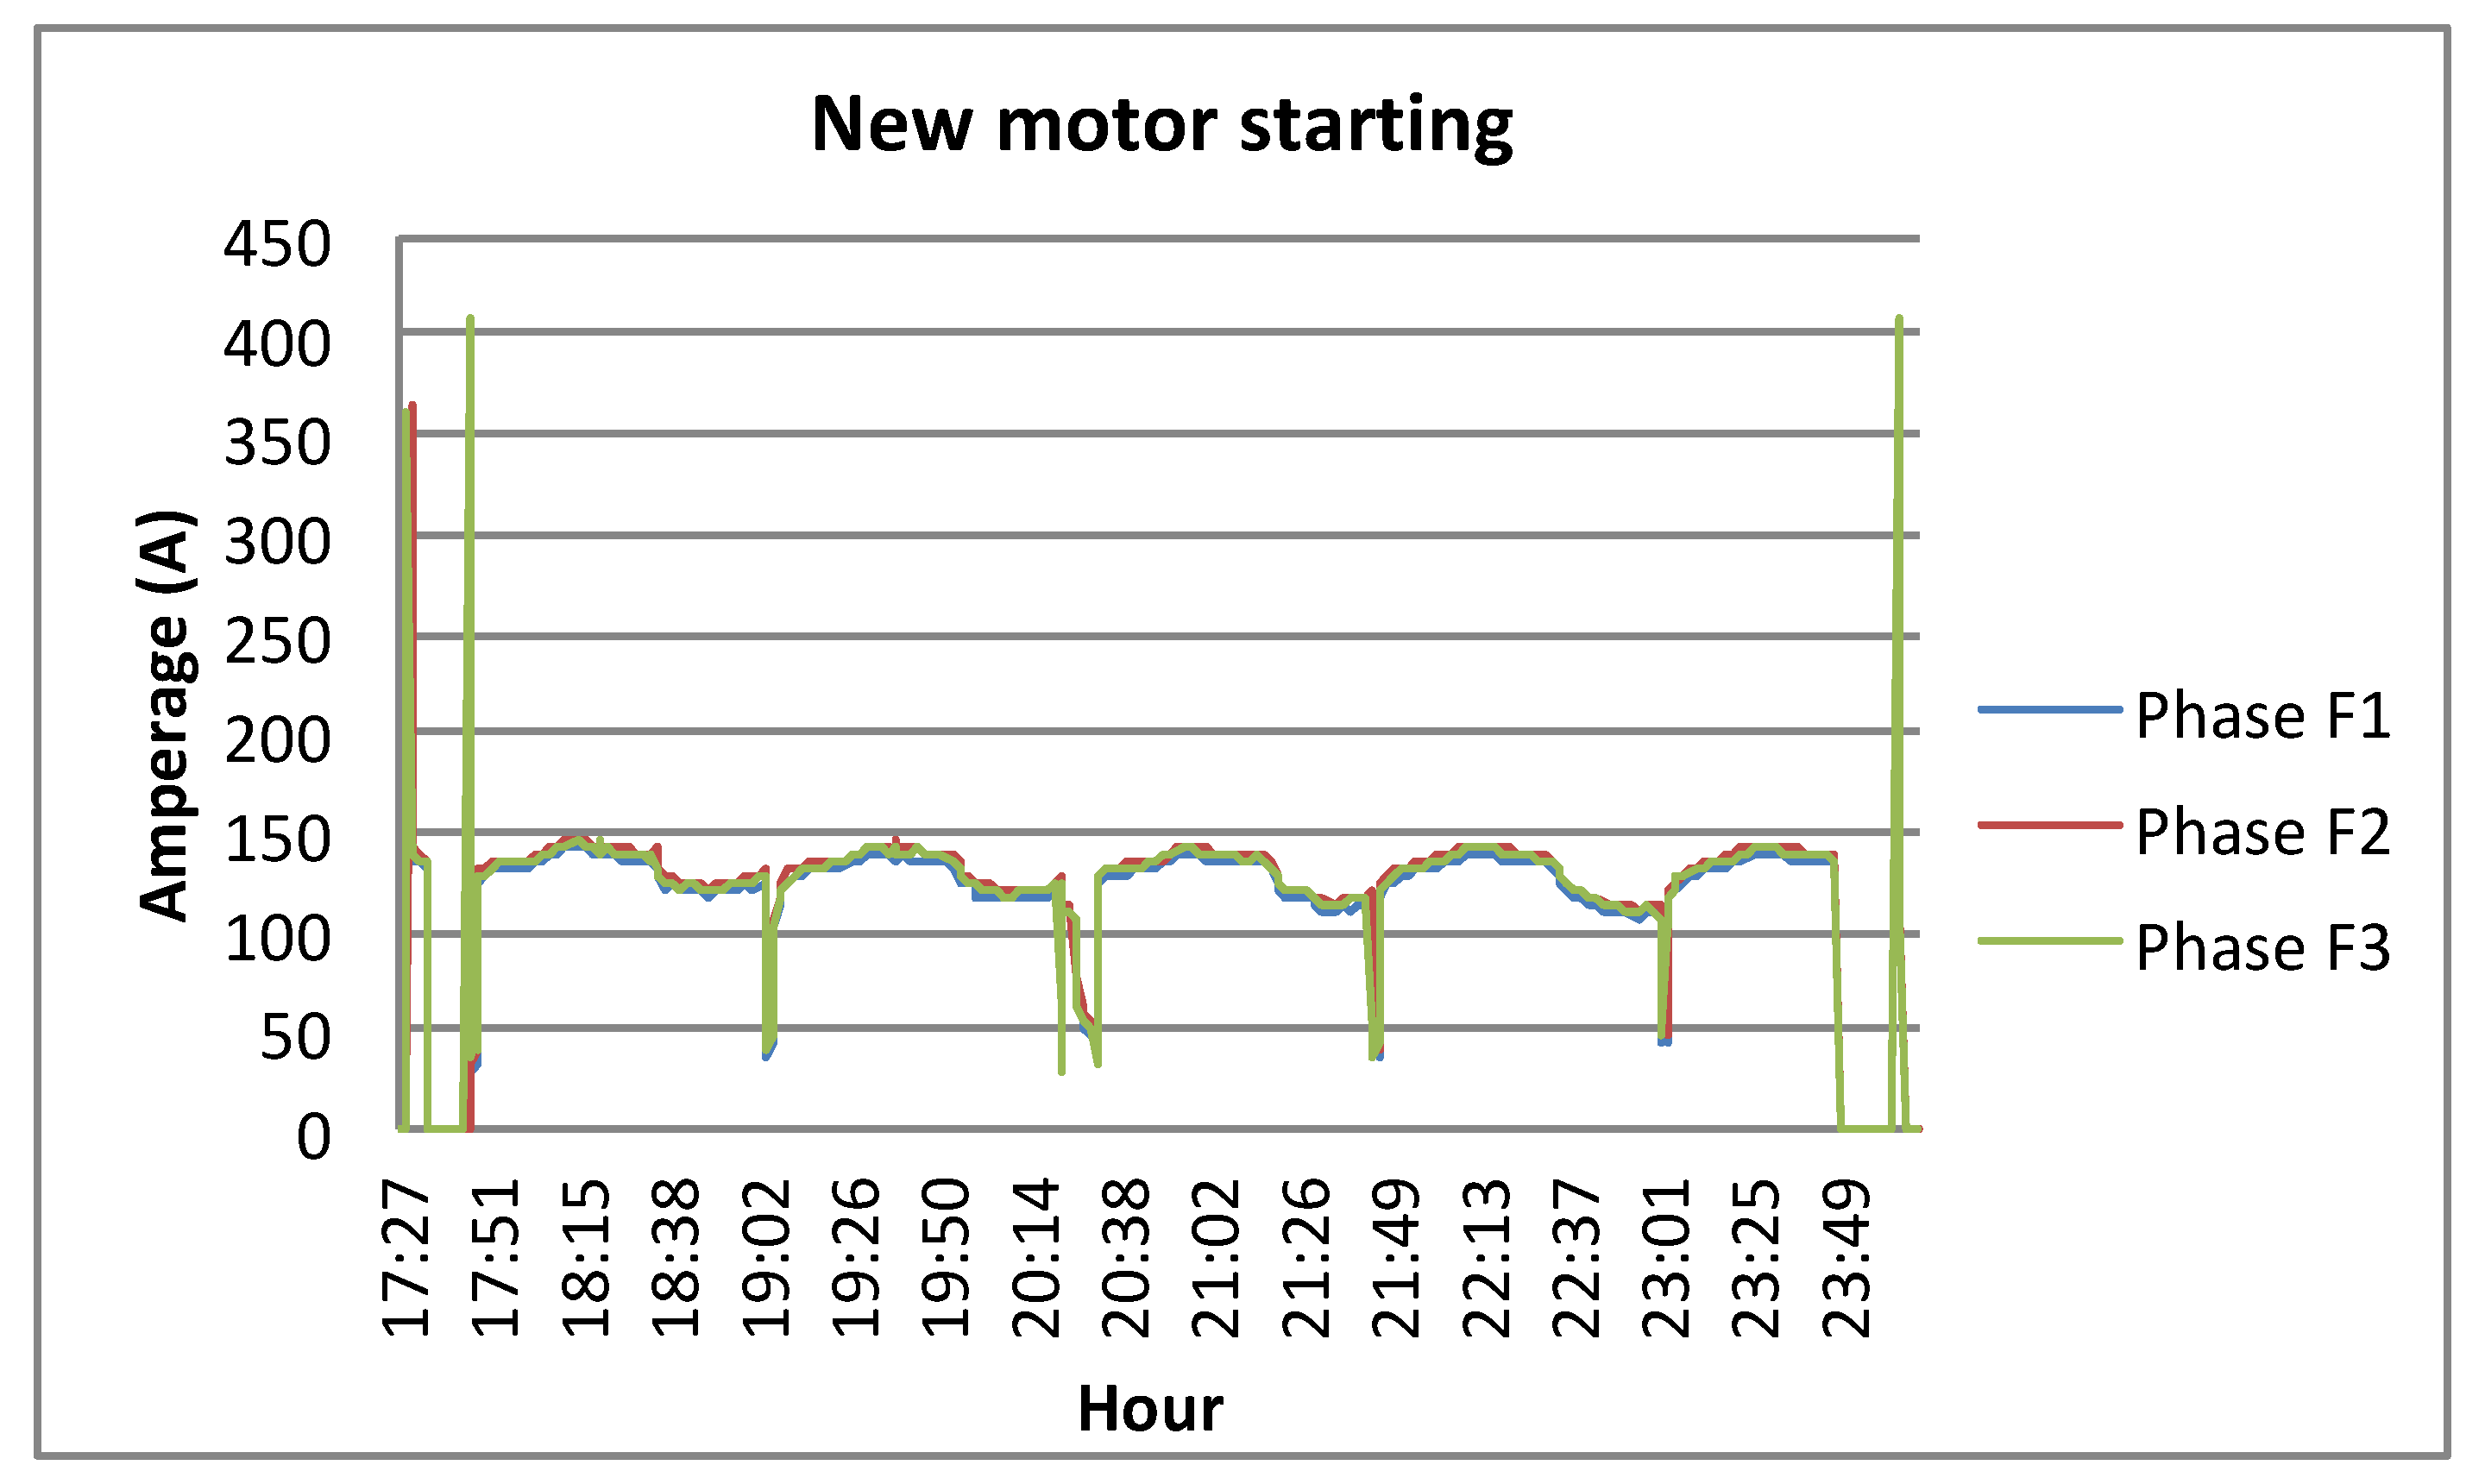
Following the failure, a new motor was installed, which was characterized by an efficiency of the 96%, as estimated by plant technicians. Energy absorption trend of the new motor is shown in
Figure 6. The working consumption was around 150 A.
4.2. Economic Evaluation of Maintenance and Operating Costs
Maintenance and Operational costs model, as shortly discussed in
Section 2, was used to estimate total
M&
O parameter for the motor system.
4.2.1. Maintenance Costs
The maintenance activities carried on in the plant are both preventive and corrective, as summarized in
Table 2, while
Table 3 shows the estimated costs of maintenance activities according to Equation (3) and company data.
Preventive maintenance costs showed a slight increase during the years, due to the cost of work increase. When the new motor was activated, its preventive maintenance for the first year was very limited (in actions and costs), and then it increased in the second year of activity. From the second year on, the progress of the costs for preventive maintenance actions became only dependent on the cost of the work.
4.2.2. Operating Costs
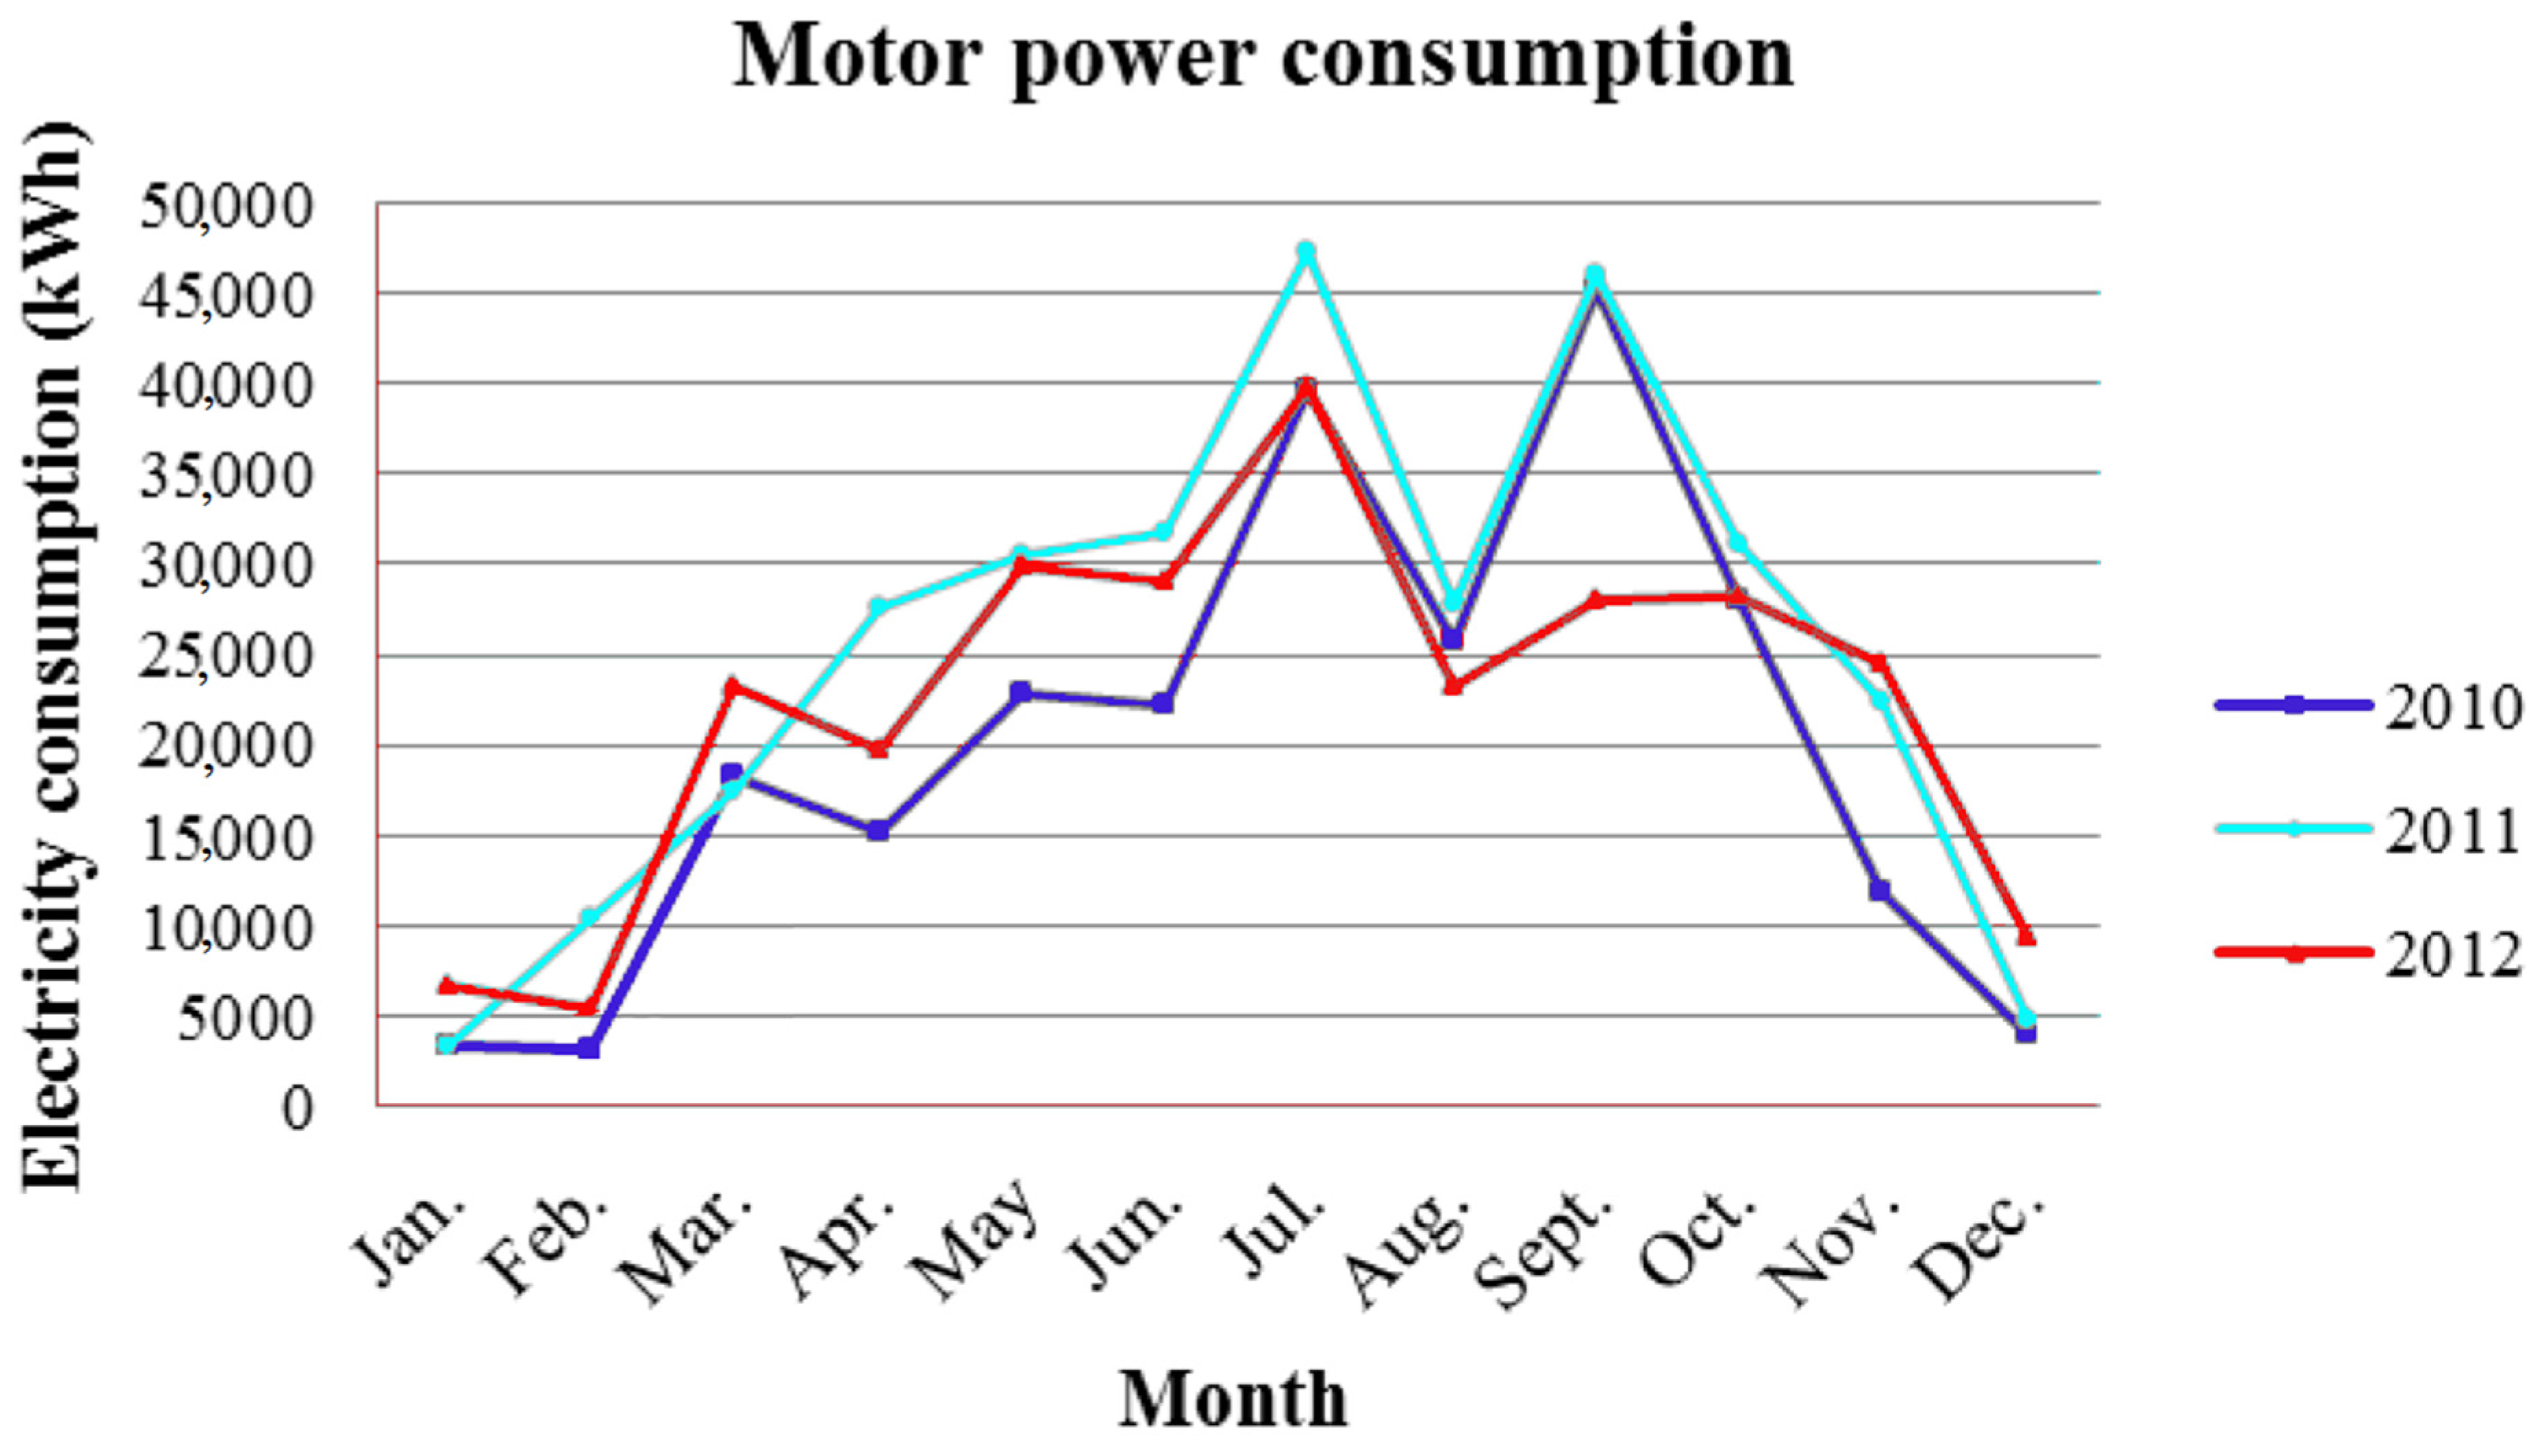
Operating costs of the motor were calculated, based on the data collected in 2010, 2011, and 2012. Different factors can affect the operating costs; the average production capacity, the operational hours—depending on the period of the year—and the average cost of electricity were considered.
The total electricity that is used by the plant is about 1.3–1.4 GWh in a year and the total electricity used by the motor is about 23% of the total energy.
Table 4 summarizes the costs of operation as retrieved by plant monitoring.
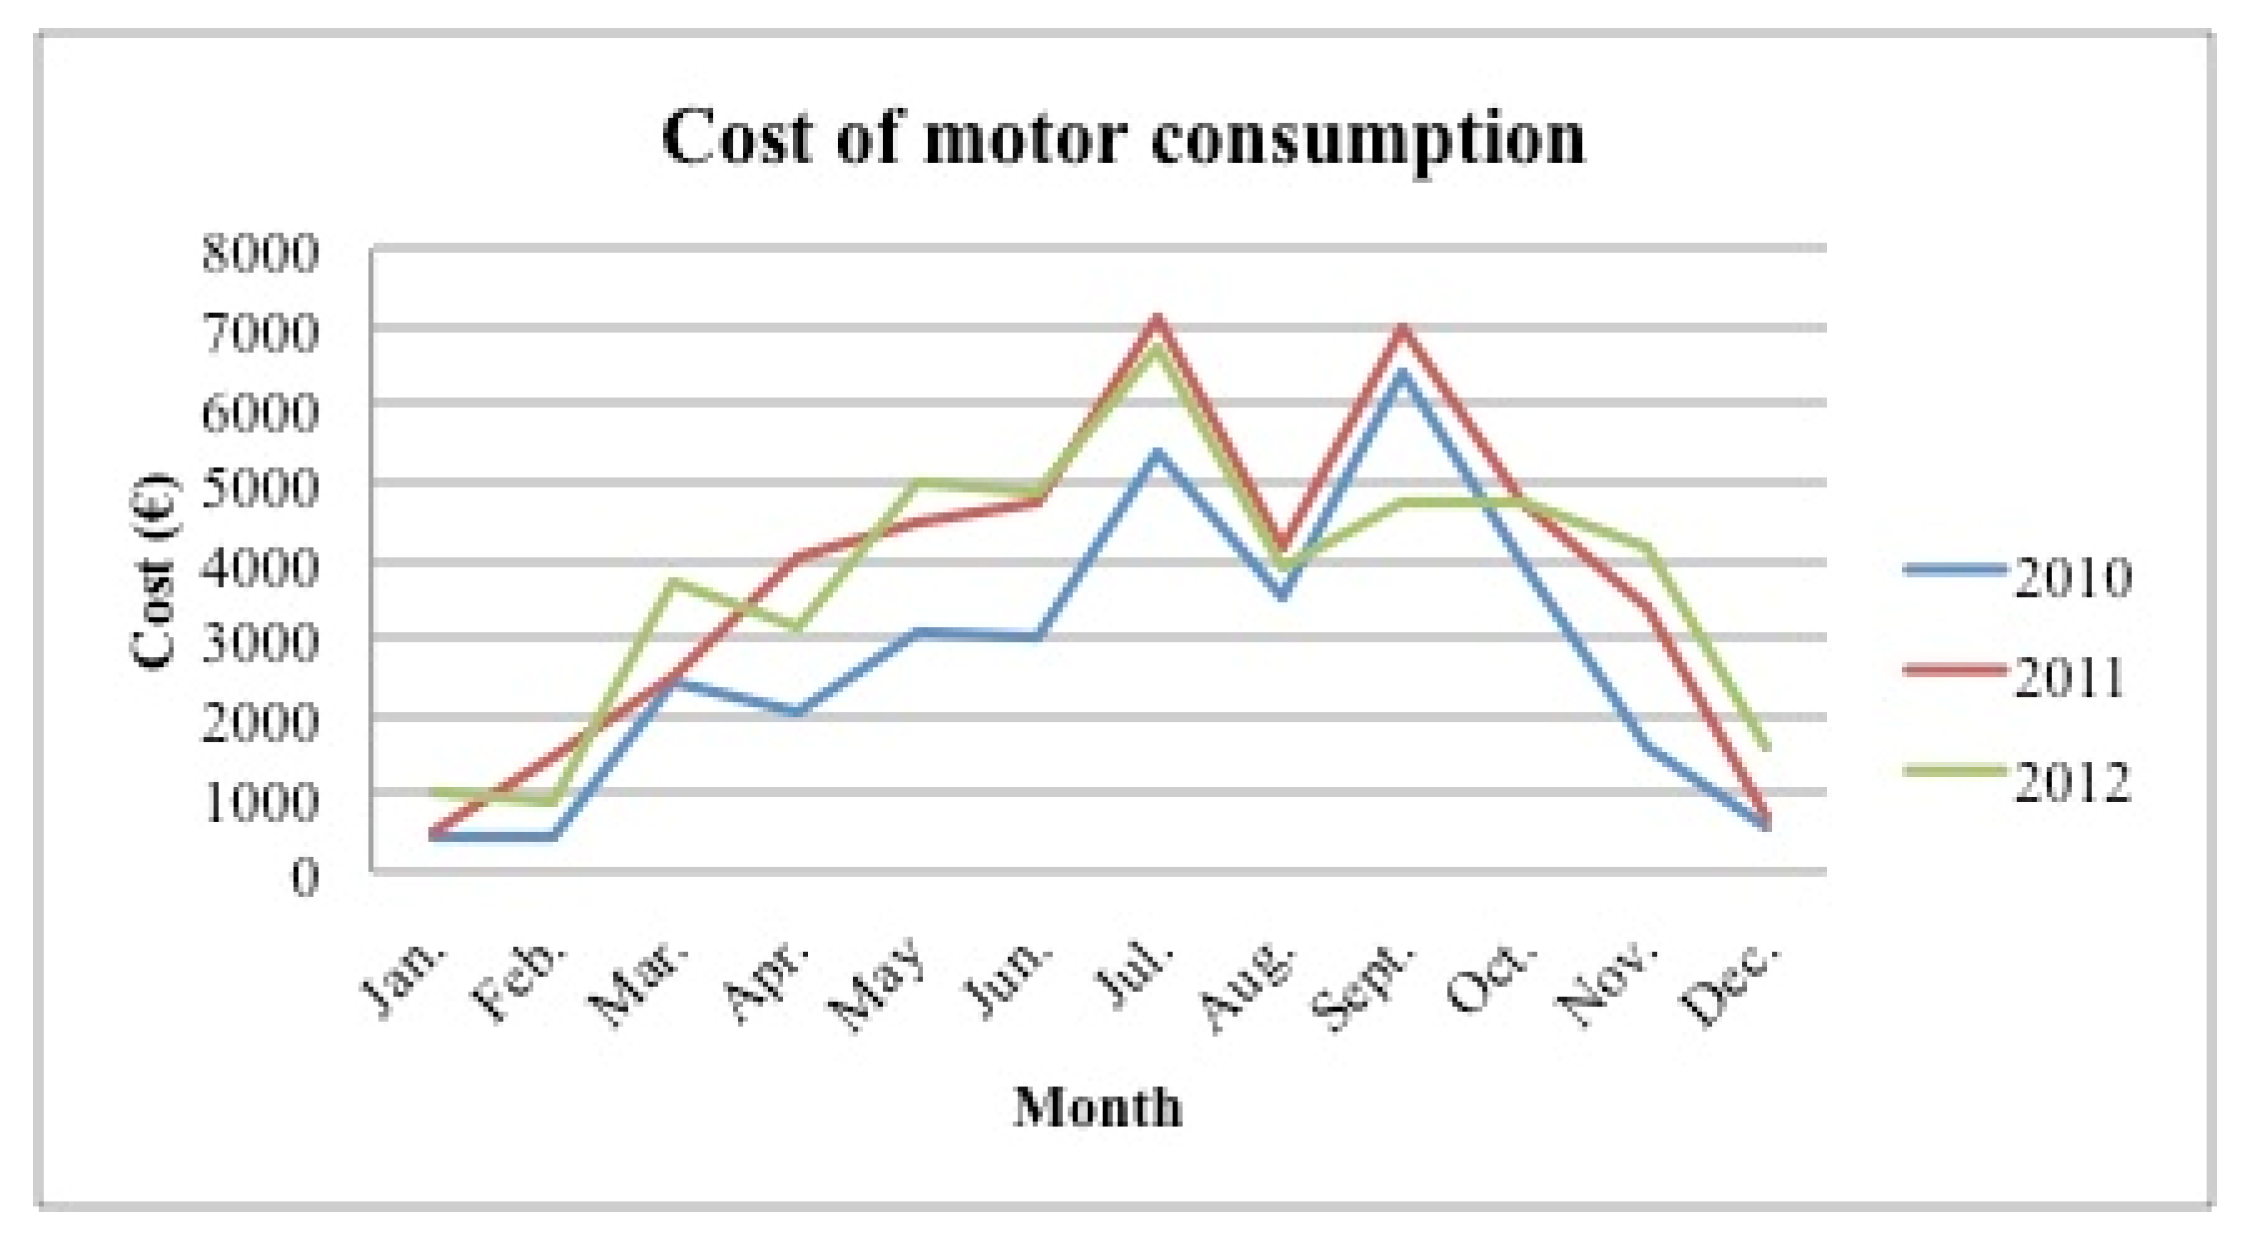
On the basis of the data of
Table 4 and of the monthly trend of energy consumption of the company,
Figure 7 shows monthly trends of motor electricity consumption, and
Figure 8 shows monthly trends of the power consumption costs.
4.3. Efficiency Analysis
The knowledge base collected in previous sections was used to estimate the gain obtained with the maintenance and operation optimization.
The energy saving achieved by the implementation of each single measure was assessed on the bases of the following inputs:
- (1)
The efficiency base case scenarios for motor system, as discussed in
Section 3.
- (2)
The measures proposed to increase the energy efficiency of the motor system, together with the possible % improvement, according to the different scenarios.
- (3)
The annual electricity used by the motor system.
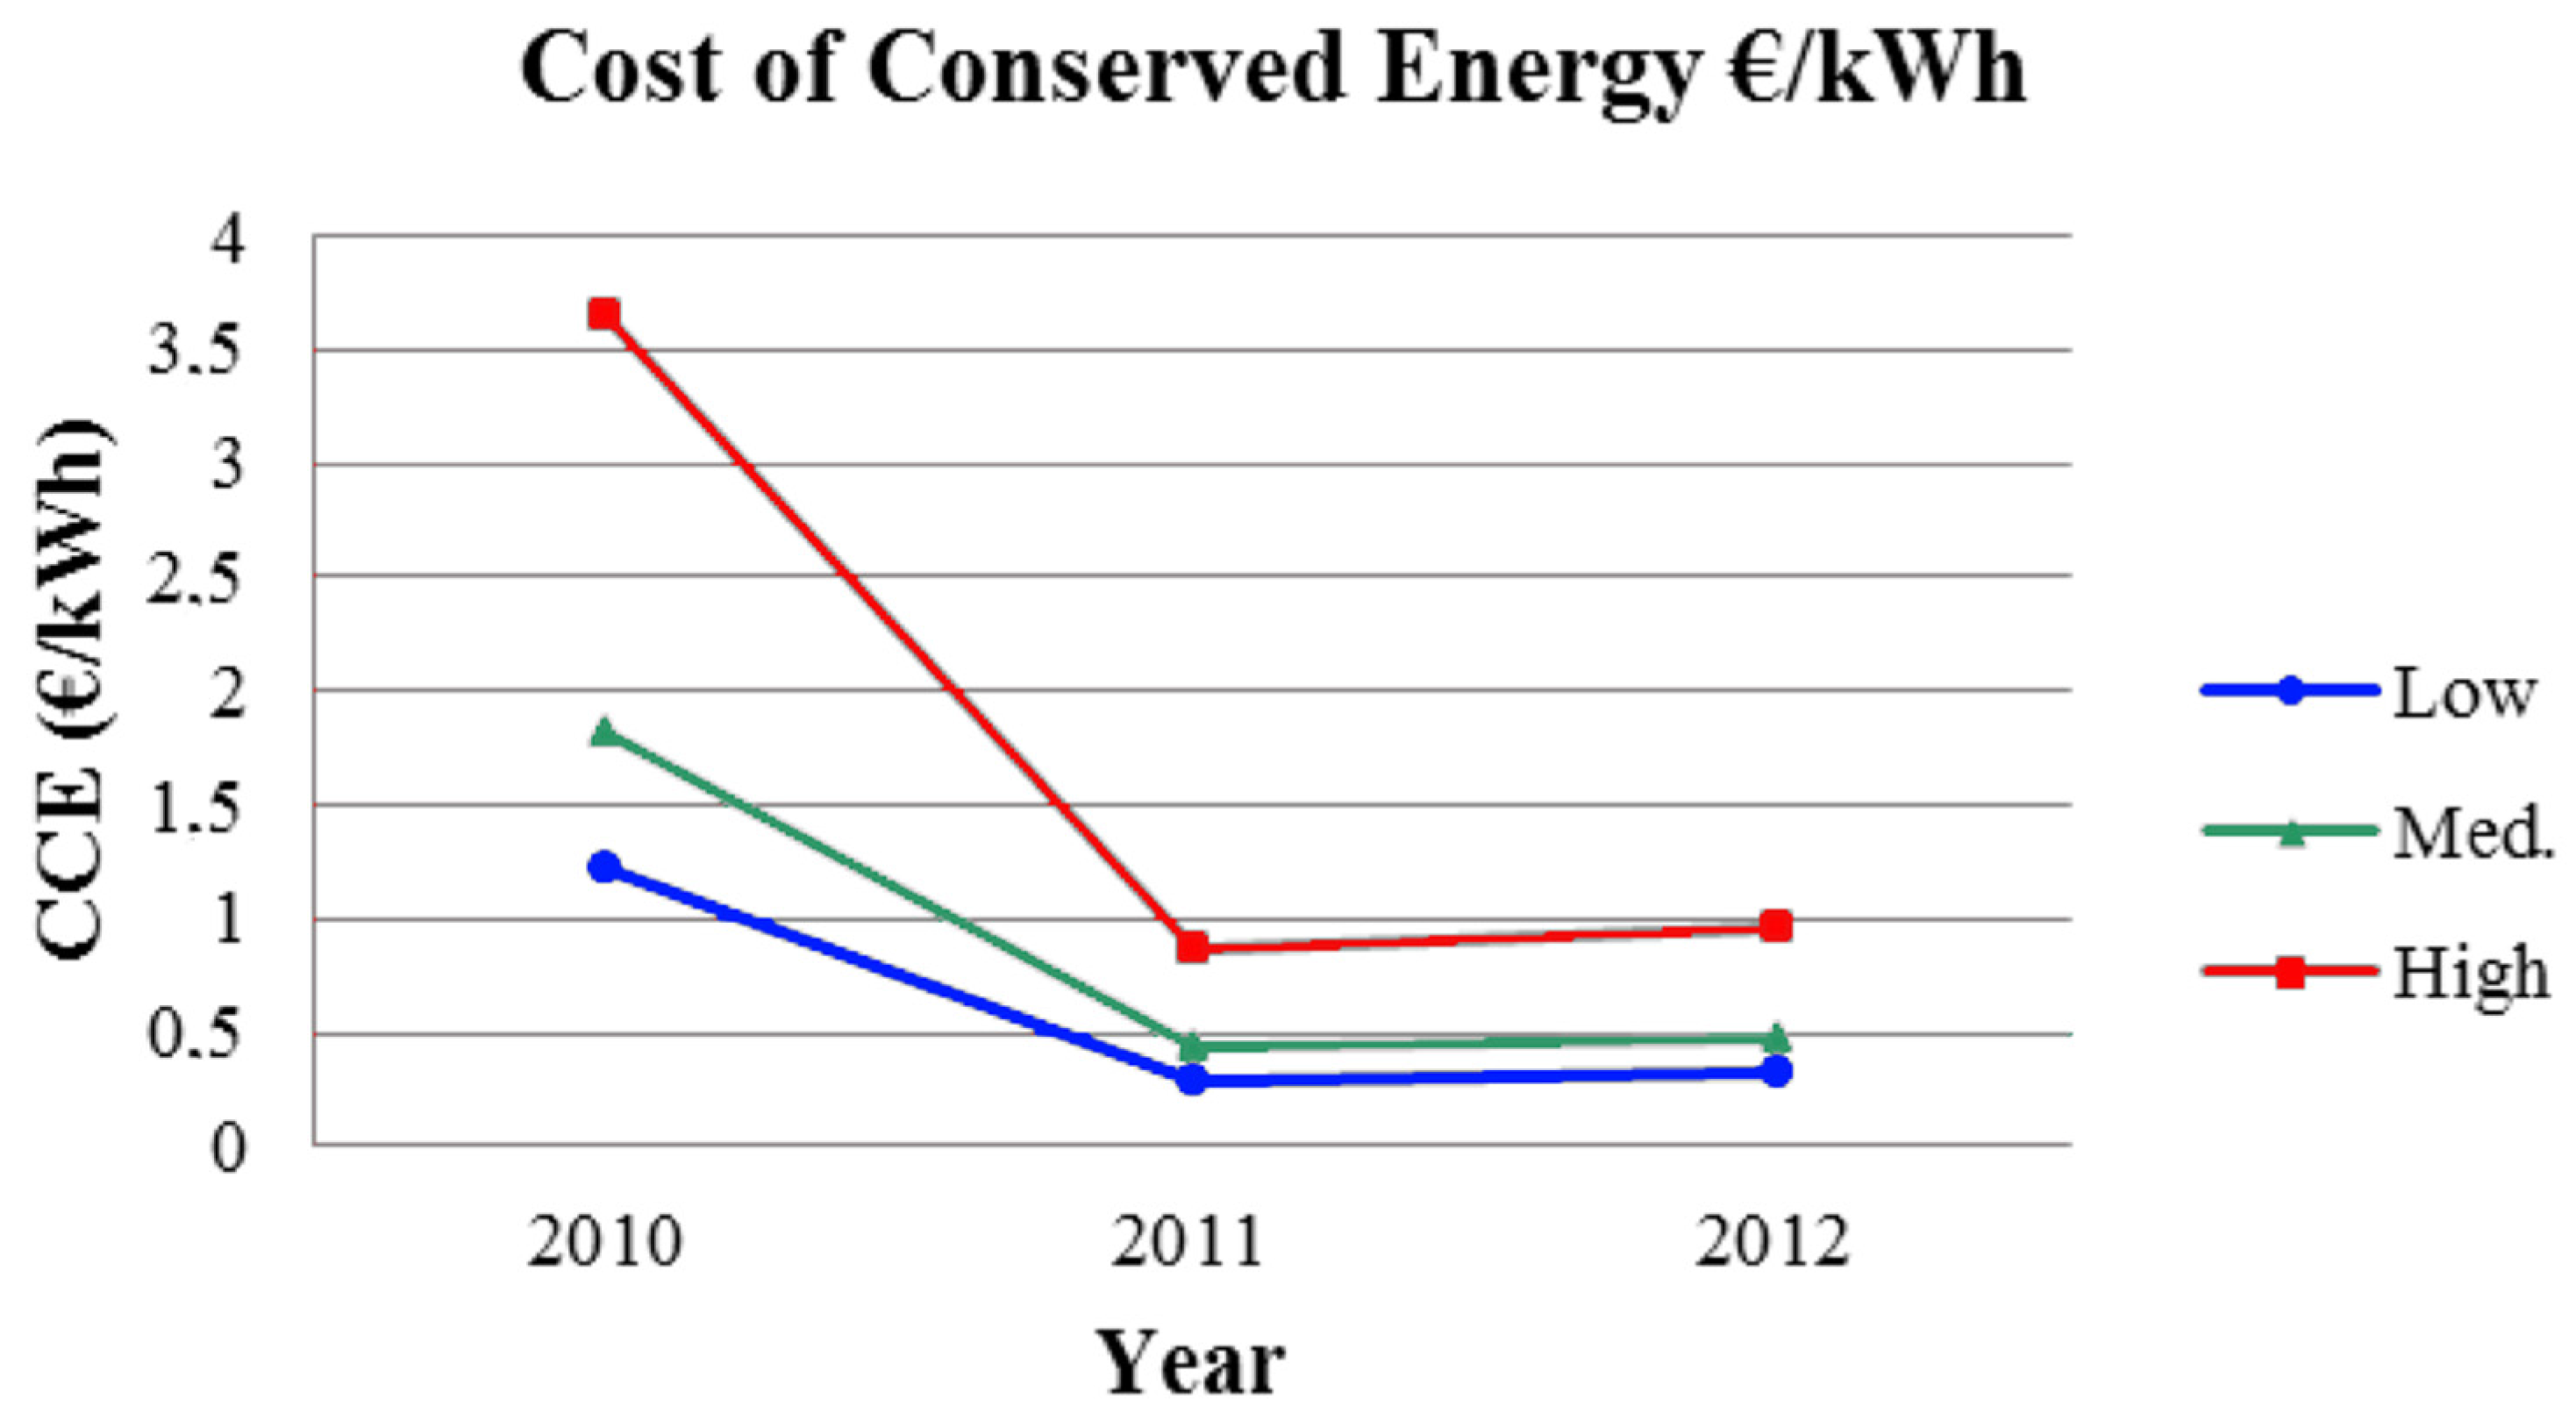
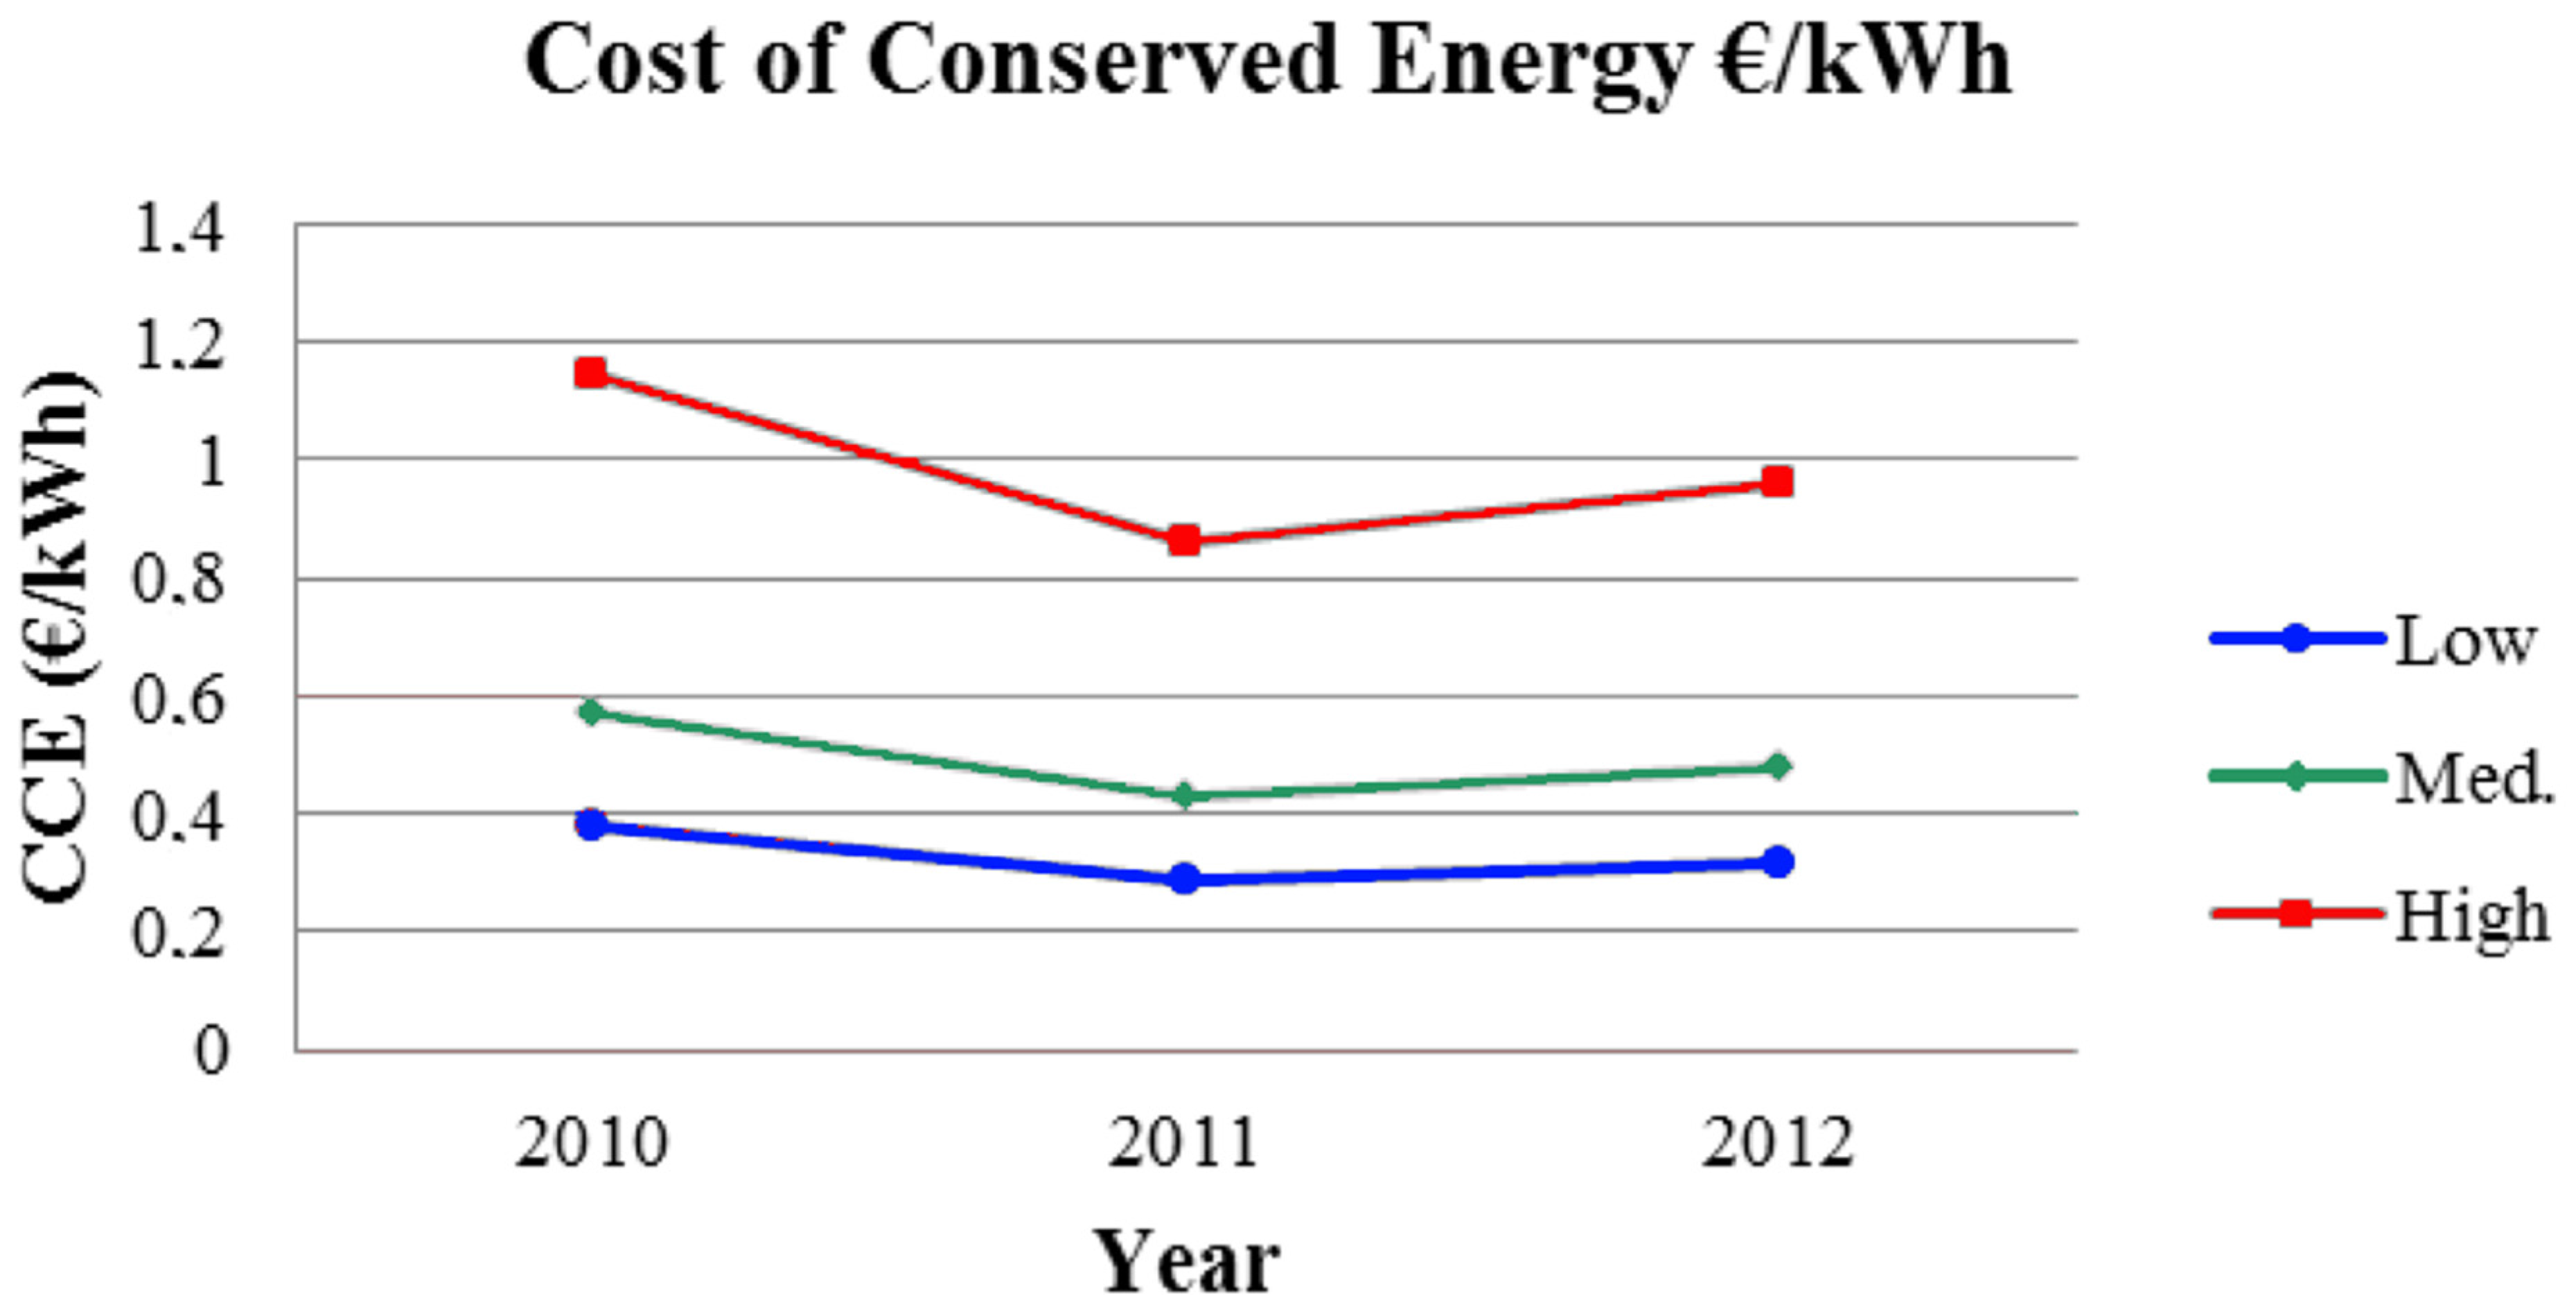
According to Equation (1), the CCE for each base case scenarios was calculated for the three years 2010–2012, as shown in
Figure 9, assuming: an average annual energy consumption of 300,000 kWh over the three years, the same average energy price, 0.15 €/kWh, and the same capital recovery factor, 0.922, in each year.
The interest rate assumed in our simulations was 3% and the discount rate d was 0.75% per year, in order to reflect the barriers to energy efficiency investment—as perceived risk, lack of information, management concerns about production, and capital constraints, within others.
The discount rate can be a relevant parameter for a sensitivity analysis.
Figure 10 shows e.g., the effect in case the real discount rate is used: a value of
d of 1.25 in 2010 brings to a
q of 1.37, while for the years 2011 and 2012, the
d value of 0.75 is maintained (with a consequent value of
q of 0.922). Thus, CCE for 2010 appears higher than for the following years [
21].
4.4. Efficiency Analysis
Expert opinion and data obtained from literature were used to choose efficiency measures and to construct a preliminary efficiency recovery for motor system based on maintenance activities, operating procedures, and conditions of the system (technical and economic feasibility).
For industrial motors, the literature related to the measures is quite rich: De Almeida et al. [
22] discussed about potentials, barriers, and solutions; Sola et al. [
23] developed a whole dedicated model; more specific indications can be found in Singh et al. [
24], McKane and Hasanbeigi [
25], and Zubergi et al. [
26].
Table 5 shows the percentage of improvement in energy efficiency. The suggested measures are prioritized according to company policies.
Since the system under analysis fell within the medium potential for energy recovery, because the plant already implemented preventive maintenance measures, the cost of conserved energy CCE for the Medium base case scenario was calculated accordingly (10%).
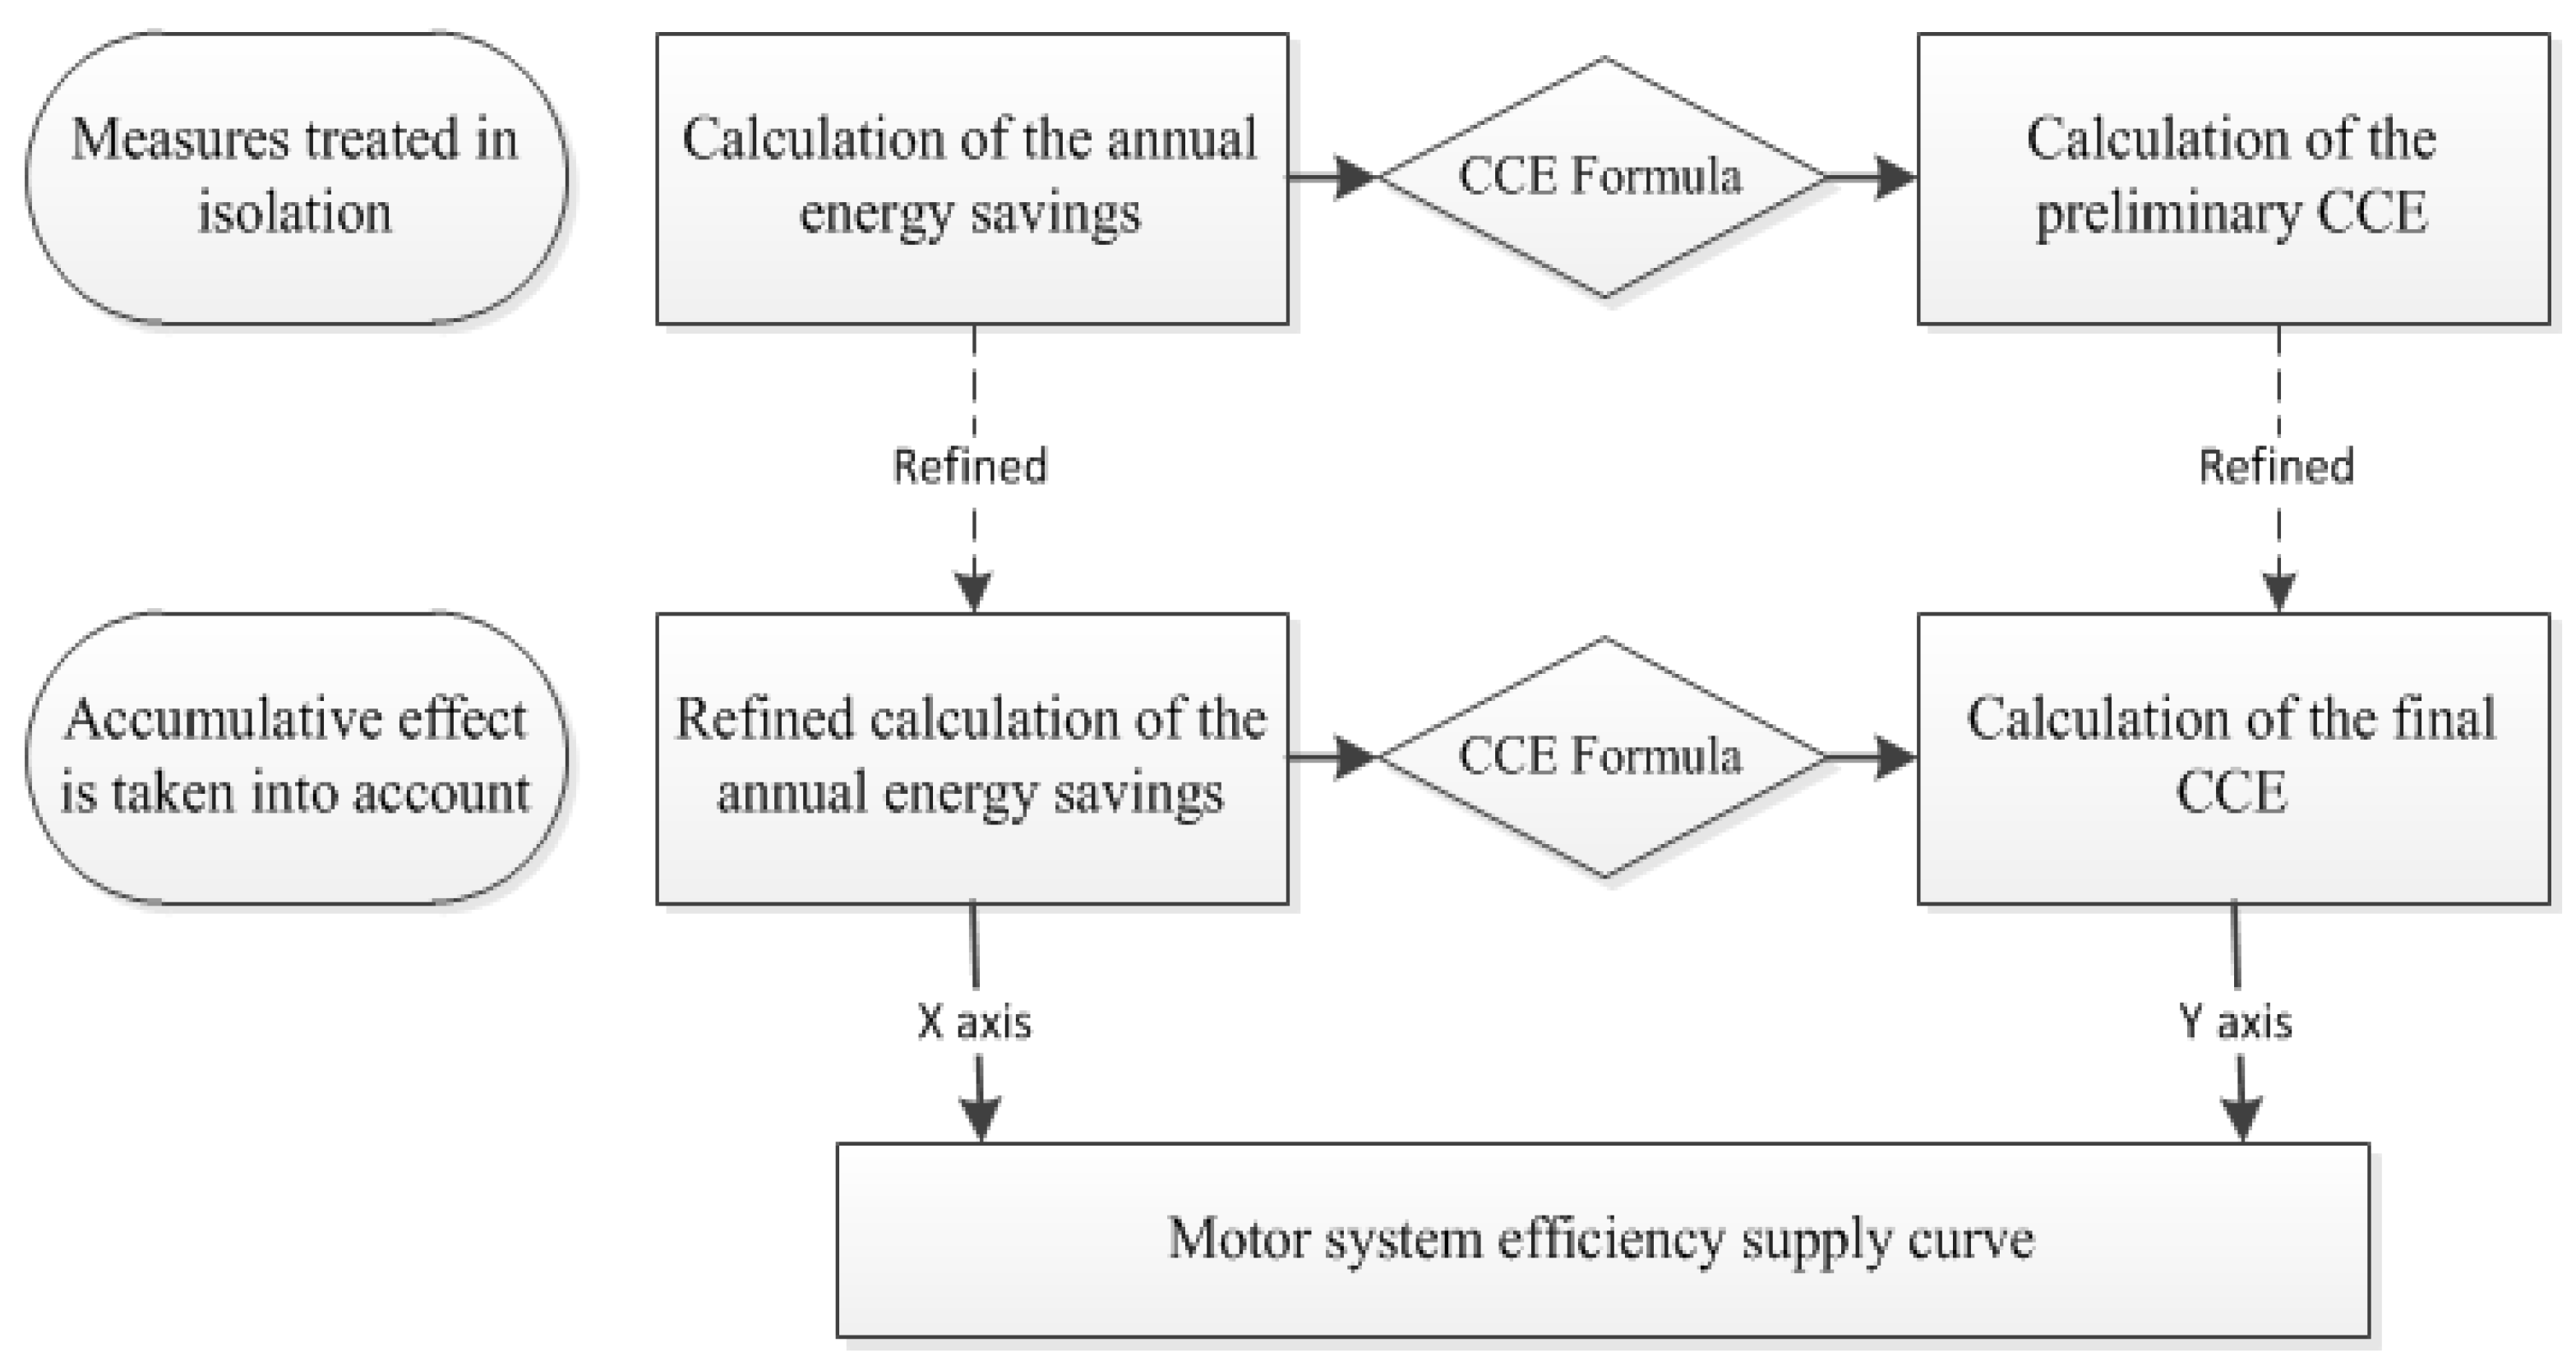
4.5. Conservation Supply Curve
Figure 11 shows the procedure according to which the calculation and data analysis was carried out. In this approach, as illustrated in detail by McKane and Hasanbeigi [
25], the measures were initially treated in isolation, and then, with a refined calculation, their mutual relation was considered. The annual electricity saving obtainable by each individual efficiency measure was estimated by using Equation (1). 2010 was used as reference year for the estimation, so in the economic analysis a constant cost of energy of 0.15 (€/kWh) was considered.
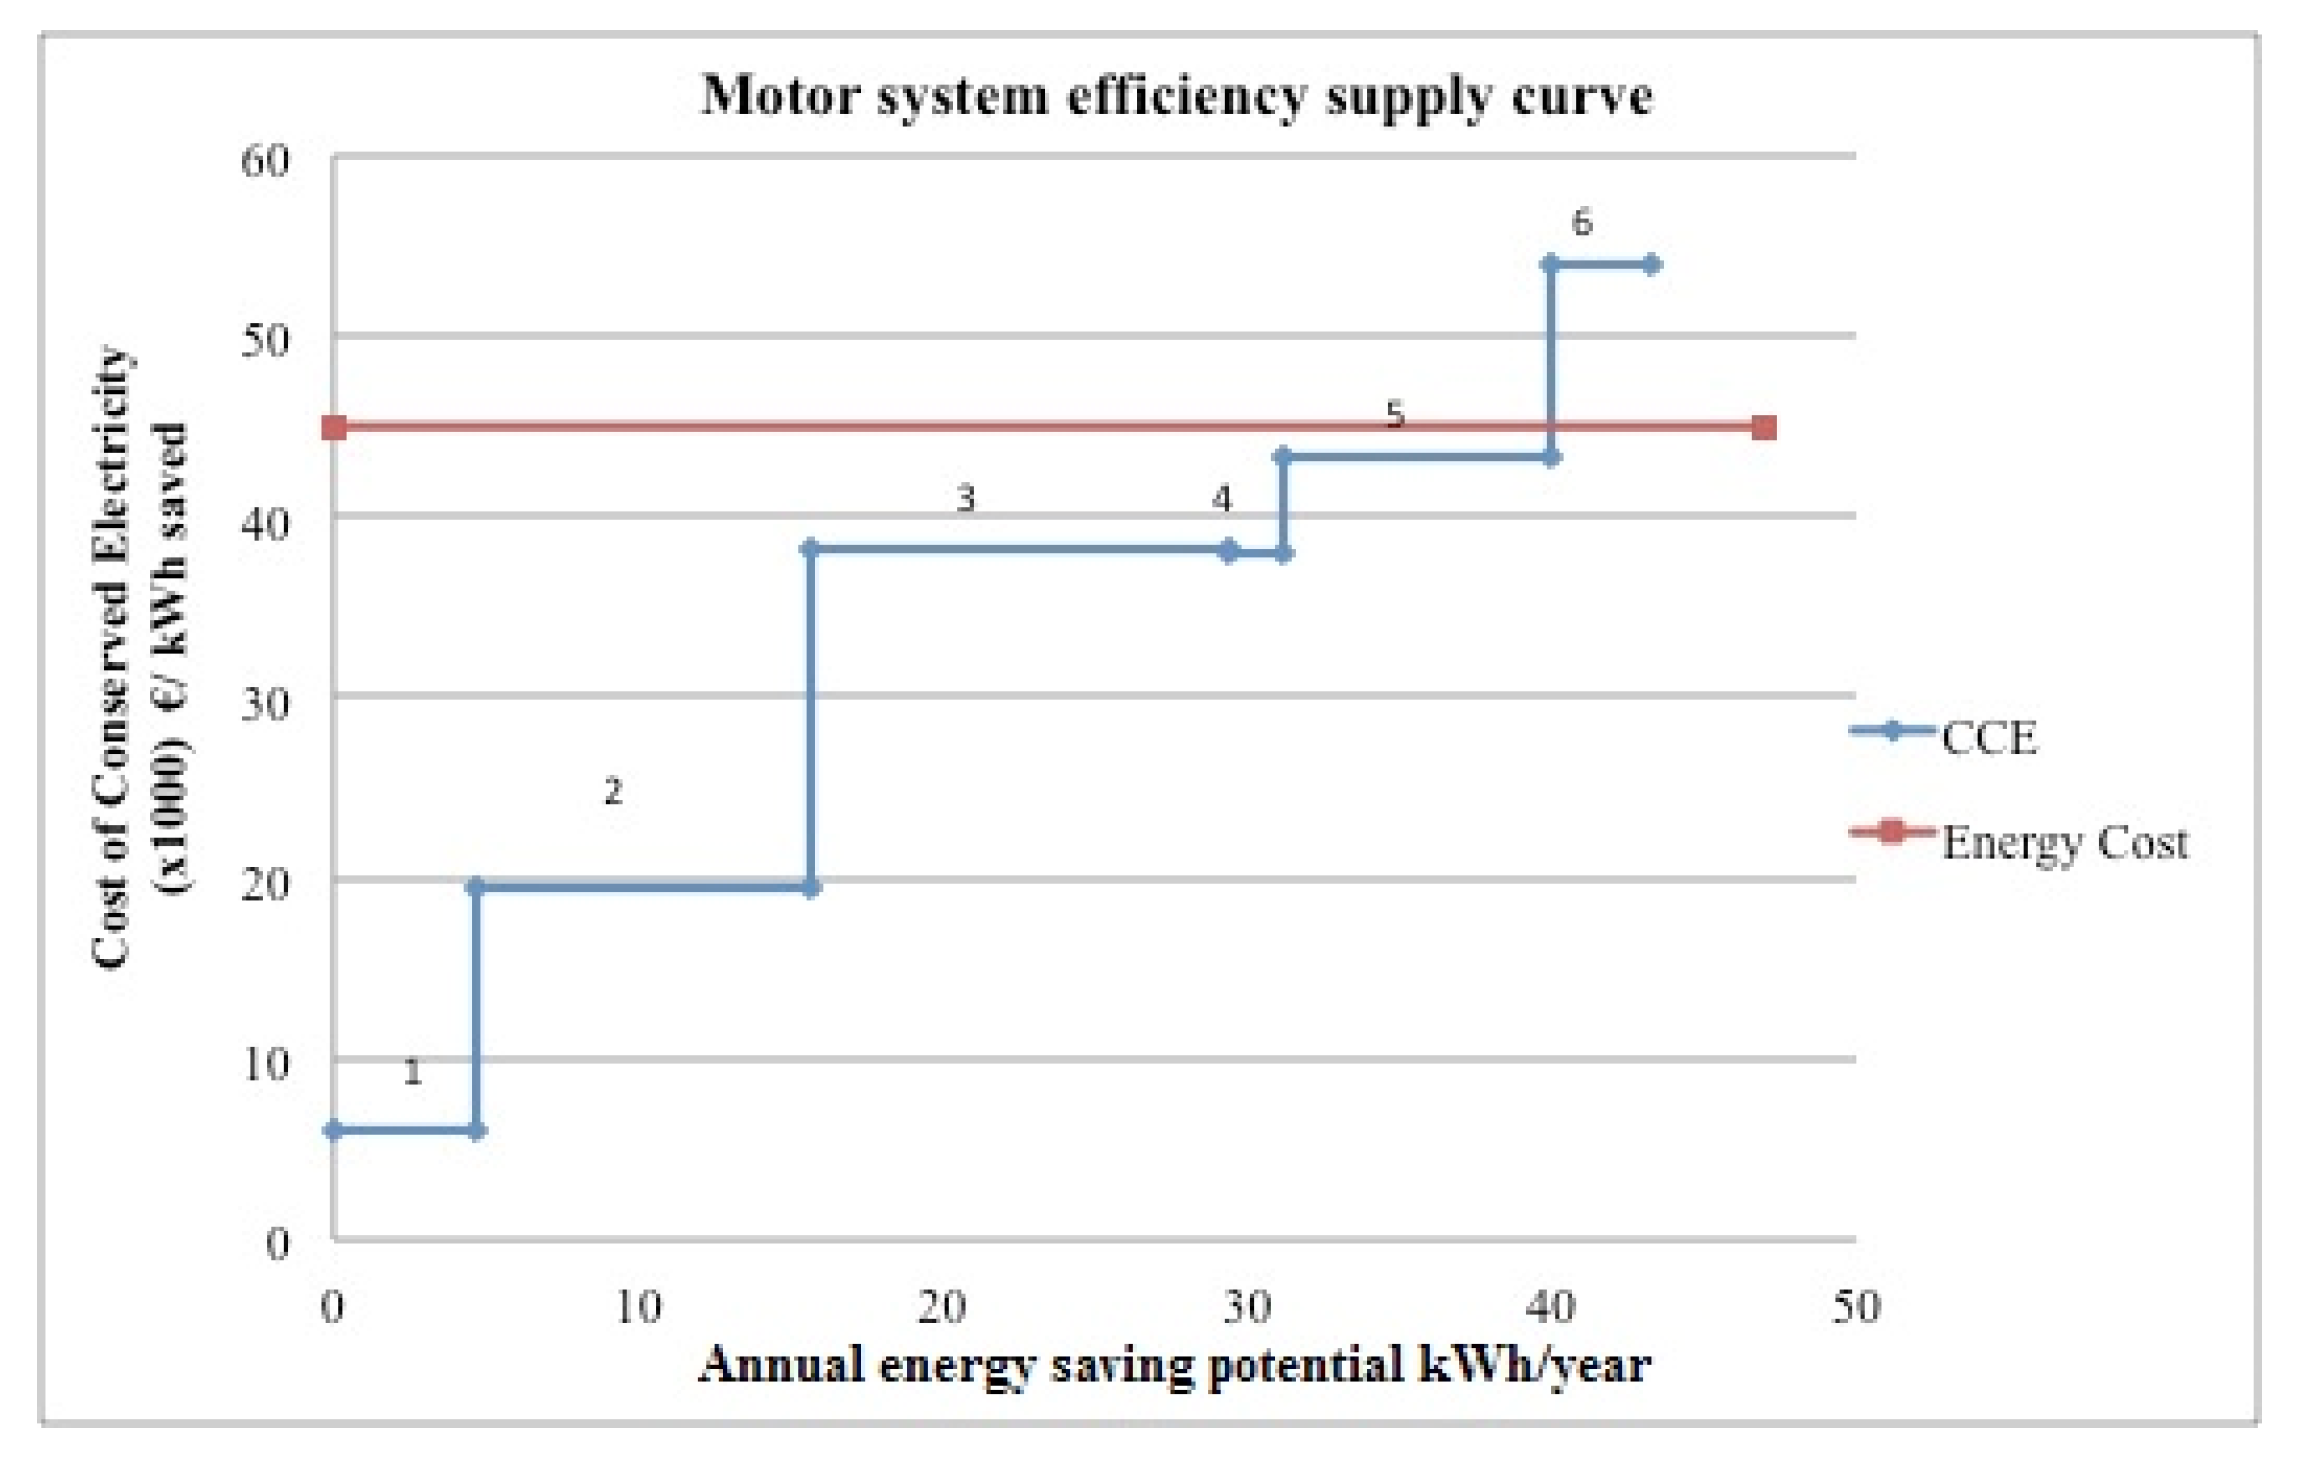
Figure 12 shows the resulting CSC as a function of the marginal CCE, taking into account the costs that are associated with the implementation of the measures in
Table 6, that explicitly accounts for the maintenance and operation costs. The technical electricity saving potential is 43,189 kWh/year.
The horizontal line in
Figure 12 represents the energy cost line. The efficiency measures that fall below the energy cost line are both technically feasible and economically feasible, while those falling above the line are technically feasible, but not cost effective.
Therefore, in this study, measure 6, entailing the use of an inverter, is technically possible, but it is not economic or convenient [
21]. The motor consumption can be instead managed minimizing the peaks during the startup or the stop of the equipment (Measure 6a), e.g., starting the motor one time a day, and turning off the motor only at the end of the daily work. This means that the motor could have a single peak of consumption (400 A) per day, for 5 s.
In 2012, some of the measures indicated in
Table 5 were undertaken: the substitution of the motor after the failure, with a more efficient one (Measure 3), and the consequent use of new belts with high transition power and maintenance free (Measure 4). Those measures brought the motor to reach the high level base case scenario. The CSC was thus recalculated according to the new hypothesis.
Table 6 shows the effect of the measures proposed with the cumulative annual electricity saving and the final CCE for the electric motor system.
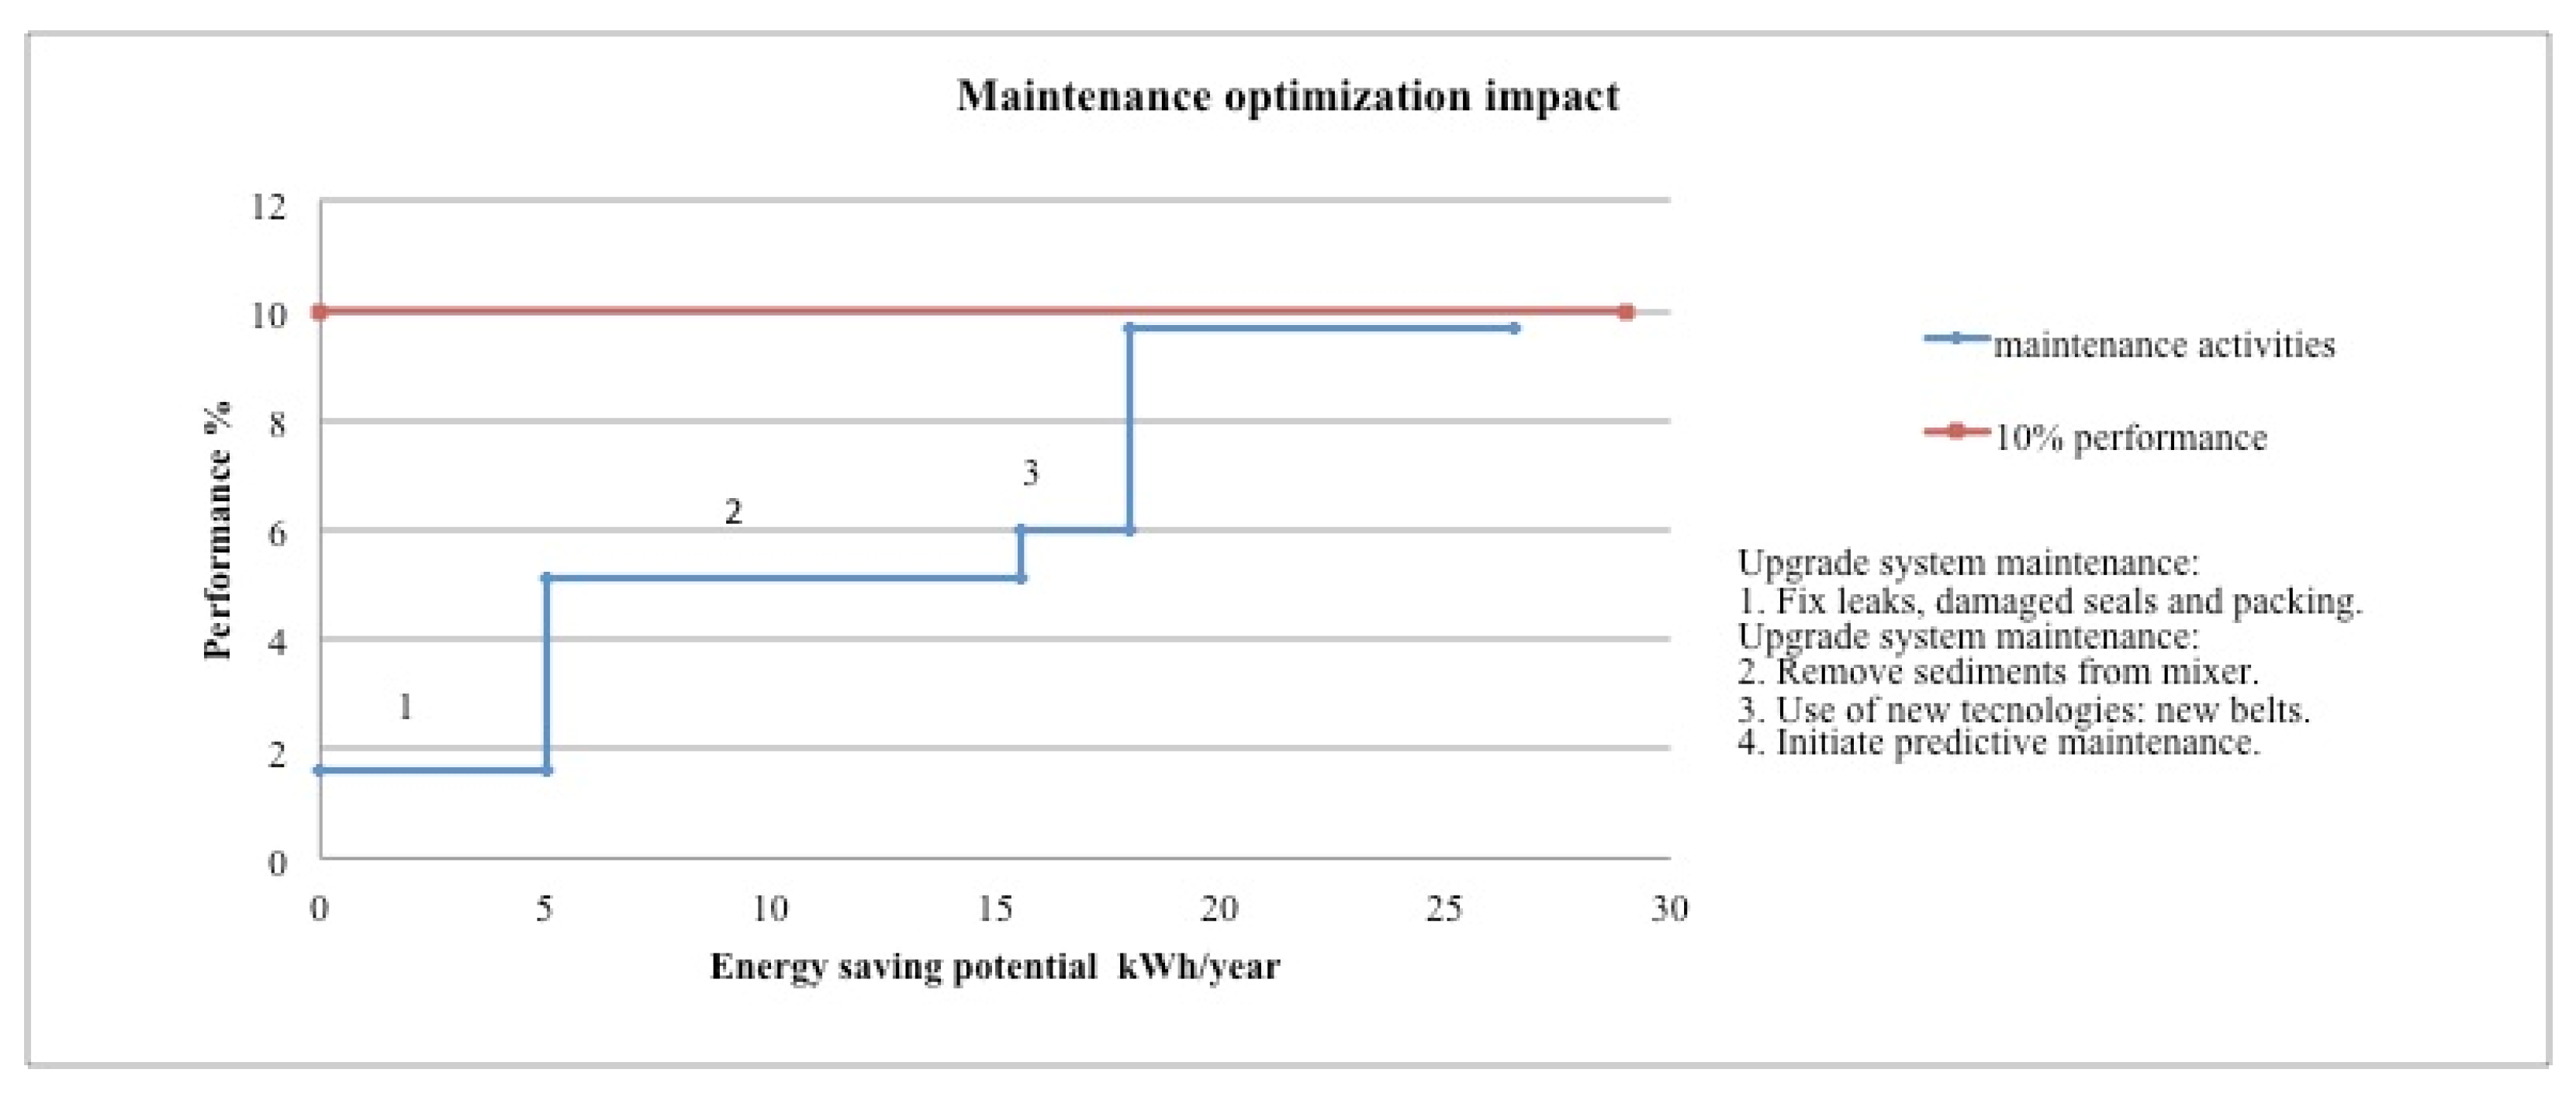
As shown in
Figure 13, results demonstrated that even only through maintenance optimization—as upgrading the maintenance of the equipment and initiating a predictive maintenance program—it is possible to increase the performance of the system by up to 10%, for a medium base case scenario.
5. Conclusions
When considering the importance of energy saving in industries, this work aimed at developing a model for energy efficiency analysis that is able to support decisions making in industrial process plants.
The methodology allows for presenting the costs and benefits of the technical and operational measures that could be implemented in energy intensive systems for the energy efficiency. With respect to literature models, the proposed one makes explicit the influence of maintenance operations and operational optimization.
The results demonstrated, that even only through maintenance optimization, the recovery could account for the 10% of the total for a medium base case scenarios electric motor system.
Furthermore, based on analysis of historical data, expert inputs and analysis of the economic impacts (balanced cost), the efficiency measures and solutions to achieve higher efficiency of the motor systems were determined.
The implementation of energy saving measures for the case study was based on both technical and economic feasibilities. On the other hand, for industrial application, some limitations have to be acknowledged: some difficulties in obtaining the historical data required for the evaluation and the presence of multiple factors that could affect the analysis—like productivity—that should be at least qualitatively considered.
However, thanks to the cooperation with the company, the analysis and the results were validated by the experts of the system. These results were compared with the results obtained using traditional method of energy balance sheet, and similar outcomes were confirmed [
21].
In the end, it has to be notices that the proposed methodology constitutes a good screening tool to present energy efficiency measures and to capture the potentials for improvement and a base to develop the tools for prognostic and health management systems in process industries.


