Centrifugal Pump Monitoring and Determination of Pump Characteristic Curves Using Experimental and Analytical Solutions


1
The Petroleum-Gas University of Ploiesti, 100680 Ploiești, Romania
2
Mewbourne School of Petroleum and Geological Engineering, The University of Oklahoma, Norman, OK 73019, USA
*
Author to whom correspondence should be addressed.
Processes 2018, 6(2), 18; https://doi.org/10.3390/pr6020018
Submission received: 12 December 2017
/
Revised: 7 February 2018
/
Accepted: 9 February 2018
/
Published: 13 February 2018
(This article belongs to the Collection Process Data Analytics)
Abstract
:Centrifugal pumps are widely used in the industry, especially in the oil and gas sector for fluids transport. Classically, these are designed to transfer single phase fluids (e.g., water) at high flow rates and relatively low pressures when compared with other pump types. As part of their constructive feature, centrifugal pumps rely on seals to prevent air entrapment into the rotor during its normal operation. Although this is a constructive feature, water should pass through the pump inlet even when the inlet manifold is damaged. Modern pumps are integrated in pumping units which consist of a drive (normally electric motor), a transmission (when needed), an electronic package (for monitoring and control), and the pump itself. The unit also has intake and outlet manifolds equipped with valves. Modern systems also include electronic components to measure and monitor pump working parameters such as pressure, temperature, etc. Equipment monitoring devices (vibration sensors, microphones) are installed on modern pumping units to help users evaluate the state of the machinery and detect deviations from the normal working condition. This paper addresses the influence of air-water two-phase mixture on the characteristic curve of a centrifugal pump; pump vibration in operation at various flow rates under these conditions; the possibilities of using the results of experimental investigations in the numerical simulations for design and training purposes, and the possibility of using vibration and sound analysis to detect changes in the equipment working condition. Conclusions show that vibration analysis provides accurate information about the pump’s functional state and the pumping process. Moreover, the acoustic emission also enables the evaluation of the pump status, but needs further improvements to better capture and isolate the usable sounds from the environment.
1. Introduction
The issue of operating centrifugal pumps with gas-liquid two-phase mixtures has been addressed by many researchers [1,2,3,4,5,6,7], as the gas will strongly affect the pump’s operability and reduce the lifetime of the system. One of the main conclusions observed in the studied literature relates to the complexity of the operation under two-phase conditions, particularly detecting when the air content becomes dangerous for the pump. A second one refers to the necessity of using experimental work for assessing the performance of a specific type of pump [6,7] to determine the equipment state when air entrapment takes place. From a process standpoint, this can be defined as non-standard, since the working parameters will deviate from the standard or expected parameters. A third conclusion refers to the difficulty of finding a general analytical model that explains the changes of the pump characteristic curve [3,6].
The development in materials and pump construction have led to an increased life time and better reliability of the products. The pump application may limit the access of personnel for a thorough visual pump inspection, so that under these conditions, the use of non-intrusive sensors can replace humans for detecting pump failure. Sometimes, air entrapment does not necessarily lead to a major failure, hence the pump may work under two-phase flow until a replacement/solution is found. However, as the pump characteristic is changing, the control system needs to know how to adjust the pumping parameters accordingly, so that the pump runs under safe conditions.
This paper shows the concept of how the pump characteristic curves transform from the normal state to the conditions of circulating a two-phase mixture. Several papers have shown and demonstrated the ability of vibrations measurement as an effective solution to identify improper machine state (such as valve opening or pump vibrations) [8,9,10,11,12,13,14] and therefore is studied in conjunction with changes of the pump characteristic curve [4]. Data acquisition of vibration and sound is directly related to large data volumes that must be transferred, stored, and processed, and therefore this technology became available with current developments in computing power. Being able to look back at the pump vibration history brings us to the actual sciences of data analytics and its processing. Nevertheless, the processing requires reference information generated through experimental investigations for calibration and validation purposes, which is the aim of this work.
Xu et al. [15] show a good synthesis of visual methods used to investigate various types of flow, particularly two-phase mixtures. The importance of optical monitoring is that it allows experiments without any direct contact with the monitored process. However, when investigating real machineries, such as pumps, it is not possible to use transparent sections for optical monitoring, because of material limitations. Therefore, our experimental design was developed around two other investigation techniques: vibration analysis and sound processing. Both technologies imply large data volumes generation, and real-time processing and analysis.
Numerous experiments on mixed gas-liquid flow were performed on centrifugal pumps. These studied to what extent the increase in the amount of gas in the liquid results in a decrease in pump performance at the same flow rate, decreasing the pumping head and efficiency. Turpin et al. published a classic study of the problem of two-phase flow in centrifugal pumps [16]. Several types of submersible multistage (5 to 8 stages) centrifugal pumps (electric submersible pumps, or ESP) were studied with a fluid mixture consisting of air-water and diesel fuel-carbon dioxide (CO2). In this study, the mixture head was calculated with the relation:
and the density of the mixture was established with the relationship:
with density of water, density of air, volumetric flow rate of water, volumetric flow rate of air at the average pressure between inlet and outlet pressure. The efficiency of the pump was calculated from the ratio of the output hydraulic power to the input electric motor power:
The volumetric gas fraction () was calculated with as (see Section 6 for nomenclature):
It has been found that the pump head is reduced as the volume of gas in the mixture increases, and the limit for the air volumetric fraction in the air-water mixture was 0.11, at which the pumping height was about 50% of the pumping height for single phase water flow. At this fraction, the head began to oscillate between two values within a time frame of 1–2 s. The limit for CO2 in the CO2-diesel fuel mixture was 0.40, at which point the pumping height was about 90% of the height when only pumping diesel fuel.
The influence of the pressure at the pump inlet on the two-phase mixture flow through the pump was studied as well. It was found that a pressure increase at the pump inlet from 3.5 barg to 6.9 barg and then to 27.5 barg resulted in a better behavior of the pump’s characteristic (close to the liquid characteristic) and even entertained the possibility of operating at higher volumetric fraction of gas (up to 0.5). A relationship between the heads (liquid only) and (liquid-gas mixture), was sought:
In this relation, the function has different mathematical expressions depending on the type of pump on which the experiments were made. An important factor, , was defined:
which allows to determine the conditions of validity of relationship (5), which is valid (there is a connection between the two heads ) for . Moreover, must have acceptable values compared to (the head produced by mixture flow is still a substantial part of the liquid-only head).
Of course, there are some valuable studies previously published that capture the essential findings of Turpin et al. [16] Mikielewicz [17] used a semi-empirical method to compare the performance of a liquid-only centrifugal pump with a pump carrying gas and liquid phases. A parameter named head-loss ratio is used, which is the apparent loss of head in two-phase flow divided by the loss of head in single-phase flow. The density of the mixture is expressed as:
and alternatively, the mixture head prediction can also be expressed by multiplying the single-phase head with the mixture-water density ratio, a relationship which can be used as a correction model for the pump characteristic curve:
Minemura et al. [18] introduced an analytical model to predict the performances of a centrifugal pump under air-water flow conditions. The two-phase model is solved numerically in the case of a radial flow pump and predicts the head and shaft power of the centrifugal pump. The precision is within ±20% of the rated flow capacity (resulted from comparison with experimental results).
With technology advancements, the two-phase centrifugal pump studies began to include computer simulations using finite element methods. Fu et al. [19] presented a 3D model of a centrifugal pump in 2016. The elements of a centrifugal pump assembly were modeled in a drafting software and was imported into a finite element method (FEM) program. The boundary conditions were dictated by the pump inlet pressure and mass flow at the pump outlet. A FEM analysis was performed for various volumetric gas fractions, and monitoring points along current lines were analyzed. The results, verified by experimental tests, indicate a slight decrease in the pumping height at low volumes of gas. At large volumes of gas, the pumping height suddenly decreases. Increasing the suction pressure results in a better behavior (head reduction is lower at the same flow as the suction pressure increases). The limits of 0.1 for the volume fraction of the gas for minor influences over the pump characteristic and 0.15 for the gas volumetric fraction for unstable behavior are indicated.
Computational fluid dynamics (CFD) multiphase models are a common method of investigating centrifugal pumps. Medvitz et al. [20] indicate the possibilities of cavitation detection and analysis of pump performance near cavitation. The reduction of the head in the case of two-phase flow is included into a model based on the forces acting on bubbles within centrifugal impellers [6,21,22]. Computational Fluid Dynamics (CFD) is a very powerful instrument in the analysis of two phase flow, an aspect proven by the very good agreement with the experimental results.
Minggao et al. [23] demonstrated that operating at parameters other than designed, especially at low flow rates, leads to an increase in vibration energy. Decreasing the centrifugal pump performance means wasted energy, and the vibration level of the pump is an indicator. A close connection between the flow aspect and the vibration energy can be found in [2].
Zhang et al. [24] show that the vibration signals can be used to monitor fully developed cavitation in centrifugal pumps. In this way, the cavitation detection method by determining the decrease of pumping height by 3% is replaced with a vibration analysis.
More complex methods have also been developed, using neural networks to analyze centrifugal pump vibration under different conditions [25,26], resulting in promising results in associating the vibration frequency with a certain defect and abnormal pump operation. As an alternative method, the noise measurement is correlated with the operation of the centrifugal pump, enabling the determination of conditions when cavitation occurs in a centrifugal pump by using sound analysis [8,10,11,12,13,14,27,28,29]. Alfayeza et al. [27] used an application of acoustic emission to detect incipient cavitation. However, it has been found that in the case of cavitation detection, the technique is only use5ul at the incipient cavity. At developed cavity, there is a phenomenon of noise attenuation.
The sound detection technology used for this project is rather simple, but strong developments have been made in the area of robotics or unmanned aerial vehicles (UAV) [10]. According to Hoshiba et al. [10], there are five main challenges that need to be developed in order to better adapt sound technique as a remote sensing technology:
- sound source localization (such as signal from a safety whistle [13]);
- real-time processing and intuitive visualization tools;
- robustness of the device in outdoor environments
If the first three challenges are mainly based on the hardware quality and performance, the last two challenges will require a large amount of real time data analyzing and a complex network of acquisition and interpretation software. Kim et al. [14] show the possibility of using a single microphone combined with a small profile monaural structure to locate the source of the sound.
Neumann et al. [30] studied gas accumulation in centrifugal pumps under steady-state two-phase flow conditions for gas flow rates up to 5% by using high-resolution gamma-ray computed tomography and a synchronized CT scanning technique within the impeller region. This approach allowed the analysis of the inlet flow conditions and gas fraction distributions and gas holdup within the impeller region on the pump performance, showing that inlet flow conditions dominate pump performance characteristic and, for the first time, a visualization of thin gas films at the impeller pressure side.
Controlling the operating parameters of submersible oil extraction pumps (ESP), which depends on the amount of gas dissolved in oil, is also a very important practical problem [17,26,31,32]. Mikielewicz et al. [17] indicated how to determine the conditions in which pump instability occurs when increasing the amount of gas. A technique based on neural networks (as in the cavitation case) was developed to determine the safe operating region.
2. Materials and Methods
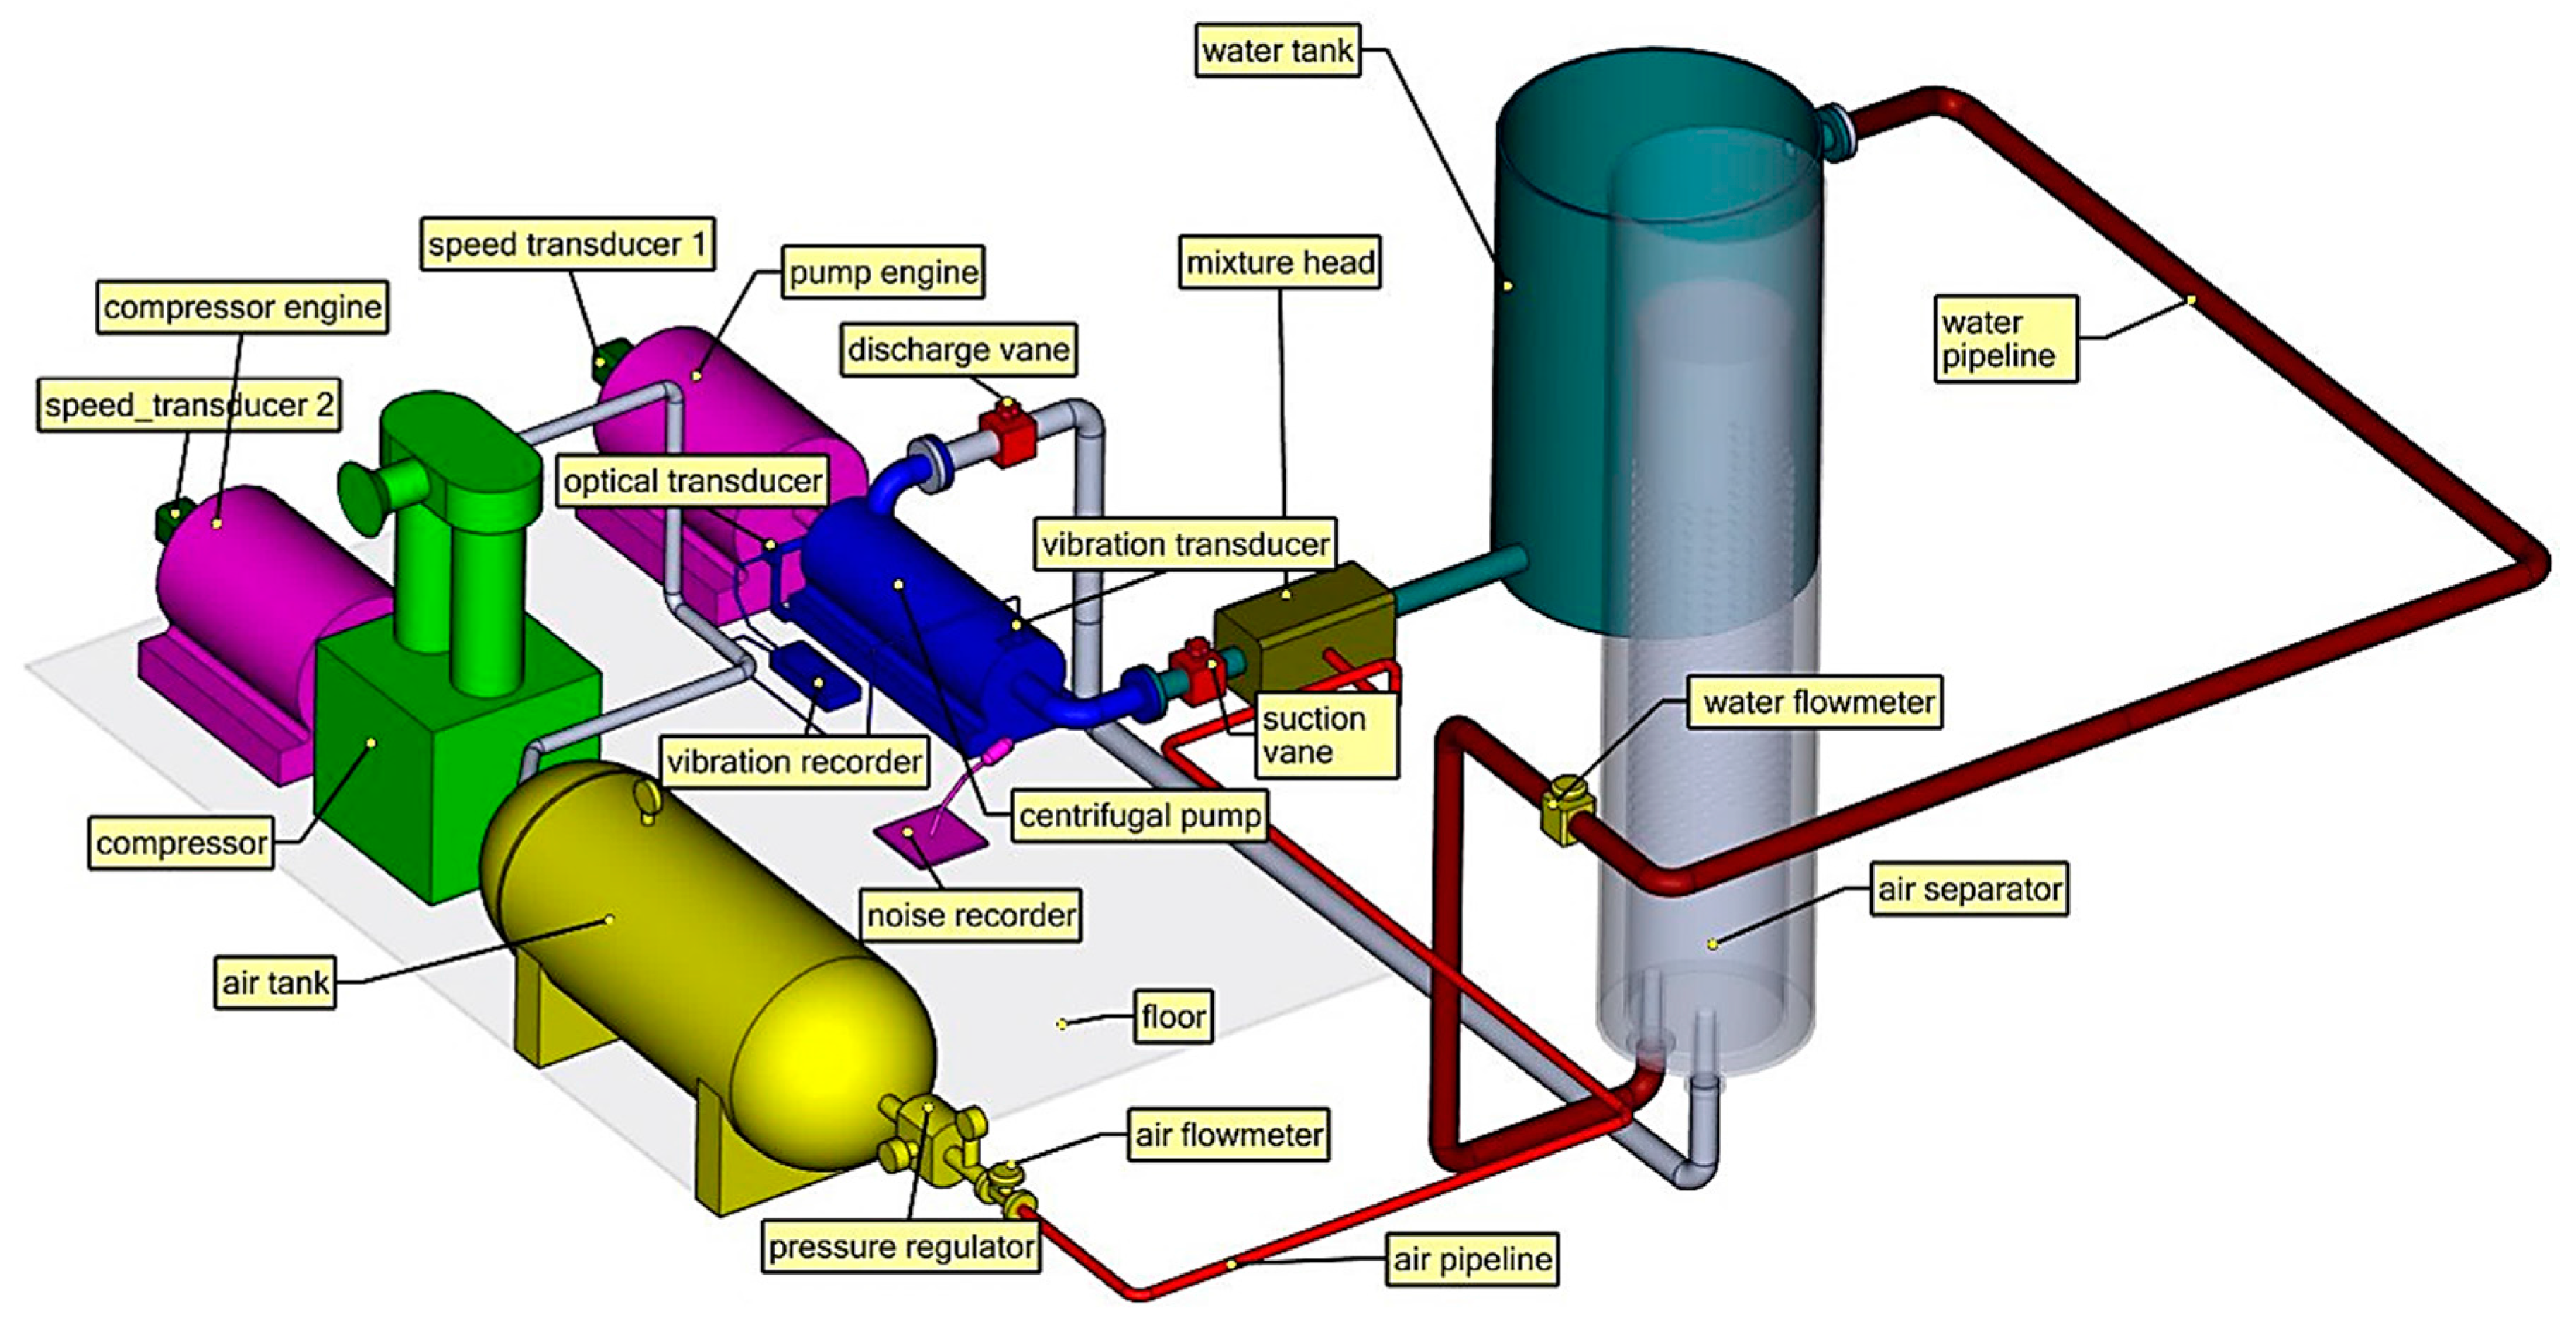
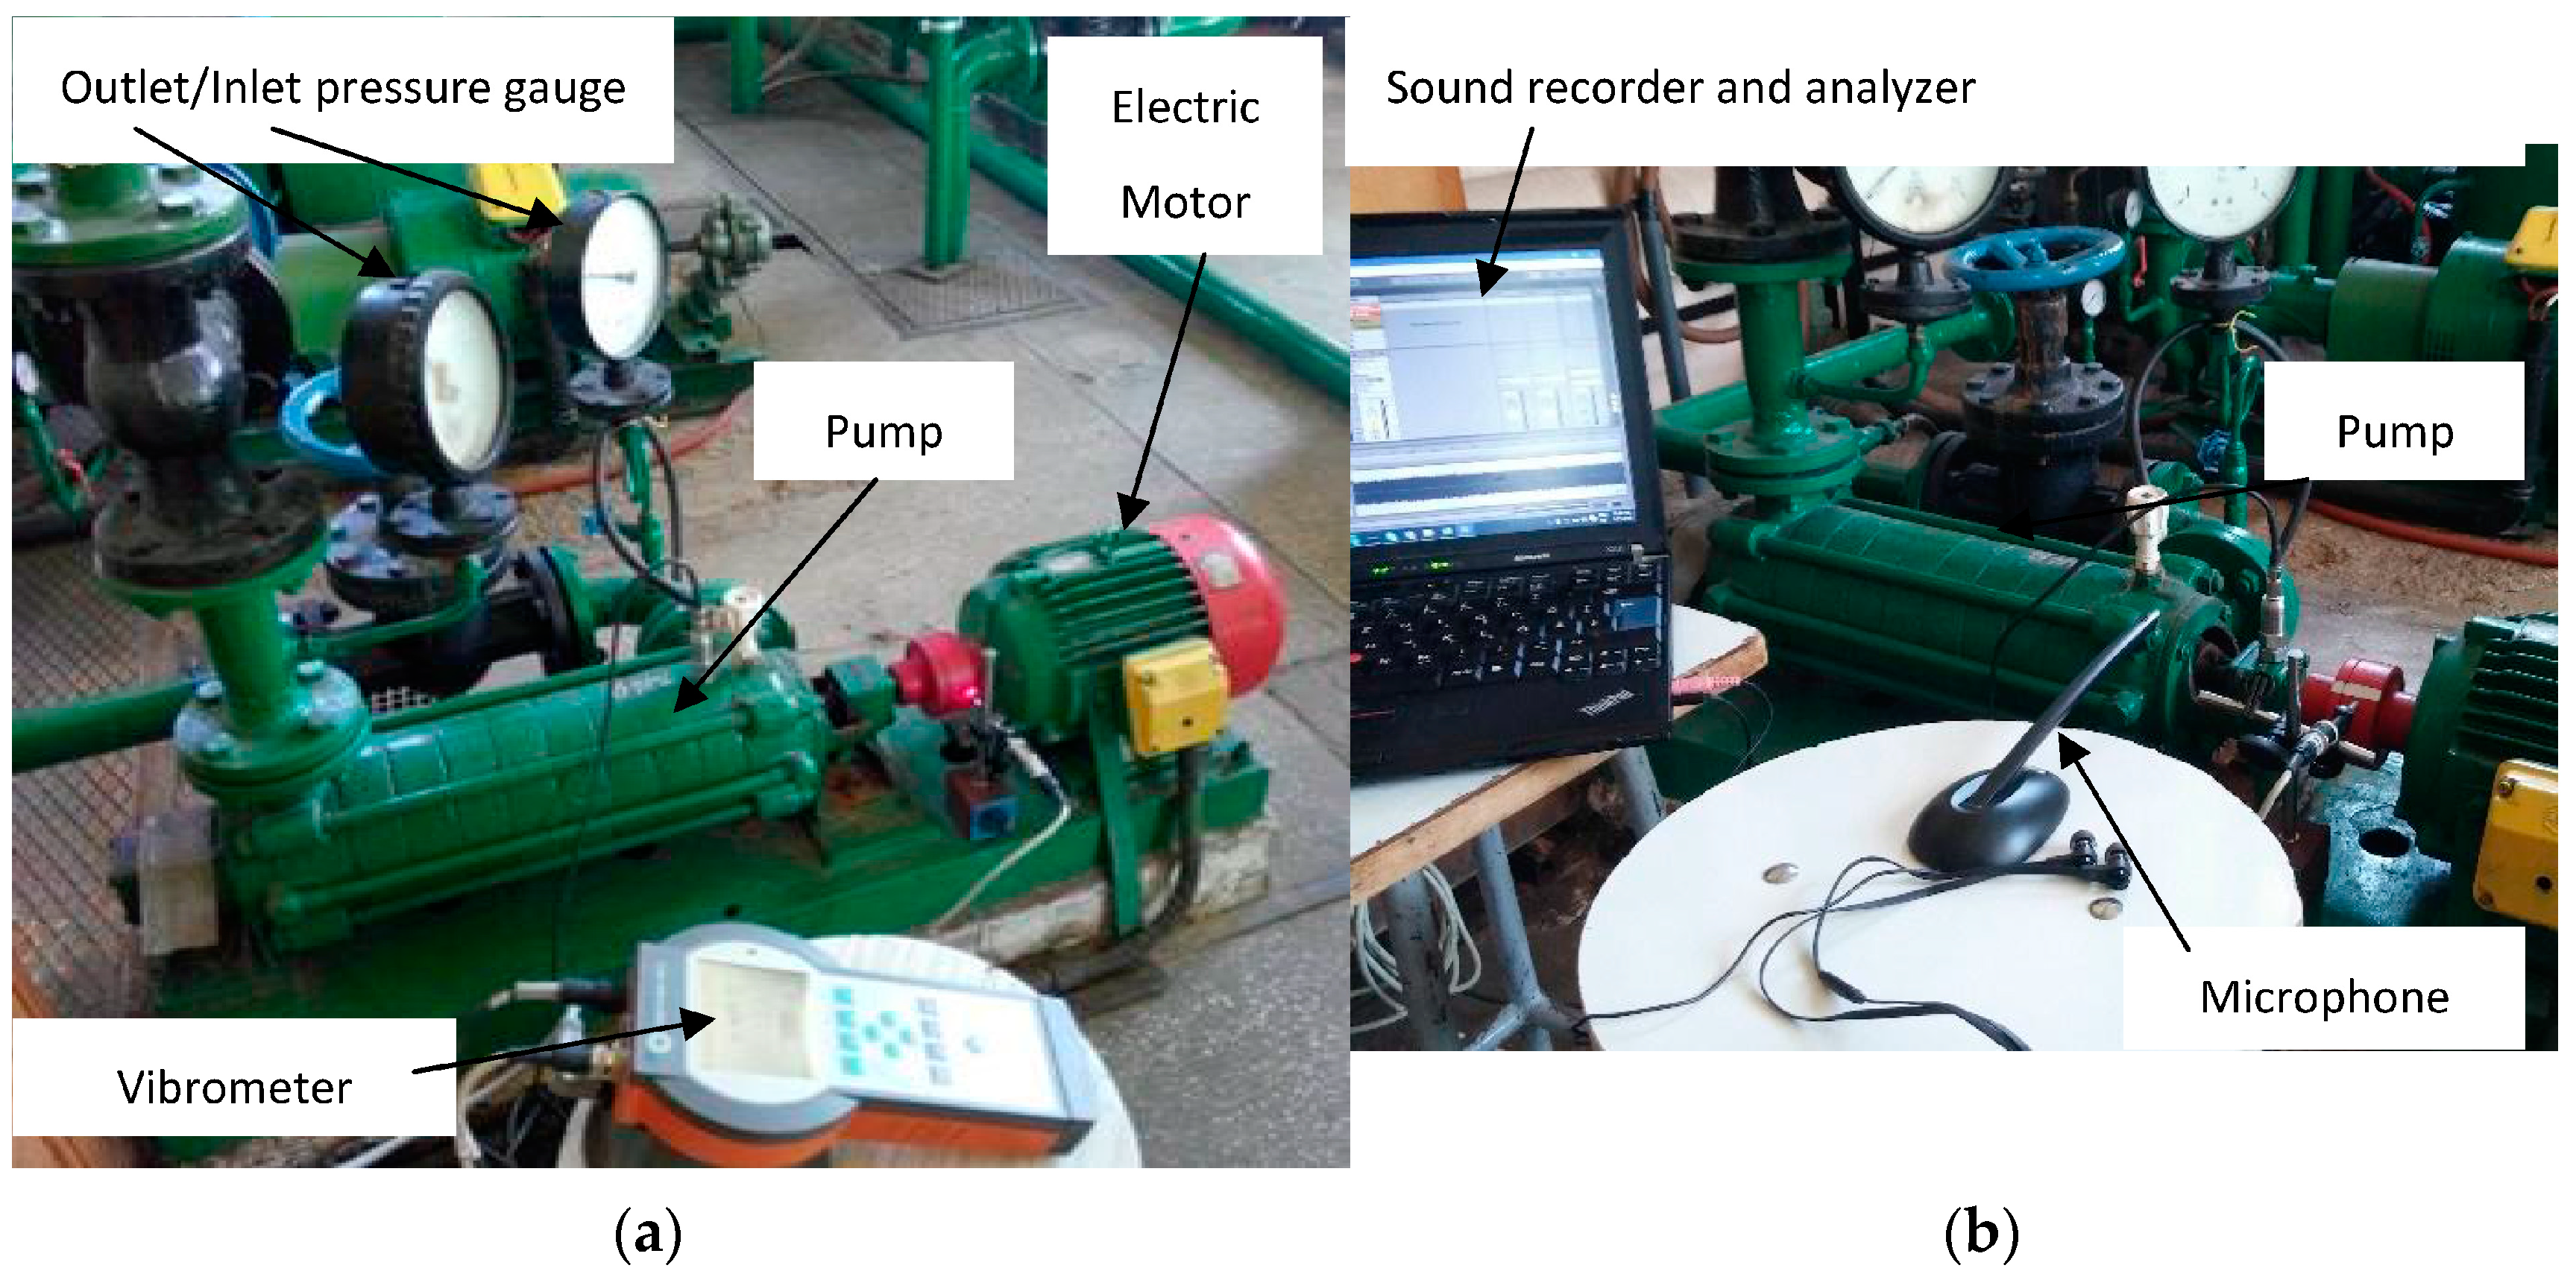
The stand used in this work is formed by a centrifugal pump (main parameters are presented in Table 1), driven by an alternative current motor (nominal speed 2950 RPM, engine power of 5.5 kW), an air compressor, a separator tank and a water tank (see Figure 1). The pump used for the experiment is designed for clean, corrosive or non-corrosive fluids with gas (sea water, hot water, overheated water, acid and base solutions, gas and liquids mixture), and is produced by Aversa Manufacturing. The engine speed at the compressor (direct current motor) can be adjusted by changing the intensity of the current supply with a rheostat. A speed measuring gauge is mounted on the motor shaft (both at pump engine and compressor engine through a PCE-DT 65 tachometer. The pump is linked with the motor through a mechanical coupling to compensate misalignments. The pump flow rate is controlled with the discharge valve, while the pump flow is measured using a turbine flow meter (FTB 1318 Omega, 45–855 L/min). The hydrostatic head created by the centrifugal pump is determined by the pressure difference between the pressure gauges mounted on the suction and discharge of the pump (see relationship 1). Water enters the pump through the suction vane. The air is added to the water in the mixture head for homogenization. The air pressure and flow rate are measured after leaving the air tank through the air regulator (see Figure 1). The mixture is then transferred by the pump through the discharge vane into the separator and then the water goes into the water tank. The water flow rate is measured before entering the mixture head, while pressure is monitored before and after exiting the pump through pressure gauges. The pump rotational speed is measured through a sensor mounted on the electric motor shaft that is directly driving the pump. As shown in Figure 2, the noise receiver is mounted on an isolated surface outside of the pump setup.
All experiments have been performed with the centrifugal pump operating with water (used as reference) and an air-water mixture. The air-water mixture is generated by adding air, which is provided by a reciprocating compressor into the mixing head (EC 5H1, manufactured by Hidromecanica with the following parameters: 5.5 kW power, 160 L/min suction flow, 10 barg maximum discharge pressure). The air pressure of the intermediate vessel is adjusted with a pressure regulator so that the desired gas amount is introduced. The air flow of the compressor is measured by a flow meter (FTB 932-Omega, 0.75–5 cubic feet per minute). At the outlet pipe, the air-water mixture passes through a separator (here, the velocity of the mixture is increased and the pressure is reduced) which separates air at the top, and water without air is introduced again into the water tank.
The vibration level on the pump housing is measured with a vibration transducer (Brüel & Kjær Type 8341 accelerometer), which measures acceleration and calculates velocity (see Equation (9)) by using the root mean square (RMS) of the last 8 records (RMS vibration recorder). The measurements also involve the simultaneous recording of the pump shaft speed with an optical transducer, mounted next to the pump coupling. The results are stored in the vibrometer (Brüel & Kjær TYPE 2270).
where v is the velocity, a is the measured acceleration, and f is the frequency.
Although the data acquisition system automatically computes the RMS velocity, conventionally, one would first plot the acquired velocity versus frequency, then sum the area below this curve for 8 consecutive records. Taking the square root of the sum will deliver the RMS of velocity.
As a secondary measurement, an omni-directional microphone is installed 1 m away from the pump (see Figure 2), to record the environmental sound or the acoustic signature of the system, which can be used to detect changes in the standard working condition of the equipment (e.g., cavitation process). The microphone, connected to a Digital Audio Workstation, has a response bandwidth of 50–20 kHz and a sensitivity of −48 dB. The high-fidelity field microphone has been used to monitor changes in the amplitude and frequency of the sound generated by the pumping system at normal operating conditions and once air enters the flow loop. The sound was recorded in real-time through a Digital Audio Workstation (Ableton™) and processed by using the SPAN Plus plug-in created by Voxengo™. Through Fourier Transformation, this displays the recorded waveform as an amplitude versus frequency plot over the recorded time, allowing us to analyze changes in amplitude and frequency.
An overview of the pump, motor and sensors positioning is shown in Figure 2. As mentioned, two methods of determining the vibration were used: a vibration velocity transducer (Figure 2a) and a sound level meter (Figure 2b). Both methods manage to capture changes in the equipment working condition, with a better accuracy achieved through the vibration velocity transducer, which is closer to the pump. For incompressible single-phase fluids at a known intake pressure and temperature, the pressure increment developed by a specific stage is a function of the flow rate and the density. For air-water mixtures, the pressure increment of the centrifugal pump stage is directly proportional to the mixture’s fluid density.
3. Results
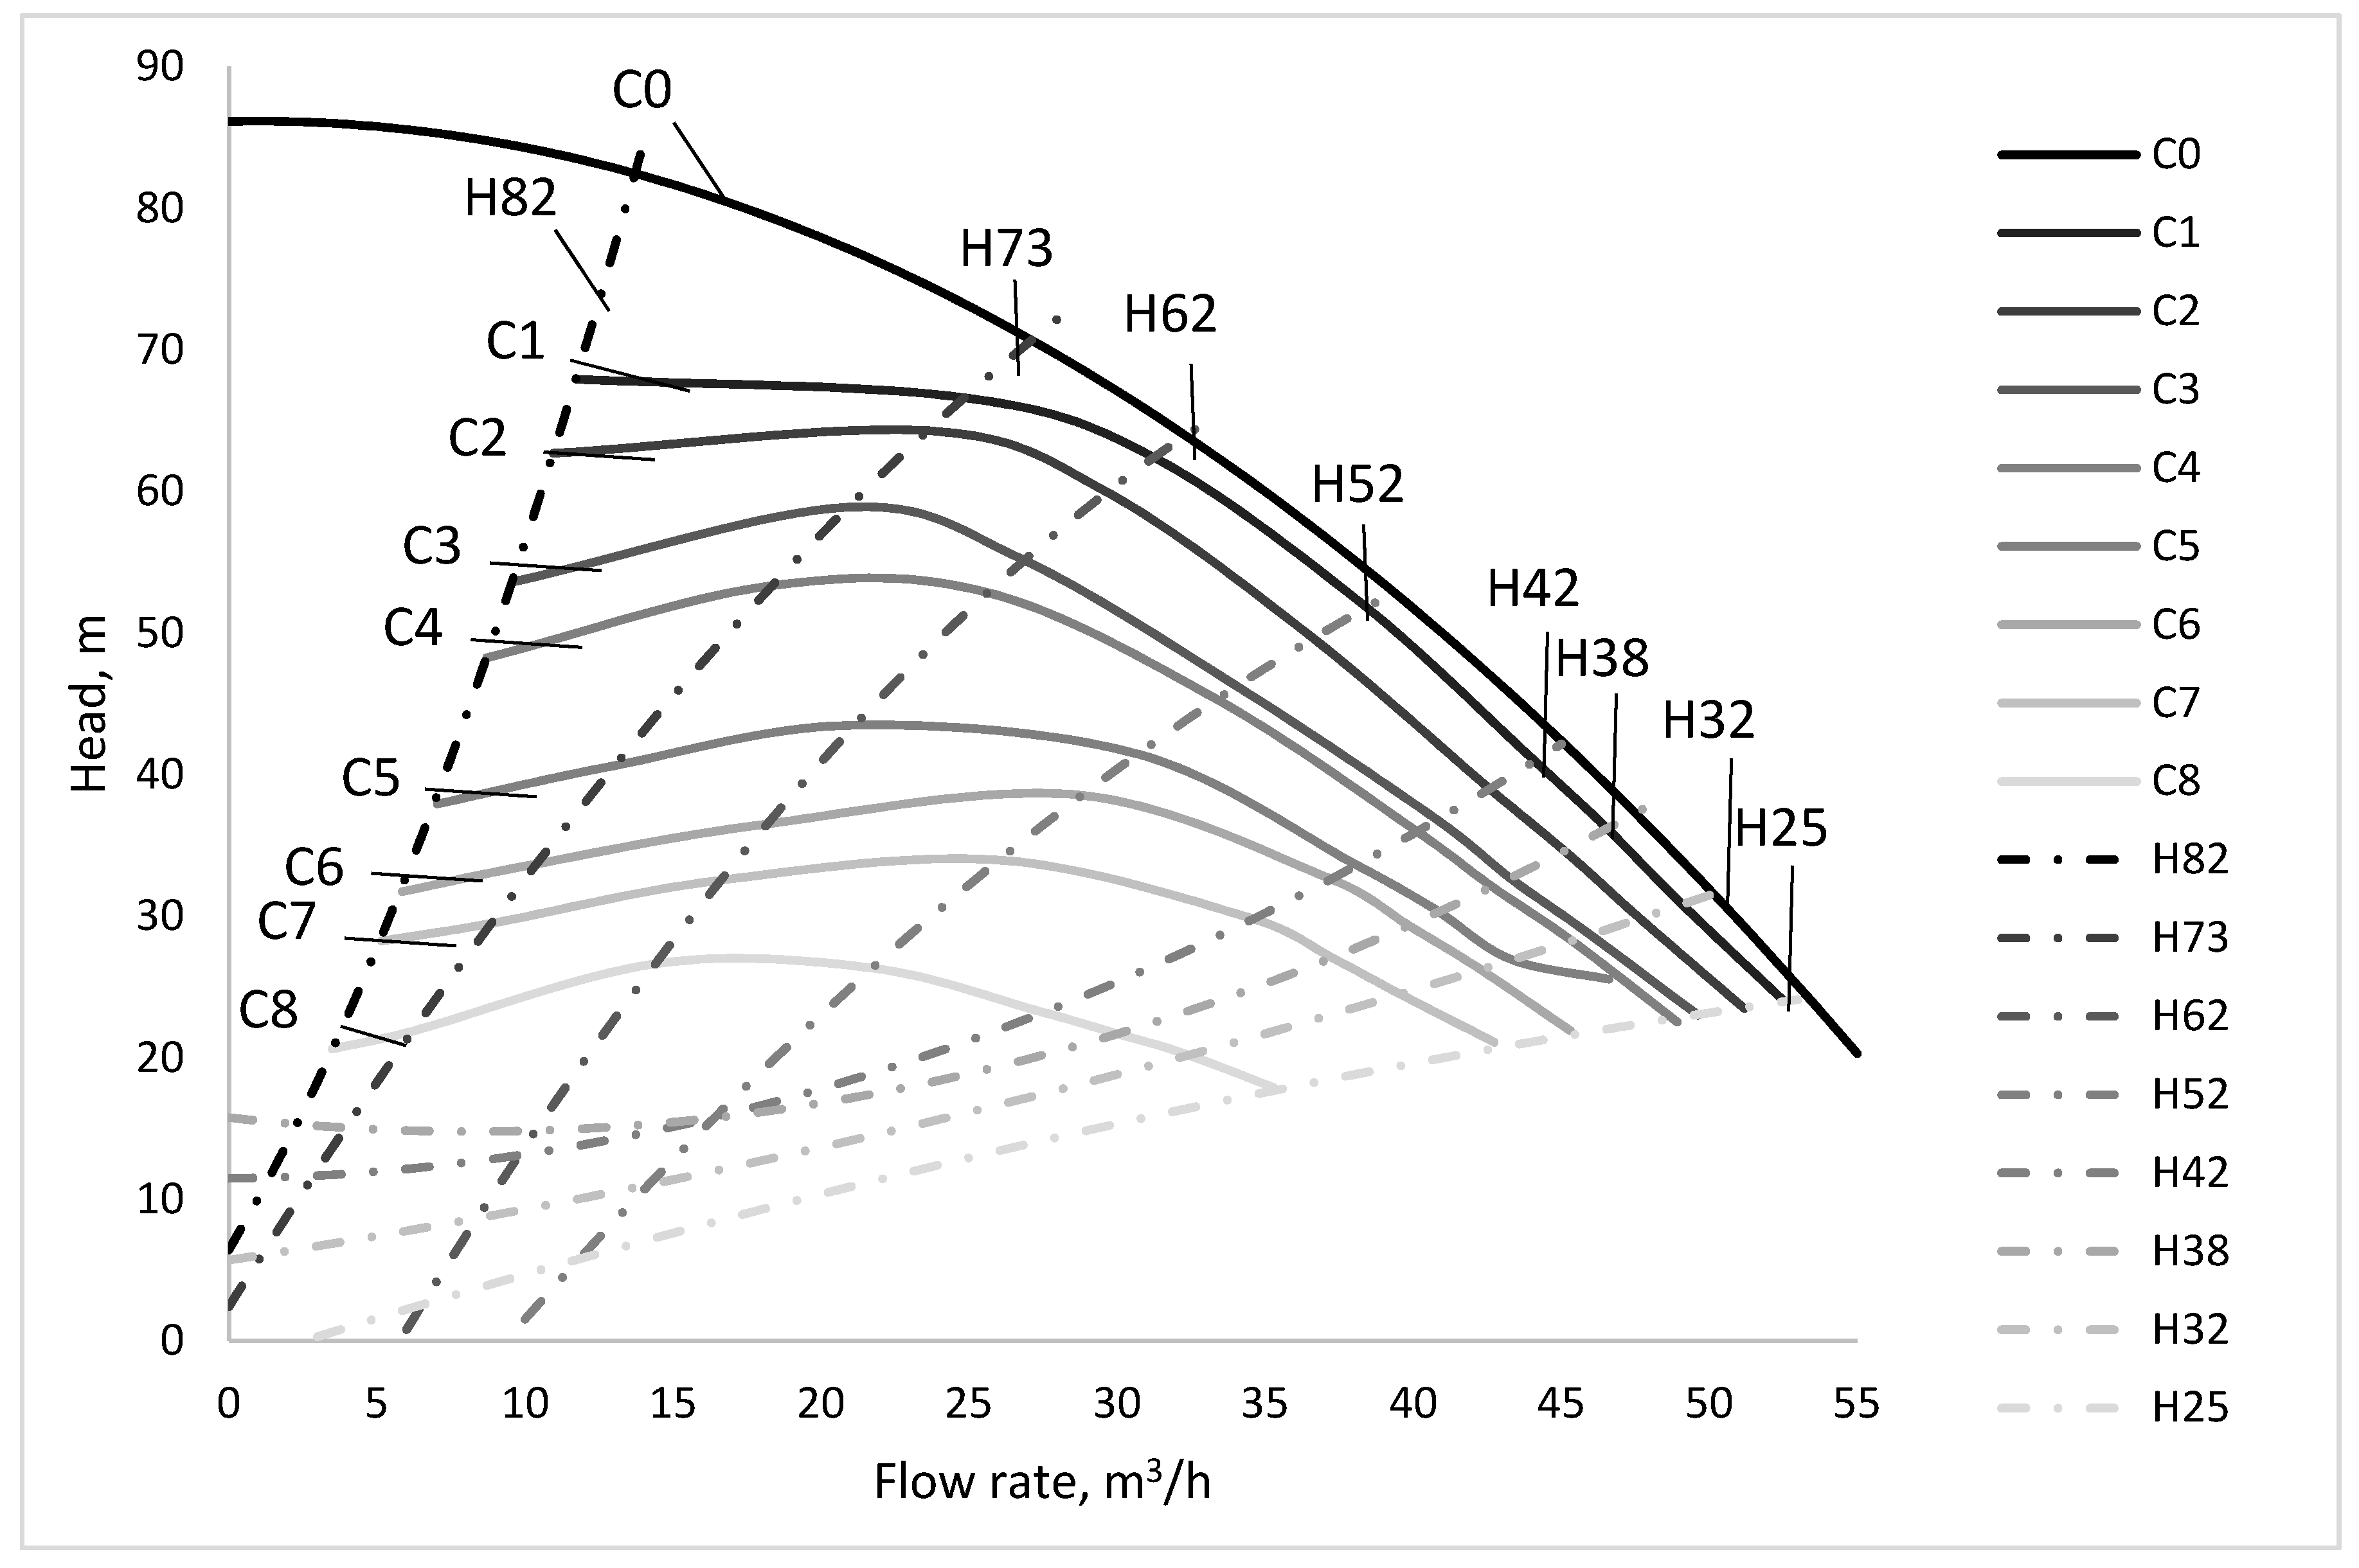
The experiments were performed on the stand from Figure 1. The parameters of the centrifugal pump used are listed in Table 1, and Table 2 gives an overview of the pump flow rates and water head in the handled scenarios. The characteristic curves of the centrifugal pump shown in Figure 3 were obtained by measuring the following values: Q—pump flow rate; ρm—mixture density; pd—pressure at the outlet of the pump; ps—pressure at the pump inlet; Qa—air flow rate.
To study the influence of the air/water ratio, different air flow rates have been mixed with water through the mixing head. The comparison with the normal situation of operation is shown in Figure 3. The following flow rate values (Qa) have been used: 1.28 m3S/h; 1.60 m3S/h; 1.92 m3S/h; 2.24 m3S/h; 2.56 m3S/h; 2.88 m3S/h; 3.2 m3S/h; and respectively 3.52 m3S/h.
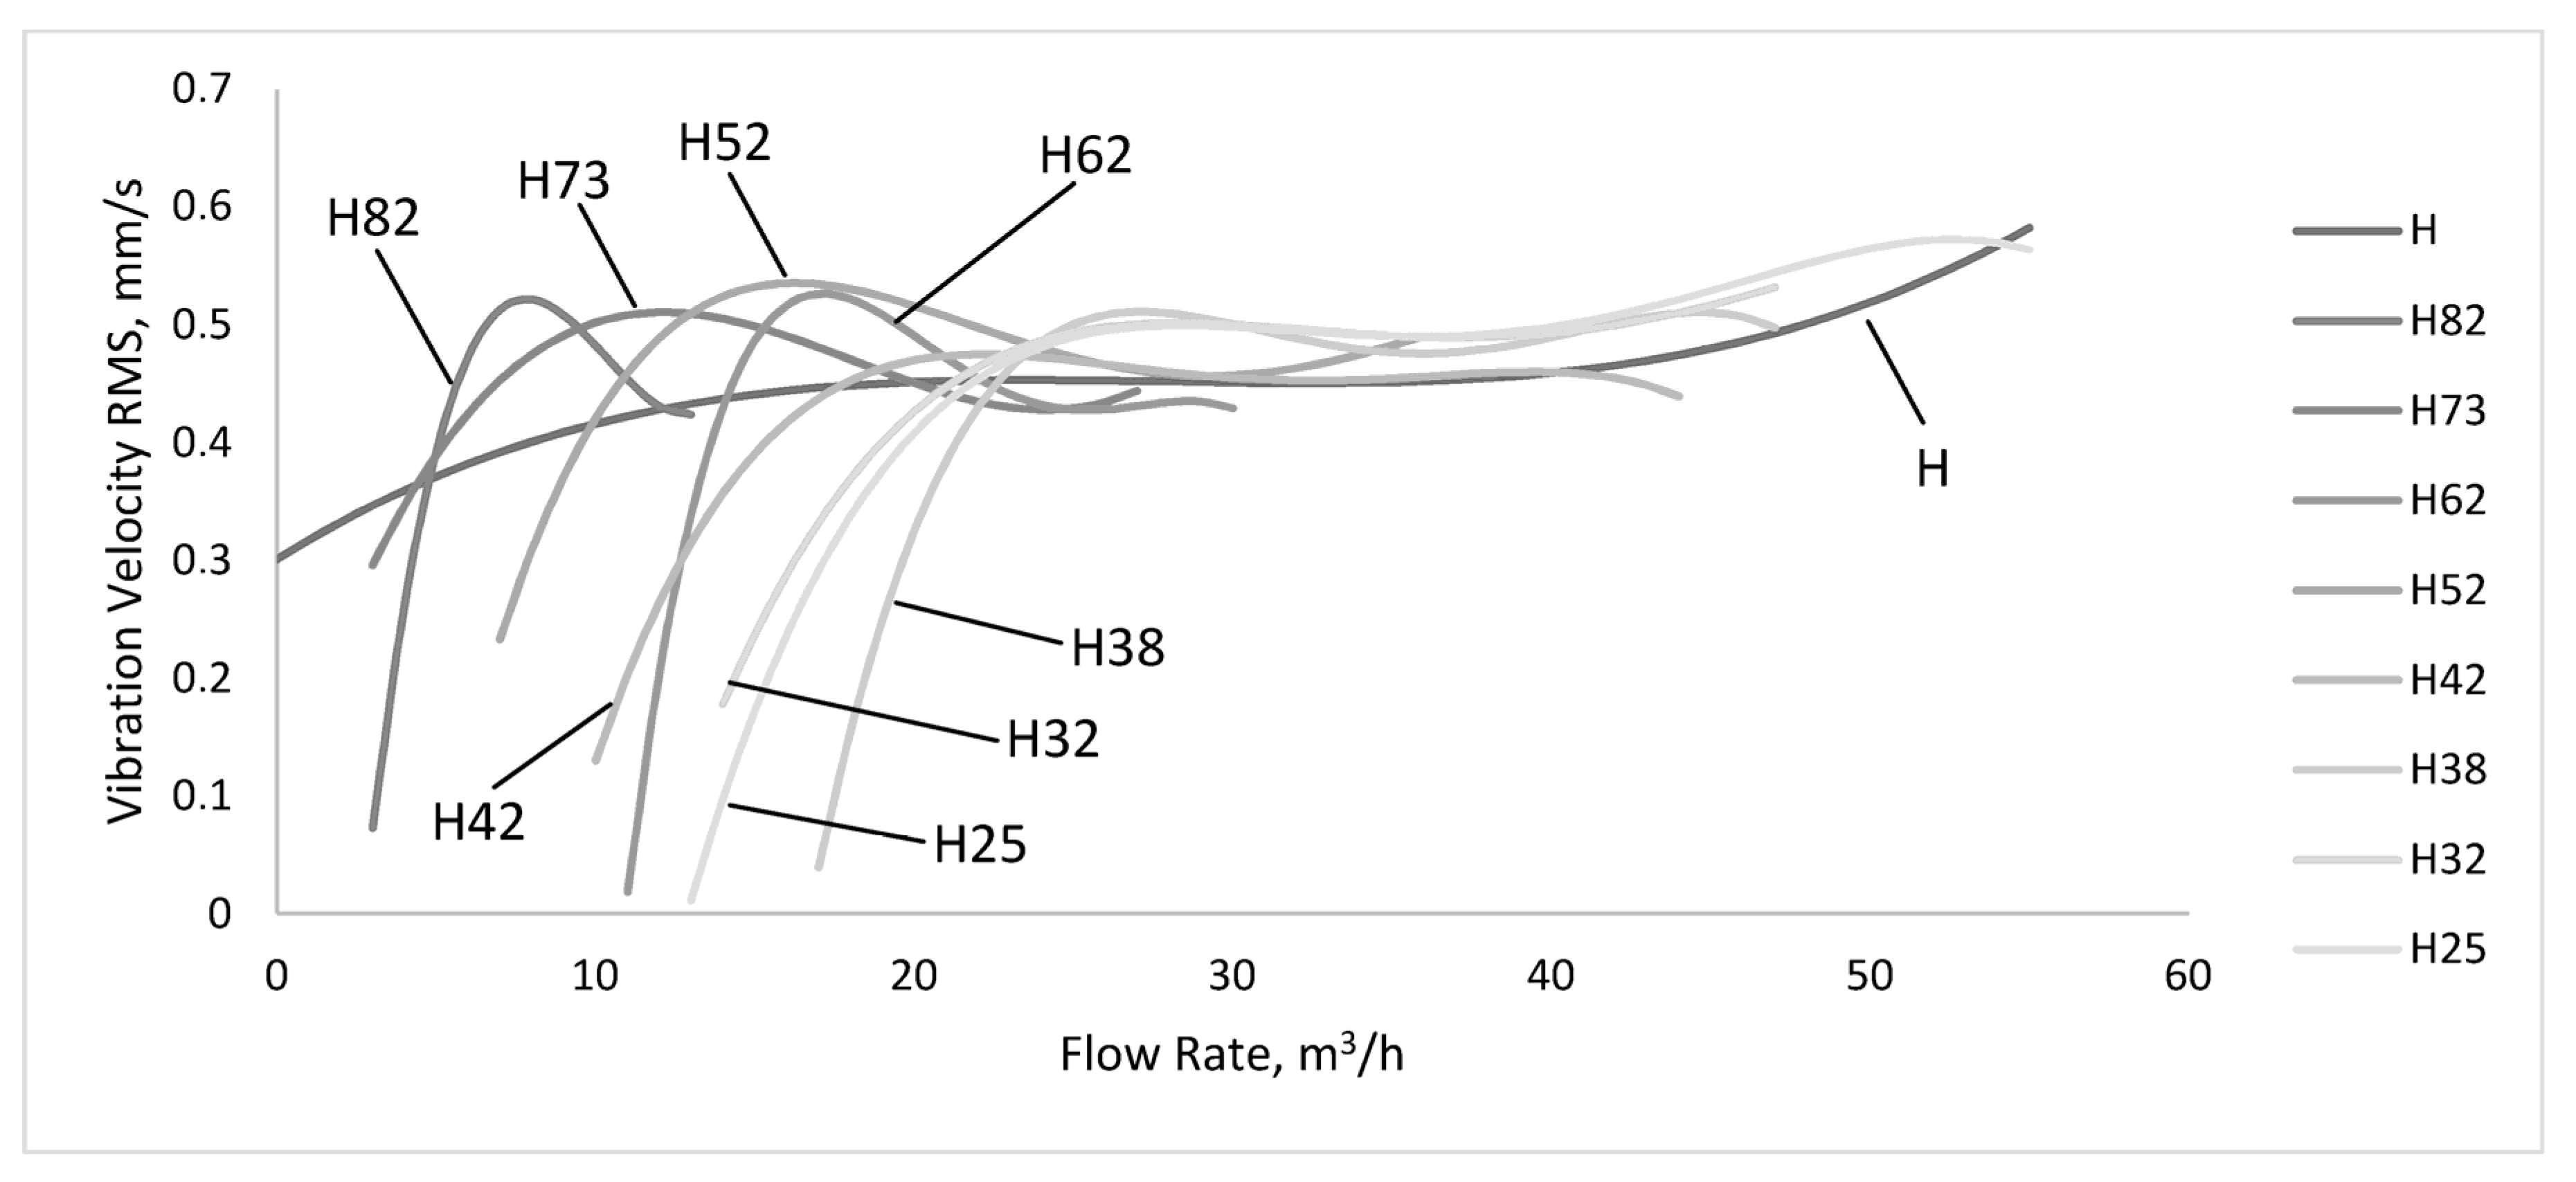
The introduction of air into the water changes the pump characteristic curve, as shown in Figure 3, and the hydraulic performance (flow rate, pump head, pump efficiency) is lower. If we follow a point on the initial characteristic curve, it can be noted that it moves to the left and down (curves noted with C in Figure 3). Changes of a point (from pump characteristic curve) coordinated with the amount of air are accompanied by a modifying level of vibration and sound signature. These are compared with the H curve, representing the recorded vibrations to normal operation at different flow rates (see Figure 4). For example, the transformation of a point of the pump characteristic curve (Q = 14 m3/h; H water = 82 m) in Figure 3, is shown by the curve H82. By reading this curve from right to left, the switch from normal operation can be observed. Initially, the vibration velocities are close to the vibration values at normal operating conditions, shown in curve H. An increase in the amount of air amplifies the vibrations, which are strongest at the flow rate of 7.5 m3/h. This aspect is also maintained in high pressure and low flow scenarios (see lines H73, H62, H52 in Figure 4). The points on the pump characteristic curves H42, H38, H32, H25 (with low pressure and high flow) have initial speeds of vibration slightly higher than at normal operating conditions. The vibration level is almost unaffected by flow rate in the 22–55 m3/h interval. With the reduction of flow, vibrations decrease rapidly as the amount of air becomes important into the mixture, acting as a dampener.
Figure 5 shows the vibration characteristics for normal operation A0% (no air introduced into the working fluid) and at the introduction of air (expressed as a percentage of the nominal flow of the pump). Influences are noticeable at an air flow rate of at least 4% of the nominal flow rate of the pump. The curves A4% and A5% have a shape similar to the normal operation conditions but the vibration velocity values are slightly lower (there is an exception for A5%, at rates up to 12 m3/h, with higher values).
By increasing the flow rate of air (A6%, A7%, A8%), vibration is higher than in normal operation at low flow rates of up to 15–19 m3/h, after which the vibration velocities are constant and under normal operation values. However, the difference is small and we can say that air influx does not influence the pump operating condition. At flow rates above 38 m3/h, the vibration velocities are greater than those of normal operation. The situation is different for the introduction of large amounts of air A9%, A10% and A11%. In all these three cases, the recorded velocities exceeding the normal functioning values and their trend is accompanied by maximum and minimum values for certain flow rates. To conclude, the vibrations intensify with increasing air in the pump at levels above 5% of the nominal pump flow. The influence is strongest at low flow rates (up to 15 m3/h). As we approach the nominal flow rate, differences are reduced. At flow rates higher than 38 m3/h, the values corresponding to the normal operation are increasing again. All in all, the operation at the flow rates that differ from Qn (particularly under 0.6 of Qn and more than 1.2 of Qn), with an amount of air higher than 5% of Qn is characterized by velocities of vibration up to 60% larger, compared to values at normal operating conditions.
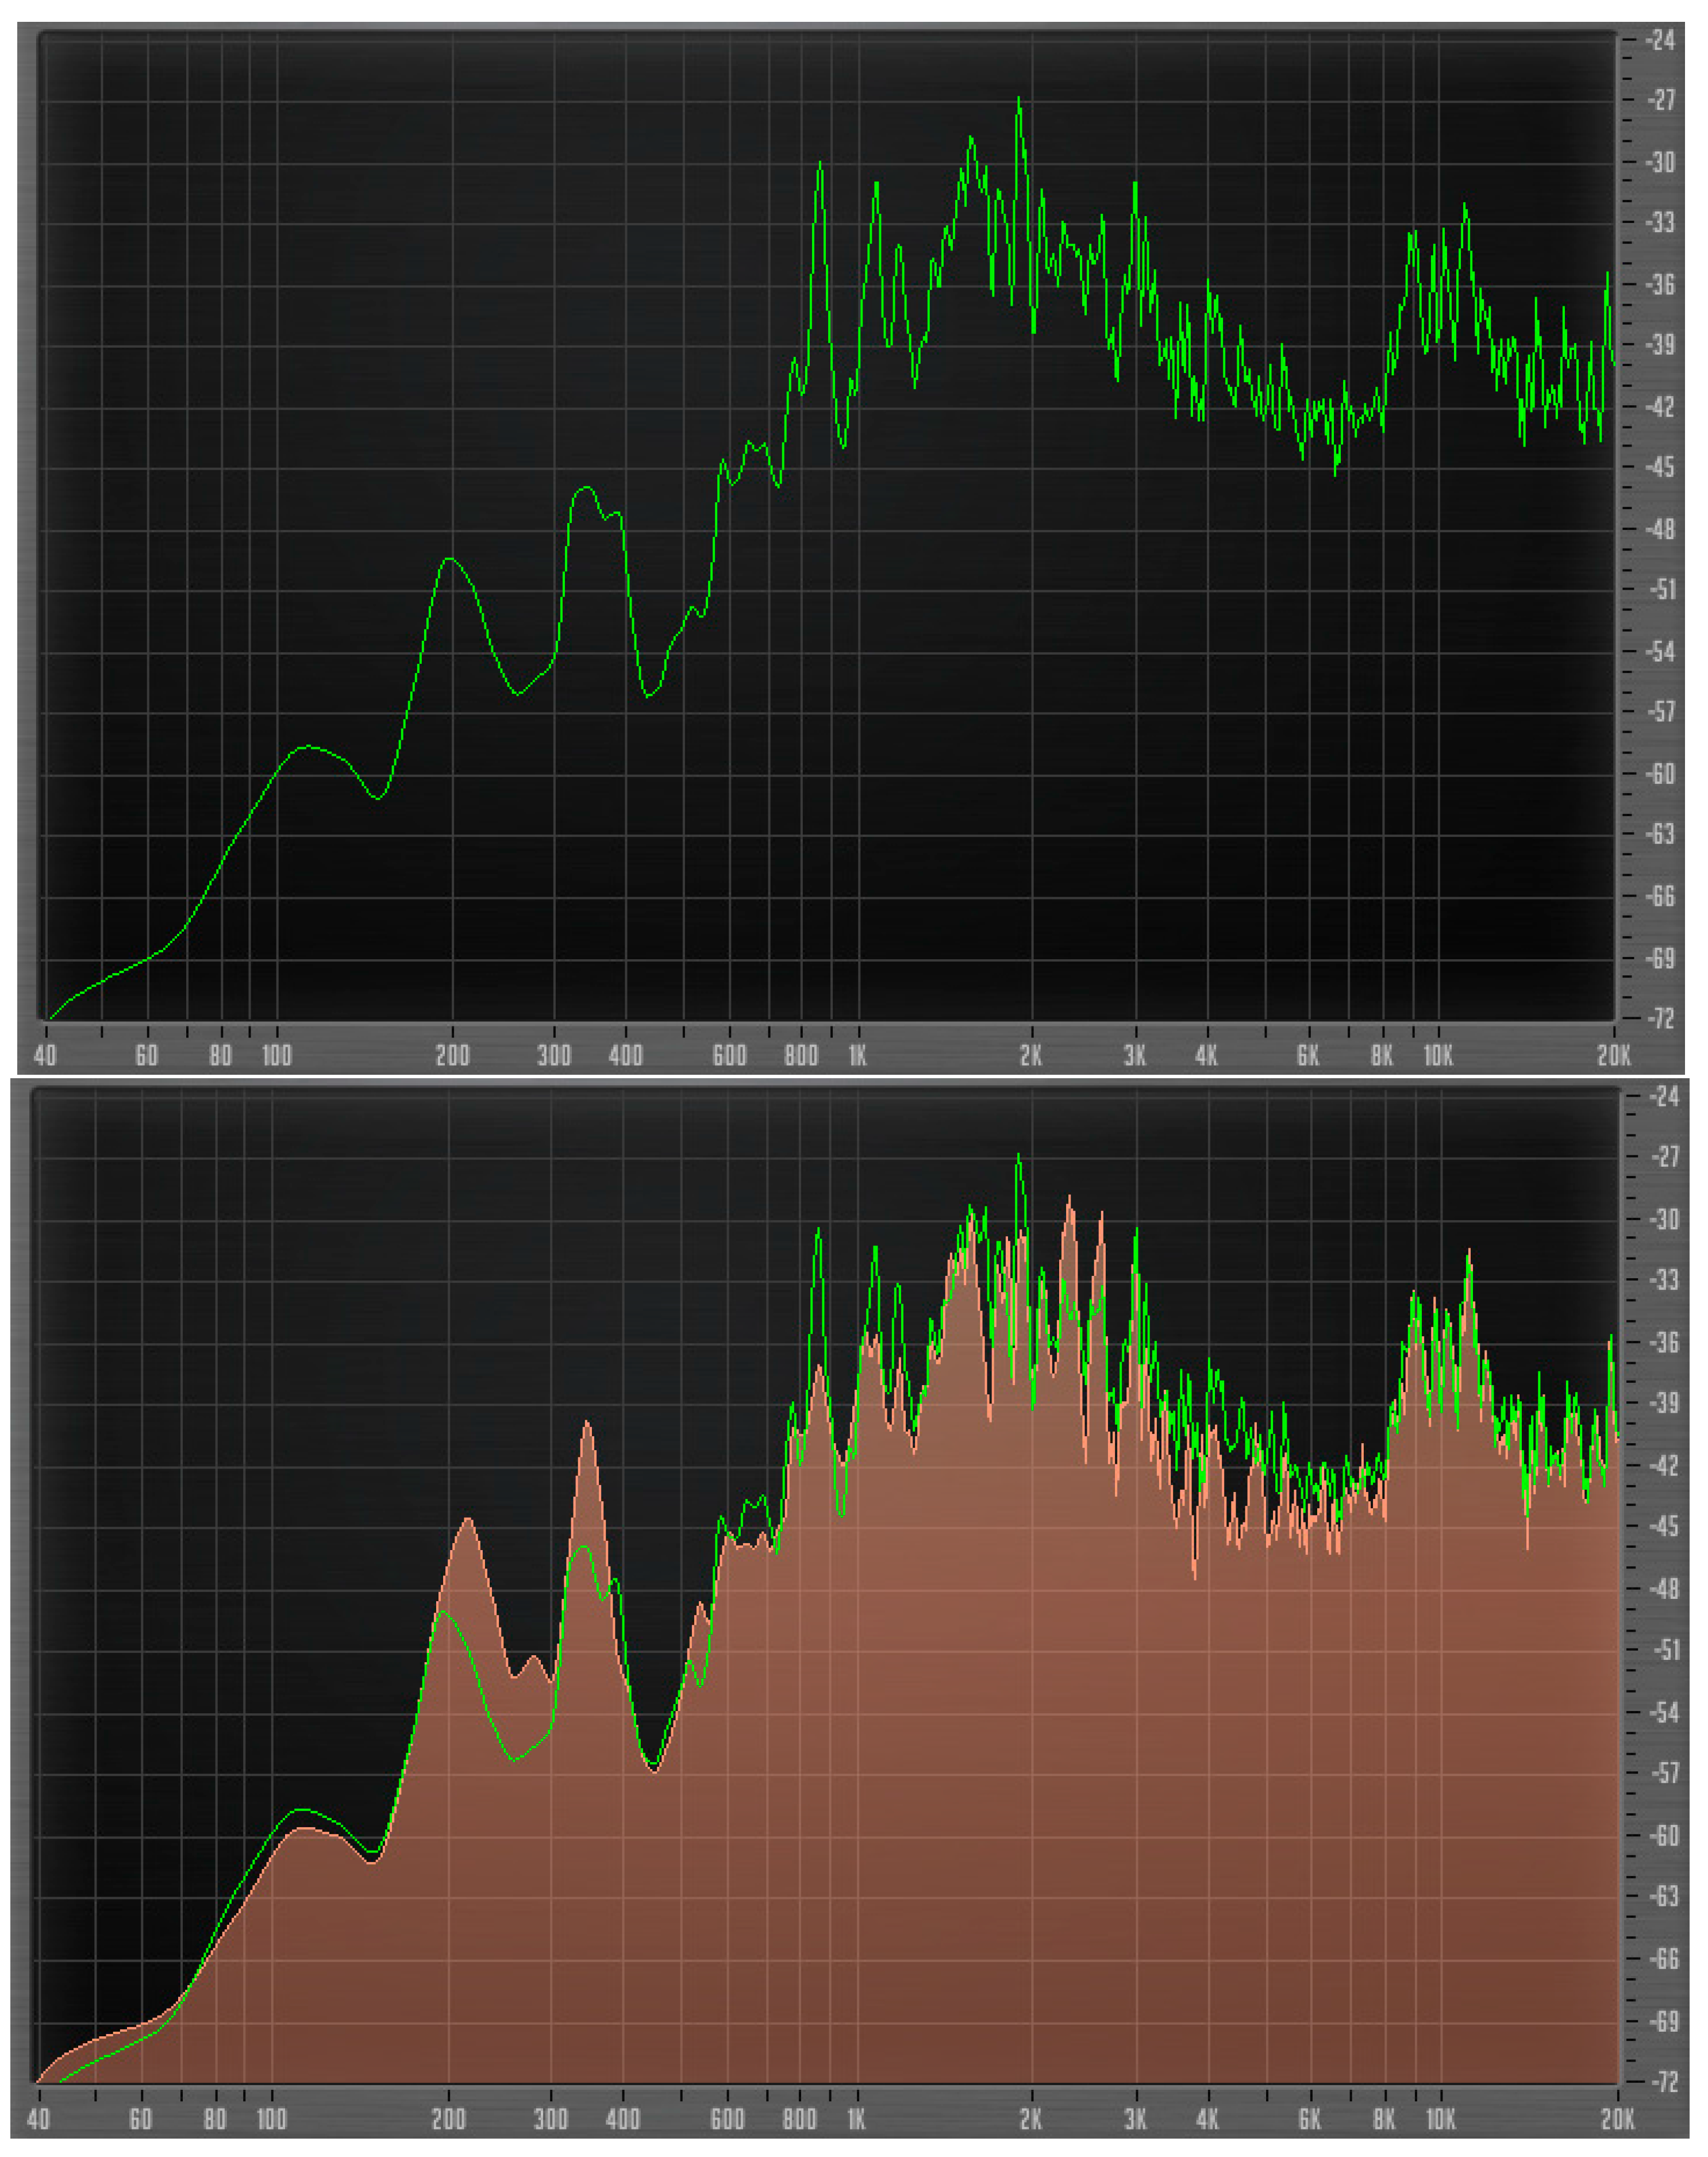
The recorded audio data can be displayed in real time or played back to follow changes in the amplitude-frequency domain. The two figures below present data extracted at approximately 3 minutes after operating the pumping system without and with air. Figure 6 (top) shows the spectrum of the standard (without air) pump working condition (green line) at frequencies between 40 Hz and 20 kHz, whereas Figure 6 (bottom) displays a second line (marked red), which shows the amplitude versus frequency plot after air enters the system.
We observe a decrease of the amplitudes of frequencies between 3120 and 8385 Hz and 580 to 1250 Hz, and an increase in amplitudes of frequencies spanning between 160 and 420 Hz once air enters the system. This approach, pinpointing changes in the initial operating condition of the equipment, might enable a further improving of predictive equipment methods through further analysis and experimental work, as also presented by [8,9]. As mentioned above, the air entrapment plays a shock absorbing (or dampening) role inside of the pump, leading to the frequency change observed. The air entering the pump will also show a high peak at around 200 Hz and 350 Hz, which could be considered as the signature of the cavitation phenomenon inside of the pump rotor.
One of the biggest challenges observed when employing this procedure is background noise isolation and the processing of large data volumes. Its main advantages are the lack of contact between measurement equipment and the pump (nonintrusive), its broad frequency spectrum, and the multitude of post-processing options (amplification, filtering, enhanced visualization), which are not as common in conventional vibration analysis [8].
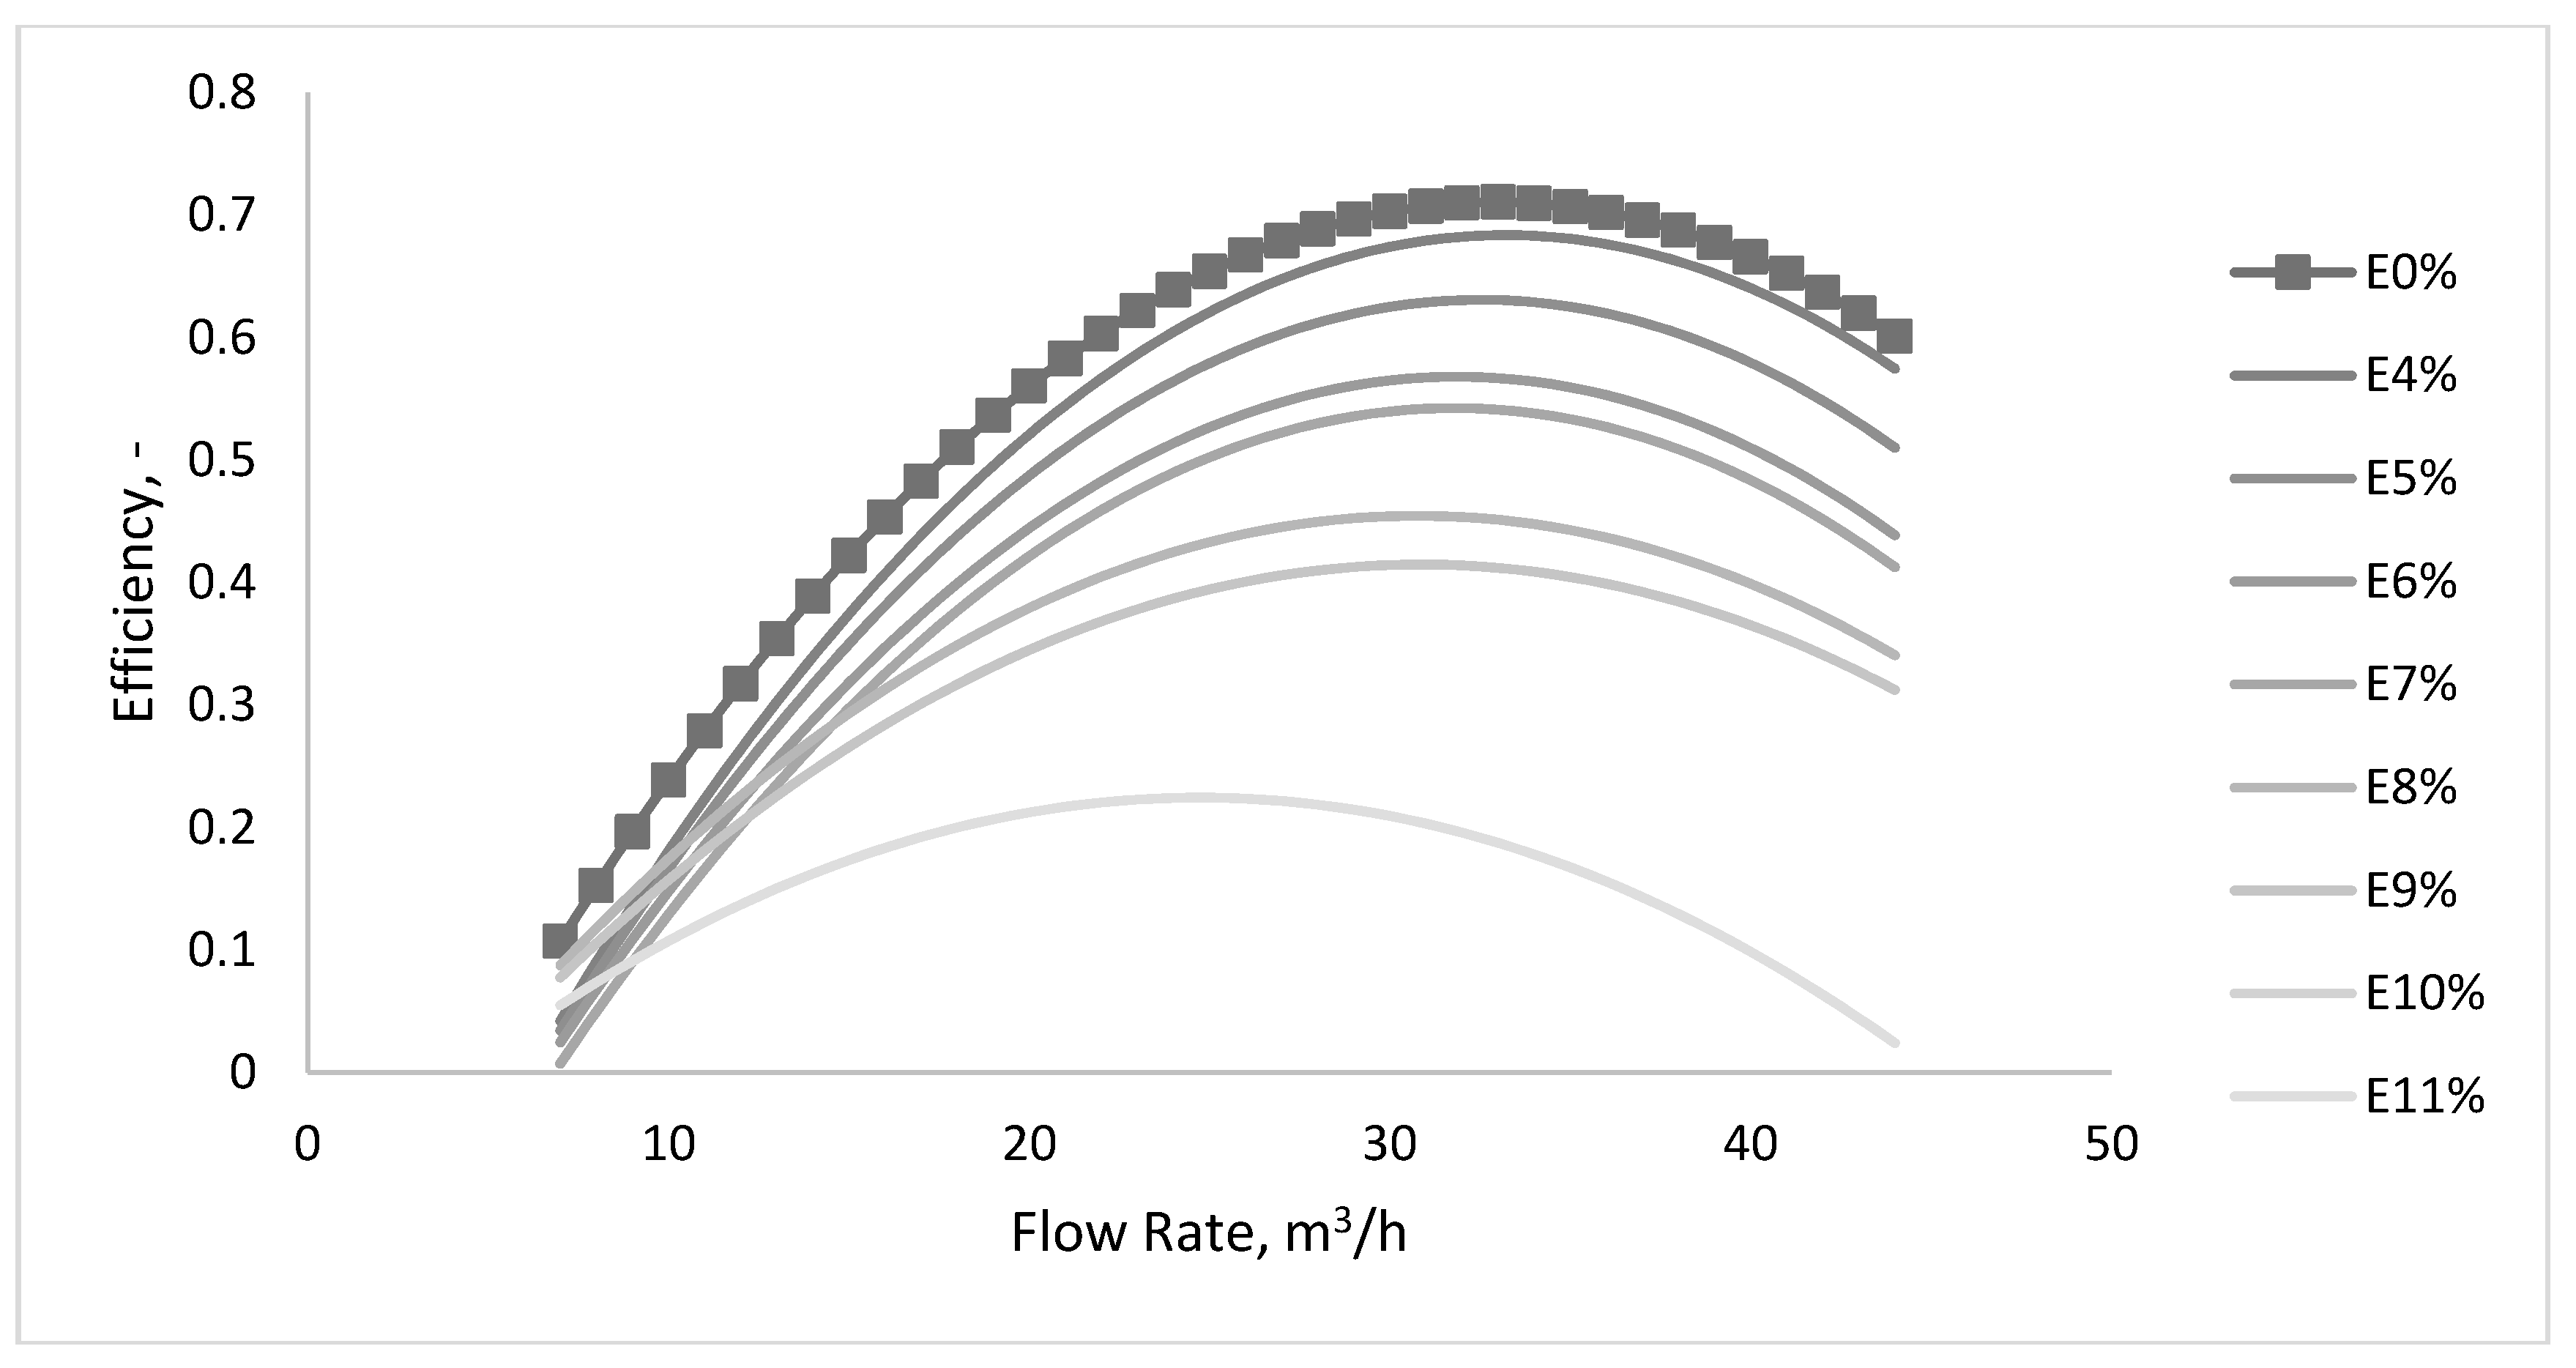
Figure 7 shows the efficiency curves corresponding to the normal operating conditions of the pump (e.g., without air intake and with air intake). The air flow rates for each curve are presented in Table 2 and the pump nominal flow is 32 m3/h. The pump efficiency decrease is proportional with the amount of air introduced into the system. Efficiency is declining rapidly when the amount of air is over 10%, so the pump stops having an active role in the pumping system. Functioning with an air-water mixture indicates energy losses related to the lack of control over the fluid, which exhibits an eddy movement between the blades. From the vibration viewpoint, pump malfunctioning is observed outside of the 0.6–1.2 Qn range, where the two-phase mixture leads to stronger vibrations. It was observed that when the pump delivers near the nominal flow rate, vibrations are close to those of the normal functioning condition and therefore cannot be used as an indicator of a low efficiency. Hence, at these flow rates, the vibration measurement is not a measure of the capability of the pump.
4. Discussion
A comparison between the experimental and analytical curves obtained by the correction method, expressed by Equation (3), Section 3, is shown in Figure 8.
It is noted that satisfactory results are obtained at flow rates above 25 m3/h, and at a quantity of air ranging from 4 to 7%. If the amount of air is increasing, the correction method does not provide acceptable results. In the range of low flow rates (less than 25 m3/h), introducing a quantity of air sharply changes the characteristics of the pump, while the correction method indicates a very small change. In this case, the correction method gives results which unfortunately cannot be used in practice.
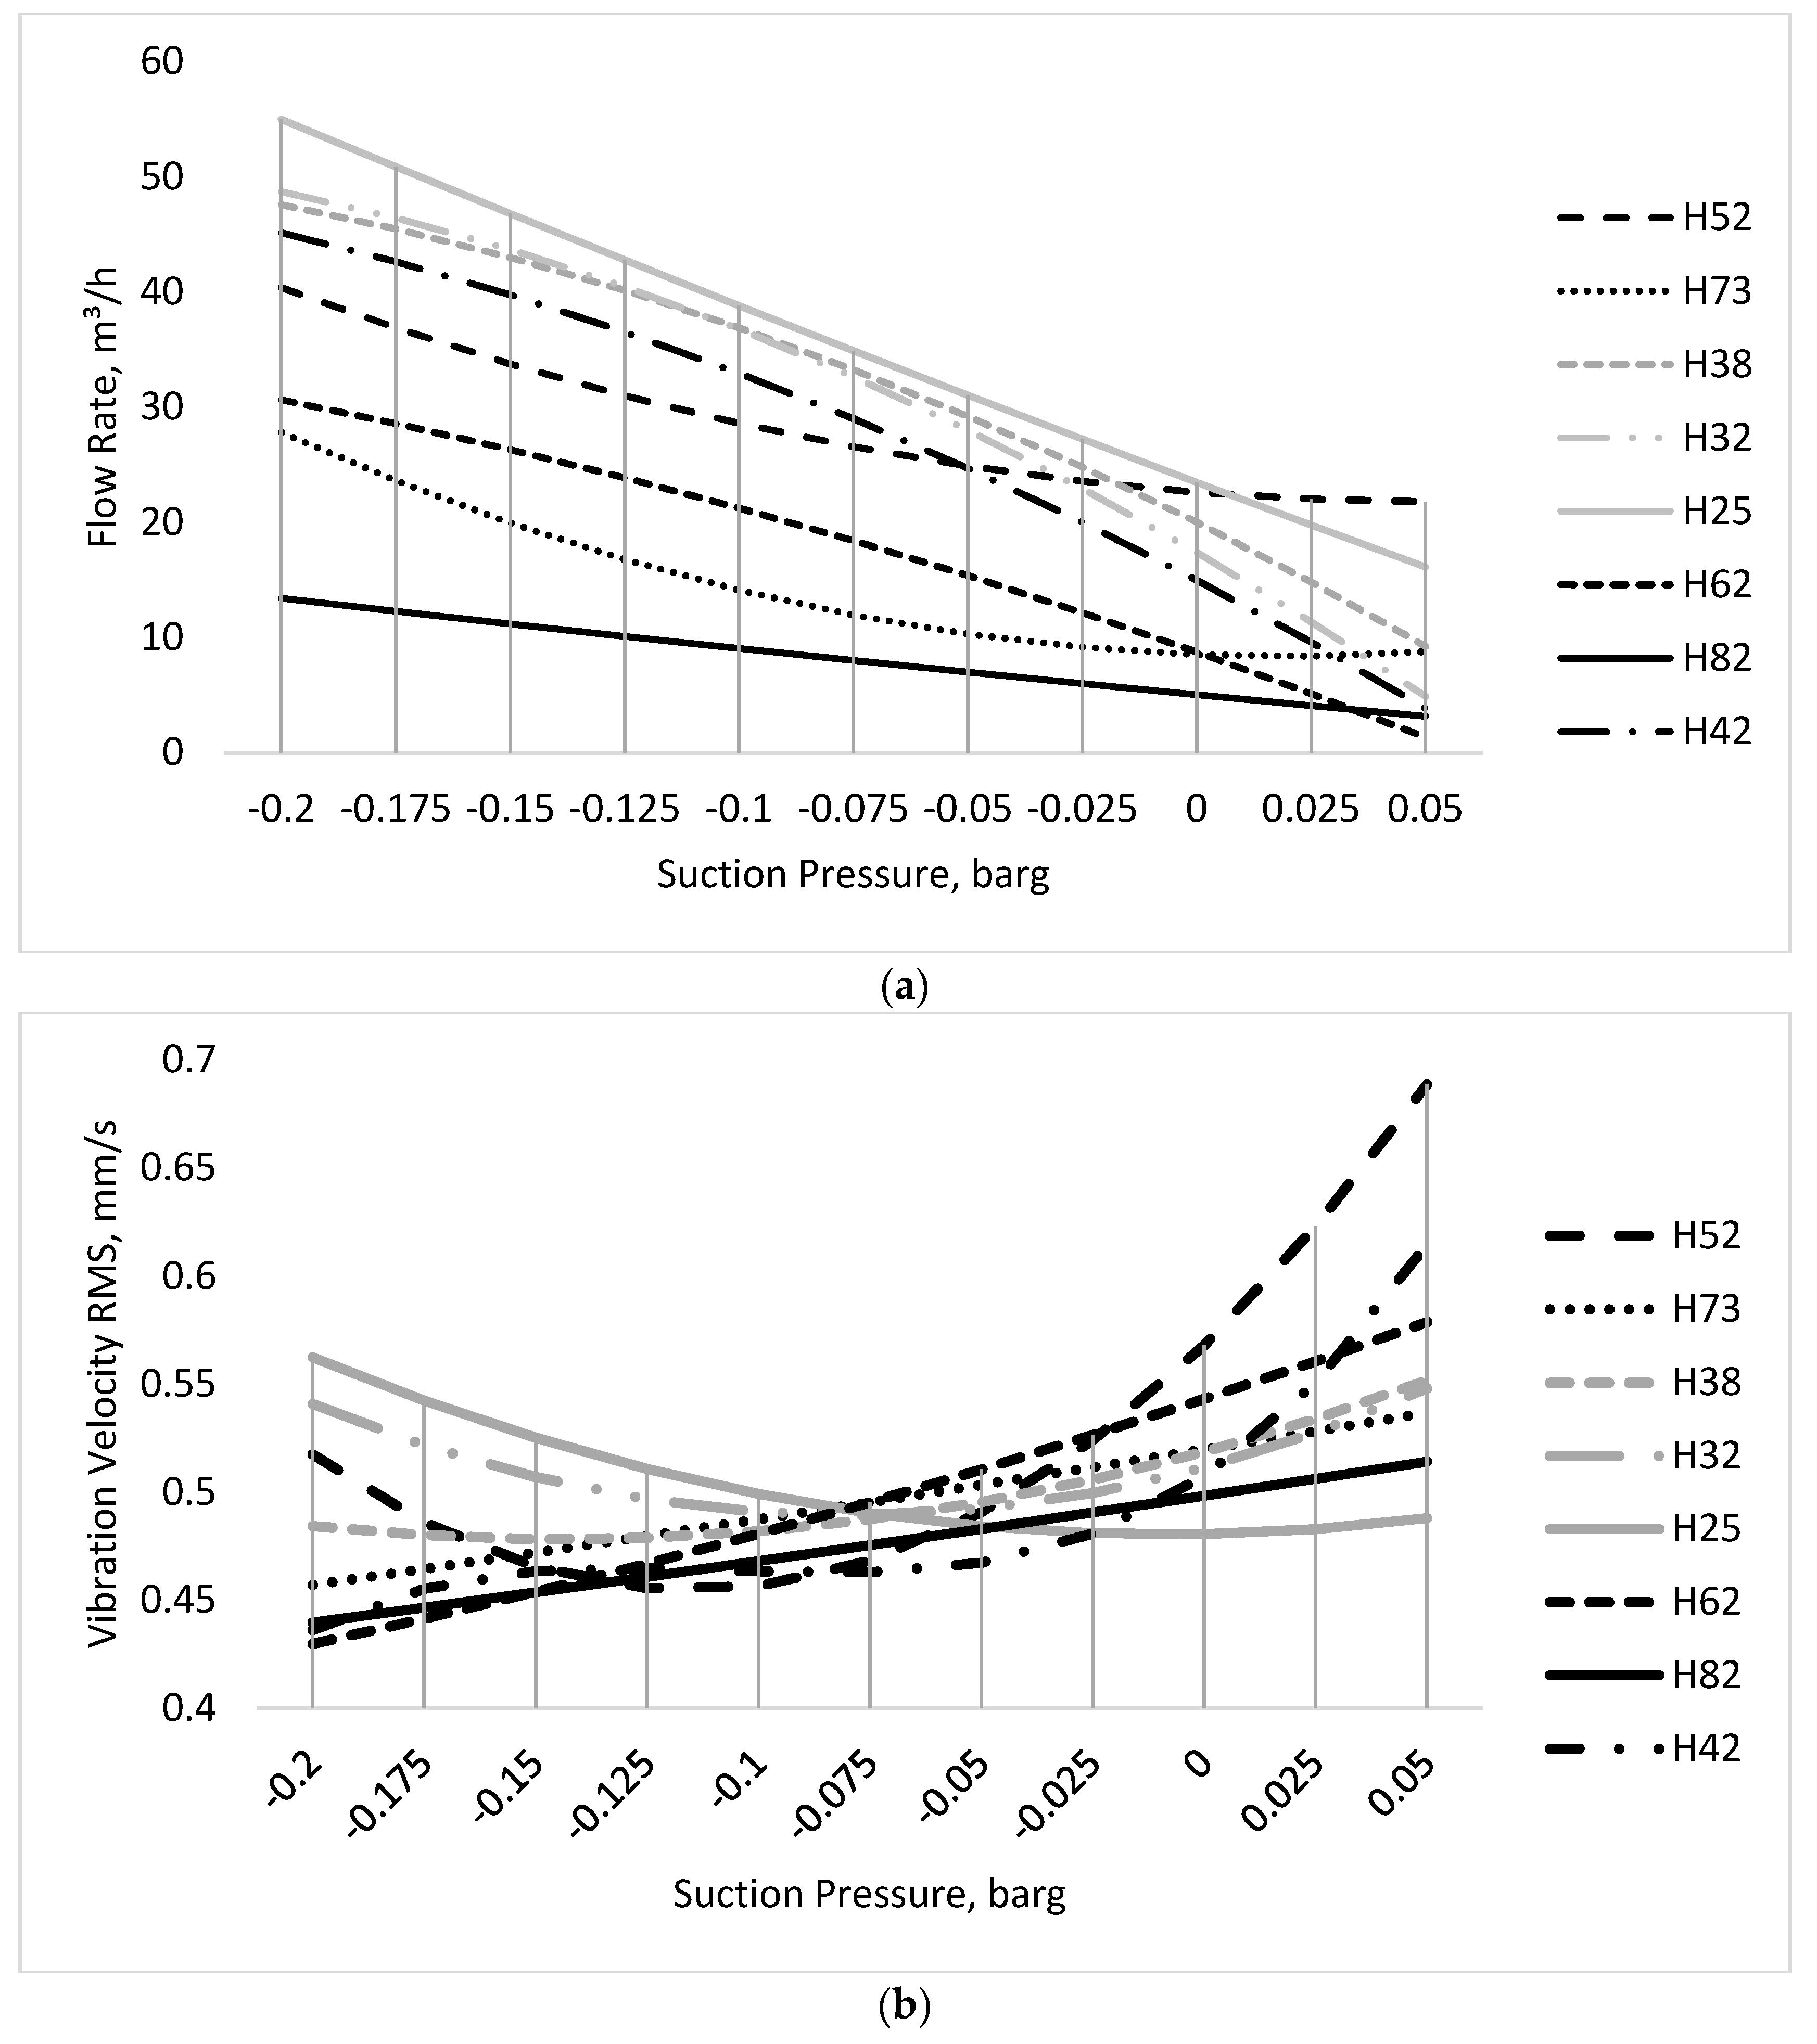
As the pump performance is decaying, flow decreases (see Figure 9a) and the suction pressure increases, because its losses are reduced (they are proportional to the square of the flow). In these circumstances, the operation of the pump with an air–water mix leads to an increase of vibrations. The presence of air at a lower flow rate is indicated by the amplification of vibration speed, observed especially at pressures above atmospheric pressure at the pump inlet, Figure 9b.
5. Conclusions
The main conclusions drawn from the various measurements and their analysis relate to how air affects the pump characteristic curve, the application of analytical correction methods, and the vibration and sound analysis.
It was found that the introduction of air into the water changes the pump characteristic curve, leading to a lower hydraulic performance (flow, head, efficiency), as shown in Figure 3 and Figure 6. No model describing how the pump characteristic curves change with air inflow was found in the literature and it is therefore presented within this paper. Changes of a point’s coordinates from the pump characteristic curve with the amount of air are accompanied by modifying levels of vibration and a change in the acoustic signature of the pumping system. The operation at flow rates different from Qn (in particular under 0.6 of Qn and larger than 1.2 of Qn), with more than 5% of Qn air is characterized by velocities of vibration up to 60% higher compared to the values of normal operation. It can be observed that the analytical method of correction cannot be used in practice. Differences between the experimental curves corresponding air-water mixture and those determined by the method of correction are important, as shown in Figure 8.
Through the experimental determination of vibration velocities at different two-phase flow conditions, a set of values showing standard functioning conditions and deviations from normal working parameters is presented, so that changes in vibration can correlate to efficiency changes. Moreover, acoustic measurements exhibit changes in their amplitude-frequency domain associated with air intake. Further experimental work is recommended to correlate air intake, pump characteristic curves, vibration, and acoustic signature, for the better evaluation of equipment condition and the improvement of predictive maintenance schedules.
Author Contributions
Ion Pana and Marius Stan conceived and designed the air inlet experiments; Mihail Minescu, Adonis Ichim and Catalin Teodoriu conceived and designed the vibration and sound experiments, Ion Pana, Marius Stan and Adonis Ichim performed the experiments; Ion Pana, Adonis Ichim and Catalin Teodoriu analyzed the data; Mihail Minescu contributed reagents/materials/analysis tools; Ion Pana, Marius Stan, Mihail Minescu, Adonis Ichim, Catalin Teodoriu wrote the paper
Conflicts of Interest
The authors declare no conflict of interest.
Nomenclature
| Pump head, m | |
| Pressure at the outlet of the pump, bar | |
| Pressure at the pump inlet, bar | |
| Air density, kg/m3 | |
| Mixture density, kg/m3 | |
| Water density, kg/m3 | |
| a | acceleration, m/s2 |
| b2 | Impeller outlet width, mm |
| D1 | Impeller inlet diameter, mm |
| D2 | Impeller outlet diameter, mm |
| f | frequency, Hz |
| g | Gravitational acceleration, m/s2 |
| Hn | Designed head, m |
| n | Rotating speed, RPM |
| v | velocity, m/s |
| x | Volumetric fraction, - |
| Z | Blade number, - |
| Qn | Nominal flow rate, m3/s |
| Pump head | the maximum outlet pressure of the pump, in meters of fluid |
| Pump efficiency | output hydraulic power versus input mechanical power |
References
- Bratu, C. Two phase pump transient behavior. In Proceedings of the SPE Annual Technical Conference and Exhibition, Dallas, TX, USA, 22–25 October 1995. SPE 30660. [Google Scholar]
- Bratu, C. Rotodynamic Two-Phase Pump Performances. In Proceedings of the 69th SPE Annual Technical Conference and Exhibition, New Orleans, LA, USA, 25–28 September 1994. SPE 28516. [Google Scholar]
- Dobre, A.D.N. Contribution to the Study Gas-Liquid Two-Phase Flows in Pipes. Ph.D. Thesis, Construction Technical University Bucharest, Bucharest, Romania, 2014. [Google Scholar]
- Pana, I. Aspects Regarding Noise in the Pumping Stations; Petroleum-Gas University of Ploiesti Bulletin, Technical Series; nr: 1/2008; Universitatea Petrol si Gaze Ploiesti: Ploiești, Romania, 2008; Volume LX, pp. 37–45. ISSN 1224-8495. [Google Scholar]
- Pana, I. Using Simhydraulics in Didactic Applications; Petroleum-Gas University of Ploiesti Bulletin, Technical Series; nr: 1/2007; Universitatea Petrol si Gaze Ploiesti: Ploiești, Romania, 2007; Volume LIX, pp. 25–32. ISSN 1224-8495. [Google Scholar]
- Patemost, G.M.; Bannwart, A.C.; Estevam, E. Experimental study of a centrifugal pump handling viscous fluid and two-phase flow. SPE Prod. Oper. 2015, 30, 146–155. [Google Scholar] [CrossRef]
- Pessoa, R.; Prado, M. Two phase flow performance for electrical Submersible pump stages. SPE Prod. Facil. 2003, 18, 13–27. [Google Scholar] [CrossRef]
- Ichim, I.; Teodoriu, C. Use of Noise Interpretation to Determine Mud Pump Working Condition: A Hands-on Teaching Concept with Research Potential. Oil Gas Eur. Mag. 2015, 41, 147–152. [Google Scholar]
- Minescu, M.; Pana, I.; Stan, M. Diagnosis of Centrifugal Pumps Using Vibration Analysis. Oil Gas Eur. Mag. 2015, 41, 215–218. [Google Scholar]
- Hoshiba, K.; Washizaki, K.; Wakabayashi, M.; Ishiki, T.; Kumon, M.; Bando, Y.; Gabriel, D.; Nakadai, K.; Okuno, H.G. Design of UAV-Embedded Microphone Array System for Sound Source Localization in Outdoor Environments. Sensors 2017, 17, 2535. [Google Scholar] [CrossRef] [PubMed]
- Basiri, M.; Schill, F.; Lima, P.U.; Floreano, D. Robust acoustic source localization of emergency signals from Micro Air Vehicles. In Proceedings of the IEEE/RSJ International Conference on Robots and Intelligent Systems (IROS), Vilamoura, Portugal, 7–12 October 2012; pp. 4737–4742. [Google Scholar]
- Okutani, K.; Yoshida, T.; Nakamura, K.; Nakadai, K. Outdoor auditory scene analysis using a moving microphone array embedded in a quadrocopter. In Proceedings of the IEEE/RSJ International Conference on Robots and Intelligent Systems (IROS), Vilamoura, Portugal, 7–12 October 2012; pp. 3288–3293. [Google Scholar]
- Furukawa, K.; Okutani, K.; Nagira, K.; Otsuka, T.; Itoyama, K.; Nakadai, K.; Okuno, H.G. Noise correlation matrix estimation for improving sound source localization by multirotor UAV. In Proceedings of the IEEE/RSJ International Conference on Robots and Intelligent Systems (IROS), Tokyo, Japan, 3–8 November 2013; pp. 3943–3948. [Google Scholar]
- Kim, Y.; Kim, K. Near-Field Sound Localization Based on the Small Profile Monaural Structure. Sensors 2015, 15, 28742–28763. [Google Scholar] [CrossRef] [PubMed]
- Xu, S.; Lu, B.; Bell, L.; Nixon, M. Outlier Detection in Dynamic Systems with Multiple Operating Points and Application to Improve Industrial Flare Monitoring. Processes 2017, 5, 28. [Google Scholar] [CrossRef]
- Turpin, L.; Lea, J.F.; Bearden, J.L. Gas-liquid flow through centrifugal pumps-correlation data. In Proceedings of the 3rd International Pump User Symposium, College Station, TX, USA, 1–2 May 1986; pp. 13–20. [Google Scholar]
- Mikielewicz, J.; Wilson, D.G.; Chan, T.; Goldfinch, A.L. A Method for Correlating the Characteristics of Centrifugal Pumps in Two-Phase Flow. J. Fluids Eng. 1978, 100, 395–409. [Google Scholar] [CrossRef]
- Minemura, K.; Uchiyama, T.; Shoda, S.; Egashira, K. Prediction of Air-Water Two-Phase Flow Performance of a Centrifugal Pump Based on One-Dimensional Two-Fluid Model. J. Fluids Eng. 1998, 120, 327–334. [Google Scholar] [CrossRef]
- Fu, Q.; Zhang, F.; Zhu, R.; Wang, X. Effect of gas quantity on two-phase flow characteristics of a mixed-flow pump. Adv. Mech. Eng. 2016, 8, 1–11. [Google Scholar] [CrossRef]
- Medvitz, R.B.; Kunz, R.F.; Boger, D.A.; Lindau, J.W.; Yocum, A.M. Performance Analysis of Cavitating Flow in Centrifugal Pumps Using Multiphase CFD. In Proceedings of the 2001 ASME Fluids Engineering Conference (FEDSM’01), New Orleans, LA, USA, 29 May–1 June 2001. [Google Scholar]
- Balasubramanian, R.; Bradshaw, S.; Sabini, E. Influence of impeller leading edge profiles on cavitation and suction performance. In Proceedings of the 27th International Pump Users Symposium, Houston, TX, USA, 12–15 September 2011; pp. 1–11. [Google Scholar]
- Caridad, J.; Asuaje, M.; Kenyery, F.; Tremante, A.; Aguillón, O. Characterization of a centrifugal pump impeller under two-phase flow conditions. J. Pet. Sci. Eng. 2008, 63, 18–22. [Google Scholar] [CrossRef]
- Tan, M.; Wang, Y.; Liu, H.; Wu, X.; Wang, K. Effects of number of blades on flow induced vibration and noise of centrifugal pumps. J. Drain. Irrig. Mach. Eng. 2012, 30, 131–135. [Google Scholar]
- Zhang, N.; Yang, M.; Gao, B.; Li, Z. Vibration Characteristics Induced by Cavitation in a Centrifugal Pump with Slope Volute. Shock Vib. 2015, 2015, 294980. [Google Scholar] [CrossRef]
- Nasiri, M.R.; Mahjoob, M.J.; Vahid-Alizadeh, H. Vibration signature analysis for detecting cavitation in centrifugal pumps using neural networks. In Proceedings of the IEEE International Conference on Mechatronics (ICM ’11), Istanbul, Turkey, 13–15 April 2011; pp. 632–635. [Google Scholar]
- Pineda, L.R.; Serpa, A.L.; Biazussi, J.L.; Sassim, N.A. Operational Control Of an Electric Submersible Pump Working with Gas-Liquid Flow Using Artificial Neural Network. In Proceedings of the 15th IASTED International Conference Intelligent Systems and Control (ISC 2016), Campinas, Brazil, 16–18 August 2016; pp. 321–328. [Google Scholar]
- Alfayeza, L.; Mbab, D.; Dysonc, G. The application of acoustic emission for detecting incipient cavitation and the best efficiency point of a 60 kW centrifugal pump: Case study. NDT E Int. 2005, 38, 354–358. [Google Scholar] [CrossRef] [Green Version]
- Cudina, M.; Prezelj, J. Detection of cavitation in operation of kinetic pumps. Use of discrete frequency tone in audible spectra. Appl. Acoust. 2009, 70, 540–546. [Google Scholar] [CrossRef]
- Cudina, M. Detection of cavitation phenomenon in a centrifugal pump using audible sound. Mech. Syst. Signal Process. 2003, 17, 1335–1347. [Google Scholar] [CrossRef]
- Neumann, M.; Schäfer, T.; Bieberle, A.; Hampel, U. An Experimental Study on the Gas Entrainment in Horizontally and Vertically Installed Centrifugal Pumps. J. Fluids Eng. 2016, 138, 091301. [Google Scholar] [CrossRef]
- Gamboa, J.; Prado, M. Review of electrical-submersible-pump surging correlation and models. SPE Prod. Oper. 2011, 26, 314–324. [Google Scholar] [CrossRef]
- Wang, Y.; Liu, H.L.; Yuan, S.Q.; Liu, D.; Wang, J. Characteristics of cavitation vibration and noise in centrifugal pumps with different vane wrap angles. J. Drain. Irrig. Mach. Eng. 2013, 31, 390–400. [Google Scholar]
Figure 1.
Experimental stand layout.

Figure 2.
Stand images: (a) speed transducer and vibration velocity transducer; (b) sound level meter and acquisition system.
Figure 2.
Stand images: (a) speed transducer and vibration velocity transducer; (b) sound level meter and acquisition system.
Figure 3.
Changing of the centrifugal pump characteristic curve with air addition to the system.

Figure 4.
Vibration velocities corresponding to the point modification of the characteristic curve when introducing different amounts of air into the fluid circulated.
Figure 4.
Vibration velocities corresponding to the point modification of the characteristic curve when introducing different amounts of air into the fluid circulated.

Figure 5.
Vibration velocities corresponding to the points of the pump characteristic curve, at variable amounts of air in water. Air flow differs as shown in Table 2. Pump nominal flow 32 m3/h.
Figure 5.
Vibration velocities corresponding to the points of the pump characteristic curve, at variable amounts of air in water. Air flow differs as shown in Table 2. Pump nominal flow 32 m3/h.
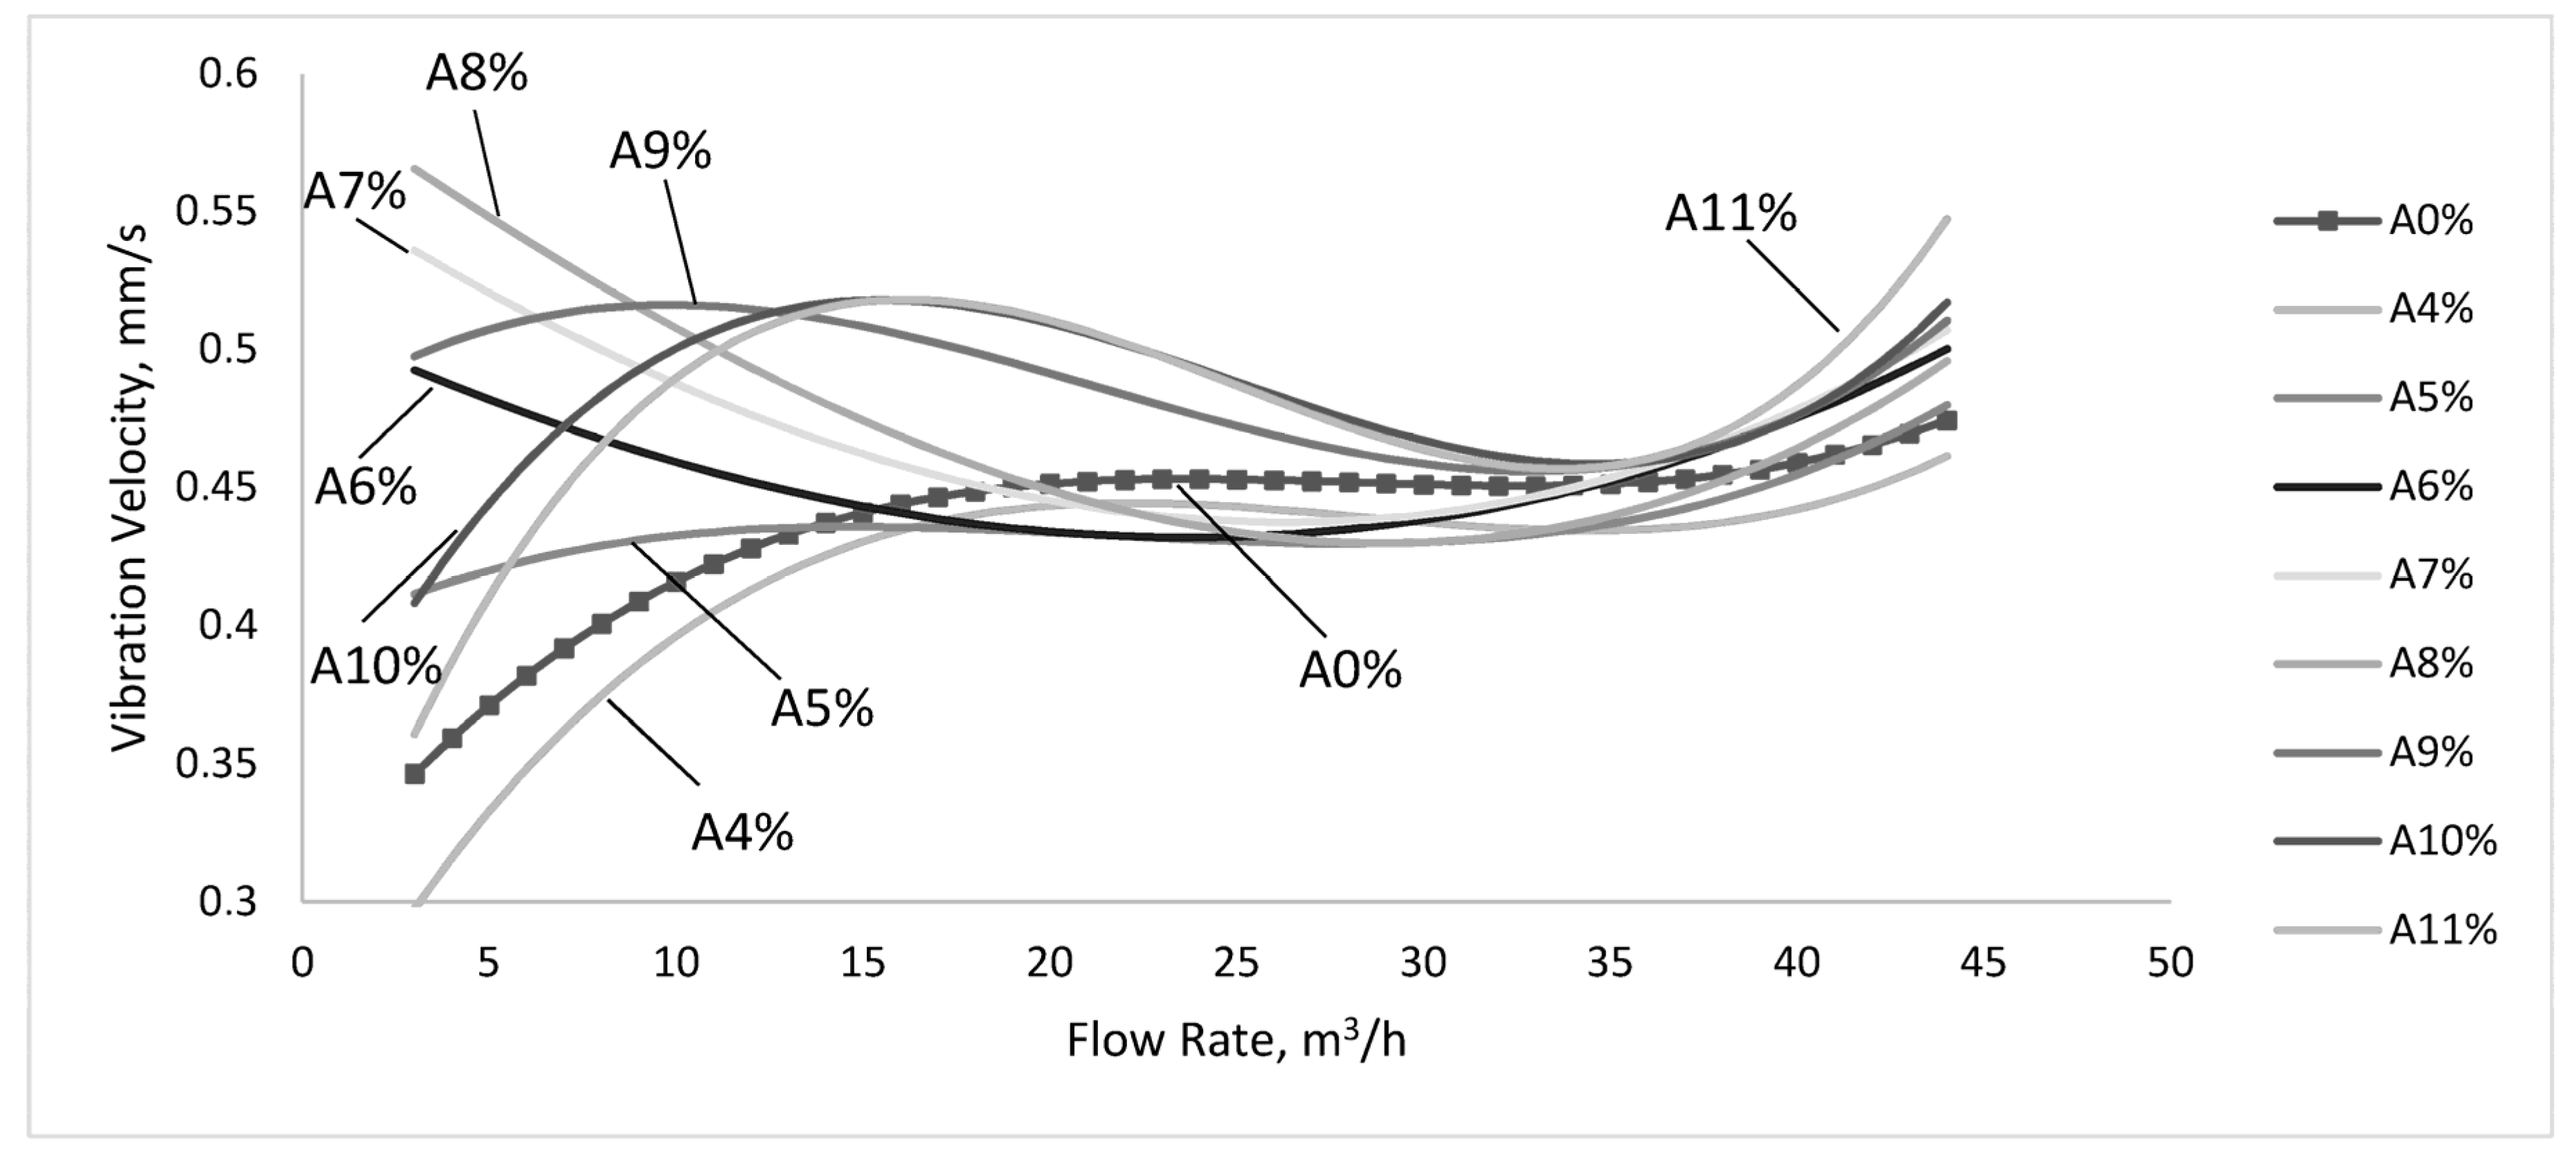
Figure 6.
Amplitude and frequencies of sound at normal operating conditions (top); and with air intake (bottom). Green line—no air, red line—with air intake.
Figure 6.
Amplitude and frequencies of sound at normal operating conditions (top); and with air intake (bottom). Green line—no air, red line—with air intake.

Figure 7.
Centrifugal pump efficiencies at variable amounts of air placed into the fluid.

Figure 8.
Comparison between experimental pump characteristic curves and those obtained through the correction method.
Figure 8.
Comparison between experimental pump characteristic curves and those obtained through the correction method.
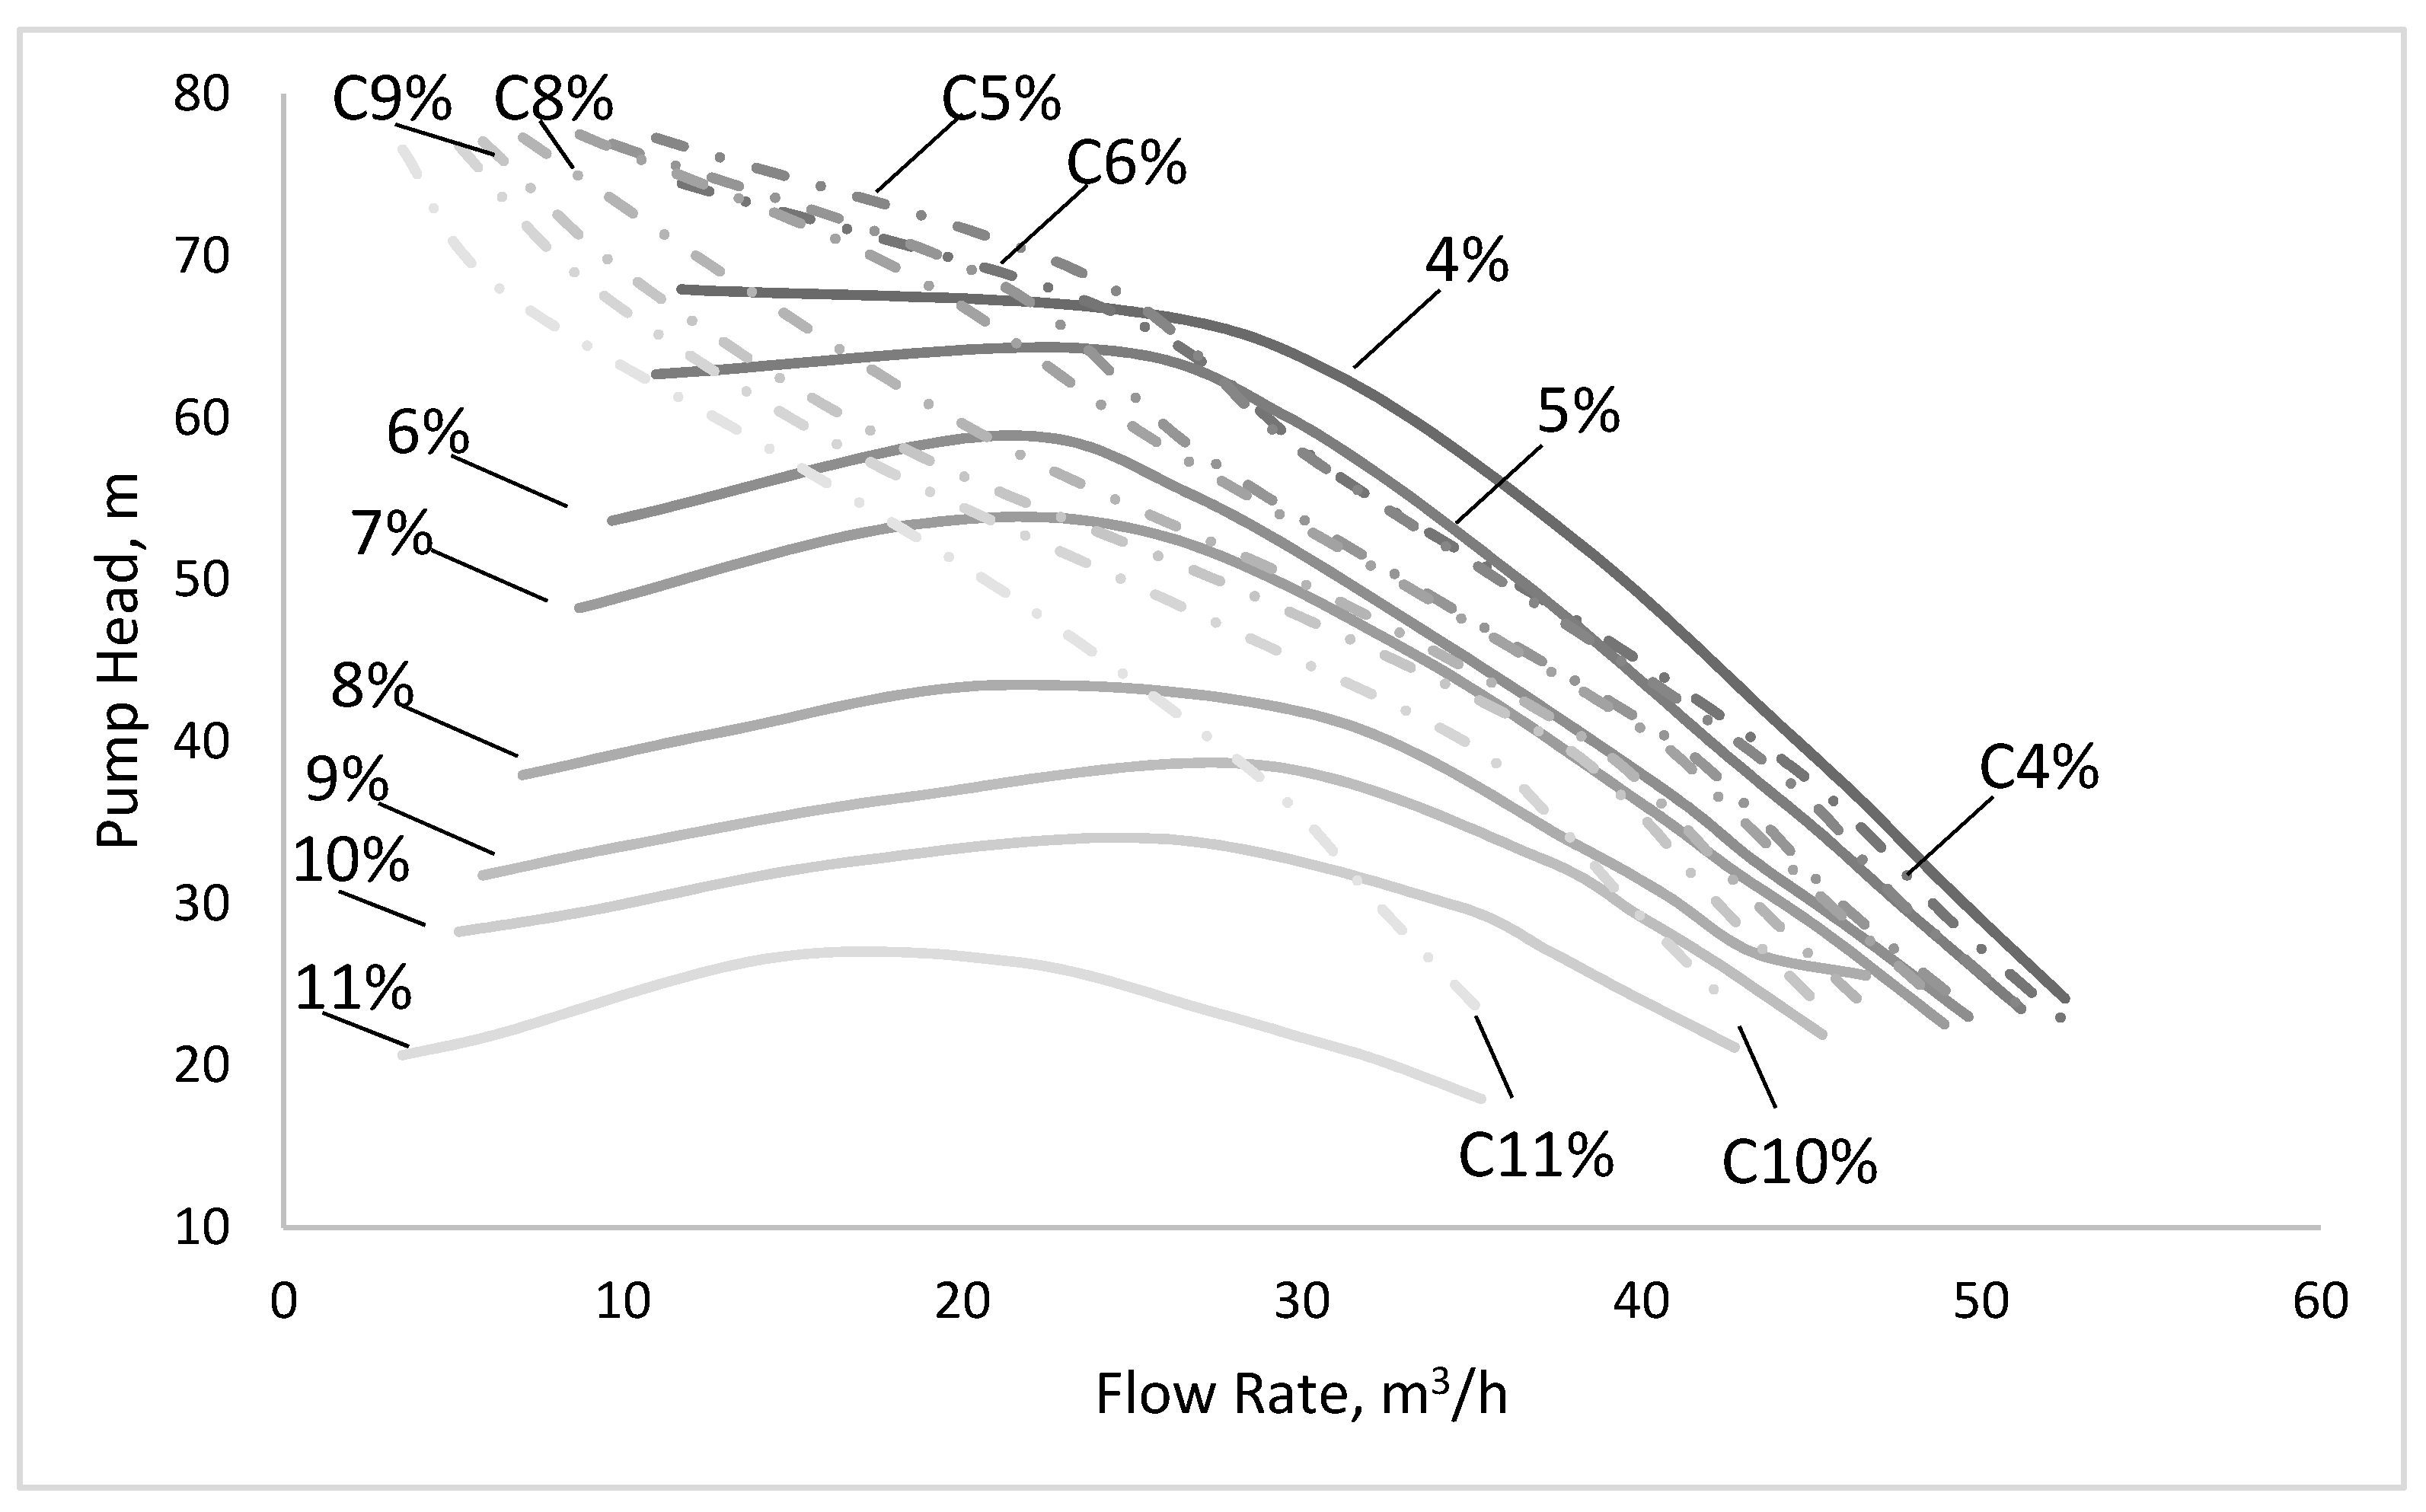
Figure 9.
The influence of the suction pressure: (a) concerning the pump flow; (b) concerning the vibration velocity.
Figure 9.
The influence of the suction pressure: (a) concerning the pump flow; (b) concerning the vibration velocity.

Table 1.
Pump parameters.
| Parameter | Value |
|---|---|
| Nominal flow rate—Qn | 32 m3/h |
| Designed head—Hn | 60 m |
| Rotating speed—n | 2950 RPM |
| Impeller inlet diameter—D1 | 70 mm |
| Impeller outlet diameter—D2 | 130 mm |
| Impeller outlet width—b2 | 12 mm |
| Blade number—Z | 7 |
| Stages number | 10 |
| Vertical distance between flanges | 150 mm |
| Flanges nominal diameter | 50 mm |
| Engine power | 5.5 kW |
Table 2.
Parameters of characteristic curves shown in in this paper.
| Curves | Air Flow Rate (m3S/h) | Curve | Water Flow Rate (m3/h) | Water Head (m) | ||
|---|---|---|---|---|---|---|
| C0 | A0% | E0% | 0 | H82 | 14 | 82 |
| C1 | A4% | E4% | 1.28 | H73 | 28 | 73 |
| C2 | A5% | E5% | 1.6 | H62 | 31 | 62 |
| C3 | A6% | E6% | 1.92 | H52 | 41 | 52 |
| C4 | A7% | E7% | 2.24 | H42 | 45 | 42 |
| C5 | A8% | E8% | 2.56 | H38 | 48 | 38 |
| C6 | A9% | E9% | 2.88 | H32 | 50.5 | 32 |
| C7 | A10% | E10% | 3.2 | H25 | 53.5 | 25 |
| C8 | A11% | E11% | 3.52 | |||
© 2018 by the authors. Licensee MDPI, Basel, Switzerland. This article is an open access article distributed under the terms and conditions of the Creative Commons Attribution (CC BY) license (http://creativecommons.org/licenses/by/4.0/).
Share and Cite
MDPI and ACS Style
Stan, M.; Pana, I.; Minescu, M.; Ichim, A.; Teodoriu, C. Centrifugal Pump Monitoring and Determination of Pump Characteristic Curves Using Experimental and Analytical Solutions. Processes 2018, 6, 18. https://doi.org/10.3390/pr6020018
AMA Style
Stan M, Pana I, Minescu M, Ichim A, Teodoriu C. Centrifugal Pump Monitoring and Determination of Pump Characteristic Curves Using Experimental and Analytical Solutions. Processes. 2018; 6(2):18. https://doi.org/10.3390/pr6020018
Chicago/Turabian StyleStan, Marius, Ion Pana, Mihail Minescu, Adonis Ichim, and Catalin Teodoriu. 2018. "Centrifugal Pump Monitoring and Determination of Pump Characteristic Curves Using Experimental and Analytical Solutions" Processes 6, no. 2: 18. https://doi.org/10.3390/pr6020018
Note that from the first issue of 2016, this journal uses article numbers instead of page numbers. See further details here.