Rheological Behavior and Modeling of a Crushed Sandstone-Mudstone Particle Mixture


1
Key Laboratory of Hydraulic and Waterway Engineering of the Ministry of Education, Chongqing Jiaotong University, Chongqing 400074, China
2
National Engineering Research Center for Inland Waterway Regulation, Chongqing Jiaotong University, Chongqing 400074, China
3
School of Civil Engineering, Hunan City University, Yiyang 413000, China
4
State Key Laboratory of Hydroscience and Engineering, Tsinghua University, Beijing 100084, China
*
Authors to whom correspondence should be addressed.
Processes 2018, 6(10), 192; https://doi.org/10.3390/pr6100192
Submission received: 15 September 2018
/
Revised: 10 October 2018
/
Accepted: 12 October 2018
/
Published: 16 October 2018
(This article belongs to the Special Issue Fluid Flow in Fractured Porous Media)
Abstract
:A mixture of sandstone and mudstone particles is often used as the main filling material for many agriculture-related and civil engineering projects, including rock-fill dams and foundations. The long-term rheological deformation experienced by rock-fill dams and foundations filled with this mixture is much bigger than that of coarse-grained and cohesive soils, due to the deterioration and softening of the mudstone particles. This study focuses on the rheological deformation of a sandstone-mudstone particle mixture, prepared by mixing sandstone and mudstone particles, based on the content by weight of four mudstone particle types. Confined uniaxial compression tests were performed to test the rheological deformation of 24 samples of the mixture, and a stress-strain curve was obtained for each test. On the basis of compression curves, the rheological process of the mixture was divided into four phases: linear, attenuation rheological, secondary attenuation rheological and stable phases. The three defining features of the curve, namely the rheological attenuation factors, attenuation rheology critical strain and limited rheological strain, were then determined and modeled. A segmented rheological model was then proposed, based on a modified attenuation rheological constitutive model for coarse-grained soil. The modelled results compared well with the experimental data, and the modelled compression-curve prediction was able to describe the two-stage attenuation rheology features (attenuation rheological and secondary attenuation rheological phases) of the sandstone-mudstone particle mixture.
1. Introduction
Interbedded layers of sandstone and mudstone are widespread in Chongqing Province in the People’s Republic of China (PRC). The interbedded deposit ranges from 2294–6440 m [1]. The sandstone and mudstone particles become mixed, and a sandstone and mudstone particle mixture (SMPM) is formed, during excavation of the sandstone-mudstone interbeds [2,3]. In southwest China, SMPM is often used as the main filling material in many filling operations such as rock-fill dams, ports and wharfs [4,5,6].
It is well established that mudstone particles are likely to disintegrate, soften or even become slime when they become saturated [4,5]. Mudstone particles are easier to break than sandstone particles. The unique physical and mechanical properties of mudstone particles mean that the long-term deformation of a foundation filled with SMPM will be more extensive than that of coarse-grained soil without mudstone particles. Furthermore, this deformation can reduce the strength of SMPM filled in water-front reservoir banks [7,8]. This increased long-term deformation and reduction in strength of the filling material may affect the safety of structures. For example, the horizontal displacement at the top of some piles has exceeded 10 cm in the Huangqi Container Terminal, located in the Three Gorges Reservoir Region. In this case, the deformation seen in the SMPM has been caused by fluctuations in the water level. Another example is Lijiang Airport (Yunnan Province, PRC), where SMPM was used as the runway-foundation filling material. Deformation reached 45.4 cm after a certain period of operation. In addition, the non-uniformity of the foundation settlement resulted in the pavement cracking and serious cavities between the roadbed and pavement, which severely affected the operation of the airport.
Researchers have investigated the rheological properties of coarse-grained soil. With the development of meso-mechanics, granular matter theory and advanced test techniques, Jiang et al. [9] concluded from a triaxial rheological shear test that particle movement, rotation and breakage are the main reasons for the rheological deformation in coarse-grained soil. The particles and structure of the soil tend to be stable when the potential energy of all of the particles and the inter-particle contract force both reach their maximum. In addition, particle breakage during the rheological process of coarse-grained soils may affect deformation, stress distribution, strength, permeability, wetting deformation and creep deformation [10,11,12,13,14,15]. Some advanced techniques such as computed tomography scanning and magnetic resonance imaging have been used to investigate the rheological mechanisms of coarse-grained soil from a microscopic perspective [9].
Rheological compression tests can be used to investigate long-term deformation. The rheological characteristics of many soil types have been investigated, such as clay [16,17], soft-rock particles [18,19] and coarse-grained soils [15,20,21]. The rheological deformation of an expansive soil can be classified as being instantaneous, linear-elastic and non-linear visco-plastic deformations. According to an investigation by Yang et al. [22], the deformation of cement-improved expansive soil indicated that no plastic deformation occurred before it yielded. They classified the observed yielded plastic creep as being either linear or non-linear visco-plastic. Zhang et al. [21,23] determined that the rheological curve of a coarse-grained material could only be classified into three phases: linear, attenuation rheological and stable. However, the rheological properties of SMPM, coarse-grained soils, clay and other soils differ greatly because of the softening of mudstone particles.
This study focuses on the influence of the mudstone particle content of SMPM on its rheological properties. Rheological compression tests were performed, and on the basis of the compression curves of each sample, the three defining features of the curve (rheological attenuation factors, attenuation rheology critical strain and limited rheological strain) were determined and analyzed. In addition, a segmented rheological model was developed by modifying an attenuation rheological constitutive model for coarse-grained soil.
2. Test Materials and Testing Methods
2.1. Tested Materials
Crushed SMPM was used as the test material. The sandstone and mudstone blocks for the mixture were both collected from the field in the Three Gorges Reservoir Region; specifically, these were lightly weathered rocks from the Jurassic Shaximiao Formation, formed in the Middle Jurassic period [1]. The uniaxial compression strength of the blocks, as determined in the laboratory, were 60.0–72.2 MPa for the sandstone and 8.3–25.8 MPa for the mudstone [3]. The large sandstone and mudstone blocks were artificially crushed into small particles with sizes of less than 5 mm. The small sandstone and mudstone particles were separated by a screen test to obtain sandstone and mudstone particle groups with particle sizes ranges of 5–2, 2–1, 1–0.5, 0.5–0.25, 0.25–0.075 and 0.075–0 mm.
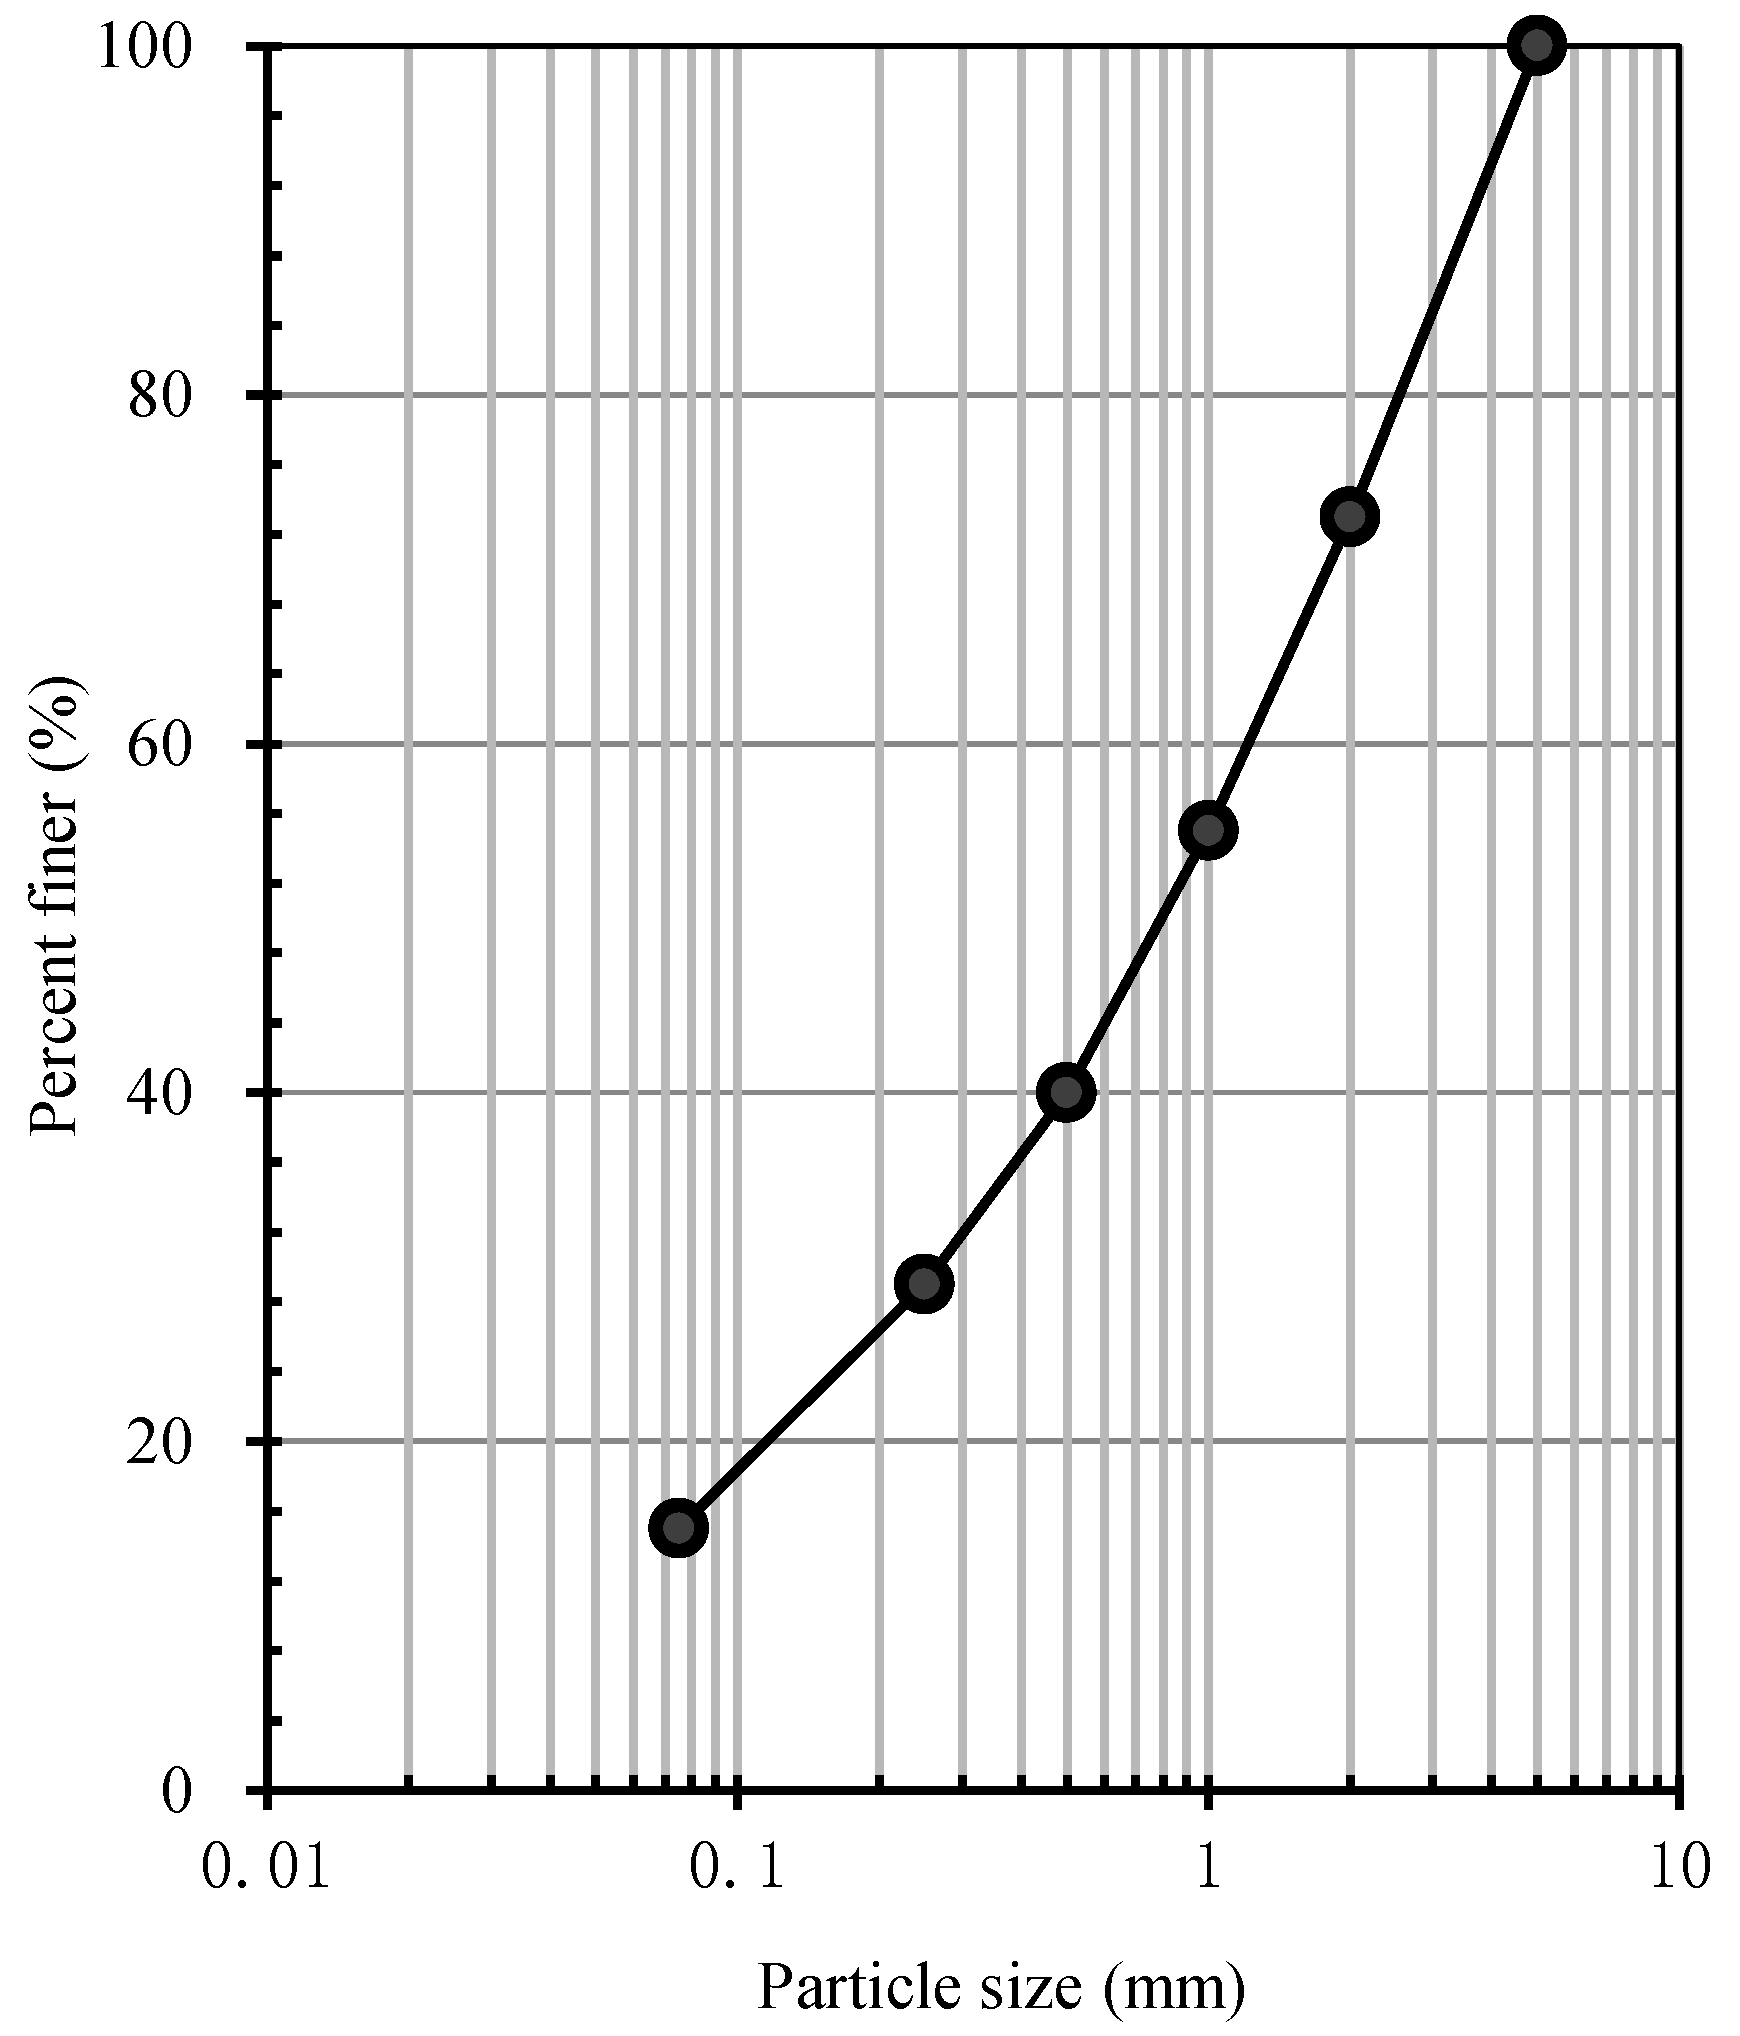
The dry density and moisture content of the samples were 1830 kg/m3 and 8%, respectively. The particle grading curve is shown in Figure 1; the maximum particle size was 5 mm. The mean particle size of the particle grading curve, D50, was 0.83 mm, and the non-uniformity and curvature coefficients were 25.56 and 1.16, respectively. The particle contents are listed in Table 1, in terms of the various particles size fractions.
2.2. Confined Uniaxial Compression Tests
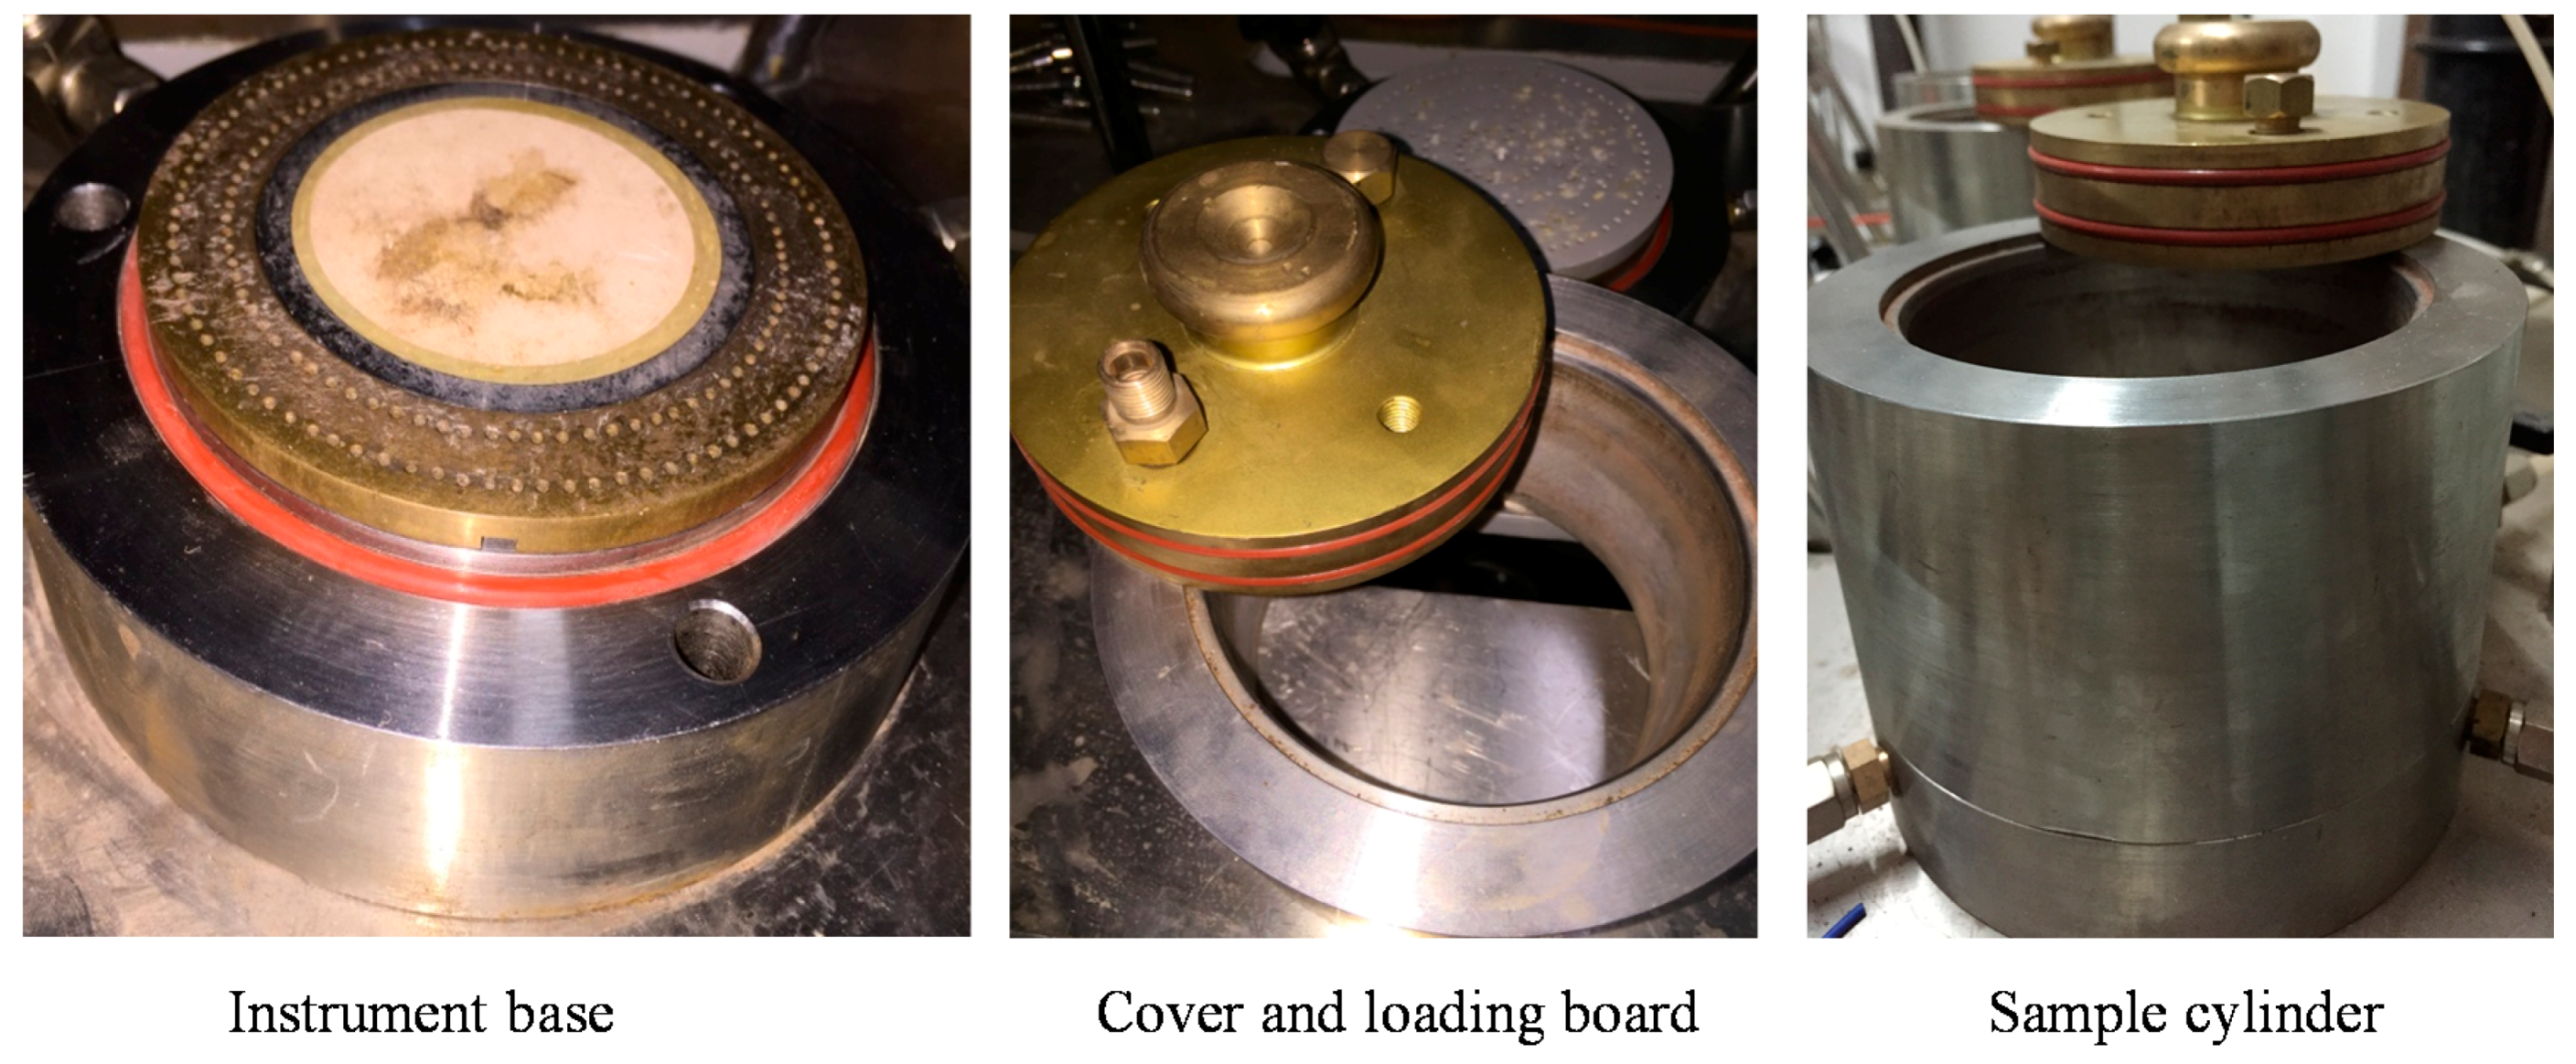
Confined uniaxial compression tests were performed to investigate the rheological deformation of SMPM. The compression-test instrument consisted of an axial loading system, sample container, temperature sensor, axial-deformation sensor and an automatic test data-acquisition system. The axial deformation of the test instrument ranged between 0 and 15 mm. This test instrument is advantageous in that it can measure deformation to a high precision while acquiring loading and deformation data during the test. The deformation-acquisition precision was 0.001 mm. Axial pressure was introduced using the lever and weights, with a maximum axial pressure of 2.4 MPa. The cylindrical sample was 7 mm high, with a diameter of 100 mm; it was contained in a sample cylinder. Figure 2 shows that the test instrument was equipped with an instrument base, a cover, a loading board and a sample cylinder. At the base, a rigid annular porous stone and a round ceramic plate for drainage were installed. The porous stone and ceramic plate were connected to an outlet valve. O-rubber rings were installed within the base and cover to prevent air and water leakage. The rheological compression test was performed with drainage to investigate the effects of the mudstone particle content and axial pressure on the rheological deformation.
2.3. Testing Method
A total number of 24 SMPM samples was prepared, which were then divided into four groups (six samples in each group). The mudstone contents in the four groups were 20%, 40%, 60% and 80%. A compressive rheological test was conducted on each group at six different axial pressure values: 100, 200, 400, 800, 1200 and 1600 kPa. The compressive rheological tests were performed according to the Trade Standard of PRC SL237-015 [24]. Each test was carried out as the follows:
(1) The sandstone and mudstone particles were weighed and poured into a bowl according to their density, the particle-grading curve and the mudstone particle content. These particles were then uniformly mixed. Next, distilled water (the sample moisture content was 8%) was weighed and evenly sprayed onto the sample at three different times, during which the particles were mixed continuously until the moisture was thoroughly integrated into the particles, with a consistent color. Subsequently, the materials were sealed to avoid water evaporation and were left standing for 24 h to ensure thorough mixing of the particles and water.
(2) The prepared materials were divided into three equal parts. Each part was poured into the compaction apparatus for compaction. Each compacted layer was roughened to ensure good contact between the particles at the compaction interfaces. Filter papers and porous stones were orderly placed at the top of every sample.
(3) The sample cylinder was then cleaned. Subsequently, lubricating oil was applied to the base and inner wall of the cylinder using a banister brush. The sample was carefully pushed into the sample cylinder. From the bottom to the top of the sample cylinder, the arrangement was as follows: base (with porous stones), filter paper, sample, porous stone and pressure cover.
(4) The lever position was adjusted to align its axis with that of the counter weight, following which, the lever height was fixed, and the displacement sensor was mounted. A pressure of 1 kPa was introduced for pre-compaction for approximately 10 min, at which point, the axial deformation gauge was reset.
(5) The predetermined axial pressure in the testing scheme was introduced in a stepwise fashion, using six sequential vertical pressure values: 50, 100, 200, 400, 800 and 1200 kPa. Each pressure was applied for 60 min. The sample was allowed to drain freely during the entire testing process.
(6) The sample was considered to be stable when the axial deformation rate was less than 0.005 mm/h. The compressive rheological test was then conducted for 4.5 days after the predetermined axial pressure was applied. The axial stress and deformation during the whole test were recorded per hour.
3. Test Results
3.1. Results of the Rheological Tests
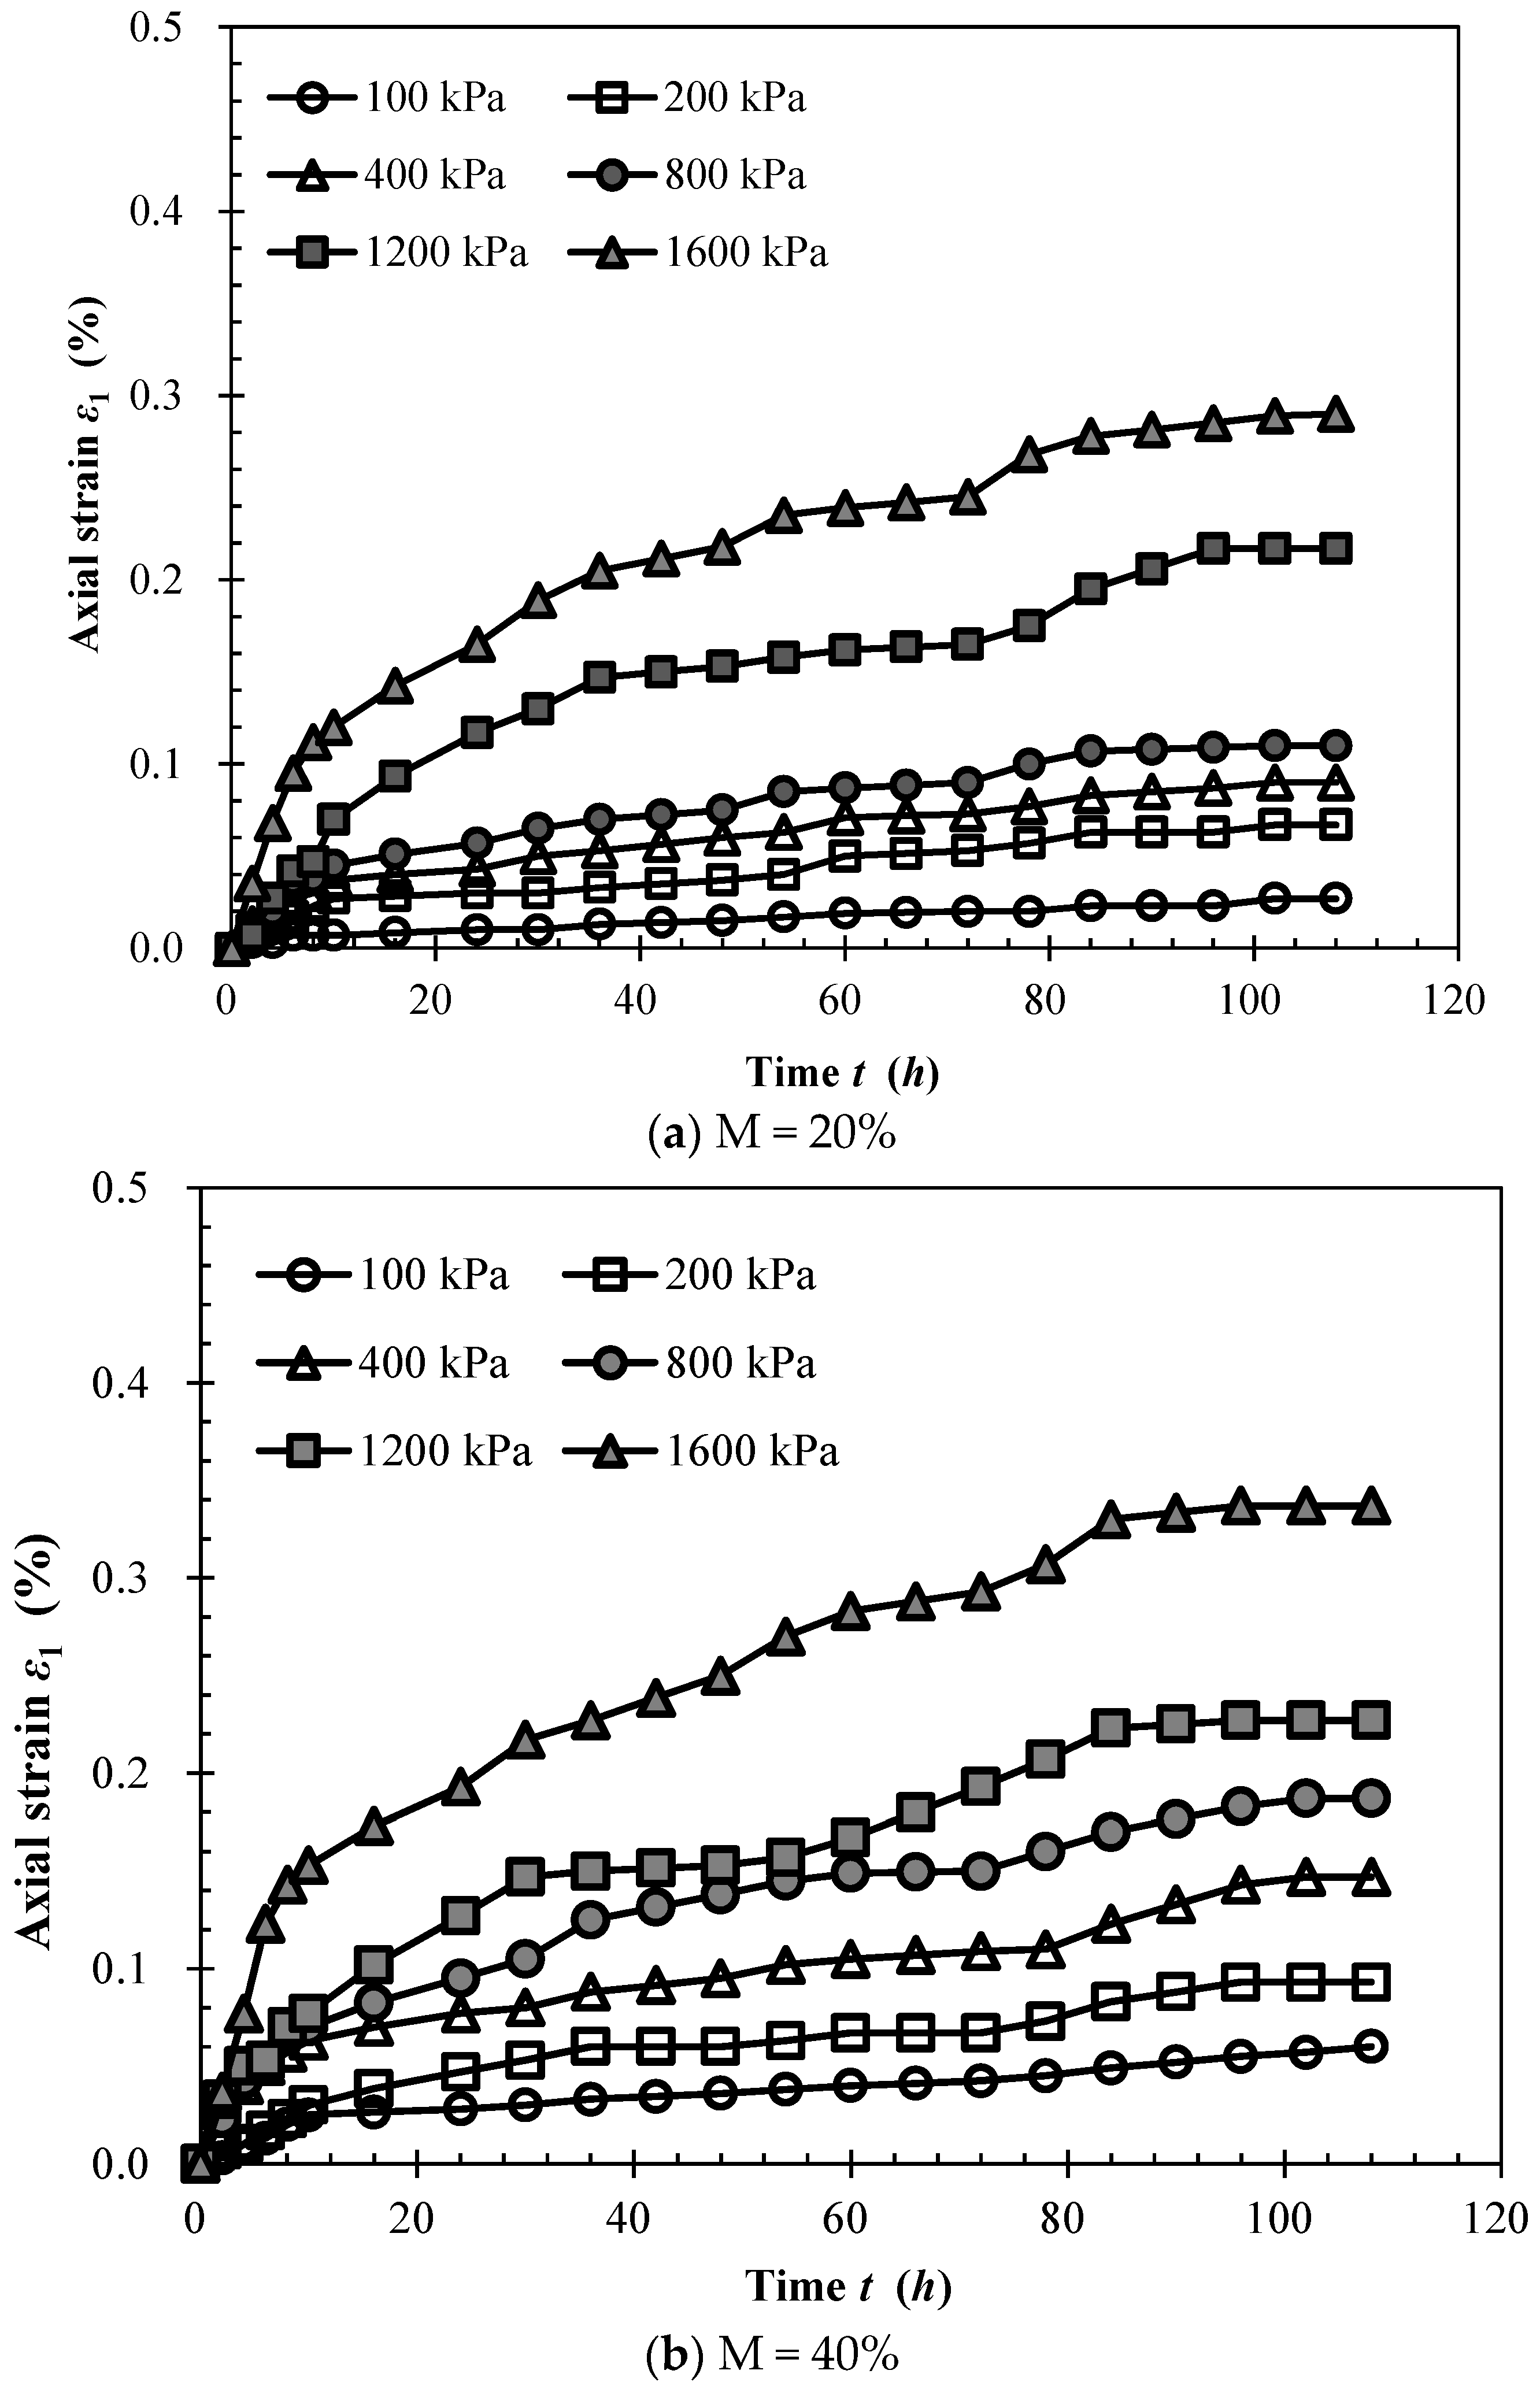
Compressive rheological tests were carried out under different vertical stresses and for different samples to investigate the effects of vertical stress and mudstone particle content on the rheological characteristic of SMPM. The resulting compressive rheological curves under different axial pressure conditions are shown in Figure 3. The test data were recorded per hour. In the figures, the data were selected for every 2 h in the first 10 h and every 6 h in the follows processes.
The rheological axial strain of SMPM initially increased before stabilizing. The final rheological limit axial strain ranged from 0.027–0.290% (mudstone particle content of 20%; vertical pressure values ranging from 100–1600 kPa). The rheological limit axial strain increased with increasing vertical pressure and increasing mudstone particle content. When the vertical pressure was 1600 kPa, the rheological limit axial strains were 0.290%, 0.337%, 0.347% and 0.470% for mudstone particle contents of 20%, 40%, 60% and 80%, respectively.
Shortly after loading, the axial strain was found to increase in an approximately linear fashion. This period could therefore be considered as the linear rheological phase. The slope of the increasing line was related to both the axial pressure and the mudstone particle content. The final axial strain of the linear rheological phase was 0.057%, 0.065%, 0.080%, 0.120%, 0.157% and 0.250% for vertical pressure values of 100, 200, 400, 800, 1200 and 1600 kPa, respectively (mudstone particle content of 80%). When the vertical pressure was 1600 kPa, the final axial strain values of the linear phase were 0.112%, 0.143%, 0.146% and 0.250% for mudstone particle contents of 20%, 40%, 60% and 80%, respectively.
3.2. Four-Phase Rheological Process
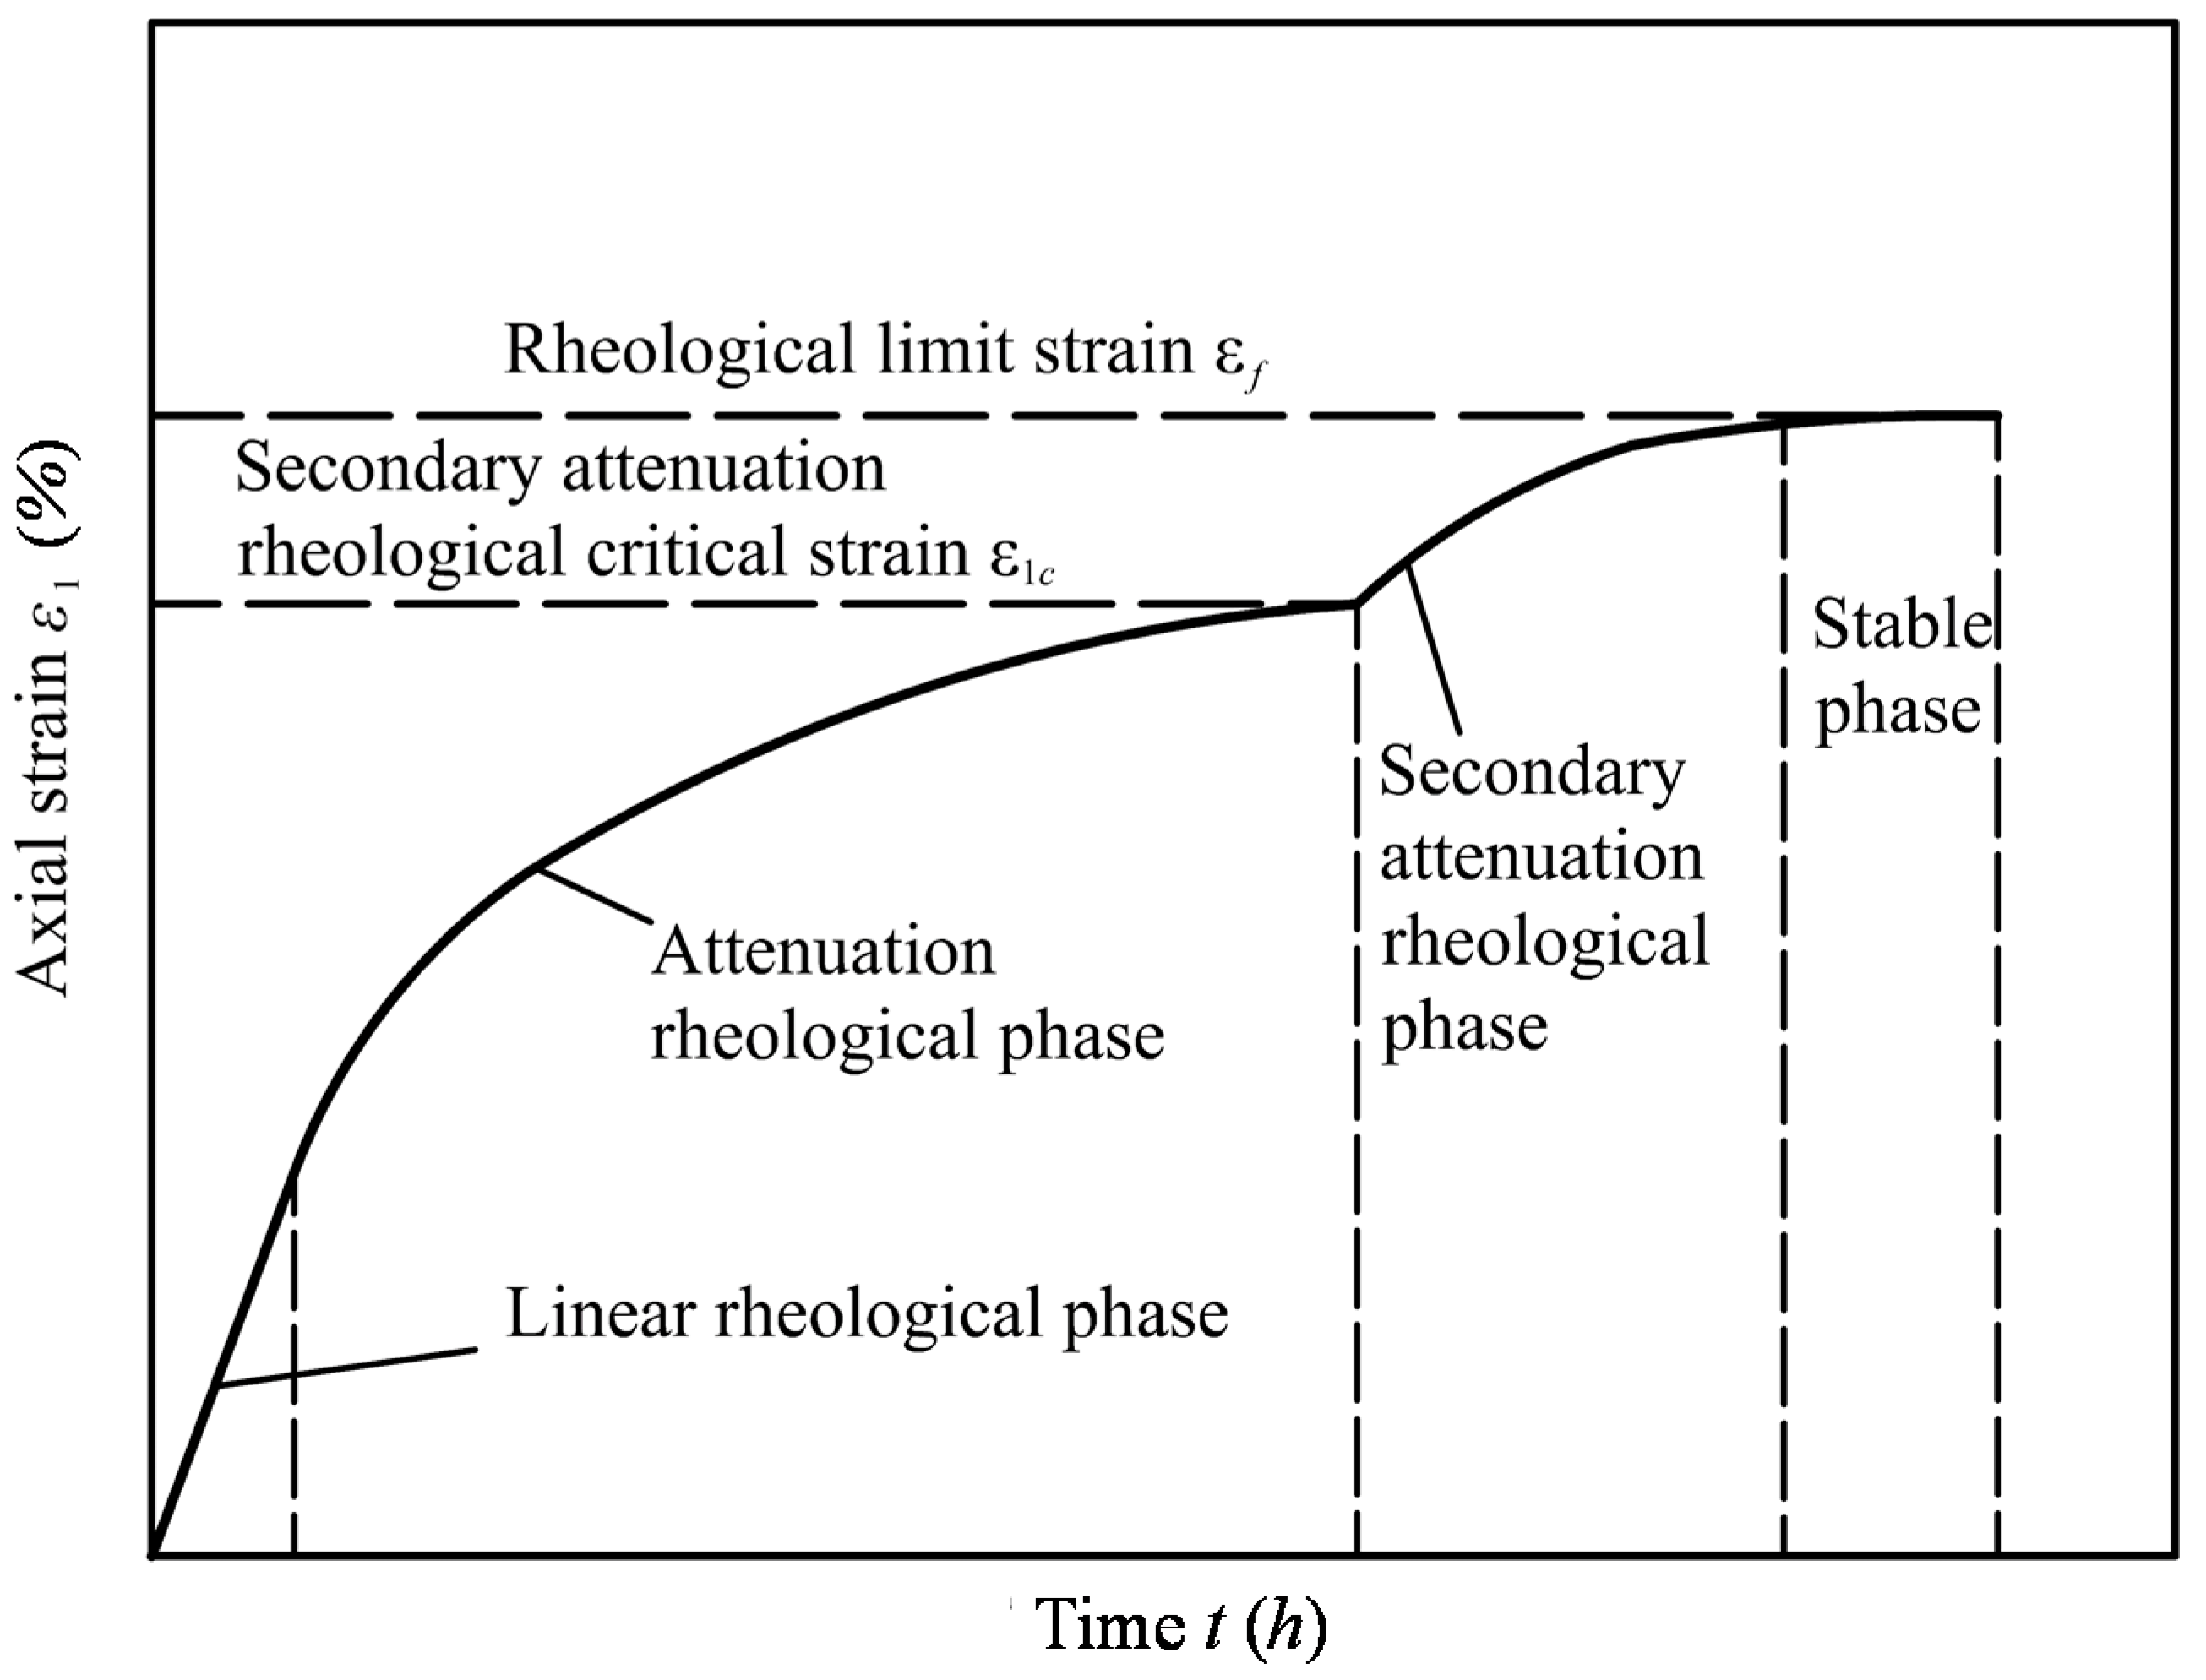
Most of the rheological curve variations of the axial strain and time took the form of the stylized curve shown in Figure 4. The entire process for these tests could be divided into four phases: the linear rheological phase, the attenuation rheological phase, the secondary attenuation rheological phase and the stable phase. The largest difference in the rheological curves between these SMPM phases and those of coarse-grained rock-fill materials was that the attenuation phase for SMPM was followed by a secondary attenuation phase. This was the result of an increase in rheological deformation, which might have been caused by the different crushing behaviors of the sandstone and mudstone particles.
The SMPM samples formed a soil-skeleton-structure during the rheological tests. According to Wang et al. [25], the skeleton mentioned in the soil mechanics is actually a relational grid that characterizes the internal particles of the granular material in contact with each other. The soil skeleton considers whether there is contact extrusion between the particles. The contact extrusion in SMPM can be sandstone-sandstone (SS), sandstone-mudstone (SM) or mudstone-mudstone (MM). In the soil-skeleton-structure, the particles may break with the increasing of the contact stress, while the contact stress avoids the critical crushing stress of the particles. Investigated by Xiao et al. [13], the critical particle crushing stress was directly proportional to the uniaxial compression strength. The mudstone particles in MM and SM may be crushed firstly and no longer bear the role of the skeleton until the complete breakage of sandstone in SS.
In the initial attenuation rheological phase, the contact extrusion include SS, SM and MM. The mudstone particles of the MM and SM were much more heavily crushed than the sandstone particles, leading to a gradual stabilization due to the disintegration of the soft mudstone particles. Then, most of the MM and SS no longer played the role of the skeleton. In the secondary attenuation rheological phase, the sandstone particles of SS were the major bearer of the soil skeleton structure [4]. The stress among the sandstone particles between SS might have caused the particles to yield. Then, the sandstone particles might have been progressively crushed and rearranged in the presence of the skeleton, which increased the deformation in this phase.
Finally, the process reached the stable phase, during which the rheological deformation remained basically unchanged. In this phase, the crushing and rearrangement of the sandstone and mudstone particles had stabilized.
4. Segmented Rheological Model for SMPM
4.1. Segmented Rheological Model
The rheological behavior of most coarse-grained soil could be divided into three phases: the linear rheological phase, the attenuation rheological phase and the stable phase. The whole rheological process is called the attenuation rheological process. The attenuation rheological process of the coarse-grained soil has been described by various rheological models, including power, exponential and hyperbolic functions, as follows:
The power model [26] is
where ε1 is the axial rheological strain; a and b are the model parameters; ε1f is the rheological final strain; t is the time of rheological test.
The rheological limit strain of these three models are , , and , respectively.
According to the research of Cao [22], the rheological strain value predicted by the exponential function was larger in the early stage than the test data and smaller in the later stage. The slope of the linear rheological phase predicted by the power function was the largest of these three functions.
According to the analysis presented in Section 3, the rheology of the sandstone-mudstone particle mixture was divided into four phases, which differed from the rheological behavior of coarse-grained soils. A segmented rheological model that was appropriate for the sandstone-mudstone particle mixture was therefore developed in this study by modifying an existing rheological model for the coarse-grained soil.
The segmented rheological model was constructed using the following modeling steps. First, rheological strain, ε1i, was calculated using the three coarse-grained soil rheological models (Equations (1) to (3)), if it had not yet reached the initial critical value, ε1c, of the secondary rheology (Figure 4). Otherwise, the rheological time and rheological strain, ε2i, were recalculated, and the rheological parameters were re-determined. The total rheological strain of the segmented rheological model can be obtained as follows:
where ε1 is the total axial rheological strain and ε1i and ε2i are the attenuation rheology and secondary attenuation rheology, respectively; they can be calculated using the coarse-grained soil rheological models listed in Table 2. ε1c is the critical rheological strain of the secondary attenuation, which can be calculated using the attenuation rheological factor and final rheology, as follows:
where εf is the rheological limit strain and is the rheological attenuation factor.
4.2. Rheological Limit Strain εf
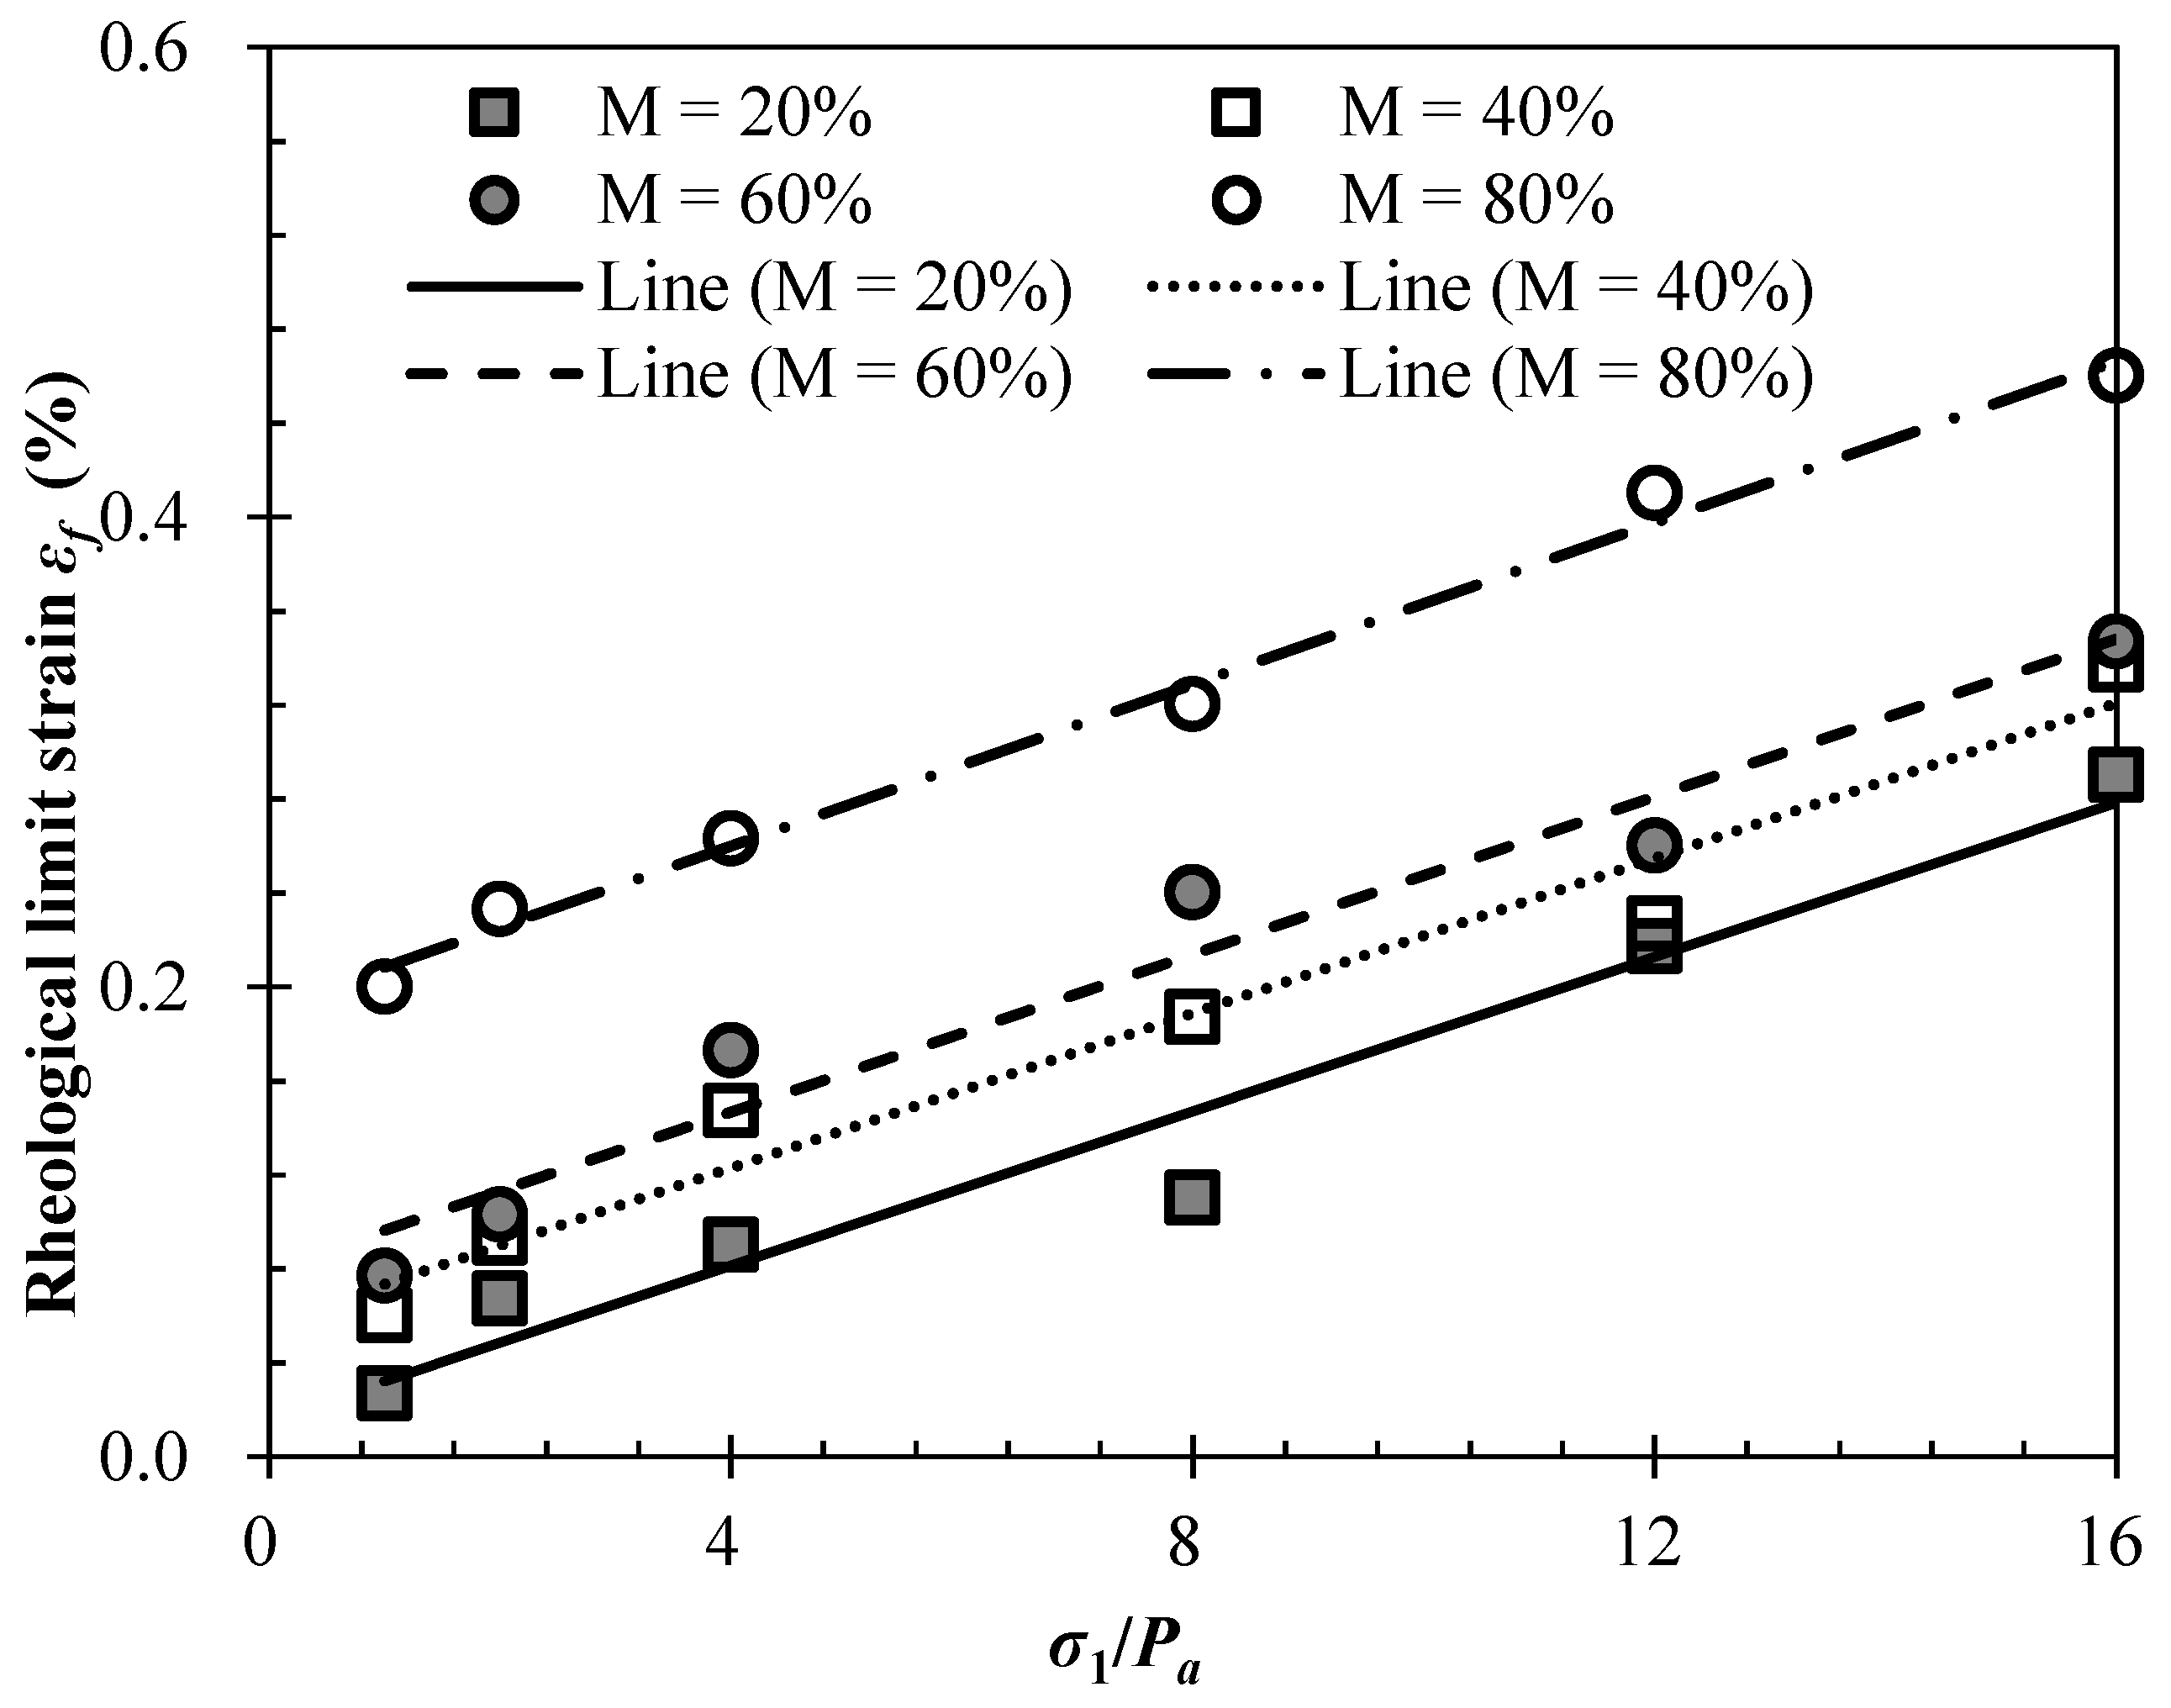
The rheological limit strain εf has been previously investigated by several researchers. Zhang et al. (2010) suggested that εf of rock-fill materials was associated with the confining pressure and concluded that the relationship between the vertical stress and the limit strain could be calculated using a hyperbola. Cao [29] argued that εf (total strain within a test period) was exponentially related to the vertical stress. In the present study, the relationship between the vertical limit strain (total strain within a test period) and axial pressure is shown in Figure 5; εf increased with increasing vertical stress, which could be fitted by the following linear relationship:
where σ1 and pa are the axial and atmospheric pressures (kPa), respectively; and m and n are the fitting parameters associated with the material properties. The fitted values of parameters m and n are listed in Table 2.
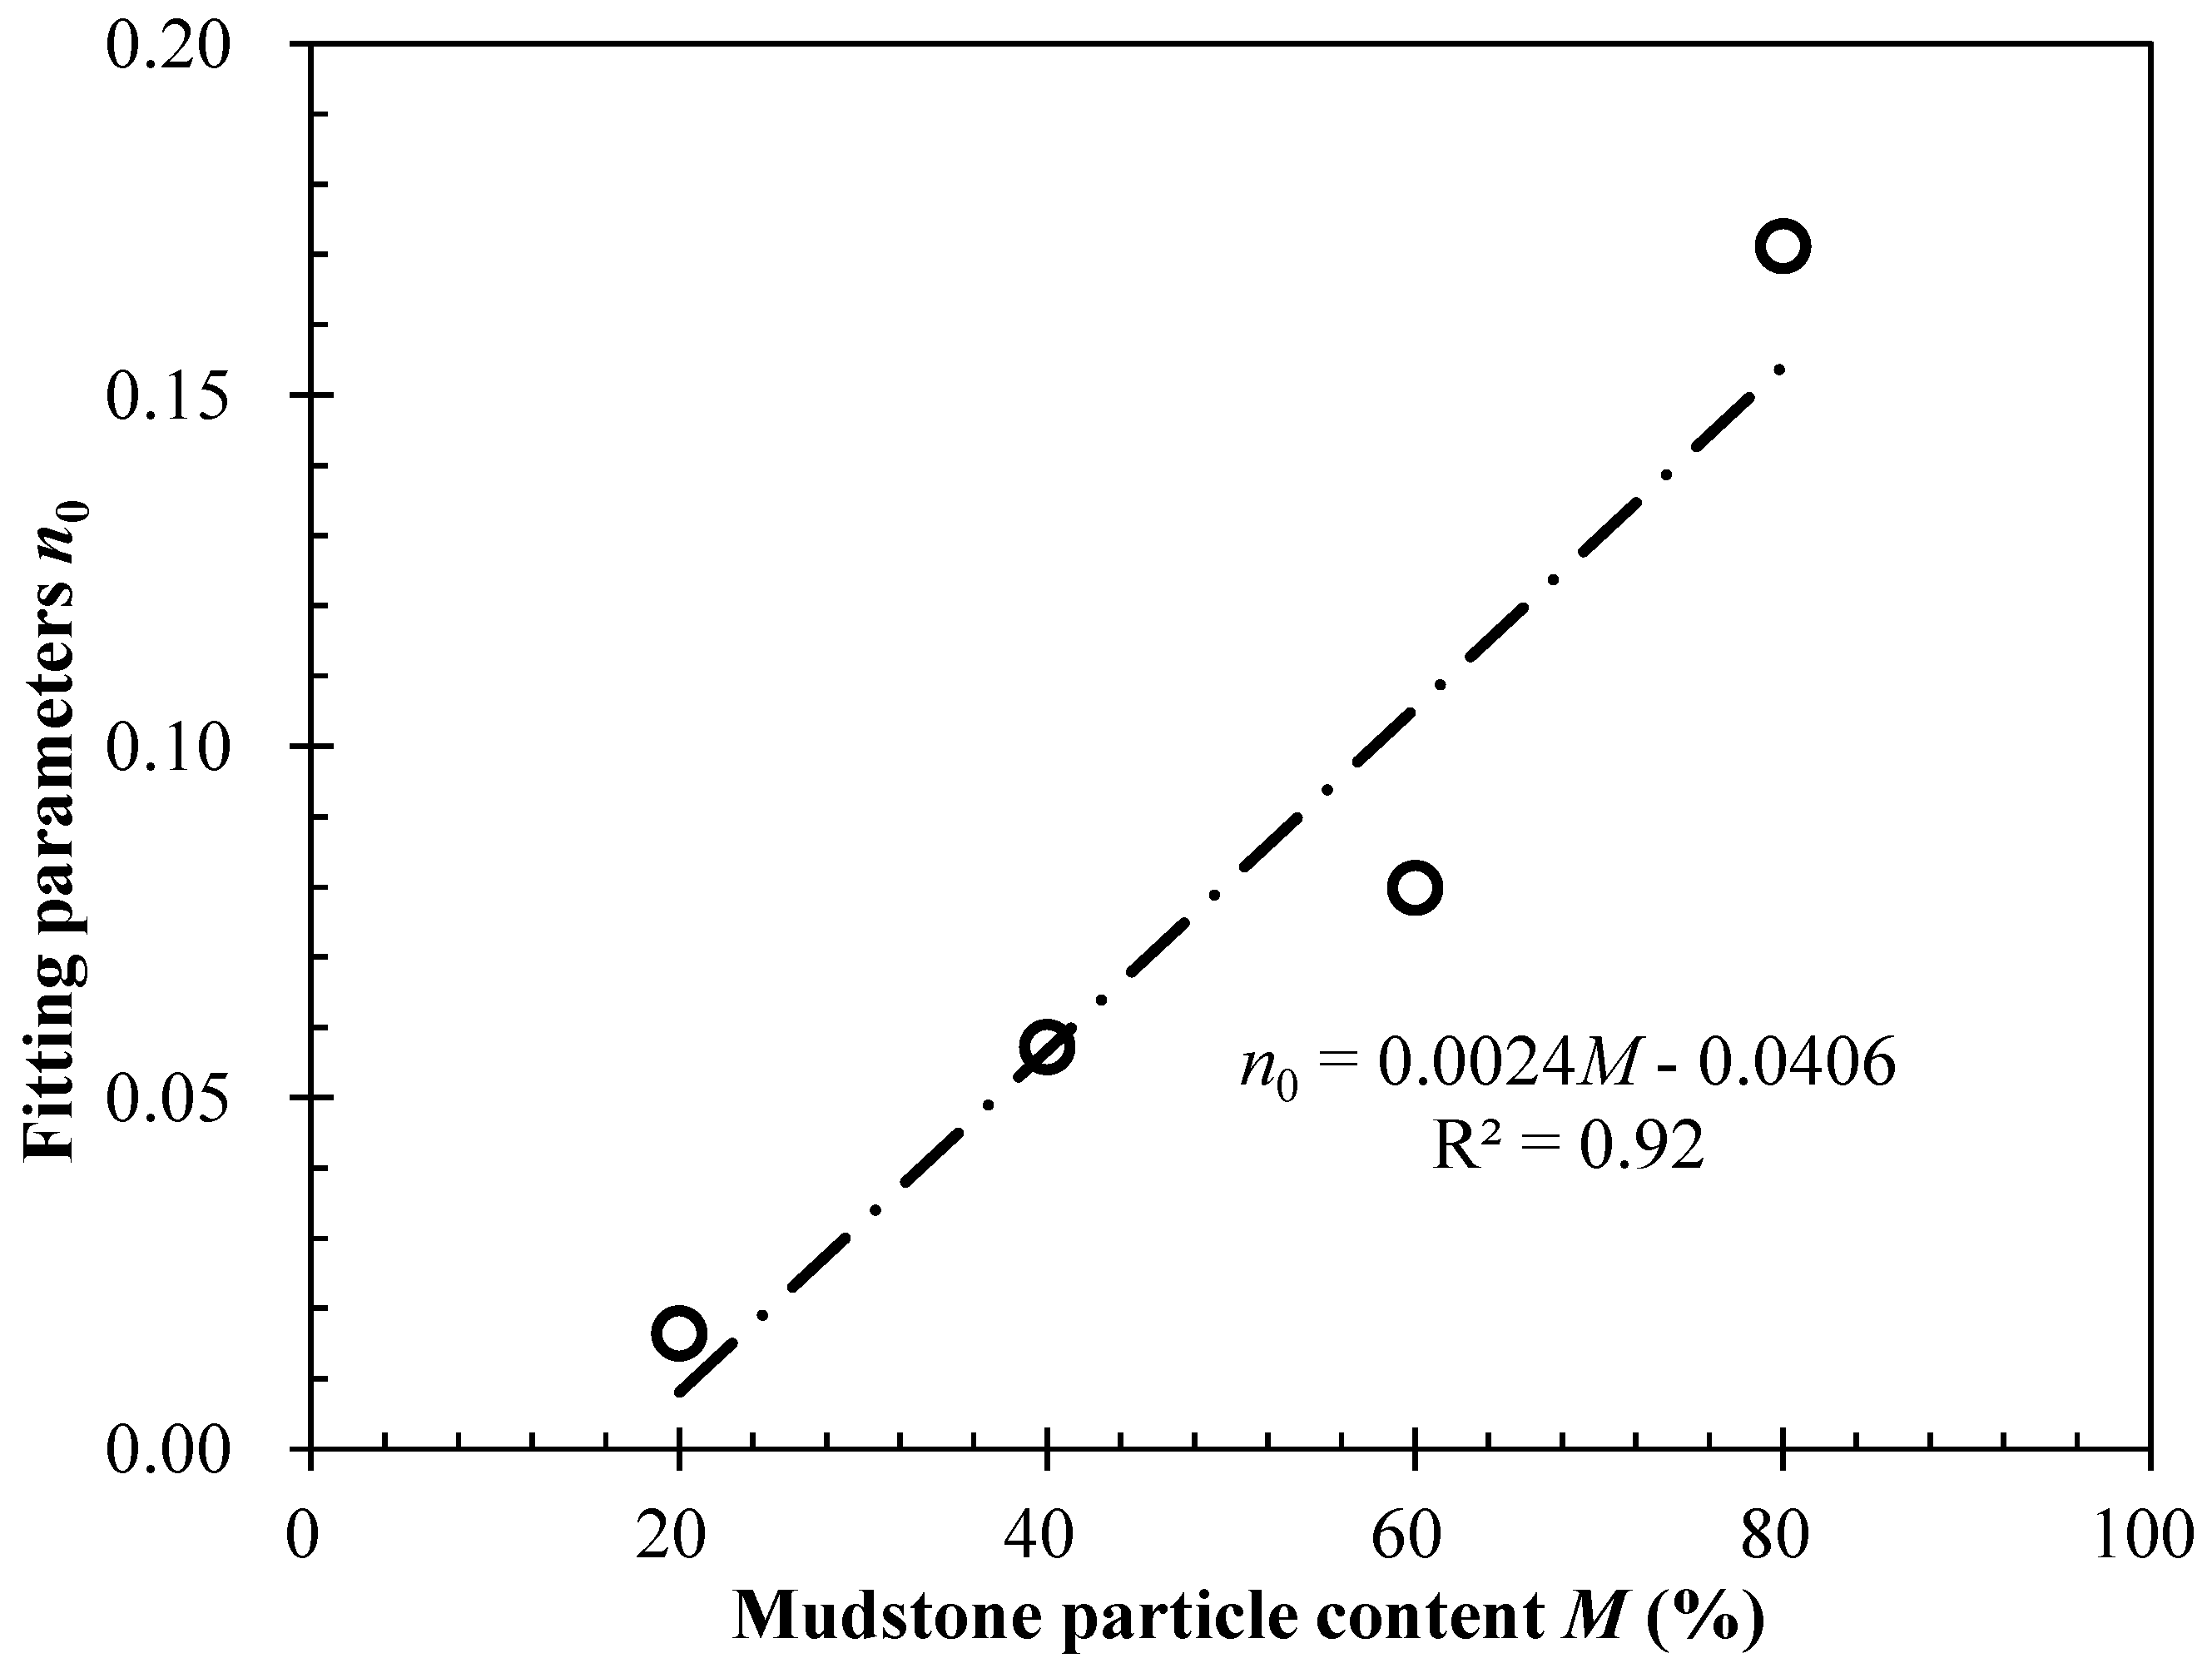
The data presented in Table 2 show that no significant relationship existed between the fitting parameter m and the mudstone particle content of the SMPM. Instead, m remained relatively unchanged, showing only a slight increase from 0.0163–0.0172 as the mudstone particle content increased from 20–80% (mean value of 0.0167). Therefore, m did not vary with the mudstone particle content in this study. The second fitting parameter n did increase with increasing mudstone particle content, as shown in Figure 6. The relationship between fitting parameter n and the mudstone particle content is expressed as follows:
where n is the fitting parameter of the relationship between the rheological limit strain and vertical stress and parameters m0 and n0 are fitting parameters whose values are 0.0024 and 0.0406, respectively.
In summary, the relationship between the rheological limit strain and mudstone particle content and the vertical stress can be expressed as follows:
where εf is the rheological limit strain, M is the mudstone particle content (%) and σ1 and pa are the vertical and atmospheric pressures (kPa), respectively. These three fitting parameters for predicting the rheological limit strain, m, m0 and n0, are fitting parameters whose values are 0.0163, 0.0024 and 0.0406, respectively. σ1 is the vertical stress in the present study. The vertical stress is the sum of pore pressure and the horizontal effective stress. The pore pressure in the coarse-soil is a small force as compared with the effective stress. Investigated by Qiu [4], the pore pressure can be ignored due to the permeability coefficient of the SMPM being greater than 0.01 cm/s. In addition to minimizing the pore pressure of the sample, the pore stone with its permeability coefficient greater than 0.05 cm/s was used in the test. The drainage of the sample was free during the entire testing process.
4.3. Rheological Attenuation Factor
The strain values of the attenuation rheology and final rheology were determined from Figure 2 and Figure 3. The ratio between the strain value of the attenuation rheology and that of the final rheology was defined as the attenuation factor α.
where α is the attenuation factor, ε1c is the critical strain value of the attenuation rheology, which can be obtained using the rheological curve, and εf is the strain value of the final rheology.
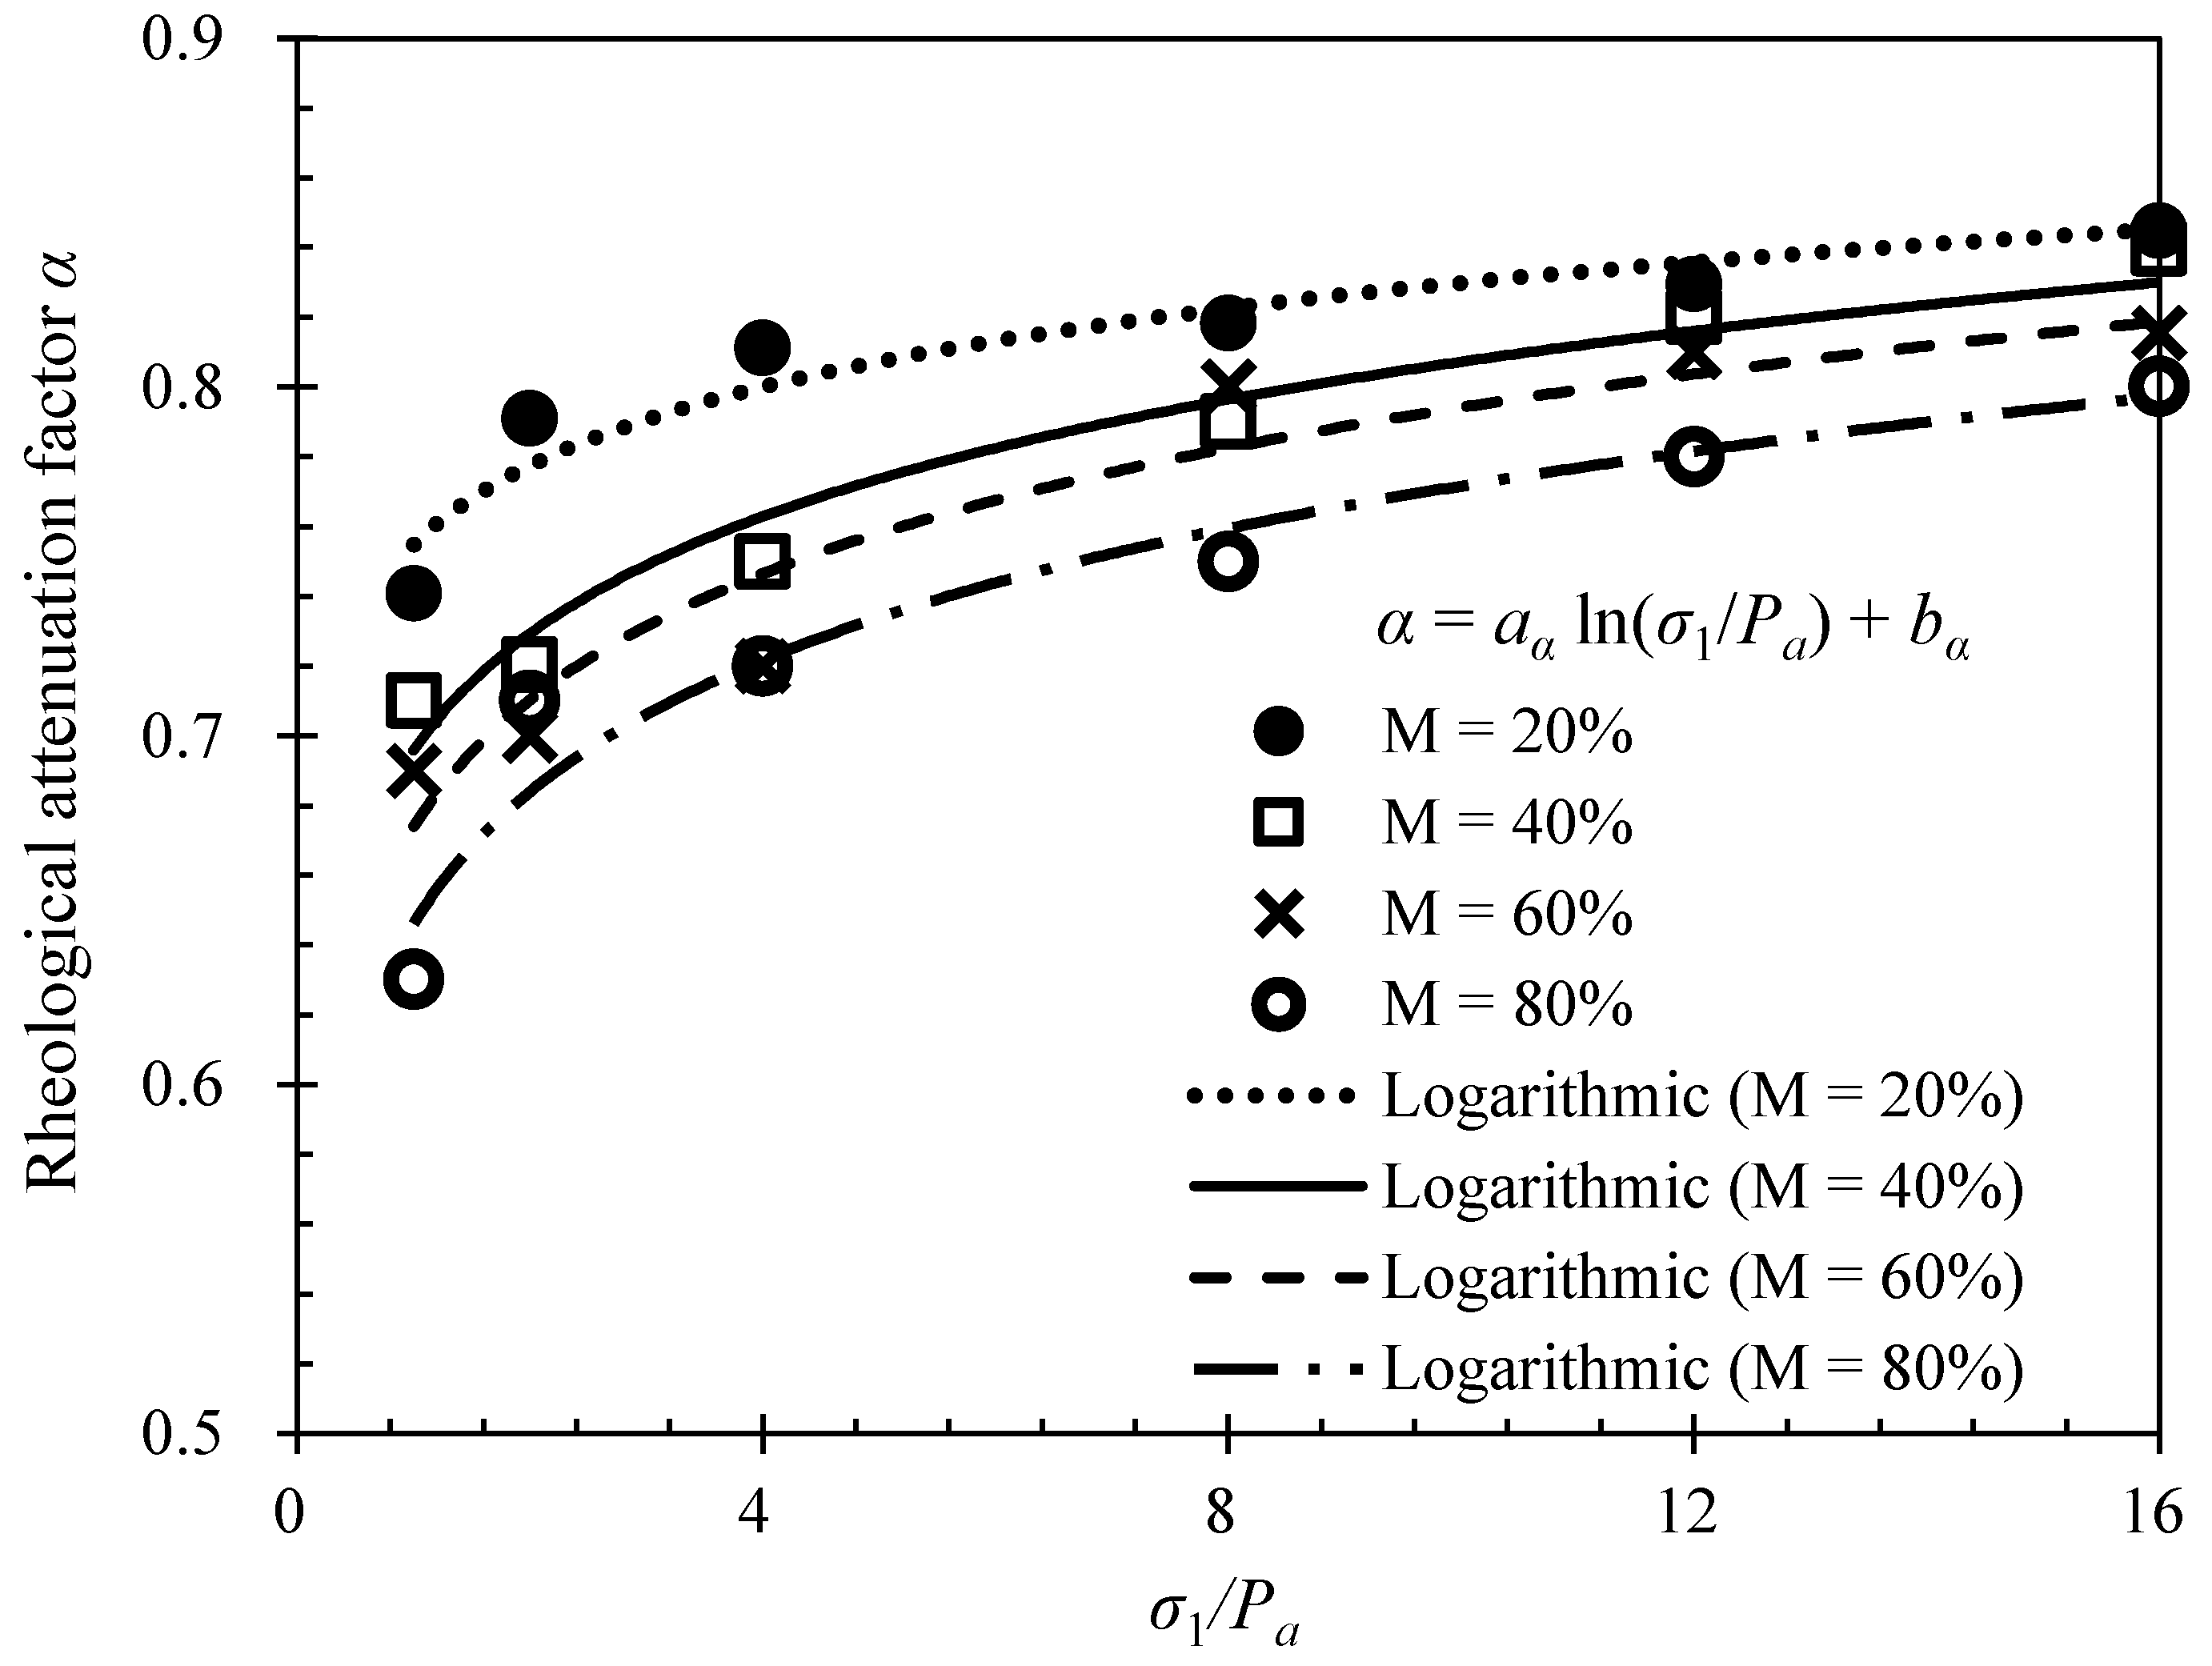
The relationship between the rheological attenuation factor and vertical stress is shown in Figure 7. A certain association appears to exist between the rheological attenuation factor and vertical stress. Furthermore, the rheological attenuation factor increased with increasing vertical stress, before stabilizing towards a constant value. The relationship between the rheological attenuation factor and vertical stress can be described by the following logarithmic function:
where α is the rheological attenuation factor and σ1 and pa are the axial and atmospheric pressures (kPa), respectively. aα and bα are fitting parameters, and their relationship with the mudstone particle content is shown in Figure 8.
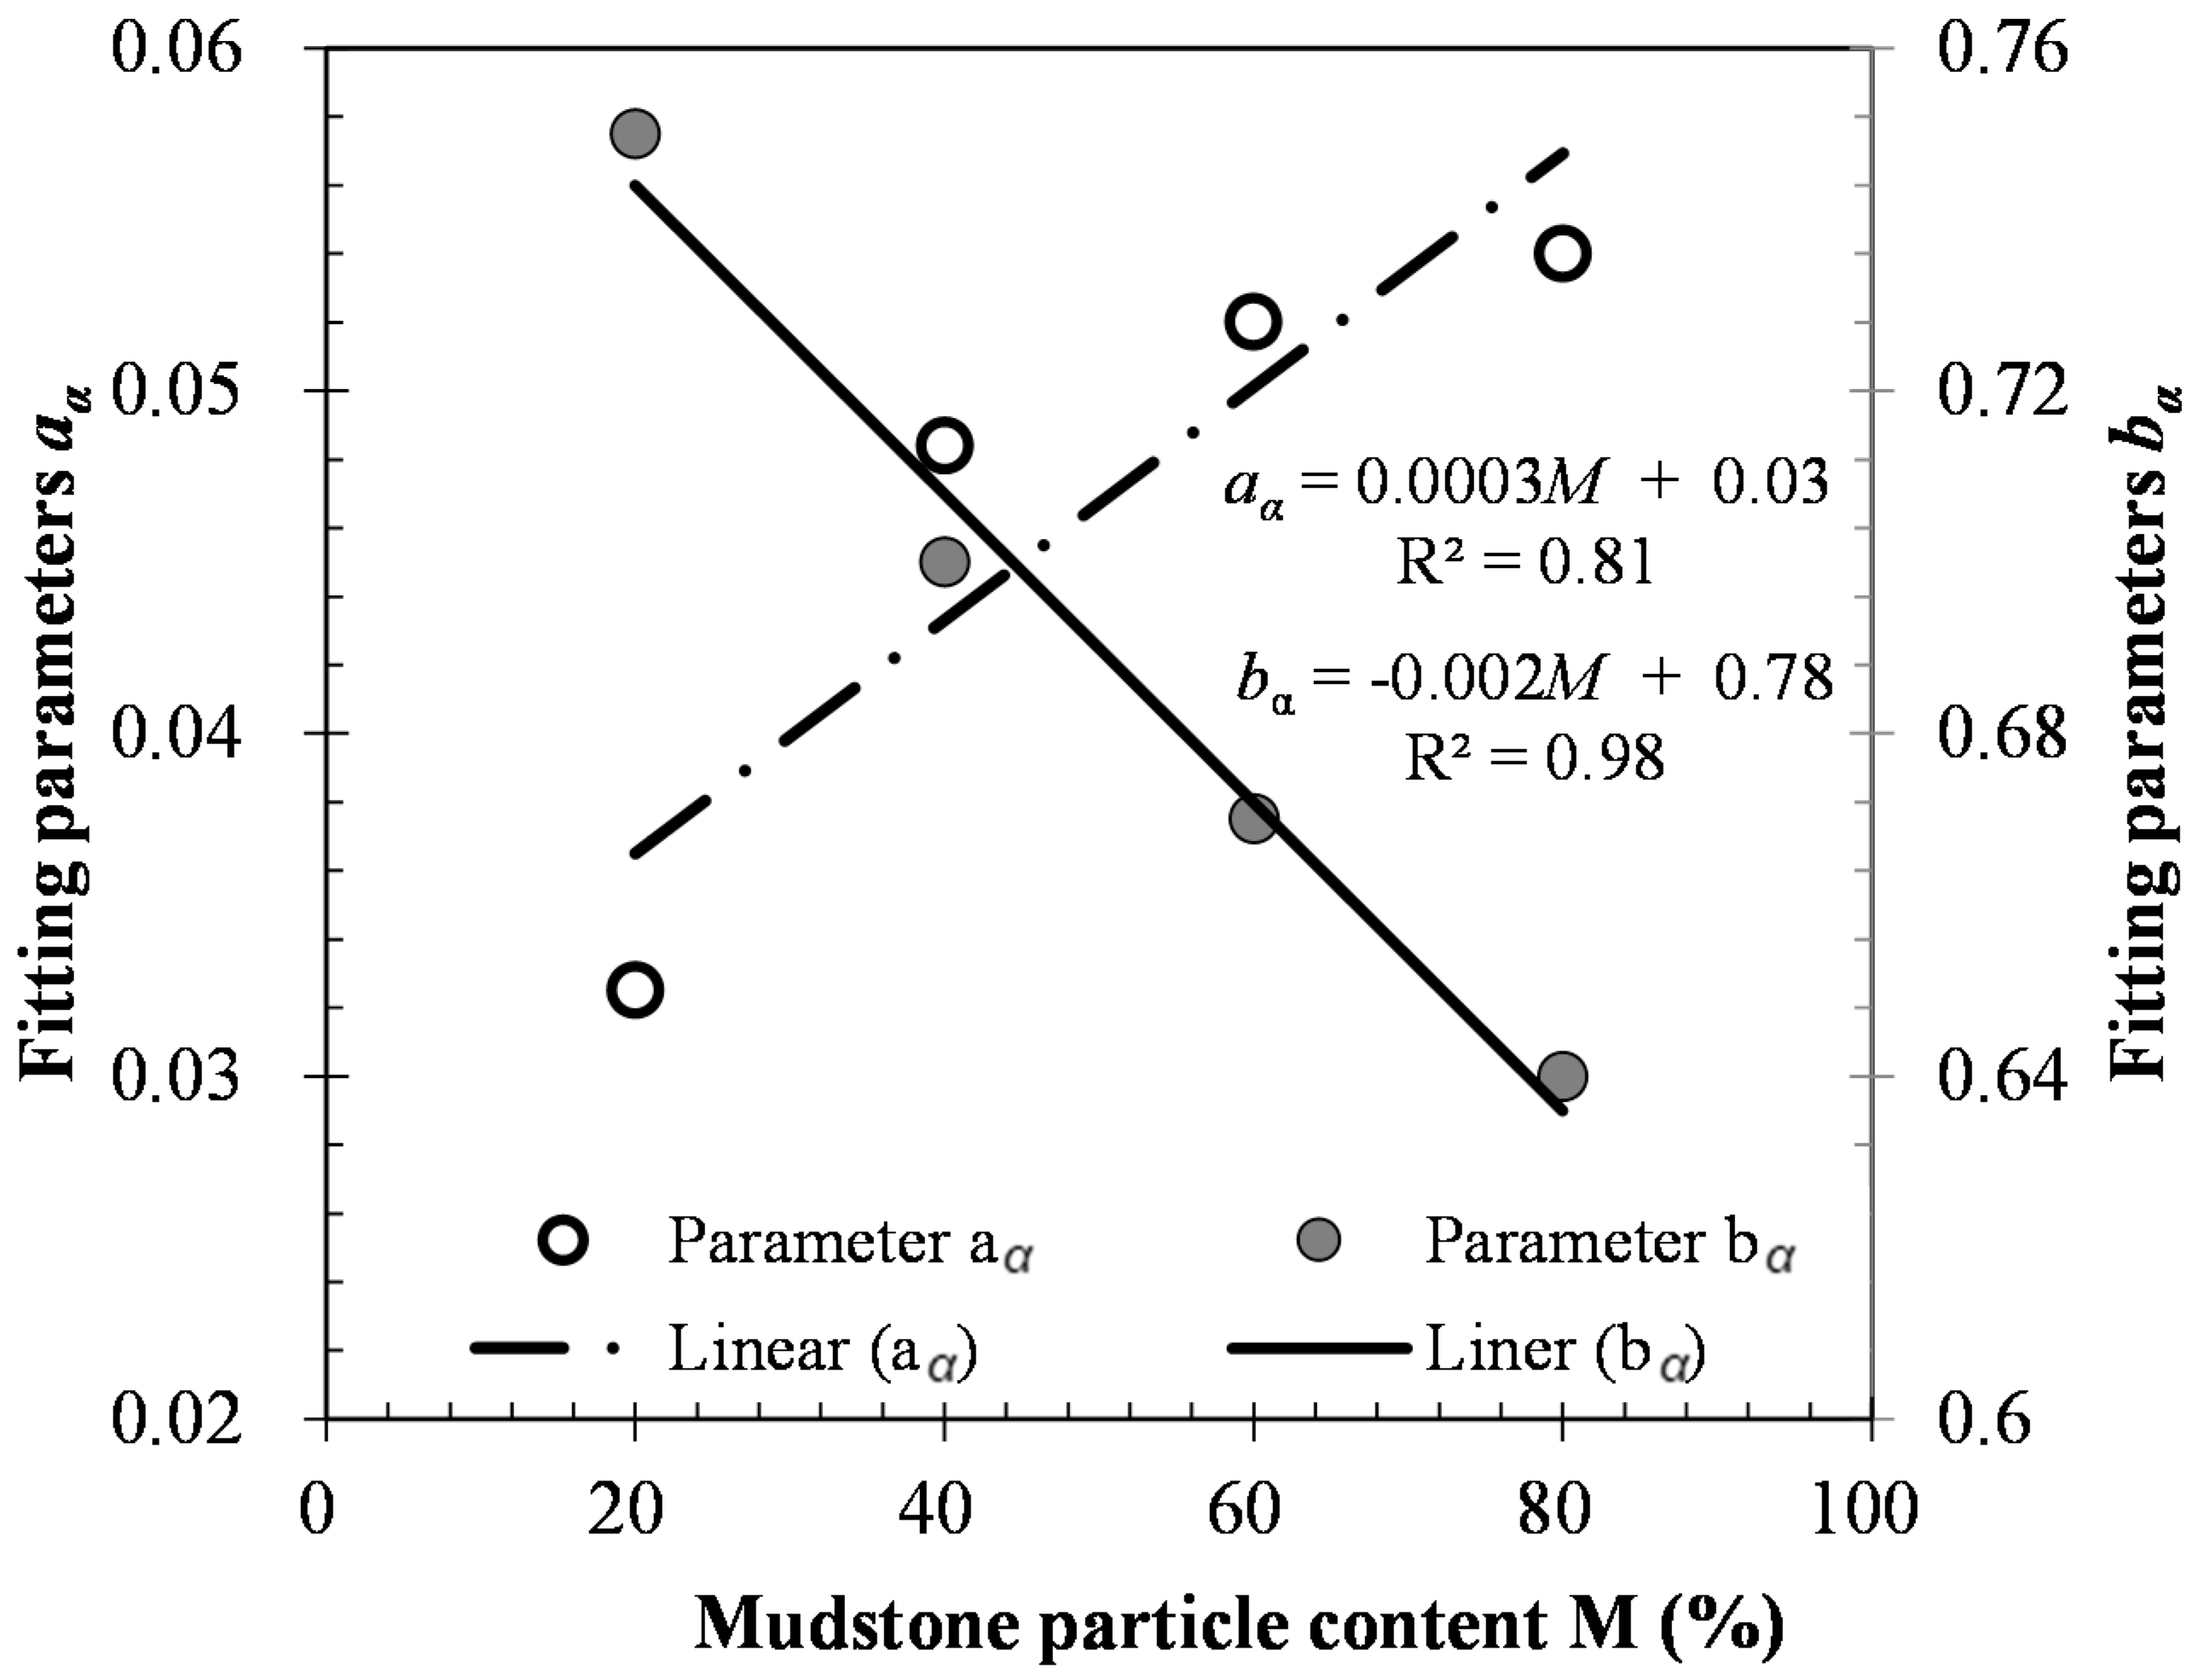
Figure 8 shows that parameter aα increased with increasing mudstone particle content, whereas bα decreased. The relationship between aα, bα and the mudstone particle content could be fitted with a linearly relationship, as follows:
where c1 and d1 are the fitting parameters of the linear fitting relationship between aα and the mudstone particle content with values of 0.0003 and 0.03, respectively. c2 and d2 are the fitting parameters of the linear fitting relationship between bα and the mudstone particle content with values of −0.002 and 0.78, respectively.
The relationships between the rheological attenuation factor, mudstone particle content and vertical stress can be obtained by combining Equations (7) and (8) as follows:
where α is the rheological attenuation factor, M is the mudstone particle content and σ1 and pa are the axial and atmospheric pressures (kPa), respectively. There are four parameters for predicting the rheological attenuation factor. c1, d1, c2 and d2 are fitting parameters whose values are 0.0003, 0.03, −0.002 and 0.78, respectively.
5. Discussions
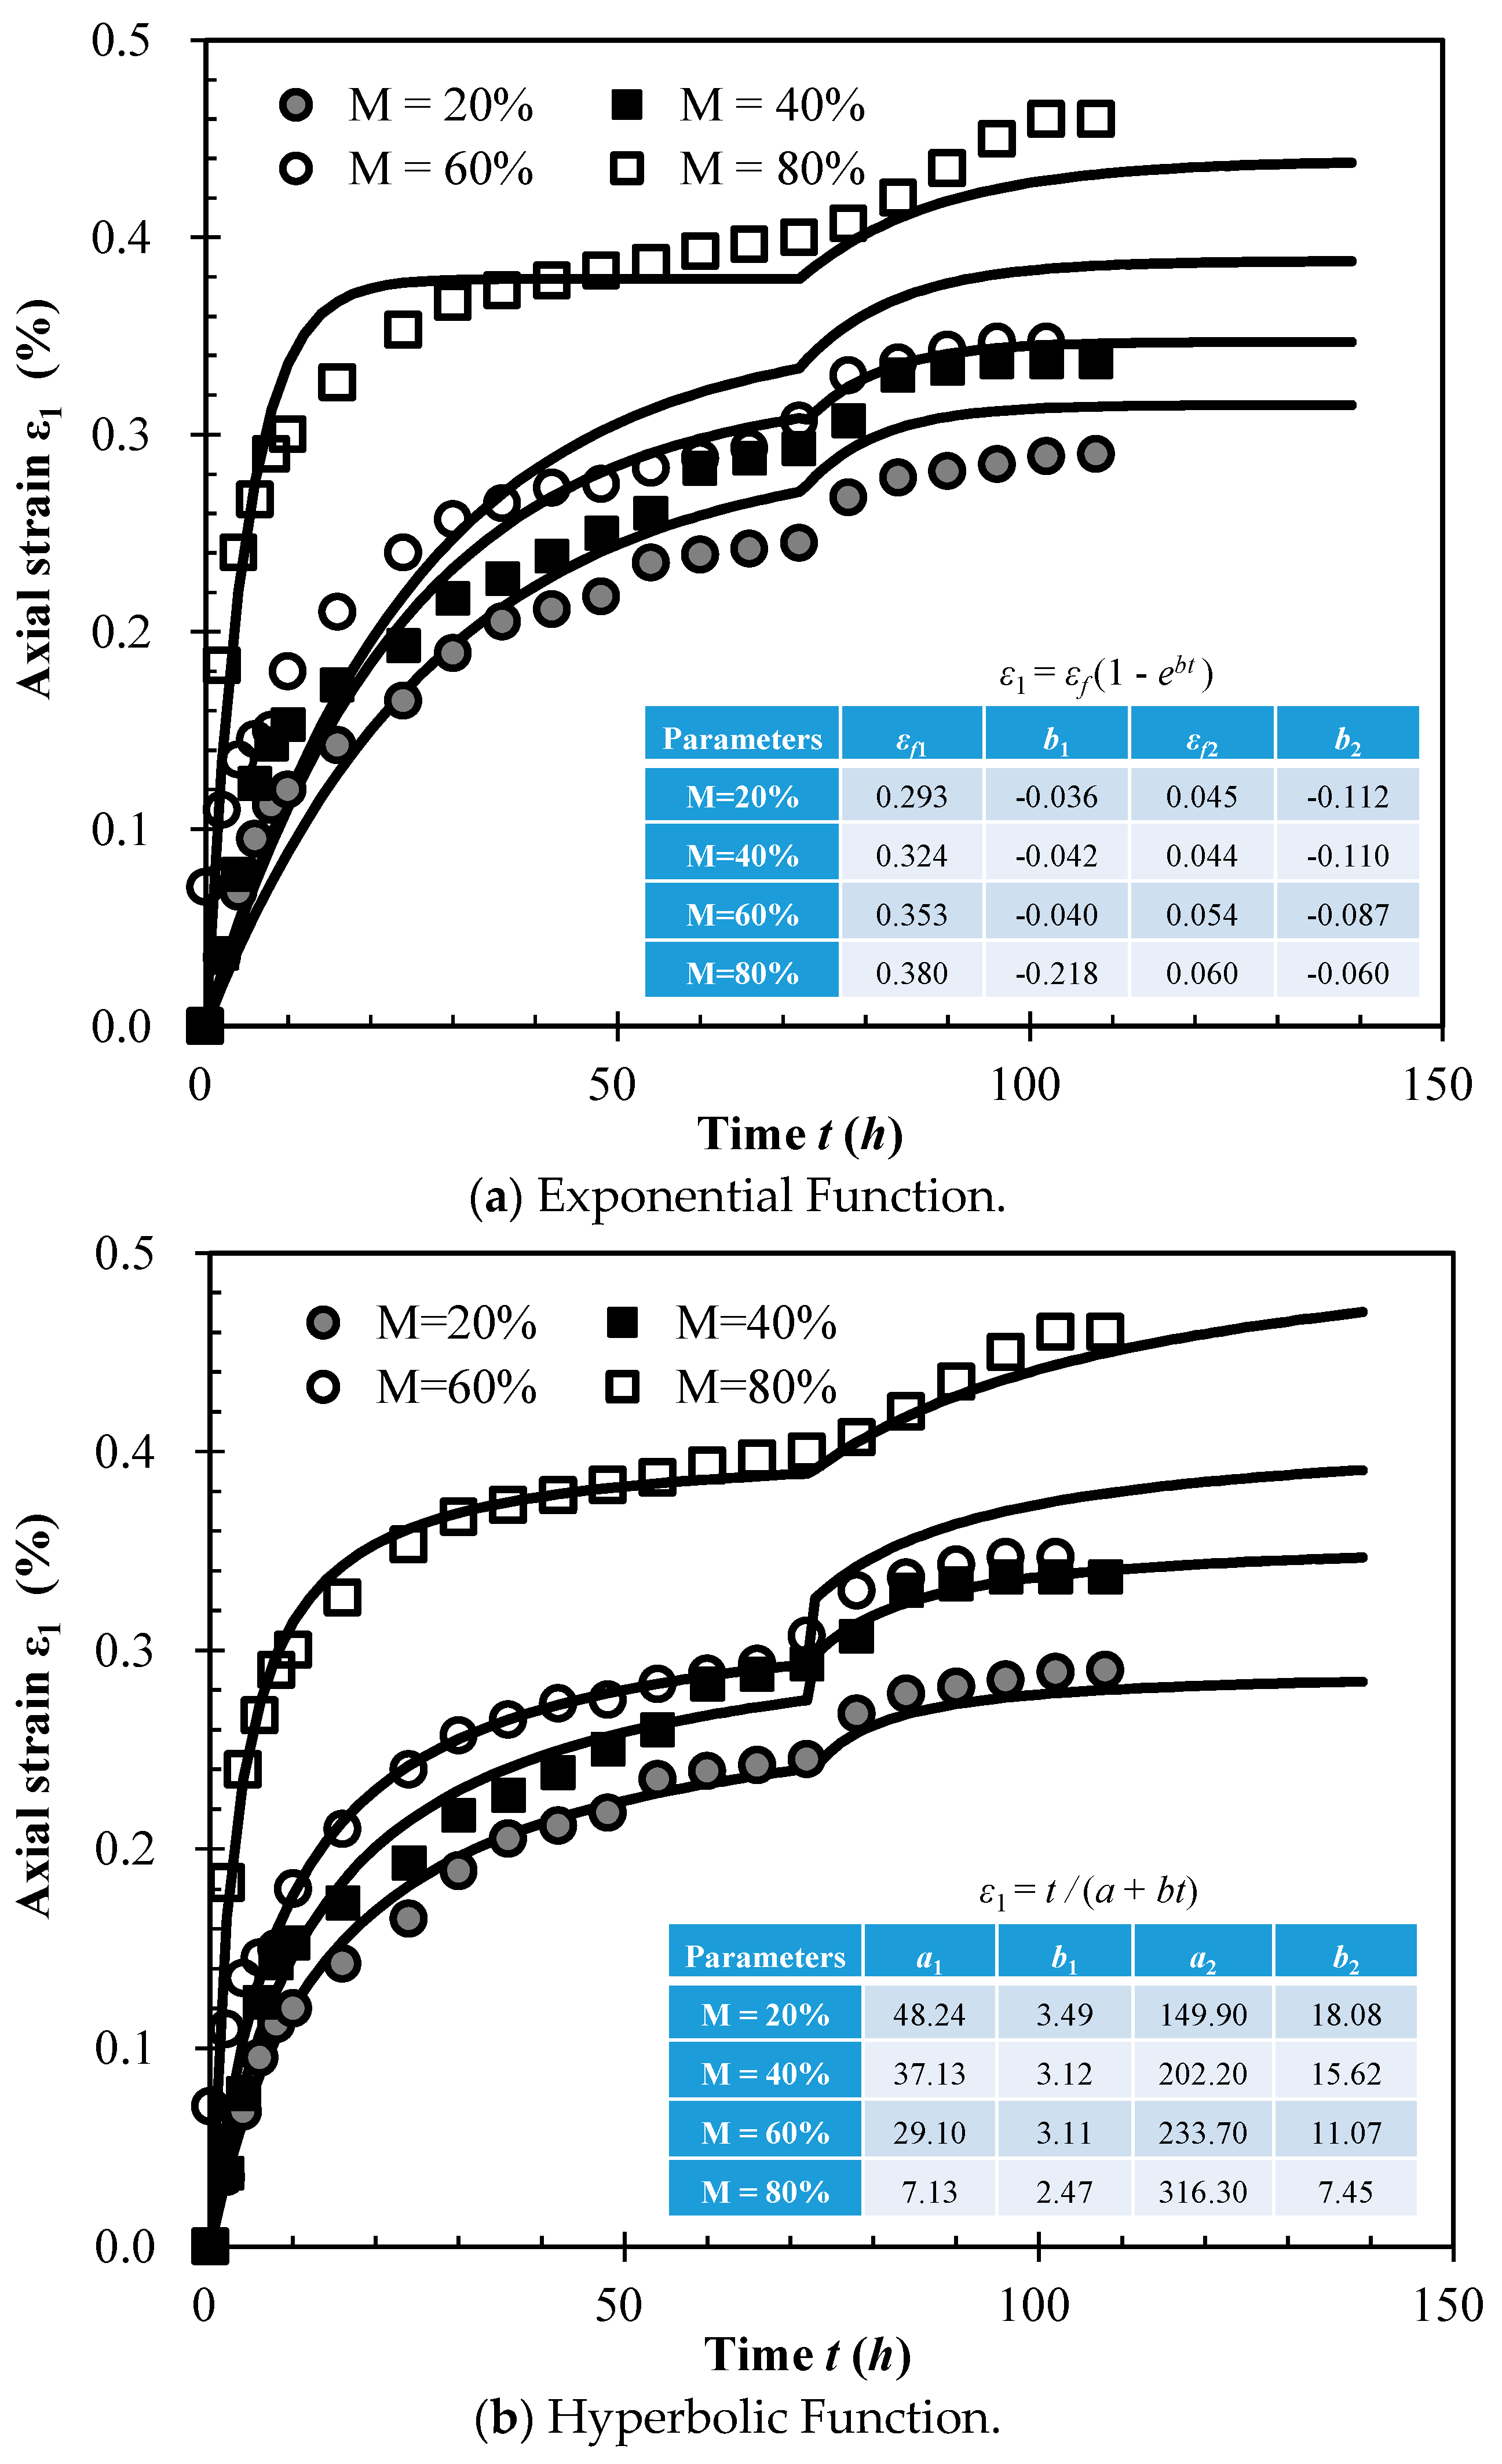
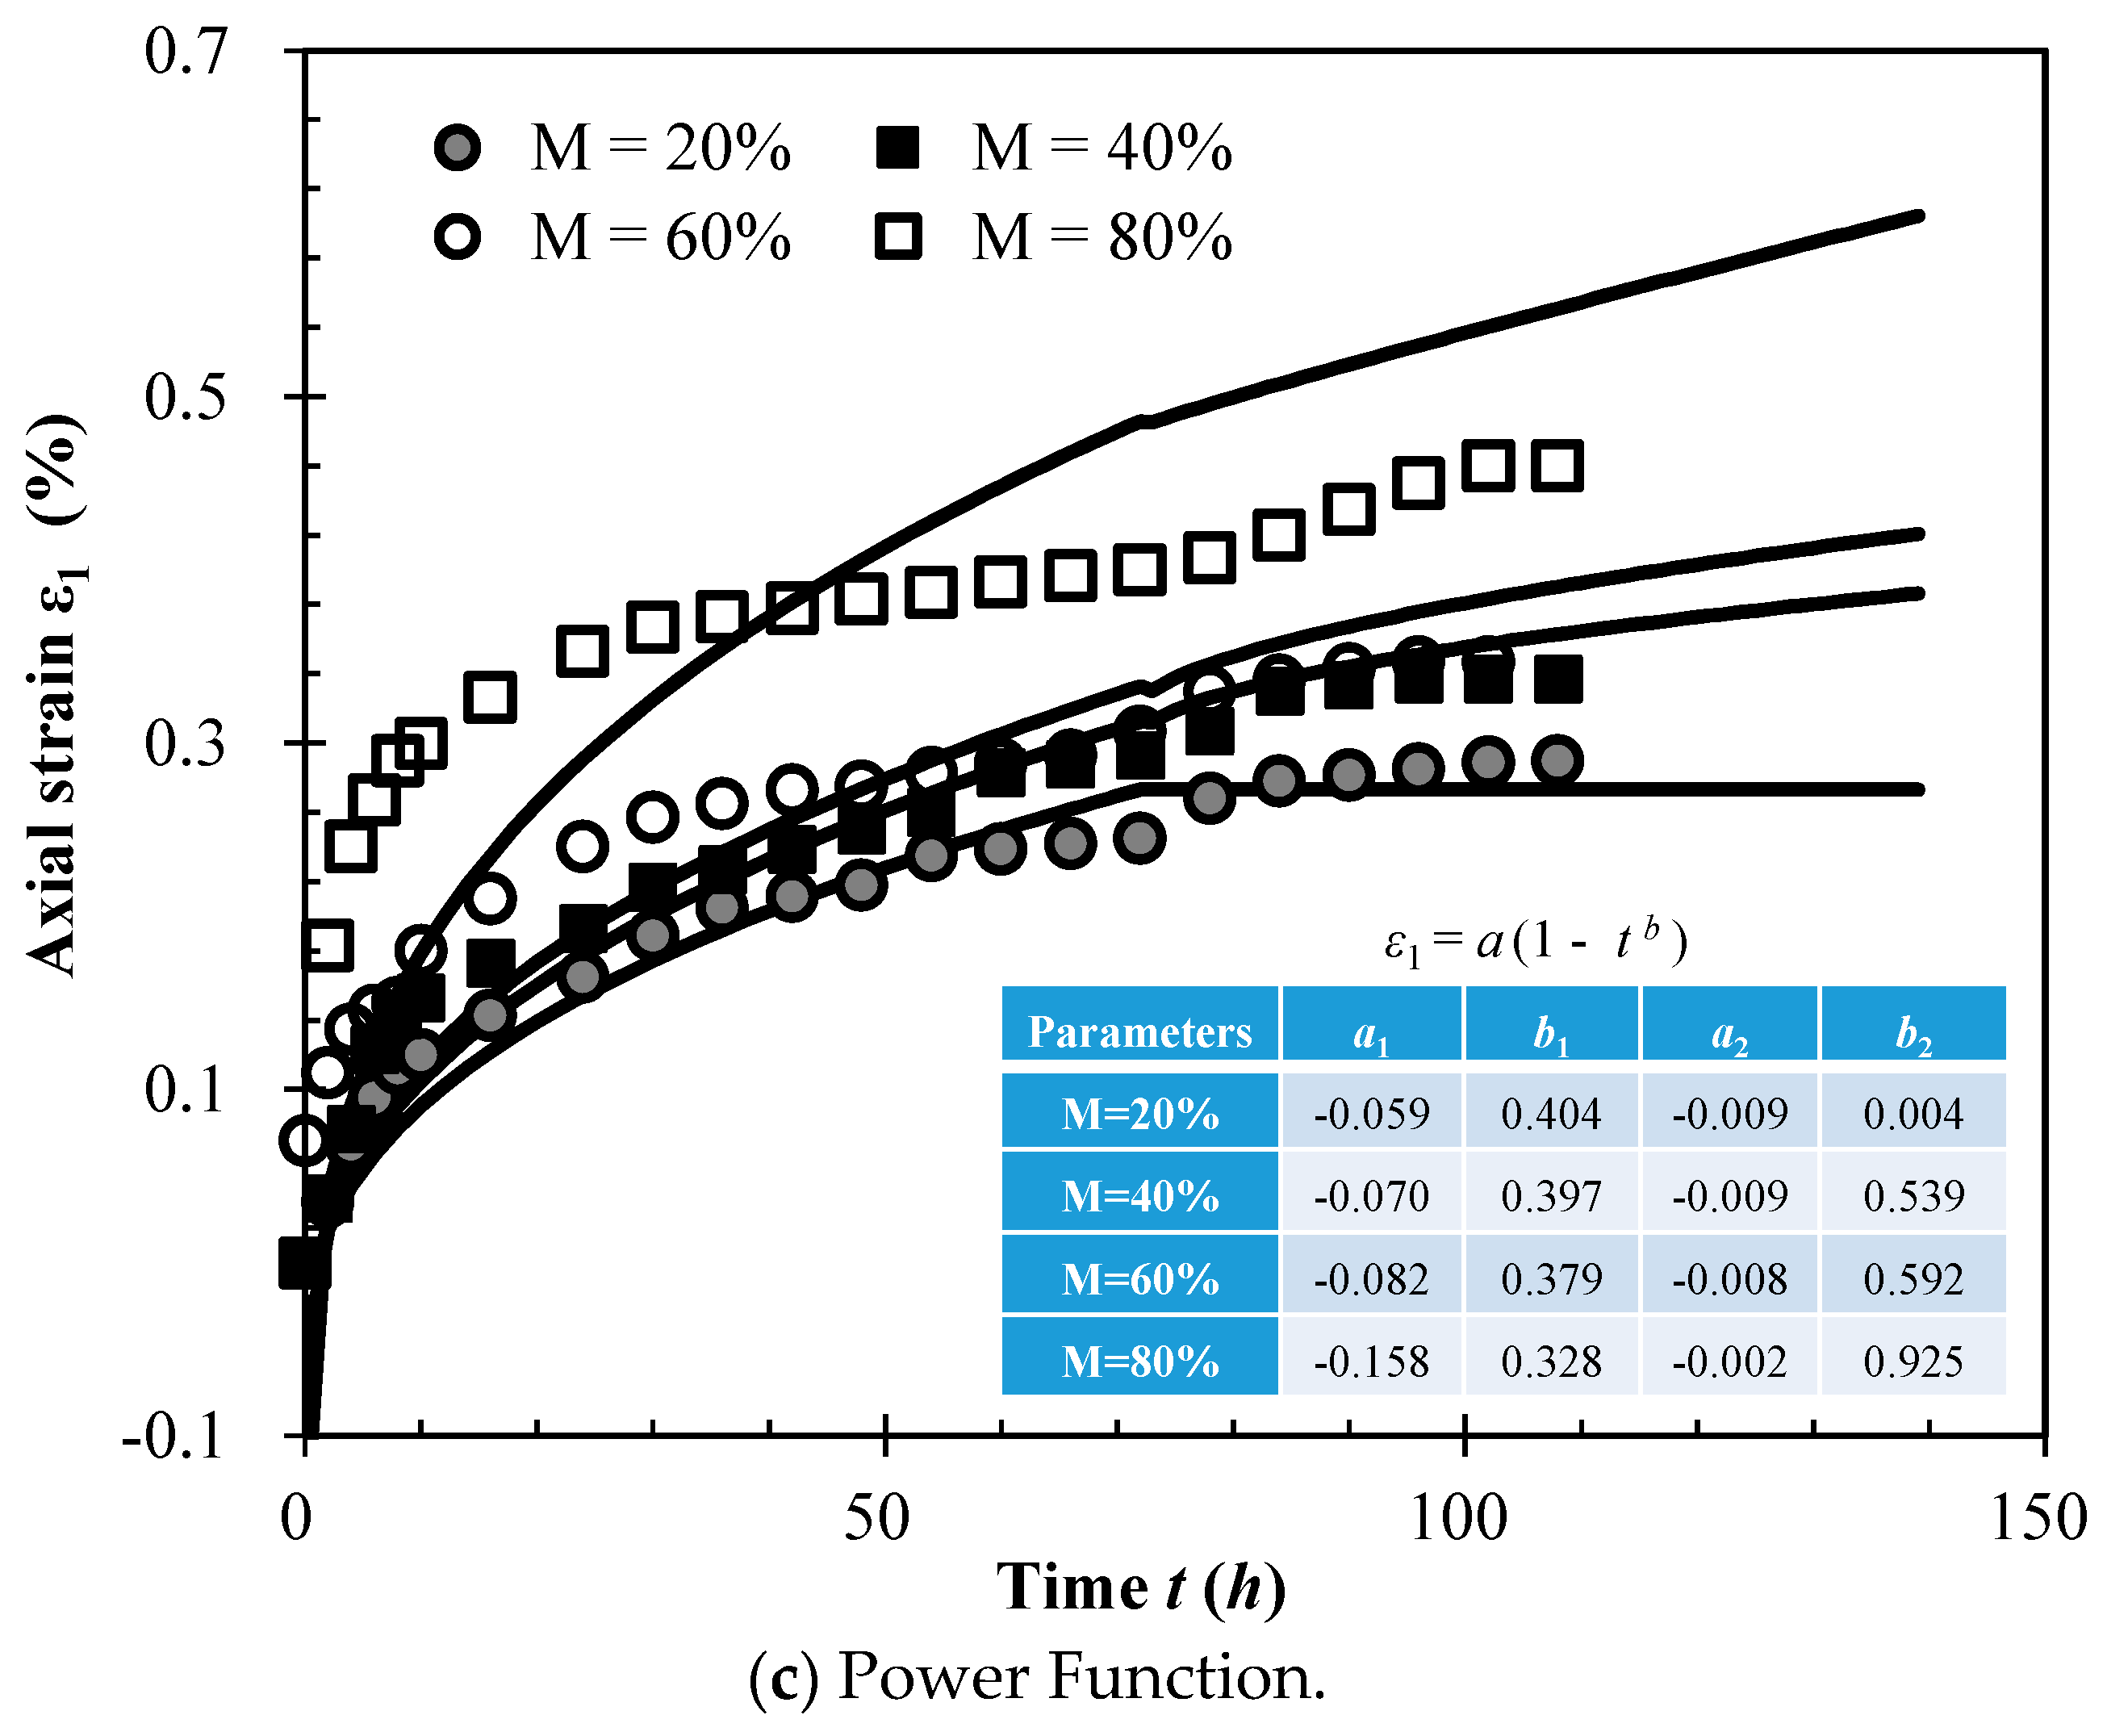
To model the segmented rheological behavior of SMPM, an appropriate function from Table 2 can be chosen by fitting each to the test data. Fitting analysis of four rheological curves (vertical stress was 1600 kPa, M values of 20%, 40%, 60% and 80%) was conducted using the segmented rheological model and the rheological model for the three types of the coarse-grained soil models listed in Table 2. The parameter values are shown in Figure 9.
The predicted values of the exponential and hyperbolic functions (Equations (1) to (3)) are shown in Figure 9a,b, plotted against the experimental data. These show that the secondary attenuation rheological process can be accurately simulated by these two functions after the attenuation rheological phase. The rheological process simulated by the power function is shown in Figure 9c. The characteristics of the segmented rheological process were not favorably reflected by the predicted curves. Therefore, the rheological process simulated by the power function model is not recommended for predicting the rheological process of SMPM.
Figure 9a shows that the predicted strain value calculated by the exponential function was larger than the experimental values in the attenuation rheological phase at a mudstone particle content of 80%. Furthermore, this curve did not conform to the characteristic of the attenuation rheology in the attenuation phase either. In the secondary attenuation rheological phase, however, the predicted value was much smaller than the experimental values. At mudstone particle contents between 20% and 60%, the predicted strain value calculated by the exponential function was much larger than the test value. Engineering designs made using this exponential function would therefore result in excessive rheology, which could lead to additional waste. Therefore, the exponential function does not appear to be suitable to calculate the rheological strain of SMPM.
Figure 9b shows that the hyperbolic rheological model fitted the test values well, and the predicted values were close to the experimental data throughout the rheological process. Therefore, the rheological process of SMPM can be calculated using the hyperbolic function. The segmented rheological model of SMPM can be expressed as:
where T is the time from the initial moment of rheology to the attenuation rheological phase. a1, b1, a2 and b2 are model parameters, c1, d1, c2, d2, m, m0 and n0 are seven fitting parameters, and these parameters can be obtained by fitting with the experimental data. There are 11 parameters for the suggested model, which can be used to calculate the rheological deformation filled with SMPM of different mudstone content. There are too many parameters for the suggested model. In further study, research on a model for the rheological deformation of SMPM within fewer parameters is very meaningful. The strength of the mudstone particles is lower than that of the sandstone particles, which suggests that they have different critical crushing stresses. The particle-crushing critical stress of the mudstone particles is lower than that of the sandstone particles. In the rheological compression tests, the deformation initially resulted from the mudstone particles being crushed, with further deformation occurring due to the crushing of sandstone particles at a later time. Mudstone particles are usually disintegrative, and mudstone particle surfaces are often covered with fractures. Therefore, the mudstone particle breakage appears to be more serious than that of the sandstone particles. Compared with other materials such as rock-fill materials and coarse-grained soil, SMPM features a unique rheological mechanism because of the mudstone particles, which are associated with various factors, including the mudstone particle content and the particle strength. The suggested rheological model was proven by the validation exercise. It is not an intuitive method to prove the accuracy of the suggested model. This model can be used to calculating the rheological deformation of a dam or foundations filled with SMPM under different mudstone content. However, it cannot be applied to real engineering works now. In future research, the finite element approach may be used to analyze the rheological behavior of SMPM. When the FEM procedures for the suggested constitutive relationships are worked out, it can be applied to the analysis of a real problem, and it could be generalized while its precision is proven.
6. Conclusions
In this study, rheological tests of a sandstone-mudstone particle mixture with different mudstone particle contents were performed, and a modified rheological deformation model for the sandstone-mudstone particle mixture was proposed. The modified model can be used to calculate the deformation in engineering structures filled with a sandstone-mudstone particle mixture. The conclusions of this study are as follows.
(1) The rheological axial strain of a sandstone-mudstone particle mixture increases with increasing vertical stress and is associated with the mudstone particle content. The higher the mudstone particle content, the larger the rheological limit strain. The rheological limit strain displays linear relationships with both the vertical pressure and the mudstone particle content. The rheological critical strain of the secondary attenuation can be calculated using the rheological attenuation factor and the rheological limit strain. The rheological attenuation factor increases with increasing vertical pressure, following a logarithmic relationship.
(2) Analysis of the rheological strain reveals that the rheological process of a sandstone-mudstone particle mixture can be divided into four phases: the linear phase, the attenuation rheological phase, the secondary attenuation rheological phase and the stable phase. Modelled rheological compression curves with different mudstone particle contents were fitted at a vertical pressure of 1600 kPa, calculated using different rheological functions; these were compared to the experimental results. The hyperbolic function model used with the proposed segmented rheological model most accurately described the four-phase attenuation rheological characteristics of a sandstone–mudstone particle mixture.
Author Contributions
Conceptualization, Z.Q. and J.W.; Methodology, Z.Q.; Software, Y.L. and Y.C.; Validation, Z.Q., J.W. and Y.C.; Formal Analysis, T.C.; Investigation, Z.Q.; Resources, J.W.; Data Curation, T.C.; Writing-Original Draft Preparation, Z.Q.; Writing-Review & Editing, Z.Q., T.C., and Y.C; Visualization, T.C.; Supervision, J.W.; Project Administration, J.W.; Funding Acquisition, J.W., Y.L., and Z.Q.
Funding
This research was funded by the National Natural Science Foundation of China under Grant No. 51479012 and Grant No. 51479014, the Chongqing Science and Technology Commission of China under Grant No. cstc2017jcyjA1642, the Technology innovation and application demonstration project in Chongqing under Grant No. cstc2018jscx-msybx0328, the Chongqing Municipal Education Commission of China under Grant No. KJ1705123, the National Postdoctoral Science Foundation of China under Grant No. 2017M622978 and the National Postdoctoral Science Foundation of Chongqing under Grant No. Xm2017093.
Conflicts of Interest
The authors declare no conflict of interest.
References
- Chongqing Geological and Mineral Resource Exploration and Development Corporation (CGMREDC). Chongqing Geological Map (Scale 1:500,000); Chongqing Yangtze River Map Printing Factory: Chongqing, China, 2002. [Google Scholar]
- Wang, J.J.; Zhang, H.P.; Deng, D.P. Effects of compaction effort on compaction behavior and particle crushing of a crushed sandstone-mudstone particle mixture. Soil Mech. Found. Eng. 2014, 51, 67–71. [Google Scholar] [CrossRef]
- Wang, J.-J.; Cheng, Y.-Z.; Zhang, H.-P.; Deng, D.-P. Effects of particle size on compaction behavior and particle crushing of crushed sandstone-mudstone particle mixture. Environ. Earth Sci. 2015, 73, 8053–8059. [Google Scholar] [CrossRef]
- Qiu, Z.F. Triaxial Deformation Behavior and Damage Model under Wet-Dry Cycling of a Sandstone-Mudstone Mixture. Ph.D. Thesis, Chongqing Jiaotong University, Chongqing, China, 2016. (In Chinese). [Google Scholar]
- Wang, J.J.; Fang, X.S.; Qiu, Z.-F. Engineering Properties of a Sandstone-Mudstone Particle Mixture; Science Press: Beijing, China, 2016. (In Chinese) [Google Scholar]
- Wang, J.J.; Qiu, Z.F.; Deng, W.J.; Zhang, H.P. Effects of mudstone particle content on shear strength of a crushed sandstone-mudstone particle mixture. Mar. Georesour. Geotechnol. 2016, 34, 395–402. [Google Scholar] [CrossRef]
- Qiu, Z.F.; Wang, J.J.; Huang, S.Y.; Bai, J.P. Wetting-induced axial and volumetric strains of a sandstone mudstone particle mixture. Mar. Georesour. Geotechnol. 2018. [Google Scholar] [CrossRef]
- Wang, J.J.; Qiu, Z.F.; Bai, J.P.; Yu, C.; Liu, M.W. Deformation of a sandstone–mudstone particle mixture induced by periodic saturation. Mar. Georesour. Geotechnol. 2018, 36, 494–503. [Google Scholar] [CrossRef]
- Jiang, J.S.; Cheng, Z.L.; Zuo, Y.Z.; Ding, H.S. CT triaxial rheological test on coarse-grained soils. Rock Soil Mech. 2014, 35, 2507–2514. [Google Scholar]
- Indraratna, B.; Thakur, P.K.; Vinod, J.S.; Salim, W. Semi empirical cyclic densification model for ballast incorporating particle breakage. Int. J. Geomech. 2012, 12, 260–271. [Google Scholar] [CrossRef]
- Indraratna, B.; Ngo, N.; Rujikiatkamjorn, C.; Vinod, J.S. Behavior of fresh and fouled railway ballast subjected to direct shear testing: Discrete element simulation. Int. J. Geomech. 2014, 14, 34–44. [Google Scholar] [CrossRef]
- Kong, X.J.; Zhou, Y.; Xu, B.; Zou, D.G. Analysis on Seismic Failure Mechanism of Zipingpu Dam and Several Reflections of Aseismic Design for High Rock-Fill Dam; The Workshop on Biennial International Conference on Engineering; ASCE: Reston, VA, USA, 2010; pp. 3177–3189. [Google Scholar]
- Xiao, Y.; Sun, Y.F.; Hanif, K.F. A particle-breakage critical state model for rockfill material. Sci. China Technol. Sci. 2015, 58, 1125–1136. [Google Scholar] [CrossRef] [Green Version]
- Zhang, B.Y.; Sun, G.L.; Zhang, Z.L. Degrading deformation of rockfill materials and its constitutive model. Chin. J. Geotech. Eng. 2010, 32, 98–103. [Google Scholar]
- Jia, Y.; Xu, B.; Chi, S.; Xiang, B.; Zhou, Y.; Jia, Y. Research on the particle breakage of rockfill materials during triaxial tests. Int. J. Geomech. 2017, 17, 04017085. [Google Scholar] [CrossRef]
- Carrier, B.; Vandamme, M.; Pellenq RJ, M.; Van Damme, H. Creep of clay: Numerical results at the scale of a layer and experimental results at the scale of thin self-standing films. In Proceedings of the 10th International Conference on Mechanics and Physics of Creep, Shrinkage, and Durability of Concrete and Concrete Structures, Vienna, Austria, 21–23 September 2015; pp. 531–536. [Google Scholar]
- Wang, Y.; Yin, Z.Z. Rheology model of rockfill used in the rheology analysis of concrete face rockfill dam. Rock Soil Mech. 2000, 21, 227–230. [Google Scholar]
- Chen, X.B.; Zhang, J.S.; Feng, Z.P. Experimental study on rheological engineering properties of coarsely granular red sandstone soil. Chin. J. Rock Mech. Eng. 2007, 26, 601–607. [Google Scholar]
- Wang, L.Z.; Yin, Z.Y. Stress dilatancy of natural soft clay under an undrained creep condition. Int. J. Geomech. 2014, 15, A4014002. [Google Scholar] [CrossRef]
- Cheng, Z.L.; Ding, H.S. Creep test for rockfill. Chin. J. Geotech. Eng. 2004, 26, 473–476. [Google Scholar]
- Zhang, B.Y.; Chen, T.; Peng, C.; Qian, X.X.; Jie, Y.; Zhang, B. Experimental study on loading-creep coupling effect in rockfill material. Int. J. Geomech. 2017, 17, 04017059. [Google Scholar] [CrossRef]
- Yang, C.; Wen, C.P. Study of nonlinear rheology of improved expansive soil based on model theory and genetic creep theory. Rock Soil Mech. 2016, S2, 75–82. [Google Scholar]
- Zhang, B.Y.; Zhang, J.H.; Sun, G.L. Deformation and shear strength of rockfill materials composed of soft siltstones subjected to stress, cyclical drying/wetting and temperature variations. Eng. Geol. 2015, 190, 87–97. [Google Scholar] [CrossRef]
- Trade Standard of P. R. China SL237-015. Standard method for one-dimensional consolidation properties of soils. In Specification of Soil Test; The Ministry of Water Resources of P.R. China: Beijing, China, 1999. (In Chinese) [Google Scholar]
- Wang, Z.J.; Liu, S.H.; Wang, Y.S.; Kong, W.Y. Analysis on microstructure of granular materials under different stress paths. J. Hydraul. Eng. 2013, 44, 772–778. [Google Scholar]
- Shen, Z.J.; Zhao, K.Z. Back analysis of creep deformation of rockfill dams. J. Hydraul. Eng. 1988, 6, 1–6. [Google Scholar]
- Liang, J.; Liu, H.L. Creep test for rockfill of CFRD. Chin. J. Geotech. Eng. 2004, 24, 257–259. [Google Scholar]
- Feda, J. Creep of Soils and Related Phenomena; Elsevier: Amsterdam, The Netherlands, 1992. [Google Scholar]
- Cao, G.X. Study on Post-Construction Settlement of High Fill Foundation in Mountainous Airport. Ph.D. Thesis, Tsinghua University, Beijing, China, 2011. (In Chinese). [Google Scholar]
Figure 1.
Grain size distribution curves of tested materials.

Figure 2.
Test instrument.

Figure 3.
Compressive rheological curves of sandstone and mudstone particle mixture (SMPM) samples; M = mudstone particle content.
Figure 3.
Compressive rheological curves of sandstone and mudstone particle mixture (SMPM) samples; M = mudstone particle content.


Figure 4.
Four-phase compressive rheological curve.

Figure 5.
The relationship between rheological limit strain and vertical stress.

Figure 6.
The relationship between parameter n0 and mudstone particle content M.

Figure 7.
The relationship between rheological attenuation factor and vertical stress.

Figure 8.
The relationship between fitting parameters and mudstone particle content.

Figure 9.
Various predicted values of the three rheological models, compared to experimental data.


Table 1.
Content of particles of various particle sizes of the sample.
| Particle size (mm) | 5–2 | 2–1 | 1–0.5 | 0.5–0.25 | 0.25–0.075 | <0.075 |
| Content (%) | 27 | 18 | 15 | 11 | 14 | 15 |
Table 2.
Fitting parameters.
| Mudstone Particles Content (%) | m | n | R2 |
|---|---|---|---|
| 20 | 0.0163 | 0.0164 | 0.96 |
| 40 | 0.0165 | 0.0571 | 0.96 |
| 60 | 0.0168 | 0.0798 | 0.96 |
| 80 | 0.0172 | 0.1711 | 0.99 |
© 2018 by the authors. Licensee MDPI, Basel, Switzerland. This article is an open access article distributed under the terms and conditions of the Creative Commons Attribution (CC BY) license (http://creativecommons.org/licenses/by/4.0/).
Share and Cite
MDPI and ACS Style
Qiu, Z.; Cao, T.; Li, Y.; Wang, J.; Chen, Y. Rheological Behavior and Modeling of a Crushed Sandstone-Mudstone Particle Mixture. Processes 2018, 6, 192. https://doi.org/10.3390/pr6100192
AMA Style
Qiu Z, Cao T, Li Y, Wang J, Chen Y. Rheological Behavior and Modeling of a Crushed Sandstone-Mudstone Particle Mixture. Processes. 2018; 6(10):192. https://doi.org/10.3390/pr6100192
Chicago/Turabian StyleQiu, Zhenfeng, Ting Cao, Yongsuo Li, Junjie Wang, and Yulong Chen. 2018. "Rheological Behavior and Modeling of a Crushed Sandstone-Mudstone Particle Mixture" Processes 6, no. 10: 192. https://doi.org/10.3390/pr6100192
Note that from the first issue of 2016, this journal uses article numbers instead of page numbers. See further details here.