Article

How to Generate Economic and Sustainability Reports from Big Data? Qualifications of Process Industry

Brahea Centre, University of Turku, 20014 Turku, Finland
*
Author to whom correspondence should be addressed.
Processes 2017, 5(4), 64; https://doi.org/10.3390/pr5040064
Submission received: 2 October 2017 / Revised: 23 October 2017 / Accepted: 24 October 2017 / Published: 1 November 2017
(This article belongs to the Collection Process Data Analytics)

Abstract

:
Big Data may introduce new opportunities, and for this reason it has become a mantra among most industries. This paper focuses on examining how to develop cost and sustainable reporting by utilizing Big Data that covers economic values, production volumes, and emission information. We assume strongly that this use supports cleaner production, while at the same time offers more information for revenue and profitability development. We argue that Big Data brings company-wide business benefits if data queries and interfaces are built to be interactive, intuitive, and user-friendly. The amount of information related to operations, costs, emissions, and the supply chain would increase enormously if Big Data was used in various manufacturing industries. It is essential to expose the relevant correlations between different attributes and data fields. Proper algorithm design and programming are key to making the most of Big Data. This paper introduces ideas on how to refine raw data into valuable information, which can serve many types of end users, decision makers, and even external auditors. Concrete examples are given through an industrial paper mill case, which covers environmental aspects, cost-efficiency management, and process design.

1. Introduction

The purpose of this paper is to present and discuss the building of an integrated system to cover cost management, emission, and economic reporting. The idea is to find a solution to support sustainable production that is fully integrated with Big Data storage. The solutions are usually industry-specific, and in this case process industry-centric. In the market, there is a huge amount of installed database solutions in operations, and their costs allocation theory and origins might be totally different. Often, the solutions are taken from a different type of industry, such as the assembly industry, and then implemented to the process industry (see e.g., [1,2,3]). This eventually causes most of final management reports to be made manually by using a spreadsheet program such as Excel. The reason for this is the lack of proper algorithms in the original system, because, for example, process industry datatypes (“recipe”) and the philosophy of allocations [4] are not at all relevant to the assembly industry, where components are put together. Large process industry sites are producing an extensive amount of non-heterogeneous data. These large, mill-wide systems are running 24/7. All of the data is collected and stored for future use and analysis, but a great deal of the information is not revealed. Since the beginning of the course of database evolution, a great number of available tools and technologies have been developed to utilize Big Data. Technologies and tools have been developed to support decision making for each phase of processing and Big Data application. Currently, studies focusing on the decision making and coordination problems of supply chain investment are relatively small in the Big Data environment. Weill and Woerner [5] and Loebbecke and Picot [6], as qualitative researches, argue that utilizing the advantages of Big Data could improve production processes and efficiency, and lower production costs. Big Data and integrated applications could provide advantages to supply chain and business management, such as improved clarity of the value chain, accurate data on operating performance, and support to decision making through a real-time perspective [7]. Glock and Taebok [8] argue that considering carbon emissions when coordinating a supply chain may lead to changes in freight routing.
The authors bring forward some essential steps on how to design and implement a highly advanced and fully integrated business critical mill-wide system based on Big Data. We will utilize an example paper mill as an industry-specific approach to present concrete examples of a development process from theory to actual solution applied to a mill. The system presented here covers the following features: (1) real-time measurement; (2) cost allocation; (3) emission control; and (4) the cube-type of reporting examples for end users. The main features are presented through reports and user interfaces. We present the steps that system developers and mill end users should take into account when building a large enterprise system covering the features listed above. The structure of the paper is as follows: In Section 2, we discuss the background of Big Data and cost management from the viewpoint of the manufacturing industry and mill-wide supply chain management. In Section 3 and Section 4, we present thorough examples of how the data is collected from different sources, including online measurements, which create the Big Data of the manufacturing unit. Section 5 contains descriptions and several examples of what the Big Data and end user applications should be like visually, and what kinds of visual reports can be created to feed the decision makers’ appetite for knowledge. In Section 6 and Section 7 respectively, we give a summary and present the findings and conclusions of the paper. Ideas for further research are presented in Section 8.

2. Background

2.1. Big Data

Understanding Big Data, real production processes, and how decision making is done offer nearly unlimited possibilities to develop businesses and organizations to simultaneously be more efficient and sustainable. Gartner [9] defines Big Data as high-volume, high-velocity, and/or high-variety information assets that demand cost-effective, innovative forms of information processing and enable enhanced insight, decision making, and process automation. Therefore, using innovative query algorithms for Big Data creates new opportunities for analysis. Anderson [10] remind that simultaneously with the development of Big Data, the development of cloud-based virtual storage has reduced the storage cost of Big Data. Lower costs will speed up the evolution of Big Data development. Zhong et al. [11] note that the manufacturing sectors such as the social internet network are facing a data tsunami; that is, data volumes are increasing immensely every second. Big Data amounts into the range of exabytes, and Big Data is not only about the data, but also about a complete conceptual and technological stack including raw and processed data, storage, ways of managing data, processing, and analytics. Wang et al. [12] add that decisions need methodology, technology, and tools (software) to identify the best decision to make based on the assumption that the decision maker is fully rational or bounded rational. For judgment, Big Data offers valuable information, but not before this “raw data” is correctly queried and filtered, and the relevant relations are identified. Several techniques will be utilized, such as process measuring, time based data transfer tools, data mining, optimization methods, statistics, and visualization [12,13]. Moreover, other challenges related to Big Data emerge, such as the 4 V or 5 V, where the Volume is too big, Variety is too many, Velocity is too fast, Veracity is too uncertain, and Value is difficult to evaluate (see e.g., [14]). Chen et al. [15] added value to stress that correctly evaluating value in Service and Manufacturing Supply Chain Management (SM–SCM) is challenging. The correctness of decisions based on Big Data is difficult to argue, because how well micro and macro economic factors reflect the success of business varies.
Big Data contributes to the idea of continuous improvement, but when data volumes increase, data tends to become more diversified, and this creates more variation. This brings changes to analysis, and reveals hidden and previously unknown perspectives that can improve processes [16,17]. Big Data can open new gateways for increasing knowledge. Chen et al. [15] argue that the developments of Big Data will enrich current decision sciences. The value of Big Data will be only generated by relevant algorithms, which produce analytical results of stored raw data. In large-scale industrial manufacturing processes, analytics improve remarkably when Big Data is opened and linkages between operations are refined. Access to more detailed information may offer more options for decision making, such as whether to lower harmful emissions in the manufacturing stages by either modifying the manufacturing process or selecting a new mix of raw materials and chemicals [18,19]. Figure 1 illustrates an integrated Big Data system in the process industry. The image reveals the main data sources, which are needed to build Big Data. The process requires various integration managers and relevant data queries, which are derived from the needs of the end users (also [20]). As a result, this process should offer new knowledge for all of the mill personnel, from top to bottom, and help to run the mill more efficiently and sustainably. The primary idea is to seamlessly connect production, sales, and logistics functions, as well as local emission measuring and external emission databases. Koetsier [21] believes that more processes will be connected, which supports timely decision making; this information is also stored and visualized, which offers more accurate predictions for the future. The goal is to reveal new, unknown, and relevant real correlations from data sources, and this is one of the main philosophies of Big Data. Unveiling new information from Big Data can help to lower the uncertainty in decision making and also in investment decisions. The data would support management to steer a company to be more forecast-oriented, cost-efficient, profitable, and sustainable all at the same time. These features separate Big Data-derived reporting from the traditional bookkeeping-based systems. Big Data links environmental and economic factors, and reveals the economic performance of an investment. All of the calculations should be based on real data from the production line in question. The local and external databases for environmental-loading factors are integrated, as well as regularly and automatically updated.

2.2. Refining and Filtering of Big Data

The term Big Data was probably first introduced by Larson [22] in an article with the following two sentences: “The keepers of Big Data say they do it for the consumer’s benefit. But data have a way of being used for purposes other than originally intended.” The European Union [23] reports that large amounts of data are being produced very rapidly by a high number of diverse sources. Big Data is complex and often unstructured data, which needs new ways and methods to be utilized, managed, and visualized [20]. In this paper, Big Data is understood basically as a non-heterogeneous data storage, which must be, filtered, refined and then utilized in different ways from the perspective of the process industry and its reporting needs, which include production reports as well as economic, sustainability, and emission-controlling reports. These last three areas are handled at modern sites with unique and separated large-scale cost and profit management solutions that create filtered clean data using Big Data as the source. At the site, all of the source data is updated continuously at predefined intervals depending on the data types and data sources. All of this collected data creates Big Data, in which the different databases are located in their own storages.
Zhong et al. [11] have listed steps to utilize and roll out Big Data-based solutions in the industry. They have classified the challenges, opportunities, and future perspectives in SM–SCM with the following terms: (1) data collection methods; (2) data transmission; (3) data storage; (4) processing technologies for Big Data; (5) Big Data-enabled decision-making models; and (6) Big Data interpretation and applications. The authors of this paper add two essential items to the list: the first is the testing phase, which takes place before the system in adapted, and the second is feedback to real manufacturing processes.
Later referees that decision makers ought to continuously steer the real process with improved information and knowledge. How this loop should be completed (see [24]) will be explained in more detail later, in Section 3, where some example interfaces and applications are presented in an actual mill-wide system. Gartner [25] comments appear in both the “Top 10 Strategic Technology Trends for 2013”and the “Top 10 Critical Tech Trends in following 5 years”. Gartner [9] has argued that besides Big Data, there is a need for big questions and big answers. The reality is that utilizing Big Data requires visual and intuitive tools, which must be developed when building industry-specific applications. At best, they take into account the special needs of the industry in question, including the various reporting needs. Big Data can bring reliable and valuable information for end users and decision makers only through appropriate and relevant usage. Usage of Big Data calls for complicated and new algorithms, because of the involved complexity [26]. Ala-Harja and Helo [27]; Zhu and Sarkis [28]; and Vachon and Klassen [29] argue that environmental issues in the supply chain management should receive more attention, because there is no real conflict between sustainability and economic growth.

3. Research Topics

3.1. Cost Management

Cost management is discussed extensively in this paper, and the following areas of calculation and reporting are covered: production information, sales and logistics, budgeting and rolling forecast, simulations, cost and profit reporting, and deviation reporting. In Figure 1, we present the main data sources to build a cost management application. The aim of supply chain management is to reduce uncertainties such as the forecast horizon, input data, administrative and decision processes, and inherent uncertainties (Van der Vorst et al. [30]). Wald et al. [31] argue, based on a sample of 185 European companies, that cost management is a central responsibility for corporate management. The need for accurate cost reporting systems has increased due to tough competition in a global economy. Wald et al. [32] found that the fields of “tools” and “information” have the highest impact on cost efficiency in companies, and that in many companies, there is still much room for improvement. Additionally, Wald et al. [32] claim that a hidden potential for cost reduction lies in the overhead costs. The savings may be achieved mainly by more accurate fixed-cost allocations to different cost centers and actions. Furthermore, Williamson [33] regards that a new business model for cost reduction is needed, which he calls the cost innovation business model, to get more from less.
Many earlier cost management scientists and practitioners argued that the activity-based costing (ABC) method has several problems and challenges related to systems, and discussed how to get them working in a complicated actual mill environment (see e.g., [34,35]). Earlier, there were also technical challenges, as computers and networks were in many cases slow, and programming languages were not truly productive enough to build large mill-wide database systems. Kaplan and Anderson [36] (p. 5) explain that the ABC system and ABC software were hard to build, and the delivered system calculated costs for the company’s 150 activities, 10,000 orders, and 45,000 line items for several days. The authors suspect that the ABC system probably was still much faster than traditional manual calculation and reporting, and also had a higher allocation accuracy. We can also associate target costing with a specific version of ABC called feature costing [37]. Anderson [10] argues that tracking environmental costs involves a linkage between environmental and organizational goals, which together improve financial performance and sustainable production.
Properly implemented and designed cost management applications have brought a lot of benefits to companies, including: better customer analysis, improved efficiency, better logistics performance, and more accurate product costs. All of these offer possibilities to achieve higher profitability (see e.g., [38,39,40,41]). Johnson and Kaplan were among the first writers of key publications in this field, which included: Relevance Lost (1987) and The Rise and Fall of Management Accounting (1987). The authors begin the latter book with the still relevant critical words: “Today’s management accounting information, driven by the procedures and cycle of the organization’s financial reporting system, is too late, too aggregated, and too distorted to be relevant for a manager’s planning and control decisions.” According to Fogelholm [2], Stafford Beer has identified the same basic issue as Kaplan: “Society, whether social, industrial, or economic, still reckons it can solve the problem of providing cheap, low-variety control of expensive, high-variety systems” [1] (p. 313). Robin Cooper was the third pioneer in developing ABC and cost management systems [42]. In his paper, Cooper created a new cost allocation taxonomy that divides the total resources hierarchically by different activities, as follows:
  • Unit-level activities—performed each time a unit is produced
  • Batch-level activities—performed each time the production of a batch of goods is initiated
  • Product-level activities—performed as needed to support the production or marketing of each type of product
  • Facility-level activities—which simply sustain a facility’s general manufacturing processes
The previous activities show that when building process industry-based allocation and calculation models, developers must first understand the differences between these activities. All of these activities affect the calculation rules differently. The calculation algorithms in these activities should be defined and separated from each other, because the economic impacts are different to cost and consumption.
Since the 1980s and 1990s, through to 2016, the cost model development for various industries has improved significantly for many reasons. These include continuous academic research, the development of Information and Communication Technologies (ICT) culture, faster Central Processing Units (CPUs), larger storages, faster internet connections, cloud storage services, better programming languages, and more extensive cost management experience among designers in different industry environments. University–industry cooperation has created mutual knowledge for problem solving and produced better experts and analysts, which have supported the whole cost management cluster [38]. Cost management has improved as a process, and action-based cost allocations are seen as essential tools for success [43].

3.2. Emission and Sustainability Measuring and Calculations

Chopra and Sodhi [44] argue that one challenge of managing supply chain operations is interconnectivity: mitigating some risks may increase others. The mill operators may change a chemical, which creates problems in another part of the process. In a complicated process industry such as the paper industry, replacing one harmful chemical may disrupt the manufacturing process and increase breaks, waste, and emissions, for example. To solve these types of challenges, mill-wide Big Data may offer new opportunities to build a profitable and optimized low-emission manufacturing, supply, and delivery chain. Wu et al. [45] recommend transforming Big Data into a manageable scale to help build a sustainable production. It is necessary to simultaneously use various types of data, and realize the available resources, and how they could impact on the sustainability of a company [46]. Emission-free production certainly improves the reputation of a company compared with other ones if effects on global warming and environmental impacts are mitigated [15,47,48,49]. Rahdari, Anvary and Rostamy [49] also explain how many companies are building sustainability indicators that address the level at which the companies are operating, and help promote progress. The emissions and sustainability of the manufacturing site naturally depend on what type of production process the manufacturing unit is utilizing, what types of chemicals are used in the production process, how energy is produced, and how harmful emissions are reduced when the site is running. Several researchers argue that environmental management systems (EMS) may improve financial performance through a better corporate image, increased sales due to green products, and lower internal costs through environmentally-friendly modern technologies (see [50,51,52]). Emission regulations may also create uncertainty in a real business environment [53,54]. Feng et al. [52] suggest that market factors need to be taken into consideration when examining the relationship between financial performance and the EMS. Consumers are aware and increasingly expecting that products and manufacturing should be as green and emission-free as possible. The paper industry must pay more attention to knowledge on how much global warming gases and other emissions its sites are contributing to soil, air and water [55]. Henri et al. [56] address that the environmental costs aimed at managing, controlling, and optimizing costs for a given environmental strategy. These environmental costs have an impact on the product design, such as raw material composition and operational product design. Emission-free manufacturing is a goal for most industries. There is a need for impartial and accurate analysis methods, which could support the sustainability projects on how to develop efficient and low-emission process industry sites globally. Allenby [57] and Graedel and Allenby [58] argue that when the goal is ecologically sustainable manufacturing, the following areas must be addressed and probably redesigned: product making and process operations, the usage of substitutive new raw materials, and emission-free manufacturing [56]. After studying 319 companies, Henri et al. [56] discovered a weak linkage between the tracking of environmental costs and financial performance in the context of strategic costs management. Parker [59] argue that environmental costs represent a large share of a company’s operating and manufacturing costs. The tracking of environmental costs requires high technological know-how and resources to reliably reveal environmental impacts [60].
Globally, the heavy process industry is considering how to fulfill low or zero-level emission expectations and international agreements. These urgent global requirements force measuring and emission removal methods to be developed to a new level. In many large Asian cities, emissions in PPM can be more than 8–10 times higher than World Health Organization (WHO) recommended levels [61]. This may produce health problems for millions of people in the coming decades.
Accordingly, the shipping industry is experiencing a change concerning all kinds of emissions such as Sulphur Oxidizes (SOX), Nitrogen Oxidizes (NOX), black carbon, ballast water, and wastewater treatment. To secure these International Maritime Organization (IMO) inherited statements (SOX), measuring methods are in full operation in the Baltic Sea area, due to follow-up SOX legislation. In the Baltic Sea, sulfur emissions were lowered more than 70 percent, and other small harmful particles by 50 percent during the monitored time frame. Correspondingly, the mining industry is a large producer of different types of emissions. At the same time, mines are still using new but poorly tested methods (from an environmental perspective) to get valuable minerals out of ore. Even though much has been done, the development of sustainable functions is a slow process, and more vigorous action may be needed in the future. Creating Big Data from manufacturing and sales elements, and combining this with emission-related and environmental knowledge, would help us find emission-free manufacturing solutions (Figure 2). Anticipatory sustainability simulations in the product development phase must be based on real data obtained from the production line in question. True linking between environmental and economic factors should be attained through recipes and specific raw material items. De Villiers [62] argue that there are advantages in integrating sustainability reporting with management control systems, and these advantages of integration ought to include better operationalization and the internal communication of sustainability ideals.
All raw materials have a combined environmental and economic impact. Product-related environmental data must be allocated to single products/customer orders to support the customers’ understanding of the production and products that they are purchasing. There are continuous changes in production machines, methods, and raw materials, and therefore also continuous changes in economic impacts and environmental loading. Stacchezzini et al. [63] come to a rather pessimistic evidence-based conclusion about the capabilities of the sustainability reporting process, and they promote the integrative management of corporate sustainability. Environmental information is usually processed ad hoc or annually due to a lack of interest or information tools. Environmental issues are not standalone issues in a company; rather, they are relevant to daily operations and investments. New ways of combining different data flows (operational, financial, and environmental) can increase environmental economic efficiency. Evidently, there is a global need for this within most of the heavy and polluting industries.

4. Practical Examples from the Process Industry

4.1. Special Qualifications of Process Industry Costing Models

In Section 2, we introduced a list with cost allocation taxonomy. The taxonomy was mainly based on the original research papers of Beer, Kaplan, and especially Cooper. Deeply inspired by the ideas and theories of previous researchers, Fogelholm and Hämäläinen [4] developed a costing model for the process industry. They claim that the previously created taxonomy was very much neglected in existing cost models within the process industry, particularly in paper mills. Commonly used costing models are based on traditional ideas of bookkeeping. The level of production line and product costing accuracy is by no means sufficient in these traditional models (see e.g., [1,2,38]). The main reason for this is that the calculations in traditional reporting systems are usually based on the average values of production and consumption. The traditional systems do not take into account, for example, how different paper grades and their production paths are behaving in different paper machines, and complicated converting units during the manufacturing process. The average values easily mislead reporting on all levels, but especially from the perspective of costs, consumption, profitability, and sustainability. This is likely to result in flawed decisions, such as the wrong product pricing, fuzzy knowledge of customer profitability, large investments in wrong places, and marketing campaigns targeted to irrelevant customer segments. Fogelholm [2] and later Hämäläinen [38] argue that cost-management solutions in process industries generally (here we use the example from the paper industry) should take into account most of the following universal allocation rules:
(1)
The cost allocations should consider the behavior of processes and materials, and how various products are running through a paper machine line.
(2)
So-called fixed costs should be allocated by production throughput, or production tonnes.
(3)
The batch costs, which are often considered as other costs, should be allocated per paper tonne, because they normally cannot be measured in any way. In a mill, there are factors, which cannot be measured by grades.
(4)
Paper machine costs (or any other machine costs concerning the main process, where a machine is the bottleneck) are the most important ones to consider, because the main production unit is always a bottleneck, and also the most expensive unit on a site. Other ones include raw material problems, logistics challenges, and warehousing and transporting costs from paper mills to customers.
(5)
Waste and recycling should be taken into account to make cost calculations more process-inherited. There can be big differences between paper grades in a paper mill in regard to waste and recycling.
(6)
There are big requirements for calculating anticipated cost functions in paper production based on corresponding resource consumption. This necessitates that all of the costs and income is estimated or anticipated as accurately as possible beforehand, and that this is done along with continuously updated customer orders, product prices, raw materials, and production data.
(7)
The cost model cannot be based on linearity, because the cost and material behavior can be distorted. Cost functions in the paper industry must be nonlinear. Variety should always be considered explicit when making cost calculations for a paper machine, and calculations are normally based on paper machine lines. The machine lines must be integrated with the cost management system so that users are able to receive the results on the mill level. Resolving this topic can offer a fundamental remedy for the Big Data-inherited industrial solution.

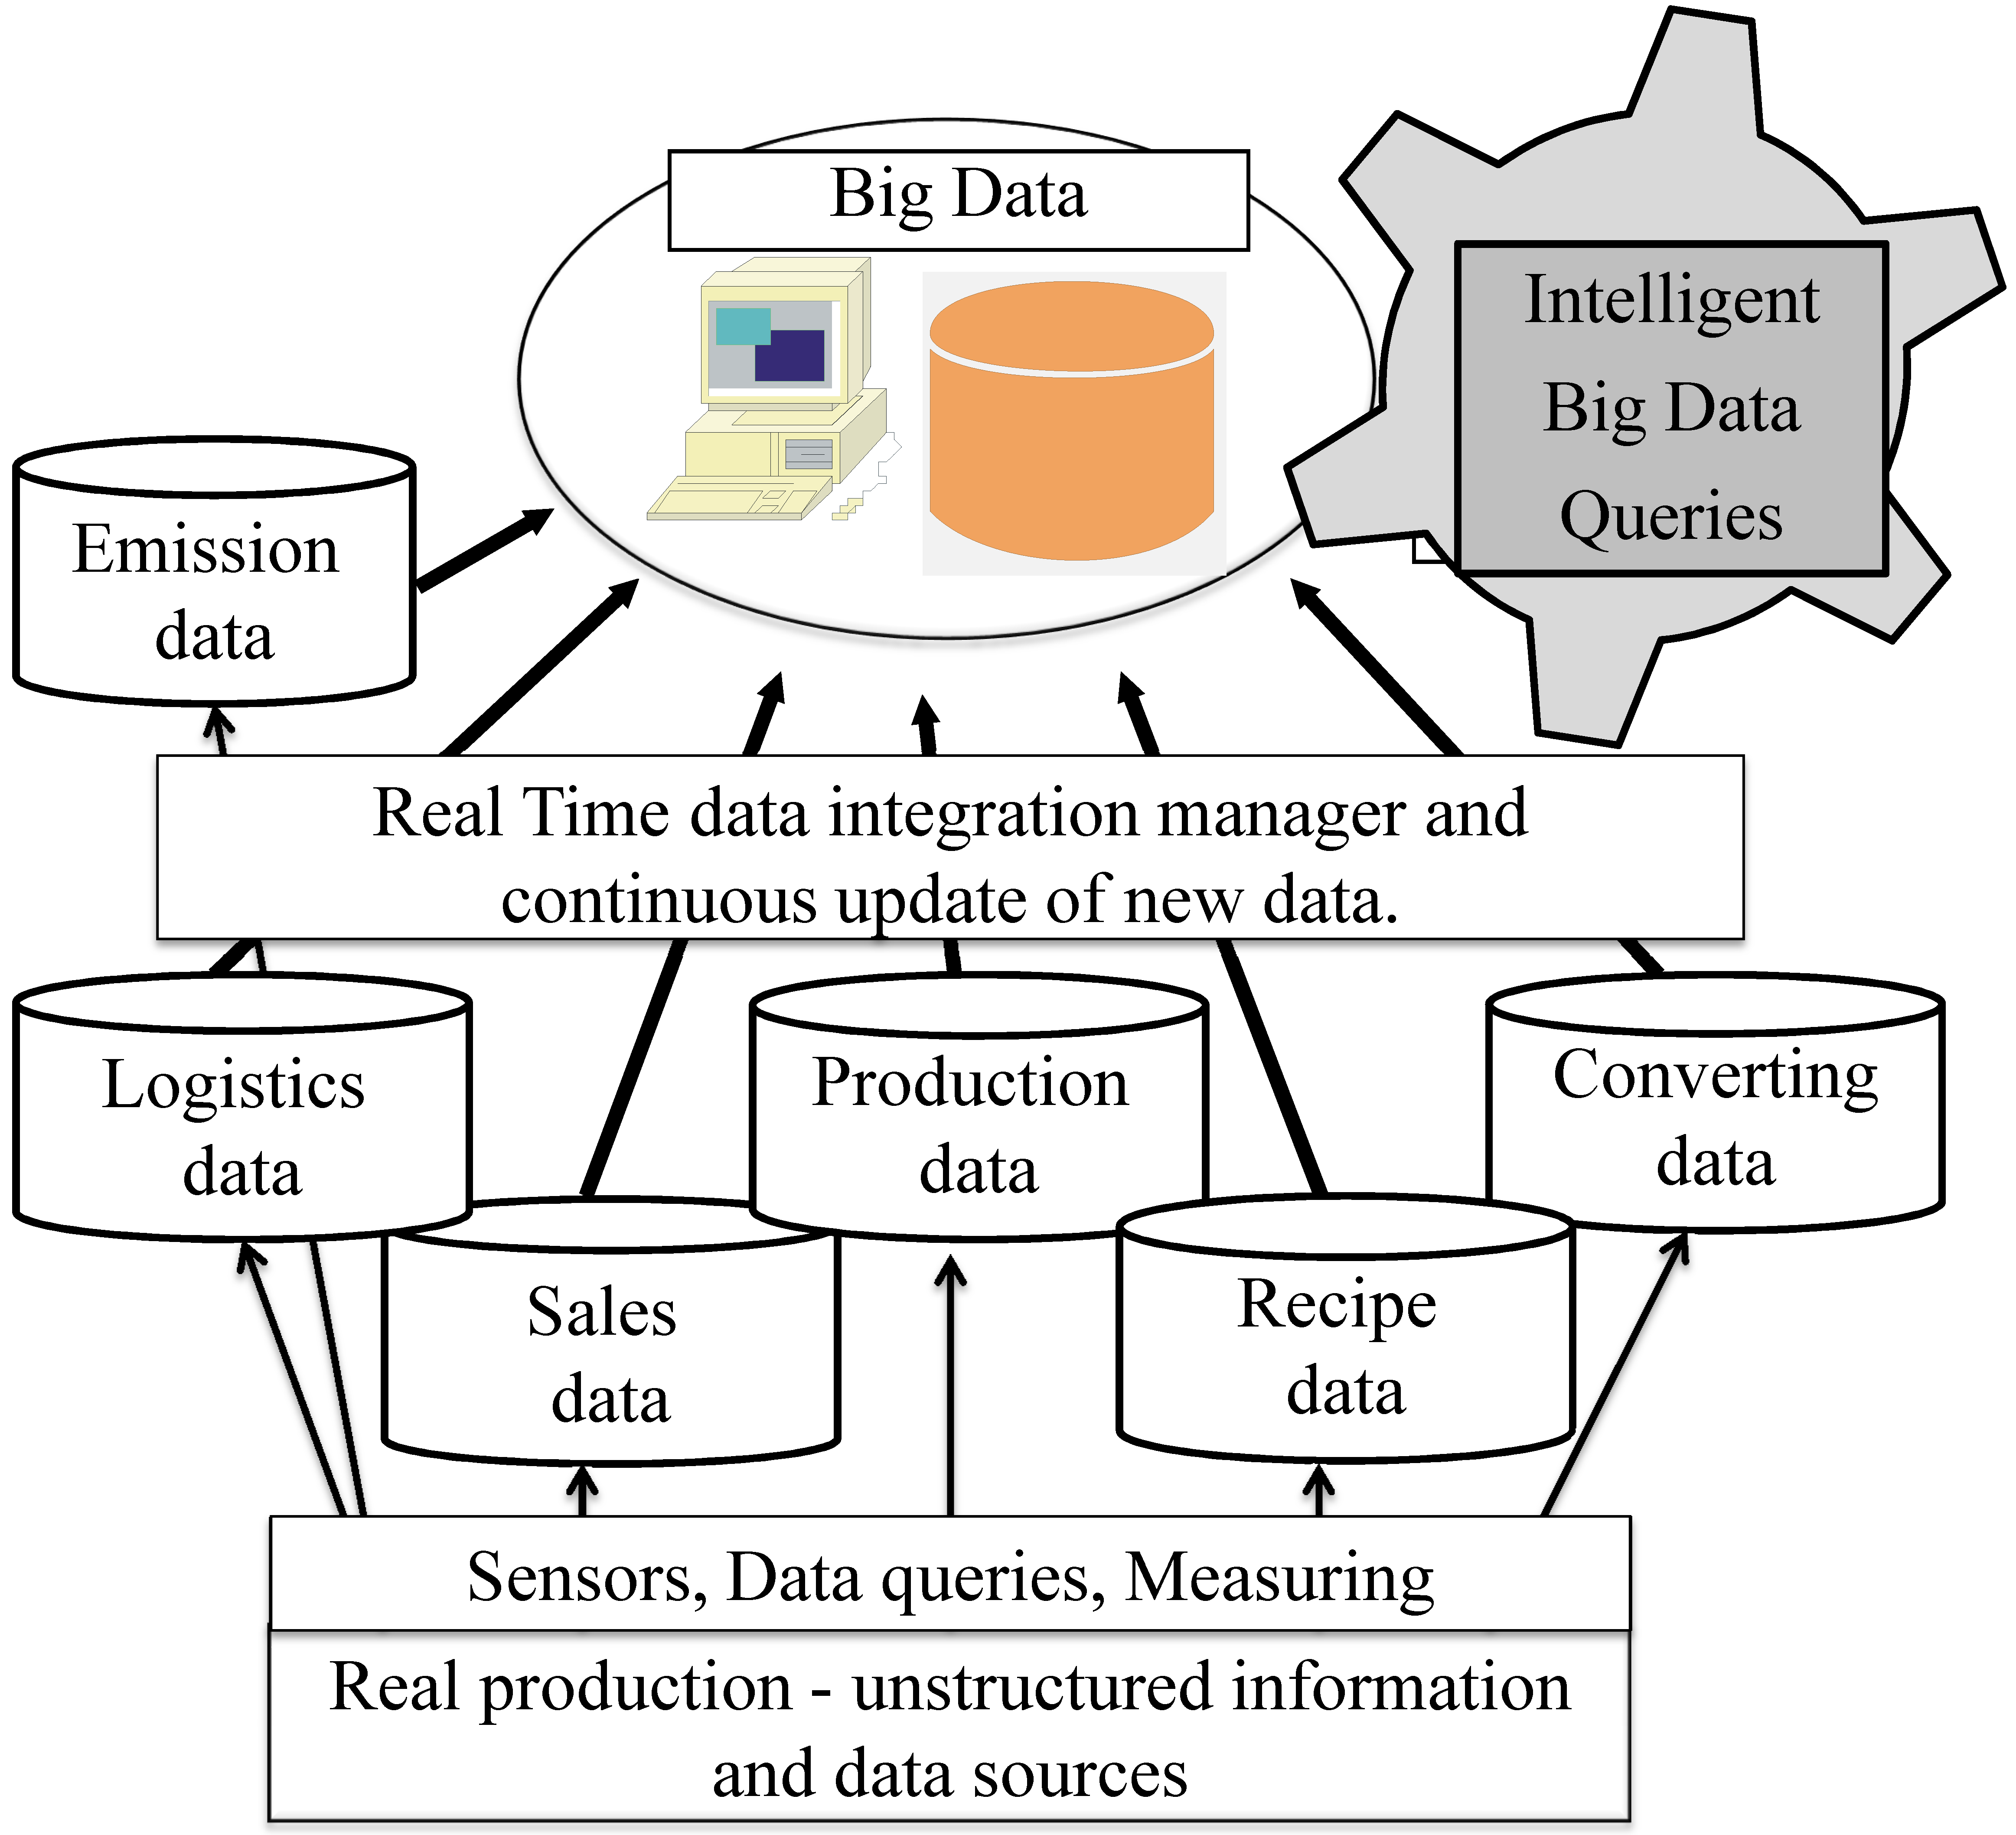
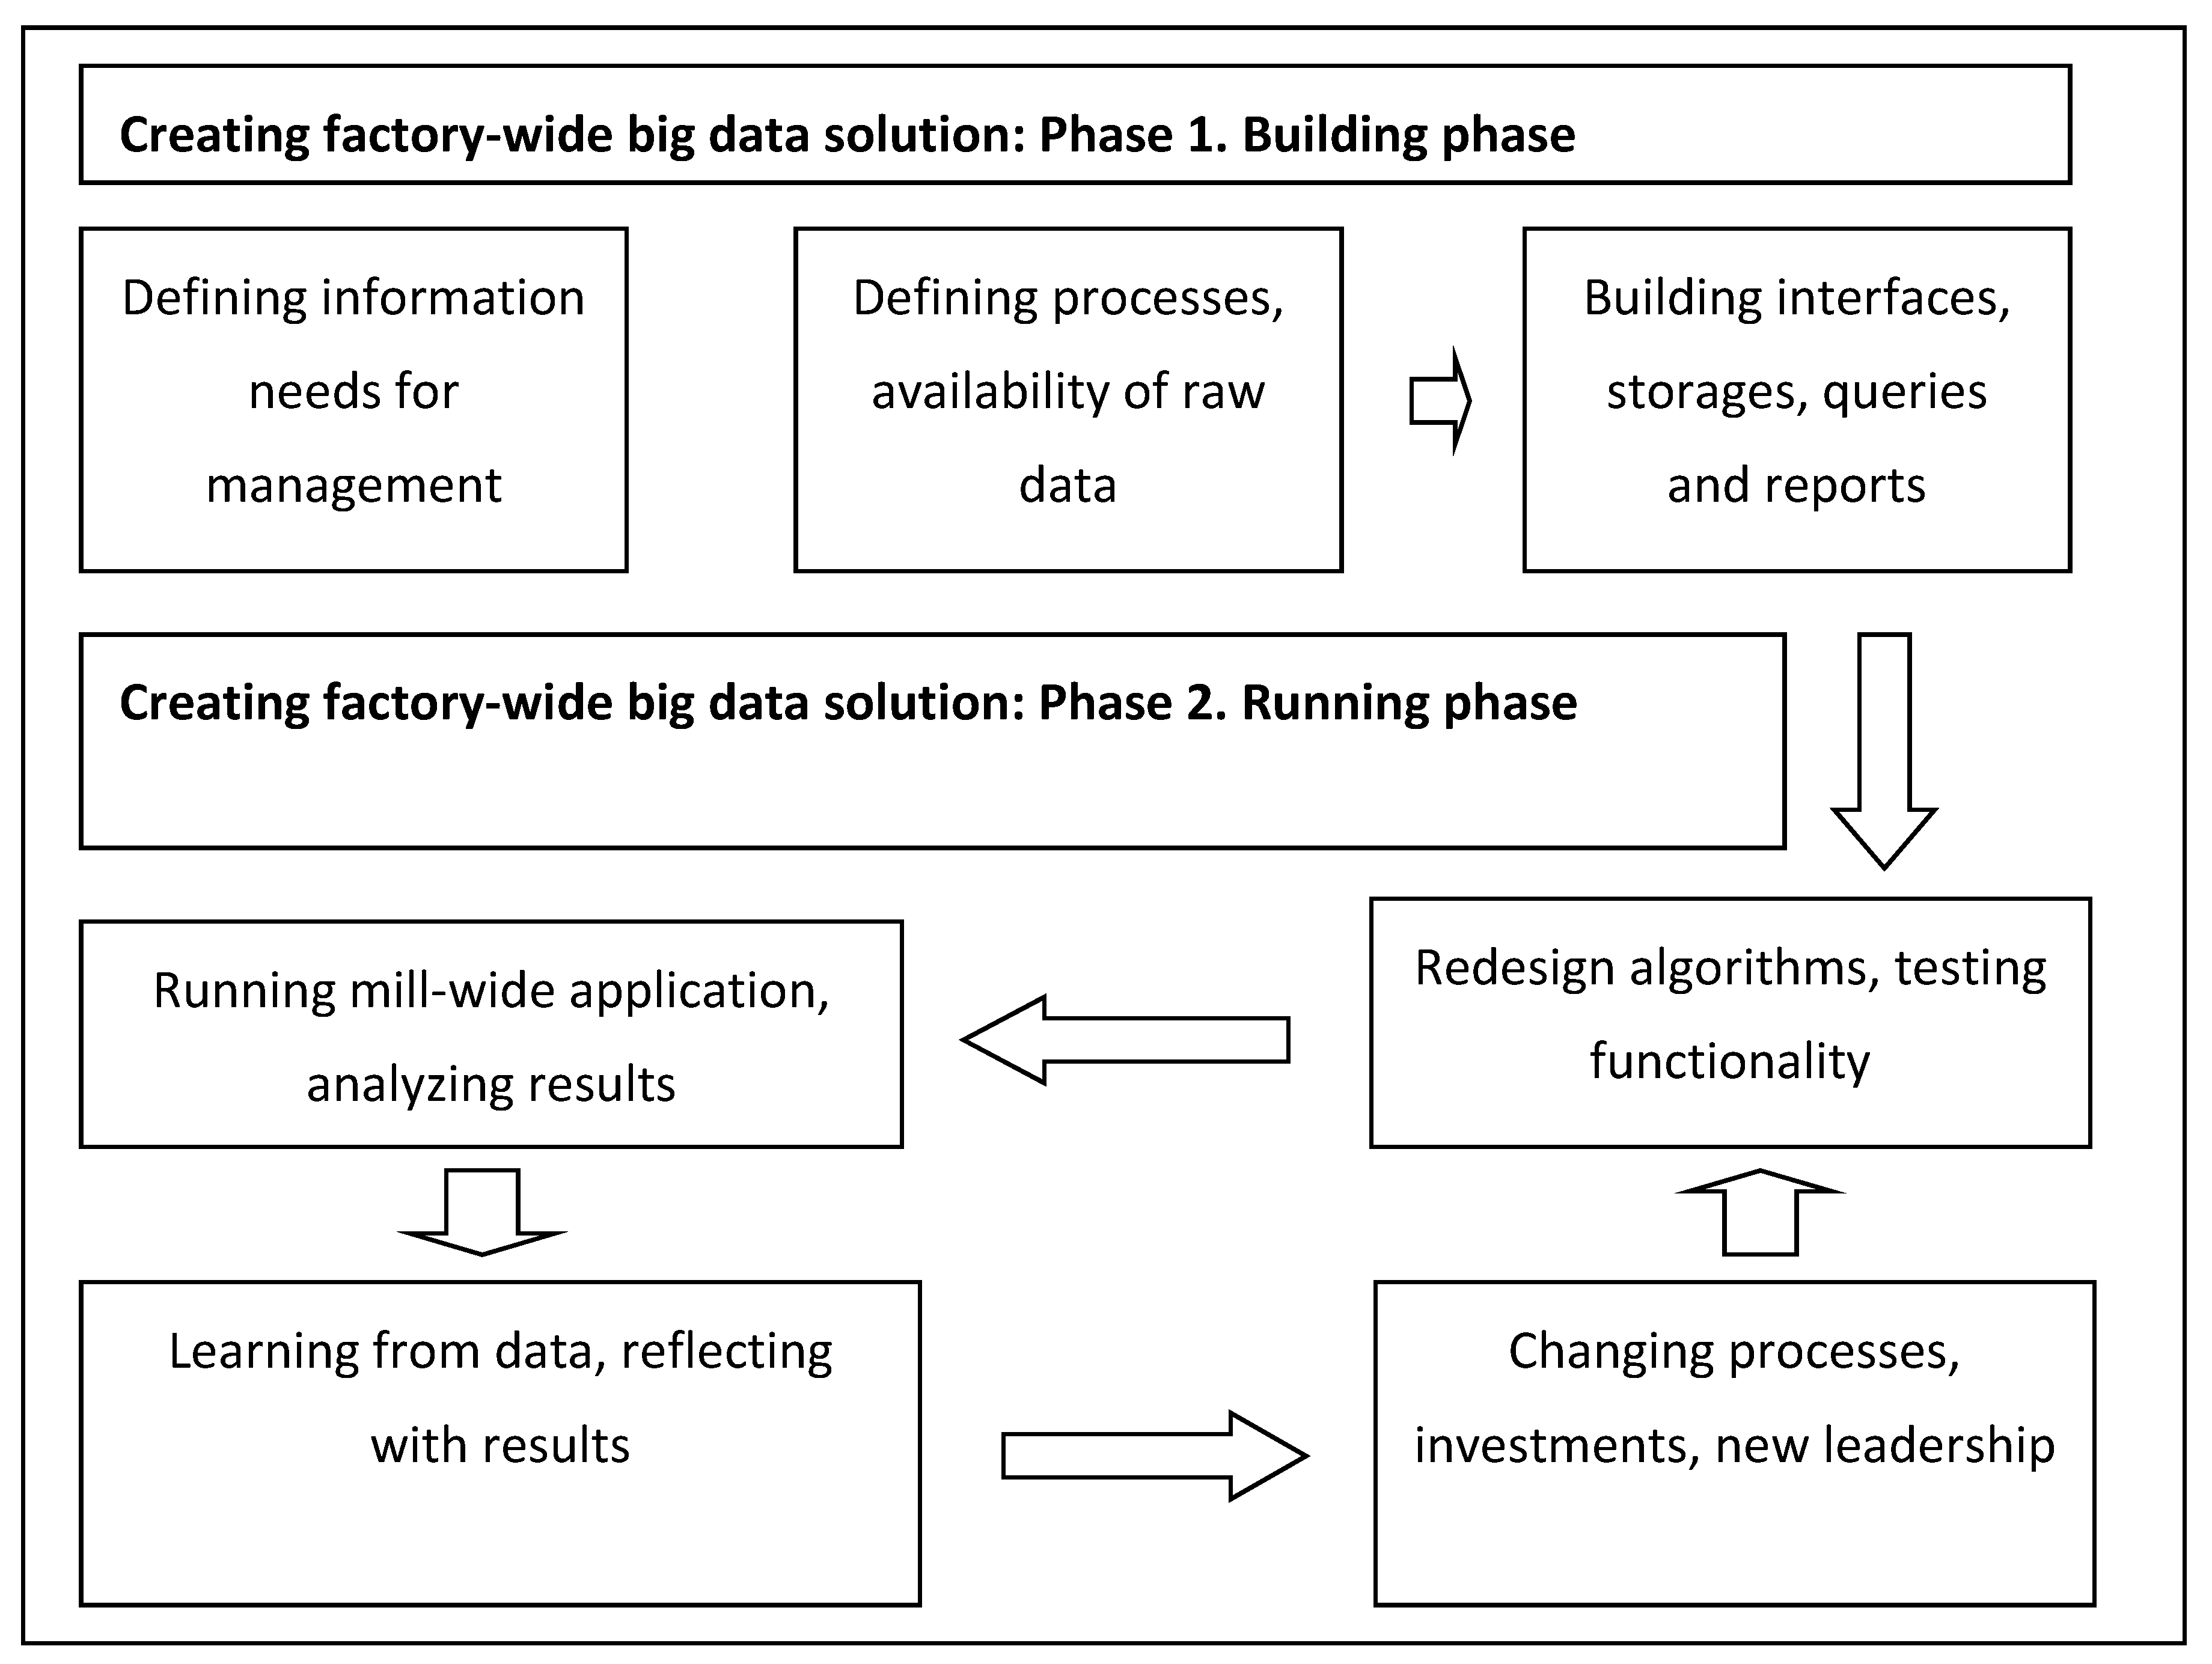
4.2. Creating Big Data by Measuring and Collecting Values from a Real Process

As presented in Section 2, there are logical stages to building a mill-wide integrated system that continuously gathers data and benefits from Big Data. In this section, we present some findings and examples of integrated Big Data-based solutions that are running in large paper mills. The findings of this section cover the following areas of calculation and reporting: production information, sales and logistics, cost and profit, and emissions.

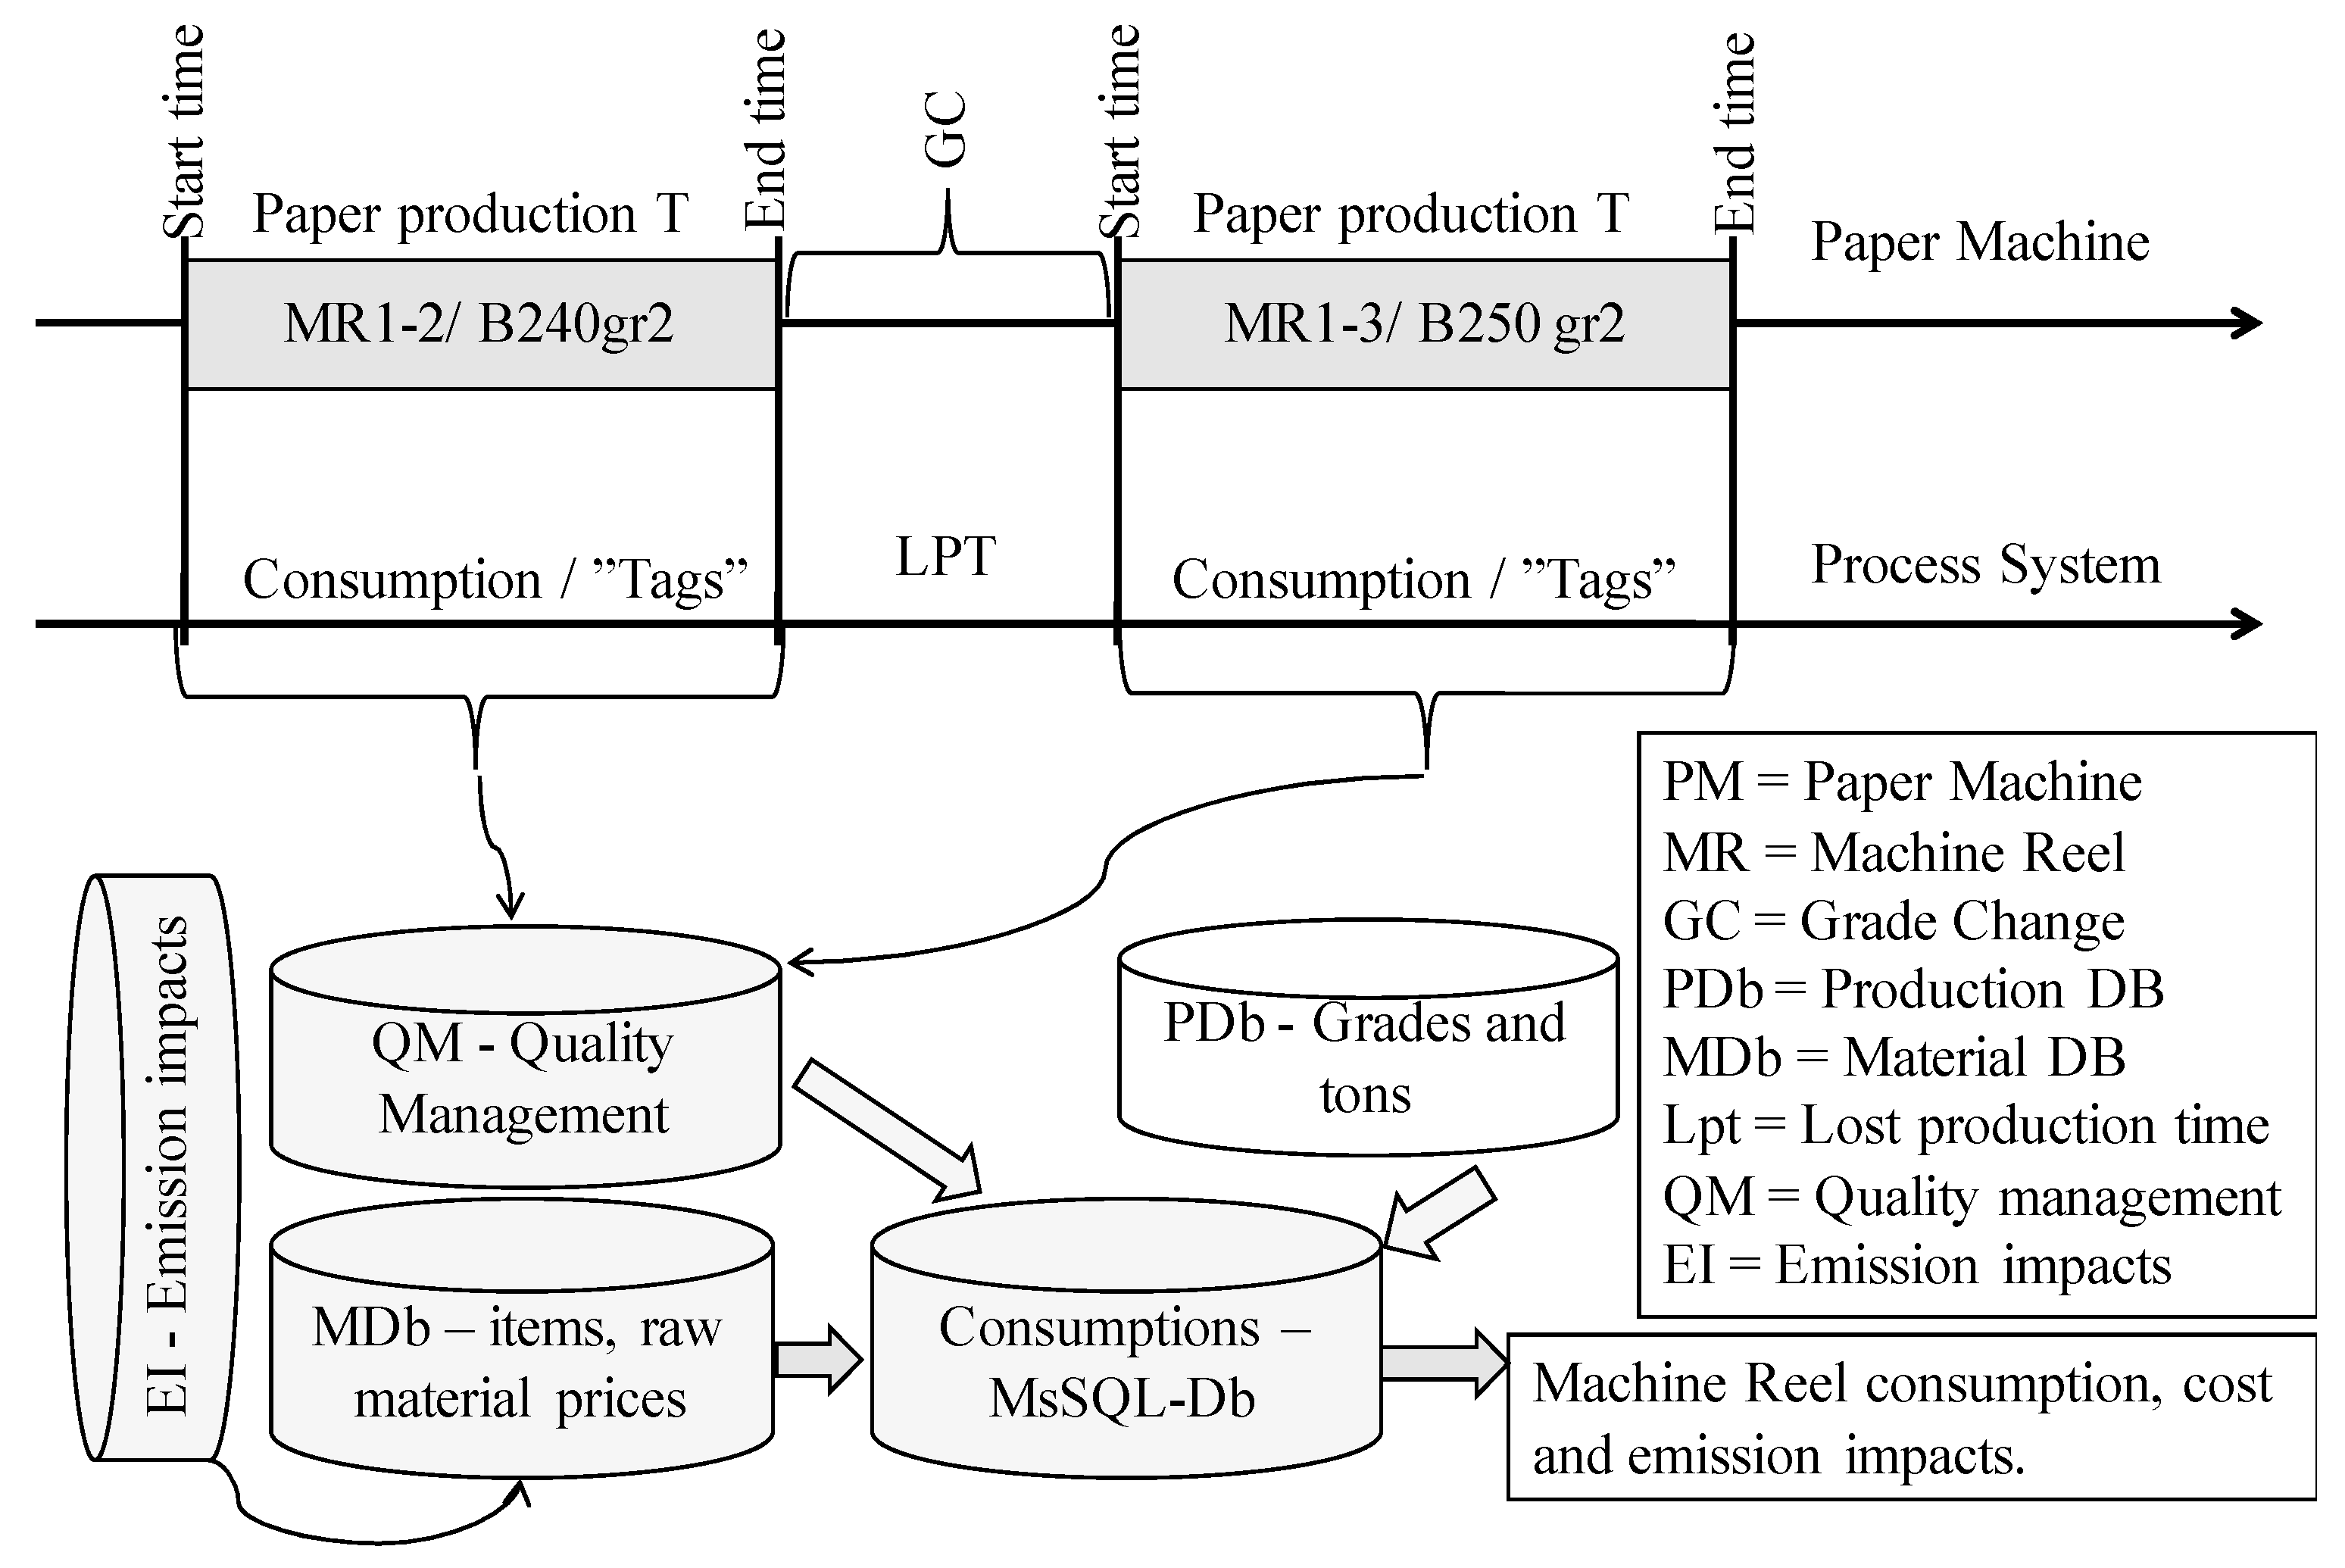
4.3. Data Description; Sources for Profit, Cost and Environment Reporting

The production system at the mill stores and delivers further production information as machine reels, roll cutting, customer rolls, and re-reeling data. The manufacturing recipes can be obtained from the production management system. The measuring is transferred automatically from the time-based process information system. It is vital to define the measuring points so that the measurements reflect the production as accurately as possible. These measurements also include the machine running times. Material information such as item, item code, consumption, dry matter, costs, item costs, and cost center can be copied/transferred automatically and online from the material systems. The fixed costs include the type of cost, cost price, and cost center. The order data is needed to calculate ex-mill costs, because the customer order describes the paper grade and converting data. Finally, the invoice data contains the possible claims, transport, warehousing, and commissions. The emissions of the used materials and energy at the site are obtained from global sustainability Big Data-sources, and merged with the process measurements (Figure 1). This information represents which chemicals the mill is utilizing, or which transport means the supply chain and logistics are using. Trucks, ships, trains etc. produce different amounts of emissions. The list of the main data sources is as follows:
Materials and items
Materials and items are information, which is stored in the material system, and this information contains the monthly consumption of different items and costs.
Production information
The production information system continuously collects production data based on customer orders. The main rule is that every produced machine reel has a customer or customers. The production information system also collects the converting data, that is, which reels are sheeted and which reels are cut to rolls with different sizes.
Recipes and energy
There is a specific system for recipe data (the material and energy composition to produce one tonne of paper or a similar unit). The system manages detailed material and manufacturing specifications to make machine reels. Customers purchase only paper that suits their printing machine qualifications exactly. This paper type usually has a certain unique recipe. The raw material (pulp) and energy consumption is calculated using recipe information, and revised based on the measured information. The recipes are also updated regularly with the help of measuring and using actual consumption knowledge. Raw material measuring in a process cannot totally replace recipes in raw material allocations, because of observed variations in real-time measuring. Time, pulp, energy, chemicals, and even fixed costs are quantified at the recipe level. All of the definitions and calculations are made per paper tonne, which makes comparisons with other paper grades easy.
Fixed costs
Fixed costs include wages (usually in the paper industry), but these cost types must always be defined in detail with the mill controllers. Mills and companies may have different ways to allocate these costs to reels, rolls, and finally to saleable packed net tonnes. It is essential that the costs are defined commensurately, such as €/h or €/T.
Customer order information and invoice data
The customer order line reports the dimensions of customer rolls or sheeted units (length, width, and weight). The customer can be selected by order line, but a part of the orders can be mill or stock orders, which are afterwards linked with customers. When users get the ex-mill price, they are able to calculate the ex-mill margin. When transport, commissions, and claims etc.—ex-mill costs (these are all called ex-mill costs)—are subtracted from the order price, the result is the ex-mill margin. The order information is needed to calculate the profitability of orders. Invoice data is needed to calculate customer profitability, and also to calculate the profitability of a machine line. Collecting customer orders helps to plan future material purchases, and this supports the forecasting of margins and profitability. These calculations are often carried out with complicated rolling forecasting algorithms.
Reject and broke
After the machine reel is finished, cut, and packed, the amount of recycled waste can be calculated. Broke is calculated with the information obtained from the production system and transferred to the cost management system, where the amount and value of reject is calculated. Machine reel is the gross weight of the reeler, and net weight is the saleable amount in different phases of the production path. When calculating the rejects of paper machines, their measurements, which contain information on how much raw materials were used to make the machine reels and how much converting creates rejects, are needed. Fiber efficiency can be analyzed when the amount of broke after different production phases (e.g., paper machine, reeler, sheeting unit, and finishing) and the final weight of customer saleable packed net are known. It is also essential to calculate the reuse of materials such as pulp, coating, and some of the chemicals that are utilized in the recycling process. This recycling additionally lowers the manufacturing costs; however, this also lowers the saleable net paper tonnes. This interrelationship can be tricky to reveal.
Reporting
After collecting the previous listed Big Data, it is possible to build the cost and environmental management and reporting system. All of this data is stored in the system containing all the relevant information of the site, and this systematically collected and saved data is continuously updated. This mill-wide system gives the users the possibility to calculate and report all of the information on a very detailed level through multiple selection-based queries (“cube-like”). The purpose of the system is to build up profound knowledge for all of the management levels.

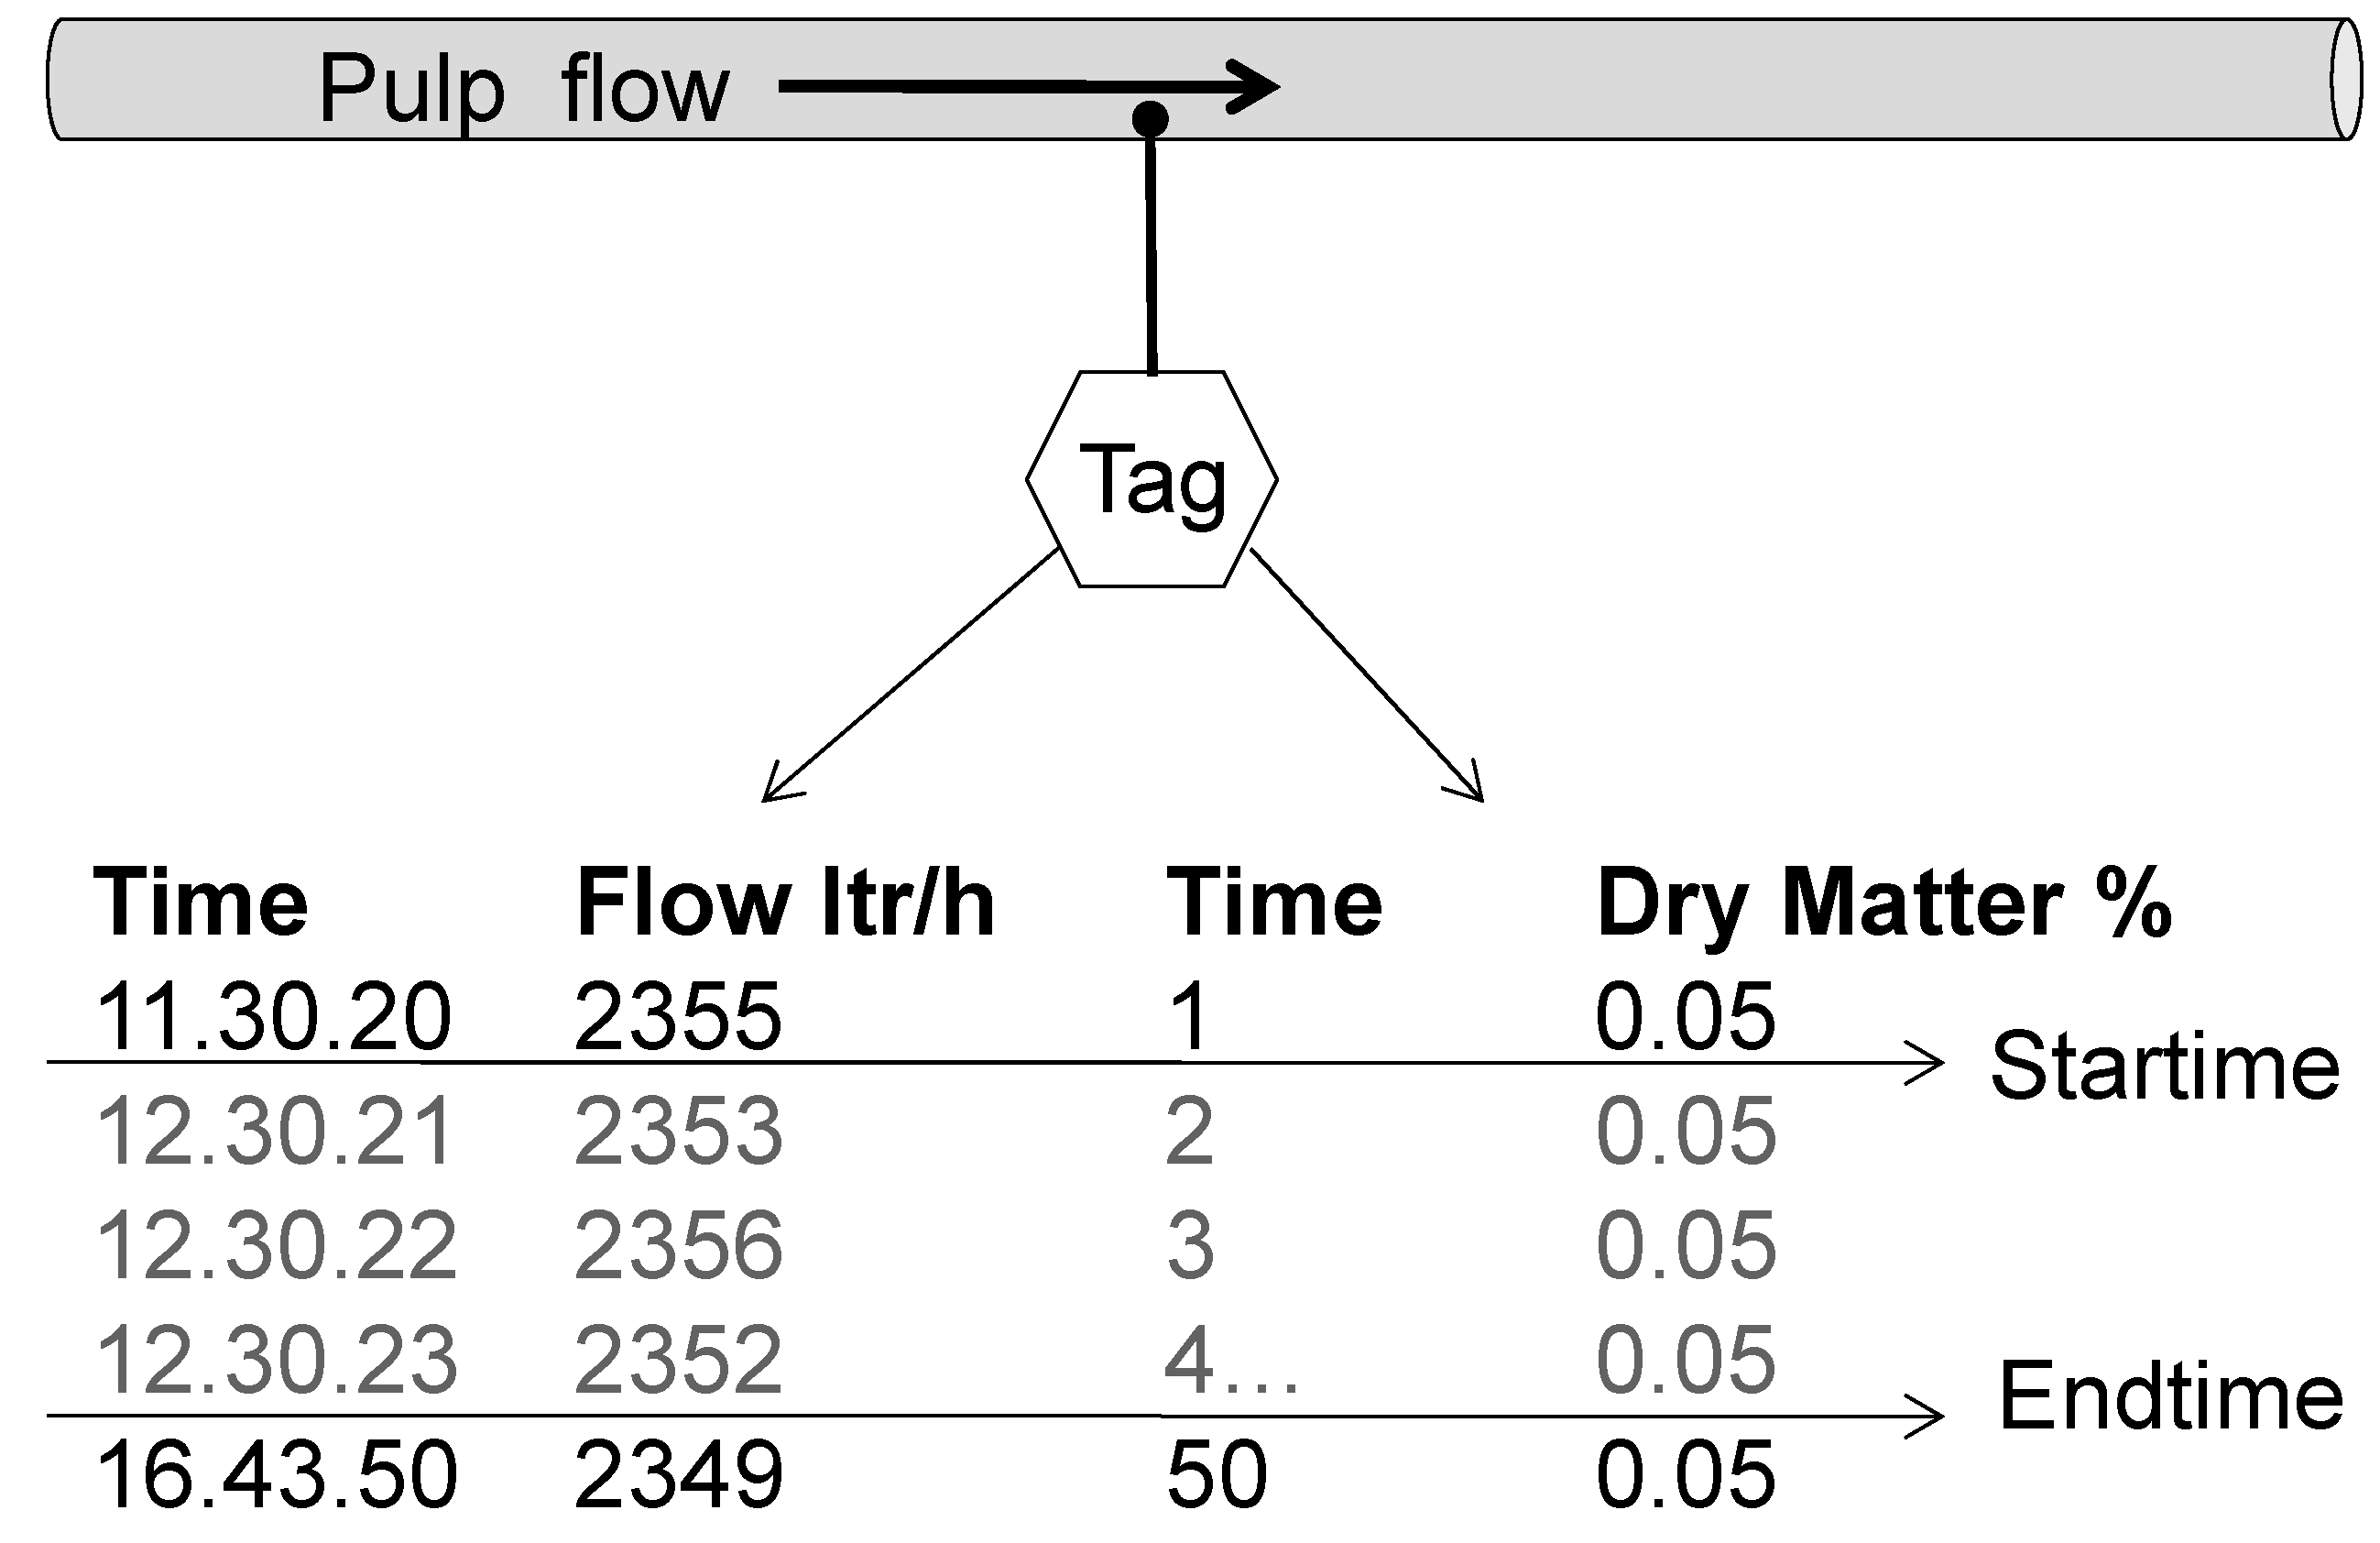
4.4. Transforming Flow Measurements to Mill Big Data

Cost calculation and emission reporting ultimately are based on reliable measurements from the process. These measurements are an important part of site-based Big Data information storage. All of the higher aggregations and calculations use this data after it has been filtered and classified in relevant ways according to primary keys such as mill, machine, and customer. Flow measuring can be considered the lowest level method that captures information and data systematically from the process. Measuring is normally performed by time-based database systems that utilize tags as measuring points. The amount or number of tags describes the number of places from which data is collected. Figure 3 illustrates through a simple example how the measurements are performed at certain intervals. These measurements are carried out concurrently with the machine reel (product) being produced, and the measurement is collected exactly from the same time period (the stored time stamp specifies the exact time). The measurements are compared with the recipe data, which gives the pulp dosage in kilos per paper tonne. The idea is to measure the consumption of process chemicals as accurately as possible, and monitor the whole usage of the recipe. The batch chemicals are not measured similarly, because the batch amount is only roughly known at the recipe level. Measurements are important from the control perspective for monitoring the material balance in the process. Deviations from planned dosages can be very costly from the viewpoint of mill economics and estimation. Normally, the measuring system is designed to use fixed and predefined intervals to determine when and how measurements are aggregated. The information system uses measurement tags and saves online measurements, such as materials. The machine reel-based measuring interval must be designed together with the operators of the automation system. The machine reel information is received from the process systems and transferred to the production system. The measurements are summed up to calculate the total amount between start time and end time. The process information system recognizes the storage tank/chest that is being used, and the raw material type that is stored in the tank. The process system obtains the status of the tank valve from the process, that is, whether the valve is open or closed. During production, used material tanks can be changed, and the material can be changed to equal types of materials during production. It is important that both materials have similar impacts in the process and the end product. The real-time production system links measuring data with material systems and other required systems to obtain the needed data for paper grade-level cost calculations.
Figure 4 demonstrates an example of how machine reel-based consumption measuring and cost calculation and reporting could be built. The cost management solution has a database, which is receiving measured material consumptions from the quality management system. The emissions of materials and the supply chain information are obtained from an external database (see Figure 1). Accordingly, the produced paper grades and tonnes are obtained from the production database, and raw material item groups and material prices are exported from the material system. This consumption database produces reports on machine reel-based consumption, costs, and emissions. These can be utilized later in detailed customer profitability and efficiency reports per paper machine.
Through these examples, we demonstrate that the mill-derived Big Data and the later presented consumption, cost, profitability, and sustainability reporting receive the basic information directly from the production process. This data is updated continuously from the actual process flow, and in some cases (batch cost) automatically, but strictly according to recipe information. However, standard recipes are updated with the measured consumption data if online data shows that the material mix is continuously different than the forecasted standard recipe. Machine upgrades and device changes may have an impact on the material recipe-based mix.

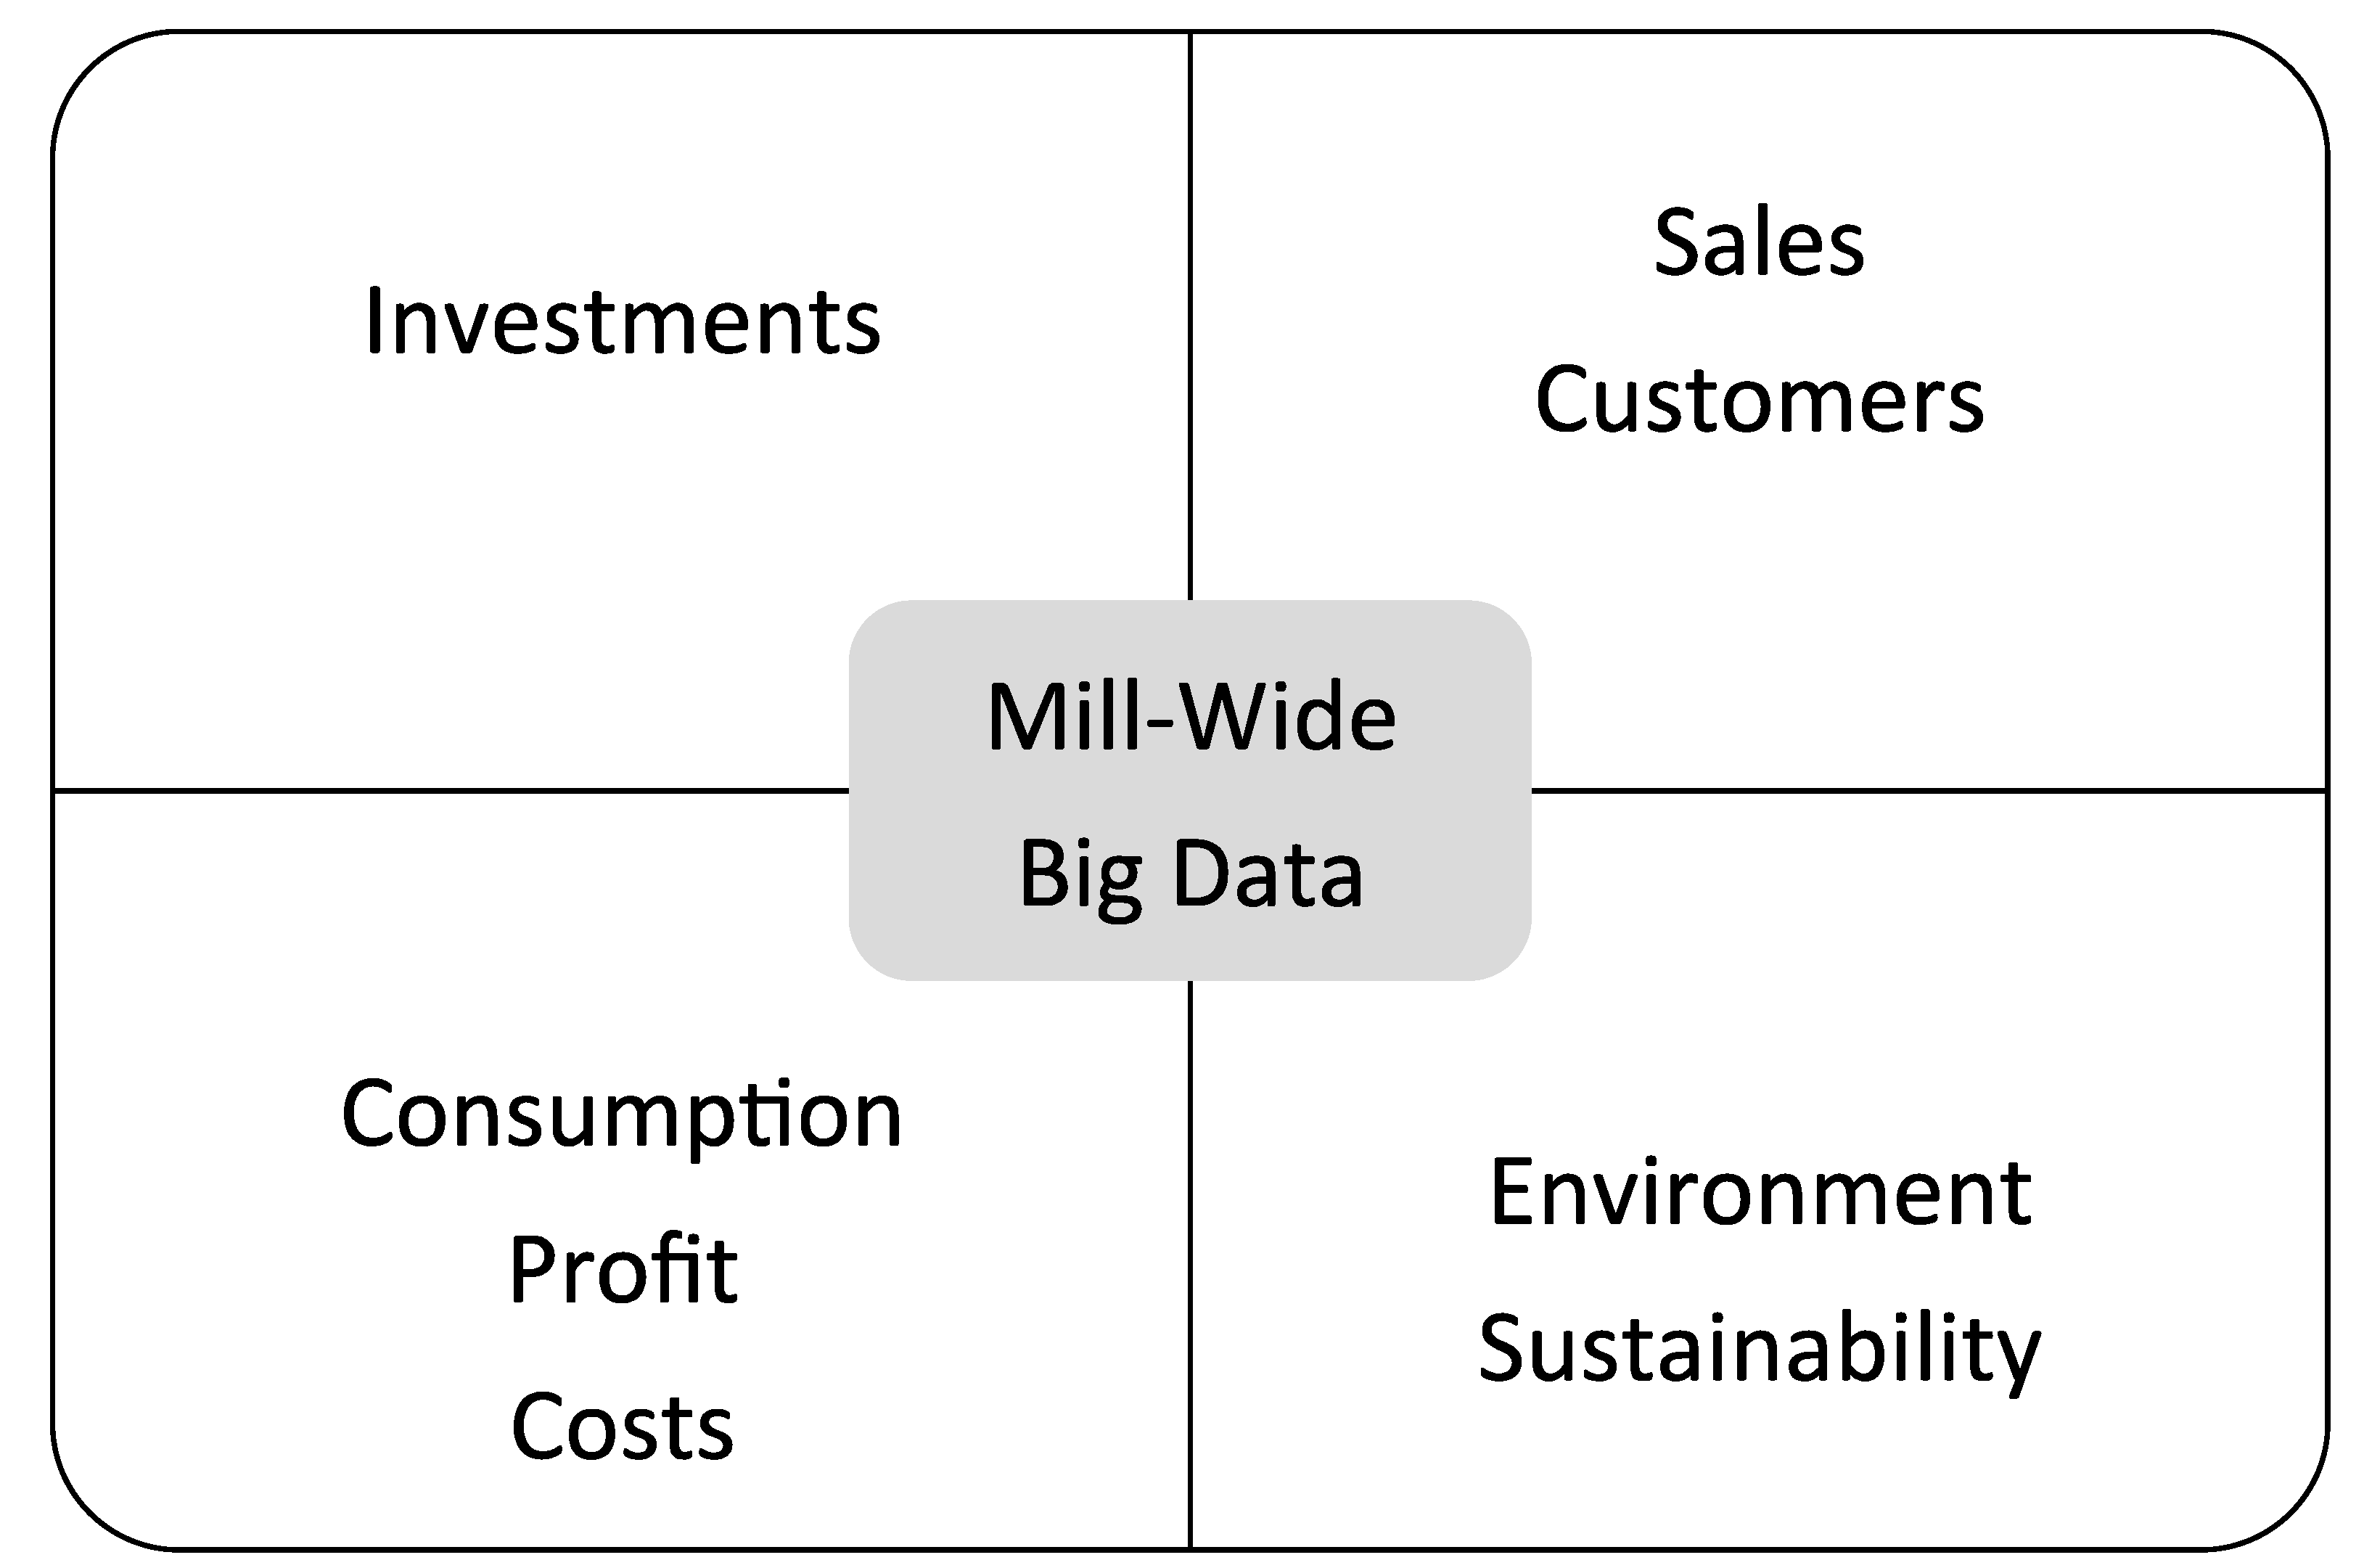
5. Integrated Production and Economic and Emission Reporting

The ultimate goal of the process measurements and data storage that originate from customer feedback is to improve both economic efficiency and sustainability. Moreover, global agreements between nations called climate actions obligate them to lower emissions and stop global warming. Both require the heavy industry to achieve lower emission levels in manufacturing in the following years by any means. Climate change is confirmed by thousands of outstanding research groups globally, and is one of the driving forces to reduce emissions. Another reason is the expectation of customers for more so-called greener products.
Cost management features of the process industry were presented in previous sections. The big picture illustrated in Figure 1 shows how a road to sustainable production could be built and executed. Figure 5 presents a report example of emissions to water and air. The report is queried from the database using selected dimensions, which in this case are period (month), product, and sales grade. Figure 5 presents how much two sales grades—1050 and 1060, 1578 tonnes in total—generate emissions to air and water (the numbers are only demonstrative) during the manufacturing process. These values are obtained from internal and external data sources and include all raw materials, energy, the emission impacts of raw materials, internal supply chain phases during manufacturing, and operating hours, including transportation and logistics. The system controls machine emissions so that unpredictable situations are minimized.
The fundamental idea is that this sustainability system will in the end steer material purchasing and investments to achieve lower emissions per produced unit tonne. The reporting possibilities are extensive due to data being stored and always usable for analysis, simulations, etc. The mill can test different material combinations (recipes) to see how much emission values are changing. Sophisticated use of Big Data-derived emission reporting requires reliable external data on how much emissions different materials actually produce before they arrive at the site, as well as how much they produce during manufacturing. The whole lifecycle must be taken into account. Reports give decision makers real facts on how sustainability can be developed, and emissions can be lowered by investments and changing raw materials. This kind of reporting converts Big Data into something useful and understandable. The system also automatically makes a time series of all measurements and emissions, so that the management can see the development of the emission levels.
Automated measuring (sensors) and reporting could be used in many areas to continuously control emissions to the environment. In many industries such as the mining sector, samples are still being taken manually from the environment, and even quite sporadically. These samples are moved to a laboratory for analysis, and finally, the values are stored in the systems with a large delay. If something unusual happens at the site, operators may receive the message of the unusual event after a delay of days [64]. Instead of manual handling, there should be different types of sensors around the site controlling the surrounding environment 24/7. These sensors should be connected wirelessly to the control room, and an alarm could be activated automatically in case the process system notifies that the agreed limits in the environment are exceeded. Moreover, the emission values would be accessible to the rescue operators, which would give them a better picture of the needed measures. Automated environmental measuring and alarm systems could significantly save money and the environment by shortening the rescue preparation time. The theoretical ideas, as well as the material and cost allocation methods, were presented in Section 2.2 and Section 3.1. The purpose is to utilize process information, raw material items, and external emission impact databases, which have detailed information about raw material items and their emissions to nature, in CO2 and other equivalencies. All of the machines may have a different efficiency; that is, through put tonnes per hour, variable costs, interests, and depreciations.
The reporting dimensions are selected as follows: period (month), machine (paper machine), and products (grades). Customer and country were excluded in this example. After the execute command, the system shows all of the information presented in the tables in seconds:
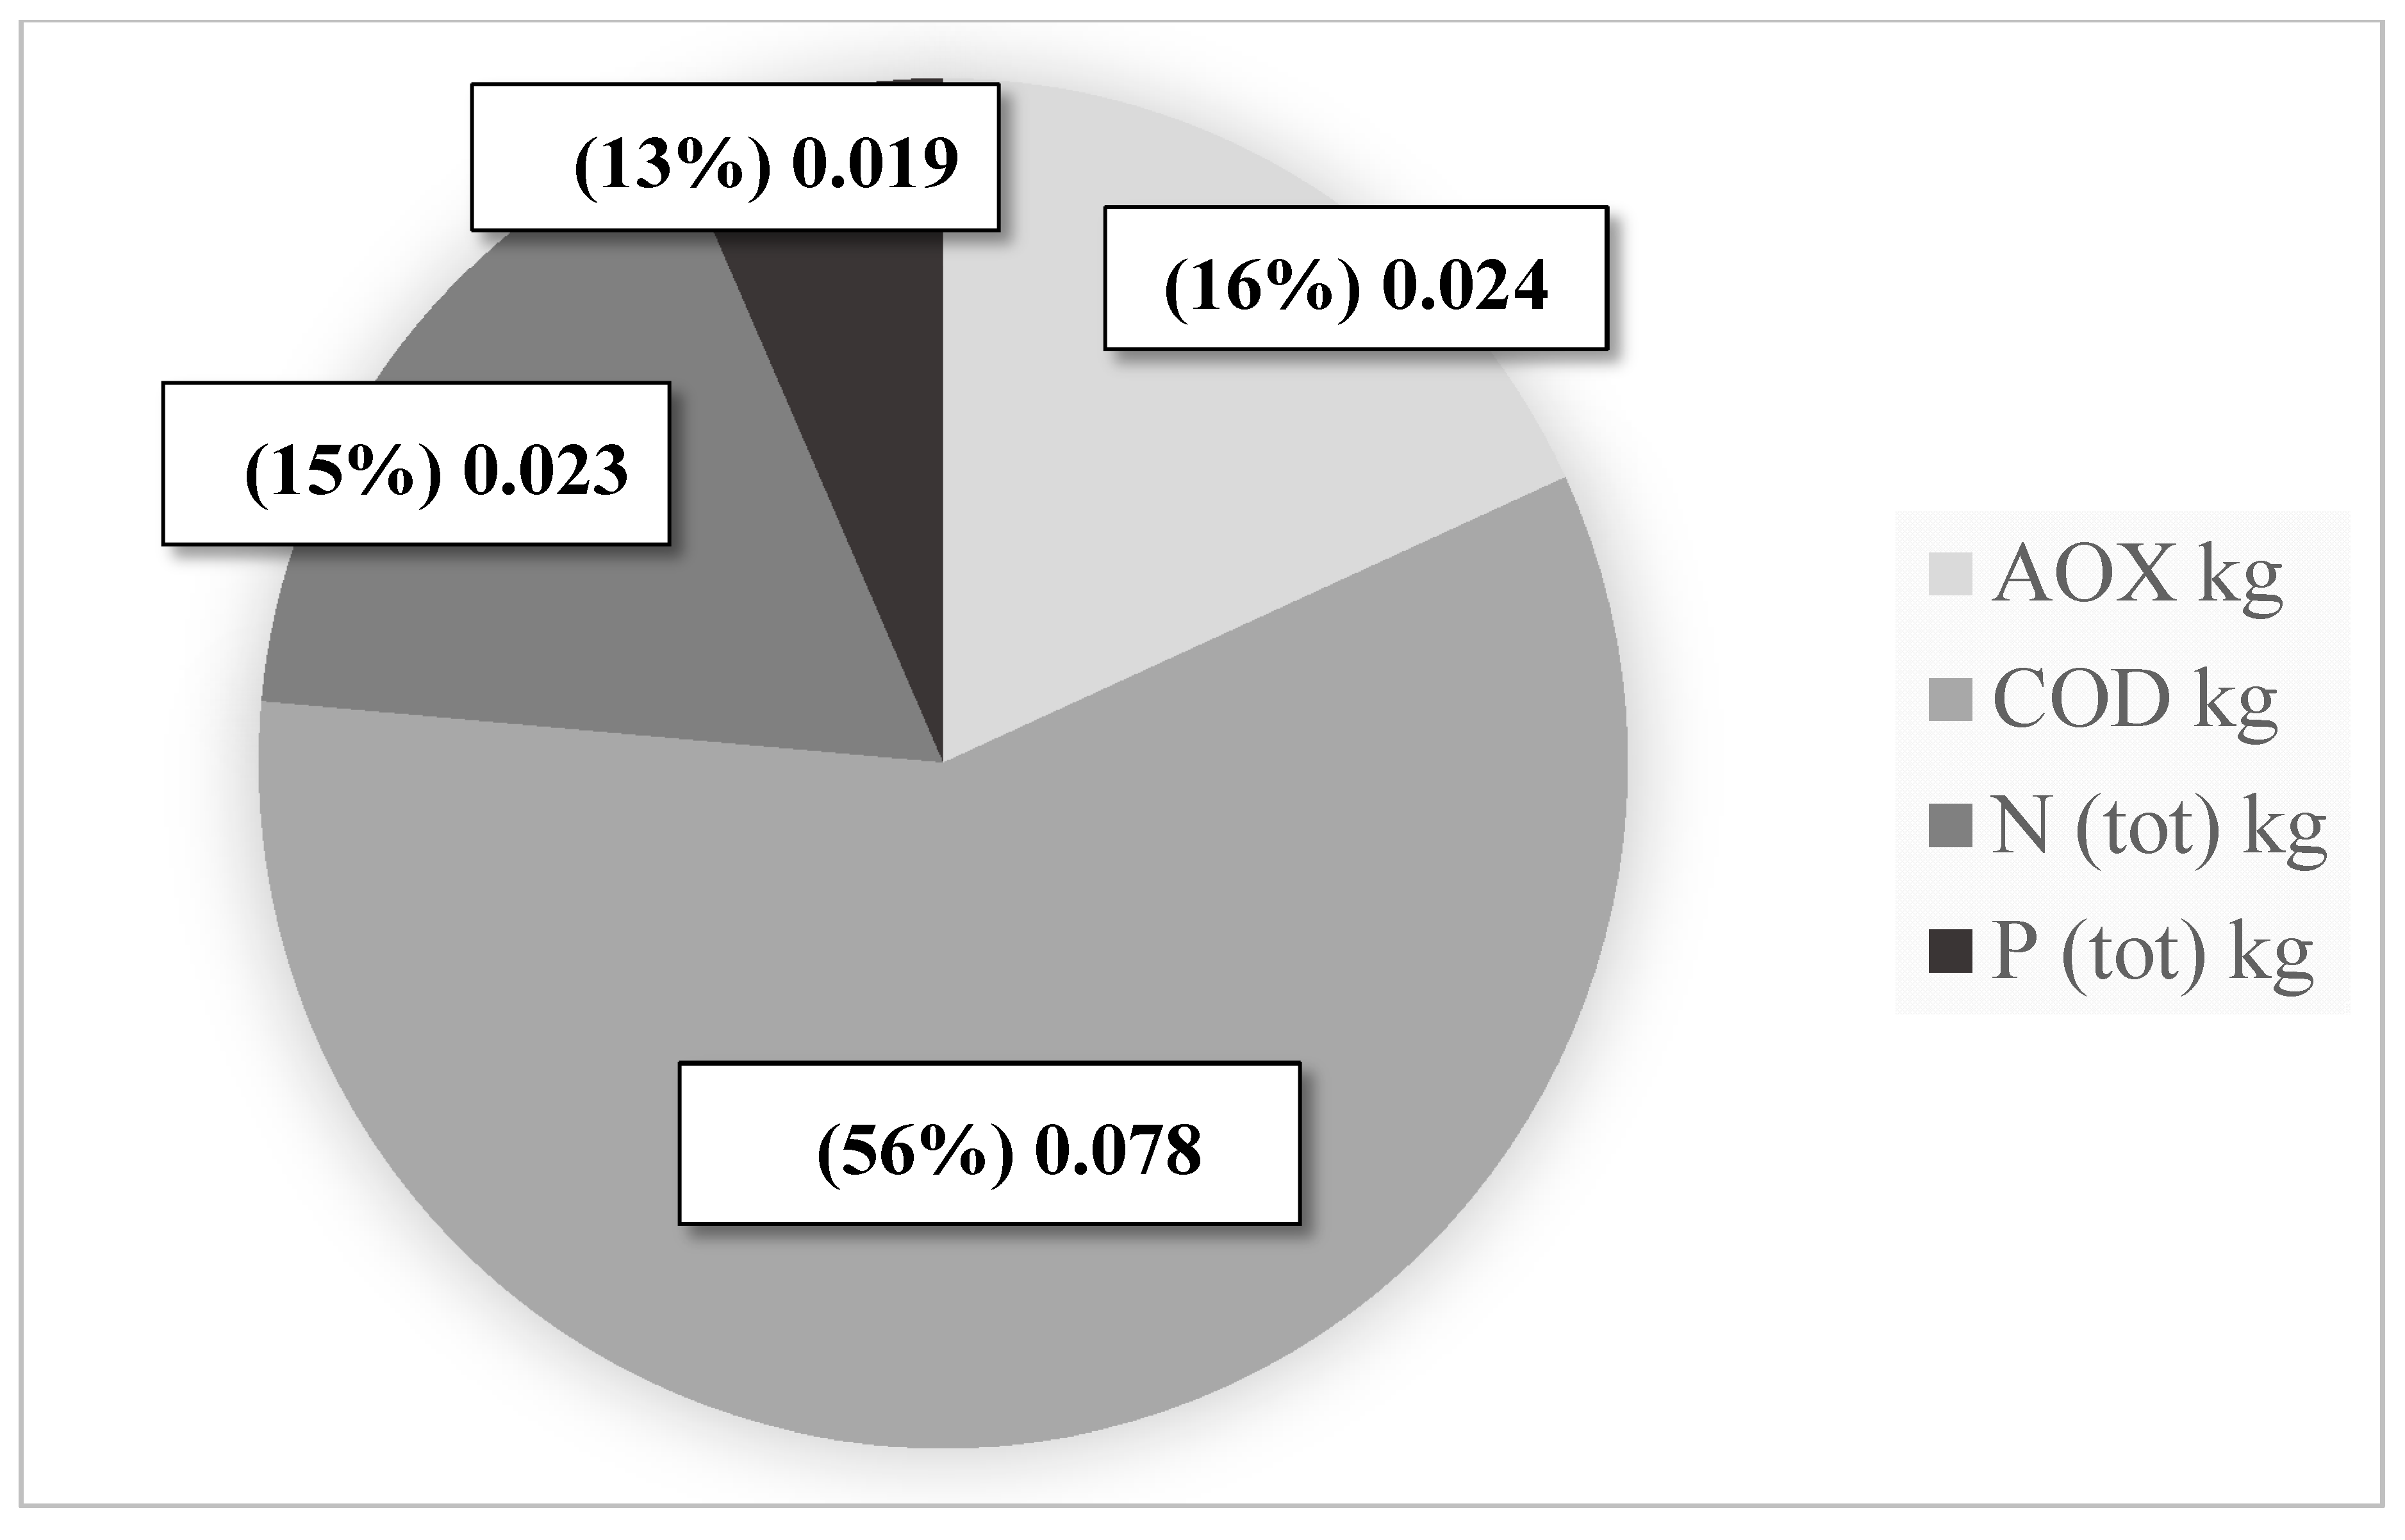
  • Emissions: global warming potential, ozone depletion potential, acidification potential, and eutrophication potential.
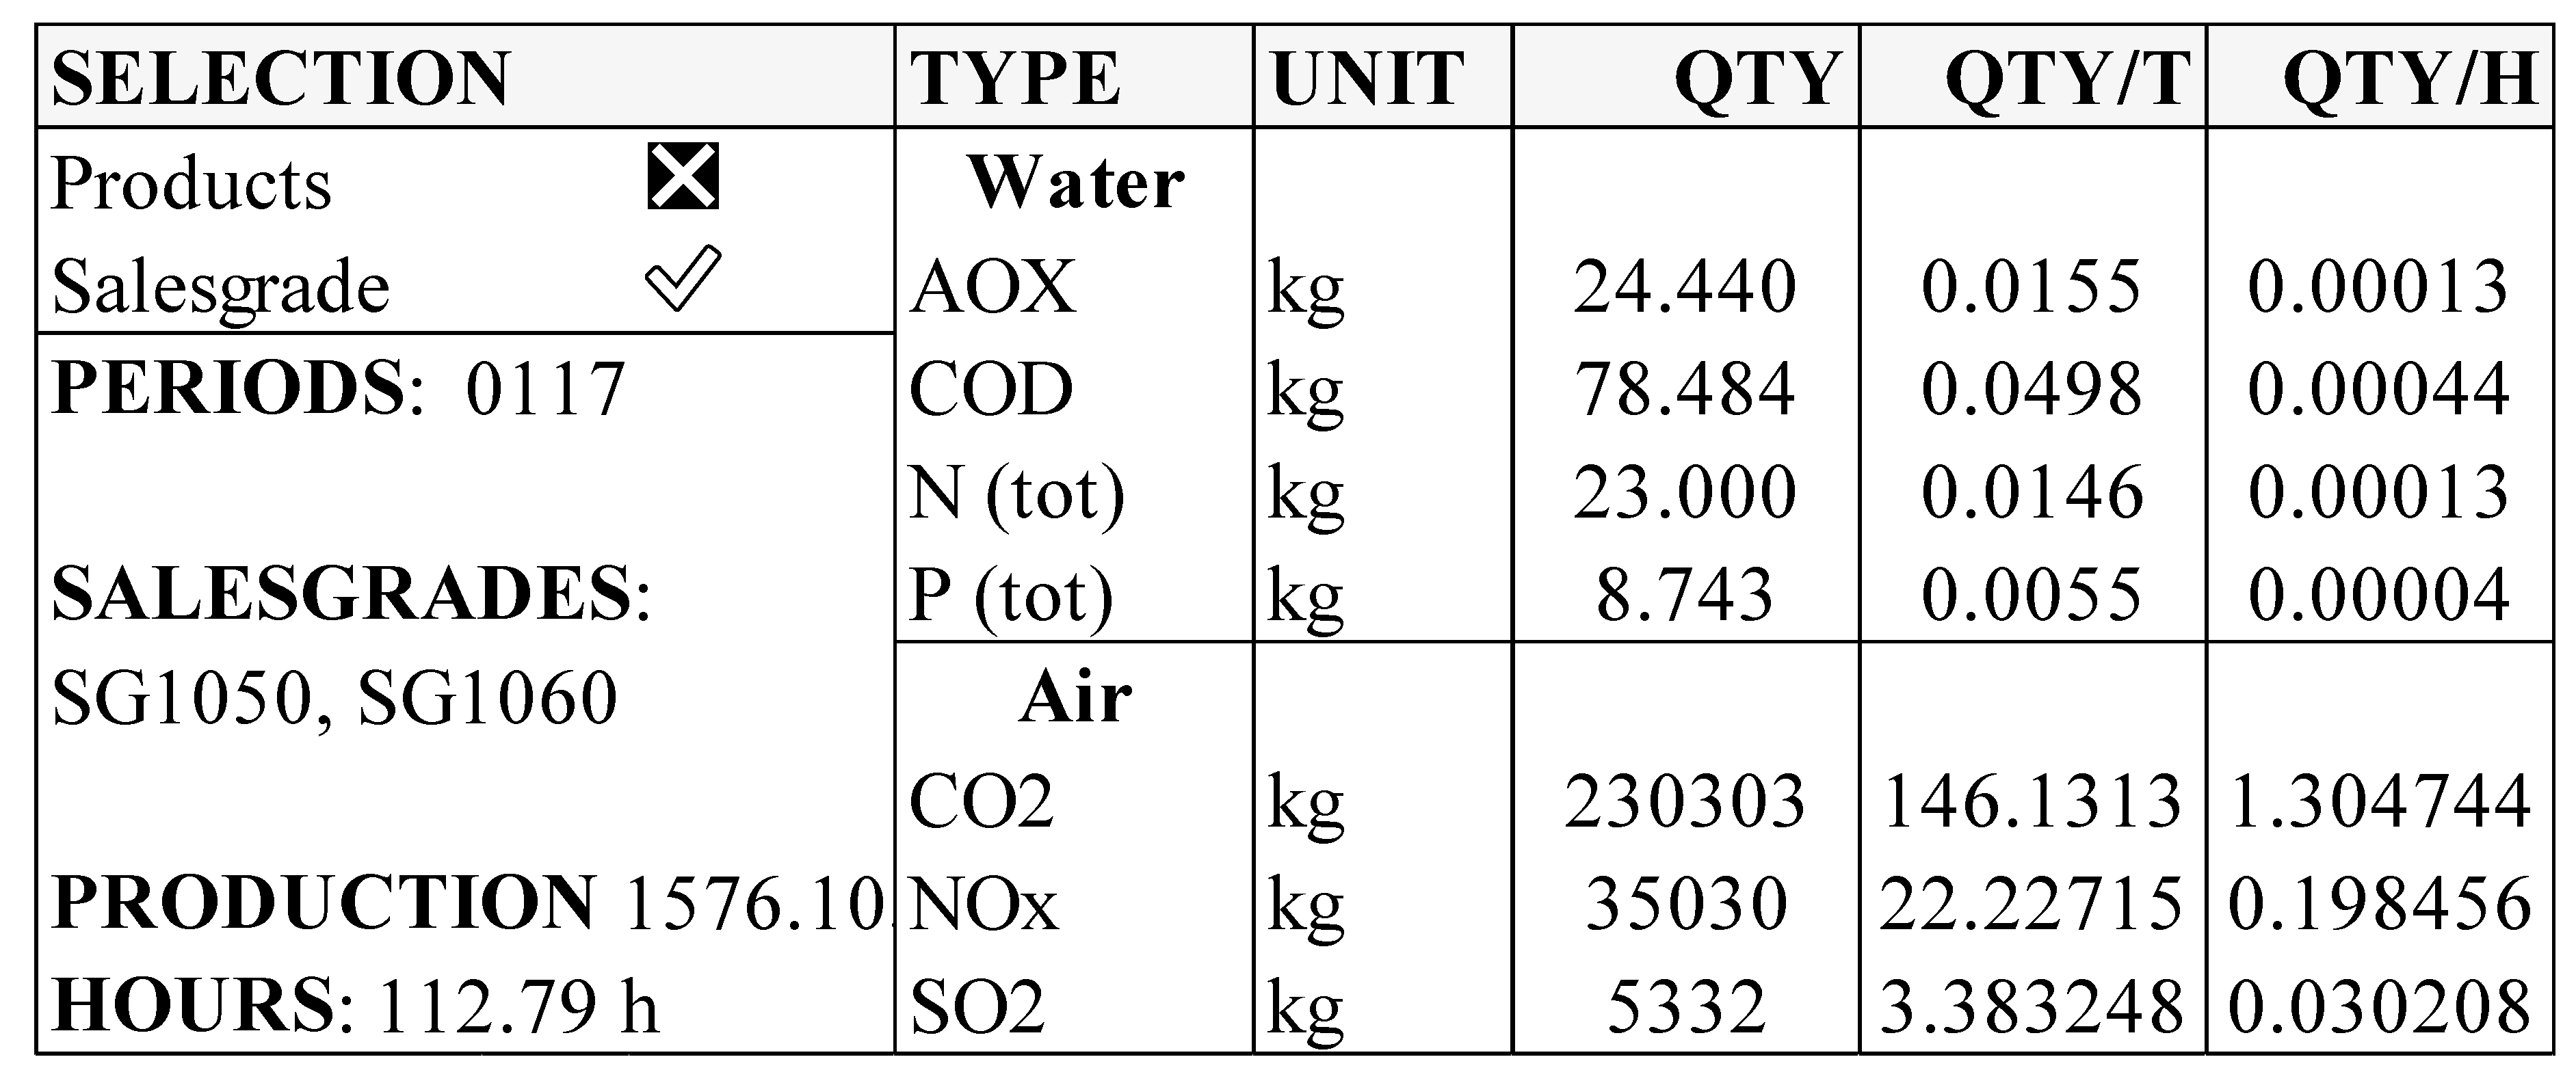
  • Production data: Material consumption and paper production in detail.
  • Economic data: From sales down to the gross margin, as an example. In a real production environment, the system composes all necessary economic reports
The mill management has miscellaneous detailed information available to them. All of this reported data is merged. It is essential to ensure that the correlations and causal relations between different actors and data fields are relevant. If operators change one or several raw materials in the recipe, this obviously impacts production costs, emissions, and even the operability of a machine. Big Data makes it possible to compile a versatile report, even from the complex multi-machine line environment. The basic idea is that the figures are calculated when the agreed production phase is finished, whether a production reel is completed, a reporting month is completed, or a customer order is packed. The application could be called the economical enterprise control system, which establishes that all top three things—economic, production, and environmental topics—are integrated and consolidated. Traditional bookkeeping and accounting systems offer narrow and limited databases, and thus limited and narrow reports. After all, different personnel groups such as marketing, sales, management, production, and emission controllers must have access to different kinds of information, and would benefit from the availability of diverse consequences in one report. In the end, correctly refined non-heterogeneous Big Data will certainly improve the competence of the management’s decision making and their ability to run businesses efficiently, profitably, and with lower emissions. The enterprise control system represents data visually and uses predefined variables. Properly defined and queried Big Data can evidently help improve efficiency with optimized costs, lower emissions, increased overall productivity, and societal approval.

6. Summary

This paper describes the building of a mill-wide solution for an industrial complex environment, which should cover all of the listed functionalities and features. Cost management and environmental reporting based on Big Data requires a careful design process, as described in Figure 6. The picture demonstrates the importance of separating the planning and designing processes from the daily operational processes after the solutions are deployed. The aim of this paper is to highlight how a system can be built from numerous non-heterogeneous processes and data sources. The goal of the system is to produce continuously (24/7) filtered, systematic and exact information for decision makers. The key is to combine and run both the actual manufacturing process and online data streams together.
The presented approach gives an opportunity for decision makers to see cost, profitability, and the environmental impacts of investments, as well as the results of any other decisions to real processes. The information system reliably shows the management the impacts of the decisions in manufacturing, logistics processes, or any other operations. Figure 6 suggests that there could be two separate phases in the building of a solution for factory/mill-wide cost and environmental reporting: the designing and building phase, and the operational running phase. In the latter stage, all of the data sources and databases are integrated either directly to manufacturing processes, or the data is collected at cyclical intervals. Moreover, external databases are used when it is necessary. It is essential to have a continuous loop that is producing systematic information. The result is a real learning process based on the actual manufacturing cycle, and the objective is a sustainable and profitable production unit.

7. Discussion and Conclusions

In this paper, the authors wanted to present how to utilize Big Data to build a mill-wide system that would cover most of the information needs and features expected by site management. To build cost-efficient and low-emission production, managers need much more merged and detailed information than before to achieve proper decisions. Uncertainty should be minimized in decision making, and obviously extended data usage offers a chance for this. The traditional silo-based systems, based on e.g., bookkeeping, do not offer a chance to combine costs, production, and emissions levels correctly. Mill-wide Big Data created from various and non-heterogeneous sources brings a great opportunity to report detailed information combinations. “Raw data” must be filtered before it is applicable for further use. Using examples, we showed how to improve accuracy in reporting and how to combine customers, products, costs, and emissions reports. The goal is to automatically calculate on the customer level both (1) the profitability of sales and (2) the emissions, when manufacturing the products in question. The manufacturer can see how much emissions the customer delivery has produced in the specific machine with the used raw materials.
When building a complex Big Data solution, especially for the process industry, it is necessary to understand different theories of cost management, emission measuring, ABC calculation, and the specialties of manufacturing phases of the process industry. All of the possible data sources and how these different types of data can interrelate must be revealed. Additionally, developers must overcome the obstacles of how to reliably measure online emissions from a process with time-based databases. What is more, developers should solve the puzzle of how to refine useful data from Big Data, and how to combine all of the calculated values to one tonne or a similar comparable production unit. This makes it easier to compare mills and the product, and at the same time develop better products with lower costs and lower emissions to soil, water, and air. The companies are not always willing to disclose the exact emissions amounts to the customer delivery level, and would rather disclose on a higher level. The primary idea for most companies is to emphasize to the customers that the production is sustainable. The figures presented to customers and authorities must be reliable with low variation.

8. Future Research Views

More research and familiarization concerning algorithms development is needed, because this is necessary for building and utilizing Big Data in complicated actual production units. Big Data offers nearly unlimited possibilities to produce more information and raise knowledge about large industrial manufacturing environments for management. The non-heterogeneous data is always challenging for system developers, and the existing knowhow is still rather limited among developers working within the complex process industry sector. Extensive further research and studies, especially in higher education institutes, is needed in the future.

Author Contributions

Hämäläinen made the research design, Hämäläinen and Inkinen wrote the text jointly.

Conflicts of Interest

The authors declare no conflict of interest.

References

  1. Beer, S. Diagnosing the System; Wiley: Chichester, UK, 1988. [Google Scholar]
  2. Fogelholm, J. Cost Function Modelling in the Paper Industries; Helsinki University of Technology: Otamedia, Espoo, 2000. [Google Scholar]
  3. Xu, S.; Lu, B.; Baldea, M.; Edgar, T.F.; Wojsznis, W.; Blevins, T.; Nixon, M. Data cleaning in the process industries. Rev. Chem. Eng. 2015, 31, 453–490. [Google Scholar] [CrossRef]
  4. Fogelholm, J.; Hämäläinen, E. Economic Reporting in Different Configurations in Paper Mills. IPPTA J. 2003, 15, 37–41. [Google Scholar]
  5. Weill, P.; Woerner, S.L. Driving in an increasingly digital ecosystem. MIT Sloan Manag. Rev. 2015, 56, 27–34. [Google Scholar]
  6. Loebbeckeand, C.; Picot, A. Reflections on societal and business model transformation arising from digitization and Big Data analytics: A research agenda. J. Strateg. Inf. Syst. 2015, 24, 149–157. [Google Scholar] [CrossRef]
  7. Wang, L.; Alexander, C.A. Big Data driven supply chain management and business administration. Am. J. Econ. Bus. Adm. 2015, 7, 60–67. [Google Scholar] [CrossRef]
  8. Glock, C.H.; Taebok, K. Coordinating a supply chain with a heterogeneous vehicle fleet under greenhouse gas emissions. Int. J. Logist. Manag. 2015, 26, 494–516. [Google Scholar] [CrossRef]
  9. Gartner. Gartner’s IT Glossary. 2015. Available online: http://www.gartner.com/it-glossary/big-data (accessed on 15 January 2017).
  10. Anderson, S.W. Managing costs and cost structure throughout the value chain: Research on strategic cost management. In Handbook of Management Accounting Research; Chapman, C.S., Hopwood, A.G., Shields, M.D., Eds.; Elsevier: Oxford, UK, 2007; p. 481. [Google Scholar]
  11. Zhong, R.Y.; Newman, S.T.; Huang, G.Q.; Lan, S. Big Data for supply chain management in the service and manufacturing sectors: Challenges, opportunities, and future perspectives. Comput. Ind. Eng. 2016, 101, 572–591. [Google Scholar] [CrossRef]
  12. Wang, G.; Gunasekaran, A.; Ngai, E.W.T.; Papadopoulos, T. Big Data analytics in logistics and supply chain management: Certain investigations for research and applications. Int. J. Prod. Econ. 2016, 176, 98–110. [Google Scholar] [CrossRef]
  13. Chen, C.P.; Zhang, C.-Y. Data-intensive applications, challenges, techniques and technologies: a survey on Big Data. Inf. Sci. 2014, 275, 314–347. [Google Scholar] [CrossRef]
  14. Gil, D.; Song, I.-Y. Modelling and management of Big Data: Challenges and opportunities. Futur. Gener. Comput. Syst. 2016, 63, 96–99. [Google Scholar] [CrossRef]
  15. Chen, R.-H.; Lin, Y.; Tseng, M.-L. Multi-attributes analysis of sustainable development indicators in the construction minerals industry in China. Recour. Policy 2014, 46, 123–133. [Google Scholar] [CrossRef]
  16. Severson, K.; Chaiwatanodom, P.; Braatz, R.D. Perspectives on process monitoring of industrial systems. Annu. Rev. Control 2016, 42, 190–200. [Google Scholar] [CrossRef]
  17. Chiang, L.; Lu, B.; Castillo, I. Big Data analytics in chemical engineering. Annu. Rev. Chem. Biomol. Eng. 2017, 8, 63–85. [Google Scholar] [CrossRef] [PubMed]
  18. Reis, M.S.; Braatz, R.D.; Chiang, L.H. Big Data challenges and future research directions. Chem. Eng. Prog. 2016, 12, 46–50. [Google Scholar]
  19. Chan, H.K.; He, H.; Wang, Y.C. Green marketing and its impact on supply chain management in industrial markets. Ind. Mark. Manag. 2012, 41, 557–562. [Google Scholar] [CrossRef]
  20. Qin, S.J. Process data analytics in the era of Big Data. Aiche J. 2014, 60, 3092–3100. [Google Scholar] [CrossRef]
  21. Koetsier, J. Top 10 Marketing Automation Companies: The VB Index Report. 2014. Available online: http://venturebeat.com/2014/02/26/top-10-marketing-automation-companies-the-vb-index-report/ (accessed on 15 January 2017).
  22. Larson, E. What Sort of Car-rt-Sort Am I? Junk Mail and the Search for Self Harper’s Magazine. 1989. Available online: http://harpers.org/archive/1989/07/what-sort-of-car-rt-sort-am-i-junk-mail-and-the-search-for-self/ (accessed on 15 January 2017).
  23. European Commission (EU). Digital Single Market Big Data. 2016. Available online: https://ec.europa.eu/digital-single-market/en/big-data/ (accessed on 15 January 2017).
  24. Deming, W.E. Out of Crisis; Center for Advanced Engineering Study, The MIT Press: Cambridge, MA, USA, 1986. [Google Scholar]
  25. Gartner. Gartner Identifies the Top 10 Strategic Technology Trends for 2013. 2012. Available online: http://www.gartner.com/newsroom/id/2209615/ (accessed on 15 January 2017).
  26. Mantha, B. Five guiding principles for realizing the promise of Big Data. Bus. Intell. J. 2014, 11, 8–11. [Google Scholar]
  27. Ala-Harja, H.; Helo, P. Green supply chain decisions—Case-based performance analysis from the food industry. Transp. Res. Part E Logist. Transp. Rev. 2015, 74, 11–21. [Google Scholar] [CrossRef]
  28. Zhu, Q.H.; Sarkis, J. The moderating effect of institutional pressure on emergent green supply chain practices. Int. J. Prod. Res. 2007, 45, 4333–4355. [Google Scholar] [CrossRef]
  29. Vachon, S.; Klassen, R.D. Extending green practices across supply chain: Impact of upstream and downstream integration. J. Oper. Prod. Manag. 2006, 26, 795–821. [Google Scholar] [CrossRef]
  30. Van der Vorst, J.G.A.J.; Beulens, A.J.M.; De Wit, W.; Van Beek, P. Supply chain management in food chains: Improving performance by reducing uncertainty. Int. Trans. Oper. Res. 1998, 5, 487–499. [Google Scholar] [CrossRef]
  31. Wald, A.; Schneider, C.; Schulze, M.; Marfleet, F. A study on the status quo, current trends, and success factors in cost management. Cost Manag. 2013, 27, 28–38. [Google Scholar]
  32. Wald, A.; Marfleet, F.; Schneider, C.; Gorner, A.; Gleich, R. The Hidden Potential Overhead Cost Reduction: A Study in European Countries. Cost Manag. 2013, 27, 28–38. [Google Scholar]
  33. Williamson, P. Cost Innovation: Preparing for a “Value-for-Money” revolution. Long Range Plan. 2010, 43, 343–353. [Google Scholar] [CrossRef]
  34. Rogozhin, A.; Gallaher, M.; Helfand, G.; McManus, M. Using indirect cost multipliers to estimate the total cost of adding new technology in the automobile industry. Int. J. Prod. Econ. 2010, 124, 360–368. [Google Scholar] [CrossRef]
  35. Reiner, G.; Trcka, M. Customized supply chain design: Problems and alternatives for a production company in the food industry. A simulation based analysis. Int. J. Prod. Econ. 2004, 89, 217–229. [Google Scholar] [CrossRef]
  36. Kaplan, R.S.; Anderson, S.R. Time-Driven Activity-Based Costing: A Simpler and More Powerful Path to Higher Profits; Harvard Business School Press: Boston, MA, USA, 2007. [Google Scholar]
  37. Cokins, G. Activity Based Costing: Optional or Required? AACE International Transactions: New Orleans, LA, USA, 2002. [Google Scholar]
  38. Hämäläinen, E. Economic Geographical Analysis of the Finnish Paper Industry; Annales Universitatis Turkuensis: Turku, Finland, 2011. [Google Scholar]
  39. Krupnicki, M.; Tyson, T. Using ABC to determine the cost of servicing customers. Manag. Account. 1997, 79, 40–46. [Google Scholar]
  40. Cooper, R.; Kaplan, R.S. Cost & Effect: Using Integrated Cost Systems to Drive Profitability and Performance; Harvard Business School Press: Boston, MA, USA, 1997. [Google Scholar]
  41. Zeller, T.L.; Kublank, D.R.; Makris, P.G. How art.com Uses ABC to Succeed. Strateg. Financ. 2001, 82, 1–6. [Google Scholar]
  42. Cooper, R. Cost classification in unit-based and activity-based manufacturing cost systems. J. Cost Manag. 1990, 4, 4–14. [Google Scholar]
  43. Askarany, D.; Smith, M.; Yazdifar, H. Technological innovations, activity based costing and satisfaction. J. Account. Bus. Manag. 2007, 14, 53–63. [Google Scholar]
  44. Chopra, S.; Sodhi, M.S. Managing risk to avoid supply-chain breakdown. MIT Sloan Manag. Rev. 2004, 46, 53–61. [Google Scholar]
  45. Wu, K.-J.; Liao, C.-J.; Tseng, M.-L.; Lim, M.K.; Hu, J.; Tan, K. Toward sustainability: Using Big Data to explore the decisive attributes of supply chain risks and uncertainties. J. Clean. Prod. 2016, 142 Pt 2, 663–676. [Google Scholar] [CrossRef]
  46. Belaud, J.-P.; Negny, S.; Dupros, F.; Michéa, D.; Vautrin, B. Collaborative simulation and scientific Big Data analysis: Illustrations for sustainability in natural hazards management and chemical process engineering. Comput. Ind. 2014, 65, 521–535. [Google Scholar] [CrossRef]
  47. Esteves, A.M.; Franks, D.; Vanclay, F. Social impact assessment: The state of the art, Impact Assessment. Proj. Apprais. 2012, 30, 34–42. [Google Scholar] [CrossRef]
  48. Marnika, E.; Christodoulou, E.; Xenidis, A. Sustainable development indicators for mining sites in protected areas: Tool development, ranking, and scoring of potential environmental impacts and assesment of management scenarios. J. Clean. Prod. 2015, 191, 59–70. [Google Scholar] [CrossRef]
  49. Rahdari, A.H.; Anvary Rostamy, A.A. Designing a general set of sustainability indicators at the corporate level. J. Clean. Prod. 2015, 108, 757–771. [Google Scholar] [CrossRef]
  50. Sroufe, R. Effects of environmental management systems on environmental management practices and operations. Prod. Oper. Manag. 2003, 12, 416–431. [Google Scholar] [CrossRef]
  51. Darnall, N.; Jolley, G.; Handfield, R. Environmental management systems and green supply chain management: Complements for sustainability? Bus. Strateg. Environ. 2008, 17, 30–45. [Google Scholar] [CrossRef]
  52. Feng, T.; Cai, D.; Wang, D.; Zhang, X. Environmental management systems and financial performance; The joint effect of switching cost and competitive intensity. J. Clean. Prod. 2016, 113, 781–791. [Google Scholar] [CrossRef]
  53. Hämäläinen, E. Estimated impacts of the sulphur directive on the Nordic industry. Eur. Transp. Res. Rev. 2015, 7, 13. [Google Scholar] [CrossRef]
  54. Hämäläinen, E. Can slow steaming lower cost impacts of sulphur directive—Shippers’ perspective. World Rev. Int. Transp. Res. 2014, 5, 59–79. [Google Scholar] [CrossRef]
  55. Hatch, M.J.; Cunliffe, A.L. Organisation Theory: Modern, Symbolic and Postmodern Perspectives; Oxford University Press: Oxford, UK, 2006. [Google Scholar]
  56. Henri, J.-F.; Boiral, O.; Roy, M.-J. Strategic costs management and performance. The case of environmental costs. Br. Account. Rev. 2016, 48, 269–282. [Google Scholar] [CrossRef]
  57. Allenby, B.R. Industrial Ecology: Policy Framework and Implementation; Prentice-Hall: Upper Saddle River, NJ, USA, 1999. [Google Scholar]
  58. Graedel, T.; Allenby, B.R. Industrial Ecology; Prentice-Hall: Enlewood Cliffs, CA, USA, 1995. [Google Scholar]
  59. Parker, L.D. Environmental Costing: An Exploratory Examination Melbourne; VIC A.S. O C.P. Accountants: Melbourne, Australia, 1999. [Google Scholar]
  60. Pizzini, M.J. The relation between costs system design, manager’s evaluation, of the relevance and usefulness of cost data, and financial performance: an empirical study of US hospitals. Account. Organ. Soc. 2006, 31, 179–210. [Google Scholar] [CrossRef]
  61. Scariatelli, A. How to Breathe Easier in China’s Most Polluted Cities. 2014. Available online: http://www.echinacities.com/expat-corner/How-to-Breathe-Easier-in-Chinas-Most-Polluted-Cities/ (accessed on 15 January 2017).
  62. De Villiers, C.; Rouse, P.; Kerr, J. A new conceptual model of influences driving sustainability based on case evidence of the integration of corporate sustainability management control and reporting. J. Clean. Prod. 2016, 136 Pt A, 78–85. [Google Scholar] [CrossRef]
  63. Stacchezzini, R.; Melloni, G.; Lai, A. Sustainability management and reporting: The role of integrated reporting for communicating corporate sustainability management. J. Clean. Prod. 2016, 136 Pt A, 102–110. [Google Scholar] [CrossRef]
  64. Talvivaara. Talvivaara Gypsum Pond Leakage Has Been Stemmed. 2013. Available online: http://www.talvivaara.com/media-en/Talvivaara_announcements/stock_exchange_releases/stock_exchange_release/t=talvivaara-gypsum-pond-leakage/id=32889934/ (accessed on 15 January 2017).
Figure 1. An integrated Big Data system in the process industry.
Processes 05 00064 g001
Figure 2. Connections between investments, sales, raw material mix, and consumption, manufacturing operations, environment, and sustainability.
Processes 05 00064 g002
Figure 3. Pulp flow measurements are performed at intervals.
Processes 05 00064 g003
Figure 4. Example of a machine reel-based consumption measuring, cost calculation, and reporting tool.
Processes 05 00064 g004
Figure 5. A report example of emissions to water and air.
Processes 05 00064 g005aProcesses 05 00064 g005b
Figure 6. Two separate phases in the building of a solution for factory/mill-wide cost and environmental reporting.
Processes 05 00064 g006

