Article

Comparison of Polymer Networks Synthesized by Conventional Free Radical and RAFT Copolymerization Processes in Supercritical Carbon Dioxide

by
Patricia Pérez-Salinas
1,
Gabriel Jaramillo-Soto
1,
Alberto Rosas-Aburto
1,
Humberto Vázquez-Torres
2,
María Josefa Bernad-Bernad
3,
Ángel Licea-Claverie
4 and
Eduardo Vivaldo-Lima
1,*
1
Facultad de Química, Departamento de Ingeniería Química, Universidad Nacional Autónoma de México, Ciudad de México 04510, Mexico
2
Departamento de Física, Universidad Autónoma Metropolitana-Unidad Iztapalapa, Av. San Rafael Atlixco No. 186, Col. Vicentina, Ciudad de México 09340, Mexico
3
Facultad de Química, Departamento de Farmacia, Universidad Nacional Autónoma de México, Ciudad de México 04510, Mexico
4
Instituto Tecnológico de Tijuana, Centro de Graduados e Investigación en Química, A.P. 1166, Tijuana 22000, B.C., Mexico
*
Author to whom correspondence should be addressed.
Processes 2017, 5(2), 26; https://doi.org/10.3390/pr5020026
Submission received: 3 April 2017 / Revised: 27 April 2017 / Accepted: 4 May 2017 / Published: 9 May 2017
(This article belongs to the Special Issue Water Soluble Polymers)

Abstract

:
There is a debate in the literature on whether or not polymer networks synthesized by reversible deactivation radical polymerization (RDRP) processes, such as reversible addition-fragmentation radical transfer (RAFT) copolymerization of vinyl/divinyl monomers, are less heterogeneous than those synthesized by conventional free radical copolymerization (FRP). In this contribution, the syntheses by FRP and RAFT of hydrogels based on 2-hydroxyethylene methacrylate (HEMA) and ethylene glycol dimethacrylate (EGDMA) in supercritical carbon dioxide (scCO2), using Krytox 157 FSL as the dispersing agent, and the properties of the materials produced, are compared. The materials were characterized by differential scanning calorimetry (DSC), swelling index (SI), infrared spectroscopy (FTIR) and scanning electron microscopy (SEM). Studies on ciprofloxacin loading and release rate from hydrogels were also carried out. The combined results show that the hydrogels synthesized by FRP and RAFT are significantly different, with apparently less heterogeneity present in the materials synthesized by RAFT copolymerization. A ratio of experimental (Mcexp) to theoretical (Mctheo) molecular weight between crosslinks was established as a quantitative tool to assess the degree of heterogeneity of a polymer network.

Graphical Abstract

1. Introduction

One of the most challenging areas of polymer science and engineering is the synthesis, characterization and development of applications of polymer networks [1] (pp. 145–319). The reason for this is the difficulty in dissolving, processing or manipulating the polymer network after its synthesis. Many authors reported their way to analyze and handle these materials in their respective fields, trying to understand their behavior [1,2,3,4,5].
Polymer science is currently diversified into different fields. Many researchers focus their research on controlling the structure and molecular weight of polymer molecules synthesized using reversible deactivation radical polymerization (RDRP) techniques [6,7,8,9]. Other authors, including ourselves, have combined the use of RDRP with the utilization of supercritical fluids, mainly carbon dioxide, as a unique solvent in polymer synthesis [5,10,11,12,13,14].
Some of the advantages of using compressed fluids in organic synthesis, and specifically supercritical carbon dioxide, include their innocuousness, their easiness of removal and recovery and the fact that they are inexpensive and easy to acquire. On the other hand, the disadvantages for their use include the initial high cost of investment in equipment, since reactors and other process equipment should withstand moderate to high pressures and moderate to high temperatures. Although there is information available on the solubility of chemical compounds in supercritical carbon dioxide [15,16], solubility data for some monomers, such as HEMA or EGDMA, and their polymers, are not available in the open literature.
There are few reports on the use of compressed fluids in the synthesis of polymer networks using RDRP controllers. The information available about the properties and performance of those materials is rather limited because the characterization of polymer networks is not straightforward. One specific aspect about the characterization of polymer networks synthesized by copolymerization of vinyl/divinyl monomers that remains unsolved is the determination of their heterogeneity, understood as the regioregularity of polymer chains between crosslinks. Several approaches have been proposed for this purpose, but the combined use of experimental data and theoretical calculations seems to be the most effective way to understand their behavior. One of such approaches is the calculation of the mean molecular weight between crosslinks from swelling index data, using the Flory–Rehner equation [2,17,18,19].
Working with supercritical fluids also requires the knowledge of the thermodynamic aspects of the reacting mixture, such as the knowledge or construction of a pressure vs. temperature (P vs. T) diagram. This diagram is built considering the actual composition of the reacting mixture, thus generating a curve that indicates which zone is related to liquid-vapor equilibrium or to supercritical conditions, where all components are in one phase and liquid and vapor densities are the same.
In this contribution, we analyze the issue of the reduced heterogeneity of polymer networks synthesized by RAFT copolymerization of vinyl/divinyl monomers in supercritical carbon dioxide (scCO2) by combining the information obtained from different characterization techniques: DSC, measurement of the swelling index (SI), FTIR, SEM and loading/controlled release of ciprofloxacin. A pressure-temperature thermodynamic diagram for our specific reacting mixture (monomers, initiator, dispersing agent and solvent), constructed with the ASPEN® software, was used in our analysis of the results. The heterogeneity of the polymer networks is evaluated with the use of a polymer network homogeneity parameter (H), defined as the ratio of theoretical (Mctheo) to experimental (Mcexp) molecular weights between crosslinks.

2. Materials and Methods

2.1. Reagents

HEMA (Sigma-Aldrich Química, S.L., Toluca, Mexico) and EGDMA (Sigma-Aldrich) were distilled under vacuum. Azobisisobutyronitrile (AIBN) (Akzo Nobel Chemicals S.A. de C.V., Los Reyes La Paz, Mexico) was recrystallized twice from methanol. Carbon dioxide (Praxair, 99.99% purity) was used as received. 4-Cyano-4-(dodecylsulfanylthiocarbonyl) sulfanyl pentanoic acid (RAFT agent) was synthesized following a procedure described previously [11]. Krytox 157 FSL (DuPont), referred to as Krytox in the remainder of this paper, was used as received.

2.2. Polymerization System

Polymerizations in scCO2 were conducted in a 38-mL high pressure view cell, equipped with one frontal and two lateral sapphire windows (from Crystal Systems Inc., Salem, MA, USA), which allowed visual observation of the reaction mixture. A 260 dual syringe pump system (from Teledyne ISCO) was used to handle the CO2 and bring it to supercritical conditions. The reactor was charged with monomer, initiator and stabilizer and a magnetic stirrer bar. Then, it was purged with a slow flow of CO2 and pressurized with CO2 until a given pressure, lower than the desired reaction pressure. Next, the reactor was placed into a warm bath and heated to the desired reaction temperature. Once this temperature was reached and controlled, pressure was increased to the desired reaction pressure by slowly loading additional CO2. Reactions were carried out at 65 °C and 172.4 bar. Further information about the reaction system is found elsewhere [11].
Samples were classified into two main groups: those synthesized by FRP and the ones synthesized by RAFT copolymerization. Half of the samples contained stabilizer (Krytox 157 FSL, 5 wt%), and the other half were synthesized without it. All samples were run by duplicate, as shown in Table 1. Therefore, the following pairs are duplicates: G311 and G313, G312 and G314, G315 and G317, as well as G316 and G318.

2.3. Polymer Network Characterization

Pendant double bond consumption was measured by FTIR using the area for carboxylic groups as an internal reference. Polymer network samples were powdered and mixed with potassium bromide (KBr), compressed and analyzed in an FTIR Perkin Elmer spectrometer.
Glass transition temperature (Tg) was measured by modulated differential scanning calorimetry (MDSC). Besides Tg, some of the parameters obtained during the characterization experiment (e.g., width and slope of a modulated heat flow versus derivative modulated temperature—Lissajous figure) can in principle correlate with the crosslinking density distribution of the polymer network. A TA Instruments Model 2920 DSC apparatus was employed. For these analyses, 10 mg of sample were placed into the aluminum pan and covered with the corresponding lid. Three cycles were programmed in the DSC. In the first and third cycles, the sample was heated from −40 °C up to 220 °C at a 10 °C/min rate. In the second cycle, the sample was chilled from 220 °C up to −40 °C at a constant cooling rate of 10 °C/ min. The results for Tg and energy from the reversible heat flow chart obtained during the third cycle were selected for reporting. These results are in principle more accurate and free of any interference related to molecular arrangements or sample preparation than the ones obtained from the other cycles [3,4].
Swelling index and gel fraction after 48 h of contact time with water were measured for selected samples. For swelling index tests, 15 mg of polymer network were placed into a previously weighted test tube. Both tube and sample were weighted again. Fifty milliliters of solvent were poured into the tube with the sample and remained in contact for specific times. Some samples remained immersed during 48 h. After each time, samples were removed from solvent and centrifuged at 15,000 rpm. Solvent was decanted, and the tubes with swelled sample were weighted. Swelling index was calculated from the difference between the weight of swelled sample with tube and the weight of the tube, divided by the weight of the tube with dried sample minus the weight of the tube. Measurement of gel content follows almost the same procedure. However, instead of decanting the solvent, it was completely removed, and the sample with the tube was dried at 80 °C for 48 h and weighed. Gel content was calculated by subtracting the weight of dried sample in the tube from the weight of the tube and dividing by the weight of the original sample.
In the case of ciprofloxacin loading and desorption tests, 15 mg of polymer network were placed into a flask containing 5 mL of a solution 0.02 M of ciprofloxacin in water. Samples were shaken for 400 min. Small aliquots of the solution were taken periodically. They were analyzed by UV-visible spectroscopy (λ = 276.2 nm) to determine antibiotic concentration. The polymer sample was then immersed in 3 mL of distillate water using a Franz cell. Donating-receiving parts were separated using a Millipore® HNWP 0.45-µm membrane. Samples were taken from the receiving part during 24 h. Aliquots were analyzed in a UV-visible spectrophotometer (λ = 276.2 nm). Desorption kinetics charts were built from these data.
Six polymer network samples of 3 ± 0.2 mg each were placed into flasks with different concentrations of ciprofloxacin (5 mL of water in each sample): 1 × 10⁻⁵, 3 × 10⁻⁵, 6 × 10⁻⁵, 8 × 10⁻⁵, 2 × 10⁻⁴ and 4 × 10⁻⁴ M. Each vial was shaken for 24 h. The samples were then filtrated. The remaining solution was analyzed in a UV-visible spectrophotometer at λ = 276.2 nm. Isotherm charts were built from these data.
SEM imaging was used to observe the morphologies of the synthesized polymer networks. A JEOL 5900-LV microscope was used. Samples were powdered and placed over a carbon patch for SEM analyses. Image-Pro Plus was used to analyze the particles.

2.4. Estimation of Mc from the Flory–Rehner Equation

Average molecular weight between crosslinks (Mc) was estimated based on experimental data of swelling index measured for each hydrogel, according to Equation (1). ρ and ve in Equation (1) are polymer network density and the amount of crosslinks per volume unit. The amount of crosslinks per volume unit is calculated using Equation (2), where Vr, V1 and χ are the volume fraction of the polymer in the swelled gel, the molar volume of solvent and the Flory interaction parameter, respectively. Vr and χ are calculated using Equations (3) and (4), respectively. SI and d in Equation (3) are the swelling index and solvent density, respectively [17,18,19].
M c = ρ v e
v e = [ ln ( 1 V r ) + V r + χ V r 2 ] [ V 1 ( V r 1 3 V r 2 ) ]
V r = [ 1 + ( S I 1 ) ρ d ] 1
χ = 0.455 0.155 V r
The values of Mc obtained from Equation (1), using experimental values of the swelling index, are denoted as Mcexp in this paper. A theoretical value of Mc can be calculated from the ratio of EGDMA to HEMA concentrations multiplied by the molecular weight of the average repeating unit. At the initial conditions and considering total conversion, Mctheo = 2603 g/mol.
In this paper, we propose a polymer network homogeneity parameter (H) defined as the ratio of Mctheo to Mcexp, as shown in Equation (5), to provide a quantitative indicator of the degree of homogeneity of the crosslink density distribution of polymer networks. If the experimental value of Mc approaches the theoretical value of Mc, H approaches unity. This means that the polymer network is almost like a homogeneous distribution of HEMA molecules referred to EGDMA molecules, in terms of chain length between crosslinks. The range of values of H can be higher or lower than unity. The reason for this is because the chain length between crosslinks is an average value calculated from a bulk test (swelling index), so the behavior exhibited by the bulk of the network will determine the value of H. Values below unity mean that hydrogels behave like highly crosslinked networks. On the contrary, values above unity mean that hydrogels behave as having long chains between crosslinks.
H = M c t h e o M c e x p

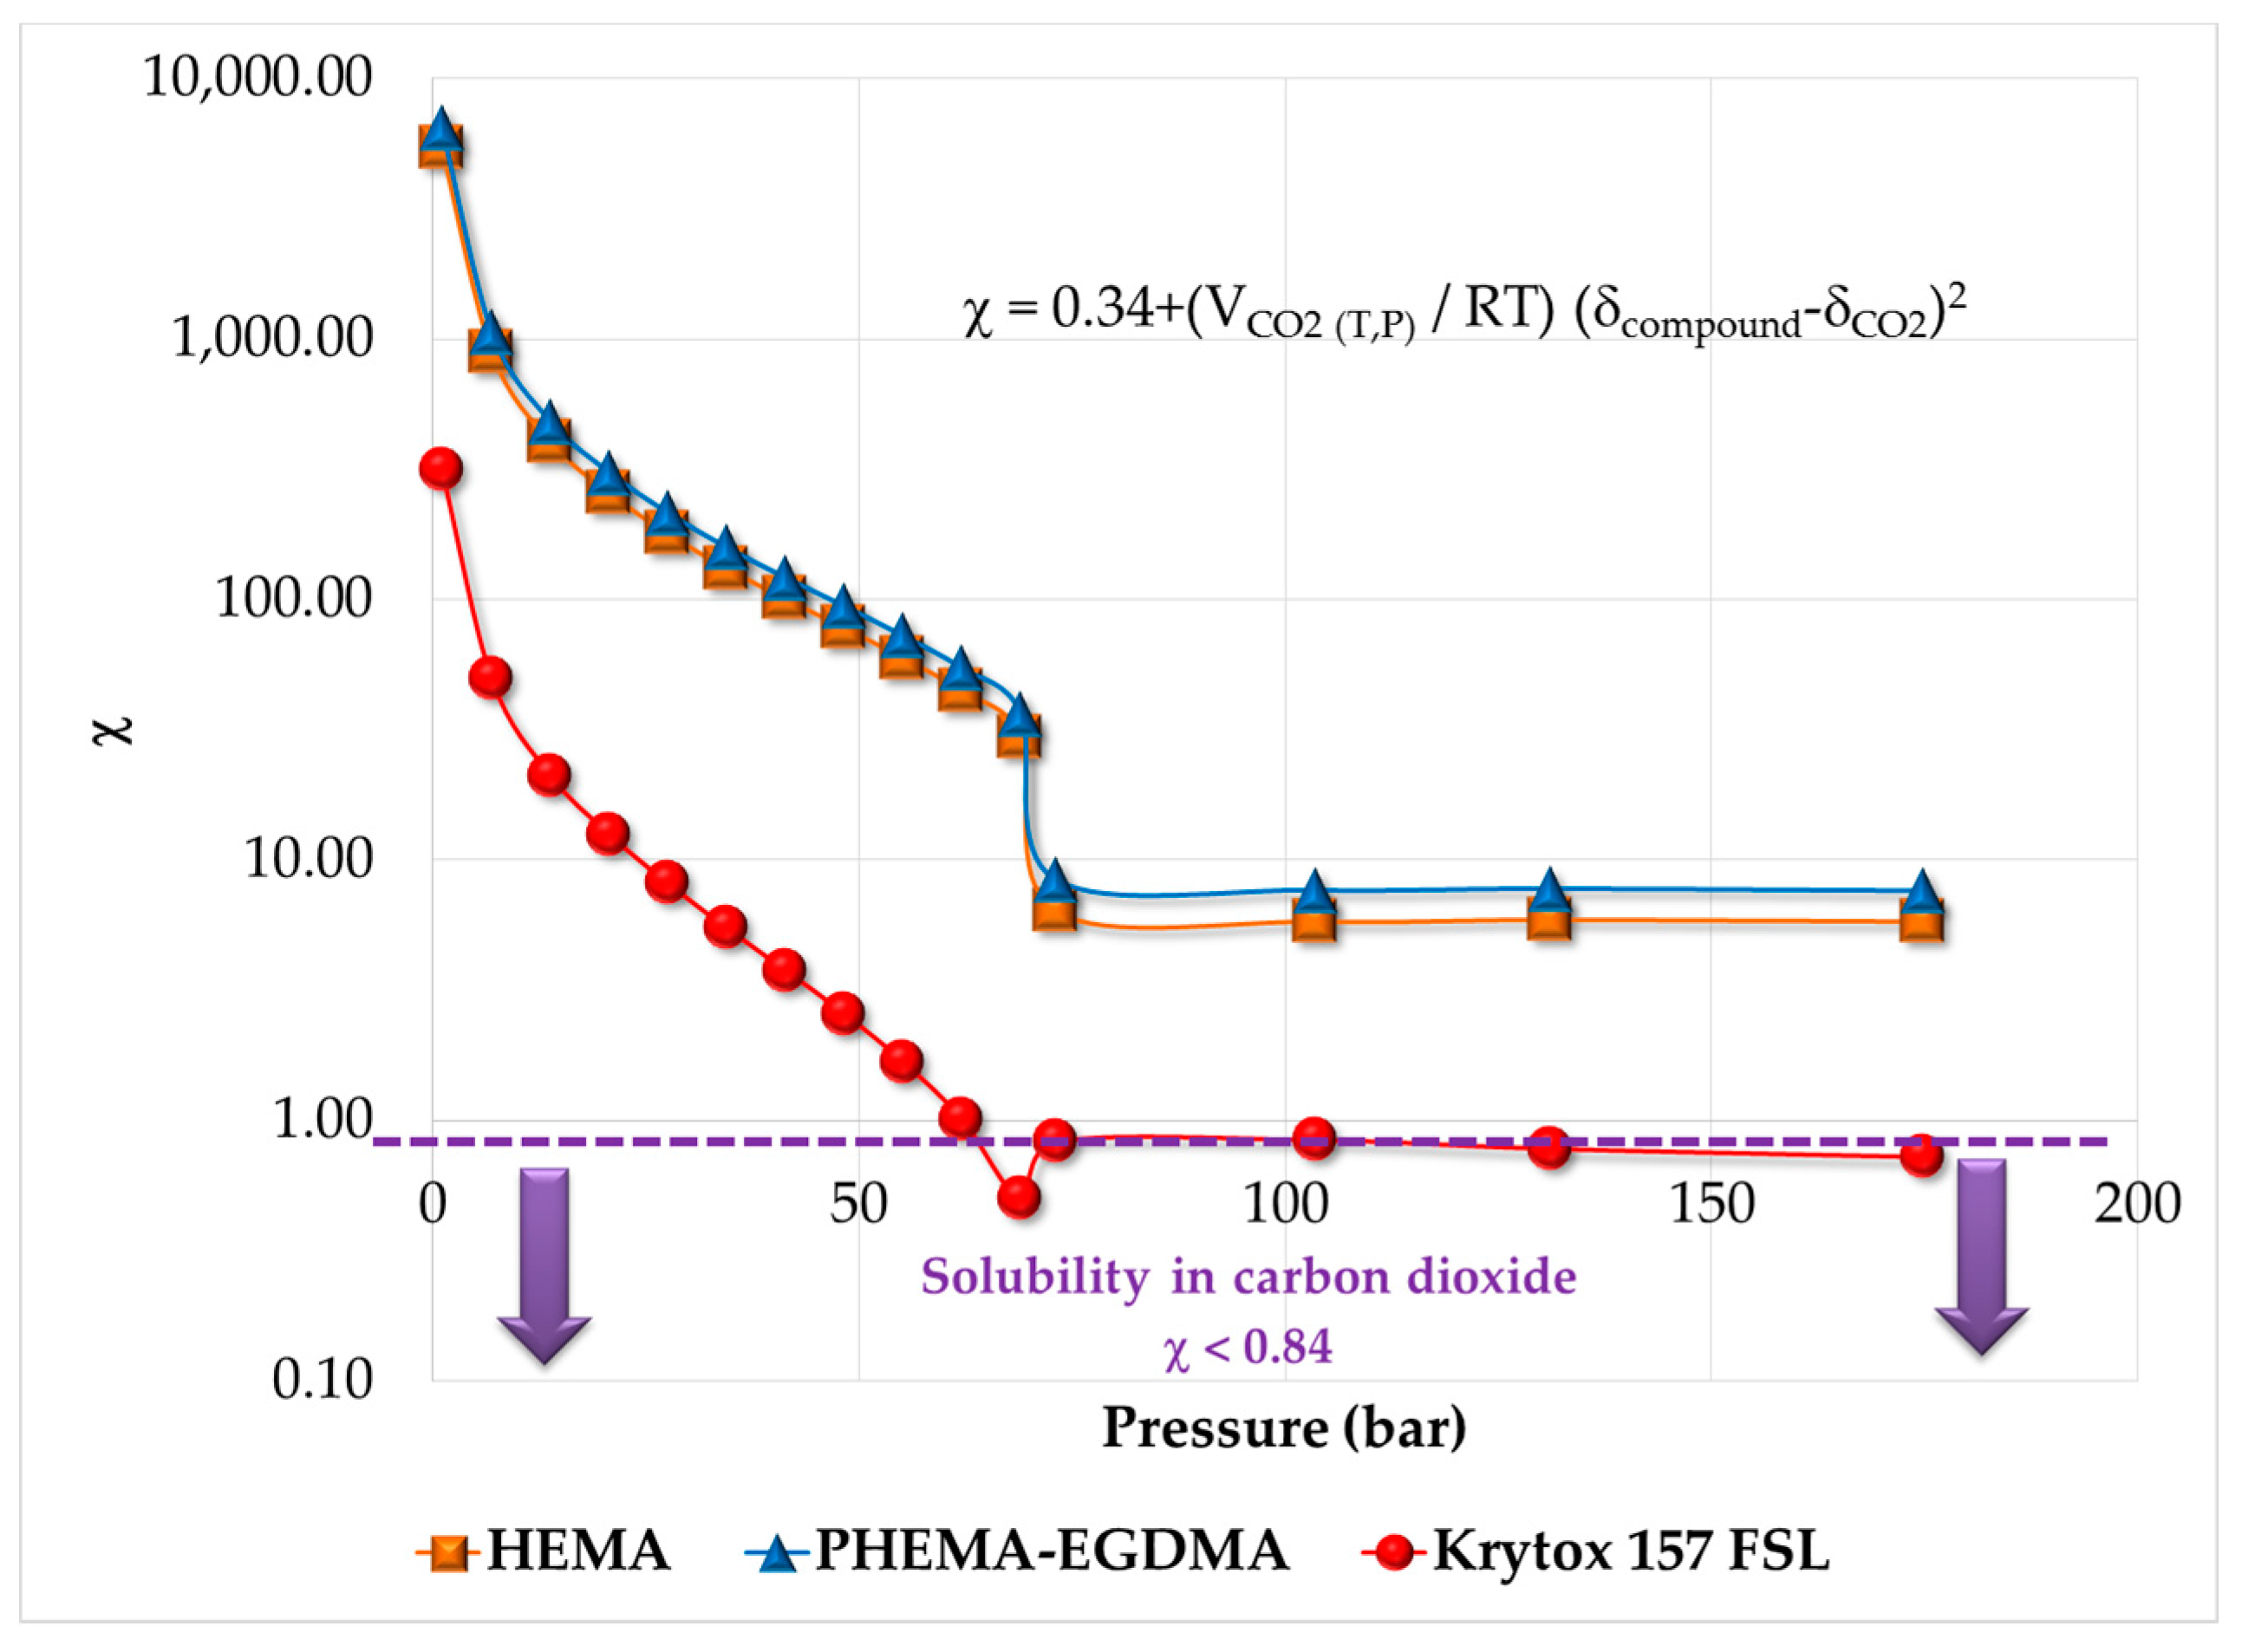
2.5. Thermodynamic Analysis, Estimation of Solubility Parameters of Components and Solubility in Supercritical CO2

Although the heterogeneity of polymer networks can be in principle reduced by using RDRP in scCO2, other thermodynamic variables, such as the phase where the reaction takes place (liquid, vapor or supercritical) or the solubility of the components participating in the reaction, may also play a role in the structures obtained. For instance, if supercritical conditions are reached inside the reactor, all of the components remain as one phase, until the first molecule of polymer appears. In contrast, if two phases, liquid and vapor, are present from the beginning, the polymerization will proceed in both phases, and molecular weight development will depend on the kinetic behavior in each phase, thus obtaining two polymer network populations, irrespective of the fact that an RAFT agent is present in the formulation. Since most polymers are insoluble in scCO2, it is important to include a dispersing agent soluble in scCO2 in the formulation, such as Krytox.
Therefore, it is important to evaluate the solubility of components, including Krytox, in supercritical carbon dioxide. The solubility parameter of CO2 (δCO2(T,P)) was taken from the literature [20,21,22], and its molar volume (VCO2(T,P)) was calculated using an equation of state [21,22]. The solubility parameters for HEMA (25 (J/cm3)1/2) and Krytox (6.02 (J/cm3)1/2), were taken from the literature [20,23]. In the case of the polymer network, δsolute (26.6 (J/cm3)1/2) was estimated using group contribution theory [24]. One criterion to determine if a solute is soluble in a solvent is to calculate its Flory interaction parameter, χ, using Equation (5); if χ < 0.84, then the component should be soluble in CO2 at the given T and P [24].
χ = 0.34 + ( V C O 2 ( T , P ) R T ) ​  ( δ S o l u t e δ C O 2 ( T , P ) ) 2
VCO2(T,P) in Equation (5) is CO2 molar volume (cm3/mol) at the given temperature and pressure; R is the ideal gas constant; T is temperature; δsolute is solubility parameter of the compound, monomer or polymer, to be dispersed in scCO2 (J/cm3)1/2.
A phase diagram (P versus T) for the reactive system (13.43% HEMA, 1.78% EGDMA, 0.07% AIBN and 84.72% CO2, on a weight basis) was created by us using ASPEN Plus (Version 8.8) [25]. Calculations were carried out using the Peng–Robinson equation of state. The processing/reaction path of the reactive mixture was traced on the P-T diagram.

3. Results and Discussion

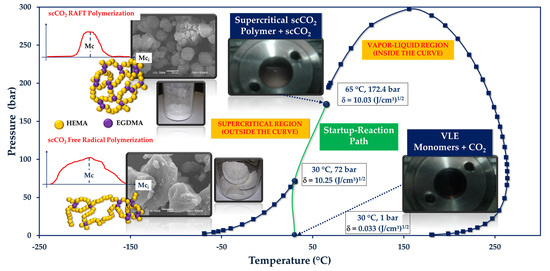
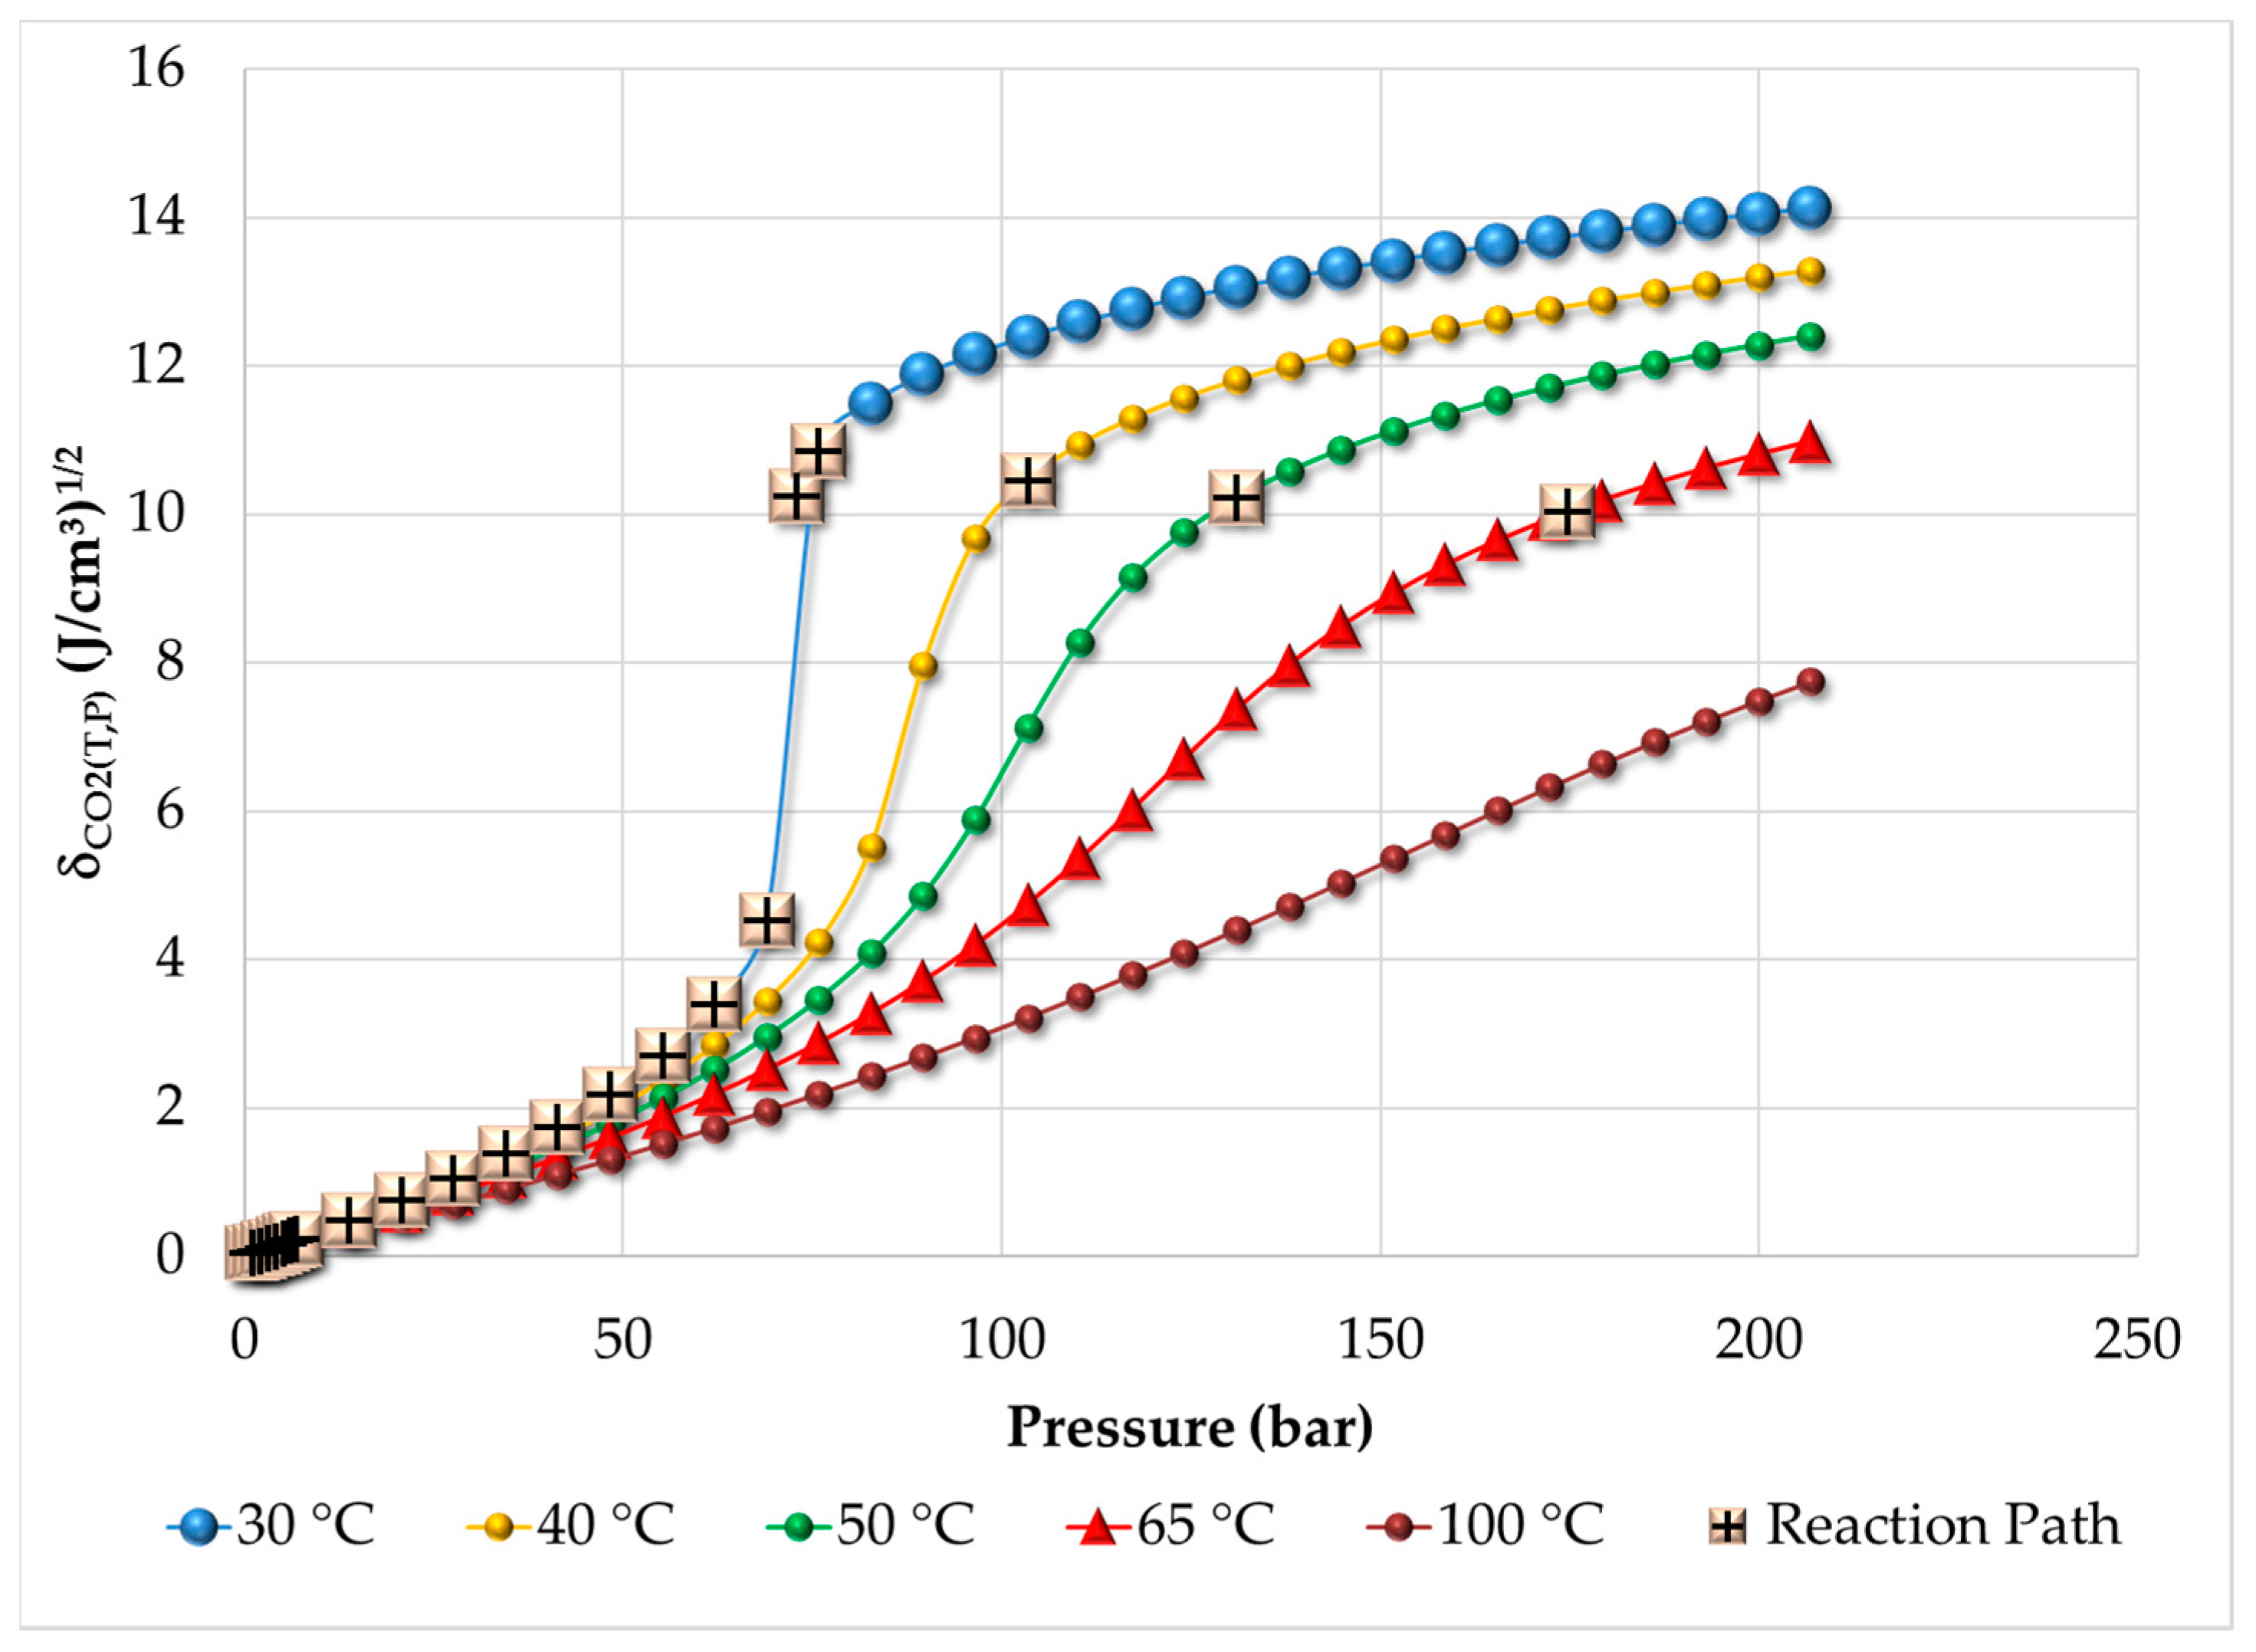
3.1. Thermodynamic Behavior of the Reacting Mixture

Figure 1 shows a P vs. T thermodynamic diagram generated with ASPEN Plus for the reacting mixture. The path followed from initial to reacting conditions is shown in the diagram. At the beginning of the reaction, when the reactor was loaded, there was a vapor-liquid mixture at 30 °C and 1 bar (see the black point shown inside the curve, in Figure 1). As pressure increased up to 72 bars, at 30 °C, the mixture approached the vapor-liquid border, but it still remained a vapor-liquid mixture. When the reactor reached the final reacting conditions, 65 °C and 172.4 bars, the mixture was in the supercritical region (outside the curve described in the chart). However, it is observed in Figure 1 that the reactor operated very close to the borderline between vapor-liquid (inside the curve) and supercritical (outside the curve) regions, so that any small change in T or P could shift the equilibrium to the vapor-liquid region, thus having two-phase polymerization even before polymer started phase separating.
It is also observed in Figure 1 that the solubility parameter for CO2 changes significantly along the reaction path. At the beginning, δCO2 was too small (0.033 (J/cm3)1/2) because CO2 was in the gas phase, and its density and molar volume were also small. However, when pressure increased from one to 72 bars (less than two orders of magnitude), δCO2 increased three orders of magnitude (reaching a value of δCO2 = 10.25 (J/cm3)1/2). This was the most significant increase in δCO2, since a further increase in pressure by one order of magnitude (from 72 to 172.4 bars) did not significantly changed δCO2 (δCO2 = 10.03 (J/cm3)1/2) at the final reacting conditions.
A plot of calculated δCO2 versus pressure, using an equation of state [21,22], is shown in Figure 2. The calculations were carried out by us. It is observed that large changes in δCO2 are obtained when pressure is increased following an isothermal route, whereas a small reduction occurs if an isochoric route is used. Also shown in Figure 2 is the process/reaction path followed by the reacting mixture. The major change in the value of δCO2 occurs at approximately 72 bar. At 68 bar and 30 °C δCO2 = 4.54 (J/cm3)1/2, but at 72 bar, δCO2 = 10.25 (J/cm3)1/2. The reason is that 30 °C and 72 bar is close to the critical point of CO2, which occurs at 31 °C and 73.8 bar. At the critical point, the densities of gas and liquid CO2 are the same. As density increases, CO2 works as a true solvent. The reaction mixture can be considered dispersed in CO2 beyond this point. However, only when the mixture achieves 65 °C and 172.4 bars, it can be considered as one phase at supercritical conditions.
As explained before, the solubility in CO2 of the components of the reacting mixture is important for the performance of the polymerization and for the heterogeneity of the produced polymer network. The solubilities of the components of the reacting mixture can be estimated from Flory’s interaction parameter, χ, calculated using Equation (6). As mentioned earlier, if χ > 0.84, then the solute is soluble in scCO2 [24].
The solubility parameters for monomer and polymer network do not change significantly within the ranges of temperatures and pressures experienced by the reacting mixture. δHEMA = 25 (J/cm3)1/2, δKrytox = 6.02 (J/cm3)1/2 and δPHEMA-EGDMA = 27.3 (J/cm3)1/2. The data used for estimation of δP(HEMA-EGDMA) using Fedor’s method [24] are summarized in Table 2.
Figure 3 shows a plot of Flory interaction parameter, χ, versus pressure, for HEMA, poly(HEMA-co-EDGMA) and Krytox 157 FSL. It is observed in Figure 3 that except for Krytox 157 FSL (above 72 bar, which is CO2 critical pressure), all of the components of the reacting mixture are insoluble in CO2 (χ > 0.84). Krytox 157 FSL is assumed to act as a stabilizer, encapsulating the monomers, thus allowing the formation of a homogeneous initial dispersion at supercritical conditions.

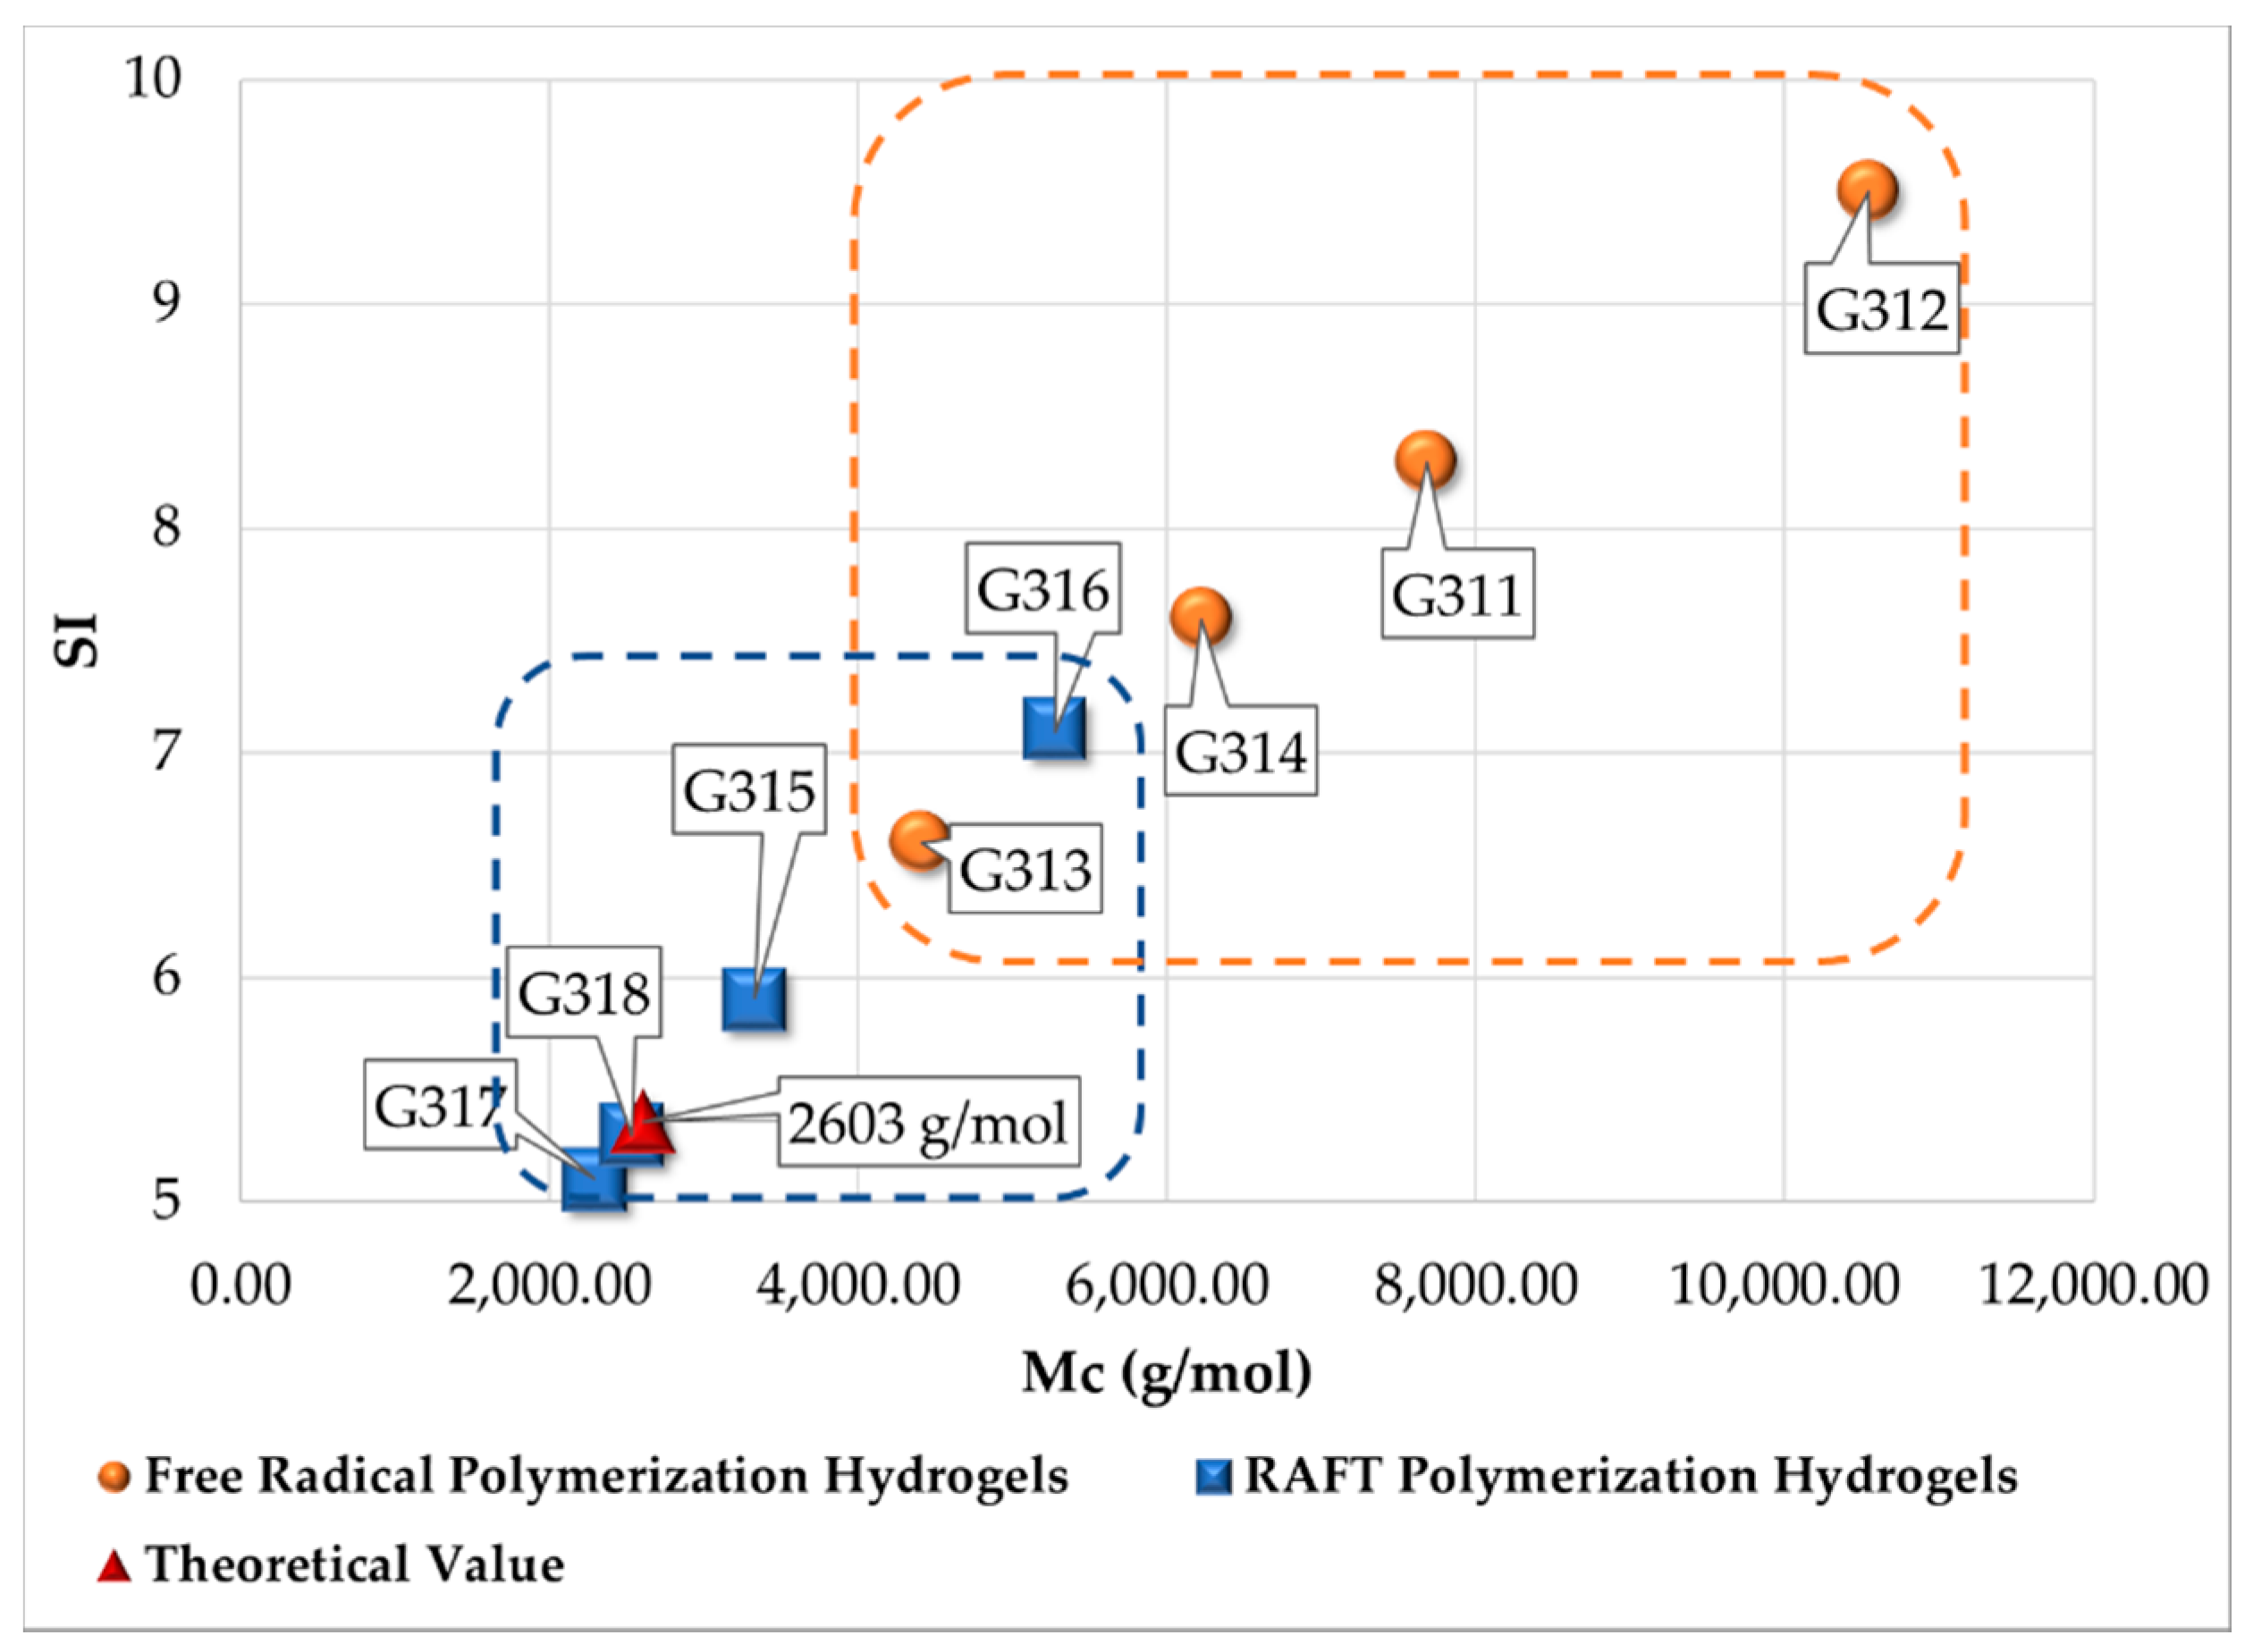
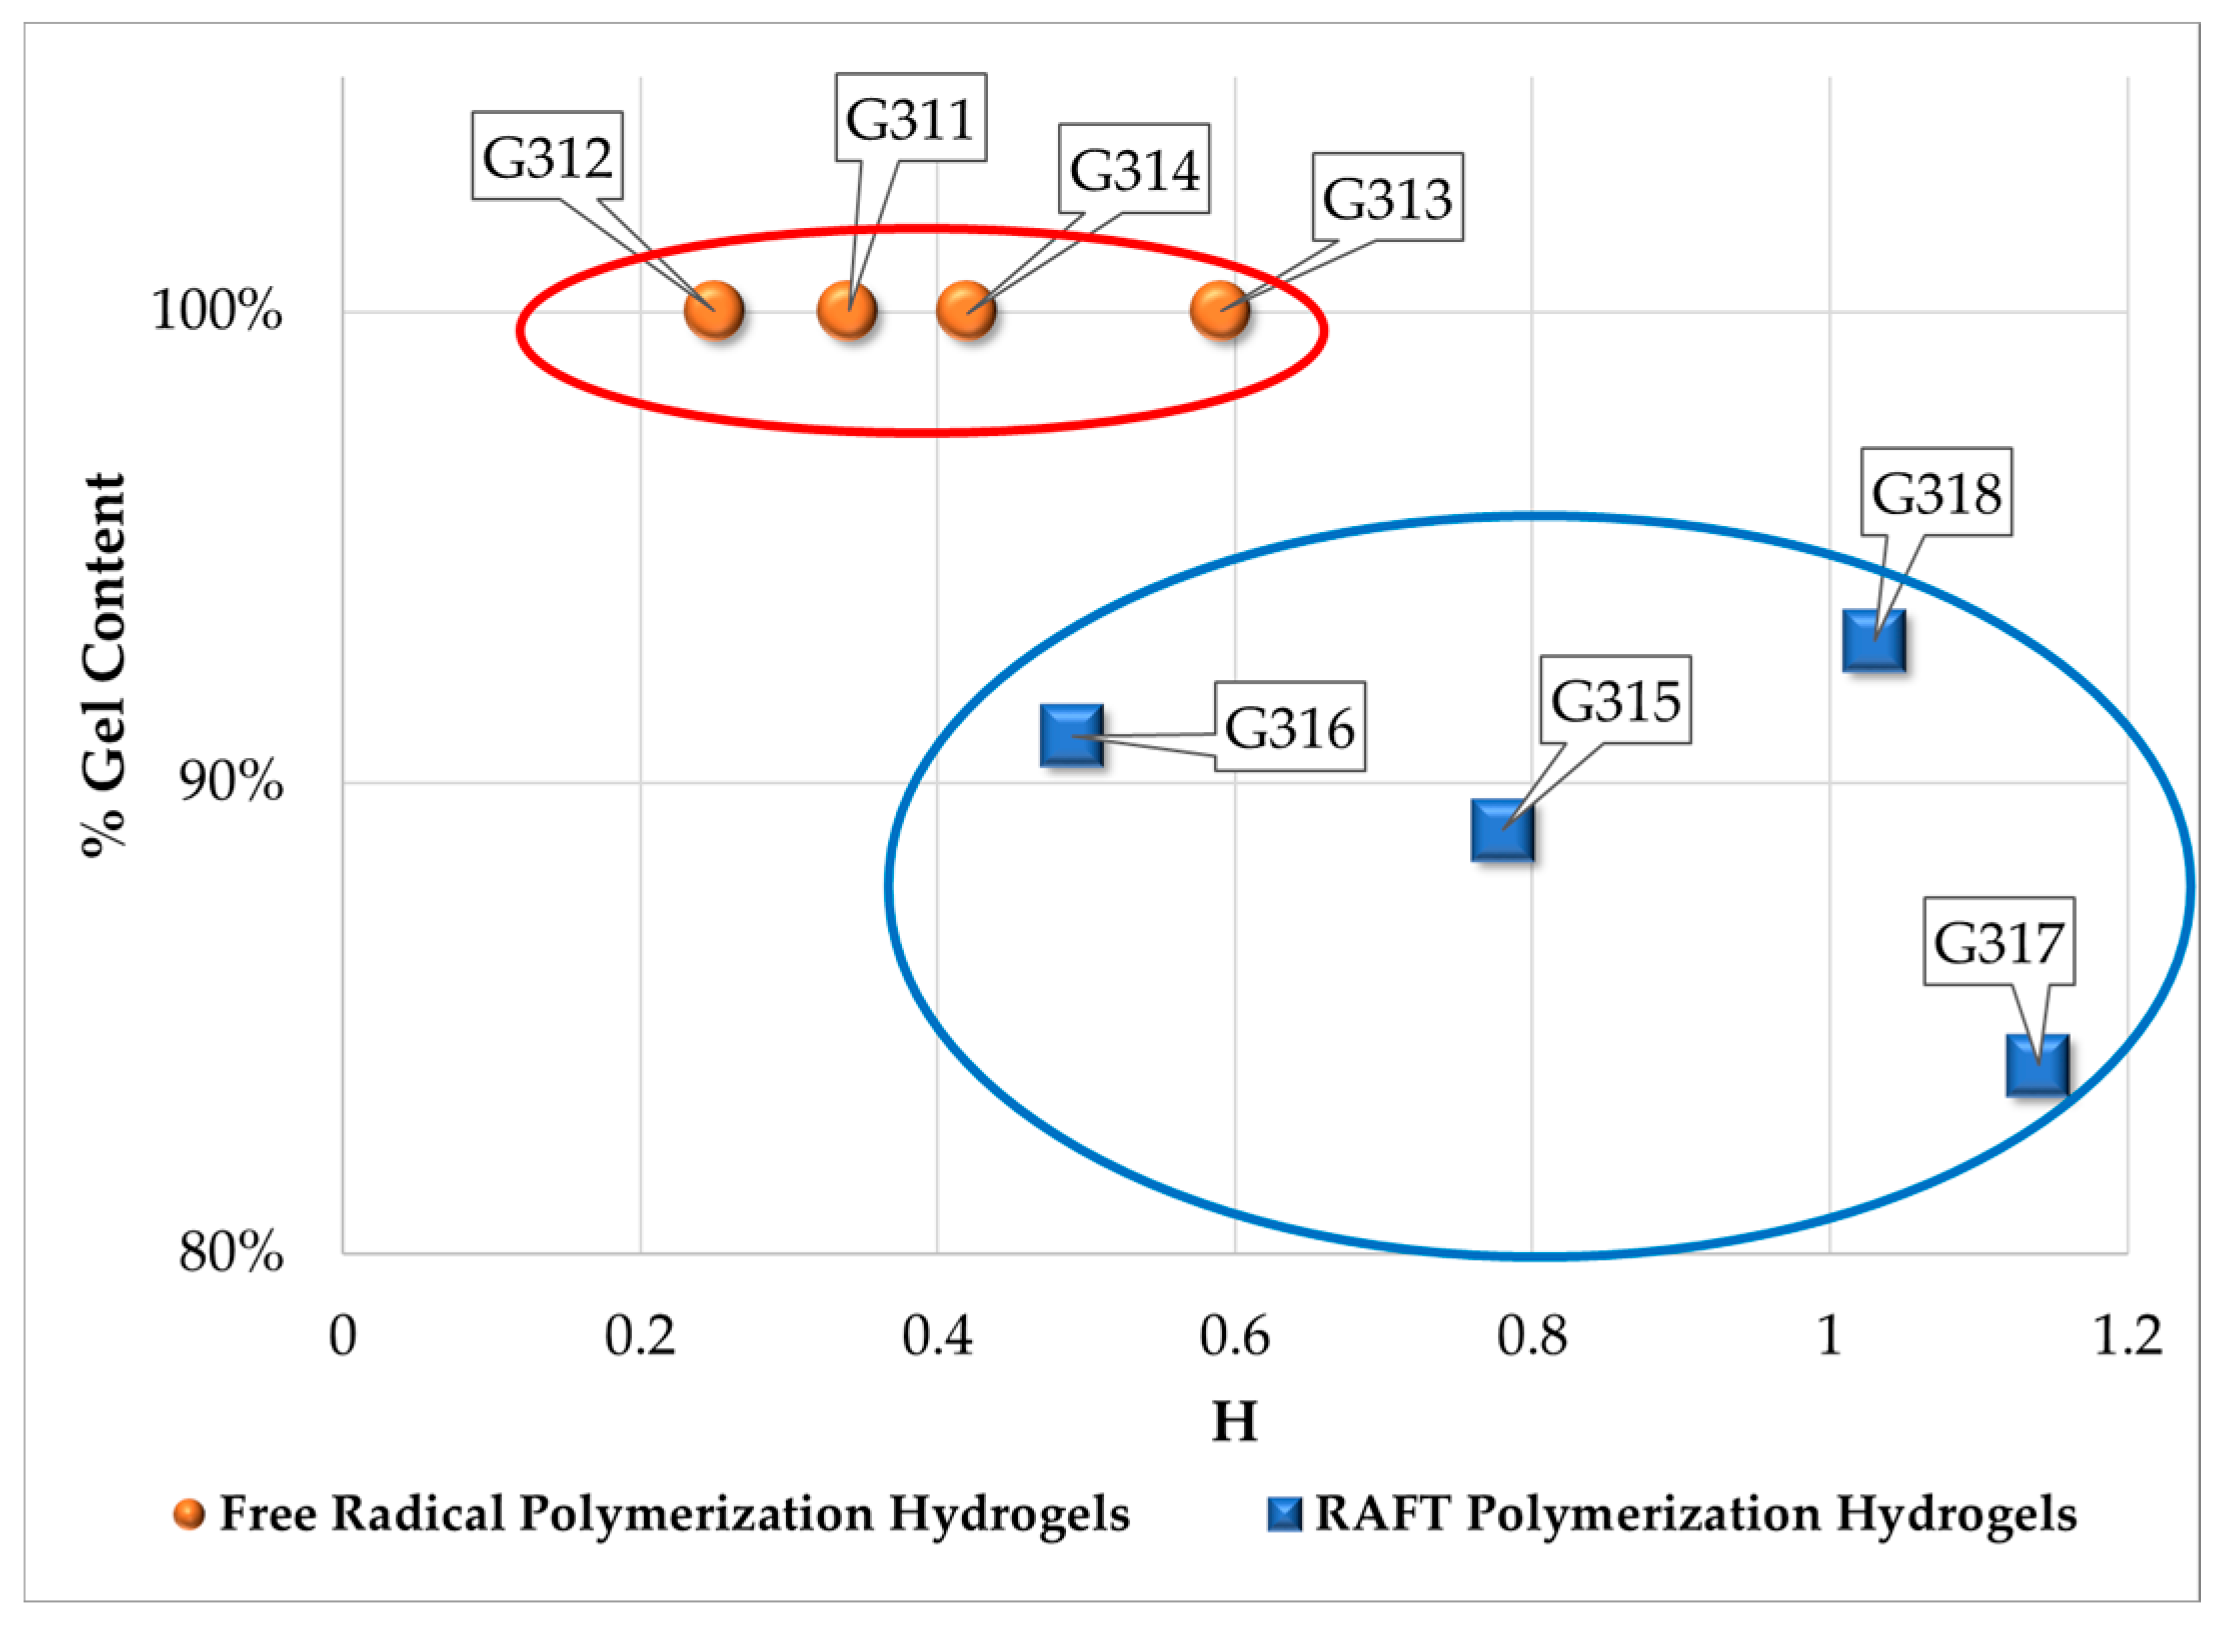
3.2. Swelling Index, Gel Content and Homogeneity Parameter

Figure 4 shows a plot of experimental swelling index versus average molecular weight between crosslinks, Mc. The plot was built using Equations (1) to (4) for the samples described in Table 1. Blue square points in Figure 4 represent polymer networks synthesized by RAFT copolymerization, whereas orange circles correspond to polymer networks synthesized by FRP. The red triangle corresponds to the theoretical value of swelling index for an ideal polymer network with an Mc value of 2603 g/mol, calculated from the comonomer composition given in Table 1. As observed in Figure 4, there are two well-defined regions. One is very broad and corresponds to polymer networks synthesized by conventional FRP; the second one is smaller in size and contains hydrogels synthesized by RAFT copolymerization. It is observed that the theoretical value lies within the region of RAFT polymer networks. Figure 4 thus shows a first difference between polymer networks synthesized by FRP and RAFT copolymerization. Hydrogels synthesized by FRP exhibit larger Mc values due to higher swelling indexes. The large dispersion in swelling index values seems to indicate a random growth of the polymer network. On the other hand, hydrogels synthesized by RAFT copolymerization exhibit swelling index-Mc values close to the theoretical point of (5.36, 2603 g/mol). The lower dispersion of SI versus Mc values observed in the case of polymer networks synthesized by RAFT copolymerization seems to describe a more structured and ordered polymer network growth process. Sample G316 seems to be an outlier, since this polymer network was synthesized using an RAFT agent, but it falls within the FRP region. There was no Krytox included in the formulation of sample G316, which may explain the anomalous behavior. However, sample G316 will remain in the analyses of our other characterization studies.
The results of Figure 4 point to the fact that hydrogels synthesized by FRP have broader distributions of Mc, compared to those synthesized by RAFT copolymerization. Figure 5 illustrates the concept of heterogeneous Mc distribution. Each polymer network contains nodes connected by chain segments of different lengths (molecular weights). The molecular weight between crosslinks (nodes) calculated from experimental swelling index, using Equations (1) to (4), represents an average value. A schematic representation of how the polymer networks synthesized by RAFT and FRP looks as shown in Figure 5.
Two polymer populations for the case of polymer networks synthesized by FRP are observed in Figure 5. The first population contains short chains with individual Mci values smaller than the theoretical value of 2603 g/mol, and the second population contains larger chains with individual Mci values higher than 2603 g/mol. In the case of short chains linking crosslink points (nodes), the polymer network is so tight and the pores so small that swelling with water in those regions is negligible. Therefore, the overall swelling measured for these polymer networks synthesized by FRP is attributable to the regions with long chain segments between crosslinks. It is this second population that is the one responsible for increasing the average value of Mc and, thus, causing such large values of SI, as observed in Figure 4.
Except for sample G316, the polymer networks synthesized by RAFT copolymerization lie very close to the theoretical value of SI versus Mc, as observed in Figure 4. These results suggest that the polymer chains between crosslinks have almost the same length, as illustrated in Figure 5. As will be evidenced from the characterization results described in the following sections, the polymer networks synthesized by free radical copolymerization of vinyl/divinyl monomers have differentiated properties and perform differently, depending on the presence or absence of a RAFT agent.
As explained earlier, in this contribution, a homogeneity parameter (H), defined by Equation (5) is used to assess the homogeneity of polymer networks. The values of SI, Mcexp, Mctheo and H for the polymer networks synthesized in this study are summarized in Table 3. It is observed that H ≈ 1.0 for the samples synthesized by RAFT copolymerization, except sample G316. The presence or absence of Krytox in the reaction does not seem to affect the behavior of the polymer network in terms of SI and H.
The relationship between gel content and H is shown in Figure 6, where two different populations are clearly observed. The first population corresponds to polymer networks synthesized by FRP and the second one to polymer networks synthesized by RAFT copolymerization. One hundred percent gel content is observed for the polymer networks synthesized by FRP, whereas ~90% gel content was obtained for the materials synthesized by RAFT copolymerization. It seems that in polymer networks synthesized by RAFT copolymerization, the slower polymerization rate causes polymer chains of low to medium molecular weight produced late in the polymerization to encounter mobility restrictions at high viscosities, thus reaching lower limiting conversions, whereas in polymer networks synthesized by FRP monomer disappears quickly, and medium-sized polymer networks rapidly become part of the gel by propagation through pendant double bonds or termination with radicals placed within the polymer network.

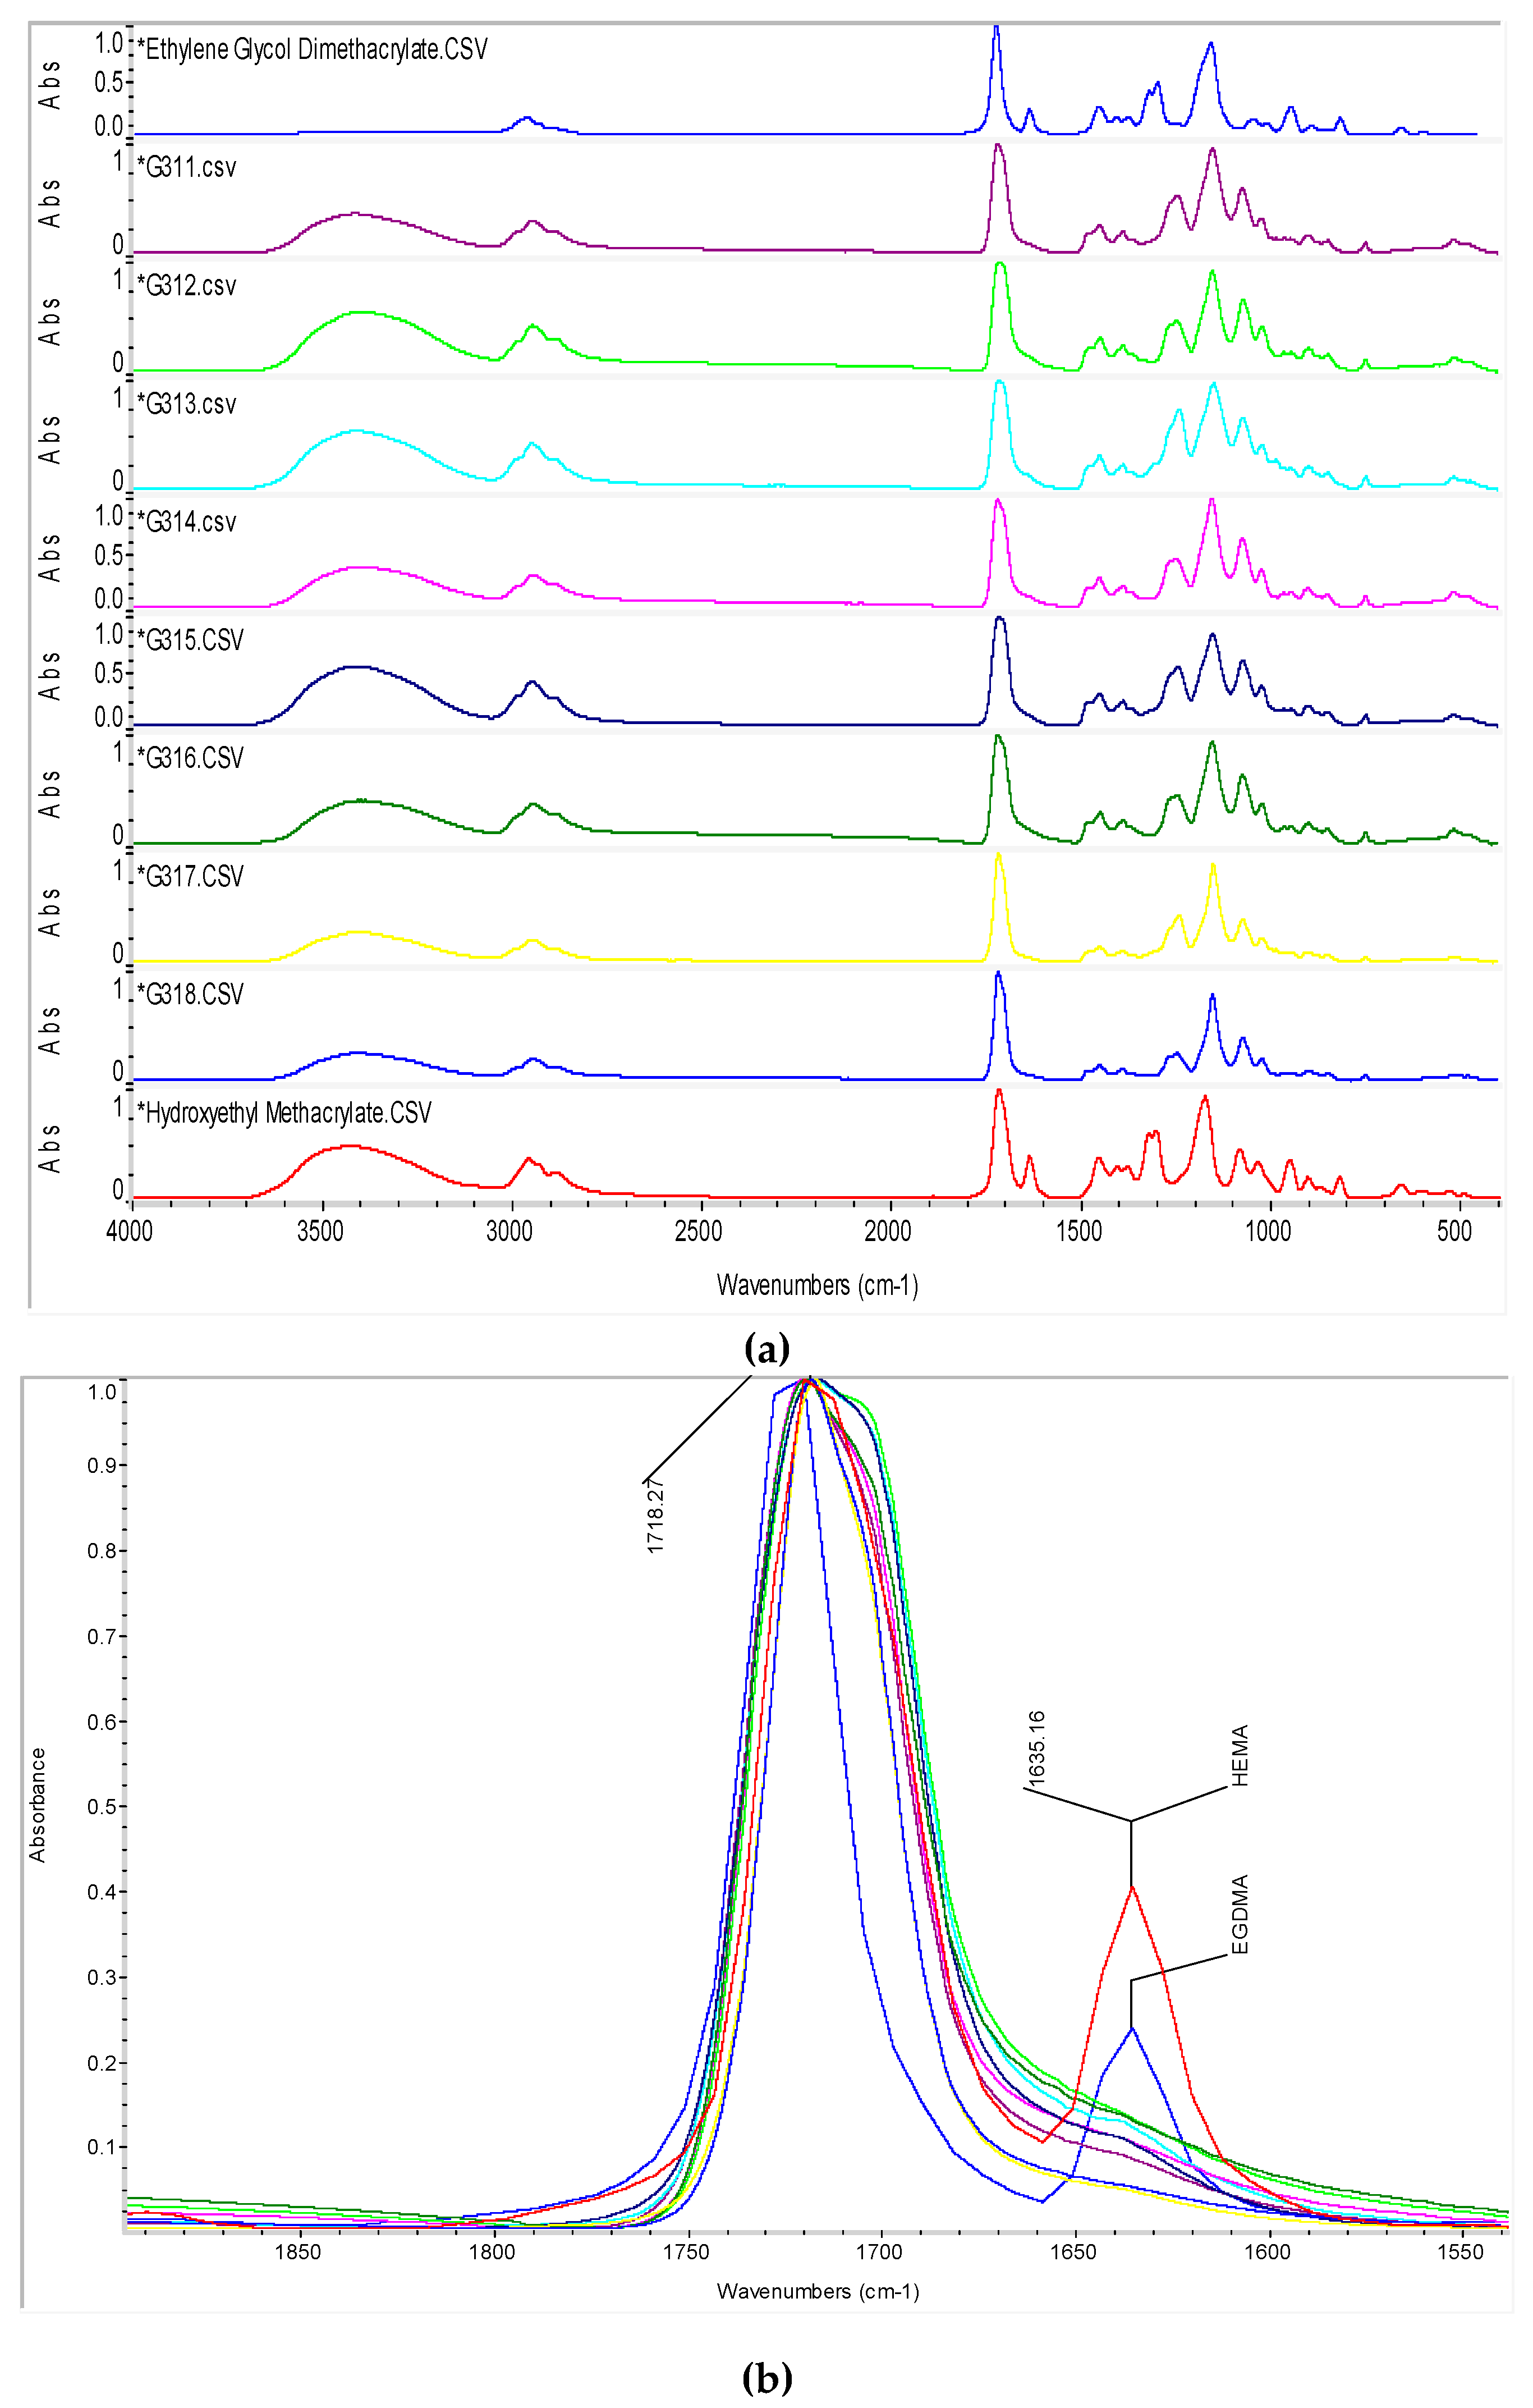
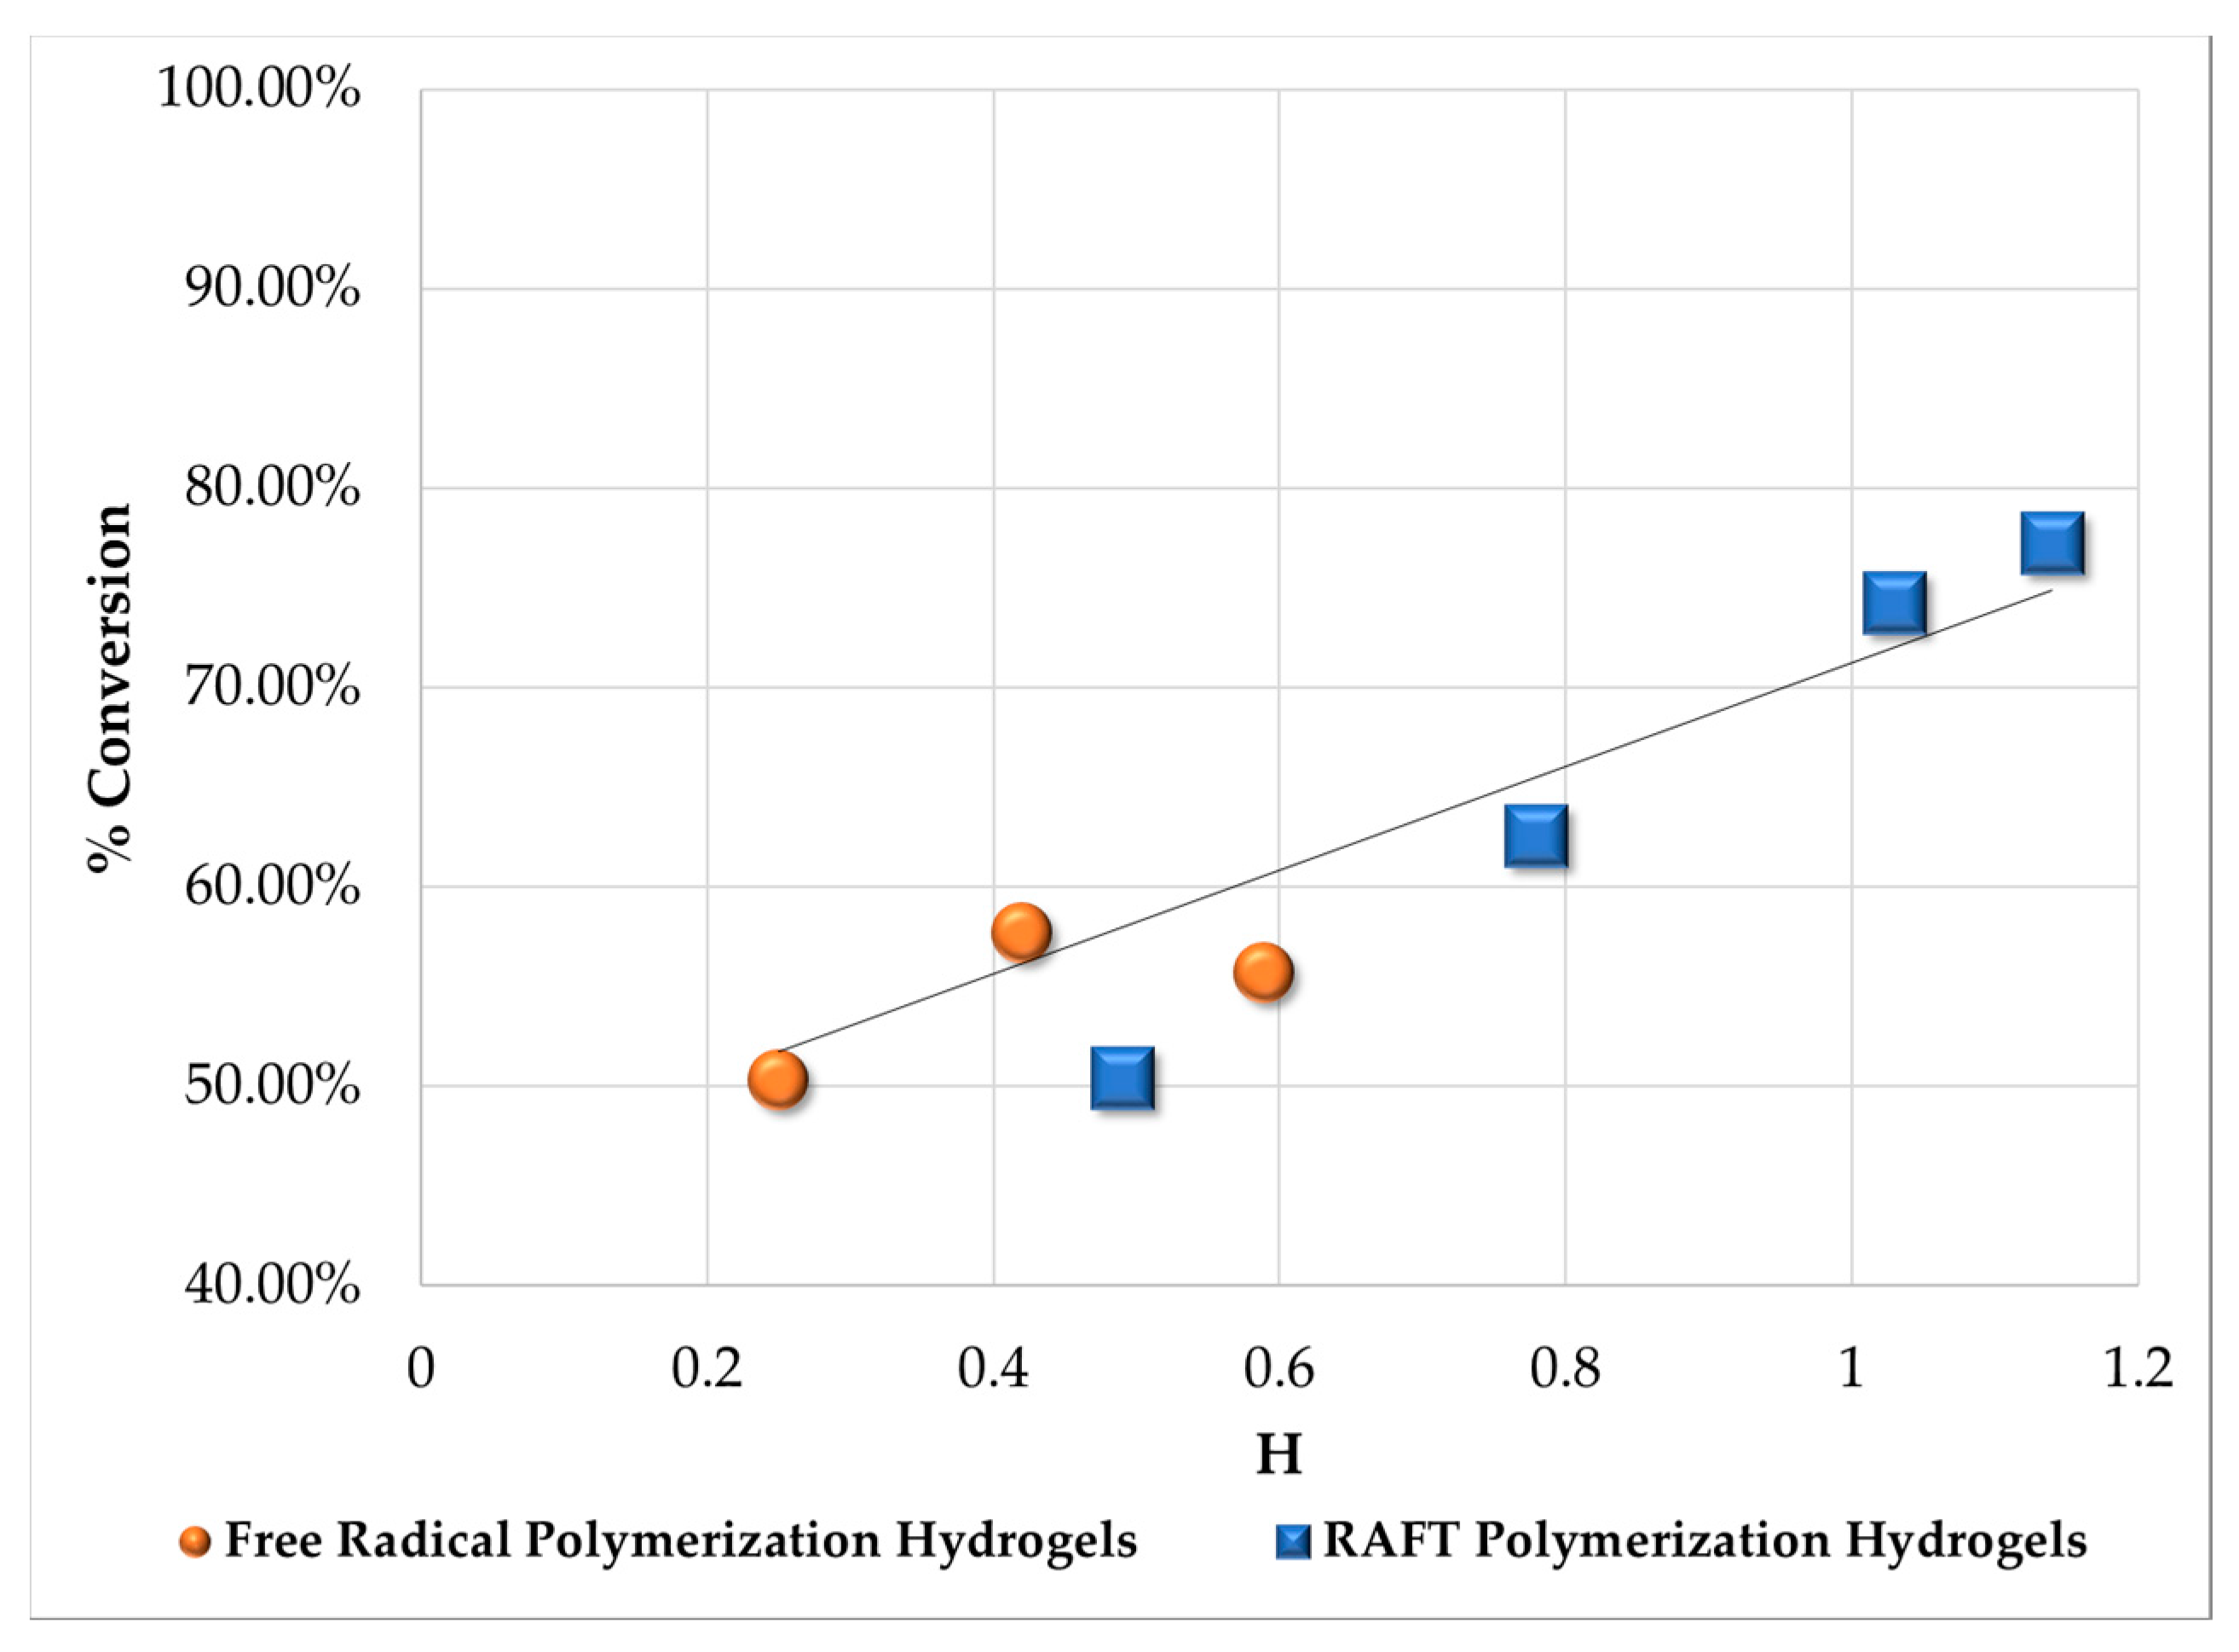
3.3. Unreacted Pendant Double Bonds from FTIR

The amount of unreacted pendant double bonds can also be used as an indicator of polymer network heterogeneity. If the polymer network grows in a gradual, ordered way, as would be the case in the presence of an RAFT controller, all pendant double bonds would have the same probability of being reached by a molecule with a free radical reacting unit. If the polymer network is being produced in a non-controlled manner, a significant amount of pendant double bonds could get trapped within the structure of the polymer network, thus becoming inaccessible to polymer chains with active (free radical) segments. Therefore, the amount of unreacted double bonds present in a polymer network is expected to be higher if the synthesis took place by FRP, compared to polymer networks synthesized by RAFT copolymerization. The FTIR spectra of the hydrogels synthesized in this study are shown in Figure 7. Also shown in the lower section of Figure 7 is an enlargement of the region of interest, where the spectra of HEMA and EGDMA are also included, in order to emphasize the region where double bonds are noticeable.
An internal standard was used for quantification purposes. A summary of the assignment of functional groups to the different bands is shown in Table 4. The signal at 1717 cm−1 corresponds to carbonyl groups –C=O, which remained unreacted and depend on HEMA and EDGMA initial concentrations only. The area for the –C=O band calculated for each sample was considered as the internal reference (AC=O). Also observed in Table 4 are two regions for double bonds. The most promising region to evaluate remaining double bonds was 1635 cm−1 in wavelength, so we integrated those peaks (AC=C).
The results of integrated areas from FTIR analyses for both regions of interest are summarized in Table 5. The ratio of integrated area for double bonds to integrated area for carbonyl groups is equivalent to the normalized amount of remaining double bonds in the sample [AC=C/AC=O]sample. Overall, pendant double bond (PDB) conversion, expressed as percentage, is calculated using Equation (7), where [AC=C/AC=O]0 corresponds to the integrated areas for the HEMA-EDGMA monomer mixture. Conversion results are summarized in Table 5.
% P D B C o n v e r s i o n = [ A C = C A C = O ] 0 [ A C = C A C = O ] s a m p l e [ A C = C A C = O ] 0 * 100
As observed in Table 5, the PDB conversions obtained for samples synthesized by FRP are lower than samples synthesized by RAFT copolymerization. That means that the amount of unreacted pendant double bonds is higher in the samples synthesized by FRC, as was expected. Sample G316 using an RAFT agent was once more an outlier, since it falls within the range of values for samples synthesized by FRP.
A plot of percentage double bond conversion measured by FTIR versus H is shown in Figure 8. A linear relationship is observed with RAFT hydrogels showing higher double bond conversions (lower residual pendant double bonds) and values of H closer to one. It should be pointed out that the correlation shown in Figure 8 comes from two different characterization techniques: SI, which is a gravimetric technique, and FTIR spectroscopy. These results strengthen the concept of H as an indicator of polymer network heterogeneity.

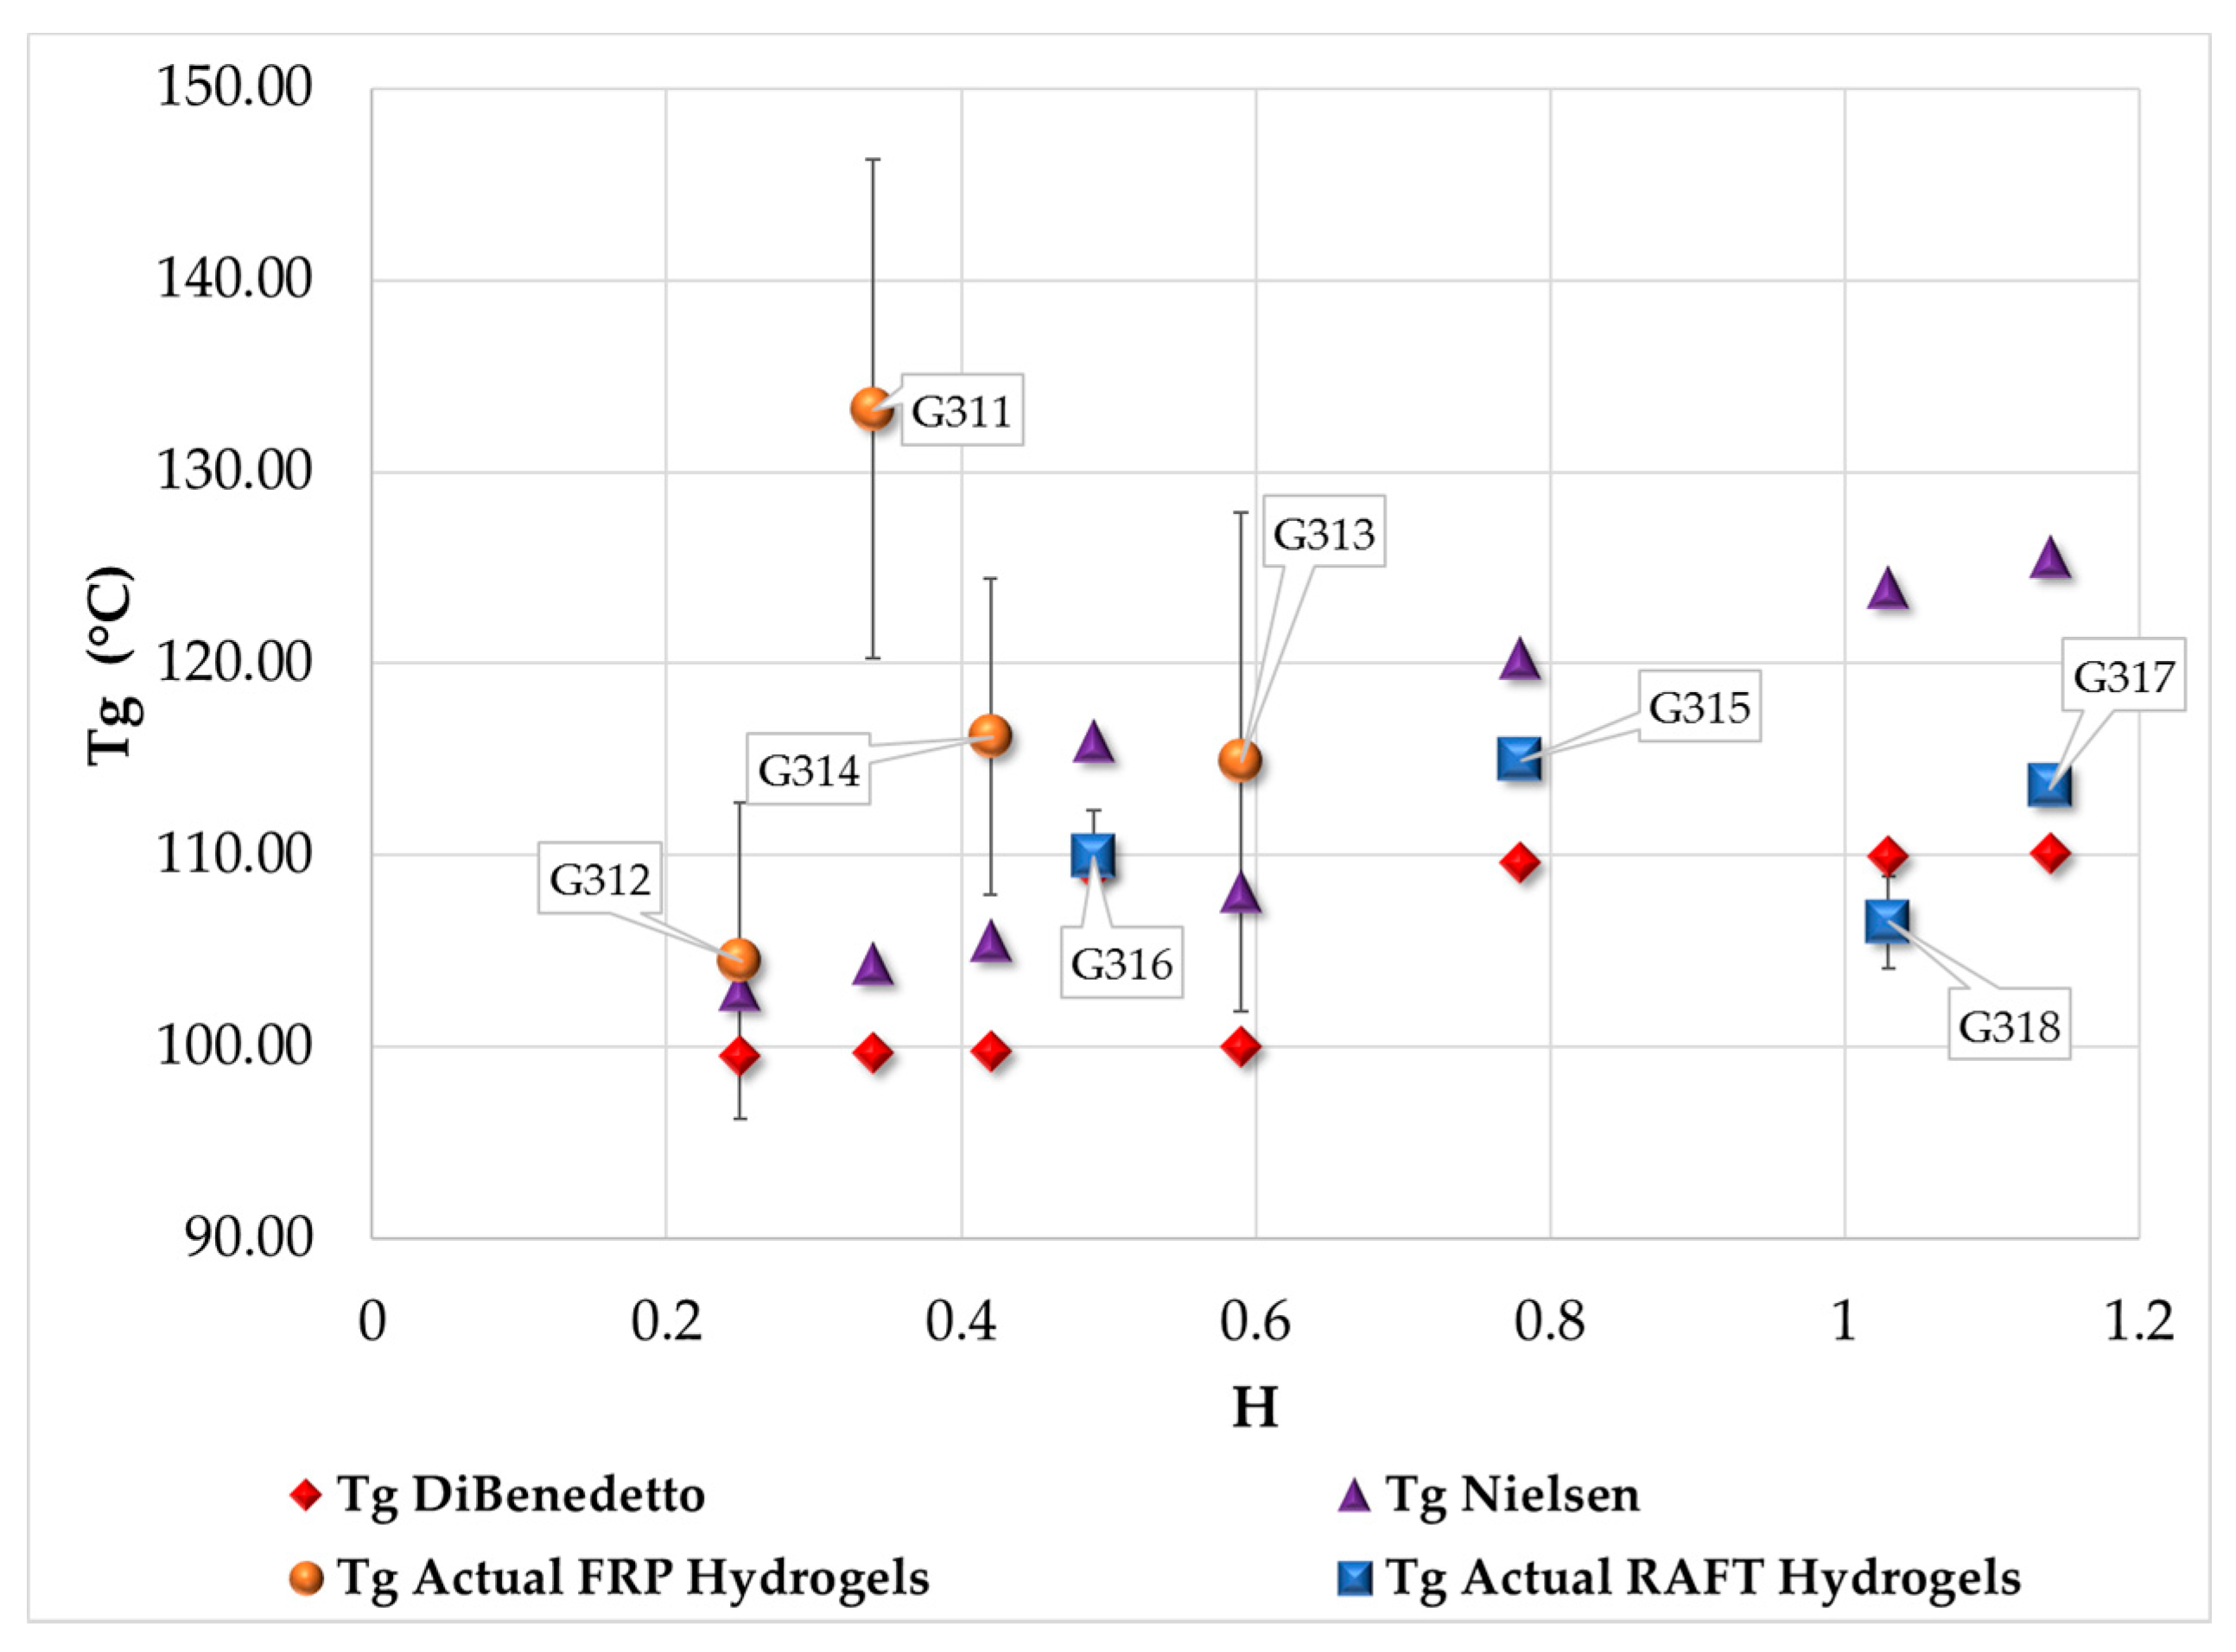
3.4. Measurement of Tg by DSC

The differences in homogeneity (H measured from SI) for polymer networks synthesized by FRP and RAFT copolymerizations, caused by the reaction path followed (thermodynamic analysis) and pendant double bond conversions achieved (determined from FTIR), led to significant differences in properties and network performance, as evidenced from glass transition temperature (Tg) measurements by modulated differential scanning calorimetry (MDSC).
Correlations for Tg of polymers and polymer networks are available in the literature [24]. The Nielsen and DiBenedetto equations for calculation of Tg for crosslinked polymers are based on the concept of a polymer network having an infinite average molecular weight between crosslinks [24]. In a plot of Tg vs. 1/Mc, Tg° represents the value of Tg when 1/Mc → 0. Plots of Tg vs. 1/Mc for hydrogels synthesized by free FRP and RAFT copolymerizations are shown in Figure 9. Significant differences in Tg are observed with values that go from 105 to 133 °C. There is a 6 °C difference between the average values of Tg between samples synthesized by FRP and RAFT copolymerizations. The higher average value corresponds to samples synthesized by FRP. It is also observed from the error bars shown in Figure 9 that the standard deviation for samples synthesized by FRP is significantly higher than the corresponding value for polymer networks synthesized by RAFT copolymerization. Tg in the case of polymer networks is related to the number of crosslink points. Higher Mc values imply having less crosslink points and, therefore, lower Tg values. Both groups of samples (FRP and RAFT) follow linear trends with a difference of ~10 °C between the values of Tg°, the lower value corresponding to the samples synthesized by FRP. However, the line corresponding to samples synthesized by RAFT copolymerization has a smaller slope. The measured values of Tg were used to evaluate the adequacy of the Nielsen and DiBenedetto equations for calculation of Tg as a function of Mc, as expressed in Equations (8) and (9), respectively, where crosslink density (xpolymer network) is defined by Equation (10) [24]. It should be noted here that xpolymer network in Equation (10) was defined as the “degree of crosslinking” in van Krevelen [24], but the definition given corresponds to crosslink density. We also changed the denominator of Equation (10), since it is more adequate to refer the calculation to the number of repeating units rather than the number of backbone atoms as defined in van Krevelen [24].
T g p o l y m e r n e t w o r k = T g ° + ( 39 , 000 K mol / g M c p o l y m e r n e t w o r k )
T g p o l y m e r n e t w o r k = T g ° + 1.2 T g ° ( x p o l y m e r n e t w o r k 1 x p o l y m e r n e t w o r k )
x p o l y m e r n e t w o r k = #   of   crosslinks #   of   repeating   units   in   chain   segment   between   crosslinks
Figure 10 shows a plot of measured and calculated values of Tg versus H. The values of Mc used in the calculation of Tg were the ones obtained experimentally. It is observed that the calculated values of Tg using either equation agree well between themselves in the region of H < 0.5, but differ significantly when H > 0.5. It is also observed in Figure 10 that Tg values for polymer networks synthesized by FRP are adequately predicted with the Nielsen equation (10% mean error), whereas DiBenedetto’s equation works better for RAFT synthesized polymer networks (3% average error). Except for sample G311, which can be considered as an outlier, the overall agreement between experimental and estimated values of Tg using typical correlations is fairly good.

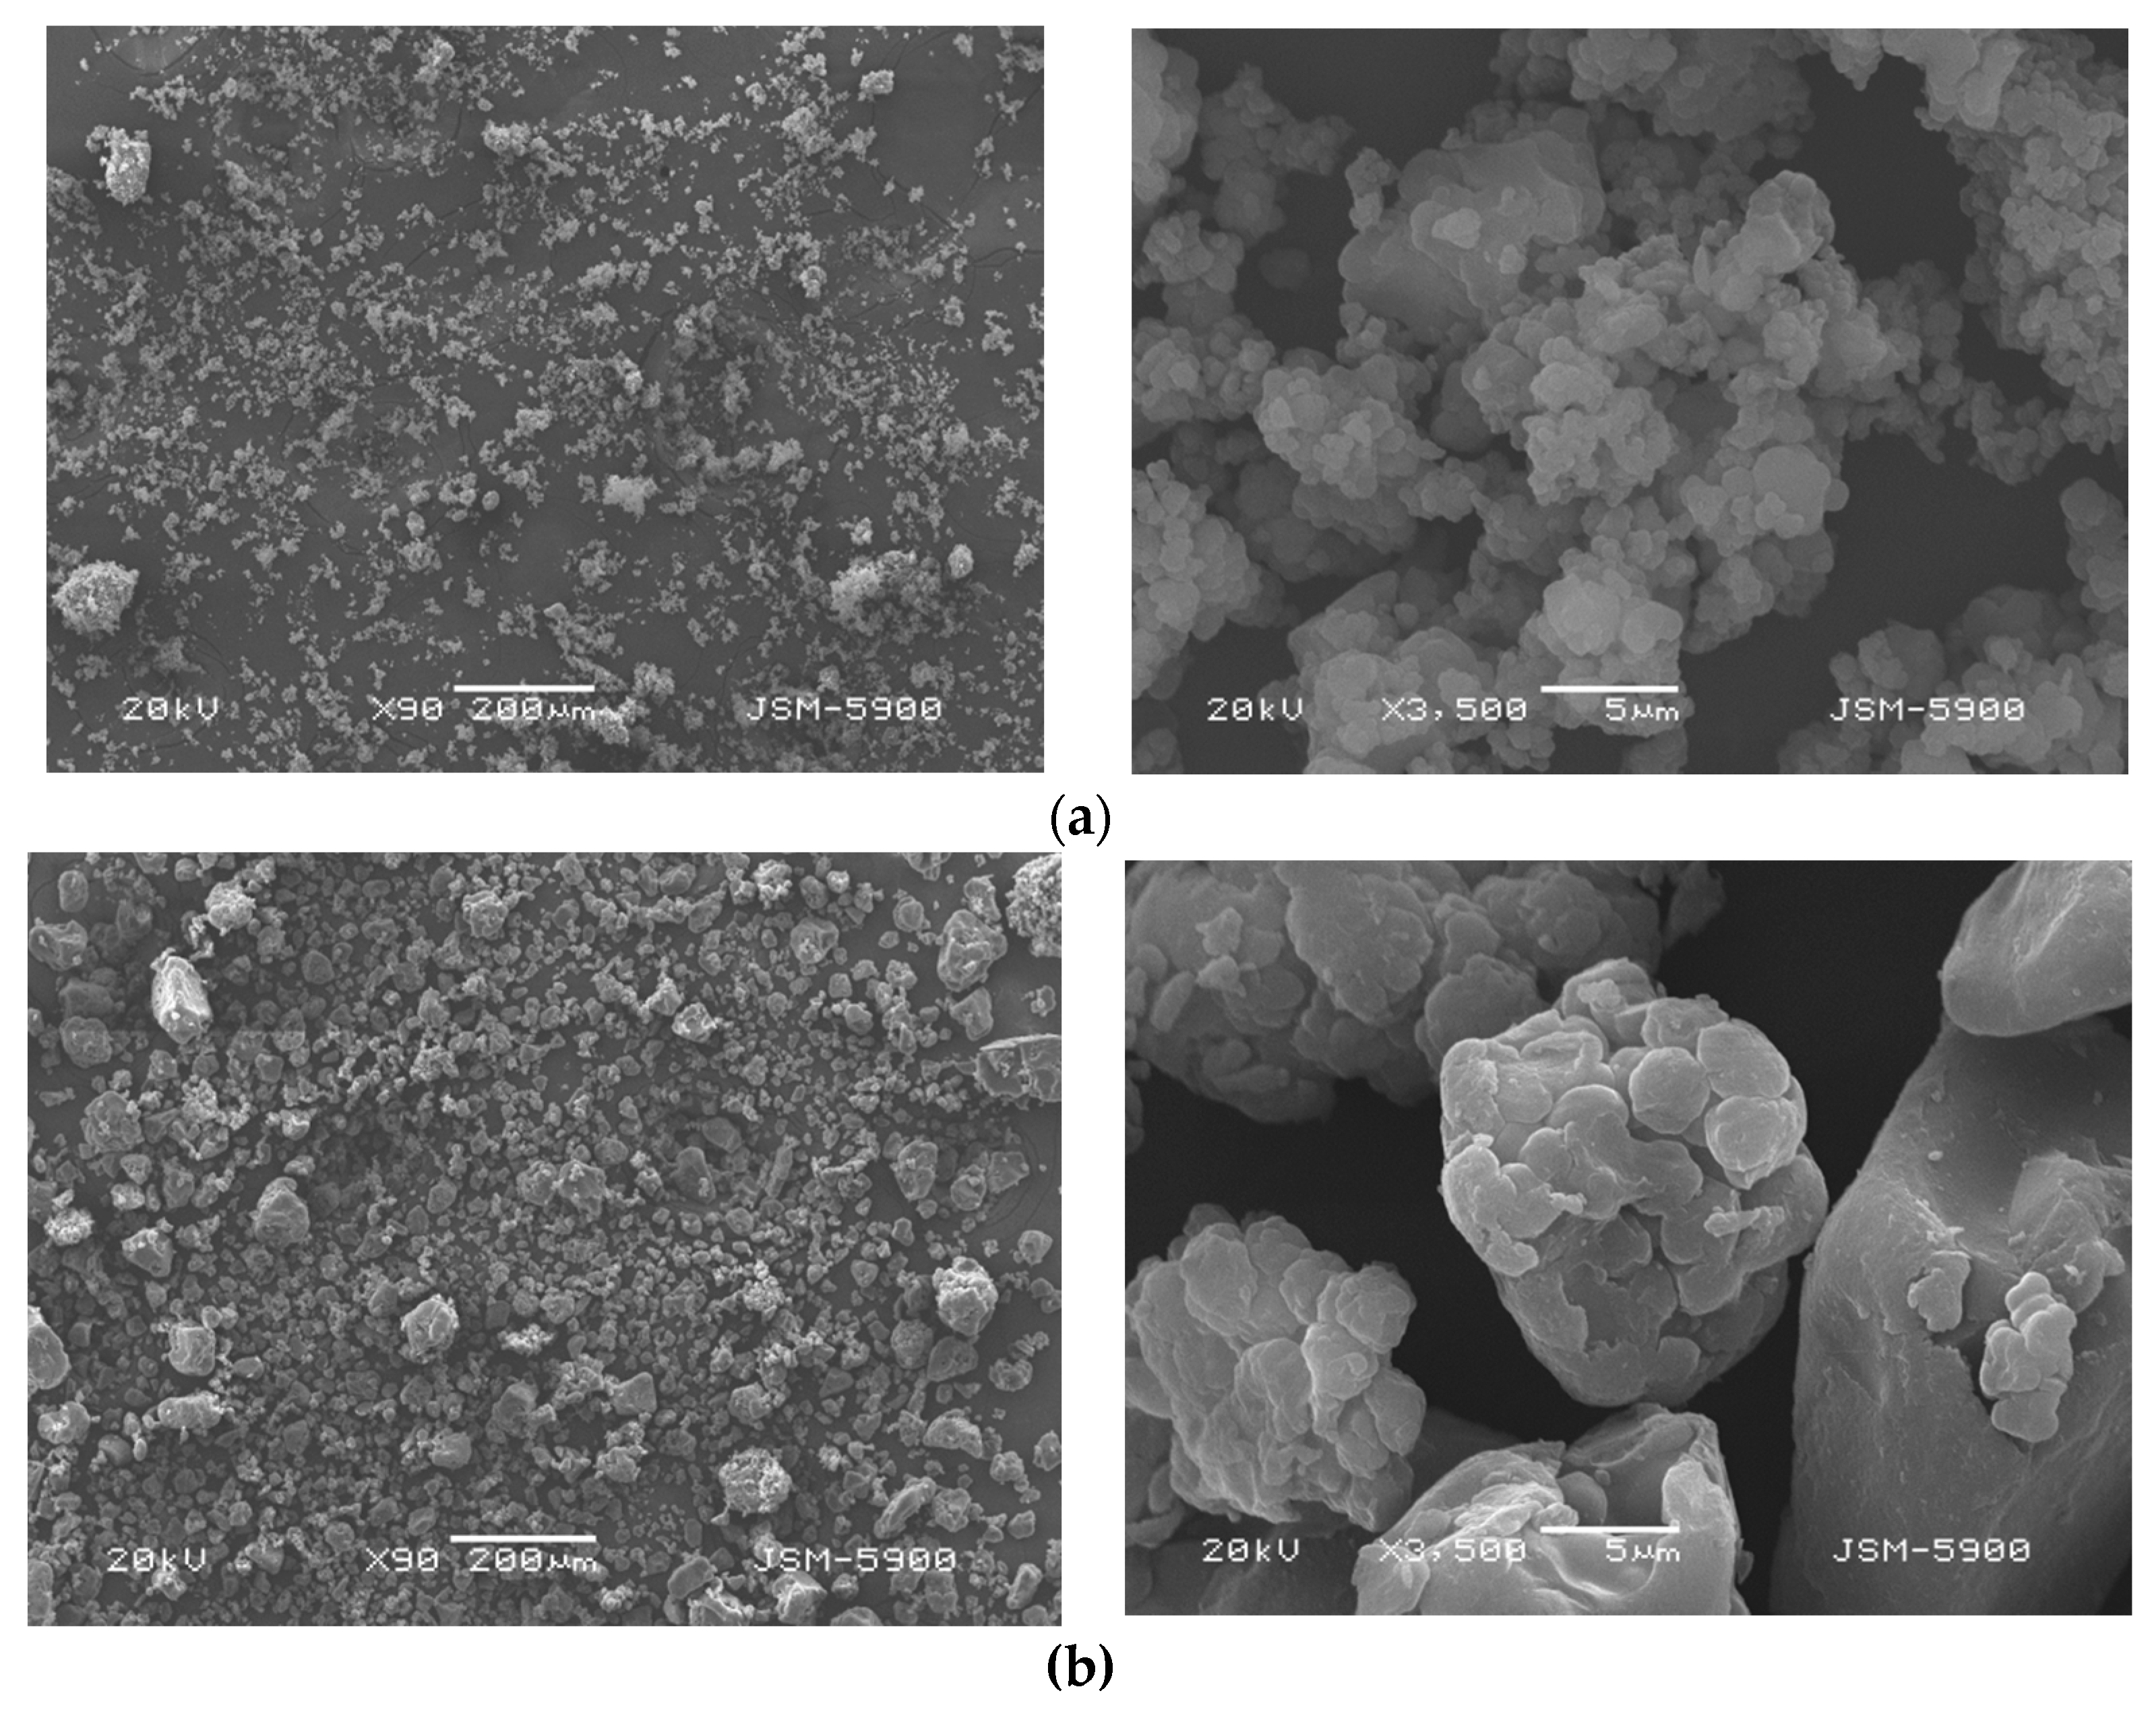
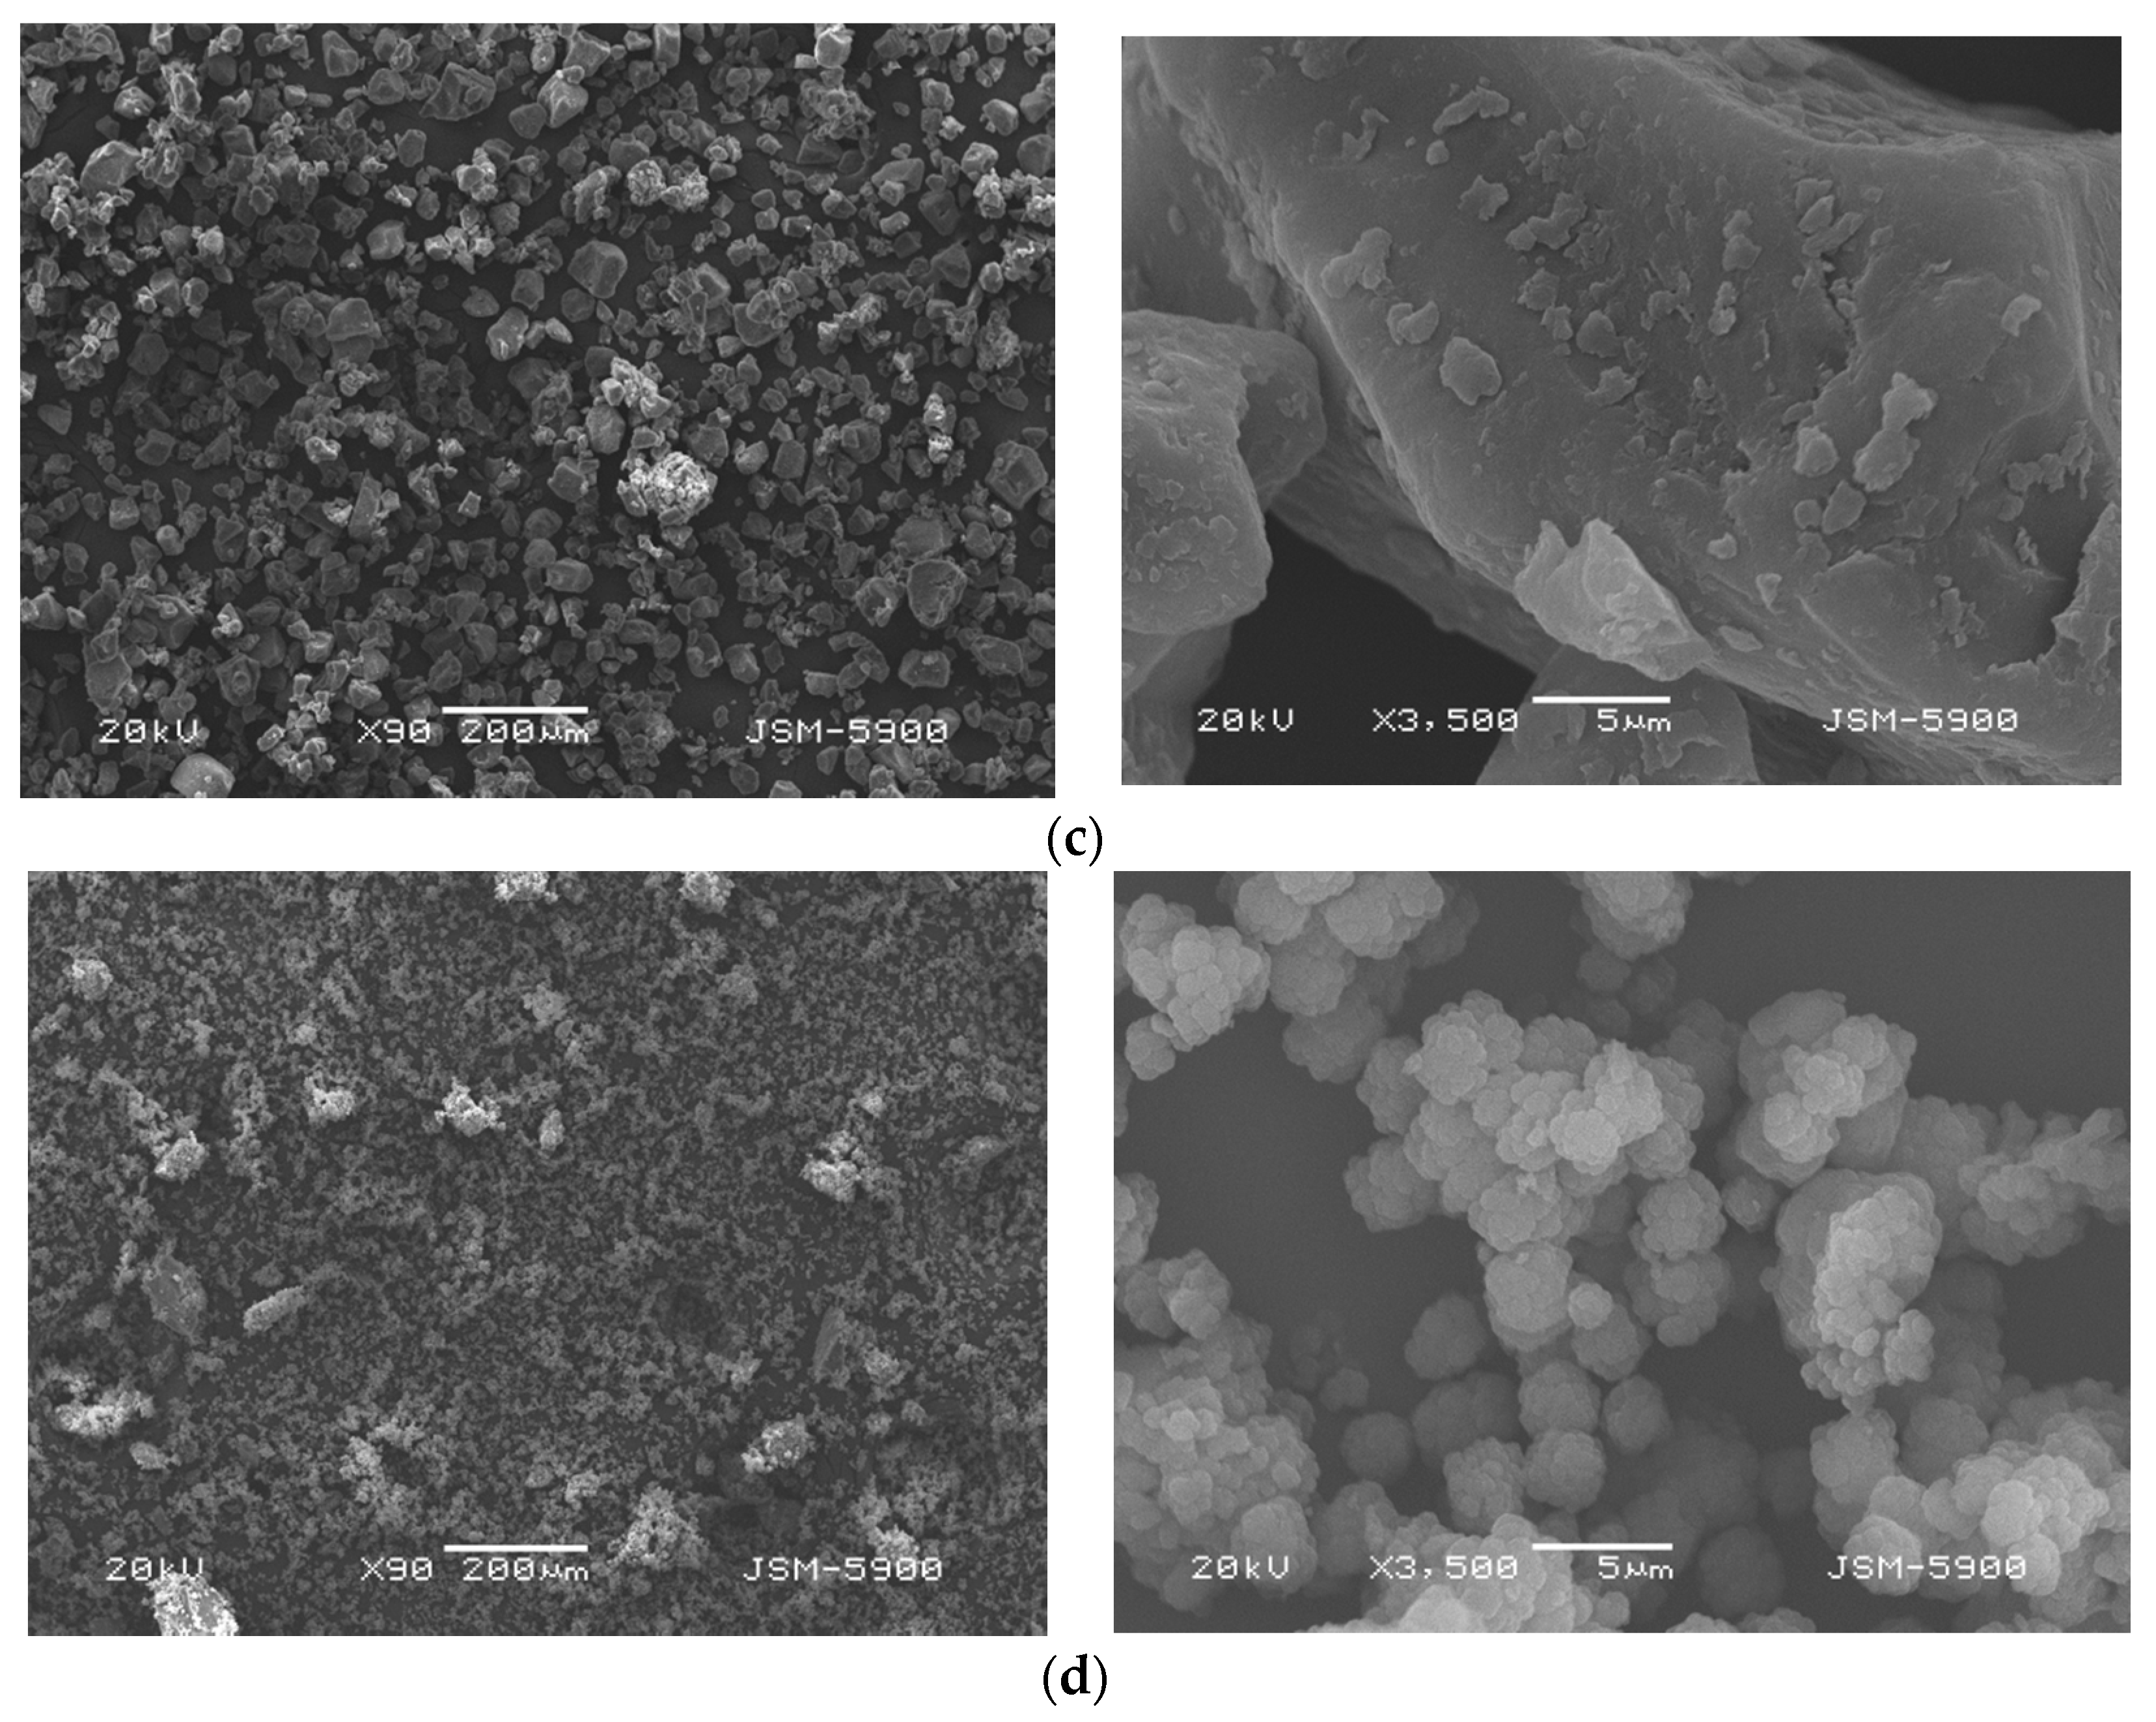
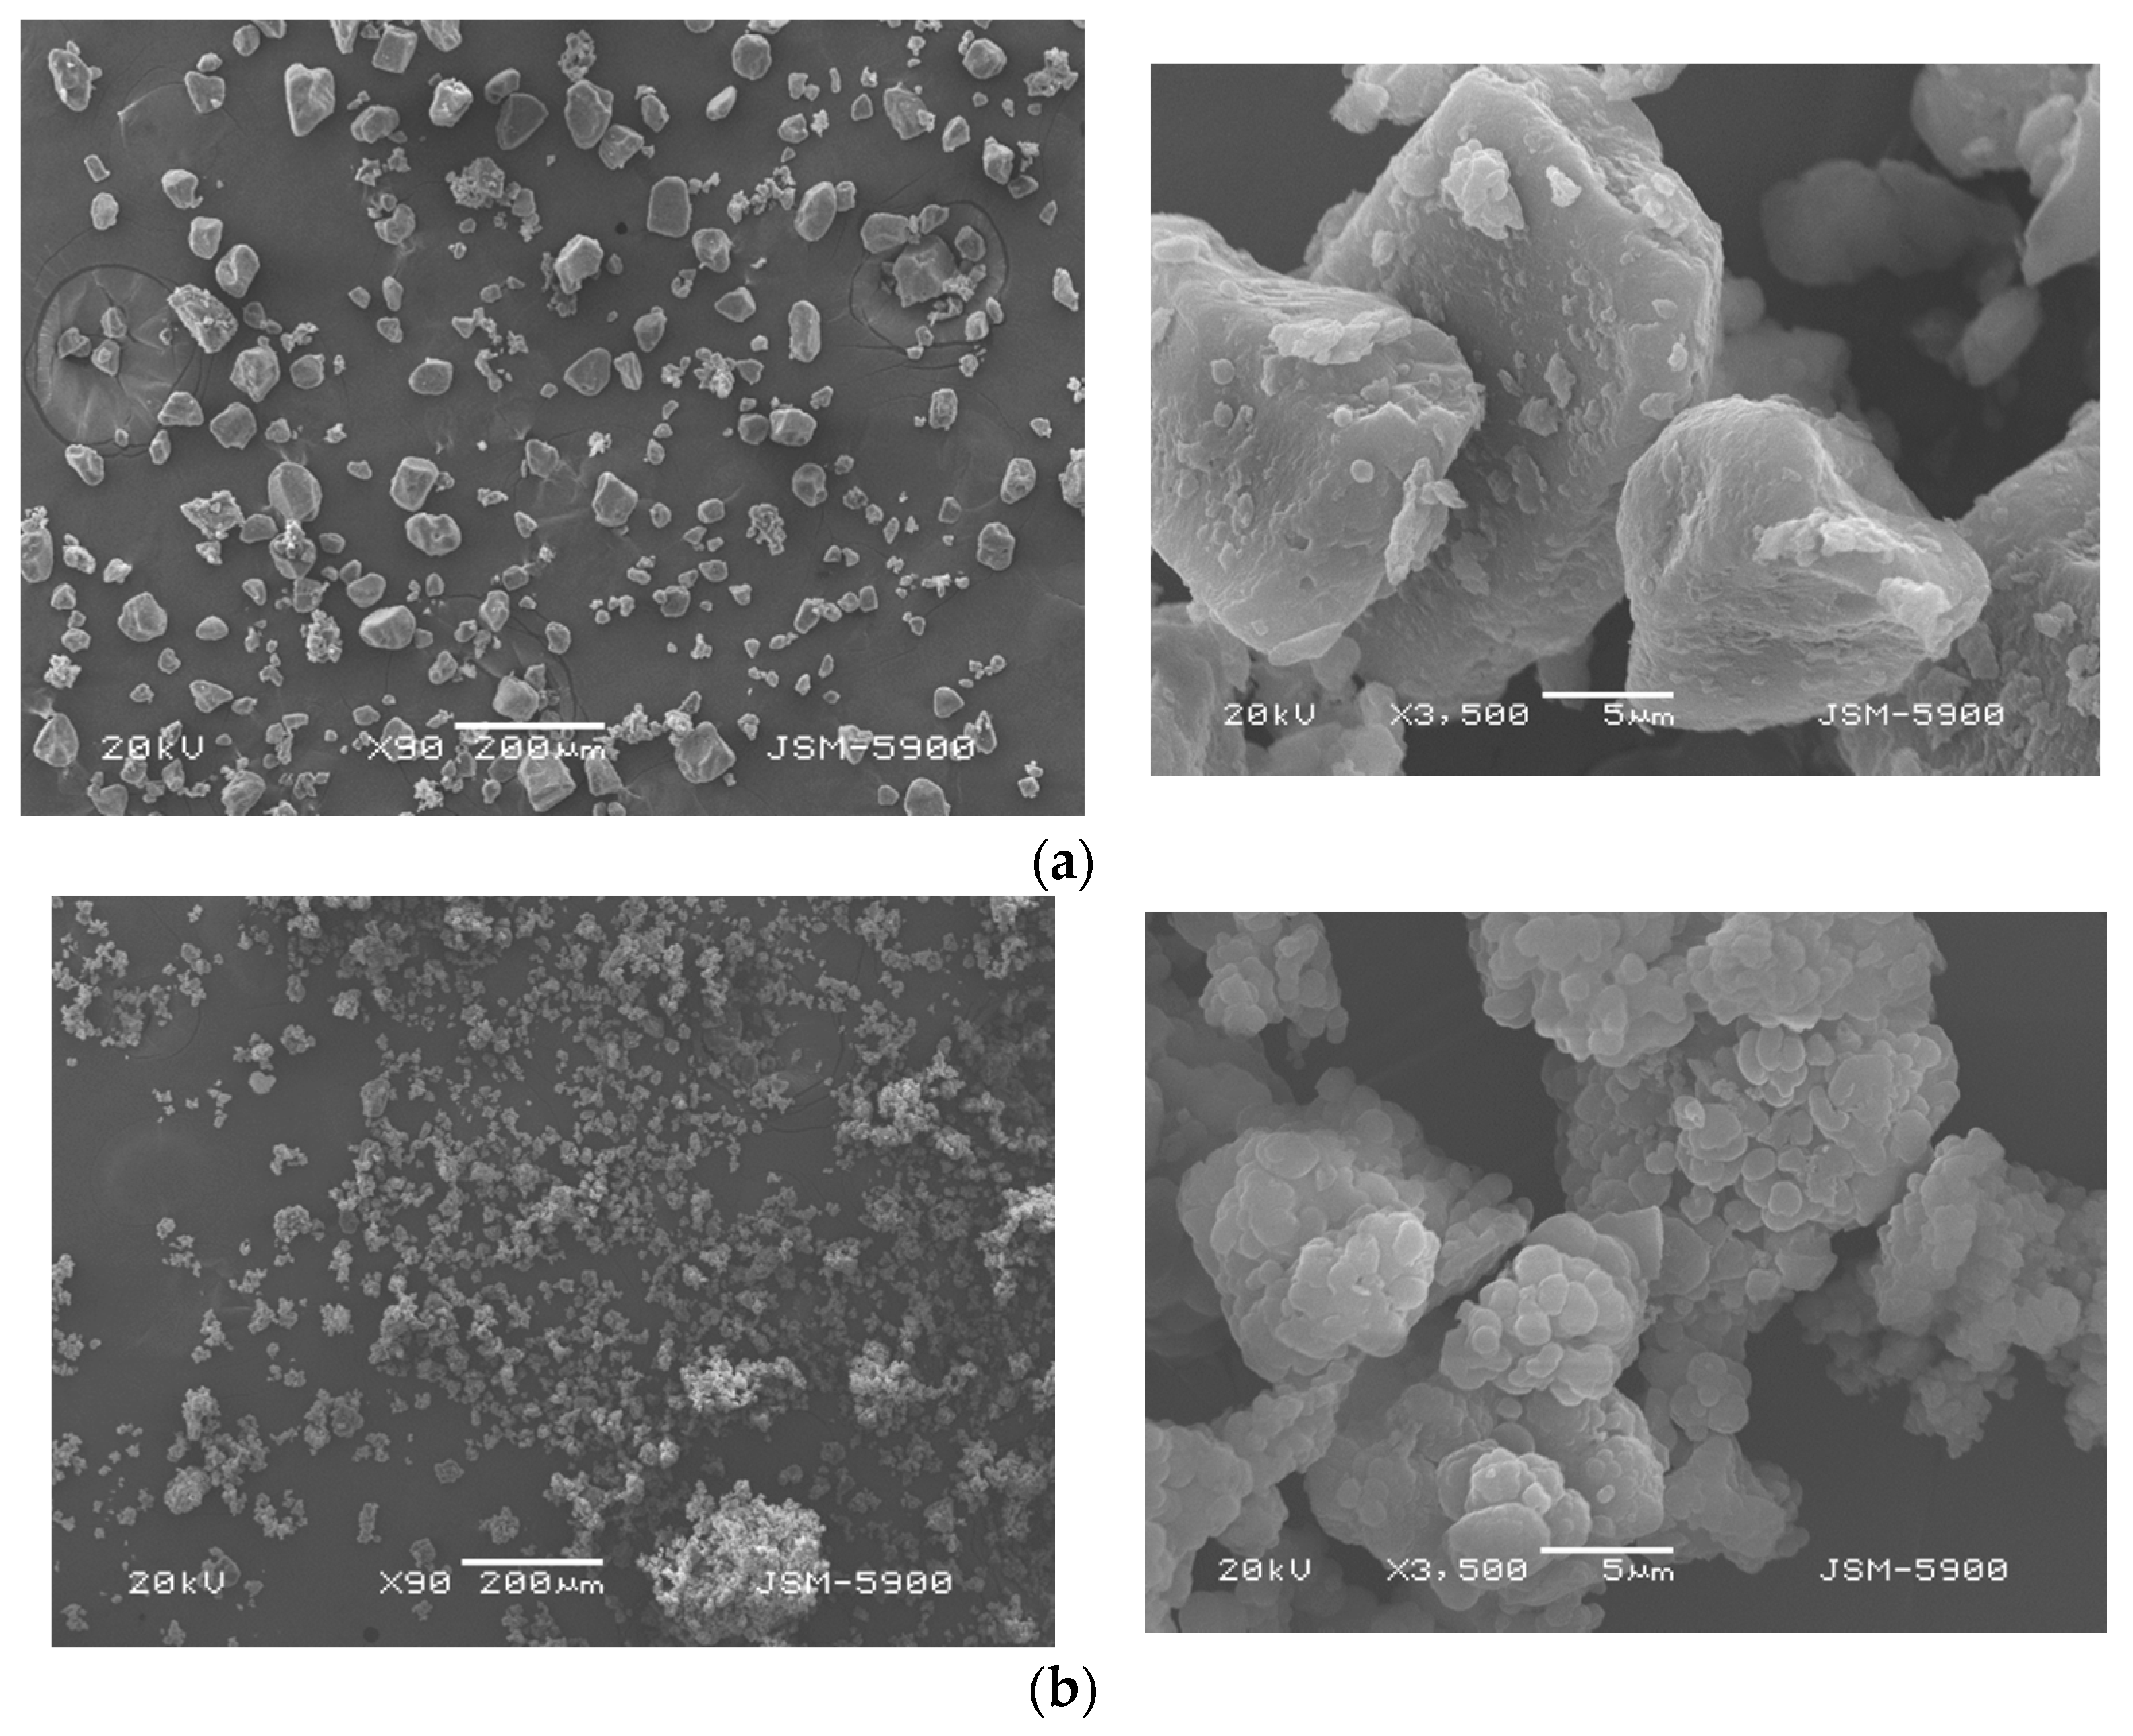
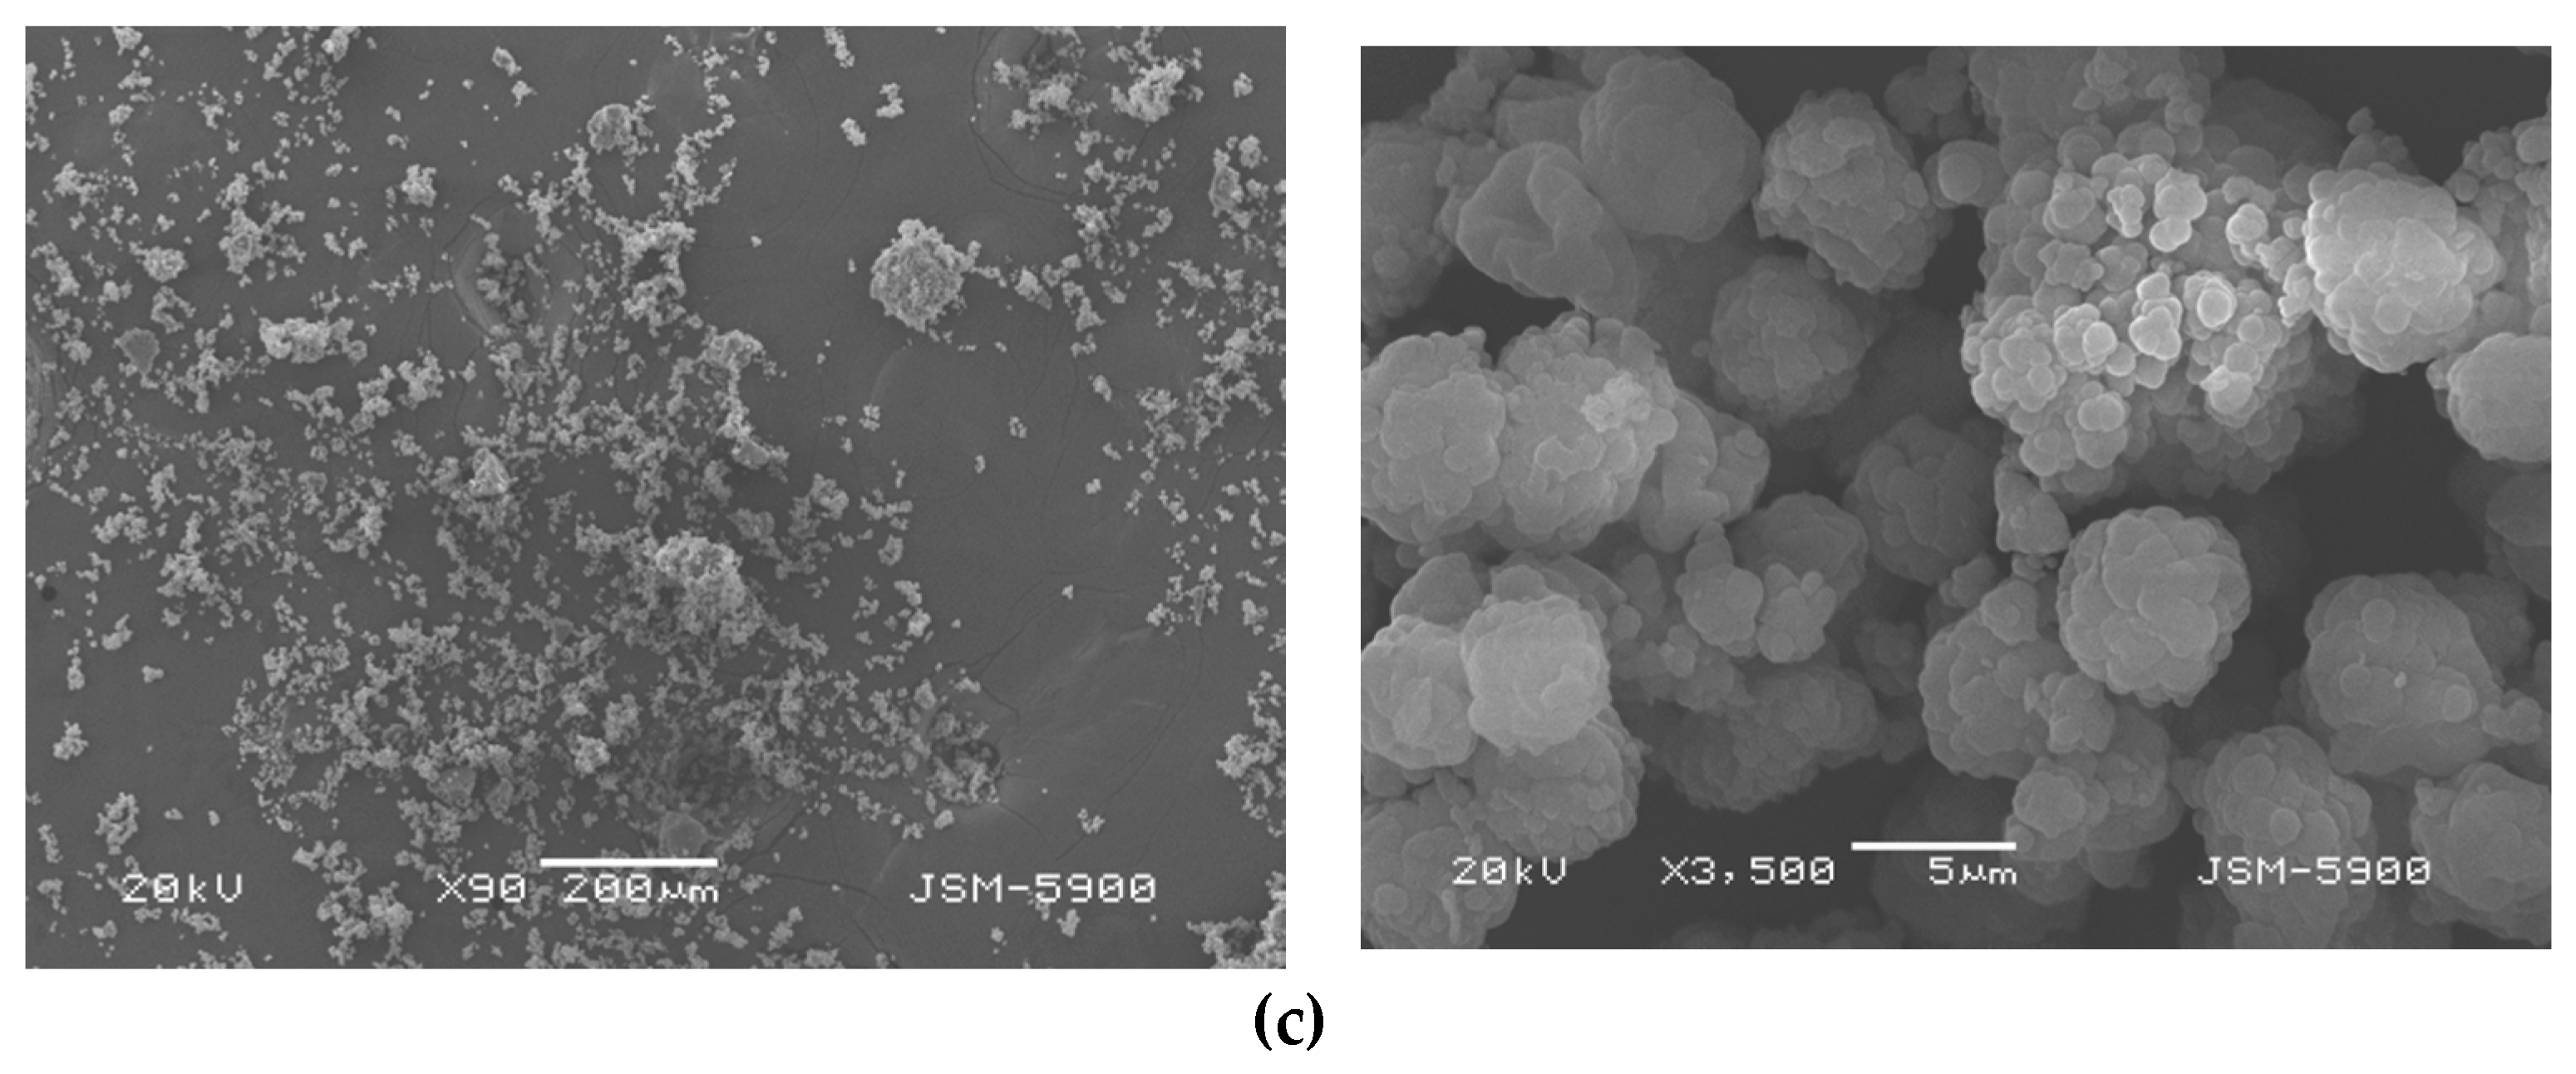
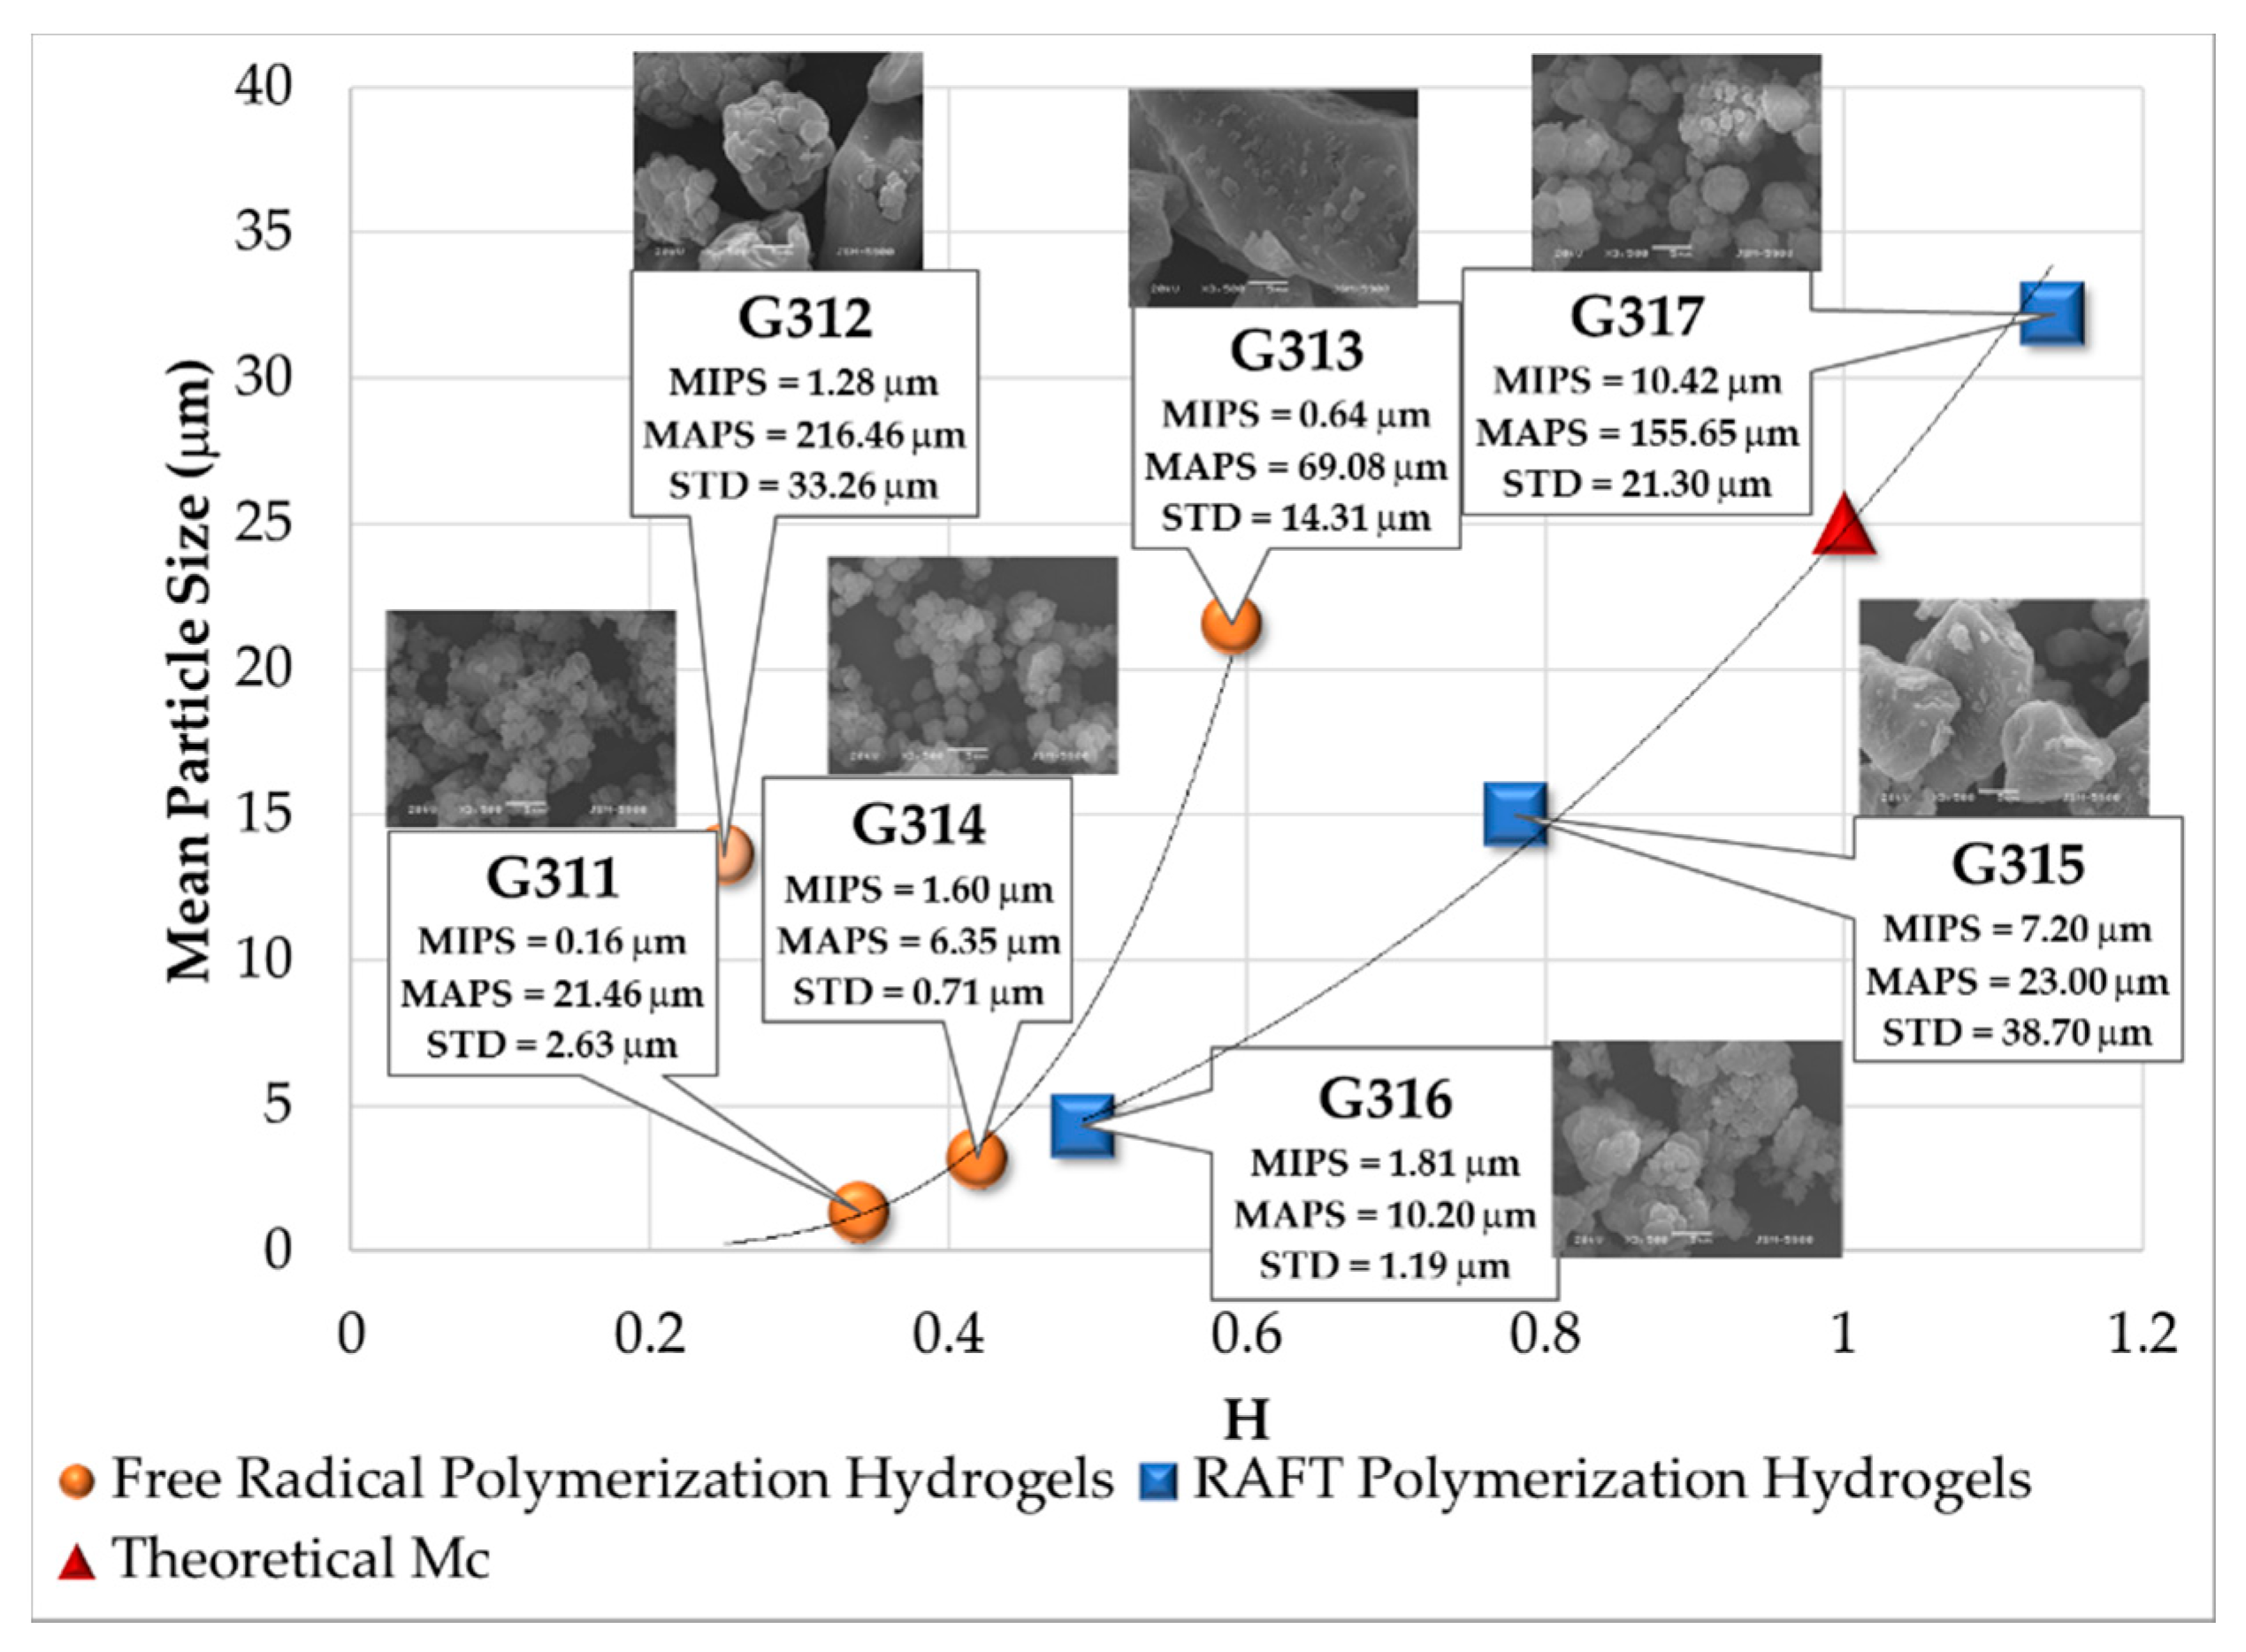
3.5. Analysis of SEM Images

The morphologies of the materials synthesized by FRP and RAFT copolymerizations were observed and analyzed using SEM. SEM micrographs at 90 and 3500 magnifications for FRP and RAFT synthesized hydrogels are shown in Figure 11 and Figure 12, respectively.
SEM images of hydrogels synthesized by FRP are shown in Figure 11. Two main morphologies are observed: solid blocks, as in samples G311 and G313 (Krytox used in the syntheses) and small spheres gathered in bunches, like raspberries, as in samples G314 and G312 (no Krytox used in the syntheses).
As observed in Figure 12, the same two morphologies (blocks and raspberries) were obtained for the particles corresponding to hydrogels synthesized by RAFT copolymerization. Sample G315, synthesized in the presence of Krytox as the dispersant, consisted of solid blocks. Samples G316 and G317 consisted of mostly raspberry spheres, with some blocks.
Particle size distribution data are shown in Figure 13 as mean particle size (MPS) vs. H. Clear linear trends, distinct for each population, are observed. Sample G312 for hydrogels synthesized by FRP is the only case not following the linear trend. Minimum and maximum particle sizes, as well as the standard deviation for all of the samples considered in this study are also shown in Figure 13 (see the numbers in boxes).
It is observed in Figure 13 that the trend line for samples synthesized by RAFT copolymerization of HEMA and EDGMA crosses the value of H = 1 (theoretical value) at MPS = 25 μm. It would be interesting to carry out additional experiments to corroborate this prediction. This linear trend between MPS and H indicates that polymer networks with low Mcexp values (highly crosslinked polymer networks) will result in small (compact) particles. Likewise, polymer networks with high Mcexp values (slightly crosslinked or loose polymer networks) will result in large particles.
Regarding morphology, in general terms, all samples tended to form spherical particles, arranged as raspberries. However, in the samples where Krytox was used as the dispersing agent, solid blocks were observed. These differences are influenced by the thermodynamic conditions achieved by the reacting mixture in the presence of Krytox. Further experimentation is needed to clarify the effect of Krytox on the morphology of hydrogel particles synthesized by conventional (FRP) or RAFT copolymerization of HEMA and EDGMA in scCO2.

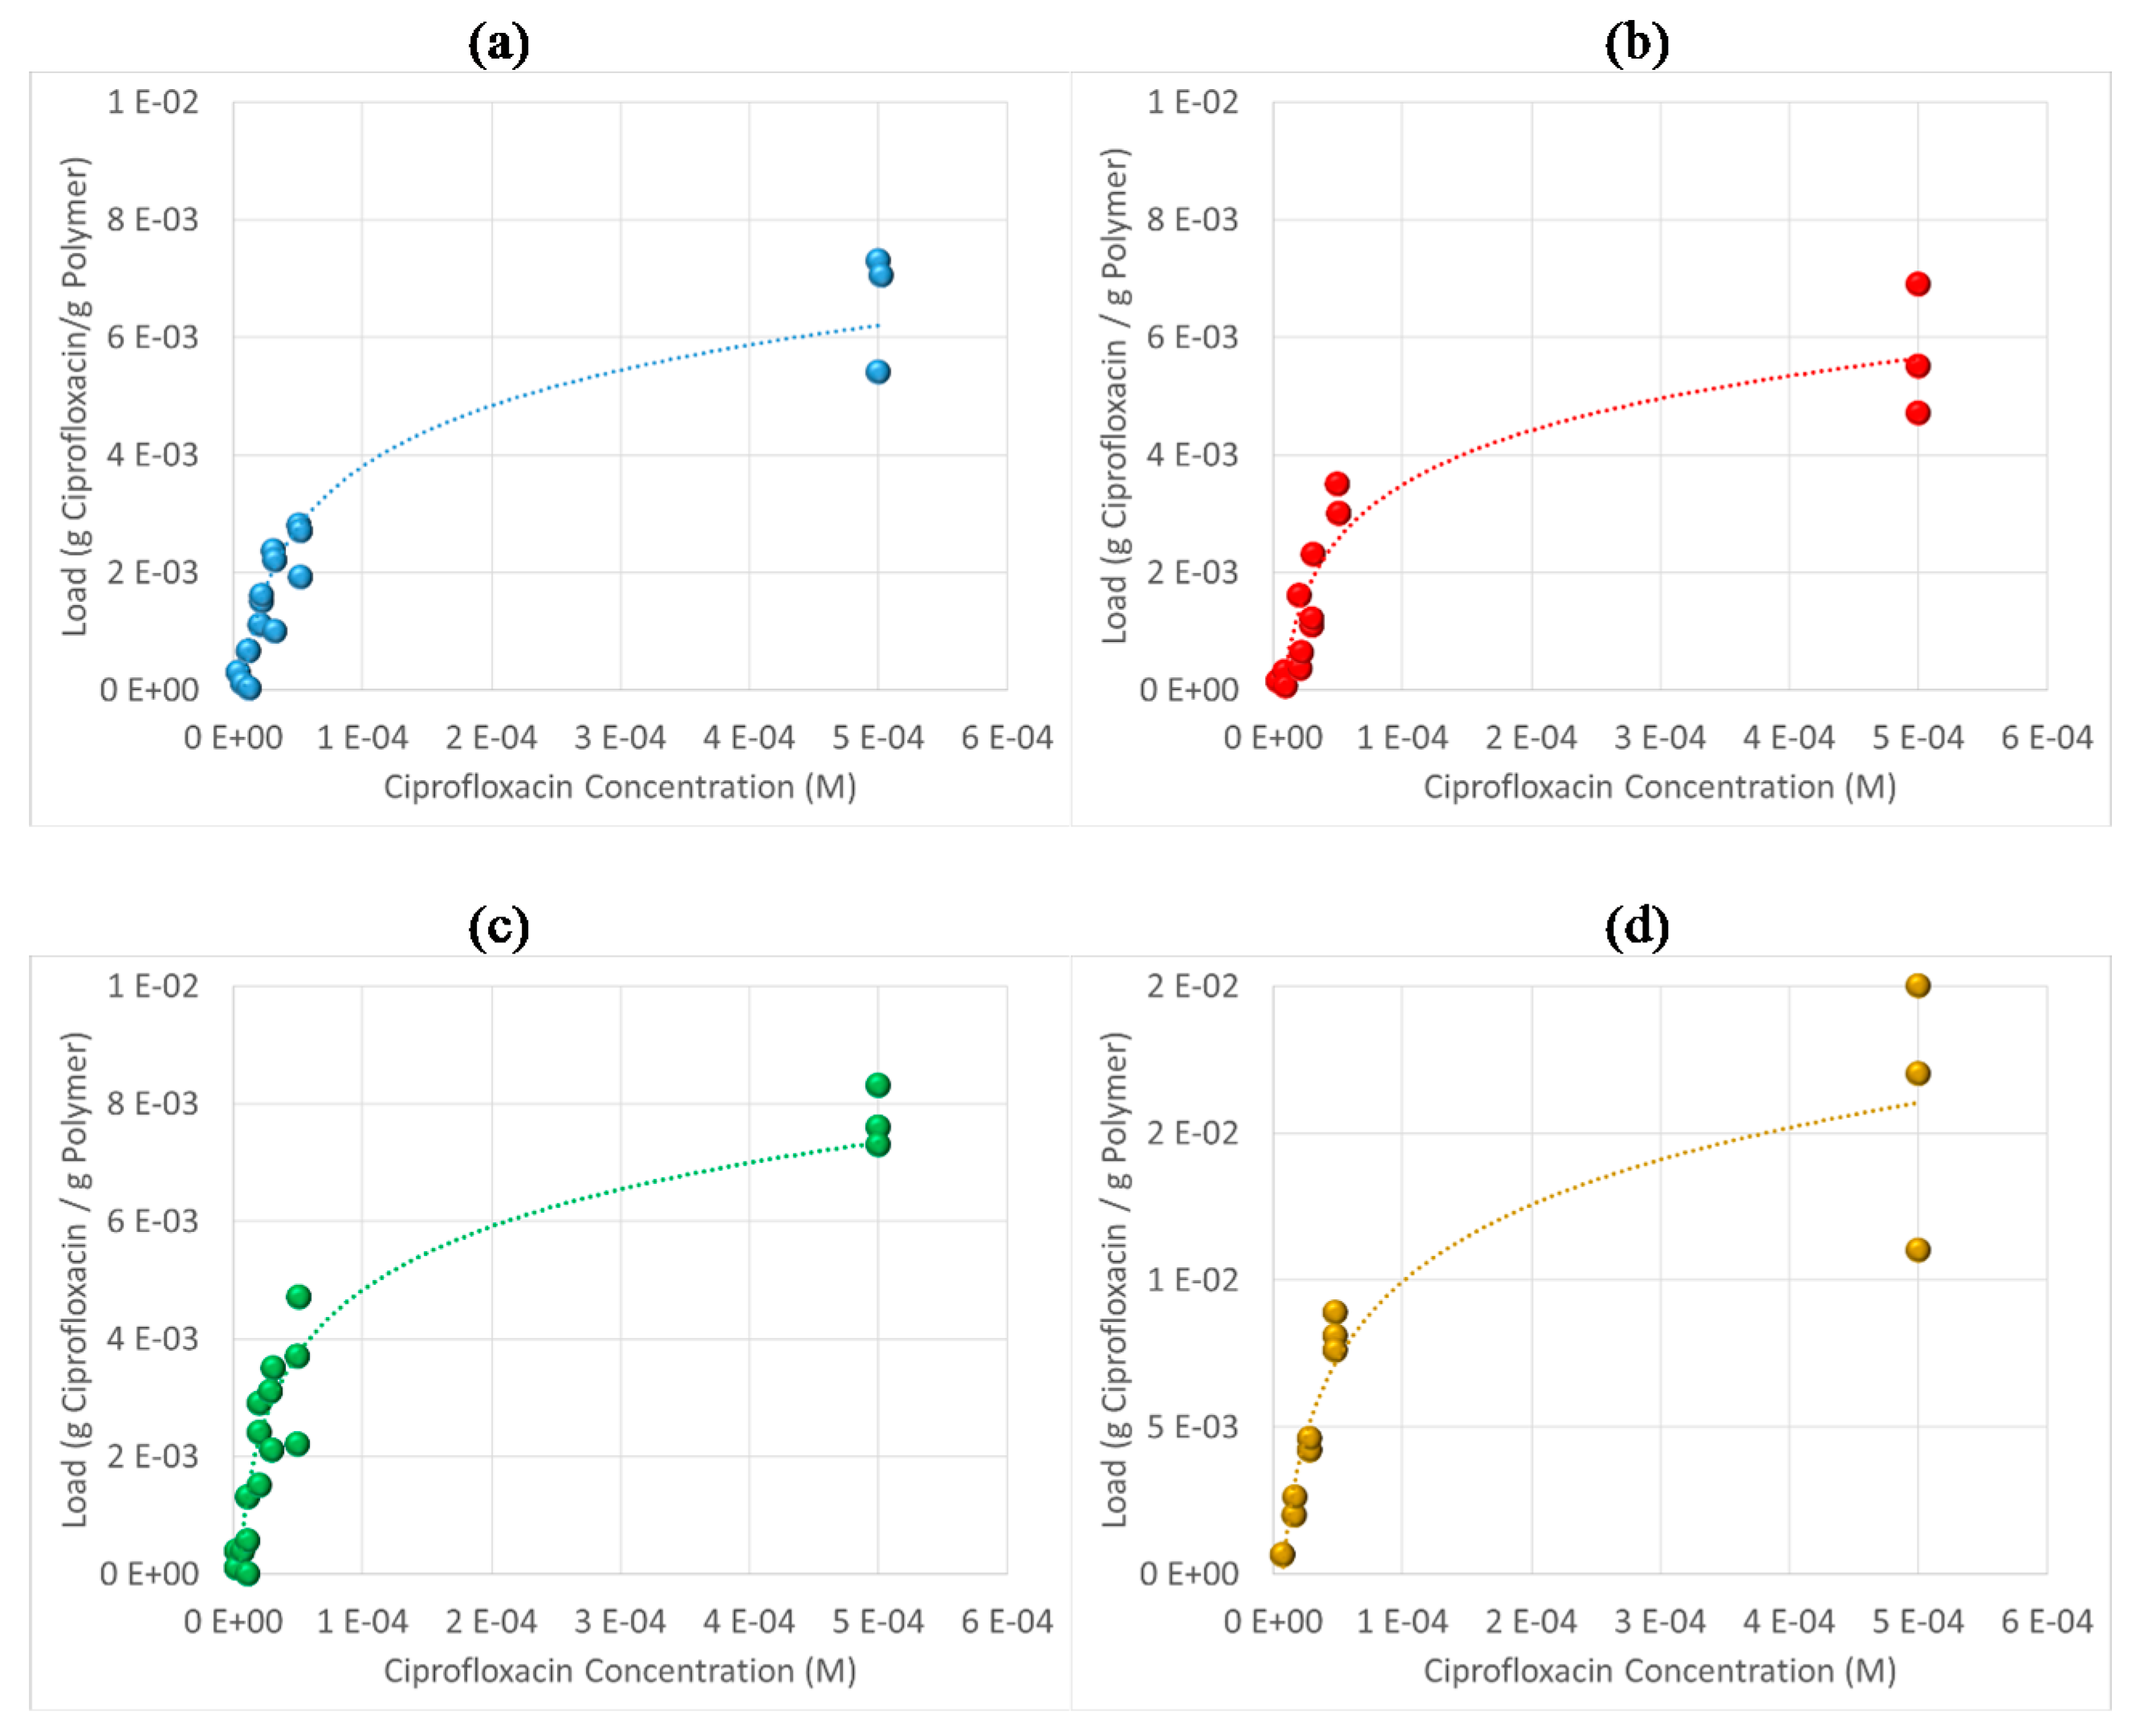
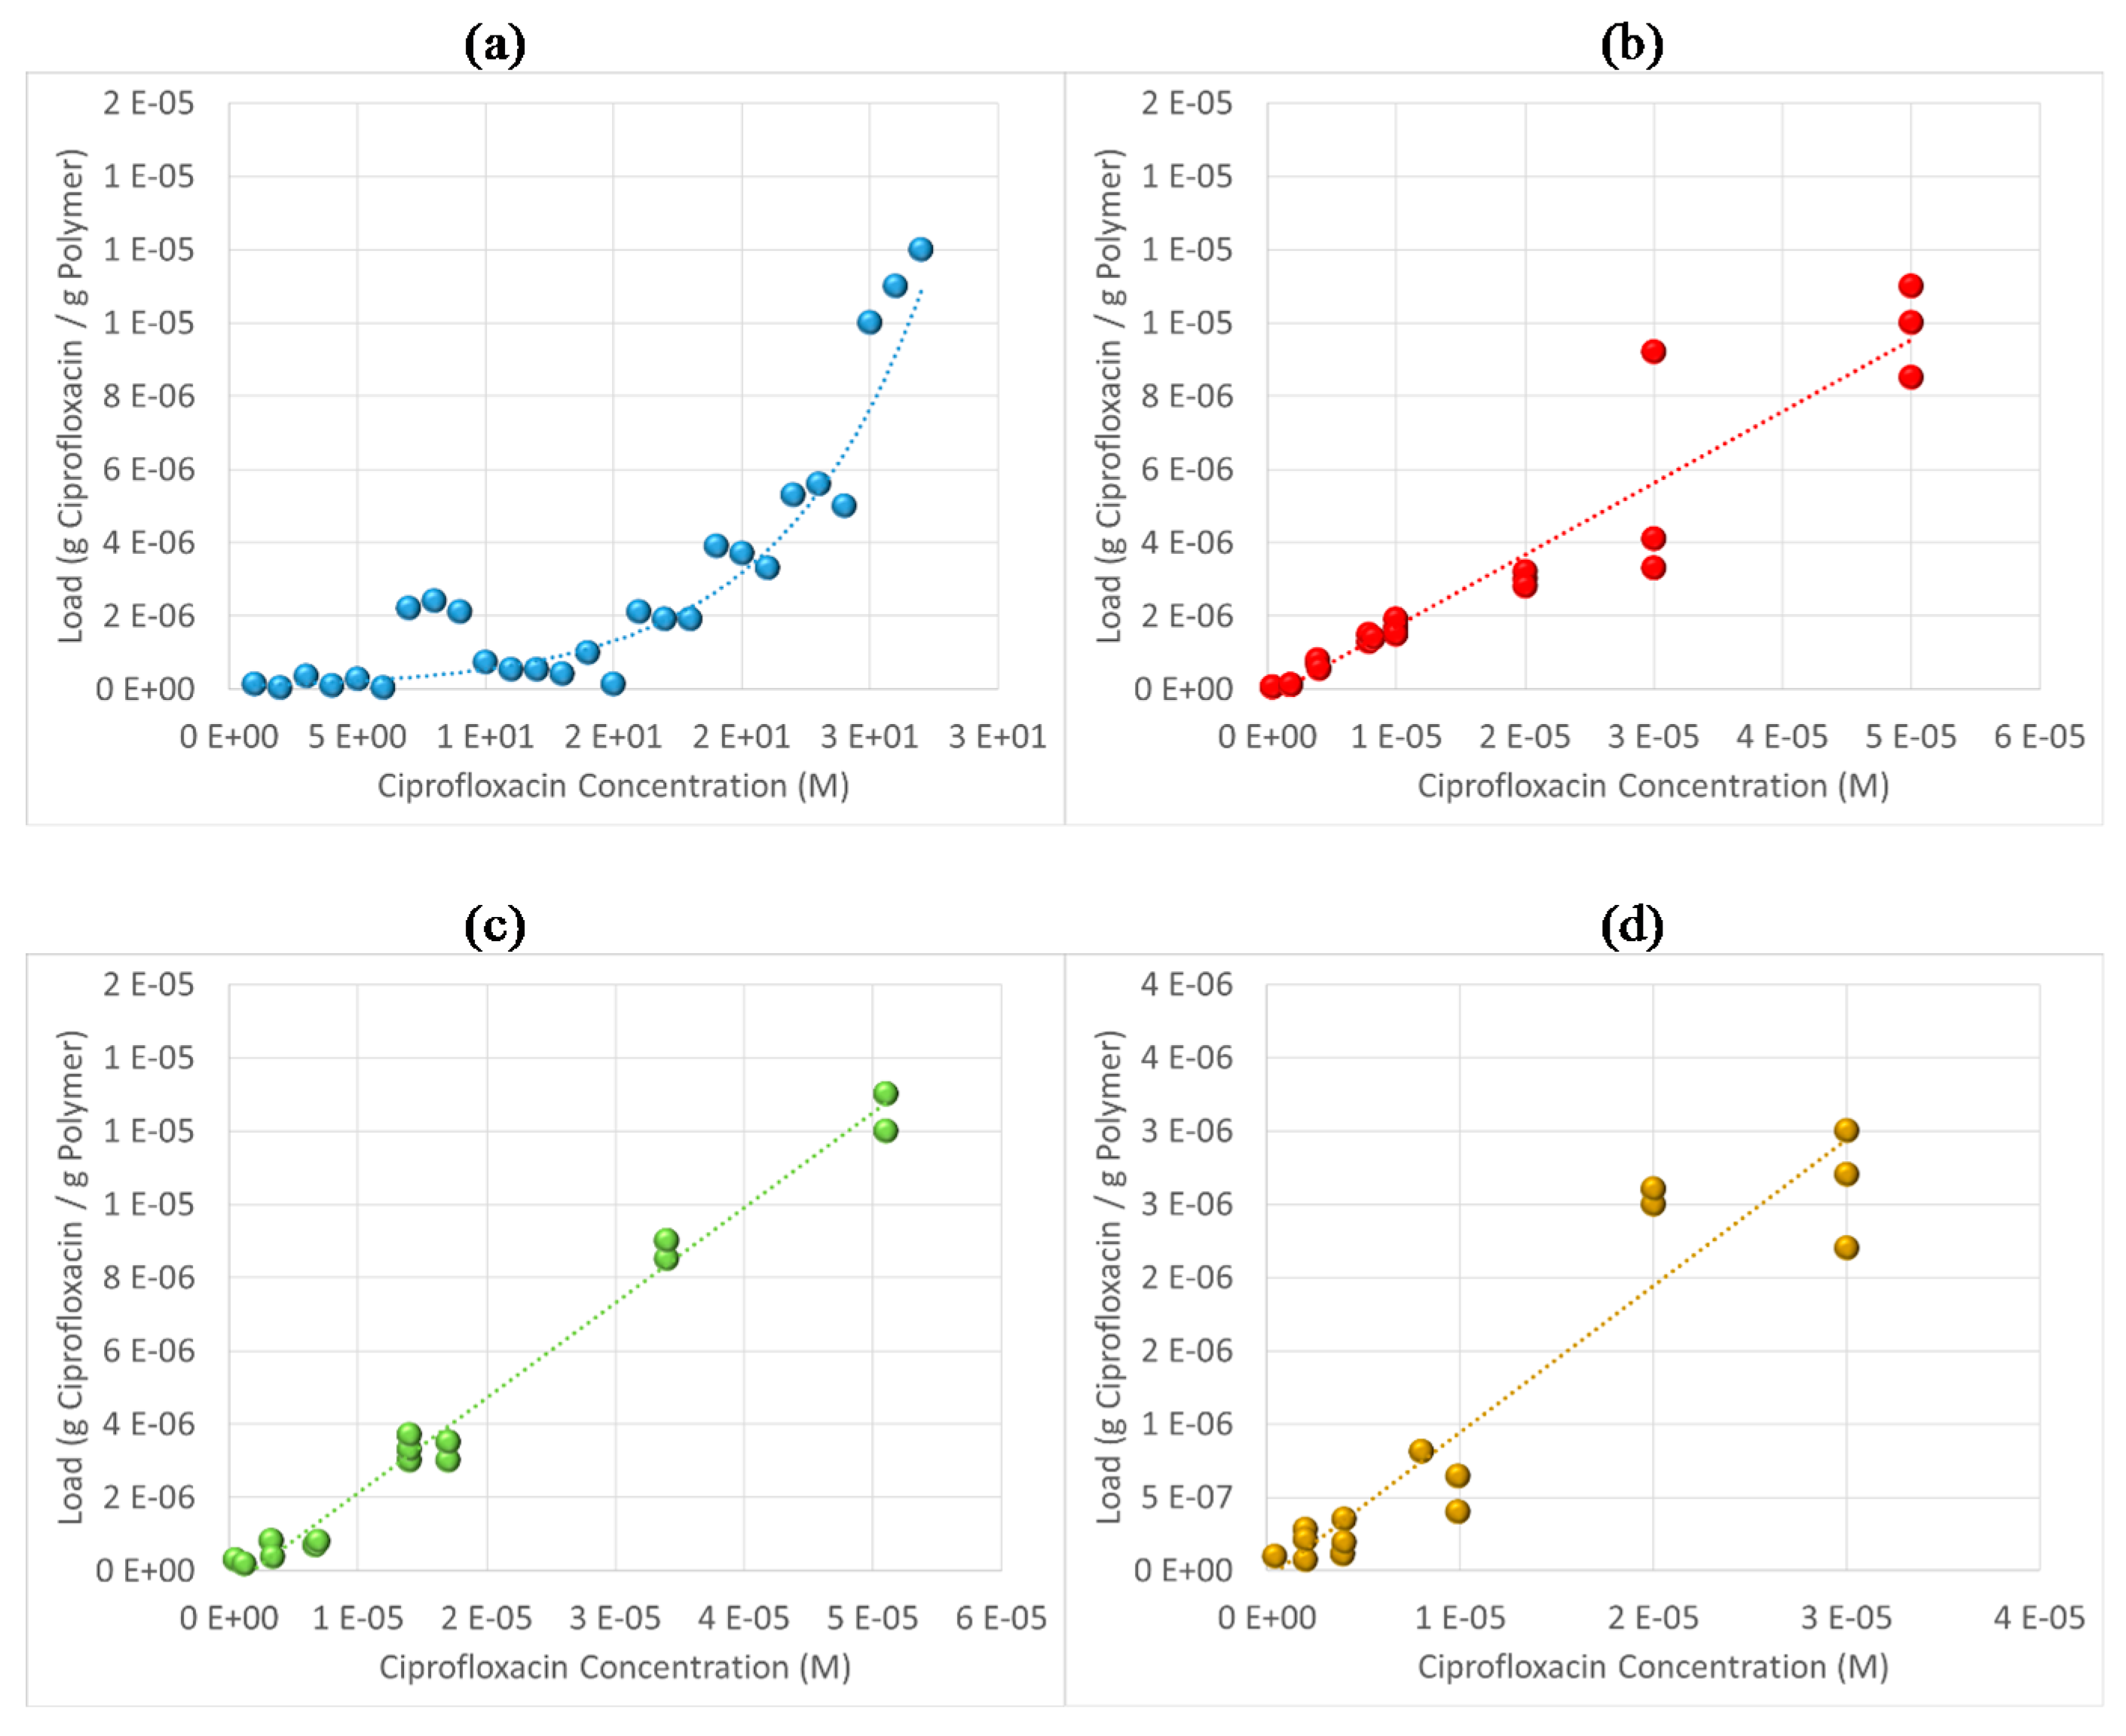
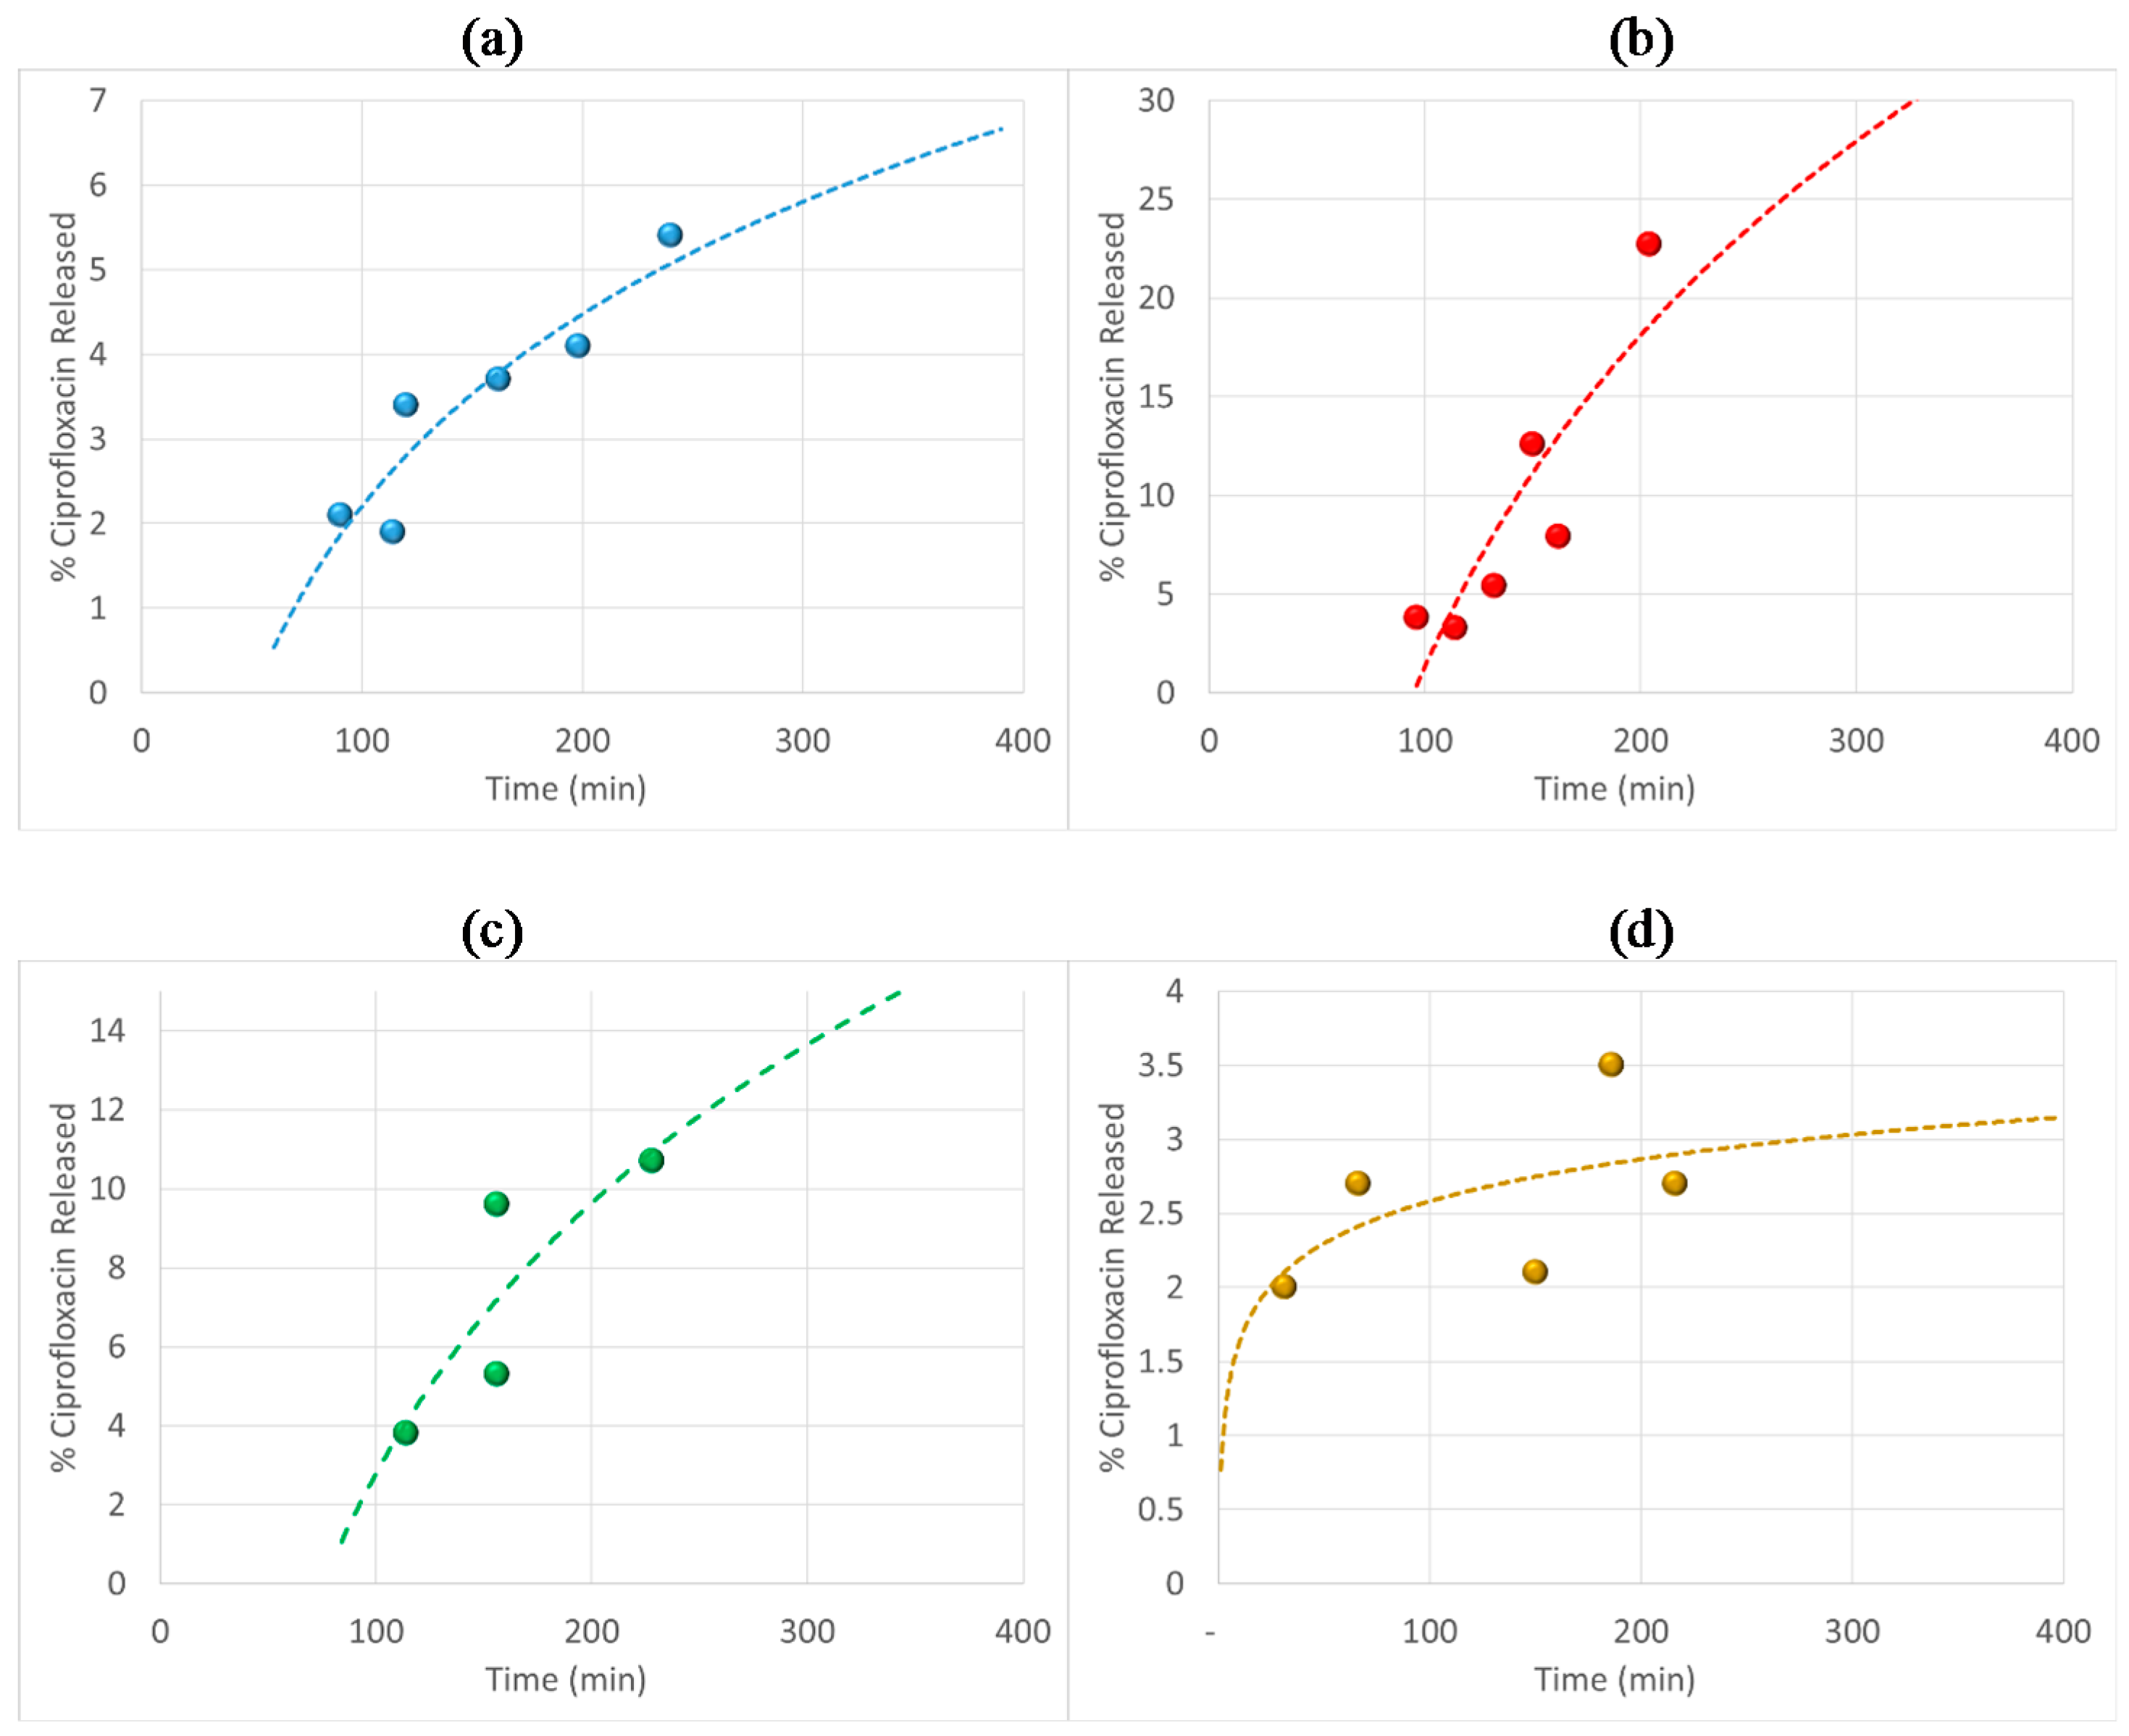
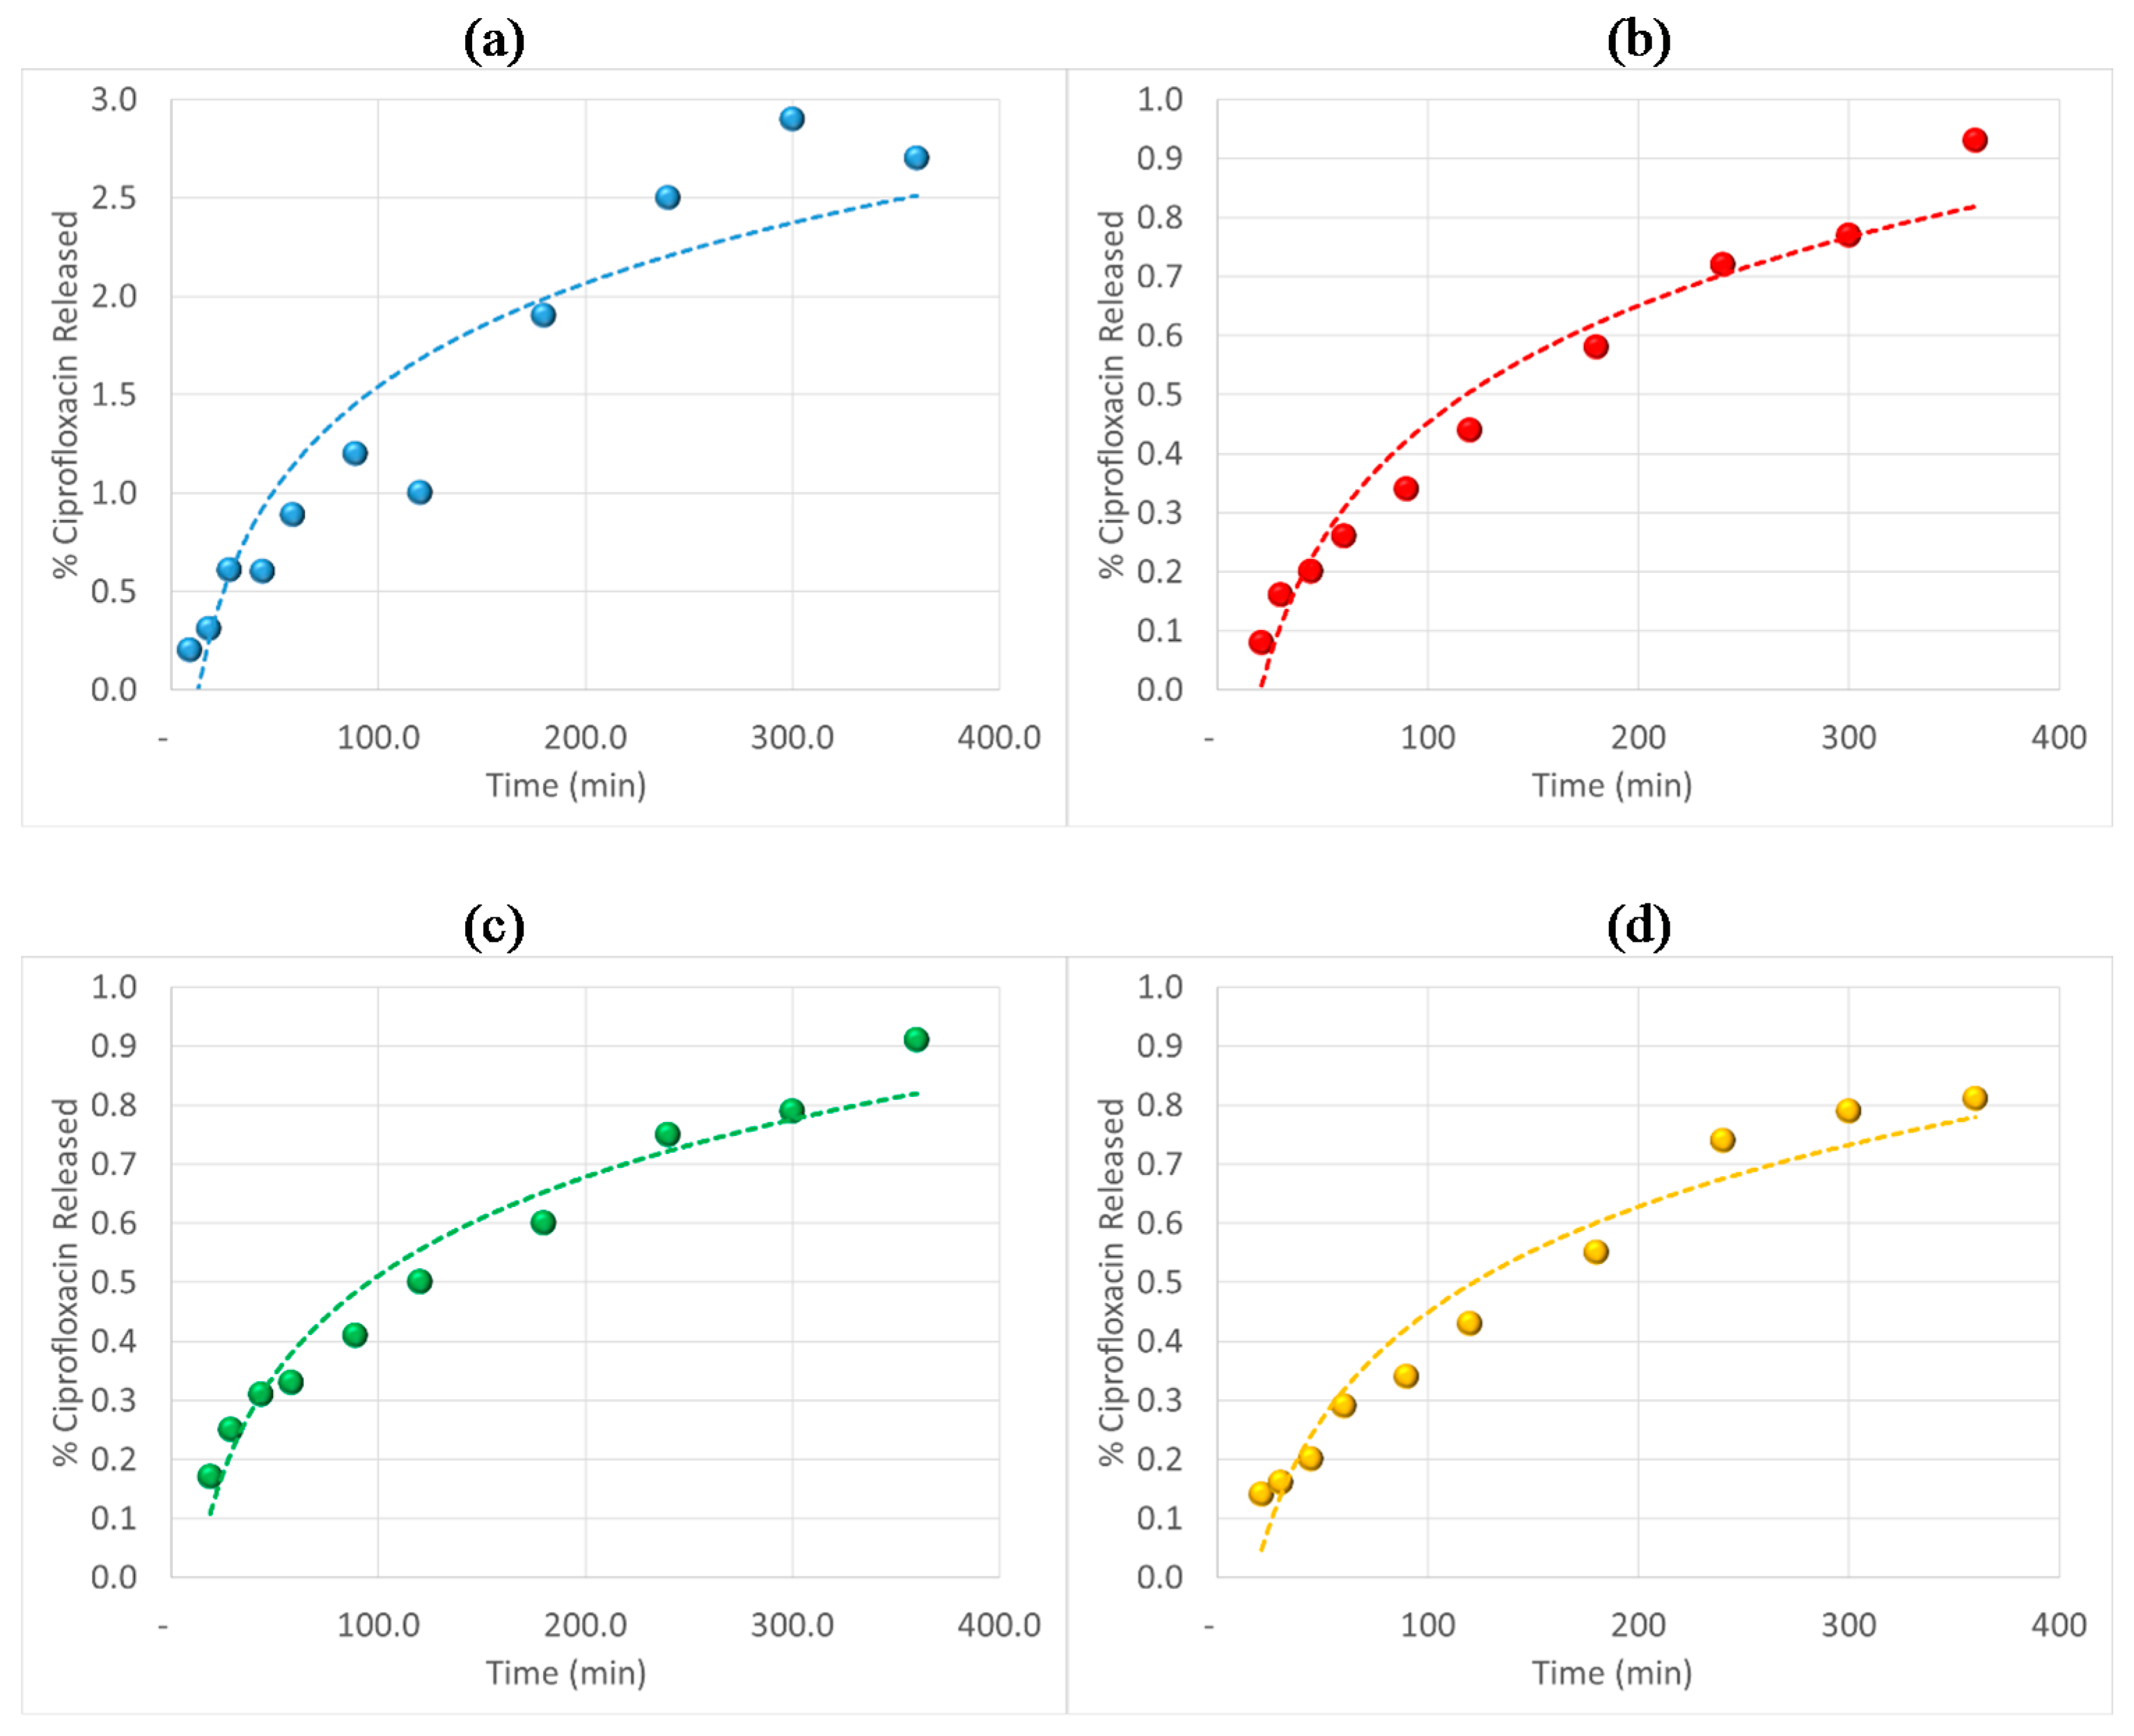
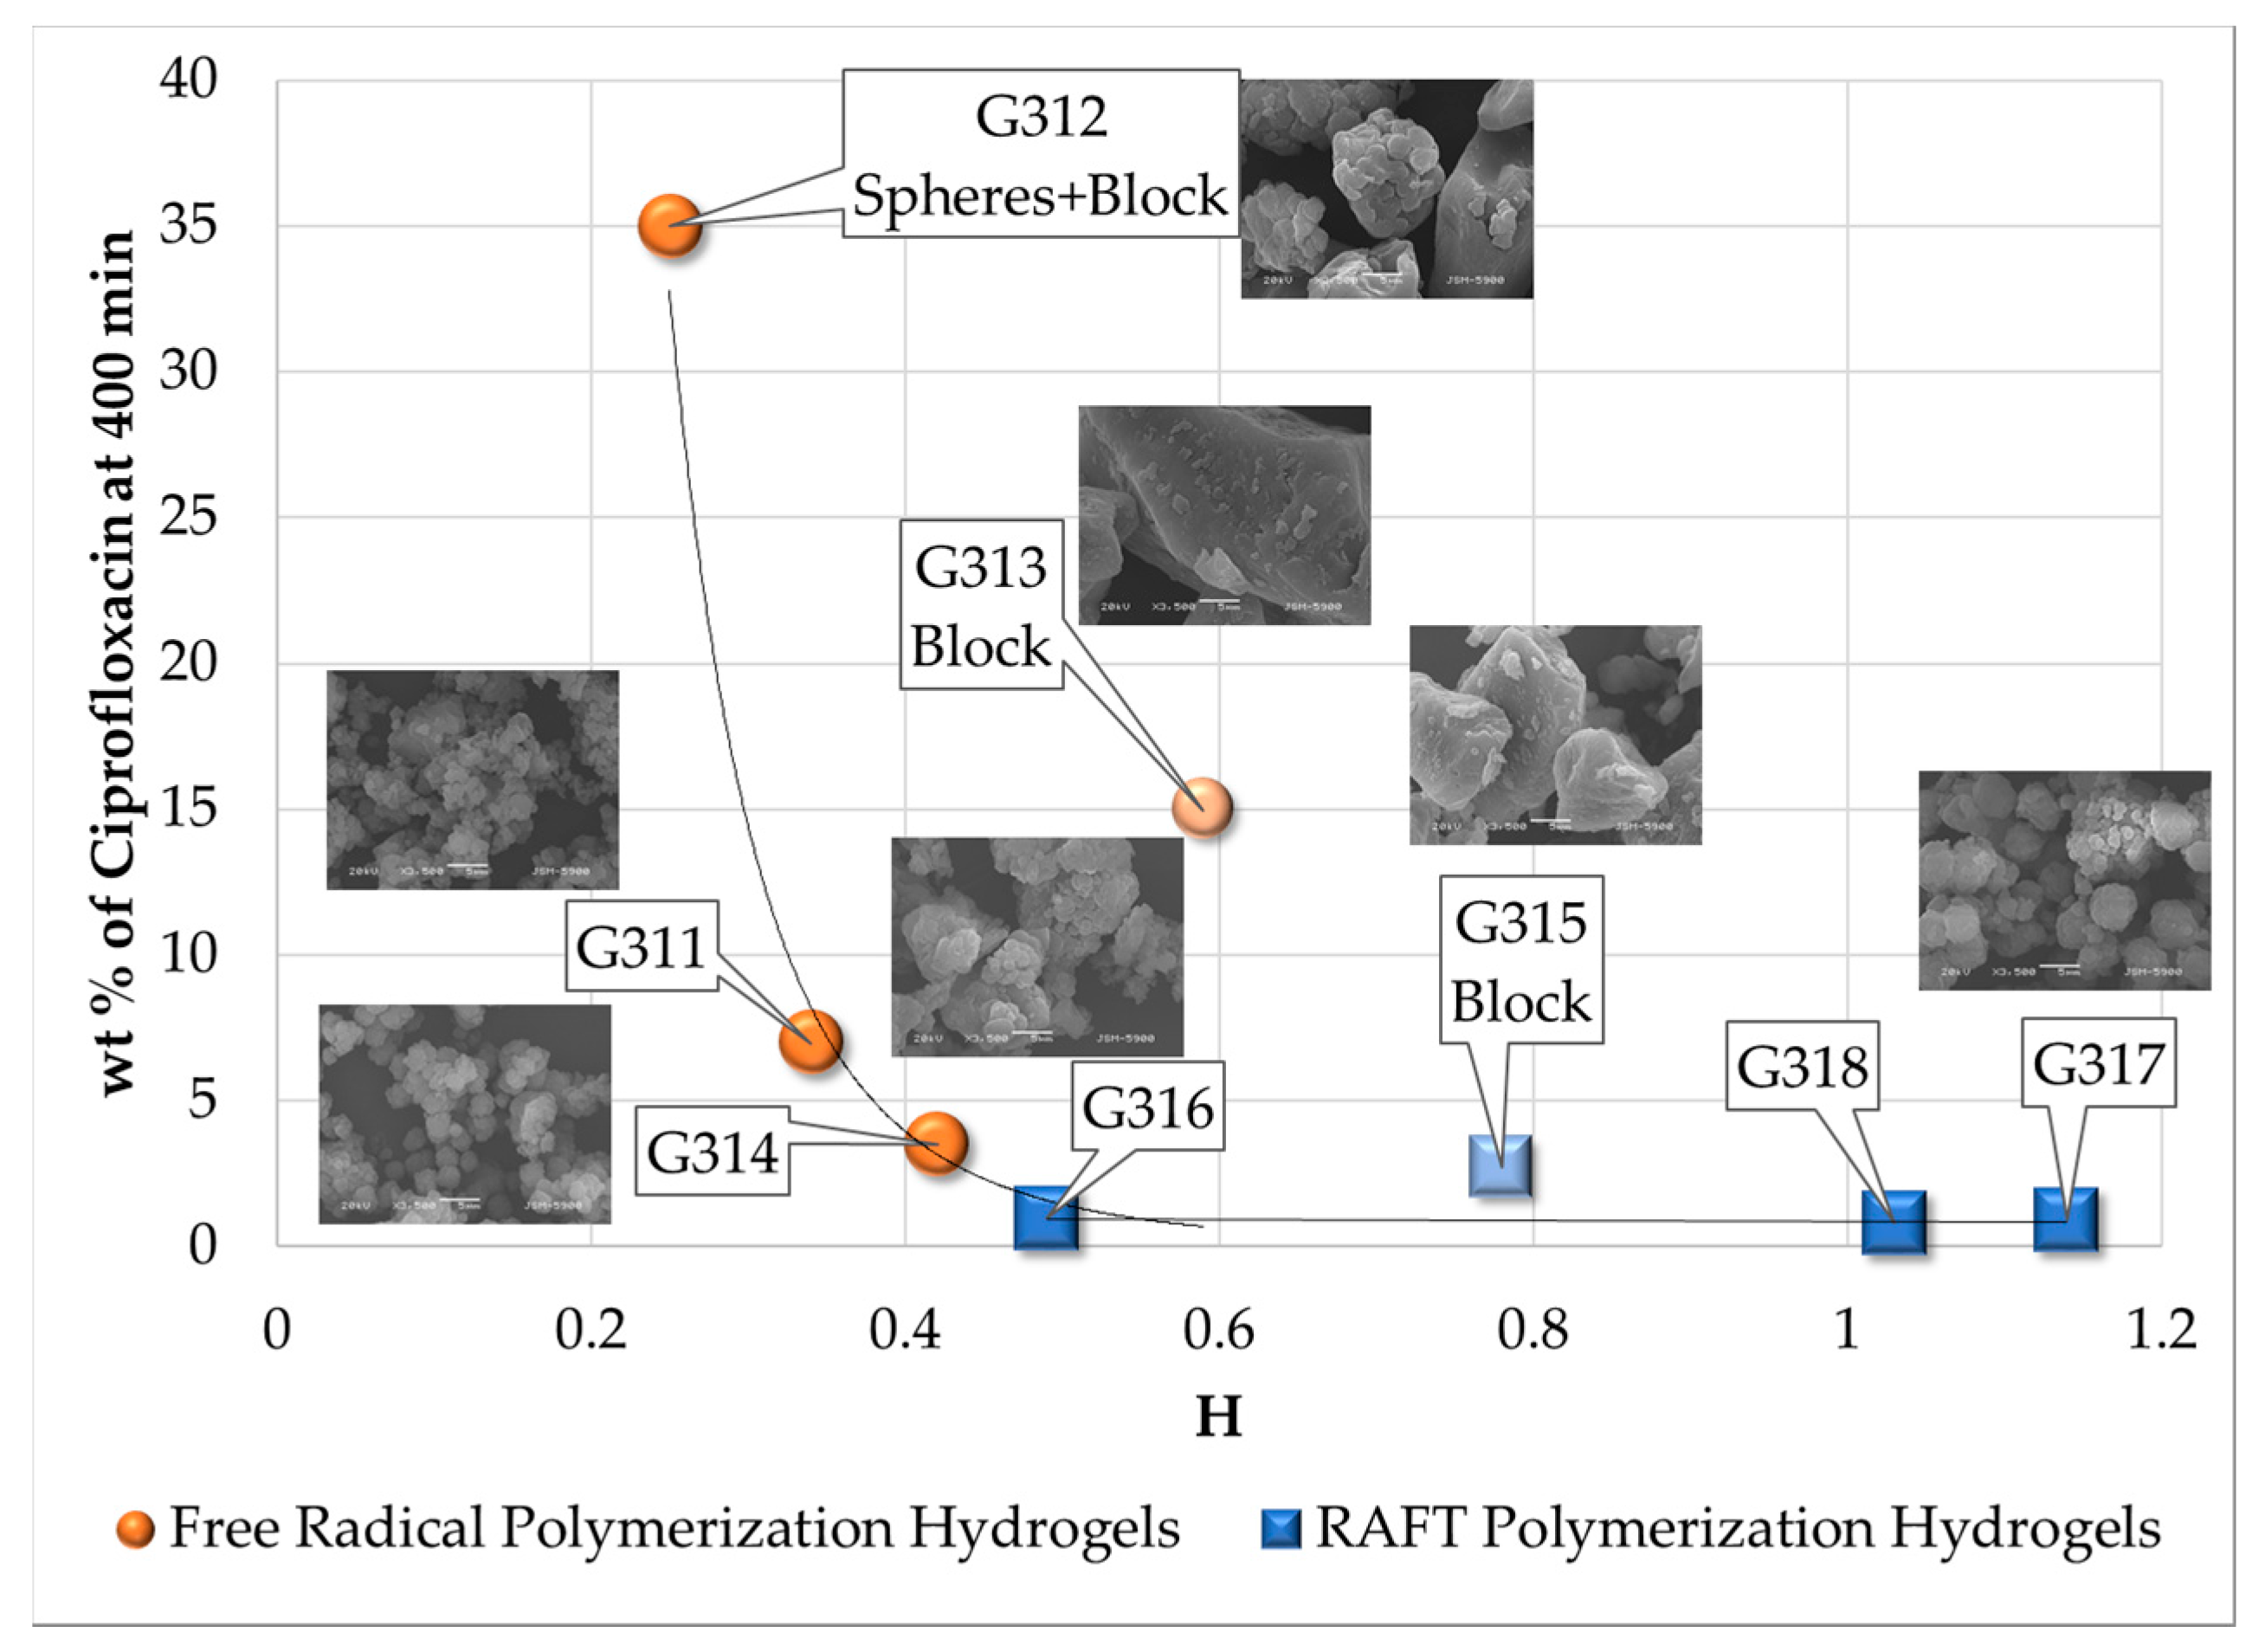
3.6. Antibiotic Loading, Adsorption and Release Studies

The last study carried out with our hydrogels was the loading and release of ciprofloxacin, a fluoroquinolone antibiotic. The objective was to assess if the synthesized materials performed differently in an actual application, depending on the synthetic route. In a previous study using vitamin B12, we found that our FRP and RAFT synthesized materials perform differently [26].
Ciprofloxacin adsorption isotherm plots using hydrogels synthesized by FRP of HEMA and EGDMA in scCO2 are shown in Figure 14. The corresponding profiles using hydrogels synthesized by RAFT copolymerization of HEMA and EGDMA in scCO2 are shown in Figure 15. As observed in Figure 14, type I adsorption isotherms are obtained in the case of hydrogels synthesized by FRP. This means that weak interactions between polymer matrix and the antibiotic are present. On the other hand, as observed in Figure 15, adsorption isotherms types II, V and VI are obtained in the case of hydrogels synthesized by RAFT copolymerization. These types of isotherms are related to pores having restrictions to their cavities, which seems to be the case with blackberry morphologies. This may explain why RAFT synthesized hydrogels have low antibiotic loading levels, compared to hydrogels synthesized by FRP.
Ciprofloxacin release rates from hydrogels synthesized by FRP and RAFT copolymerizations of HEMA and EGDMA in scCO2 are shown in Figure 16 and Figure 17, respectively. It is observed that the release rate of ciprofloxacin from hydrogels synthesized by FRP is higher than in hydrogels synthesized by RAFT copolymerization. A maximum release rate of 25% at 200 min for sample G312 was obtained in the case of hydrogels synthesized by FRP. The maximum release rate obtained with RAFT hydrogels was 3% at 300 min (sample G315). However, broad dispersion of data is observed in the case of hydrogels synthesized by FRP (maximum release rates from 4 to 25%). If we extrapolate the results shown in Figure 16 and Figure 17, it would take 25,000 min (420 h) to release ~80 to 90% of the total loaded ciprofloxacin from hydrogels synthesized by RAFT copolymerization. This can be considered a true controlled release system.
In order to get a better understanding of the relationship between ciprofloxacin release rate and polymer network homogeneity, a plot of wt% ciprofloxacin released at 400 min vs. H is shown in Figure 18. Except for samples with block only morphologies (samples G313 and G315, both synthesized using Krytox), a clear difference in ciprofloxacin release performance between the two types of polymer networks (FRP and RAFT synthesized) is observed (see the trend lines in Figure 18). It seems that samples having block morphologies release higher amounts of ciprofloxacin, compared to the analogous samples with raspberry morphologies. In order to understand this behavior, we have to keep in mind that block morphologies are assumed to be less restrictive for ciprofloxacin escape from the hydrogel matrix. Ciprofloxacin molecules must escape from the block, and no further organized hydrogel matrices are found. Holes between blocks are big enough to consider them as a bulky phase. Raspberry morphologies, on the other hand, represent a major escape challenge, since ciprofloxacin molecules must escape the volume within individual spheres, between neighbor spheres and between raspberry bunches. These spaces are too close among themselves to be considered as a bulky phase. This concept is illustrated in Figure 4 of Pérez-Salinas et al. [26].

4. Conclusions

Several considerations must be taken into account in the synthesis of hydrogels in supercritical or near supercritical carbon dioxide. One of such considerations is the thermodynamic behavior of the reacting mixture at different pressures and temperatures. It is important to identify the region of a phase diagram where one is working. It is also important to take into account the solubility in scCO2 of the components present in the reacting mixture, since it can drastically change during the startup of the reaction and even during the reaction itself, depending on temperature and, most importantly, pressure. Characterization of polymer networks is a challenging task. As shown in this contribution, at first glance, most of the data collected from different characterization techniques seemed to be unrelated. However, the use of the polymer network homogeneity parameter (H), proposed in this contribution, allowed us to identify and even quantify the differences in the properties and performance between polymer networks synthesized by FRP and RAFT copolymerization of HEMA and EGDMA in scCO2. Since the determination of H relies on SI, it is very important to get a reliable determination of this property.
One important aspect to take into account when explaining the differences in behavior and performance between polymer networks synthesized by FRP or RAFT copolymerization of vinyl/divinyl monomers in scCO2 is polymerization time. For instance, as observed in Figure 6, an ~100% gel fraction is achieved at 24 h for polymer networks synthesized by FRP, whereas only ~80 to 90% (and large spread of data) has been achieved at the same time when the synthesis proceeds in the presence of an RAFT agent. This means that remaining monomer can last longer in RAFT polymerization, thus swelling the hydrogel in formation, promoting different morphologies and increasing the possibility of significantly changing the thermodynamic behavior of the reacting mixture if a small to moderate variation in pressure or temperature occurs inside the reactor during that time.
The use of Krytox remains unclear in our system since it seemed to promote the formation of hydrogels with solid block morphologies. As pointed out earlier, Krytox is highly soluble in scCO2, but its solubility in HEMA and EGDMA is poor. Further experimentation is needed to fully elucidate the role of Krytox in the synthesis of hydrogels in scCO2.

Supplementary Files

Supplementary File 1

Acknowledgments

Financial support from the following sources is gratefully acknowledged: (a) Consejo Nacional de Ciencia y Tecnología (CONACYT, México), Project CB 239364 and the Ph.D. scholarship granted to P.P.-S.; (b) CONACYT and Essencefleur de México S.A. de C.V., Project FIT 235804; (c) CONACYT and Essencefleur de México S.A. de C.V., Project PEI 220695; (d) DGAPA-UNAM, Project PAPIIT IG100815; (e) Facultad de Química-UNAM, research funds granted to E.V.-L. (PAIP 5000-9078). No funds for covering the costs to publish in open access were received from the above mentioned sources. The help and support from Prof. Enrique Bazúa-Rueda on the use and interpretation of results of ASPEN PLUS for this application is gratefully acknowledged.

Author Contributions

Eduardo Vivaldo-Lima conceived of the idea of improving the performance of polymer networks by RAFT synthesis in scCO2, put together and led the research team. Patricia Pérez-Salinas conceived of and carried out the thermodynamic analyses and measurements, including the concept of a polymer network homogeneity parameter; she also led the swelling, gel fraction determination and SEM analyses. Gabriel Jaramillo-Soto synthesized the polymer networks by FRP and RAFT copolymerization of HEMA and EGDMA in scCO2. Humberto Vázquez-Torres, Ángel Licea-Claverie and Ma. Josefa Bernad-Bernad designed with Eduardo Vivaldo-Lima the original research strategy and types of characterization techniques that would be needed. Patricia Pérez-Salinas carried out the FTIR and DSC characterization analyses with guidance from Alberto Rosas-Aburto and Humberto Vázquez-Torres. Ma. Josefa Bernad-Bernad conceived and led the loading, adsorption and release studies. Ángel Licea-Claverie trained and guided Patricia Pérez-Salinas and Alberto Rosas-Aburto in the continuation and analysis of data for these studies. Patricia Pérez-Salinas put together the first complete manuscript draft, which was revised by Eduardo Vivaldo-Lima, Alberto Rosas-Aburto, Humberto Vázquez-Torres, Ángel Licea Claverie and Ma. Josefa Bernad-Bernad.

Conflicts of Interest

The authors declare no conflict of interest. The funding sponsors had no role in the design of the study; in the collection, analyses or interpretation of data; in the writing of the manuscript; nor in the decision to publish the results.

References

  1. Bhattacharya, A.; Rawlins, J.W.; Ray, P. Polymer Grafting and Crosslinking, 1st ed.; John Wiley & Sons: Hoboken, NJ, USA, 2009; pp. 1–100, 145–319. [Google Scholar]
  2. Menard, K.P. Dynamic Mechanical Analysis: A Practical Introduction, 2nd ed.; CRC Press, Taylor & Francis Group: Boca Raton, FL, USA, 2008; pp. 95–122. [Google Scholar]
  3. Seidel, A. Characterization Analysis of Polymers, 1st ed.; Wiley-Interscience: Hoboken, NJ, USA, 2008; pp. 649–675. [Google Scholar]
  4. Wunderlich, B. Thermal Analysis of Polymeric Materials, 1st ed.; Springer: Berlin/Heidelberg, Germany, 2005; pp. 597–609. [Google Scholar]
  5. Espinosa-Pérez, L.; Hernández-Ortiz, J.C.; López-Domínguez, P.; Jaramillo-Soto, G.; Vivaldo-Lima, E.; Péerez-Salinas, P.; Rosas-Aburto, A.; Licea-Claverie, Á.; Vázquez-Torres, H.; Bernad-Bernad, M.J. Modeling of the Production of Hydrogels from Hydroxyethyl Methacrylate and (Di) Ethylene Glycol Dimethacrylate in the Presence of RAFT Agents. Macromol. React. Eng. 2014, 8, 564–579. [Google Scholar] [CrossRef]
  6. Scherf, R.; Müller, L.S.; Grosch, D.; Hübner, E.G.; Oppermann, W. Investigation on the homogeneity of PMMA gels synthesized via RAFT polymerization. Polymer 2015, 58, 36–42. [Google Scholar] [CrossRef]
  7. Moad, G. RAFT (Reversible Addition-Fragmentation Chain Transfer) Crosslinking (Co)polymerization of Multi-Olefinic Monomers to Form Polymer Networks. Polym. Int. 2015, 64, 15–24. [Google Scholar] [CrossRef]
  8. Matyjaszewski, K. Atom Transfer Radical Polymerization (ATRP): Current Status and Future Perspectives. Macromolecules 2016, 45, 4015–4039. [Google Scholar] [CrossRef]
  9. Chatgilialoglu, C.; Ferreri, C.; Matyjaszewski, K. Radicals and Dormant Species in Biology and Polymer Chemistry. ChemPlusChem 2016, 81, 11–29. [Google Scholar] [CrossRef]
  10. Jaramillo-Soto, G.; Vivaldo-Lima, E. RAFT Copolymerization of Styrene/Divinylbenzene in Supercritical Carbon Dioxide. Aust. J. Chem. 2012, 65, 1177–1185. [Google Scholar] [CrossRef]
  11. García-Morán, P.R.; Jaramillo-Soto, G.; Albores-Velasco, M.E.; Vivaldo-Lima, E. An Experimental Study on the Free-Radical Copolymerization Kinetics with Crosslinking of Styrene and Divinylbenzene in Supercritical Carbon Dioxide. Macromol. React. Eng. 2009, 3, 58–70. [Google Scholar] [CrossRef]
  12. Kiran, E. Supercritical Fluids and Polymers—The Year in Review—2014. J. Supercrit. Fluids 2016, 110, 126–153. [Google Scholar] [CrossRef]
  13. Boyère, C.; Jérôme, C.; Debuigne, A. Input of Supercritical Carbon dioxide to Polymer Synthesis: An Overview. Eur. Polym. J. 2014, 61, 45–63. [Google Scholar] [CrossRef]
  14. Kemmere, M.F. Supercritical Carbon Dioxide in Polymer Reaction Engineering, 1st ed.; Kemmere, M.F., Meyer, T., Eds.; Wiley-VCH Verlag GmbH & Co.: Weinheim, Germany, 2005; pp. 15–34. [Google Scholar]
  15. Gupta, R.B.; Shim, J.J. Solubility in Supercritical Carbon Dioxide, 1st ed.; CRC Press, Taylor & Francis Group: Boca Raton, FL, USA, 2007; pp. 1–18. [Google Scholar]
  16. Khansary, M.A.; Amiri, F.; Hosseini, A.; Sani, A.H.; Shahbeig, H. Representing Solute Solubility in Supercitical Carbon Dioxide: A Novel Empirical Model. Chem. Eng. Res. Des. 2015, 93, 355–365. [Google Scholar] [CrossRef]
  17. Brown, R. Physical Testing of Rubber, 4th ed.; Springer: New York, NY, USA, 2006; pp. 316–326. [Google Scholar]
  18. Flory, P.J.; Rehner, J. Statistical Mechanics of Crosslinked Polymer Networks. J. Chem. Phys. 1943, 11, 521–526. [Google Scholar] [CrossRef]
  19. Flory, P.J. Statistical Mechanics of Swelling of Network Structures. J. Chem. Phys. 1950, 18, 108–111. [Google Scholar] [CrossRef]
  20. Yang, Y. Fluorous Membrane-Based Separations and Reactions. Ph.D. Thesis, University of Pittsburg, Pittsburgh, PA, USA, 22 February 2011. [Google Scholar]
  21. Bush, D. Equation of State for Windows 95 Software, version 1.0.14; Georgia Institute of Technology: Atlanta, GA, USA, 2005.
  22. Ely, J.F.; Haynes, W.M.; Bain, B.C. Isochoric (p, Vm, T) measurements on CO2 and on (0.982CO2 + 0.018N2) from 250 to 330 K at pressures to 35 MPa. J. Chem. Thermodyn. 1989, 21, 879–894. [Google Scholar] [CrossRef]
  23. Mark, J.E. Physical Properties of Polymers Handbook, 2nd ed.; Springer: New York, NY, USA, 2007; pp. 289–303. [Google Scholar]
  24. Van Krevelen, D.W.; Tenijenhuis, K. Properties of Polymers: Their Correlation with Chemical Structure; Their Numerical Estimation and Prediction from Additive Group Contributions, 4th ed.; Elsevier: Oxford UK, 2009; pp. 129–225. [Google Scholar]
  25. Aspen Technology Inc. Aspen Plus Software, version 8.8; Aspen Technology, Inc.: Bedford, MA, USA, 2016.
  26. Pérez-Salinas, P.; Rosas-Aburto, A.; Antonio-Hernández, C.H.; Jaramillo-Soto, G.; Vivaldo-Lima, E.; Licea-Claverie, Á.; Castro-Ceseña, A.B.; Vázquez-Torres, H. Controlled Release of Vitamin B-12 Using Hydogels Synthesized by Free Radical and RAFT Copolymerization in scCO2. Macromol. Symp. 2016, 360, 69–77. [Google Scholar] [CrossRef]
Figure 1. Pressure vs. temperature diagram for the system carbon dioxide, HEMA, EGDMA, AIBN, including the path followed by the reactor and the solubility parameter values estimated at each point using an equation of state, generated with ASPEN PLUS.
Processes 05 00026 g001
Figure 2. Estimation of the solubility parameters of carbon dioxide under subcritical and supercritical conditions, including the reaction path followed by the reactor.
Processes 05 00026 g002
Figure 3. Solute-solvent Flory interaction parameter, χ, versus pressure, for solutes HEMA, polymer network and Krytox 157 FSL, in CO2 (solvent). A solute is soluble in the solvent when χ < 0.84.
Processes 05 00026 g003
Figure 4. Correlation between experimental results of swelling index (SI) and calculated average molecular weight between crosslinks, using Equation (1).
Processes 05 00026 g004
Figure 5. Schematic representation of the Mc distribution in polymer networks and how they differ for hydrogels synthesized by FRP and RAFT copolymerizations.
Processes 05 00026 g005
Figure 6. Correlation between gel content and the polymer network homogeneity parameter (H).
Processes 05 00026 g006
Figure 7. FTIR spectra (a) and enlarged view of the region of interest (b).
Processes 05 00026 g007
Figure 8. Relationship between conversion of pendant double bonds measured by FTIR and H.
Processes 05 00026 g008
Figure 9. Relationship between Tg measured by modulated differential scanning calorimetry (MDSC) and 1/Mc for hydrogels synthesized by FRP and RAFT copolymerizations.
Processes 05 00026 g009
Figure 10. Relationship between Tg measured by MDSC and H and comparison with Tg estimates from the Nielsen and DiBenedetto equations.
Processes 05 00026 g010
Figure 11. SEM images for hydrogel samples synthesized by FRP: (a) G311 (with Krytox); (b) G312 (without Krytox); (c) G313 (with Krytox); and (d) G314 (without Krytox).
Processes 05 00026 g011aProcesses 05 00026 g011b
Figure 12. SEM images for hydrogel samples synthesized by RAFT copolymerization: (a) G315 (with Krytox); (b) G316 (without Krytox); and (c) G317 (with Krytox).
Processes 05 00026 g012aProcesses 05 00026 g012b
Figure 13. Correlation between MPS and H for hydrogels synthesized by FRP and RAFT copolymerizations of HEMA and EGDMA in scCO2. Abbreviations: MIPS = minimum particle size; MAPS = maximum particle size; STD = standard deviation.
Processes 05 00026 g013
Figure 14. Adsorption isotherm charts for hydrogels synthetized by FRP. Samples: (a) G311; (b) G312; (c) G313; and (d) G314.
Processes 05 00026 g014
Figure 15. Adsorption isotherm charts for hydrogels synthetized by RAFT copolymerization. Samples: (a) G315; (b) G316; (c) G317; and (d) G318.
Processes 05 00026 g015
Figure 16. Ciprofloxacin release rate from polymer networks synthetized by FRP. Samples: (a) G311; (b) G312; (c) G313; and (d) G314.
Processes 05 00026 g016
Figure 17. Ciprofloxacin release rate from polymer networks synthetized by RAFT copolymerization. Samples: (a) G315; (b) G316; (c) G317; and (d) G318.
Processes 05 00026 g017
Figure 18. Relationship among the amount of ciprofloxacin released at 400 min from hydrogels, morphology and H.
Processes 05 00026 g018
Table 1. Summary of experimental conditions for the FRP or RAFT copolymerization of HEMA/EDGMA in supercritical carbon dioxide (scCO2) (T = 65 °C, P = 173 bar, t = 24 h, 22% w/v CO2).
SampleHEMA (mmol)EGDMA (mmol)AIBN (mmol)RAFT Agent (mmol)Krytox (mmol)
G311251.250.105 wt%/HEMA
G312251.250.100
G313251.250.105 wt%/HEMA
G314251.250.100
G315251.250.10.055 wt%/HEMA
G316251.250.10.050
G317251.250.10.055 wt%/HEMA
G318251.250.10.050
Table 2. Summary of group contribution parameters used in Fedor’s method [24] for estimation of δP(HEMA-EGDMA) for the polymer network. The composition of HEMA and EGDMA in the polymer network is based on the information from Table 1, namely, HEMA 95.24 mol% and EGDMA 4.76 mol%.
MoleculeContribution GroupsContribution Value for Ecoh (J/mol)Contribution Value for Vnetwork (cm3/mol)Frequency
Processes 05 00026 i001–CH3471033.51
–CH2494016.13
>C<1470−19.21
–CO218,000181
–OH29,800101
Processes 05 00026 i002–CH3471033.52
–CH2494016.14
>C<1470−19.22
–CO218,000182
Table 3. Estimation of average molecular weight between crosslinks from the Flory–Rehner equation.
Polymerization ProcessSampleSwell IndexMc Experimental (g/mol)Mc Theoretical (g/mol)Polymer Network Homogeneity H ≈ 1.0Krytox Content
Free Radical PolymerizationG3118.37,6812,603; this value was calculated as the HEMA to EGDMA molar ratio0.34Yes
G3129.510,5410.25No
G3136.64,4070.59Yes
G3147.66,2210.42No
RAFT PolymerizationG3155.93,3290.78Yes
G3167.15,2740.49No
G3175.12,2891.14Yes
G3185.32,5301.03No
Table 4. Assignment of functional groups to bands of the FTIR spectra.
Band (cm−1)Functional Group
3,420–OH from HEMA
2,990–CH from HEMA and EGDMA in polymer
2,950–CH2 from HEMA and EGDMA structures
1,717–C=O from HEMA and EGDMA structures
1,635–C=CH2 remaining from HEMA and EGDMA monomers
1,450–CH from HEMA and EGDMA in polymer
1,320 to 1,300–C–O– ester from HEMA and EGDMA
1,170–C–O– carboxylic derivate
1,080 to 1,030–C–O– from the –OH of HEMA
950remaining –C=CH2 from HEMA and EGDMA monomers
900remaining –C=CH2 from HEMA and EGDMA monomers
Table 5. FTIR quantifications results.
SampleArea Measured for Total C=OArea Measured for Total C=CArea Ratio between C=C/C=O% Conversion Total C=CMean % Conversion Total C=C
G31148.6624.2510.087364.88%Hydrogels synthesized by FRP 56.98%
G31251.9526.4250.123650.28%
G31353.4345.8900.110255.68%
G31447.4824.9990.105257.67%
G31553.0294.9440.093262.52%Hydrogels synthesized by RAFT 66.10%
G31649.2146.0660.123250.44%
G31739.4972.2350.056577.25%
G31839.1282.5110.064174.20%
HEMA46.71811.6200.2487--
EGDMA35.5025.7210.1611-

