
Environmental Control in Flow Bioreactors
by
 ,
,
Serena Giusti
1,2, 
Daniele Mazzei
1,3,
Ludovica Cacopardo
1,2,
Giorgio Mattei
1,4,
Claudio Domenici
5 and
Arti Ahluwalia
1,2,* 1
Research Center “E. Piaggio”, University of Pisa, 56122 Pisa, Italy
2
Department of Information Engineering, University of Pisa, 56122 Pisa, Italy
3
Department of Computer Science, University of Pisa, 56122 Pisa, Italy
4
Optics 11, De Boelelaan 1081, 1081 HV Amsterdam, The Netherlands
5
CNR Institute of Clinical Physiology, 56124 Pisa, Italy
*
Author to whom correspondence should be addressed.
Processes 2017, 5(2), 16; https://doi.org/10.3390/pr5020016
Submission received: 1 March 2017
/
Revised: 2 April 2017
/
Accepted: 4 April 2017
/
Published: 7 April 2017
(This article belongs to the Special Issue Biomedical Systems Control)
Abstract
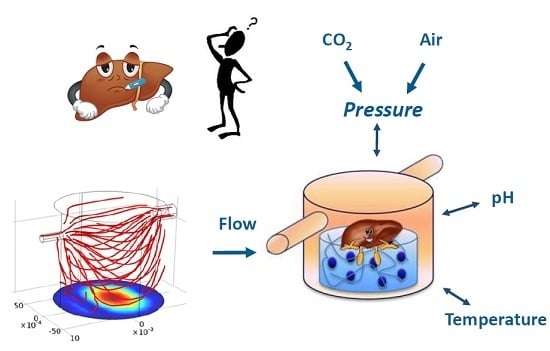
:The realization of physiologically-relevant advanced in vitro models is not just related to the reproduction of a three-dimensional multicellular architecture, but also to the maintenance of a cell culture environment in which parameters, such as temperature, pH, and hydrostatic pressure are finely controlled. Tunable and reproducible culture conditions are crucial for the study of environment-sensitive cells, and can also be used for mimicking pathophysiological conditions related with alterations of temperature, pressure and pH. Here, we present the SUITE (Supervising Unit for In Vitro Testing) system, a platform able to monitor and adjust local environmental variables in dynamic cell culture experiments. The physical core of the control system is a mixing chamber, which can be connected to different bioreactors and acts as a media reservoir equipped with a pH meter and pressure sensors. The chamber is heated by external resistive elements and the temperature is controlled using a thermistor. A purpose-built electronic control unit gathers all data from the sensors and controls the pH and hydrostatic pressure by regulating air and CO2 overpressure and flux. The system’s modularity and the possibility of imposing different pressure conditions were used to implement a model of portal hypertension with both endothelial and hepatic cells. The results show that the SUITE platform is able to control and maintain cell culture parameters at fixed values that represent either physiological or pathological conditions. Thus, it represents a fundamental tool for the design of biomimetic in vitro models, with applications in disease modelling or toxicity testing.
1. Introduction
The study of biological organs and tissues in clinical and biomedical research is often based on the use of isolated cell cultures plated in Petri dishes or multi-wells. Scientists have begun to appreciate that this representation of living processes is overly simplistic and much attention is now being paid to the development of so-called “physiologically-relevant” in vitro models. Such models have the potential to better approximate in vivo responses, offering new advanced systems with greater translational and predictive value. Key improvements to traditional models are focused on conferring three-dimensionality and the presence of multiple cell types and mechanical stimuli such as flow and stress.
Environmental parameters are also essential for the development of more physiologically-relevant in vitro models, as several studies have demonstrated the crucial role of the microenvironment on cell growth and function [1,2]. Indeed, as in the body, cells are extremely sensitive to chemical, as well as physical, stimuli, like oxygen concentration, pressure, temperature, and pH. However, traditional, as well as advanced (i.e., in bioreactors, on scaffolds, or in organoids), in vitro models are still maintained in cell culture incubators, with a physiological temperature of 37 °C and a controlled partial pressure of CO2 (5%). Most commercial incubators have very large volumes compared to the culture media and the temperature and CO2 gas sensors are placed a large distance away from the cells. Thus, the temperature and CO2 concentration measured by the instrument is often not that actually perceived by the cells. Moreover, even the opening/closing of the incubator door can briefly modify the gas and temperature levels, as well as the pressure in the whole chamber. An additional parameter, which is often ignored by cell biologists, is the variation in oxygen concentration with media height and the cell density. In both monolayer cultures and scaffolds the oxygen level at the cell membrane depends on the distance of the cell from other cells (i.e., the cell density), the distance of the cell from the gas-medium interface, and its oxygen consumption rate [3].
In the case of highly-sensitive cells, like stem cells or undifferentiated cell-lines, these variations may compromise experimental results leading to false negatives or positives. In fact, it is well known that even small and brief changes of the physical and chemical conditions of the cell environment can activate (or inhibit) signal processing for cell differentiation [4]. For instance, it has been observed that transient fluctuations in oxygen partial pressure can change gene transcription, thus influencing the fate of stem cells in culture [5].
The importance of chemical and physical measurements is reported in [6], where the authors also outlined the difference between on-line, in-line, and at-line measurements. In particular, on-line data are defined as signals that are available continuously, while sequential data can be defined as quasi-on-line measurements. Finally, when the sensors are placed inside the bioreactor, we can refer to in-line measurements, or to at-line measurements when the sensors are not in the culture chamber and sampling is necessary. This distinction can be important for the correct design of culture parameter measuring systems, where the measured variables can be physical (pressure, temperature, flow, and stirrer speed), chemical (pH, pO2, nutrients, metabolites), or biological variables (cell metabolism, etc.). For each type of measurement, different sensing methods can be used and the best sensor for a specific application should be sterilizable and should not interfere with the medium. In addition to monitoring, a further step is the control of environmental conditions depending on the measured variables. This implies the necessity of actuators able to operate on the culture environment in order to maintain variables of interest within a desired range.
An example of integration of in-line measurements in bioreactors can be found in Abu-Absi et al. [7], where Raman spectroscopy was implemented for monitoring culture parameters, such as glutamine, glutamate, glucose, lactate, ammonium, viable cell density, and total cell density. In particular, large, 500-L bioreactors operated in fed-batch mode were used, and immersion probes were constructed of stainless steel and connected to a RamanRXN3 (Kaiser Optical Systems Inc., Écully, France). Moreover, the pH and dissolved oxygen tension (DOT) were maintained around 7.0 and 50% of air saturation. The pH was controlled using CO2 gas to decrease pH and 3N NaOH to increase pH.
Several studies in the literature are implemented using commercial bioreactors with environmental controls. For example, the Sixfors multireactor system (Infors AG, Bottmingen, Switzerland) was used by Trummer et al. [8] to investigate the effect of variation in DOT, pH, and temperature (T) on cell growth, metabolism, and cell cycle distribution. The authors observed that the reduction of T and pH exert the most significant effects on process performance mainly by reducing cell growth and metabolism. A parallel bioreactor system commercialised by DASGIP AG (Jülich, Germany), was used in [9] for the culture of human pluripotent stem cells. This system is composed of four stem cell culture vessels, and has several monitoring and control opportunities (i.e., temperature, pH, DOT) [9].
Different studies with custom control systems can also be found for micro-sized bioreactors. For instance, a microbioreactor platform that allows for independent control of culture parameters in each well of an array has been reported [10]. To control the physical-chemical mechanisms related to cell activity in microfluidic devices, dissolved oxygen concentrations were monitored in real-time using fluorescence intensity and lifetime imaging of an oxygen sensitive dye by Metha et al. [11]. In particular, if used at slow flow rates and high cell density, this microfluidic device creates oxygen-limited physiology (hypoxia conditions) that can be useful in several situations, such as maintaining the pluripotency of embryonic stem cells without the need of hypoxic chambers. The authors conclude that the system provides several advantages thanks to the dynamic control of oxygen, achieved by programming temporal changes in the perfusion rates. However, it is known that microfluidic systems are not really representative of physiological conditions and that they present several issues related to edge effects, high shear and nutrient depletion [2]. On the other hand, the use of very large volume bioreactors can be useful for industrial purposes, but in the case of in vitro studies can lead to an unnecessary expenditure of materials.
In this paper, we describe a “milli-scaled” platform, SUITE (Supervising Unit for In Vitro Testing), for cell culture under controlled environmental conditions. The platform can be used to carry out experiments in well-defined flow, temperature, pressure, and pH, and enables the study of specific physiological and pathological scenarios in vitro. In previous studies interconnected modular bioreactors with liver, adipose tissue, and endothelial cells were used to generate an advanced in vitro model of the metabolic system [12,13,14]. Following this approach, a feasibility study was conducted to implement a model of portal hypertension using an environmental control system embedded in SUITE.
Portal hypertension syndrome is characterized by a pathologic increase in portal venous pressure which leads to an increase in the pressure gradient between the portal vein and the hepatic veins (i.e., inferior vena cava). The study of this pathology poses a variety of difficulties both in in vitro and in clinical studies, and the knowledge of portal hypertension pathophysiology is mainly based on animal models [15]. The few examples of portal hypertension in vitro studies in the literature are based on rat hepatectomy [16] or are focused on understanding the correlations between endothelial dysfunction and liver diseases [17]. However, in many instances animal models are not sufficiently predictive of human pathophysiology [18]. Moreover, as far as in vitro methods are concerned, traditional incubators cannot be used to provide pressure variations typical of those observed in portal hypertension. The SUITE platform was hence employed to determine the influence of hydrostatic pressure generated by the system on the two cell types primarily involved in portal hypertension: hepatocytes (represented by the human hepatic cell line C3A) and endothelial cells (human umbilical vein endothelial cells or HUVEC). The study demonstrates the potential of the platform to control and maintain different pathophysiologic pressure conditions and paves the way towards the establishment of more complex hypertension models, thanks to the possibility of connecting different bioreactors to reproduce the interaction between different cell types (e.g., endothelial and hepatic cells).
2. Materials and Methods
2.1. The SUITE System
The SUITE (Supervising Unit for In Vitro Testing) platform is a modular cell culture system for dynamic cell culture experiments, consisting of all of the sensing, control, and actuation units necessary for monitoring and adjusting on-line the local environmental variables, such as pH, temperature, and hydrostatic pressure. In this way, the system can provide the optimal environment for cells outside the classical incubator and at the same time apply the desired pattern of mechanical and chemical stimuli to simulate the physiological milieu. The architecture and components of SUITE are described in the following paragraphs.
2.1.1. Architecture of the SUITE System
As shown in Figure 1a, the SUITE platform is composed of:
- The software which reads, controls, and stores information from the sensors and actuators in the system;
- A control box linked to a PC, containing all the electronic circuits and electro-valves;
- A mixing chamber for pH regulation and media reservoir;
- A heating system;
- A peristaltic pump; and
- A series of modular bioreactors which can be combined in series or parallel to recapitulate physiological crosstalk between organs.
The control software framework used for the SUITE system was described in [19]. Briefly, it is based on a programming framework called Robotics.NET (Microsoft.NET platform) developed in F#, with an architecture inspired by the human nervous system. Bioreactors are controlled with a dedicated library, which reads data from the sensors and communicates with the system brain, as do the peripheral organs with the human brain. The user can set and monitor experimental parameters using a graphical user interface (GUI) developed in C#.
The control box is composed of a custom-made electronic block that acquires signals from sensors (i.e., pH meter, pressure sensor, and NTC (negative temperature coefficient) thermistor) and drives the actuators (i.e., electro-valves, power switches) for actively controlling the environmental parameters. In order to control the pH and the hydrostatic pressure in the mixing chamber, the control box is provided with electro-valves and pressure regulators which modulate the gas flow in the chamber.
The mixing chamber (Figure 1b) is the key element of the system: it contains the pH meter (Electro Chemical Devices, Anaheim, CA, USA, mod. 8602, resolution: ±0.05 pH units) and the gas inlet, as well as flow and pressure sensors (differential air pressure sensor 1337, Phidgets, IncCalgary, AL, Canada, resolution 1.5%). It is connected in series with one or more modular bioreactors through inlet and outlet tubes enabling the cell culture media to flow in the whole circuit.
The mixing chamber and the flow bioreactors are placed in the heating system, a Plexiglas box filled with water and constantly maintained at 37 °C. Alternatively, single bioreactors can be heated using small heating modules in aluminum, which surround each bioreactor chamber. The temperature of the water and/or the heating modules are monitored with several NTC thermistors (resolution: ±0.1 °C), connected to the control unit for PID feedback control of the temperature. The PID algorithm generates a PWM (pulse width modulation) output signal between 0 and V that drives the gate terminal of a MOSFET (IRLB3813PbF, HEXFET Power MOSFET, IRF International Rectifier, El Segundo, CA, USA), in order to modulate the drain current in the resistors.
2.1.2. Control Algorithm
In traditional cell culture experiments performed within incubators, the pH value in a sample of cell-free culture medium is maintained within a range of 7.2–7.4, through the chemical equilibrium between a buffer (usually sodium bicarbonate), and a high ambient CO2 (5%). In the presence of cells, the pH falls at a rate which depends on cell density and metabolic activity, dictating the frequency of media changes [20]. The pH is a critical parameter because even the slightest hyperacidity due to metabolic products of cells can lead to an impairment of cell vitality and irreversible loss of function. On the other hand, cells cannot tolerate an alkaline pH and cell death is immediate.
In order to maintain the desired pH value in the cell culture, the pressure of air and carbon dioxide in the mixing chamber is controlled continuously by SUITE. Simultaneously, a pressure regulator is used to maintain a constant hydrostatic overpressure (between 10 and 50 mmHg) in both the mixing chamber and the circulating cell culture media.
Basically, the SUITE platform continuously injects pressurized air (21% O2) or carbon dioxide (99% pure CO2) into the mixing chamber as required. These gases diffuse and dissolve in the fluid present in the chamber following Henry’s law and react with the sodium bicarbonate buffer. When CO2 is injected the pH decreases and, vice versa, when air enters the chamber the pH increases. A mathematical or computational model of pH regulation is extremely complex to achieve. In fact, to predict the pH value as a function of CO2 and air inserted, four different transport processes should be considered: (i) the convective and diffusive transport of gases in the top part of the mixing chamber, with no medium; (ii) the passage of gas molecules through the air-liquid interface, following Henry’s law; (iii) the diffusion of gases in the cell culture media; and (iv) the reaction of gases with the buffer.
To simplify pH regulation in the system, the SUITE control strategy follows a specific real-time algorithm (Figure 2): the system continuously injects air in the mixing chamber until the pH is above a user-defined threshold (i.e., pH* = 7.4). Then it alternately inserts CO2 and air for a time (CO2 injection time and air injection time, respectively) calculated in real-time by a proportional control algorithm. When the measured pH is again under the same pre-defined threshold pH*, the system again injects pressurized air, and the cycle restarts. In detail, every second the SUITE platform performs a computational step to evaluate if the pH is above or below the user-defined value. A simple proportional regulator adjusts the amount of gases required for correcting the pH value, on the basis of the actual pH measured in the cell culture media. Then, considering the pressure and the temperature of the media in the cell culture media, the algorithm estimates the time of gas injection required for adding the pre-calculated moles of gases in the mixing chamber. Proportional parameters of the control algorithm were tuned in order to maximize the time response of the system while minimizing its overshoot. A large number of tests were performed to verify the algorithm’s robustness with respect to proportional parameters (Kp) chosen within an identified range (Air Kp from 0.8 to 2, CO2 Kp from 4.5 to 1.5). According to the tests, the optimum value of Kp decreases with the selected hydrostatic pressure in the fluidic circuit (i.e., p = 20 mmHg: CO2 Kp = 4, air Kp = 2; p = 50 mmHg: CO2 Kp = 1,5, air Kp = 1). These are the default values in SUITE, although the proportional parameters can also be defined by the user through the dedicated software interface.
The pH control algorithm was tested for up to 72 h under cell culture conditions: the SUITE system was connected to a bioreactor and the dynamic circuit filled with 10 mL of cell culture media. A fluid flow of 200 µL/min was applied using a commercial peristaltic pump (ISMATEC, IPC N4, Wertheim, Germany). The fluidic circuit was placed in the heating box and maintained at 37 °C. Different hydrostatic pressures (from 15 to 50 mmHg) were evaluated and data were recorded in order to analyze the capability of the system to automatically maintain the target pH (set to 7.4) by modifying the injection times of gases.
2.2. The LiveBox1 Bioreactor
In this study we connected the SUITE platform to the LiveBox1 (LB1, IVTech S.r.l., Massarosa, Italy) bioreactor. LB1 is a single flow transparent bioreactor with an internal hydrodynamic design which ensures a low wall shear stress for high fluid turnover rates. The bioreactor is an upgrade of the MCmB (multi-compartmental modular bioreactor), which has been successfully used with hepatocytes [21,22]. The geometry of LB1 differs slightly from the MCmB, to increase the optical transparency of the system and enable optical imaging during the experiment. In particular, the LB1 consists of a cell culture chamber with inner dimensions similar to the single well of the 24-well plate (Ø 15 mm × 14 mm). It has one inlet and one outlet tube, with dimensions of Ø 1 mm and Ø 2 mm, respectively, placed at the top of the chamber, at a distance of 10 mm with respect to the base of the bioreactor, where cells are placed (Figure 3a). It is made in PDMS (poly-dimethyl-siloxane), with two removable glass coverslips (Ø 20 mm) at the bottom and top surface of the chamber. After the experiment, the LB1 can be disassembled and the glass coverslip supporting the cell monolayer or the 3D construct can be easily removed from its bottom part and used for further investigations and analysis.
To establish the optimal fluidic conditions in the LB1 and ensure laminar flow and a low shear stress on the cells, parametric models with different inlet flow rates were implemented. In particular, CFD models were used to evaluate flow parameters, such as flow velocity, shear stress, and stream lines in the cell culture chambers, focusing on the bottom surface of the bioreactor where cells are cultured (Figure 3b).
The CFD model was implemented in COMSOL Multiphysics (version 3.5a COMSOL AB, Stockholm, Sweden, 2009), using steady-state Navier-Stokes equations for incompressible Newtonian fluids to solve the velocity field (u) resulting from convection:
where ρ denotes density (kg∙m−3), η dynamic viscosity (kg∙m−1∙s−1 = Pa∙s), p pressure (Pa) and F a volume force field such as gravity (N∙m−3). Equation (1) represents the momentum balance, while Equation (2) is the continuity equation for incompressible fluids. The shear stress on the surface of a non-porous tissue construct depends linearly on the density and the viscosity of the culture medium used. In our model, the culture medium was considered an essentially aqueous media at body temperature characterized by the following constants: T = 310.15 K, ρ = 993 kg/m3, and η = 0.7 × 10⁻³ Pa∙s [2,22].
As boundary conditions, the inflow velocity vin was set to 2.12 × 10⁻³, 4.24 × 10⁻³, 6.36 × 10⁻³, and 10.6 × 10⁻³ m/s (corresponding to 100, 200, 300, and 500 μL/min, respectively), on the basis of previous experiments with similar bioreactors. The model was solved using the UMFPACK direct solver, and the computational grid (or mesh) was generated using the COMSOL predefined “fine” mesh size for meshing the 3D geometries.
Hydrodynamic Pressure in the LiveBox1
To characterize the hydrodynamic environment in the bioreactor chamber, a pressure sensor was used to evaluate the hydrodynamic pressure in the fully-assembled fluidic circuit (1 LB1, tubing, and a pump). The same flow rate used in all the cell culture experiments (200 µL/min) was applied. The Vegabar 14 sensor (VEGA Grieshaber KG, Schiltach, Germany, dynamic range: −10 to 10 kPa, resolution: 0.02 kPa) was connected to the inlet and the outlet of the fluidic chamber thought three-way valves, and the pressure signal automatically acquired for 3 min and stored using an appropriate graphical user interface developed in F#, as reported in [23]. To confirm that the hydrostatic overpressure generated by SUITE in the mixing chamber affects the whole fluidic circuit, the same measurements were performed in a LB1 bioreactor connected to the SUITE platform and to the fluidic circuit. Several hydrostatic overpressures were tested, comparing the overpressures in the mixing chamber with the values measured close to the bioreactor chamber.
2.3. In Vitro Model of Portal Hypertension
The use of SUITE for developing more physiologically relevant in vitro models of portal hypertension was investigated by performing two independent cell culture experiments involving endothelial cells and hepatocytes, respectively. Our aim was to determine whether endothelial and liver cell function are affected by hydrostatic pressures generated in the SUITE system. Thus, HUVEC and C3A were cultured in the LB1 and were subjected to different levels of hydrostatic pressure in combination with fluid flow.
2.3.1. Cell Culture
All cell culture reagents were purchased from Sigma-Aldrich, unless otherwise specified.
HUVEC (human umbilical vein endothelial cells) were extracted as previously described [24]. Two donated umbilical cords were sufficient for all the experiments. The medium for culturing HUVEC was EMEM (Eagle’s minimal essential medium) supplemented with 10% FBS, 1% penicillin/streptomycin/amphotericin B, 2 mM l-Glutamine, 1% non-essential amino acids 100X, 1% MEM vitamins solution, 10 µg/mL of endothelial cell growth supplement (ECGS), 10 ng/mL human epidermal growth factor (hEGF), 3 ng/mL basic fibroblast growth factor (bFGF), 1 µg/mL hydrocortisone, and 10 µg/mL heparin sodium salt. Endothelial cells were routinely trypsinized and used between passage 3 and 8. HUVEC were seeded 24 h before the experiment, in a well, or in a plastic coverslip (Ø 12 mm, NUNC, Roskilde, Denmark) coated with 1% gelatin from porcine skin at a density of 2.104 cells/cm2.
The C3A hepatic cell line was cultured in monolayers. In all experiments the culture media was EMEM with 1 g/L glucose supplemented with 1% non-essential amino acids, 1% EMEM vitamins, 2 mM l-glutamine, 100 U/mL penicillin, and 100 g/mL streptomycin. Cells were seeded on the glass coverslips (3 × 10⁵ cells/cm2), pre-coated with a thin layer of collagen IV type 0.3 mg/mL, and left in a 24-wells plate in a humidified incubator at 37 °C, 5% CO2 with 500 µL of culture media.
At least 24 h after seeding, coverslips were moved to the LB1 and connected to the fluidic circuit and the SUITE platform. A constant flow rate of 200 µL/min was applied as described in Section 2.1.2. Two different controls were implemented: (a) static controls composed of a seeded coverslip into a Ø 10 cm Petri dish, and (b) dynamic controls with LB1, at the same flow rate, but not connected to the SUITE system. Both the controls were filled with 10 mL of culture media and placed in a classical cell culture incubator (37 °C, 5% CO2).
In the SUITE system, the pH target was set at the physiological value of pH 7.4, and three different hydrostatic overpressures were applied to each cell type: 30, 40, and 50 mmHg to HUVEC and 20, 30, and 40 mmHg to C3A. All the data from the cellular environment sensors were recorded, analyzed and correlated with assays for cell viability.
2.3.2. Cell Assay and Staining
For evaluating HUVEC responses, 4 h long experiments were performed, as these cells respond very quickly to physical stimuli, like shear stress or pressure [25,26]. On the other hand, for evaluating the chronic effect of hyperpressure on hepatocytes, we conducted 24 h long experiments.
At the end of each experiment, cell viability was evaluated using a CellTiter Cell Viability Assay (Promega, Madison, WI, USA). Media flow was stopped, the bioreactors were disassembled, and coverslips were all moved to a 24-well plate. Each well containing cell-seeded coverslips was filled with 400 µL of fresh medium and 40 µL of reagent, and the plate was placed in the incubator. Measurements of fluorescent emission at 590 nm were performed with a fluorescent plate reader (Fluostar Optima, BMG Labtech, Ortenberg, Germany) after 30 min and after 2½ h, and the viability was expressed as a percentage with respect to the static control.
The morphology of C3A was also observed before and after experiments using an optical microscope (Olympus, AX70, Olympus Italia, Milan, Italy) with 10× and 20× objectives. Moreover, HUVEC expression of the von Willebrand factor (vWF) was also examined. Cells were fixed in isopropanol 70% over night. Then, cells were rinsed and stained with the first antibody suspended in 2% BSA solution (monoclonal mouse anti-human von Willebrand factor, Dako, Glostrup, Denmark) for 1 h, and after three washing steps the second antibody was added (AlexaFluor, Invitrogen, Paisley, UK) to the cells. DAPI (4′,6-diamidino-2-phenylindole) staining was used to image the nuclei. Images were acquired using an optical microscope (AX70, Olympus Italia, Milan, Italiy) with 20× and 40× objectives and quantified using image processing software (ImageJ, National Institutes of Health, Bethesda, MA, USA). All images were taken at the same luminous intensity to ensure a constant background.
2.3.3. Data Analysis
All results were calculated from at least three different experiments and expressed as means ± standard deviation of the mean. Data were analyzed by the Student’s t-test. Statistical significance was set at p < 0.05 (indicated with *).
Image analysis was performed from three coverslips per experimental setting and averaged using at least nine regions of interest (ROIs) per well. Data are expressed as a percentage of the fluorescent area with respect to the total cell area, using the same threshold, again setting significance at p < 0.05.
3. Results
3.1. Fluid-Dynamics in the LB1
3.1.1. CFD Models
As reported in Figure 4, the fluid dynamic analysis shows that flow laminarity is maintained for inlet flow rates up to 200 μL/min, with uniform streamlines mostly parallel to the bottom surface, whereas it is compromised at higher flows. The shear stress on the bottom surface of the LB1 increases along the axis of flow, reaching its maximum value near the center of the culture chamber, then decreases again near the outlet region. As expected, shear stress increases with the inlet flow rate, maintaining acceptable values for hepatocytes even at the highest flow. On the basis of these results, the highest media flow rate (necessary for an adequate oxygen and nutrient supply) which also guarantees laminar flow is an inlet volumetric flux of 200 μL/min. This value was used for all cell experiments and for characterizing the system.
3.1.2. Hydrostatic and Hydrodynamic Pressure
Pressure measurements carried out in the LB1 with a constant flow rate of 200 µL/min, showed that the bioreactor chamber has a hydrostatic pressure of about 4.5 mmHg (4.59 ± 0.19 mmHg), which is close to the reported physiological intra-hepatic pressures in human liver [27]. This characterization pointed out that the hydrodynamic environment in the LB1 is suitable for mimicking the pressure conditions of the human liver in vitro. The same test was repeated in the bioreactor connected with the SUITE system. The results demonstrated that the pressure applied by the pump is accounted for by the SUITE control system. In fact, the actual pressure measured at both the inlet and outlet of the bioreactor corresponds to the desired pressure stimulus imposed by the software.
3.2. Validation of Control Algorithm
The ability of the new control strategy to adjust and maintain physiological values of pH in different conditions was tested. At first, several pressures were applied in SUITE using the same initial proportional parameters for the control algorithm.
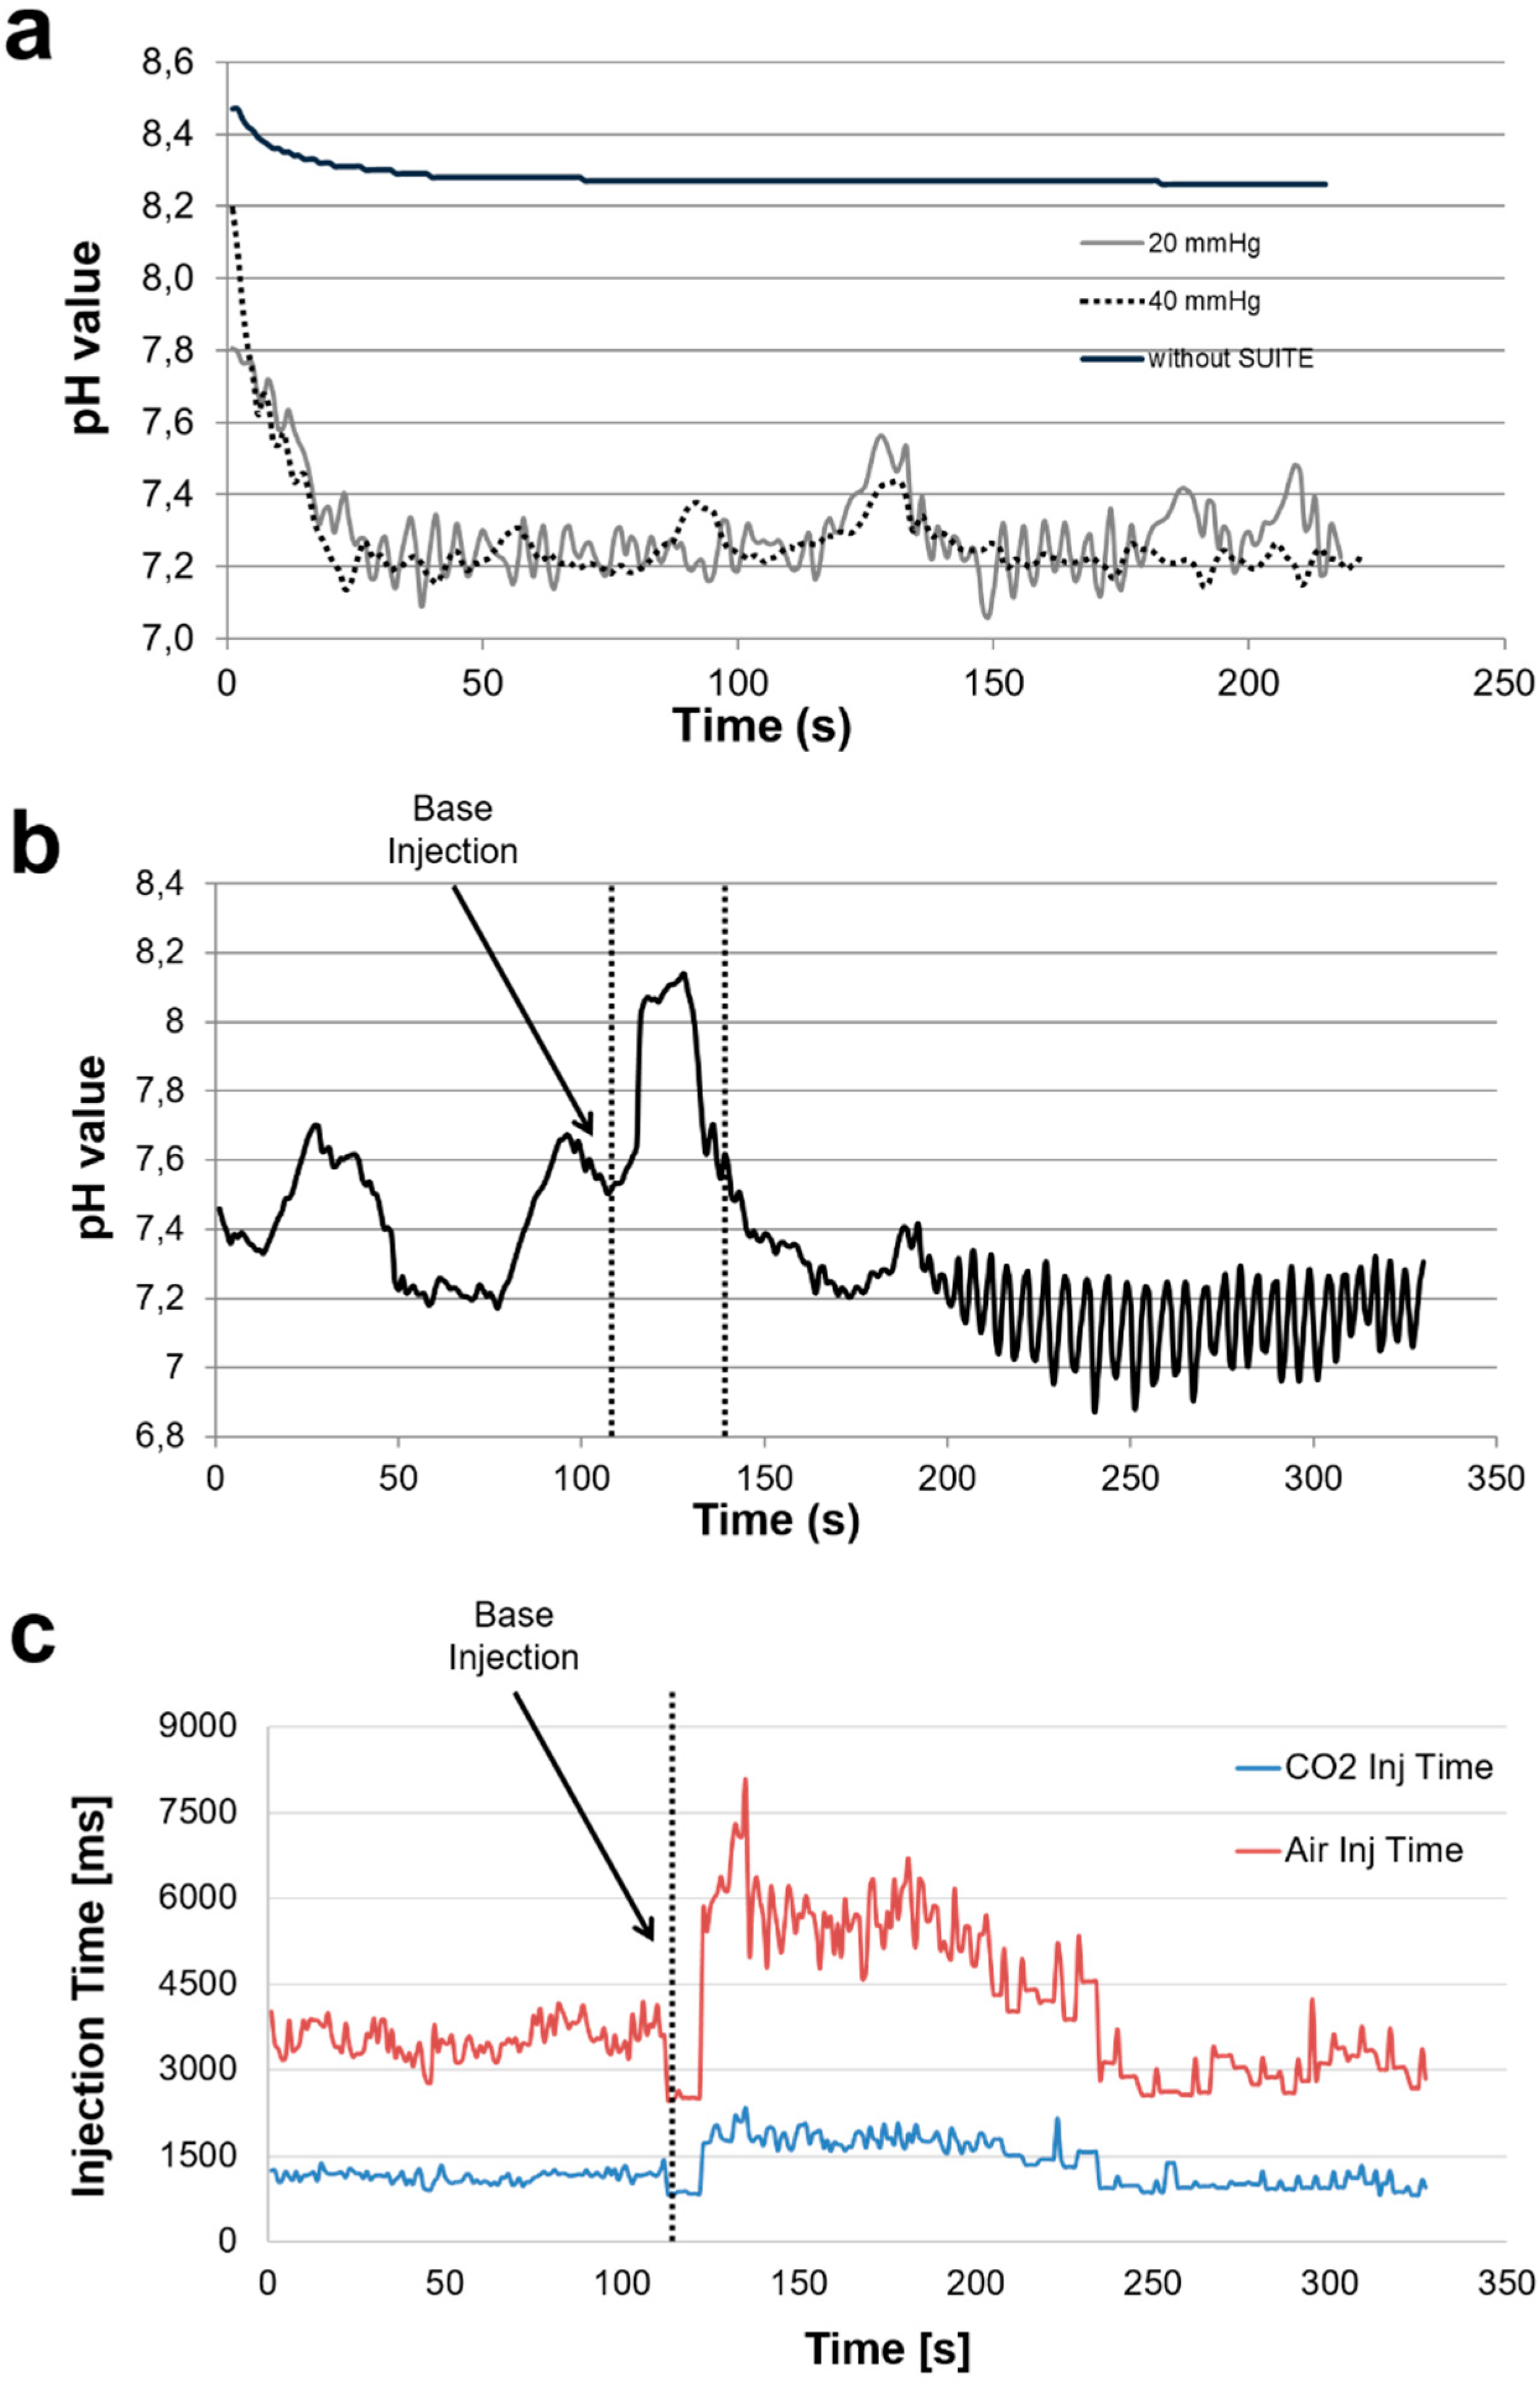
Our tests confirmed the capability of the system to maintain the target parameters for extended periods—of up to 72 h. As shown in Figure 5a, fresh medium in air cannot maintain physiological pH values. In SUITE the medium quickly reached the steady state, reducing the pH from the basic initial value to the target in around 20 s. Both the pH (7.28 ± 0.06) and the hydrostatic pressure (20 ± 1.5; 30 ± 2; 50 ± 1.75 mmHg) are held around the target values (pH = 7.4; pressure = 20, 30, and 50 mmHg) during all of the experiments performed. However, small pH fluctuations of around ± 0.1 pH units are recorded in all of the tests in dynamic conditions, due to the alternate infusions of air and CO2 necessary to maintain overpressure and pH as well as the fluid movement in the mixing chamber where the pH meter is placed. Furthermore, we observed that that the average pH was slightly lower than the target of pH 7.4. This is because CO2 is more soluble in media than other gases in air, so the pH tended more towards the acidic (<7.4) than basic (>7.4) values. The target pH was not increased above 7.4 since cells are more susceptible to damage from alkaline conditions than acidic ones.
As shown in Table 1, the SUITE control algorithm automatically adjusts the injection time of the gases on the basis of the hydrostatic pressure applied in the dynamic bioreactor circuit. As expected from the gas law and Henry’s law, the data pointed out an inverse relation between pressures and injection times of both gases. In fact, as the hydrostatic pressure increases, the gas concentration increases and, hence, solubility in media also increases. Notably, we did not observe any media evaporation in the mixing chamber in all the conditions tested.
The control system was finally tested with pH perturbations due to external stimuli (i.e., adding 0.1 mL of basic solution pH 10 to the circuit through the mixing chamber). As observed in Figure 5b,c, the system reacts to the altered pH increasing both the injection time of CO2 and air (Figure 5c), and the pH is brought back close to the target value in about 50 s (Figure 5b). When the pH was again below the set threshold, the injection times returned to the initial values. These tests pointed out the high stability and flexibility of the system in different conditions, obtaining results comparable with other reports which employ more complex control strategies [28,29].
3.3. Cell Assays
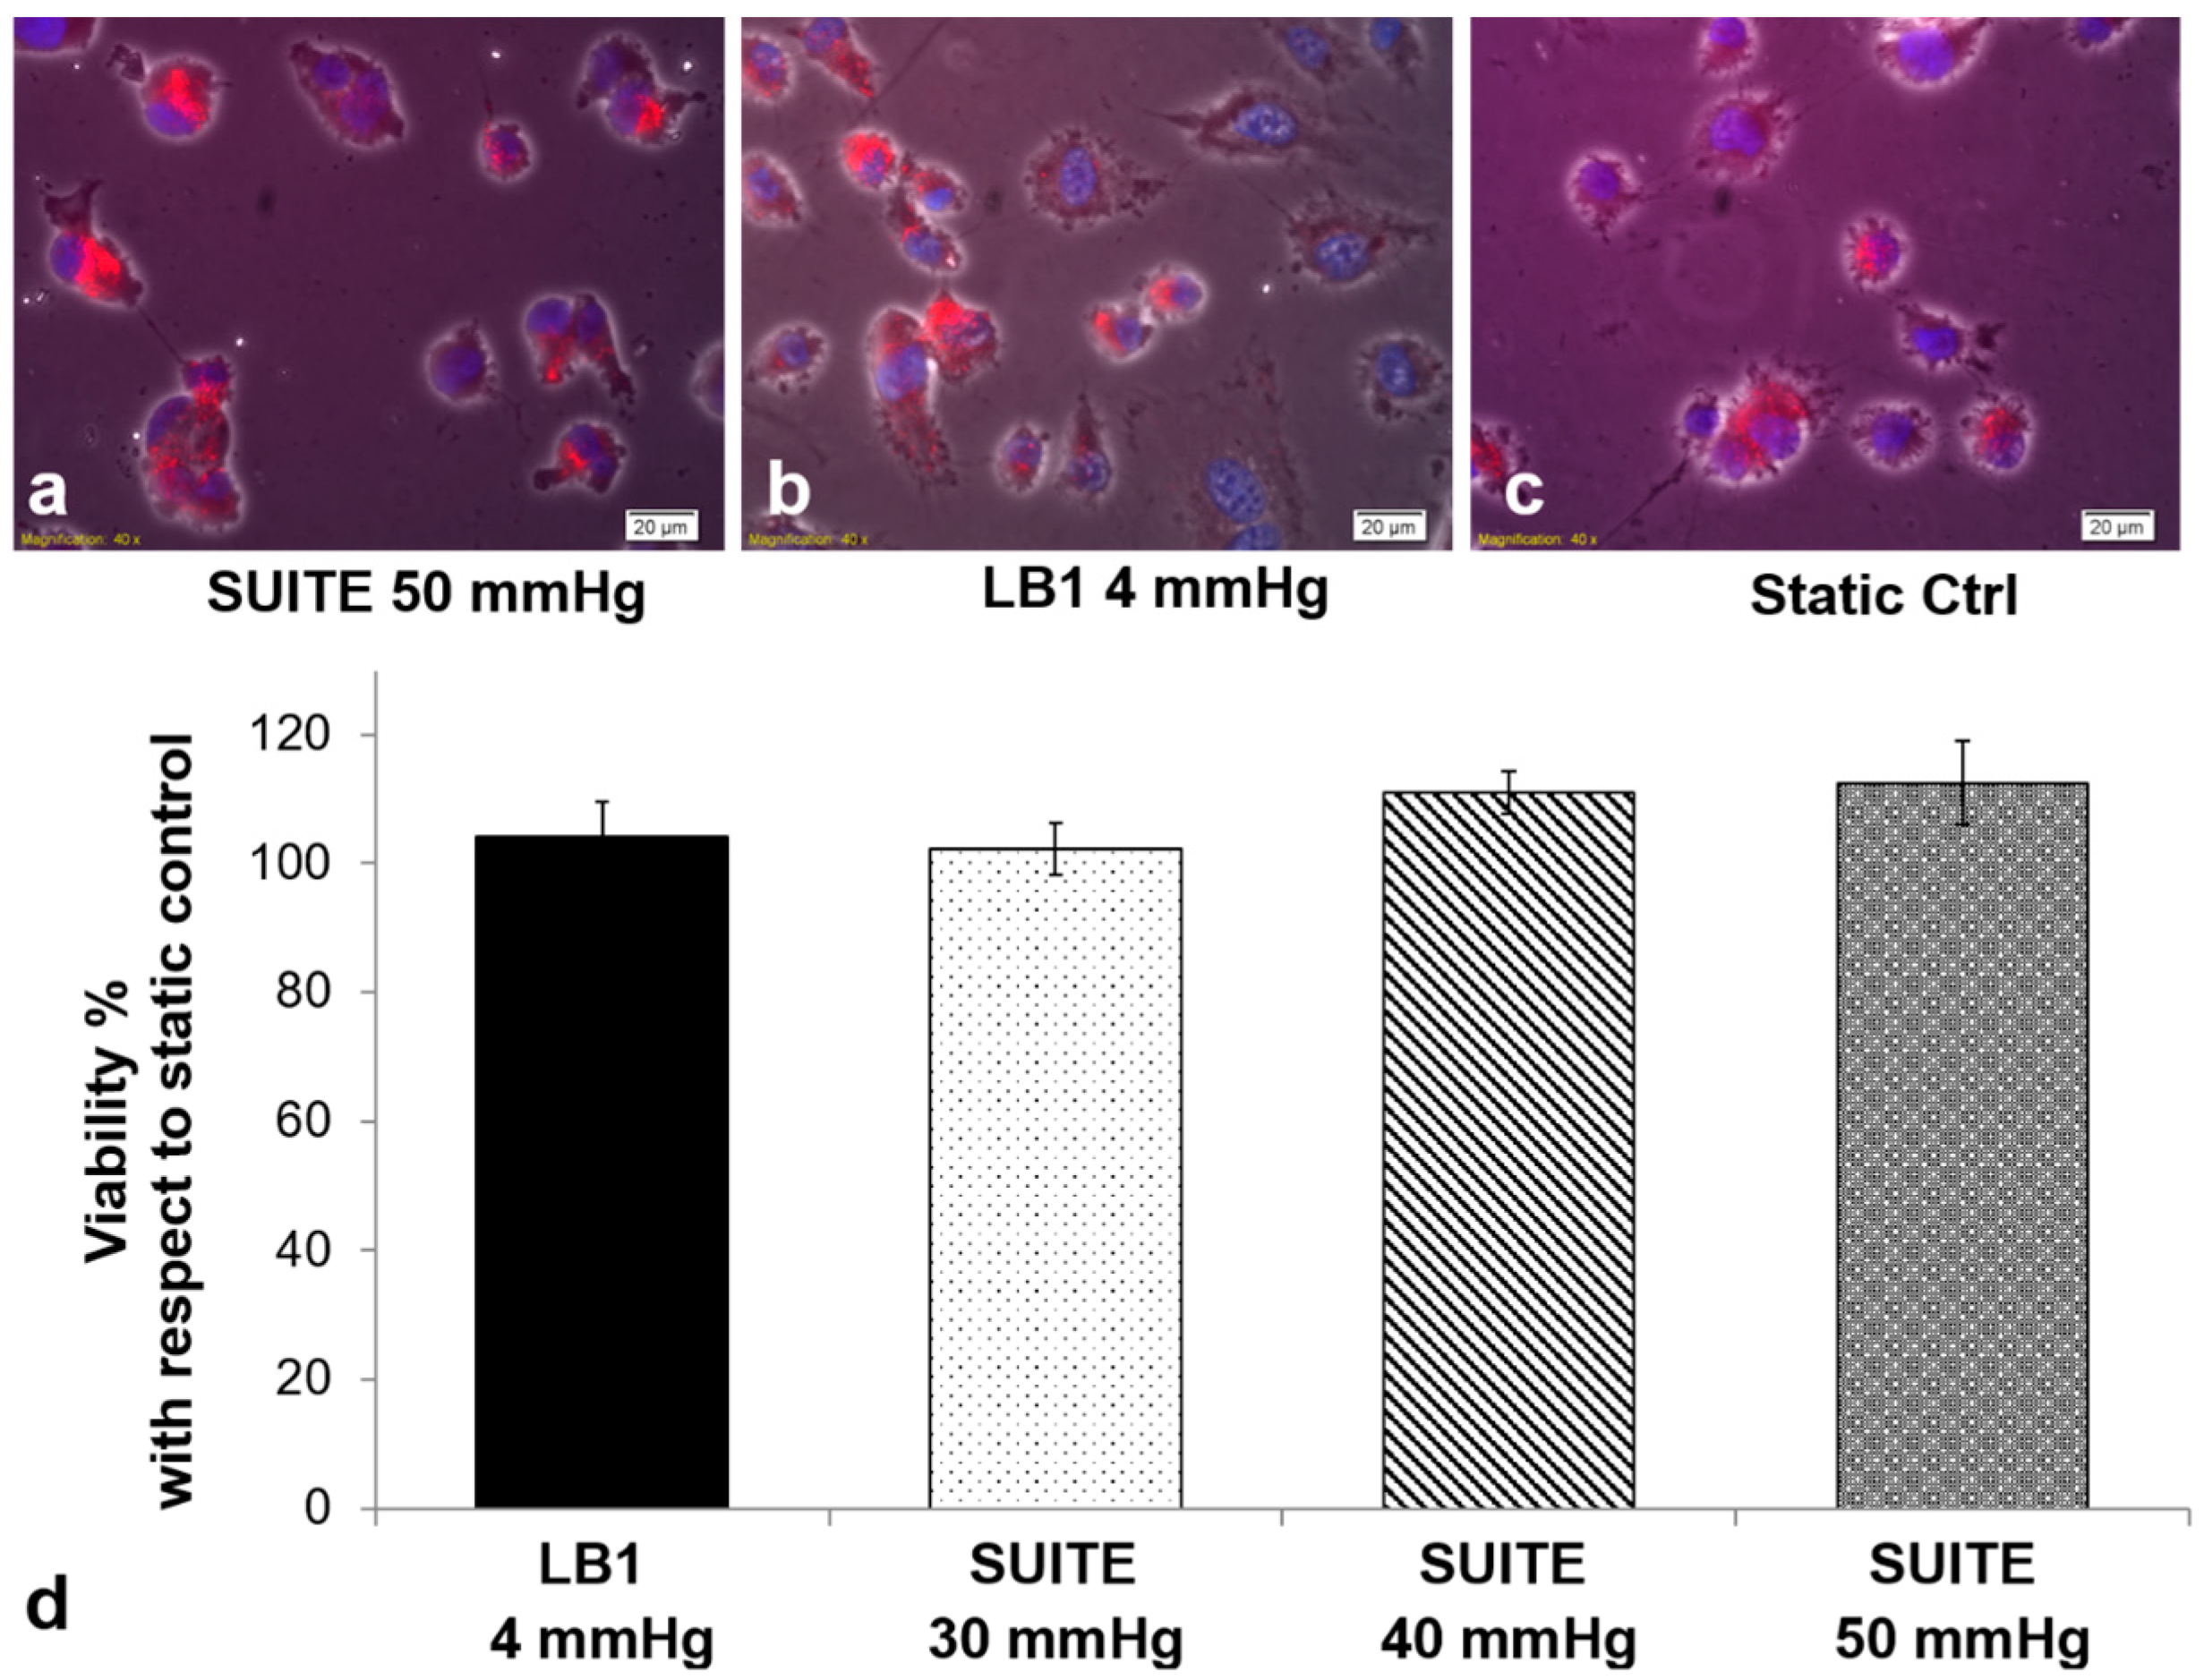
HUVEC stained with DAPI and anti-vWF are reported in Figure 6a–c. Figure 6d shows that the cells were viable at all pressures with no significant differences (p > 0.05) between the different conditions.
Table 2 shows that vWF is significantly (p < 0.05) upregulated in all the dynamic conditions with respect to the static control, confirming the role of fluid-induced forces in activating vWF expression [25]. Moreover, vWF fluorescence increases with increasing hydrostatic pressure. As endothelial cells can support high pressures in vivo, the observed increase may be physiological and merits further investigation.
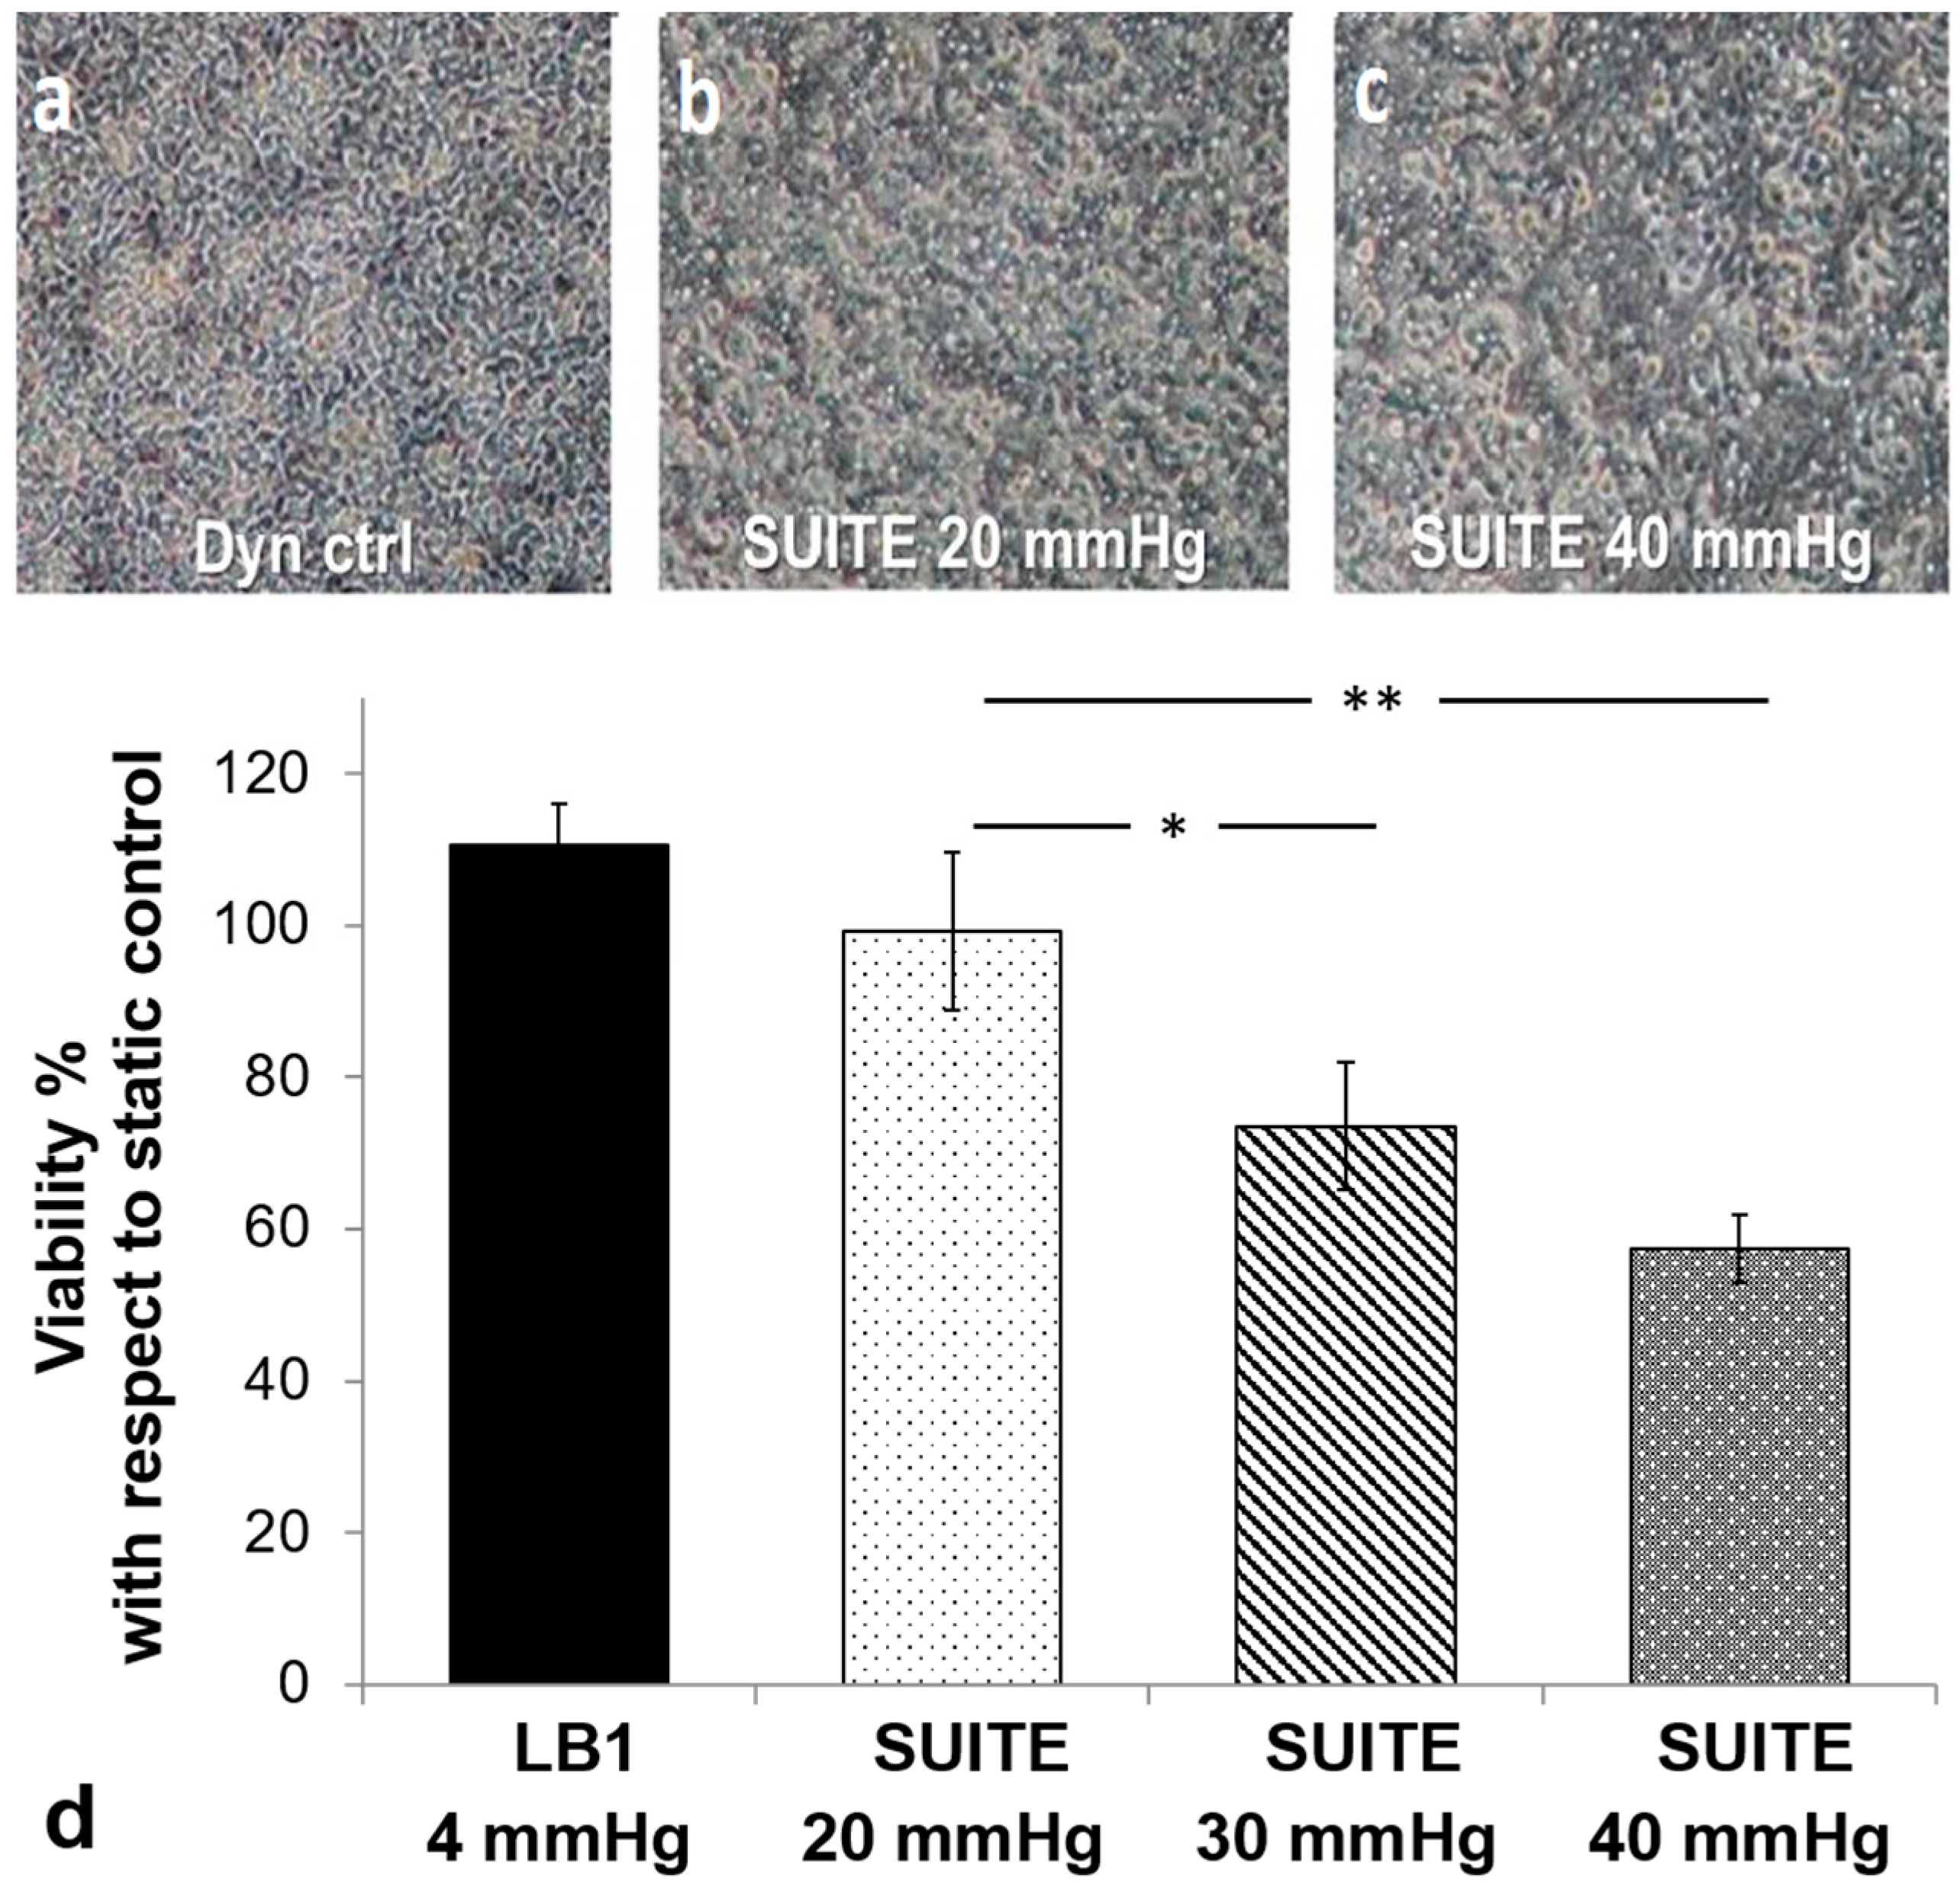
Figure 7a–c show bright field images of C3A cells under different conditions (the dynamic control in which the pressure is 4 mmHg and from experiments in SUITE at different pressures). High cell viability is maintained in SUITE up to 20 mmHg of hydrostatic pressure (Figure 7d), which is considered the threshold for portal vein hypertension [27]. Pressures higher than 20 mmHg, which typically lead to hepatocyte damage in vivo, reduce hepatocyte viability by 50%. These results were confirmed by a morphological analysis of the images which indicated an increase of cell size with higher pressures, and signs of cell damage starting from 30 mmHg.
4. Discussion
The SUITE platform is a free-standing cell culture system able to measure and regulate “on-line” cell culture parameters, such as temperature, pH, and pressure in a fluidic cell culture system without the support of an incubator. The system consists of a pump, modular bioreactors, and a mixing chamber, along with sensing, actuation, and control components. Measurements are performed directly in the mixing chamber connected to the bioreactors, without the need for sampling. Therefore they can be referred to as “in-line”. An ensemble of actuators, such as electro-valves, pressure regulators, and heating elements allow precise control of cell culture parameters. Moreover, the use of the LB1 bioreactor as a module in SUITE presents several advantages: (i) pressure and shear stress values close to the physiologic ones in the liver; and (ii) the possibility of optical real-time monitoring.
SUITE is also able to reproduce in vitro conditions related to complex pathologies which are related with an alteration of physico-chemical parameters. Our results show that thanks to a real-time algorithm which adjusts gases injection time considering the actual pressure and temperature, it is possible to maintain pre-determined values of pressure and pH. In particular, the system was able to regulate the pH at around 7.27 ± 0.06, both at different hydrostatic pressures and in the case of external perturbations (i.e., with solutions at different pH). The response time of the system is about 50 s. This type of regulation is not available in traditional incubators, where the constant imposed partial pressure of CO2 combined with cellular metabolic activity leads to a progressively acidic medium over time [20].
Portal hypertension, like other diseases characterized by high vascular pressure, are rarely modelled in vitro because of the technical difficulties associated with the generation of a constant overpressure and fixed pH concomitantly. For this reason, human hypertension is modelled in animals, where high blood pressure in different regions is induced, either through the use of drugs or by ligation. To test the feasibility of SUITE as a platform for the design of in vitro experiments of hypertension, a portal hypertension model was implemented with endothelial and hepatic cells (i.e., HUVEC and C3A). HUVECs, as they are endothelial cells, strongly support pressure values up to 50 mmHg, but with a marked increase in vWF expression; while hepatic C3A cell viability begins to decrease at 20 mmHg and their function is severely affected at 40 mmHg. While several biological aspects still need to be addressed to validate the model the technology, nevertheless, paves the way for further investigations into non-animal models of human pathologies associated with high pressures such as stenosis, glaucoma, and intracranial hypertension.
The study presented in this paper demonstrates the importance of cell culture parameter control both for in vitro modelling of complex diseases and for maintaining optimal culture conditions. In particular, this last aspect is fundamental both for the reliability of cell experiments and for the culture of sensitive cells, such as stem cells.
In conclusion, “physiologically relevant” in vitro models are not just about recreating a 3D dynamic environment, but also require the control of environmental parameters to ensure that the in vivo physico-chemical milieu is also recapitulated. Since traditional incubators cannot accurately control these parameters, the SUITE platform represents a valid option for experiments that require fine regulation of pressure, temperature, and pH, and can provide a cell culture environment capable of recreating pathophysiological conditions for the study of disease models.
Supplementary Files
Supplementary File 1Author Contributions
S.G., D.M. and A.A. conceived and designed the experiments; S.G. and L.C. performed the experiments; S.G., D.M., and G.M. analyzed the data; C.D. contributed reagents/materials/analysis tools; S.G., L.C., and A.A. wrote the paper.
Conflicts of Interest
S.G., G.M. and A.A. are shareholders of IVTech S.r.l., manufacturer of LB1. However, IVTech did not contribute to the study, nor did they have any role in the design of the study; in the collection, analyses, or interpretation of data; in the writing of the manuscript, and in the decision to publish the results. All other authors declare no conflict of interest.
Abbreviations
The following abbreviations are used in this manuscript:
| SUITE | Supervising Unit for In Vitro TEsting |
| LB1 | LiveBox 1 Bioreactor |
| HUVEC | Human Umbilical Vein Endothelial Cells |
| C3A | human hepatocellular carcinoma cells |
| vWF | von Willebrand Factor |
| EMEM | Eagles Minimal Essential Medium |
References
- Di Nardo, P.; Minieri, M.; Ahluwalia, A. Engineering the Stem Cell Niche and the Differentiative Micro-and Macroenvironment: Technologies and Tools for Applying Biochemical, Physical and Structural Stimuli and Their Effects on Stem Cells. In Stem Cell Engineering; Springer: Berlin/Heidelberg, Germany, 2011; pp. 41–59. [Google Scholar] [CrossRef]
- Mattei, G.; Giusti, S.; Ahluwalia, A. Design Criteria for Generating Physiologically Relevant In Vitro Models in Bioreactors. Processes 2014, 2, 548–569. [Google Scholar] [CrossRef]
- Ahluwalia, A. Allometric Scaling in-Vitro. Sci. Rep. 2017, 7, 42113. [Google Scholar] [CrossRef] [PubMed]
- Bratt-Leal, A.M.; Carpenedo, R.L.; McDevitt, T.C. Engineering the Embryoid Body Microenvironment to Direct Embryonic Stem Cell Differentiation. Biotechnol. Prog. 2009, 25, 43–51. [Google Scholar] [CrossRef] [PubMed]
- Pfau, J.C.; Schneider, J.C.; Archer, A.J.; Sentissi, J.; Leyva, F.J.; Cramton, J. Environmental Oxygen Tension Affects Phenotype in Cultured Bone Marrow-Derived Macrophages. AJP Lung Cell. Mol. Physiol. 2004, 286, L354–L362. [Google Scholar] [CrossRef] [PubMed]
- Biechele, P.; Busse, C.; Solle, D.; Scheper, T.; Reardon, K. Sensor Systems for Bioprocess Monitoring. Eng. Life Sci. 2015, 15, 469–488. [Google Scholar] [CrossRef]
- Abu-Absi, N.R.; Kenty, B.M.; Cuellar, M.E.; Borys, M.C.; Sakhamuri, S.; Strachan, D.J.; Hausladen, M.C.; Li, Z.J. Real Time Monitoring of Multiple Parameters in Mammalian Cell Culture Bioreactors Using an in-Line Raman Spectroscopy Probe. Biotechnol. Bioeng. 2011, 108, 1215–1221. [Google Scholar] [CrossRef] [PubMed]
- Trummer, E.; Fauland, K.; Seidinger, S.; Schriebl, K.; Lattenmayer, C.; Kunert, R.; Vorauer-Uhl, K.; Weik, R.; Borth, N.; Katinger, H.; et al. Process Parameter Shifting: Part I. Effect of DOT, pH, and Temperature on the Performance of Epo-Fc Expressing CHO Cells Cultivated in Controlled Batch Bioreactors. Biotechnol. Bioeng. 2006, 94, 1033–1044. [Google Scholar] [CrossRef] [PubMed]
- Olmer, R.; Lange, A.; Selzer, S.; Kasper, C.; Haverich, A.; Martin, U.; Zweigerdt, R. Suspension Culture of Human Pluripotent Stem Cells in Controlled, Stirred Bioreactors. Tissue Eng. Part C Methods 2012, 18, 772–784. [Google Scholar] [CrossRef] [PubMed]
- Maharbiz, M.M.; Holtz, W.J.; Howe, R.T.; Keasling, J.D. Microbioreactor Arrays with Parametric Control for High-Throughput Experimentation. Biotechnol. Bioeng. 2004, 85, 376–381. [Google Scholar] [CrossRef] [PubMed]
- Mehta, G.; Mehta, K.; Sud, D.; Song, J.W.; Bersano-Begey, T.; Futai, N.; Heo, Y.S.; Mycek, M.A.; Linderman, J.J.; Takayama, S. Quantitative Measurement and Control of Oxygen Levels in Microfluidic Poly (dimethylsiloxane) Bioreactors during Cell Culture. Biomed. Microdevices 2007, 9, 123–134. [Google Scholar] [CrossRef] [PubMed]
- Vinci, B.; Murphy, E.; Iori, E.; Meduri, F.; Fattori, S.; Marescotti, M.C.; Castagna, M.; Avogaro, A.; Ahluwalia, A. An in Vitro Model of Glucose and Lipid Metabolism in a Multicompartmental Bioreactor. Biotechnol. J. 2012, 7, 117–126. [Google Scholar] [CrossRef] [PubMed]
- Vinci, B.; Murphy, E.; Iori, E.; Marescotti, M.C.; Avogaro, A.; Ahluwalia, A. Flow-Regulated Glucose and Lipid Metabolism in Adipose Tissue, Endothelial Cell and Hepatocyte Cultures in a Modular Bioreactor. Biotechnol. J. 2010, 5, 618–626. [Google Scholar] [CrossRef] [PubMed]
- Iori, E.; Vinci, B.; Murphy, E.; Marescotti, M.C.; Avogaro, A.; Ahluwalia, A. Glucose and Fatty Acid Metabolism in a 3 Tissue In Vitro Model Challenged with Normo-and Hyperglycaemia. PLoS ONE 2012, 7, e34704. [Google Scholar] [CrossRef] [PubMed]
- Gupta, T.K.; Chen, L.; Groszmann, R.J. Pathophysiology of Portal Hypertension. Clin. Liver Dis. 1997, 1, 1–12. [Google Scholar] [CrossRef]
- Lee, S.S.; Hadengue, A.; Girod, C.; Braillon, A.; Lebrec, D. Reduction of Intrahepatic Vascular Space in the Pathogenesis of Portal Hypertension: In Vitro and in Vivo Studies in the Rat. Gastroenterology 1987, 9, 157–161. [Google Scholar] [CrossRef]
- Liu, S.; Premont, R.T.; Kontos, C.D.; Zhu, S.; Rockey, D.C. A Crucial Role for GRK2 in Regulation of Endothelial Cell Nitric Oxide Synthase Function in Portal Hypertension. Nat. Med. 2005, 11, 952–958. [Google Scholar] [CrossRef] [PubMed]
- Van der Worp, H.B.; Howells, D.W.; Sena, E.S.; Porritt, M.J.; Rewell, S.; O’Collins, V.; Macleod, M.R. Can Animal Models of Disease Reliably Inform Human Studies? PLoS Med. 2010, 7, e1000245. [Google Scholar] [CrossRef] [PubMed]
- Mazzei, D.; Vozzi, F.; Cisternino, A.; Vozzi, G.; Ahluwalia, A. A High-Throughput Bioreactor System for Simulating Physiological Environments. IEEE Trans. Ind. Electron. 2008, 55, 232–241. [Google Scholar] [CrossRef]
- Abts, H.; Arain, S. Process Monitoring in Suspension–Adapted CHO Cell Cultures. BioProcess Int. 2008, 6, 64–66. [Google Scholar]
- Vinci, B.; Cavallone, D.; Vozzi, G.; Mazzei, D.; Domenici, C.; Brunetto, M.; Ahluwalia, A. In Vitro Liver Model Using Microfabricated Scaffolds in a Modular Bioreactor. Biotechnol. J. 2010, 5, 232–241. [Google Scholar] [CrossRef] [PubMed]
- Mazzei, D.; Guzzardi, M.A.; Giusti, S.; Ahluwalia, A. A Low Shear Stress Modular Bioreactor for Connected Cell Culture under High Flow Rates. Biotechnol. Bioeng. 2010, 106, 127–137. [Google Scholar] [CrossRef] [PubMed]
- Giusti, S.; Sbrana, T.; La Marca, M.; Di Patria, V.; Martinucci, V.; Tirella, A.; Domenici, C.; Ahluwalia, A. A Novel Dual-Flow Bioreactor Simulates Increased Fluorescein Permeability in Epithelial Tissue Barriers. Biotechnol. J. 2014, 9, 1175–1184. [Google Scholar] [CrossRef] [PubMed]
- Baudin, B.; Bruneel, A.; Bosselut, N.; Vaubourdolle, M. A Protocol for Isolation and Culture of Human Umbilical Vein Endothelial Cells. Nat. Protoc. 2007, 2, 481–485. [Google Scholar] [CrossRef] [PubMed]
- Vozzi, F.; Bianchi, F.; Ahluwalia, A.; Domenici, C. Hydrostatic Pressure and Shear Stress Affect Endothelin-1 and Nitric Oxide Release by Endothelial Cells in Bioreactors. Biotechnol. J. 2014, 9, 146–154. [Google Scholar] [CrossRef] [PubMed]
- Galbusera, M.; Zoja, C.; Donadelli, R.; Paris, S.; Morigi, M.; Benigni, A.; Figliuzzi, M.; Remuzzi, G.; Remuzzi, A. Fluid Shear Stress Modulates von Willebrand Factor Release From Human Vascular Endothelium. Blood 1997, 90, 1558–1564. [Google Scholar] [PubMed]
- Blendis, L.M.; Orrego, H.; Crossley, I.R.; Blake, J.E.; Medline, A.; Israel, Y. The Role of Hepatocyte Enlargement in Hepatic Pressure in Cirrhotic and Noncirrhotic Alcoholic Liver Disease. Hepatology 2007, 2, 539S–546S. [Google Scholar] [CrossRef]
- Mahmoodi, S.; Poshtan, J.; Jahed-Motlagh, M.R.; Montazeri, A. Nonlinear Model Predictive Control of a pH Neutralization Process Based on Wiener–Laguerre Model. Chem. Eng. J. 2009, 146, 328–337. [Google Scholar] [CrossRef]
- Henson, M.; Seborg, D.E. Adaptive Nonlinear Control of a pH Neutralization Process. IEEE Trans. Control Syst. Technol. 1994, 2, 169–182. [Google Scholar] [CrossRef]
Figure 1.
(a) Block diagram for the SUITE (Supervising Unit for In Vitro Testing) platform connected with several bioreactor units (represented by hexagons 1, 2, and 3); and (b) the detailed scheme of the mixing chamber in the heating system (image not to scale).
Figure 1.
(a) Block diagram for the SUITE (Supervising Unit for In Vitro Testing) platform connected with several bioreactor units (represented by hexagons 1, 2, and 3); and (b) the detailed scheme of the mixing chamber in the heating system (image not to scale).
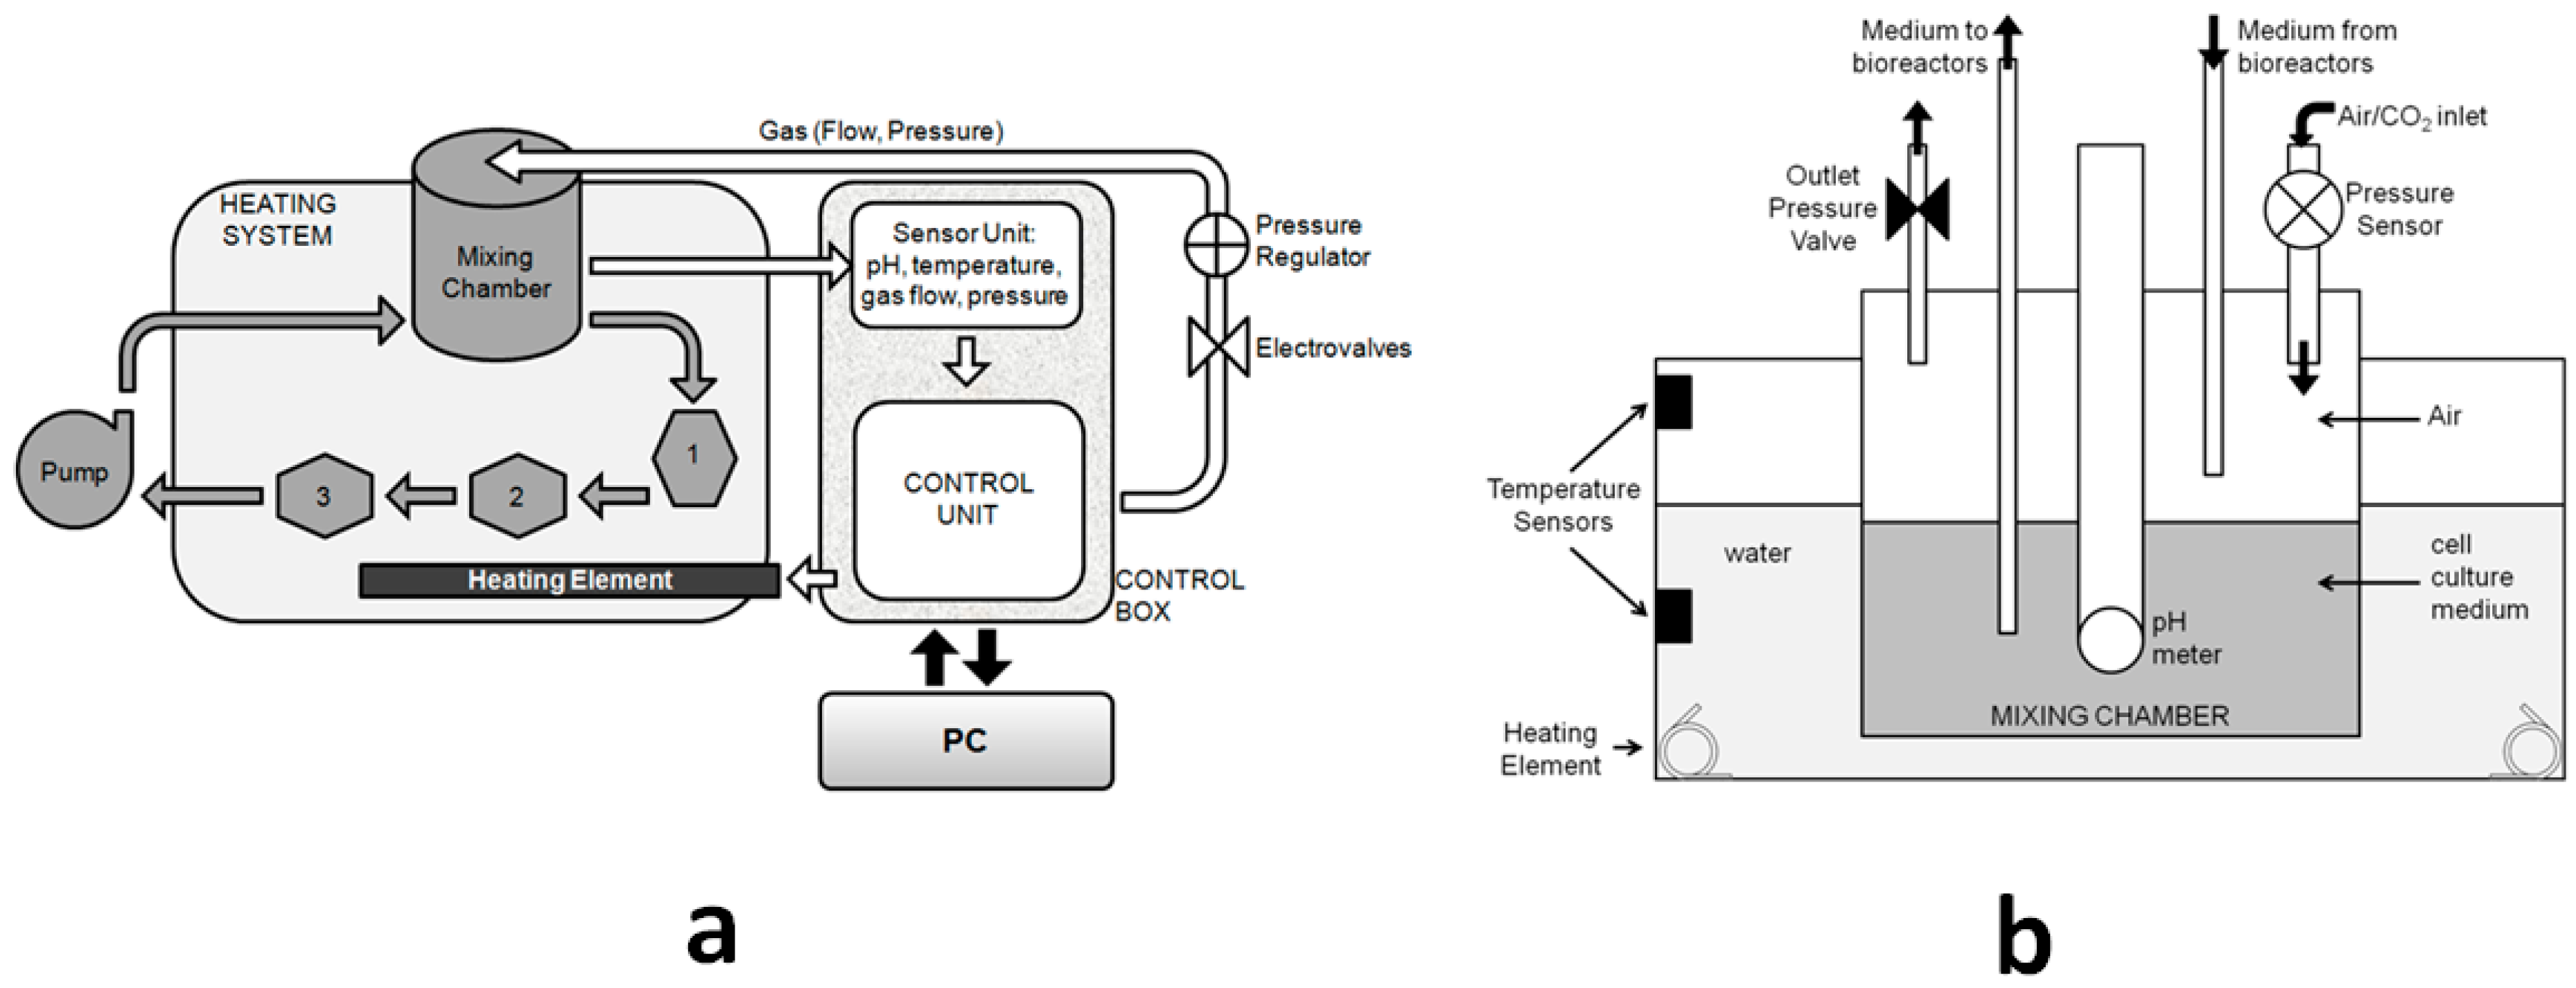
Figure 2.
Block diagram for the pH control algorithm in SUITE.
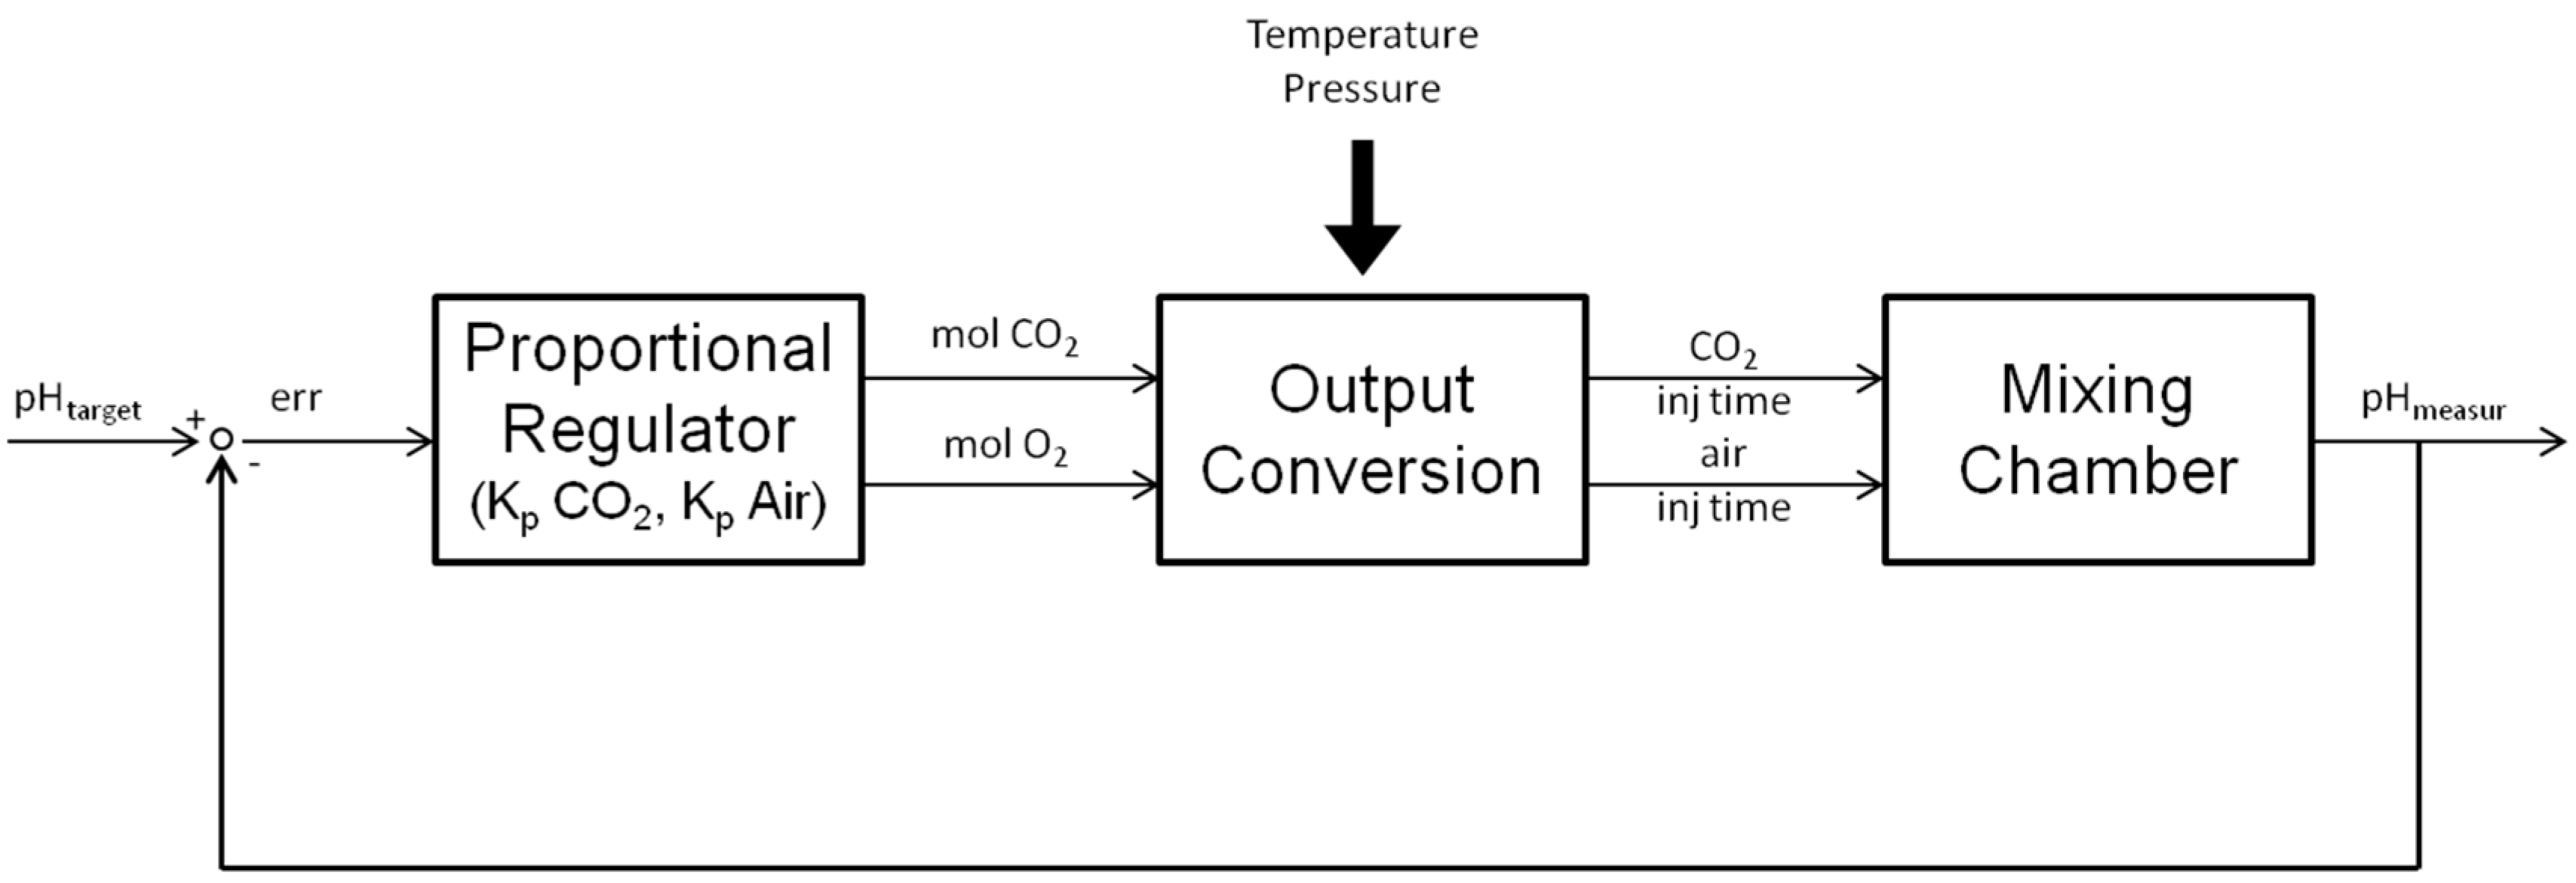
Figure 3.
The LB1 bioreactor: (a) the transparent chamber and clamps; and (b) the inlet and outlet channel and culture region.
Figure 3.
The LB1 bioreactor: (a) the transparent chamber and clamps; and (b) the inlet and outlet channel and culture region.
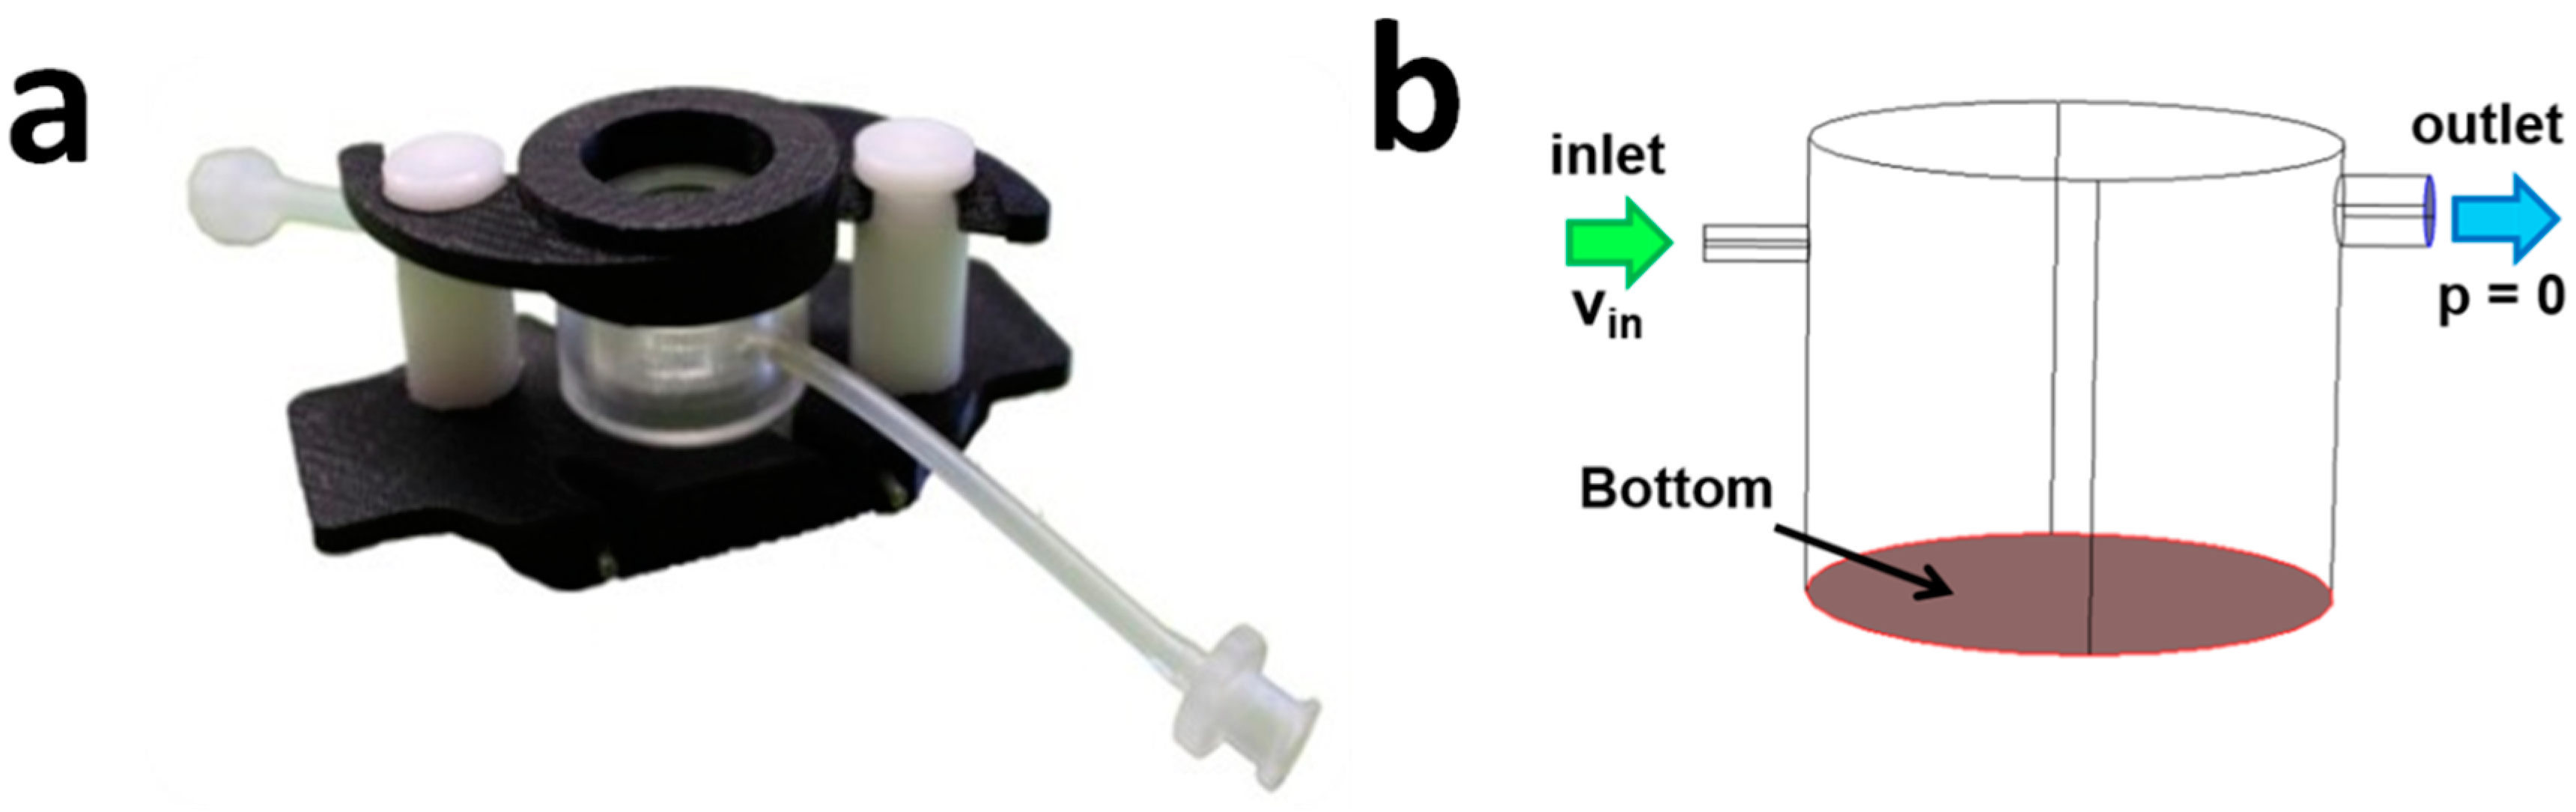
Figure 4.
Results from the CFD models. Velocity streamlines (red) show how laminarity is compromised at higher flow rates. The surface plots at the bottom of the bioreactor show the fluid-induced shear stress (Pa) with the scale bar indicating the maximum (top) and minimum values (bottom).
Figure 4.
Results from the CFD models. Velocity streamlines (red) show how laminarity is compromised at higher flow rates. The surface plots at the bottom of the bioreactor show the fluid-induced shear stress (Pa) with the scale bar indicating the maximum (top) and minimum values (bottom).
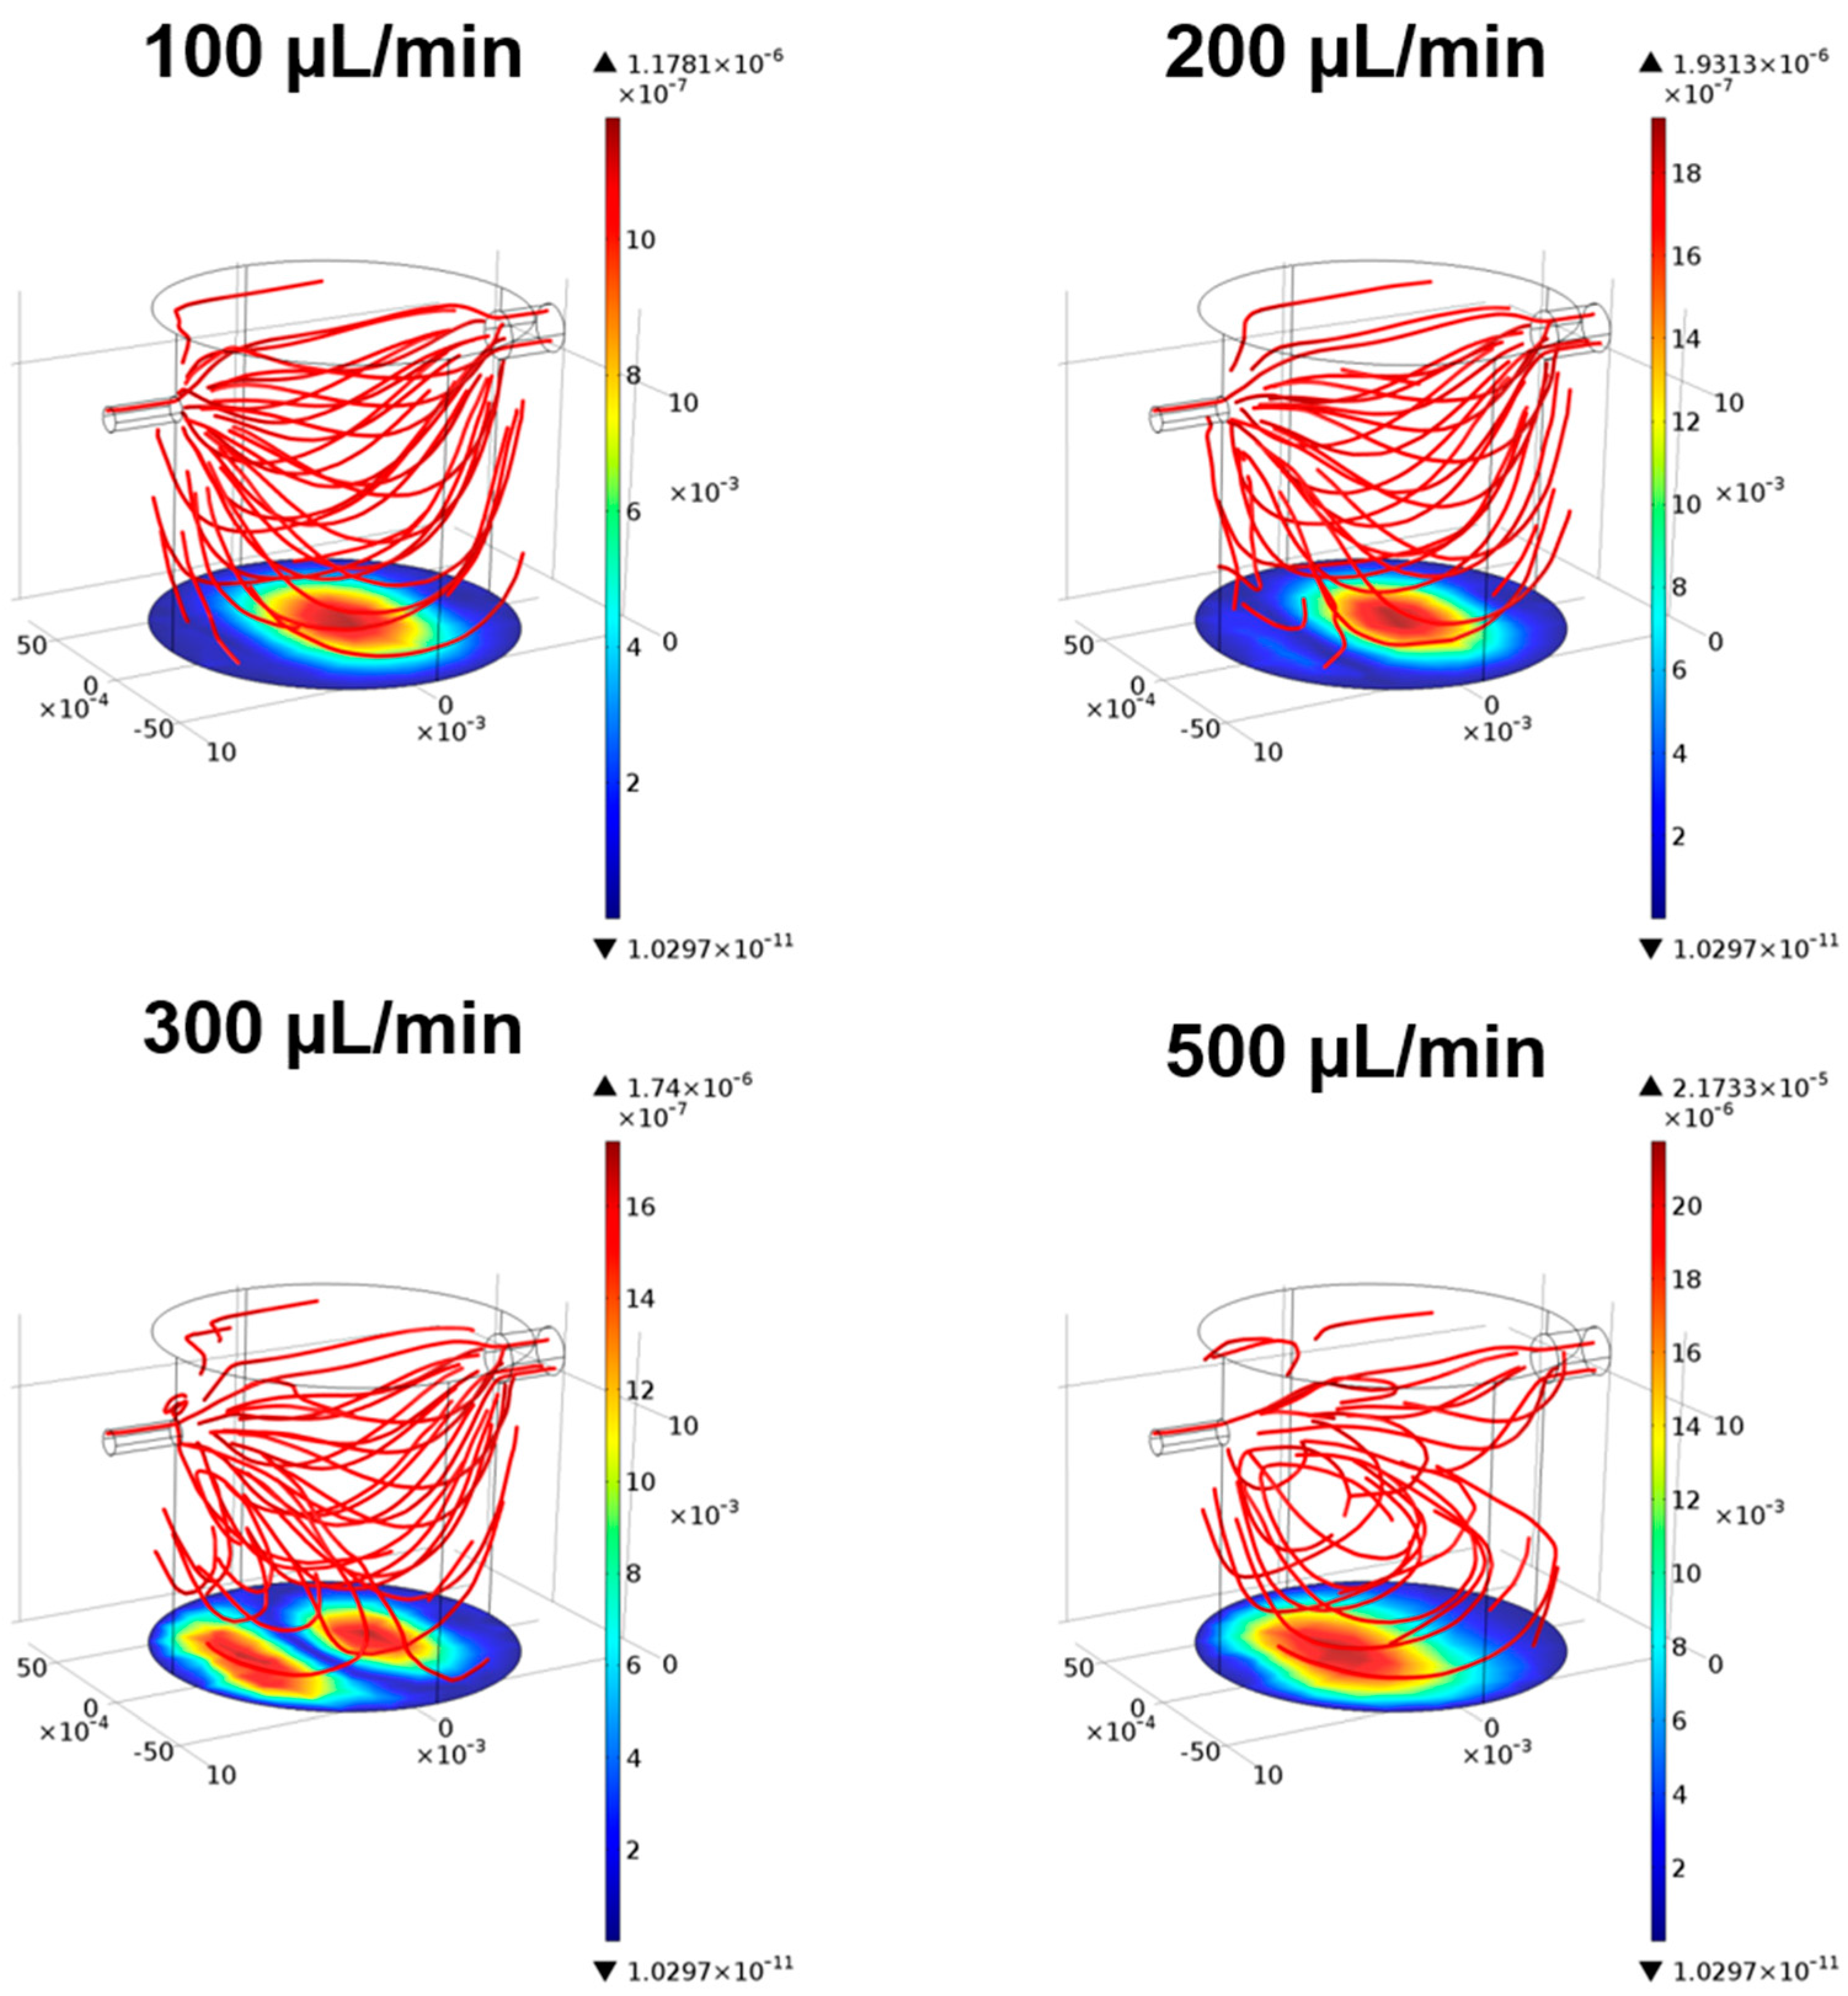
Figure 5.
(a) Behavior of pH control at different hydrostatic pressures (20 mmHg, 40 mmHg). The pH is constantly maintained close to the set-point (pH 7.4) in SUITE, but the medium exposed to air at the same temperature (without SUITE) remains alkaline (i.e., pH around 8.26); (b) Reaction to pH changes: a small quantity of NaOH was inserted in the media at t = 100 s, and SUITE quickly reacts and moves the pH back to the set-point; (c) Control output variables (CO2 and air injection times) measured during the base injection test in Figure 5b.

Figure 6.
(a–c) Fluorescence micrographs of endothelial cells stained with DAPI (blue) and vWF (red). (d) Viability of HUVEC cells after 4 h in the SUITE system at different hydrostatic pressures, compared with dynamic controls placed in the traditional incubator (in LB1). Data are expressed as a percentages with respect to static controls.
Figure 7.
(a–c) Images of C3A (20× magnification, bright field) collected after 24 h of cell culture in the LB1 with different hydrostatic pressures: (a) dynamic control = 4.5 mmHg in the incubator; (b) SUITE at 20 mmHg (the threshold for portal hypertension); (c) SUITE at 40 mmHg (cell damage, 50% viability); and (d) the viability of C3A cells after 24 h in the SUITE system, with respect to static controls placed in the traditional incubator. * p < 0.05 comparing 20 mmHg and 30 mmHg; ** p < 0.01 comparing 30 mmHg and 40 mmHg.


Table 1.
Average injection times at different hydrostatic pressures, when the SUITE control algorithm reaches the steady-state.
Table 1.
Average injection times at different hydrostatic pressures, when the SUITE control algorithm reaches the steady-state.
| Pressure (mmHg) | Air Inject Time (s) | CO2 Inject Time (s) |
|---|---|---|
| 15 | 1.94 ± 0.22% | 4.06 ± 0.18% |
| 20 | 1.54 ± 0.23% | 3.15 ± 0.28% |
| 25 | 1.46 ± 0.21% | 2.88 ± 0.24% |
| 30 | 1.10 ± 0.09% | 2.11 ± 0.47% |
| 40 | 0.78 ± 0.06% | 2.03 ± 0.23% |
| 50 | 0.83 ± 0.18% | 1.57 ± 0.16% |
Table 2.
Quantitative analysis of the expression of vWF in HUVEC (percentage of red fluorescent area with respect to the total area cell covered area of images) for static and dynamic (LB1) controls and in SUITE at different overpressures.
Table 2.
Quantitative analysis of the expression of vWF in HUVEC (percentage of red fluorescent area with respect to the total area cell covered area of images) for static and dynamic (LB1) controls and in SUITE at different overpressures.
| Static Ctrl (0 mmHg) | LB1 (4 mm Hg) | SUITE 30 mmHg | SUITE 40 mmHg | SUITE 50 mmHg |
|---|---|---|---|---|
| 18.14 ± 2.86% | 28.44 ± 5.02% | 29.11 ± 5.98% | 37.28 ± 4.67% | 41.84 ± 6.01% |
© 2017 by the authors. Licensee MDPI, Basel, Switzerland. This article is an open access article distributed under the terms and conditions of the Creative Commons Attribution (CC BY) license (http://creativecommons.org/licenses/by/4.0/).
Share and Cite
MDPI and ACS Style
Giusti, S.; Mazzei, D.; Cacopardo, L.; Mattei, G.; Domenici, C.; Ahluwalia, A. Environmental Control in Flow Bioreactors. Processes 2017, 5, 16. https://doi.org/10.3390/pr5020016
AMA Style
Giusti S, Mazzei D, Cacopardo L, Mattei G, Domenici C, Ahluwalia A. Environmental Control in Flow Bioreactors. Processes. 2017; 5(2):16. https://doi.org/10.3390/pr5020016
Chicago/Turabian StyleGiusti, Serena, Daniele Mazzei, Ludovica Cacopardo, Giorgio Mattei, Claudio Domenici, and Arti Ahluwalia. 2017. "Environmental Control in Flow Bioreactors" Processes 5, no. 2: 16. https://doi.org/10.3390/pr5020016
Note that from the first issue of 2016, this journal uses article numbers instead of page numbers. See further details here.