1. Introduction
Concerns related to global climate change and the long-term ability to generate adequate supplies of crude oil have motivated substantial research on the conversion of renewable and carbon-neutral biomass resources into marketable chemicals [
1]. Almost all aromatics come from crude oil, although small quantities are made from coal. Aromatics are the starting material for a wide range of consumer products, such as clothing, pharmaceuticals, cosmetics, computers, paints, vehicle components, cooking utensils, fabrics and sports equipment [
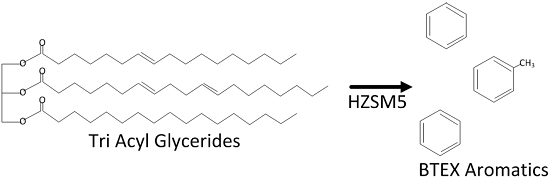
2]. Thus, it is imperative that technologies be developed that can supply the most commonly used aromatics—benzene, toluene, ethylbenzene, and xylenes (BTEX)—from alternative, renewable resources.
Multiple researchers have realized the need for renewable aromatic technology and have published their efforts to achieve this goal. An attractive candidate raw material for aromatics is triglyceride (TG) oils (e.g., crop oils, algae oil), although there are other biomass pathways. For example, Vispute
et al. produced aromatics up to 21.6% carbon yield from biomass pyrolysis oil using Ru/H
2 + zeolite [
3].
Among the TG oil cracking studies, Idem
et al. reported that aromatic hydrocarbon formation and gas yield were favored at high cracking temperature and low canola oil space velocity in the absence of catalyst and steam [
4]. Tamunaidu
et al. cracked palm oil with a REY (rare earth Y structure) catalyst and achieved a 40% selectivity towards aromatics, but with a maximum cracking liquid product yield of only 34 wt% [
5]. Sadrameli
et al. used an analytical semi-empirical model applied to previously published data to predict the attractiveness of various catalysts for crop oil cracking. In their work they found that HZSM-5 > Silicalite > H-Y > Silica-aluminum > H-mordenite > Aluminum-pill-Caly for the catalytic cracking of canola oil [
6]. Among the various catalysts studied, HZSM-5 yielded the highest fraction of aromatics from crop oil [
7,
8].
Twaiq
et al. tested palm oil with three zeolite catalysts, HZSM-5, zeolite β and USY (ultra stable Y structure) with HZSM-5, to assess their conversion, gasoline yield, selectivity for aromatics, and coke formation [
9]. In subsequent work, the same group used HZSM-5 crystals to coat aluminosilicate mesoporous material. The composite materials gave similar palm oil conversion compared to HZSM-5, but lower yields of gaseous products, higher yields of liquid products, and decreased aromatic content in the gasoline fraction [
10].
Katikaneni
et al. also tested several catalysts, including HZSM-5, H-mordenite, H-Y (hydrated Y structure), silicalite, silica-alumina, and aluminum-pillared clay, on canola oil, and again found that HZSM-5 had the highest selectivity towards aromatic hydrocarbons [
11]. In a follow up paper that included wood derived oils, HZSM-5 was again the preferred catalyst with 89% selectivity for aromatics of the 33.6 wt% recovered reaction liquid product [
12]. In subsequent work, they doped HZSM-5 with potassium to weaken the acid sites and observed similar recovery, but with higher yields of aliphatic hydrocarbons at increasing potassium fractions, therefore reducing aromatics yield [
13].
Prasad
et al. performed a DOE on HZSM-5 catalyst in a fixed bed micro-reactor and results showed that 60–95 wt% of the canola oil can be converted to hydrocarbons in the gasoline boiling range, with 60–70 wt% aromatic hydrocarbons [
14]. They subsequently added steam to the inlet and found a two-fold increase in catalyst life while keeping the same aromatic concentration in the liquid product [
15].
Dandik
et al. varied the length of a HZSM-5 bed in a packed column reactor while passing used sunflower oil through the column at pyrolysis conditions. They recovered 33 wt% of the product as liquid. The aromatic content decreased with longer columns, believed to be caused by internal thermal effects between the liquid and vapor phases [
16].
From all these studies it can be seen that HZSM-5 catalytic cracking of crop oil is selective toward aromatics. The present work documents a Design of Experiments study to optimize the reaction conditions for the catalytic cracking of crop oils to generate aromatics. A key contribution to the HZSM-5 aromatic research is the addition of a complete fatty acid analysis. The fatty acid content of the liquid reaction product is most often overlooked, despite the fact that the fatty acid content can limit potential uses as well as impact downstream processing. Fatty acids are an inevitable byproduct when converting any triglyceride oil. They contribute negative qualities for fuel fractions, are difficult to separate, require additional processing to decarboxylate or ketonize and decrease overall yield of desired products.
2. Materials and Methods
2.1. Acquired Reactants and Catalyst
Degummed soybean oil was obtained from Northwood Mills (Northwood, ND, USA). The catalyst, ZSM-5 (CBV5524G), was obtained in the ammonium form from Zeolyst International Inc., Conshohocken, PA, USA. The catalyst had a Si/Al molar ratio of 50/50 with a surface area of 425 m2/g. Hydrogen (UN1049) and nitrogen (UN1066) cylinders were purchased from Praxair Inc., Danbury, CT, USA.
2.2. Equipment
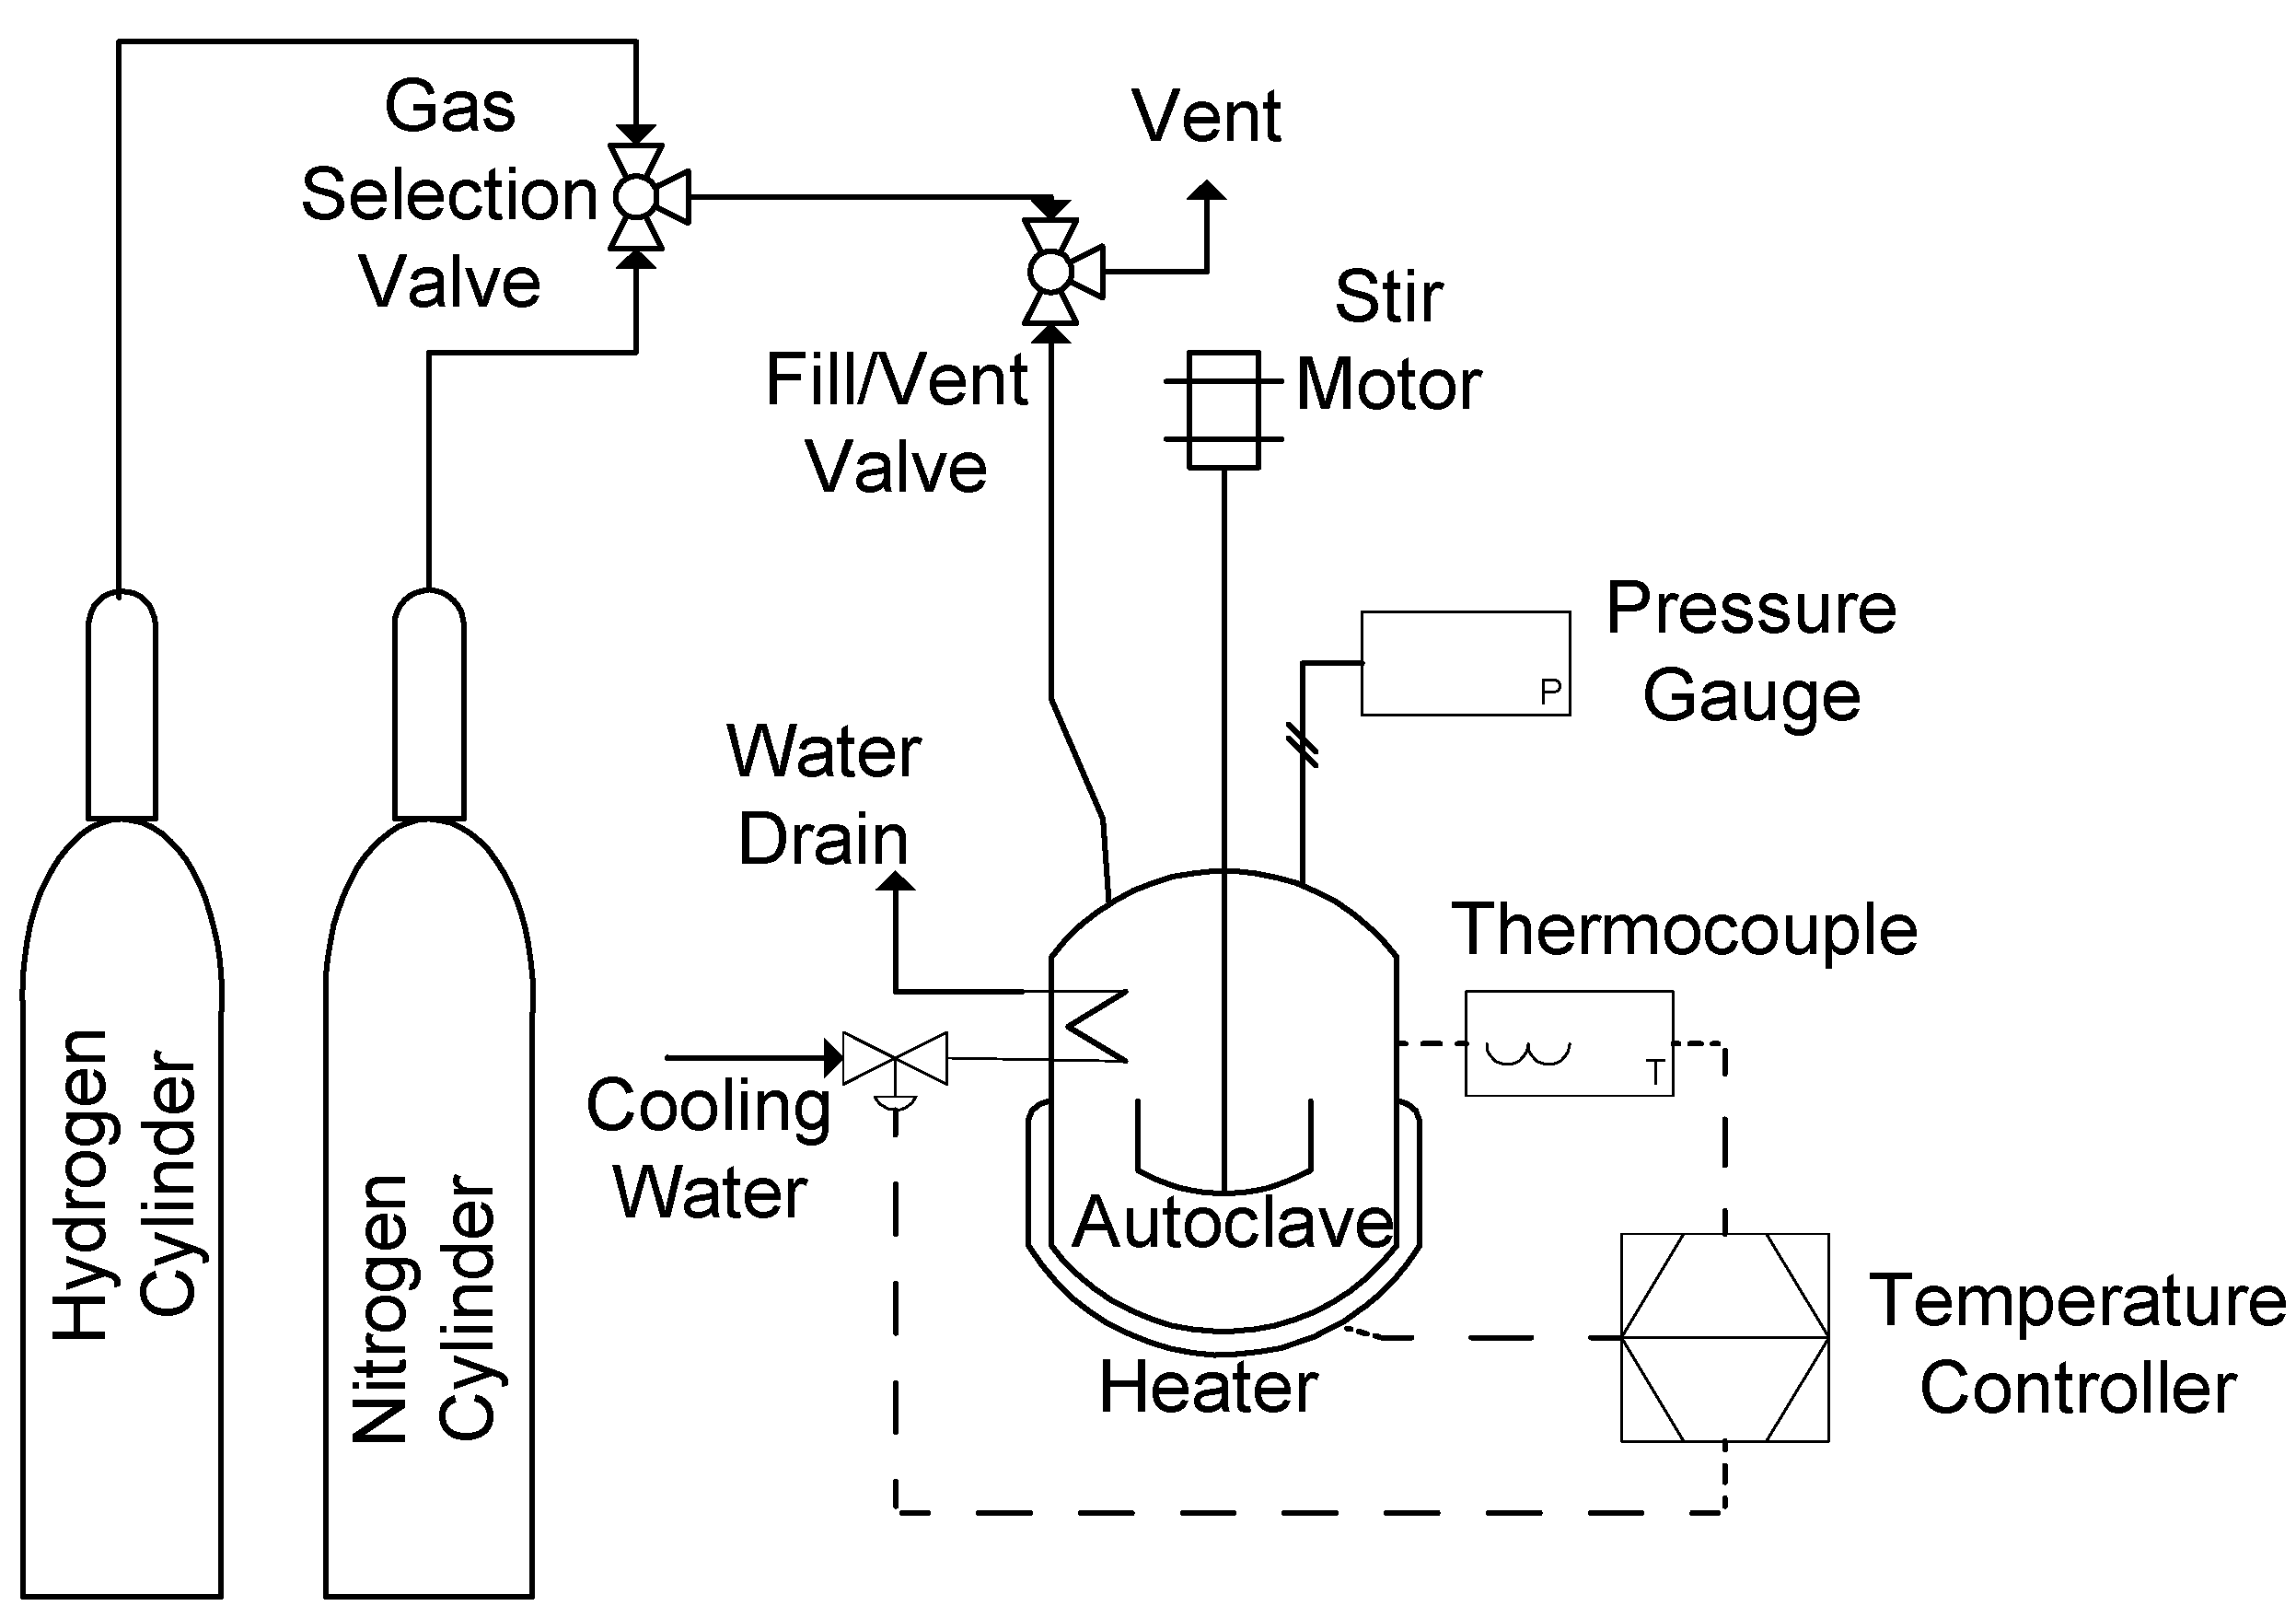
All cracking experiments were conducted in a 500 mL volume, high temperature, high pressure batch reactor (Parr 4575 series High Pressure/High Temperature reactor).
Figure 1 shows a simplified schematic of the autoclave. A flexible compressed graphite gasket was used to maintain a high pressure (34.5 MPa), high temperature (500 °C) seal between the reactor head and vessel. Stirring was provided by a 190 watt magnetic motor drive. Pressure and stir speed were set manually. Temperature was regulated with a heating jacket and cooling water coil and maintained the desired temperature within 1 °C.
Figure 1.
Simplified schematic of autoclave reactor used for all experiments.
Figure 1.
Simplified schematic of autoclave reactor used for all experiments.
2.3. Catalyst Activation
The catalyst was activated by calcination at 600 °C for six hours in an oven. The catalyst was allowed to cool down to room temperature under an inert nitrogen gas atmosphere. The calcined catalyst was then transferred to an airtight container until being used in the cracking reactions.
2.4. Reaction Setup
The specified amount of powdered catalyst was added to the reaction vessel, followed by 200 mL of soybean oil. The 500 mL vessel was then installed in the autoclave, sealed, and repeatedly purged with nitrogen. On the runs where hydrogen was tested, hydrogen gas was purged through the reactor three times before charging to the specified pressure. Once the desired reaction temperature was reached the stirrer was started, signifying the start of the timed experiment.
2.5. Analysis of Products
The products of cracking were the organic liquid product (OLP), uncondensed gases, and coke. The OLP was collected in a graduated cylinder to measure the volume recovered. The residue left behind was a dry dark brown powder, which was a mixture of spent catalyst and coke. All the coked catalyst was carefully collected from the agitator blades, cooling coil, thermocouple, thermowell, and all other internal parts of the reactor and reactor vessel. The difference in the weight of the catalyst before and after the reaction was measured to calculate the amount of coke produced.
Liquid phase analyses were performed following the method developed by Kubatova
et al. [
17,
18]. The analyses of nonpolar hydrocarbons were performed using an Agilent 7890 gas chromatograph equipped with an Agilent 7683B series autosampler and two parallel detectors: a flame ionization detector (FID) and a HP-5975C Mass Spectrometer (MS). Separations were accomplished with a 100 m long DB—Petro Capillary column having an internal diameter of 0.25 mm, and 0.5 μm film thickness (J&W Scientific, Rancho Cordova, CA, USA) with a constant helium flow of 1.5 mL/min. Samples (0.2 μL) were injected with a split ratio of 1:30. Efficient separation was achieved using a temperature gradient of 2.5 °C/min up to 300 °C. The temperature of the FID was 320 °C; the transfer line of the MS was kept at 280 °C. Data collection and processing were performed using GC Chemstation software.
In order to identify the samples, several identification mixtures were employed including paraffins, isoparaffins, aromatics, naphthalenes, and olefins purchased from Supelco (Bellefonte, PA, USA). Identification was performed based on retention time and confirmed based on mass spectra. For calibration, standards consisting of a series of alkanes and species representing different classes of compounds were prepared. Since the FID response is proportional to the carbon mass, the FID signal was used for quantification. For the GC analysis of fatty acids, OLP (10 μL) and standards were derivatized with bis(trimethylsilyl)trifluoroacetamide with trimethylchlorosilane (BSTFA + TMCS, 99:1, 200 μL at 60 °C for 1 h). After cooling to room temperature 2-chlorotoluene, used as an internal standard, and dichloromethane (DCM) were added resulting in their final concentration of 5.0 mg/mL. For identification and quantification of OLPs, a calibration mixture (0.1 to 680 µg/mL) was prepared from analytical grade standards of mono- and dicarboxylic acids as described above for underivatized compounds. The analyses were performed using the instrument described above in the splitless mode (1 min) with an injection volume set to 0.2 µL. The GC separation was performed using a HP-5MS capillary column (60 m × 250 µm × 0.25 µm). Helium was used as a carrier gas at a constant flow rate of 1.1 mL/min. The GC column temperature program started at 35 °C for 5 min, followed by a 20 °C/min gradient to 300 °C and a hold for 12 min. The MS was used for quantification in the full scan mode (m/z of 33–550) using the electron ionization (EI) with the transfer line kept at 300 °C. The solvent delay for MS was adjusted to prevent analysis of the derivatization agent.
2.6. Experimental Test Plan
A design of experiments (DOE) study was performed to evaluate the effect of key reaction parameters on the overall OLP yield and composition, and the amount of coke produced. A half fractional factorial design with sixteen runs was randomized and all experiments were completed in a single block. The five experimental factors examined were reaction temperature, reaction time, catalyst weight, gas composition (N
2–H
2) and gas pressure.
Table 1 lists the DOE parameters and experimental conditions for each experiment. The experiments were conducted in a random order to mitigate any unknown varying influences. The results were verified with Minitab statistical software (State College, PA, USA) for constant variance, independent errors, randomization, zero mean, and contained no outliers.
Table 1.
Design of Experiments (DOE) reaction conditions for the catalytic cracking of soybean oil.
Table 1.
Design of Experiments (DOE) reaction conditions for the catalytic cracking of soybean oil.
| Experiment Number | Reaction Temperature (°C) | Reaction Time (Min) | Catalyst Weight (g) | Hydrogen Composition (%) | Gas Pressure (MPa) |
|---|
| 1 | 410 | 20 | 19 | 0 | 1.4 |
| 2 | 430 | 20 | 19 | 0 | 0 |
| 3 | 410 | 60 | 19 | 0 | 0 |
| 4 | 430 | 60 | 19 | 0 | 1.4 |
| 5 | 410 | 20 | 38 | 0 | 0 |
| 6 | 430 | 20 | 38 | 0 | 1.4 |
| 7 | 410 | 60 | 38 | 0 | 1.4 |
| 8 | 430 | 60 | 38 | 0 | 0 |
| 9 | 410 | 20 | 19 | 100 | 0 |
| 10 | 430 | 20 | 19 | 100 | 1.4 |
| 11 | 410 | 60 | 19 | 100 | 1.4 |
| 12 | 430 | 60 | 19 | 100 | 0 |
| 13 | 410 | 20 | 38 | 100 | 1.4 |
| 14 | 430 | 20 | 38 | 100 | 0 |
| 15 | 410 | 60 | 38 | 100 | 0 |
| 16 | 430 | 60 | 38 | 100 | 1.4 |
The reaction temperature range (410–430 °C) was based on a preliminary study performed by Luo and co-workers [
19], which accounts for the narrow range employed. Reaction time was based on previous studies, conducted by (1) Kubatova
et al. [
18] and (2) Chew and Bhatia [
20], in similar reaction systems. The range of catalyst weight employed (19–38 grams) was based on the work of Katikaneni and co-workers [
11] and verified in our laboratories in preliminary studies [
21]. The presence of a hydrogen environment can have two counteracting effects in this reaction system. Hydrogen may help to keep the ZSM-5 catalyst activated. However, too much hydrogen will inhibit the aromatization reactions, since hydrogen is a byproduct of double bond formation. The DOE low and high values were set at operating pressures of <0.1 MPa (vacuum conditions, denoted in table 1 as 0) and 1.4 MPa, which insured that a full run could be completed before the maximum safe pressure of the reaction system was reached. Our purpose in including hydrogen in the test matrix was to explore these two effects. An inert nitrogen atmosphere at the same initial reaction pressures was also investigated to separate pressure effects from those due to the presence of hydrogen.
3. Results and Discussion
Table 2 presents a summary of the DOE significant factors measured during the cracking experiments while
Table 3 and
Table 4 show the composition results from these catalytic cracking experiments. Where a positive response to any factor is indicated in
Table 2, it means that a larger effect on the production of that analyzed component was observed, whereas a negative response shows a reduced effect when the factor parameter is increased. The mass balance remaining after measuring OLP and coke is reported as the uncondensed gas, which contains mostly CO
2, CO, and low concentrations of short-chain (C1–C4) hydrocarbons. The product gas composition was not of great importance in maximizing aromatics in these experiments, however optimization favored lower gas production as it correlates directly to high OLP yields.
Table 2.
A summary of the significant DOE factors in the catalytic cracking of soybean oil.
Table 2.
A summary of the significant DOE factors in the catalytic cracking of soybean oil.
| Response | Reaction Temperature | Reaction Time | Weight of Catalyst | Hydrogen Composition | Gas Pressure |
|---|
| OLP Yield (%) | + | + | + | NE | NE |
| Coking (% feed) | (Interaction with Hydrogen Composition) | (Interaction with Hydrogen Composition) | (Interaction with Hydrogen Composition) | + | NE |
| Alkanes (w/w %) | NE | NE | − | NE | NE |
| Cycloalkanes (w/w %) | + | + | − | NE | NE |
| Alkenes (w/w %) | NE | + | − | + | NE |
| Aromatics (w/w %) | + | + | + | NE | NE |
| Light PAH (w/w %) | NE | + | + | NE | NE |
| Fatty Acids (All Unsaturated) (w/w %) | NE | NE | − | NE | NE |
Table 3.
Composition results from the catalytic cracking of soybean oil (concentration reported as weight percent based on feed oil and the organic liquid product (OLP).
Table 3.
Composition results from the catalytic cracking of soybean oil (concentration reported as weight percent based on feed oil and the organic liquid product (OLP).
| Experiment Number | OLP | Coke | Alkanes | Cycloalkanes | Alkenes | Aromatics | Polycyclic Aromatic Hydrocarbons | Fatty Acids |
|---|
| %Feed | %Feed | %Feed (%OLP) | %Feed (%OLP) | %Feed (%OLP) | %Feed (%OLP) | %Feed (%OLP) | %Feed (%OLP) |
|---|
| 1 | 27 | 1 | 0.76 (2.8) | 0.03 (0.10) | 0.11 (0.42) | 3.1 (11) | 0.32 (1.2) | 2.4 (8.8) |
| 2 | 50 | 9 | 2.2 (4.4) | 0.08 (0.17) | 0.16 (0.31) | 7.5 (15) | 0.90 (1.8) | 1.4 (2.7) |
| 3 | 40 | 0 | 1.8 (4.5) | 0.07 (0.16) | 0.20 (0.50) | 6.4 (16) | 0.59 (1.5) | 2.5 (6.2) |
| 4 | 56 | 5 | 1.8 (3.2) | 0.07 (0.13) | 0.17 (0.30) | 10 (18) | 1.9 (3.4) | 1.8 (3.2) |
| 5 | 35 | 9 | 0.43 (1.2) | 0.02 (0.06) | 0.05 (0.15) | 10 (29) | 2.6 (7.3) | 0.06 (0.18) |
| 6 | 55 | 13 | 1.4 (2.6) | 0.04 (0.08) | 0.07 (0.12) | 16 (28) | 2.4 (4.4) | 0.03 (0.06) |
| 7 | 53 | 7 | 0.79 (1.5) | 0.03 (0.07) | 0.12 (0.26) | 17 (33) | 4.3 (8.1) | 0.02 (0.05) |
| 8 | 60 | 11 | 1.0 (1.7) | 0.05 (0.08) | 0.07 (0.12) | 21 (35) | 4.2 (7.0) | 0.02 (0.04) |
| 9 | 33 | 8 | 1.6 (4.9) | 0.05 (0.15) | 0.20 (0.60) | 4.5 (14) | 0.46 (1.4) | 3.1 (9.4) |
| 10 | 44 | 6 | 2.1 (4.9) | 0.07 (0.17) | 0.21 (0.47) | 8.0 (18) | 0.93 (2.12) | 1.5 (3.4) |
| 11 | 38 | 12 | 2.4 (6.1) | 0.06 (0.17) | 0.21 (0.55) | 8.1 (21) | 0.75 (2.0) | 0.99 (2.6) |
| 12 | 53 | 9 | 1.9 (3.5) | 0.09 (0.18) | 0.20 (0.37) | 11 (21) | 2.2 (4.1) | 0.06 (0.11) |
| 13 | 34 | 9 | 0.41 (1.2) | 0.02 (0.04) | 0.09 (0.27) | 11 (33) | 3.1 (9.0) | 0.01 (0.04) |
| 14 | 54 | 5 | 0.62 (1.1) | 0.02 (0.03) | 0.10 (0.18) | 16 (25) | 2.7 (5.0) | 1.5 (2.8) |
| 15 | 51 | 13 | 0.62 (1.2) | 0.02 (0.04) | 0.16 (0.31) | 16 (32) | 4.9 (9.7) | 0.02 (0.04) |
| 16 | 63 | 10 | 1.2 (2.0) | 0.06 (0.09) | 0.13 (0.20) | 22 (35) | 5.6 (8.9) | 0.39 (0.61) |
Table 4.
Fatty acids distribution results from catalytic cracking soybean oil (concentration in wt% based on total acid and OLP).
Table 4.
Fatty acids distribution results from catalytic cracking soybean oil (concentration in wt% based on total acid and OLP).
| Experiment Number | Uncracked Acids | Formic Acid | Acetic Acid | Propanoic Acid | Butanoic Acid | Pentanoic Acid | Hexanoic Acid | Heptanoic Acid | Octanoic Acid | Nonanoic Acid |
|---|
| %Acid (%OLP) | %Acid (%OLP) | %Acid (%OLP) | %Acid (%OLP) | %Acid (%OLP) | %Acid (%OLP) | %Acid (%OLP) | %Acid (%OLP) | %Acid (%OLP) | %Acid (%OLP) |
|---|
| 1 | 72 (6.3) | - | 3.7 (0.33) | 2.0 (0.18) | 1.6 (0.14) | 1.9 (0.16) | 2.4 (0.21) | 3.3 (0.29) | 3.5 (0.30) | 3.1 (0.27) |
| 2 | 36 (0.97) | - | 8.9 (0.24) | 6.6 (0.18) | 5.5 (0.15) | 5.3 (0.14) | 6.4 (0.17) | 8.2 (0.22) | 7.8 (0.21) | 6.8 (0.18) |
| 3 | 53 (3.2) | - | 4.3 (0.27) | 3.6 (0.22) | 3.2 (0.19) | 3.5 (0.22) | 4.5 (0.28) | 6.3 (0.39) | 6.3 (0.39) | 5.3 (0.33) |
| 4 | 76 (2.4) | - | 5.1 (0.16) | - | 2.6 (0.08) | 2.4 (0.08) | 2.8 (0.09) | 3.7 (0.12) | 3.7 (0.12) | 3.5 (0.11) |
| 5 | 74 (0.13) | - | 26 (0.05) | - | - | - | - | - | - | - |
| 6 | - | - | 100 (0.06) | - | - | - | - | - | - | - |
| 7 | - | - | 100 (0.05) | - | - | - | - | - | - | - |
| 8 | - | - | 100.0 (0.04) | - | - | - | - | - | - | - |
| 9 | 47 (4.5) | - | 3.2 (0.30) | 3.0 (0.28) | 2.8 (0.26) | 3.8 (0.36) | 5.3 (0.50) | 7.6 (0.71) | 7.7 (0.72) | 6.4 (0.61) |
| 10 | 44 (1.5) | - | 5.6 (0.19) | 5.3 (0.17) | 5.1 (0.17) | 5.5 (0.19) | 6.3 (0.22) | 8.4 (0.29) | 7.5 (0.26) | 5.9 (0.20) |
| 11 | 45 (1.2) | - | 7.0 (0.18) | 6.9 (0.17) | 6.7 (0.17) | 6.7 (0.18) | 7.7 (0.20) | 10.4 (0.27) | 9.4 (0.25) | - |
| 12 | - | - | 66 (0.07) | - | - | 34 (0.04) | - | - | - | - |
| 13 | - | - | 100 (0.04) | - | - | - | - | - | - | - |
| 14 | 90 (2.5) | - | 5.0 (0.14) | - | - | 1.4 (0.04) | 1.6 (0.04) | 2.1 (0.06) | - | - |
| 15 | - | - | - | - | - | 100 (0.04) | - | - | - | - |
| 16 | 26 (0.16) | - | 26 (0.16) | - | - | 8.7 (0.05) | 11 (0.07) | - | 13.8 (0.08) | 14 (0.09) |
3.1. Aromatic Product Recovery
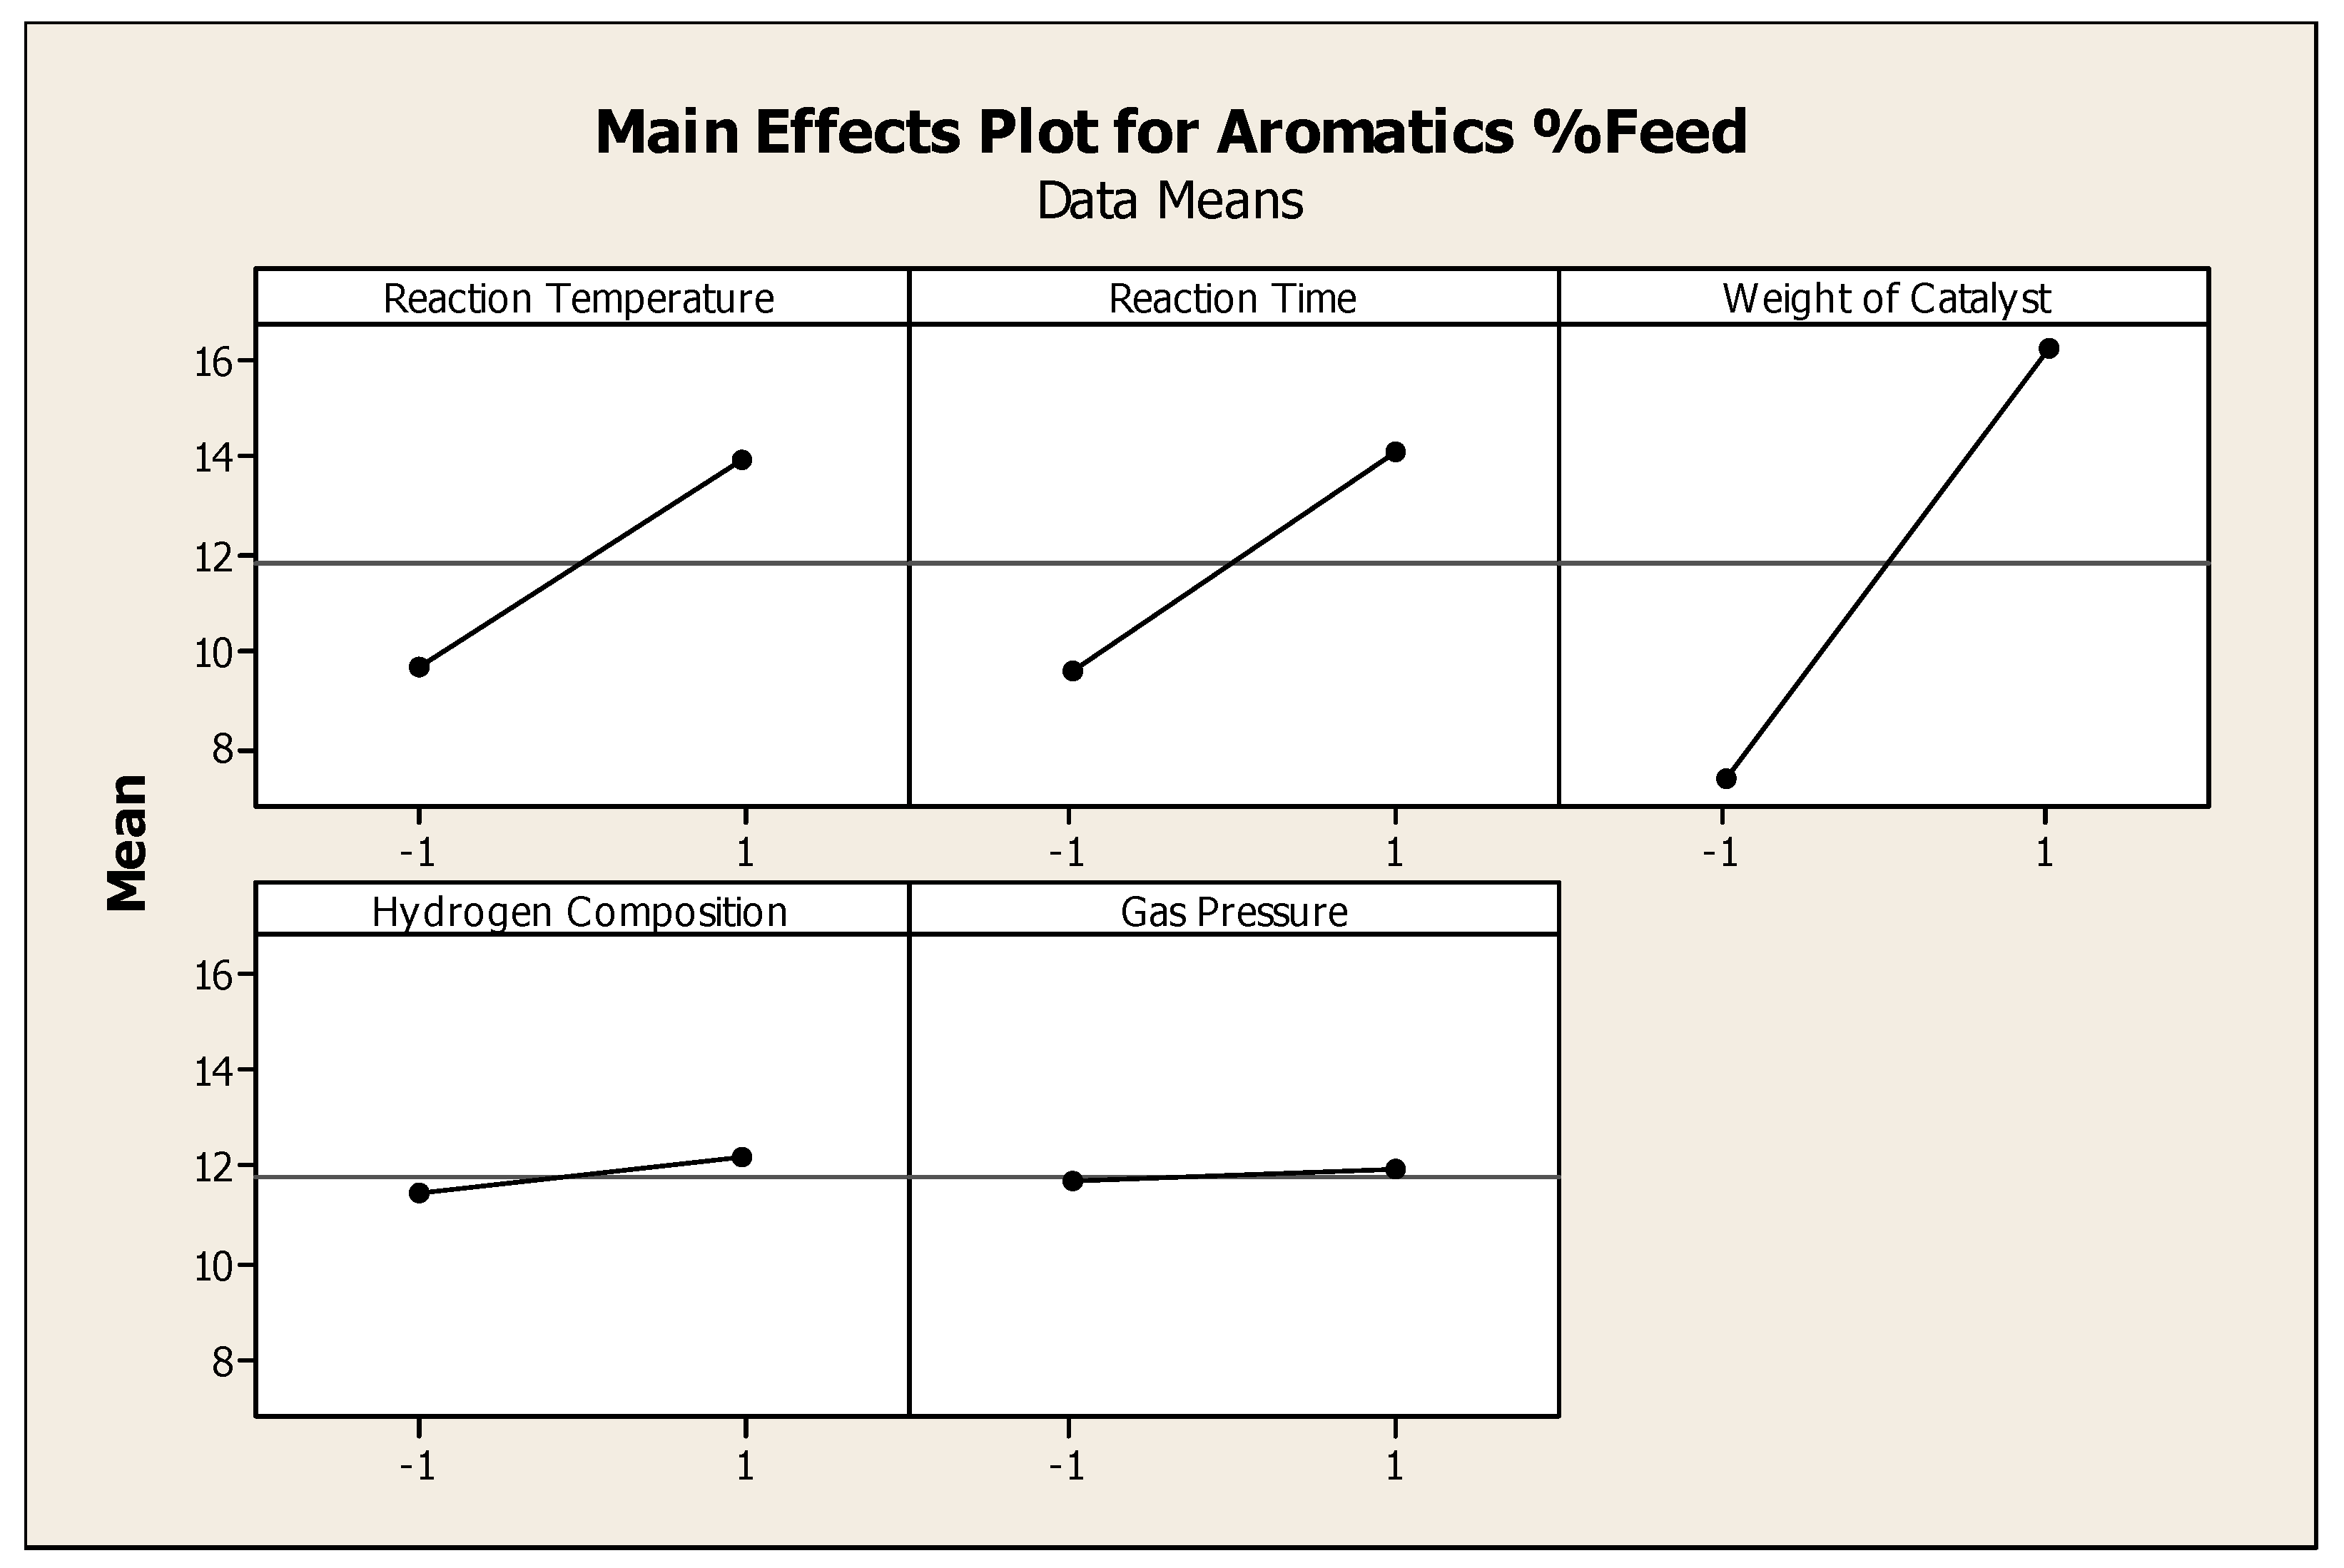
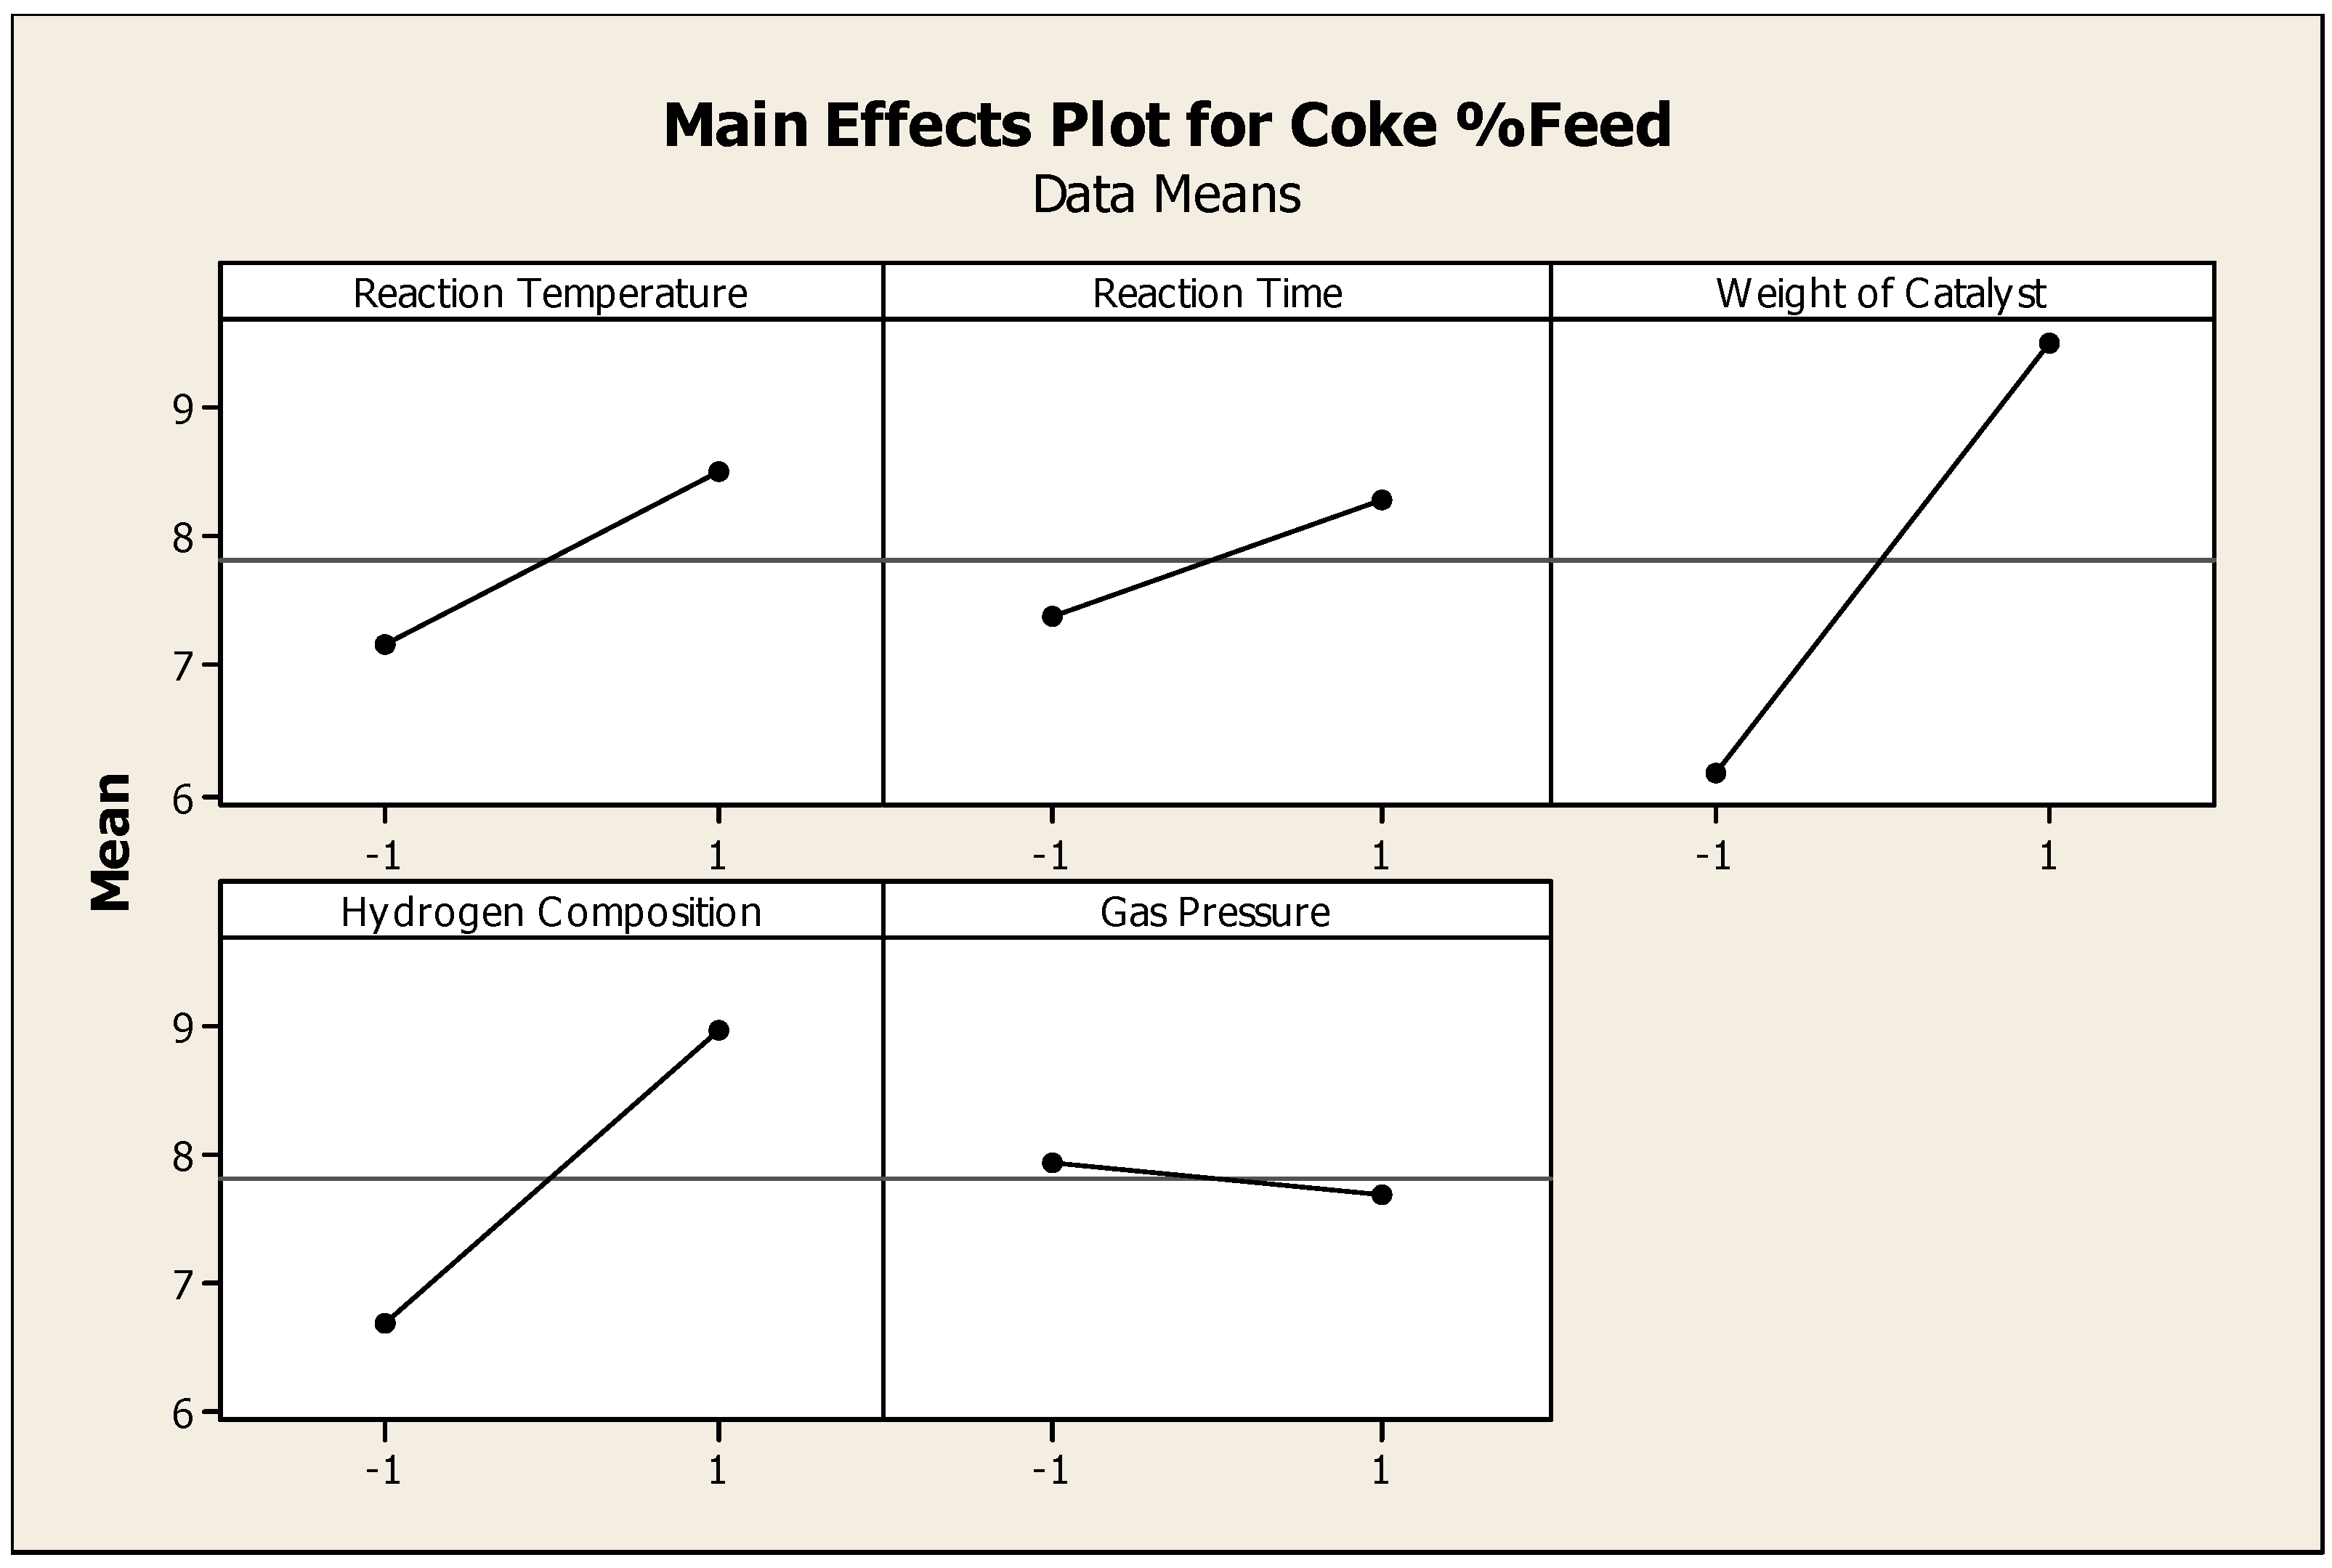
Aromatic production was maximized by greater amounts of catalyst, longer reaction time and higher reaction temperatures. Hydrogen gas and total gas pressure had no statistically significant effect on aromatic production. When reactant TG oil and thermally cracked (noncatalytically) TG products had more available active catalyst sites at higher temperature and longer reaction time, the formation of aromatics significantly increased.
Figure 2 shows the DOE results, as compiled using the MINITAB™ software package, for the average effects of tested factors on aromatics.
Figure 2.
Main effect plot for recovered aromatics.
Figure 2.
Main effect plot for recovered aromatics.
3.2. Unreacted Soybean Oil
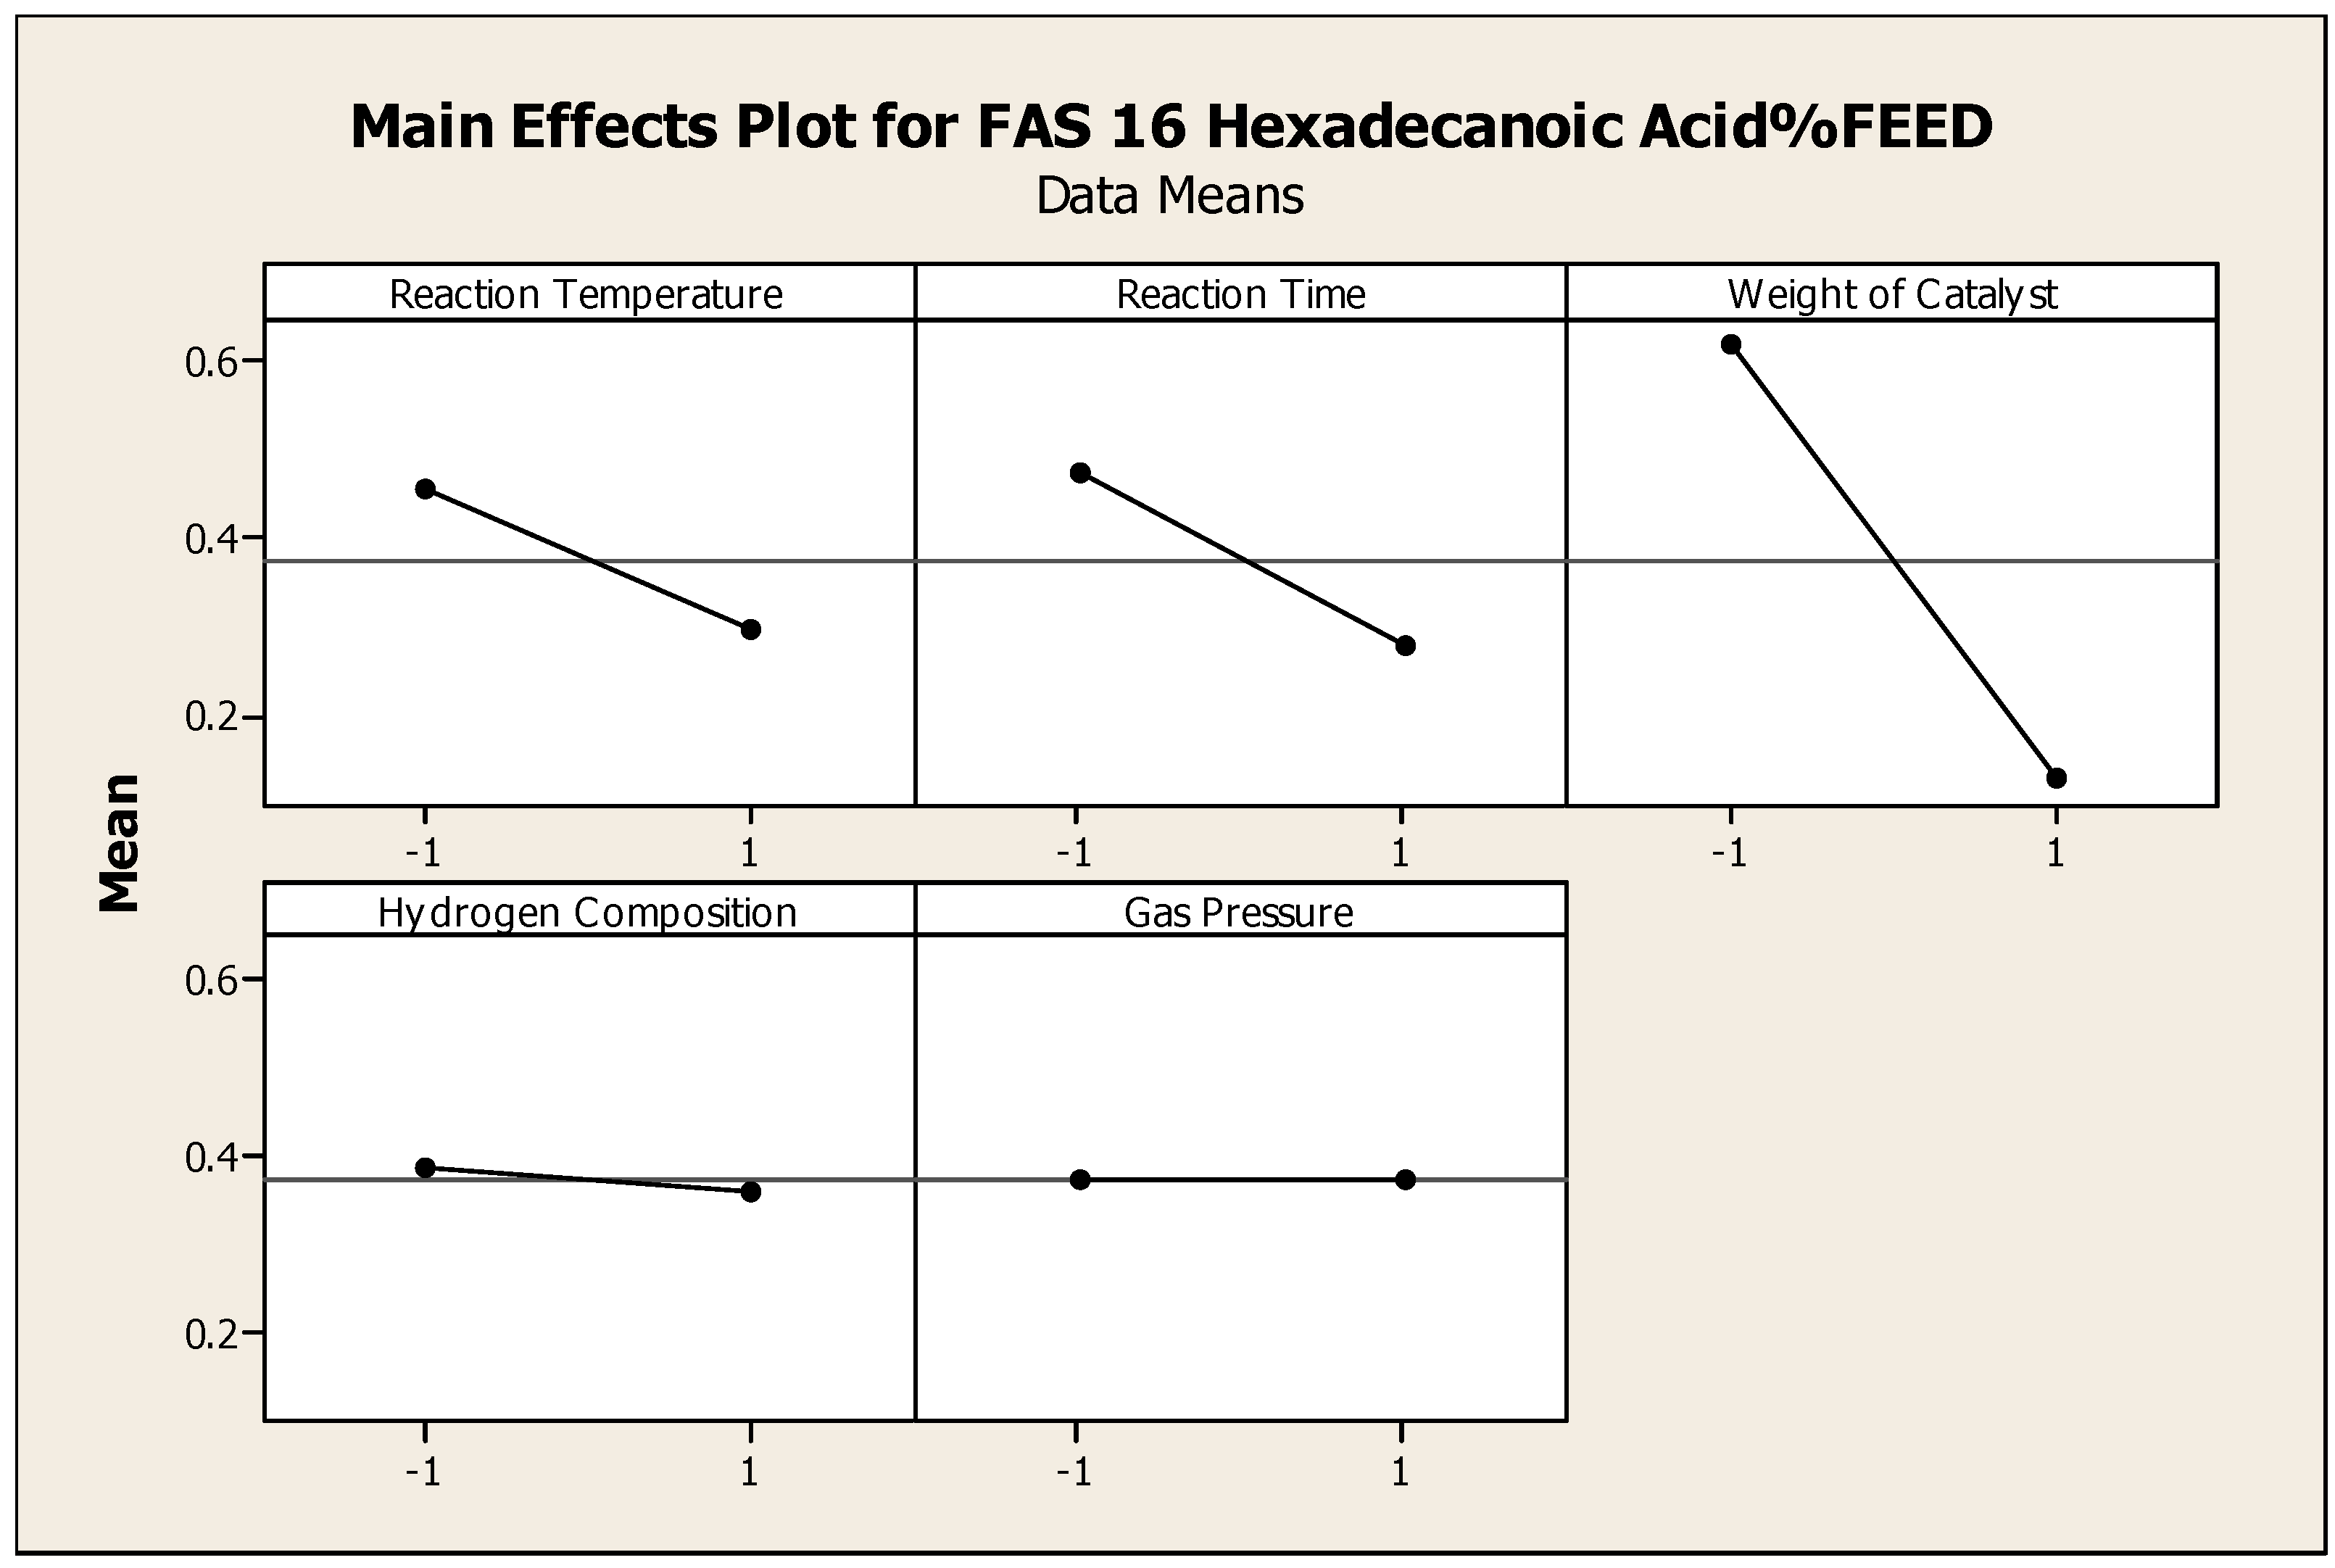
Unreacted feed oil was measured by the presence of C16–C18 fatty acids in their derivatized form in GC-MS analyses.
Figure 3 shows the main effect plot of C16 fatty acids; the effects of C18 fatty acids were comparable but not as prominent. As expected, increased reaction time, temperature, and amount of catalyst promoted a more complete reaction of feed oil. By contrast, an increase in reaction pressure, either with or without hydrogen, was not a significant factor.
3.4. Notable Experimental Runs
The concentrations of C16 and C18 fatty acids were combined and are reported in
Table 3 as uncracked acids. These acids are formed when fatty acid chains (most typically saturated chains) are cleaved from the glyceride backbone with no further decomposition. These stable chains typically are not able to contribute to the formation of aromatics during cracking reactions. When the concentrations shown in
Table 4 were adjusted to remove these unreactive compounds, it was found that over 35% of the inlet oil that is available to participate in the cracking reactions can be converted into aromatics, as measured in the OLP corresponding to over 20% of TG feed being converted to aromatics.
Every run (5–8, 13–16) with high catalyst loadings results in an OLP with over 25% aromatics concentration. Two runs (11 and 12) at the low catalyst loading still produced over 20% aromatics in the OLP, which was assisted by the longer reaction time.
Over 10% of the feed can be converted to possibly recoverable coke, with coke formation facilitated by the presence of hydrogen. Two runs (6 and 8) resulted in the formation of large coke amounts even in the absence of externally added hydrogen. This effect can be accounted for by the high temperature and increased catalyst weight, which promote, not only the reactant cracking to monoaromatics, but also the subsequent side reactions of condensation into PAH and then to coke.
3.5. Catalytic Effect
The aromatic hydrocarbon fraction in the OLP increased significantly with increased reaction time and additional catalyst thus evidencing the catalytic effect of HZSM-5. Fewer alkanes and alkenes were observed with more catalyst as these products are postulated to be intermediates for aromatics (
Table 3). Thus longer residence time and additional active catalyst sites will promote secondary reactions to aromatics. PAHs and coke formation also increased with more catalyst (
Table 3). The overall OLP yield increased with increased catalyst weight, preventing reactant loss to low molecular weight gaseous species.
3.6. Hydrogen Effect on OLP Fatty Acid Content
The decarboxylating effect of the catalyst was amplified with the addition of hydrogen as seen in experiments with low catalyst weight, which produced relatively low fatty acid concentrations (
Table 4). Even the runs conducted under a lower catalyst loading but with the addition of hydrogen resulted in low fatty acid content. The detailed speciation analysis showed that all relatively high fatty acid amounts were due to the presence of uncracked C16 and C18 fatty acids. By contrast, when complete catalytic cracking occurred, only acetic acid and small amounts of short chain fatty acids were observed (
Table 4). Increasing the quantity of HZSM-5 increased the yield of recoverable products, OLP and coke, while producing aromatics and keeping fatty acid amounts low. The most successful runs, those yielding the maximum concentration of aromatics, contained only trace amounts of carboxylic acids (
Table 3), of which either acetic or pentanoic acid was the only one present above the limit of quantification (
Table 4).


