Abstract
Industrial control systems are often used to assist and manage an industrial operation. These systems’ weaknesses in the various hierarchical structures of the system components and communication backbones make them vulnerable to cyberattacks that jeopardize their security. In this paper, the security of these systems is studied by employing a reinforcement learning extended attack graph to efficiently reveal the subsystems’ flaws. Specifically, an attack graph that mimics the environment is constructed for the system using the state–action–reward–state–action technique, in which the agent is regarded as the attacker. Attackers may cause the greatest amount of system damage with the fewest possible actions if they have the highest cumulative reward. The worst-case assault scheme with a total reward of 42.9 was successfully shown in the results, and the most badly affected subsystems were recognized.
1. Introduction
Industrial control systems (ICSs) characterize a broad range of control systems that are used to support and manage industrial operations. These systems include train transportation, gas and power distribution, water treatment, oil refining, and process monitoring. Among the most well known ICSs are distributed control systems (DCSs) and Supervisory Control and Data Acquisition (SCADA) systems [1]. The largest subgroup of ICSs used in industrial settings to monitor a process from a central location is acknowledged to be SCADA systems. Numerous configurations for SCADA systems are available, and they may be tailored to the specific needs of the controlled process. Due to this feature, SCADA systems are suitable for numerous uses such as energy management and manufacturing [2].
Remote access and top monitoring are made possible by the effective connection between SCADA system nodes, but this also exposes the system to cyberattacks. Numerous cyberattack events related to SCADA security have been reported; these attacks have caused plant damage, financial loss, and in certain circumstances, fatalities [3]. Nonetheless, in our prior work on ICS security [4], we tried to depict the attack sequences that an attacker would employ to break the system inside the attack graph. Furthermore, architectural analysis and design language for system modeling were employed to discover any potential attacks.
Machine learning (ML) is an innovation that is capable of assisting real-world communication challenges. Artificial intelligence (AI) is now having a major influence on the development of various sectors. This paper demonstrates the usage of a reinforcement learning (RL)-based security analysis methodology for ICSs. The state–action–reward–state–action (SARSA) strategy, which employs incentives and penalties to interact with sensory data and the environment, is utilized in particular. Unlike previous ML approaches that relied on trial and error, without any previous idea of the environment, RL agents are capable of independent learning [5]. A novel SARSA-based on-policy algorithm is proposed and applied to an ICS to identify the optimal assault scheme that a potential attacker could use to inflict the most amount of harm on the system. An off-policy learner learns the importance of taking the optimal course of action independent of the agent’s behavior. The advantages of the policy, including the investigative processes, are known to an agent who is learning on-policy [6].
The remainder of the paper is provided as follows. Section 1.1 summarizes a portion of the studies carried out in this field. Section 2 discusses the ICS system and the details of our technique. Section 3 depicts the SARSA algorithm procedure, while Section 4 describes the system’s evaluation and outcomes. Finally, in Section 5, we outline our contribution and future endeavors.
1.1. Related Work
The literature looks at RL’s and SARSA’s possible applications in cybersecurity. Reference [7], for example, proposed adaptive RL techniques to analyze the safe state estimation dilemma from three different perspectives. Both the strategy that leads to Nash equilibrium from the standpoint of a zero-sum game and the matching optimum course of action from the perspective of an attacker or sensor may be found using the methods. It can be observed that there are restrictions since high-dimensional state spaces cannot be accommodated by Q-learning because they depend on tables for value storage.
To look at the problem of impersonation between mobile users and edge nodes in edge computing settings, a RL algorithm was proposed by the authors of [8] as part of an impersonation attack detection strategy that makes use of physical layer security technologies. Under the Impersonation Attack Model (IAM) in an edge environment, a detection method built on the SARSA algorithm was developed to identify impersonation attacks in a dynamic context. The experimental outcomes illustrated that while Q-learning has a higher miss detection rate than the SARSA-based impersonation detection system, it has a lower false alarm and average error rate. Communication security among edge nodes and mobile clients is consequently better protected in an environment of edge computing with enhanced accuracy.
The application of RL in penetration testing has been covered in several published works. An automated penetration testing system built on deep reinforcement learning techniques—specifically, Deep Q-Learning Network (DQN)—was developed by the authors of [9]. The method creatively gathers actual host and vulnerability data for creating realistic training and validation situations by fusing the Shodan search engine with a range of vulnerability datasets. The DQN model is trained by processing the attack information that is generated for every training scenario using the attack tree approach. The training determines the best practical attack path for a particular network scenario by using reward points that are awarded to each node, mostly based on CVSS score information. The DQN approach needs more work to establish the appropriate parameter choice for the DQN model over a broad number of situations with diverse attributes, even though it appears to converge quite quickly when utilizing multiple instance network topologies.
In penetration tests [10], RL algorithms of the Partially Observable Markov Decision Processes (POMDPs), Markov Decision Processes (MDPs), and DQN kinds are frequently employed. Research indicates that the POMDP model is not well suited for big networks. The literature has suggested MDP and DQN algorithms as a way to overcome this POMDP constraint as well as a way to expand the network’s size and performance.
Numerous studies have been carried out to investigate SARSA algorithms for determining the optimum path. For example, Ref. [11] provided a special reinforcement learning technique called “Iterative SARSA” that enables an agent to select the safest path in hazardous environments. The recommended approach functioned best when the overall safety and effectiveness of the activities came before their speed of implementation. SARSA was next applied to determine the safest trajectory. But because of all the iterations, the path’s length caused the temporal complexity to increase.
A hierarchical route planning approach was proposed by the authors of [12], employing multi-SARSA based on topological maps to find the best path for mobile robots with little computation. The solution in this research divides and addresses the issue by offering a priori knowledge: the initialization of the Q-table is given by the topological map, and the child nodes are provided by the artificial probable field approach. The combination of two earlier datasets allows the algorithm to converge more quickly and produce a better result. The experiment looked more closely at how past information affects RL route planning. Tests showed that the algorithm’s convergence speed may be accelerated by the presentation data and that the convergence outcome is more in line with the presentation data. These findings imply that the proposed approach has a bright future in customized route training. The robot is limited, though, by the interactive options it must navigate.
The SARSA-based reward-extended attack graph algorithm was initially applied in our previous work [13] to identify the attacker’s best course of action in a smart grid application. The availability of an attack graph created with knowledge of the resources, system design, connections, vulnerabilities, and potential threats is a determining factor. Furthermore, the reward values were established by utilizing the overall ratings of these attacks on the CVSS. The SARSA agent was selected with a higher cumulative reward since our objective was to choose the assault path that does the most damage to the system, not the shortest path, regardless of the cumulative reward, as demonstrated by the Q-learning technique. The same methodology is used in this work, but it is for a different application, that is, for an ICS, which necessitates the availability of a new attack graph and new CVSS overall ratings. These findings can help with ICS security analysis by identifying the most susceptible parts and suggesting where to deploy resources to ensure complete coverage. The main contributions of this paper are as follows:
- Applying SARSA-based optimal pathfinding on the attack graph of the ICS and using the CVSS scoring system to determine the worst-case attack in the graph.
- Identifying the weakest component in the ICS and determining the best place to deploy security measures like intrusion prevention (IP) and intrusion detection (ID).
2. Preliminaries
2.1. Industrial Automation System Topology
The case study, which will center on the SCADA system (as mentioned in our earlier work [4]), is covered in this part.
Figure 1 presents an ICS.
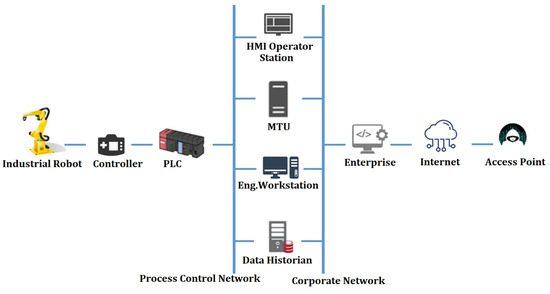
Figure 1.
Industrial automation system.
This system can be illustrated by the following hierarchy:
- Physical Level (P)
This tier comprises a Programmable Logic Controller (PLC) and a controller that connects precisely to the industrial robot. This level’s components also handle logical operations and data transmission to the Supervisory level.
- PLC: PLCs are used to replace Remote Terminal Units (RTUs) in industrial systems. In general, PLCs are solid-state devices meant to replace hard-wired relay panels. PLCs are favored because they are economical and time efficient. A PLC is generally made up of a processor (CPU), memory, input/output interfaces, a power supply, a communication interface, and a programming interface. The programming interface transfers programs to the PLC, whereas the communication device communicates via the network (including with other PLCs and a Master Terminal Unit (MTU)) [14].
- Controller (MC): The robot’s operations are controlled by a control system implemented by a controller, ensuring the safety and security of vital components. It forms the logic and services required for monitoring, communication with the environment, and controlling the mechanical portions of the robot [15].
- Industrial Robots (IR): Industrial robots are mechanical, multi-axis “arms” that are commonly employed for automation, particularly in the industrial industry. All robots are complex automated manipulators that interact extensively with the physical environment. As a result, they are cyber-physical systems (CPSs), which include a variety of hardware and software components such as mechanics, controllers, human-interaction devices, firmware, operating systems, actuators, control logic, and sensors. Furthermore, the greater integration of digital monitoring of physical manufacturing activities connects robots both inside and with external services [16].
- SCADA Level (S)
The central system responsible for receiving and processing digital data at the physical level is the SCADA system. At this level, there are the following components:
- Human–Machine Interface (HMI): this is the component of the SCADA system that oversees tracking the system’s condition, adjusting control parameters, and allowing the operator to see reports and historical data in addition to real-time monitoring [17].
- Data Historian (DH): a database containing network-related information (for example, device IP addresses, hardware model, firmware, and historical measurements) [18].
- Engineering professionals utilize the Engineering Workstation (EW) to diagnose and alter control network connections and logic. It also includes tools for downloading new code to controllers [19].
- SCADA’s MTU monitors and manages system communication, acquiring data from RTUs to offer current status information [19].
- Corporate Level (C)
This tier comprises an Enterprise Site Management computer (E) that collects information and transmits outcomes to decision-makers. while a Wireless Access point (AP) is utilized for external internet connectivity. Network backbones:
- Process Control Network (PB): it connects S with P.
- Corporate Network (CB): it connects C with S.
2.2. SCADA Communication Systems/Infrastructures
A transmission channel facilitates communication between nodes in the SCADA network system. For example, cable connections are utilized for smaller distribution areas since they are insufficient to cover a vast region. As a result, LANs/WANs are used to connect SCADA nodes that are separated by a wide distance. Furthermore, telemetry systems like radio signals, satellites, and microwaves have been employed for SCADA communication [20].
Communication designs between MTU and RTU might be point-to-point, which needs a separate channel for each connection. This feature simplifies and reduces complexity, but it is also more costly. Conversely, multi-drop or series connections are built on the principle of channel sharing, with channels linked in series. Channel sharing minimizes the count of channels used while simultaneously affecting the system’s efficiency and complexity [21].
2.3. Attack Graph
Attack graphs can be used to link many vulnerabilities to create an incursion. A flaw in a system that can be exploited by an assaulter to launch a triumphant assault is called a vulnerability. These serve as prerequisites for a few of the attacks. They may result from defects, functionalities, or human mistakes. To accomplish their objective, attackers will try to exploit any of them, usually combining one or more of them [22]. An attack graph describes a breach of defects among connected hosts as a shift in the system state, which is represented by scenarios pertaining to the system’s security [23].
This research will analyze the ICS attack graph that is presented in Figure 2. We generated this graph in our previous work [4]. This paper intends to emphasize the need for the ICS’s cyber security while also delving further into the attack graph.
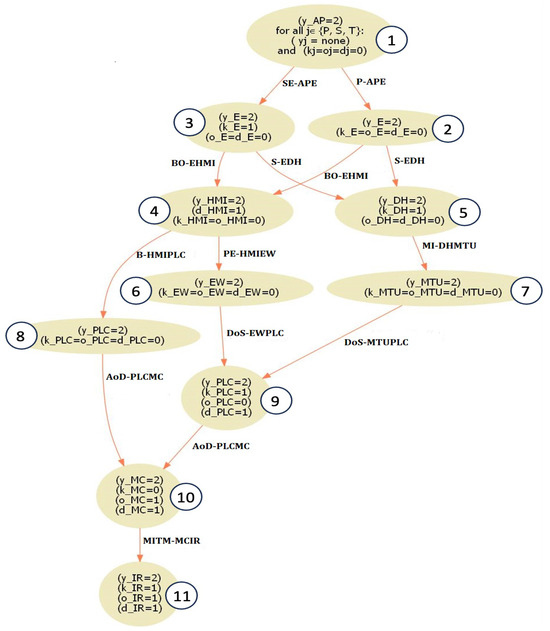
Figure 2.
ICS attack graph.
In the ICS, numerous weaknesses were discovered, including the following:
- Firmware vulnerability: Faked firmware upgrades are frequently seen on PLCs. For example, reverse engineering techniques can be utilized to investigate the PLC vulnerability before concluding the firmware update validation procedure. The firmware update validation process is then examined for weaknesses that might lead to firmware counterfeiting and refinement. After that, the flaws are used to create a forged firmware sample, which is uploaded and used by a PLC [24].
- Commercial-off-the-shelf (COTS) vulnerability: Organizations all over the world, in every sector and market, are developing networks based on Internet protocols. Furthermore, third-party commercial and open-source software is an important component for these enterprises and the utilities, network infrastructure, and services on which they rely. This means that software issues in COTS software products may quickly generate significant problems for any business [25].
An example of a CPS is the ICS. The ICS’s vulnerabilities may be used to carry out cyberattacks, such as the following:
- Social Engineering (SE): This is the term for attacks that mostly target businesses and organizations. The target of these assaults is to get sensitive information by mentally coercing or misleading a person [26].
- Malware Injection (MI): This technique, which may be quite effective, involves tricking the victim into installing or clicking a link to download a file that appears secure but contains a hidden malware installation. The attacker can take control of the machine and use it to sniff data, or they can take full use of every computer connected to the victim’s network [27].
- Pivoting: The attack normally consists of two parts, phishing and malware insertion. Because the corporate network has the most exposure to the Internet, this attack is typically utilized against it. An attacker can gain further access to the system and even the process control domain by breaching this network [28].
- Sniffing (S): In terms of network security, sniffing is the act of stealing or severing data by using a sniffer to record network traffic. For instance, using (Base64 encoding), the attacker sniffs the data surrounding the Historian to get login credentials. By extracting them, the attacker can use specially constructed packets to improve the assaults and create a backdoor on the Historian [29].
- Buffer Overflow (BO): This form of attack makes use of a defect known as a “buffer overflow”, in which software overwrites memory adjacent to a buffer that has not been altered—either purposefully or accidentally. Buffer overflows are typically associated with C-based programming languages that lack bounds checking. As a result, actions like transferring a sequence from one buffer to another may cause extra data to be erased in the memory that borders the new, shorter buffer [30]. This exploit uses a heap buffer overflow to fuzz and destroy the SCADA HMI. Since the operation must be manually repeated to return the system to normal, the SCADA system is greatly impacted by the attack [31].
- Privilege Escalation (PE): This attack uses bugs in programming or design to grant the attacker further access to the network, the data connected to it, and the programs that run on it [32].
- Authentication Bypass (B): A bypass is a security system vulnerability that enables an attacker to go around security measures and gain access to a system or network. The actual point of entry is via a software, hardware device, or even just a small bit of code that grants access to the system to the user despite security clearance processes (like authentication). An attacker-placed technique, a design fault, or a developer-placed alternate access method might all be considered bypasses [33].
- Alteration of Data (AoD): If attackers have access to software, they can carry out this attack. It attacks the memory of the device in an attempt to cause data corruption (such as changing the set point) and slowness in data processing [34].
- Man in the Middle (MITM): A hacker compromises, stymies, or impersonates two systems’ communications. An industrial robot may be blown out of its designated lane and speed restriction by an attacker taking control of a smart actuator, which might harm a meeting place or hurt operators [35].
- Denial of Service (DoS): The purpose of a DoS attack is to either prevent resources from being utilized as intended or to prohibit system access. Since the PLC is the primary hardware component that directly controls the operation, it may be extremely harmful to profit from this part. For example, since the EWs are the primary location where PLC logic is stored, the attacker can utilize them as an entry point to launch a denial-of-service assault [36].
The attack graph demonstrated in Figure 2 simulates all possible paths an attacker may pursue to breach the system and interfere with IR functioning. Six distinct attack sequences that can be used by the attacker to breach the system are displayed in the attack graph, assuming that the attacker at the beginning only has access to AP and his/her intention is to disrupt the system by either altering the data entering IR or causing a delay from IR. Furthermore, each node shows the results of executing each attack as captured by the dynamic Boolean variables whose values change under attacks. These variables are as follows: gaining access to IR (yIR = 1); causing communication delay from IR (dIR = 1); the manipulation of data sent to target IR (oIR = 1); and information disclosure about IR (kIR = 1) [4]. Of course, the ultimate goal can be changed based on the attacker’s intention, and thus the attack graph termination node will also vary. Each arrow shows the name of the attack, the system from which the attacker is executing the attack, and the system against which the attacker is executing the attack. For example, SE_APE indicates that the attack is SE and the attacker used the system AP to attack system E. The attack graph will be extended including more details (incentives) to mimic the environment for the state–action–reward–state–action.
This is an explanation of a sequence that is shown in the graph as an example. The attacker starts with root access to the access point (AP) and launches a social engineering (SE) attack (SE_APE) to obtain access to the enterprise computer (E) and learn more about the system and its parts. To obtain root access to the Human–Machine Interface (HMI), a Buffer Overflow (BO) assault against HMI (BO_EHMI) is initiated, using the information that has been made accessible and the enterprise’s access. An Authentication Bypass (B_HMIPLC) attack is initiated using the information that was made public, taking advantage of a PLC firmware or COTS vulnerability. An Alteration of Data (AoD_PLCMC) attack is carried out in this case to obtain root access to the controller (MC). The industrial robot (IR) then experiences data corruption as a result of a Man-in-the-Middle (MITM_MCIR) attack (i.e., changing the IR set point). Furthermore, this results in IR performance delays.
2.4. SARSA
In the discipline of machine learning, RL is a wide family of algorithms that attempt to enable an agent to learn how to behave in a setting where the sole form of feedback is a scalar reward signal. RL should be seen as a learning method or paradigm rather than a learning problem. The agent’s objective is to conduct actions that will ultimately maximize the reward signal [37].
The MDP constituted the foundation for the AI technique known as SARSA [38]. In this study, we used SARSA in the reward-extended attack graph to find the attacker’s optimum path. Rummery and Niranjan [38] first published the “Modified Connectionist Q-Learning MCQL” approach, which is today recognized as one of the reputable algorithms in the RL area of ML.
The MDP framework supports online solutions that progressively learn optimum policies through simulated trials, as well as approximated solutions in terms of resources like computing time. Finally, the model enables numerical, decision-theoretic evaluations of policy quality and learning performance [39]. MDP consists of parameters and state space functions, sets of actions, a state transition probability function, and a reward function [40].
The set containing all states is known as the state space. A state is composed of all the data required to calculate decisions, rewards, and transitions. Among the principal ideas of MDPs is that decisions ought to be determined only by the system’s present state; previous states should not be taken into account [37].
It is possible that the distinction between the environment and the agent is not always the most obvious one. Everything outside of the agent’s control is seen as a component of the environment [37].
RL utilizes the MDP model for agent–environment interaction, as shown in Figure 3. MDPs define state spaces, representing all possible states that the agent can encounter, which is crucial for decision-making. They capture transitions between states based on selected actions and corresponding rewards. Discount factors modulate future rewards’ influence on current decisions. SARSA employs temporal difference learning to update action–value estimates, balancing exploration and exploitation to maximize rewards. This iterative learning approach enables agents to adapt behaviors for long-term objectives [41].
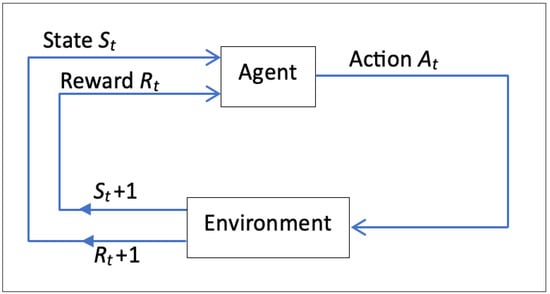
Figure 3.
MDP schematic of the agent–environment interaction.
In this paper, the SARSA algorithm operates within the confines of a discrete, finite MDP, serving as a framework to simulate the attacker’s decision-making process within an attack graph. This MDP framework encompasses a well-defined state space, comprising nodes representing various states of the attack scenario, along with a set of permissible actions that dictate transitions between these states. Each transition yields an immediate reward, encapsulated in a reward matrix, guiding the agent’s behavior toward maximizing cumulative rewards over successive interactions. Furthermore, the inclusion of a discount factor in the algorithm accounts for the varying significance of future rewards, thus balancing the agent’s exploration of new actions with the exploitation of learned behaviors. This amalgamation of SARSA within the MDP paradigm facilitates dynamic learning and adaptation, crucial for navigating the intricate pathways of the attack graph towards the attacker’s ultimate objective state, while simultaneously considering the short-term gains and long-term consequences of each decision made.
Afterward, Sutton [42] suggested the current SARSA designation. SARSA and Q-learning, two well-known reinforcement learning algorithms based on temporal difference (TD) learning, are highly capable of creating a learning process that ultimately leads to future decision-making processes.
The agent may only choose which behavior to follow by considering its current state and the influence of a positive or negative reward signal generated utilizing the learning process. A discount factor is also suggested about the learning approach’s design aims. As the factor becomes closer to unity, the effect of the future reward on the current state will grow conversely. Reward signals consequently operate as feedback to illustrate if an activity either goes well or poorly in the learning process [43].
The agent’s current state is the primary basis for updating the Q-value, according to SARSA. The agent selects action , and the reward signal guides it in selecting the right course of action; after carrying out that specific action, the agent accesses state , and finally, in its recent state, it selects action . The state–value function and the epsilon-greedy approach are used by the agent in SARSA to carry out exploration and exploitation. The next phase uses the weights of the computed Q-values to evaluate the states and calculate their corresponding strength [44]:
where
- is the agent’s actions set, ;
- is the agent’s state set, ;
- is the Q-value for ;
- is the reward signal;
- is the control policy in the learning process;
- γ is the discount factor;
- is a time step.
Equation (1) underscores the link among state and value while Equation (2) focuses on the correlation among action and value. The degree to which the two functions diverge depends on whether or not the agent’s current action is known. The optimal action to take at every moment step is therefore usually found using the action–value function. Consequently, a better Bellman version of Equation (2) would be as follows:
where:
- is the probability that an agent will update among any two consecutive states after conducting a specific behavior;
- is the adjusted state;
- is the adjusted action.
The greedy policy in SARSA limits the agent’s actions both now and in the future, making them all on-policy. Conversely, Q-learning relies on off-policy as the agent’s next move is not dictated by the online policy, which forbids greedy policy. The SARSA uses the following equation to update the Q-values:
where:
- is the learning rate;
- is the reward gained on leaving state by performing an action ;
- is the Q-value for .
2.5. Common Vulnerability Scoring System (CVSS)
Information on IT vulnerabilities is disseminated using an open platform known as CVSS. Using this uniform nomenclature will be beneficial for IT administrators, researchers, security organizations, application developers, vulnerability assessment companies, and vulnerability bulletin providers [45].
The CVSS measure is divided into its basic, temporal, and environmental subcategories. The base metric category represents the inherent characteristics of a weakness that persist over time and across different user scenarios. Metrics that assess impact and exploitability are the two distinct areas that it comprises.
The exploitability criteria consider both the technological ways and the ease with which a weakness may be abused. Put differently, they embody characteristics of the sensitive entity, sometimes referred to as the vulnerable element. What the impact measurements refer to as the immediate result of an effective attack is the impacted component, also appropriately called the object that is affected [46].
The temporal metric class highlights the aspects of a flaw that changes with time but not with different user scenarios. For example, the inclusion of a basic exploit kit would raise the CVSS score; nevertheless, the development of an official solution would lower the CVSS score [47].
The environmental metric group represents the susceptibility qualities unique to a certain user’s environment. The relative importance of a system within an IT infrastructure, the existence of defenses that may mitigate part or all of the consequences of an effective attack, and other related factors are all crucial [48].
The CVSS scores for each assault on the ICS were ascertained using an online CVSS calculator [49], as provided in Table 1. As an illustration, the following inputs were put into the calculator for the AoD attack on subsystem MC (AoD-PLCMC) by the host PLC:

Table 1.
Attack CVSS scores.
- Attack Vector: Network;
- Attack Complexity: High;
- Privileges Required: High;
- User Interaction: None;
- Scope: Changed;
- Confidentiality Impact: High;
- Integrity Impact: High;
- Availability Impact: High;
- Exploit Code Maturity: Unproven that exploit exists;
- Remediation Level: Unavailable;
- Report Confidence: Unknown;
- Modified Attack Vector (MAV): Network;
- Modified Attack Complexity (MAC): High;
- Modified Privileges Required (MPR): High;
- Modified User Interaction (MUI): None;
- Modified Scope (MS): Changed;
- Modified Confidentiality (MC): High;
- Modified Integrity (MI): High;
- Modified Availability (MA): High;
These inputs resulted in an overall score of 6.8.
3. Methodology
The procedure for the SARSA-based reward-extended attack graph is described in this section. As seen in Figure 4, the attack graph from Figure 2 is extended, including more details. It displays the motions that the attacker may performs from each node with enhanced incentives. The attacker is meant to start at node number 1 and can move freely via the nodes in any sequence until he/she reaches node number 11, which stands for the objective state.
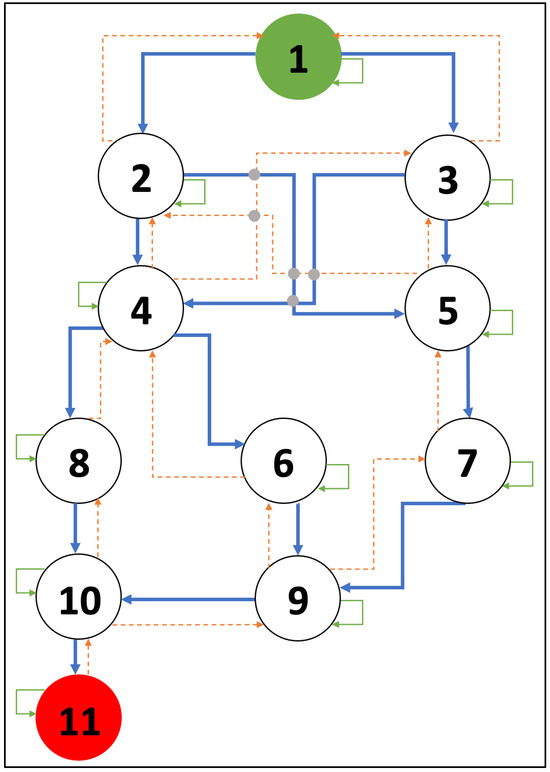
Figure 4.
Reward-extended attack graph.
In addition, the CVSS overall scores from Table 1 are used to calculate the award values. The attacker will reach the target state and will remain there indefinitely. The blue lines represent the forward path, and their value changes based on the assault and its CVSS score. Any movement that is reversed—shown by the orange lines—will not earn the agent any reward. The reward will be −1 regardless of whether the agent remains in the same state or moves to a new node that is unlinked to the node it is now in, as indicated by the green lines.
Table 2 displays the possible rewards the agent could obtain from moving between the eleven nodes. For example, if the attacker went from node 5 to node 7, the reward would be 4.2.
Table 2.
Reward matrix.
Using a reward-extended attack graph based on SARSA, Algorithm 1 determines the attacker’s anticipated best path. As input, the initial state 1 is given. Nevertheless, node 11 is thought to be the final state. The output is the recommended route from the root to the objective nodes. Equation (4) is utilized to use SARSA to calculate and adjust the Q-value in the proposed route recommendation technique.
In states, the decision on what to do next is made using the epsilon-greedy method. A random number (0 or 1) is generated for each state, and it is then compared to the epsilon value. If the obtained random number is bigger than epsilon, this function chooses the action with the minimal possible number for the stated user preference; if not, it adopts a greedy strategy to look into every alternative action that might be taken for the specified circumstance. The path is predicted using the greatest action value for the state in mind. It is repeated until one of the last nodes is reached.
| Algorithm 1: Predict the optimal route. |
| Input: Initial state; Output: Optimal route;
|
The practical application of the SARSA algorithm within the reward-extended attack graph framework involves identifying the attacker’s optimal path. SARSA plays a pivotal role in guiding the decision-making process of the attacker as he/she navigates through the attack graph towards his/her objective state.
SARSA serves as the cornerstone of our approach, enabling the attacker to iteratively learn and adapt his/her strategy based on the observed rewards and state transitions within the attack graph. Within this framework, SARSA functions as the driving force behind the attacker’s decision-making process, guiding him/her toward maximizing cumulative rewards while considering the short-term gains and long-term consequences of each action.
At each node of the attack graph, SARSA facilitates the decision-making process by selecting actions that lead to the highest expected cumulative reward. By leveraging the current state and the expected future rewards associated with each available action, SARSA enables the attacker to dynamically adjust his/her strategy in response to changes in the environment.
The application of SARSA for attack path identification entails several key steps. Initially, the Q-values for state–action pairs are initialized to establish a foundation for learning. Subsequently, the attacker selects actions using an epsilon-greedy approach, balancing the exploration of new actions with the exploitation of learned behaviors. As the attacker traverses the attack graph, SARSA updates the Q-values based on observed rewards, gradually refining the attacker’s strategy toward optimal performance. This iterative process continues until convergence is achieved, and the attacker identifies the optimal path toward his/her objective state.
4. Results and Discussion
Based on the RL framework, the suggested method may be thought of as continuous interactions between two key aspects of the problem: the agent and the environment. The attacker (agent) determines the direction of motion (action) in the environment (attack graph), and as a result of the attacker’s action, the environment (based on its attributes) offers a new state and reward. At each time step, the agent obtains the current state from the environment and, based on that state, selects the required action on the direction of the move to identify the target.
We used our Python-based SARSA technique to obtain the worst-case attack scenario that an adversary may execute on the ICS. About one hour and thirteen minutes is the average execution time of the used technique on a computer processor with the following characteristics: 2.3 GHz 8-CoreIntelCorei9; memory: 16 GB; 2667 MHz DDRF4; executing macOS Big Sur.
Determining the attacker’s/agent’s optimal path is a reflection of the agent’s training growth, as seen in Figure 5. The y-axis displays the cumulative reward for each episode, while the x-axis displays the total number of episodes. A total of 43 episodes were needed for the scheme to converge. The average reward after each episode is presented by the red line, which shows how the agent training has evolved. The cumulative reward for every episode is presented by the blue line. The graph identifies that as the episodes increase, the average reward increases, which implies that the agent’s training is getting better.
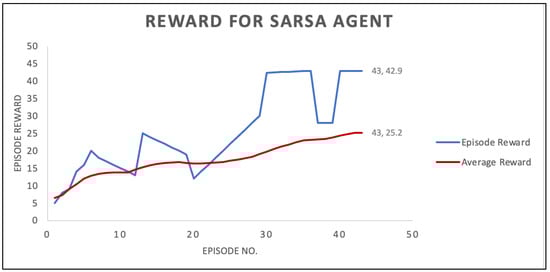
Figure 5.
Results of SARSA agent.
When the agent finds out how to maneuver around the attack graph in a way that maximizes damage to the system, the RL model stops learning. This occurs when the agent accomplishes its objectives in the environment and routinely obtains the same high rewards.
After 43 iterations, the worst assault scheme, with a total reward of 42.9, includes the nodes 1 → 2 → 4 → 6 → 9 → 10 → 11. Furthermore, it is evident that the attacker started at AP and moved to node 2, indicating that the P-APE attack was carried out. The reward at this stage was 3.4. The attacker moved to node 4 after making an action or attack from node 2, which was BO-EHMI, for a cumulative reward of 10.4. Subsequently, a PE-HMEW attack was carried out to force the attacker to relocate from node 4 to node 6, resulting in a total reward of 17.4. The attacker then proceeded to node 9 and carried out a DoS-EWPLC attack, for which he/she received a CVSS value of 8.7, making the attack’s cumulative reward 26.1. The attacker then executed an AoD-PLCMC attack, which has a CVSS of 6.8 and a cumulative reward of 32.9, moving from node 9 to node 10. The last step that the attacker took to compromise the system was to launch the MITM-MCIR attack from node 10 to node 11, which had a CVSS of 10 and a cumulative reward of 42.9.
E, HMI, EW, PLC, MC, and IR are the subsystems that may be determined as having the most serious damage utilizing this information. When the agent was unclear about the appropriate activity during training, the cumulative reward was low at first. However, when the correct course of action was determined, the cumulative reward grew throughout the episodes. The agent’s training was complete when the reward did not change. That took 43 iterations.
Host-based defenses can be strengthened using network intrusion prevention (IP) and intrusion detection (ID) techniques to protect the system’s weak points against attacks from both the inside and outside [50]. Also, the PLC is the essential component that is operating the industrial robot. Therefore, it must be protected. This may be accomplished by using stronger passwords and usernames that are difficult to figure out.
The availability of the system topology is necessary for the creation of the attack graphs. It frequently takes a single interpreting work to acquire each component’s system description, interactions, solutions, and weaknesses.
There is a linear connection between dynamic state variables and pre- and post-factors for asynchronous attacks. The computation’s complexity is also influenced by the model’s size and the property’s length. Polynomial impacts on performance are known to exist for both system size and the length of security features.
Moreover, the RL approach adapts its understanding of the attack graph and vulnerabilities, continuously refining its strategies to optimize its attack path. It remains flexible, adjusting to environmental changes or new data, ensuring effectiveness against evolving security threats or system modifications. Thus, the model retains its adaptability over time, maintaining relevance and efficacy in real-world scenarios, even beyond initial training. It could be challenging to follow the agents’ rationale and reasoning for their decisions and behaviors, yet by guaranteeing that the model functions precisely and efficiently with straightforward CVSS rewards, it establishes a strong basis for future advancement.
In RL, the trade-off between exploration and exploitation has a substantial effect on learning rate. This trade-off is especially significant when taking observations which might be expensive and restrict the learning agent’s ability to operate [51]. Our approach incorporates techniques like epsilon-greedy exploration to effectively manage this trade-off to enhance learning efficiency and agent performance. Additionally, it is essential to guide the agent toward desired actions by using the CVSS score as the reward structure.
Our method gives RL agents the freedom to continually interact with the environment, which is represented by the attack graph that captures the evolution of system parameters under attacks, in order to explore and find novel techniques. RL agents learn by making mistakes, as opposed to rule-based approaches that follow preset rules. This allows them to discover new strategies that might not be apparent at first.
RL is well known for its ability to adapt to the dynamic, unpredictable, and complex nature of cybersecurity environments, and it is a good fit for threat analysis and mitigation in ICS.
Based on [10], tabular RL algorithms struggle to scale effectively in large networks with many machines due to the vast state space, while DQN encounters challenges as the number of actions increases. Additionally, POMDPs, which involve partial observability, can be computationally demanding. Consequently, we opted for SARSA for optimal pathfinding, as it offers a more scalable and computationally efficient solution in such scenarios.
Since SARSA operates on-policy, it immediately takes into account the current policy while choosing actions and updating Q-values, which frequently leads to a more circumspect examination of the state space. Under the existing protocol, SARSA allows the agent to learn from its actions. However, due to its exploration–exploitation trade-off, Q-learning, an off-policy algorithm, may be more likely to choose suboptimal actions. On the other hand, it can accelerate convergence to an optimal policy by updating Q-values based on the maximum Q-value of the next state, regardless of the action taken. Because of this, SARSA tends to learn safer policies even if it is more conservative and takes longer to converge than Q-learning, which may converge more quickly but may ignore safer options in favor of instant rewards [52].
In pathfinding, the SARSA algorithm, SARSA with MDP, and SARSA with epsilon-greedy are used for determining optimal paths. While SARSA with MDP models the environment by using the MDP framework, SARSA with epsilon-greedy strikes a balance between exploration and exploitation, and SARSA directly predicts Q-values for state–action pairings. The benefits of both MDP and epsilon-greedy techniques are combined in the SARSA MDP with epsilon-greedy strategy. It offers a formal depiction of the decision-making process by utilizing the MDP framework, which makes it easier to comprehend and optimize the environment. Meanwhile, the epsilon-greedy approach guarantees efficient state–action space exploration, resulting in better learning and convergence to ideal policies.
5. Conclusions
In this work, a unique technique is suggested, built on the attack graph’s SARSA RL application, that represents the collection of likely scenarios for an assault executed in opposition to the structure. The agent successfully identified the optimal path that may inflict the system the greatest harm. Our research indicated the subsystems that were most vulnerable to attackers. These findings can help with the formulation of the optimal action selection criteria for addressing vulnerabilities.
Future upgrades to this technique might involve the installation of a supporter, who would adopt suitable preventative action following a limited awareness of the system’s condition, that could be enabled by the installation of panels. Furthermore, larger attack graphs provide a more powerful illustration of the method. In addition, alternate techniques, such as deep RL and double RL, can be applied and compared to the RL approach employed in this investigation. Additionally, techniques such as attention mechanisms and human-in-the-loop approaches could be implemented to enhance the interpretability and explainability of our model.
Author Contributions
Conceptualization, M.I. and R.E.; methodology, M.I. and R.E.; software, M.I. and R.E.; validation, M.I. and R.E.; formal analysis, M.I. and R.E.; investigation, M.I. and R.E.; resources, M.I. and R.E.; data curation, M.I. and R.E.; writing—original draft preparation, M.I. and R.E.; writing—review and editing, M.I. and R.E.; visualization, M.I. and R.E.; supervision, M.I.; project administration, M.I.; funding acquisition, M.I. All authors have read and agreed to the published version of the manuscript.
Funding
This research received no external funding.
Data Availability Statement
Data are contained within the article.
Conflicts of Interest
The authors declare no conflicts of interest.
References
- Bhamare, D.; Zolanvari, M.; Erbad, A.; Jain, R.; Khan, K.; Meskin, N. Cybersecurity for industrial control systems: A survey. Comput. Secur. 2020, 89, 101677. [Google Scholar] [CrossRef]
- Eden, P.; Blyth, A.; Jones, K.; Soulsby, H.; Burnap, P.; Cherdantseva, Y.; Stoddart, K. SCADA system forensic analysis within IIoT. In Cybersecurity for Industry 4.0: Analysis for Design and Manufacturing; Springer: Cham, Switzerland, 2017; pp. 73–101. [Google Scholar]
- Umer, M.A.; Junejo, K.N.; Jilani, M.T.; Mathur, A.P. Machine learning for intrusion detection in industrial control systems: Applications, challenges, and recommendations. Int. J. Crit. Infrastruct. Prot. 2022, 38, 100516. [Google Scholar] [CrossRef]
- Ibrahim, M.; Al-Hindawi, Q.; Elhafiz, R.; Alsheikh, A.; Alquq, O. Attack graph implementation and visualization for cyber physical systems. Processes 2019, 8, 12. [Google Scholar] [CrossRef]
- Rigas, E.S.; Ramchurn, S.D.; Bassiliades, N. Managing electric vehicles in the smart grid using artificial intelligence: A survey. IEEE Trans. Intell. Transp. Syst. 2014, 16, 1619–1635. [Google Scholar] [CrossRef]
- Orseau, L.; Armstrong, M. Safely interruptible agents. In Proceedings of the Conference on Uncertainty in Artificial Intelligence, Association for Uncertainty in Artificial Intelligence, Jersey City, NJ, USA, 25–29 June 2016. [Google Scholar]
- Jin, Z.; Ma, M.; Zhang, S.; Hu, Y.; Zhang, Y.; Sun, C. Secure state estimation of cyber-physical system under cyber attacks: Q-learning vs. SARSA. Electronics 2022, 11, 3161. [Google Scholar] [CrossRef]
- Yan, X.; Yan, K.; Rehman, M.U.; Ullah, S. Impersonation attack detection in mobile edge computing by levering sarsa technique in physical layer security. Appl. Sci. 2022, 12, 10225. [Google Scholar] [CrossRef]
- Hu, Z.; Beuran, R.; Tan, Y. Automated penetration testing using deep reinforcement learning. In Proceedings of the IEEE European Symposium on Security and Privacy Workshops (EuroS&PW), Genoa, Italy, 7–11 September 2020; pp. 2–10. [Google Scholar]
- Cengiz, E.; Murat, G.Ö.K. Reinforcement Learning Applications in Cyber Security: A Review. Sak. Univ. J. Sci. 2023, 27, 481–503. [Google Scholar] [CrossRef]
- Mohan, P.; Sharma, L.; Narayan, P. Optimal path finding using iterative Sarsa. In Proceedings of the 5th IEEE International Conference on Intelligent Computing and Control Systems (ICICCS), Madurai, India, 6–8 May 2021; pp. 811–817. [Google Scholar]
- Wen, S.; Jiang, Y.; Cui, B.; Gao, K.; Wang, F. A hierarchical path planning approach with Multi-SARSA based on topological map. Sensors 2022, 22, 2367. [Google Scholar] [CrossRef]
- Ibrahim, M.; Elhafiz, R. Security Analysis of Cyber-Physical Systems Using Reinforcement Learning. Sensors 2023, 23, 1634. [Google Scholar] [CrossRef] [PubMed]
- Wang, Z.; Zhang, Y.; Chen, Y.; Liu, H.; Wang, B.; Wang, C. A Survey on Programmable Logic Controller Vulnerabilities, Attacks, Detections, and Forensics. Processes 2023, 11, 918. [Google Scholar] [CrossRef]
- Balduzzi, M.; Sortino, F.; Castello, F.; Pierguidi, L. A Security Analysis of CNC Machines in Industry 4.0. In Detection of Intrusions and Malware, and Vulnerability Assessment; Gruss, D., Maggi, F., Fischer, M., Carminati, M., Eds.; DIMVA. Lecture Notes in Computer Science; Springer: Cham, Switzerland, 2023; Volume 13959, pp. 132–152. [Google Scholar]
- Yankson, B.; Loucks, T.; Sampson, A.; Lojano, C. Robots Security Assessment and Analysis Using Open-Source Tools. In Proceedings of the International Conference on Cyber Warfare and Security, Baltimore County, MD, USA, 9–10 March 2023; Volume 18, pp. 449–456. [Google Scholar]
- Shahzad, A.; Musa, S.; Aborujilah, A.; Irfan, M. The SCADA review: System components, architecture, protocols and future security trends. Am. J. Appl. Sci. 2014, 11, 1418. [Google Scholar] [CrossRef]
- Green, B.; Krotofil, M.; Abbasi, A. On the significance of process comprehension for conducting targeted ICS attacks. In Proceedings of the Workshop on Cyber-Physical Systems Security and PrivaCy, New York, NY, USA, 3 November 2017; pp. 57–67. [Google Scholar]
- Andress, J.; Winterfeld, S. Cyber Warfare: Techniques, Tactics and Tools for Security Practitioners, 2nd ed.; Syngress: Oxford, UK, 2013. [Google Scholar]
- Khelil, A.; Germanus, D.; Suri, N. Protection of SCADA communication channels. In Critical Infrastructure Protection: Information Infrastructure Models, Analysis, and Defense; Lopez, J., Setola, R., Wolthusen, S.D., Eds.; Springer: Berlin/Heidelberg, Germany, 2012; Volume 7130, pp. 177–196. [Google Scholar]
- Abbas, H.A. Future SCADA challenges and the promising solution: The agent-based SCADA. Int. J. Crit. Infrastruct. 2014, 10, 307–333. [Google Scholar] [CrossRef]
- Ammann, P.; Wijesekera, D.; Kaushik, S. Scalable, graph-based network vulnerability analysis. In Proceedings of the 9th ACM Conference on Computer and Communications Security, Washington, DC, USA, 18–22 November 2002; pp. 217–224. [Google Scholar]
- Wang, L.; Islam, T.; Long, T.; Singhal, A.; Jajodia, S. An attack graph-based probabilistic security metric. In Proceedings of the Data and Applications Security XXII: 22nd Annual IFIP WG 11.3 Working Conference on Data and Applications Security, London, UK, 13–16 July 2008; pp. 283–296. [Google Scholar]
- Basnight, Z.; Butts, J.; Lopez, J., Jr.; Dube, T. Firmware modification attacks on programmable logic controllers. Int. J. Crit. Infrastruct. Prot. 2013, 6, 76–84. [Google Scholar] [CrossRef]
- Martin, R.A. Managing vulnerabilities in your commercial-off-the shelf (COTS) systems using an industry standards effort. In Proceedings of the 21st IEEE Digital Avionics Systems Conference, Irvine, CA, USA, 27–31 October 2002; Volume 1, p. 4A1. [Google Scholar]
- Hinson, G. Social engineering techniques, risks, and controls. EDPAC EDP Audit. Control. Secur. Newsl. 2008, 37, 32–46. [Google Scholar] [CrossRef]
- Sood, A.; Enbody, R. Targeted Cyber Attacks: Multi-Staged Attacks Driven by Exploits and Malware, 1st ed.; Syngress: Oxford, UK, 2014. [Google Scholar]
- Zimba, A. A Bayesian attack-network modeling approach to mitigating malware-based banking cyberattacks. Int. J. Comput. Netw. Inf. Secur. 2022, 14, 25–39. [Google Scholar] [CrossRef]
- Verma, P. Wireshark Network Security, 1st ed.; Packt Publishing Ltd.: Birmingham, UK, 2015. [Google Scholar]
- Gupta, S. Buffer overflow attack. IOSR J. Comput. Eng. 2012, 1, 10–23. [Google Scholar] [CrossRef]
- Sayegh, N.; Chehab, A.; Elhajj, I.H.; Kayssi, A. Internal security attacks on SCADA systems. In Proceedings of the Third IEEE International Conference on Communications and Information Technology (ICCIT), Beirut, Lebanon, 19–21 June 2013; pp. 22–27. [Google Scholar]
- Yamauchi, T.; Akao, Y.; Yoshitani, R.; Nakamura, Y.; Hashimoto, M. Additional kernel observer: Privilege escalation attack prevention mechanism focusing on system call privilege changes. Int. J. Inf. Secur. 2021, 20, 461–473. [Google Scholar] [CrossRef]
- Siu, J.Y.; Kumar, N.; Panda, S.K. Command authentication using multiagent system for attacks on the economic dispatch problem. IEEE Trans. Ind. Appl. 2022, 58, 4381–4393. [Google Scholar] [CrossRef]
- Ibrahim, M.; Alsheikh, A.; Al-Hindawi, Q. Automatic attack graph generation for industrial controlled systems. In Recent Developments on Industrial Control Systems Resilience, 1st ed.; Pricop, E., Fattahi, J., Dutta, N., Ibrahim, M., Eds.; Springer: Cham, Switzerland; Berlin/Heidelberger, Germany, 2020; Volume 255, pp. 99–116. [Google Scholar]
- Bin Muzammil, M.; Bilal, M.; Ajmal, S.; Shongwe, S.C.; Ghadi, Y.Y. Unveiling Vulnerabilities of Web Attacks Considering Man in the Middle Attack and Session Hijacking. IEEE Access 2024, 12, 6365–6375. [Google Scholar] [CrossRef]
- Horak, T.; Strelec, P.; Huraj, L.; Tanuska, P.; Vaclavova, A.; Kebisek, M. The vulnerability of the production line using industrial IoT systems under ddos attack. Electronics 2021, 10, 381. [Google Scholar] [CrossRef]
- Van Otterlo, M. Markov Decision Processes: Concepts and Algorithms. Compiled for the SIKS Course on “Learning and Reasoning”. 2009, pp. 1–23. Available online: https://citeseerx.ist.psu.edu/document?repid=rep1&type=pdf&doi=968bab782e52faf0f7957ca0f38b9e9078454afe (accessed on 4 April 2024).
- Rummery, G.A.; Niranjan, M. On-Line Q-Learning Using Connectionist Systems; Department of Engineering, University of Cambridge: Cambridge, UK, 1994; Volume 37, p. 14. [Google Scholar]
- Scheftelowitsch, D. Markov Decision Processes with Uncertain Parameters. Ph.D. Thesis, der Technischen Universität Dortmund an der Fakultät für Informatik, Dortmund, Germany, May 2018. [Google Scholar]
- Sombolestan, S.M.; Rasooli, A.; Khodaygan, S. Optimal path-planning for mobile robots to find a hidden target in an unknown environment based on machine learning. J. Ambient Intell. Humaniz. Comput. 2019, 10, 1841–1850. [Google Scholar] [CrossRef]
- Nguyen, T.T.; Nguyen, N.D.; Nahavandi, S. Deep reinforcement learning for multiagent systems: A review of challenges, solutions, and applications. IEEE Trans. Cybern. 2020, 50, 3826–3839. [Google Scholar] [CrossRef] [PubMed]
- Barto, A.G. Reinforcement learning: Connections, surprises, and challenge. AI Mag. 2019, 40, 3–15. [Google Scholar] [CrossRef]
- Knox, W.B.; Stone, P. Combining manual feedback with subsequent MDP reward signals for reinforcement learning. In Proceedings of the 9th International Conference on Autonomous Agents and Multiagent Systems, Toronto, ON, Canada, 10–14 May 2010; pp. 5–12. [Google Scholar]
- Aljohani, T.M.; Mohammed, O. A Real-Time Energy Consumption Minimization Framework for Electric Vehicles Routing Optimization Based on SARSA Reinforcement Learning. Vehicles 2022, 4, 1176–1194. [Google Scholar] [CrossRef]
- Mell, P.; Scarfone, K.; Romanosky, S. A Complete Guide to the Common Vulnerability Scoring System Version 2.0; FIRST-Forum of Incident Response and Security Teams: Cary, NC, USA, 2007; Volume 1, p. 23. [Google Scholar]
- Singh, U.K.; Joshi, C. Quantitative security risk evaluation using CVSS metrics by estimation of frequency and maturity of exploit. In Proceedings of the World Congress on Engineering and Computer Science, San Francisco, CA, USA, 19–21 October 2016; Volume 1, pp. 19–21. [Google Scholar]
- Mell, P.; Scarfone, K.; Romanosky, S. Common vulnerability scoring system. IEEE Secur. Priv. 2006, 4, 85–89. [Google Scholar] [CrossRef]
- Cheng, Y.; Deng, J.; Li, J.; DeLoach, S.A.; Singhal, A.; Ou, X. Metrics of security. In Cyber Defense and Situational Awareness, 1st ed.; Kott, A., Wang, C., Erbacher, R., Eds.; Springer: Cham, Switzerland; Berlin/Heidelberger, Germany, 2014; Volume 62, pp. 263–295. [Google Scholar]
- National Vulnerability Database. Common Vulnerability Scoring System Calculator. Available online: https://nvd.nist.gov/vuln-metrics/cvss/v3-calculator (accessed on 12 January 2024).
- Aloul, F.; Al-Ali, A.R.; Al-Dalky, R.; Al-Mardini, M.; El-Hajj, W. Smart grid security: Threats, vulnerabilities and solutions. Int. J. Smart Grid Clean Energy 2012, 1, 1–6. [Google Scholar] [CrossRef]
- Chung, J.J.; Lawrance, N.R.; Sukkarieh, S. Learning to soar: Resource-constrained exploration in reinforcement learning. Int. J. Robot. Res. 2015, 34, 158–172. [Google Scholar] [CrossRef]
- Wang, Y.-H.; Li, T.-H.S.; Lin, C.-J. Backward Q-learning: The combination of Sarsa algorithm and Q-learning. Eng. Appl. Artif. Intell. 2013, 26, 2184–2193. [Google Scholar] [CrossRef]
Disclaimer/Publisher’s Note: The statements, opinions and data contained in all publications are solely those of the individual author(s) and contributor(s) and not of MDPI and/or the editor(s). MDPI and/or the editor(s) disclaim responsibility for any injury to people or property resulting from any ideas, methods, instructions or products referred to in the content. |
© 2024 by the authors. Licensee MDPI, Basel, Switzerland. This article is an open access article distributed under the terms and conditions of the Creative Commons Attribution (CC BY) license (https://creativecommons.org/licenses/by/4.0/).