
Research on the Analysis of and Countermeasures for the Eutrophication of Water Bodies: Waihu Reservoir as a Case Study
1
Faculty of Water and Environmental Engineering, Zhejiang University of Water Resources and Electric Power, Hangzhou 310018, China
2
Jiaxing Hydraulic and Hydropower Survey and Design Research Institute Co., Ltd., Jiaxing 314000, China
3
Yunnan Electric Test & Research Institute Group Co., Ltd., Kunming 650200, China
*
Author to whom correspondence should be addressed.
Processes 2024, 12(4), 796; https://doi.org/10.3390/pr12040796
Submission received: 7 March 2024
/
Revised: 8 April 2024
/
Accepted: 12 April 2024
/
Published: 15 April 2024
(This article belongs to the Special Issue Processes of Pollution Control and Resource Utilization)
Abstract
:Water quality deterioration and eutrophication have become a global concern, while reservoir pollution caused by multiple factors has led to frequent algal blooms, posing a serious threat to rural drinking water security and urban water supply. The purpose of this paper is to analyze the current water quality of Waihu Reservoir and use the single index method, the weighted comprehensive scoring method, and the nutrient level index method (TLI) to evaluate eutrophication. On this basis, the pollution sources of the reservoir are comprehensively analyzed and discussed, and effective control strategies are proposed. The evaluation results indicate that the reservoir is of moderate eutrophication type. Therefore, reducing the input of nutrients such as nitrogen and phosphorus in water is the main goal of alleviating exogenous pollution. The combination of engineering intervention and ecological restoration strategies to remove nutrients from the aquatic environment is an effective strategy to manage endogenous pollution. From the point of view of the source of pollution, this study provides an in-depth analysis of exogenous and endogenous pollution, respectively, and the proposed treatment is instructive for the control and routine management of eutrophication in the Waihu Reservoir, as well as for the management of similar problems in different reservoirs.
1. Introduction
The quality of water was once closely linked to the sustainable development of human society. As artificial lakes, reservoirs play a vital role in the safety of downstream water environments and have a major impact on human life and ecosystem stability. However, over the past few decades, numerous reservoirs have faced serious challenges in terms of water quality deterioration and eutrophication due to factors such as agricultural non-point source pollution, improper sewage discharge from urbanization processes, and the inadequate treatment of industrial wastewater [1,2,3,4]. This not only results in the degradation of water quality [5] but also triggers algal blooms, thus affecting the multiple functions of reservoirs.
Since the 1960s, the ecological health of numerous lakes and reservoirs worldwide has been impacted by eutrophication [6,7,8]. The causes of eutrophication are multifaceted and include both natural and anthropogenic factors. The enrichment of nutrients, particularly phosphorus and nitrogen, in aquatic ecosystems has been identified as the primary driver of eutrophication [9,10,11,12,13]. Changes in temperature and precipitation patterns due to climate change have the potential to alter hydrological conditions within watersheds, thereby affecting the timing and extent of nutrient releases. Increased nutrient inputs due to the synergistic effects of climate change and anthropogenic activities can create favorable conditions for the proliferation of harmful algal blooms (HABs) and the growth of toxic algae, posing significant risks to human and animal health. With the intensification of human activity, anthropogenic factors have become the primary driver of reservoir eutrophication.
Research on reservoir water quality analysis and eutrophication issues, both domestically and internationally, has a history of several decades and involves various disciplines, including environmental science, ecology, hydrology, and remote sensing [14]. The content ranges from fundamental theoretical exploration to applied technological development and encompasses surveillance methods and control strategies. To effectively address reservoir eutrophication, accurate water quality analysis is essential for the timely detection of problems and implementation of measures. Currently, water quality analysis techniques include conventional physical, chemical, and biological methods, as well as modern techniques such as remote sensing and biomolecular markers [15,16,17,18,19,20]. These methods can help us better understand the nutrient status and pollution levels of water bodies. Internationally, the real-time monitoring of water quality parameters, including dissolved oxygen (DO), pH, turbidity (TD), nitrogen, and phosphorus content, is extensively conducted using advanced sensor technology and automatic monitoring devices [21,22,23,24]. Meanwhile, China has attached great importance to the construction of water quality monitoring networks and the establishment of standards [25,26], gradually improving the accuracy and timeliness of monitoring data. In addition, water eutrophication has been intensively studied internationally, and the inputs of nutrients such as nitrogen and phosphorus have been identified as major contributors to eutrophication. Researchers have explored biogeochemical cycling processes and factors influencing eutrophication through laboratory simulations and field studies. Globally, a series of indicators and models have been established to assess the degree of water eutrophication, such as the Trophic State Index (TSI) and algal biomass assessment. These methods can be used to assess the health status of water bodies and serve as a basis for the formulation of management measures. The Trophic State Index (TSI), originally proposed by [27], classifies the nutritional status of water bodies based on the relationship between Chla and other water quality parameters, including total phosphorus and transparency. Subsequently, ref. [28] refined TSI by incorporating total nitrogen into the equation, resulting in the development of the Trophic Level Index (TLI). TLI serves as a valuable tool for assessing the nutritional status and nutrient-loading conditions of water bodies [29]. Moreover, TLI is an indicator of water body productivity, which is influenced by the presence of nutrients such as nitrogen and phosphorus [30].
According to the existing research, abundant achievements have been made in eutrophication evaluation methods and treatment [31,32,33], but treatment counter-measures are relatively general, and there are few studies on the analysis and implementation of targeted control from the perspective of pollution source categories [34,35]. Therefore, this paper mainly analyzes the existing water quality of Waihu Reservoir and uses the single index method, the weighted comprehensive scoring method, and the nutrient level index (TLI) to evaluate the eutrophication and determine the nutritional status of the reservoir. On this basis, from the perspective of reservoir pollution sources (external pollution sources and internal pollution sources), the targeted eutrophication control strategy is proposed, which has certain practicability and provides certain reference guidance for improving the reservoir management level.
2. Materials and Methods
2.1. Study Area
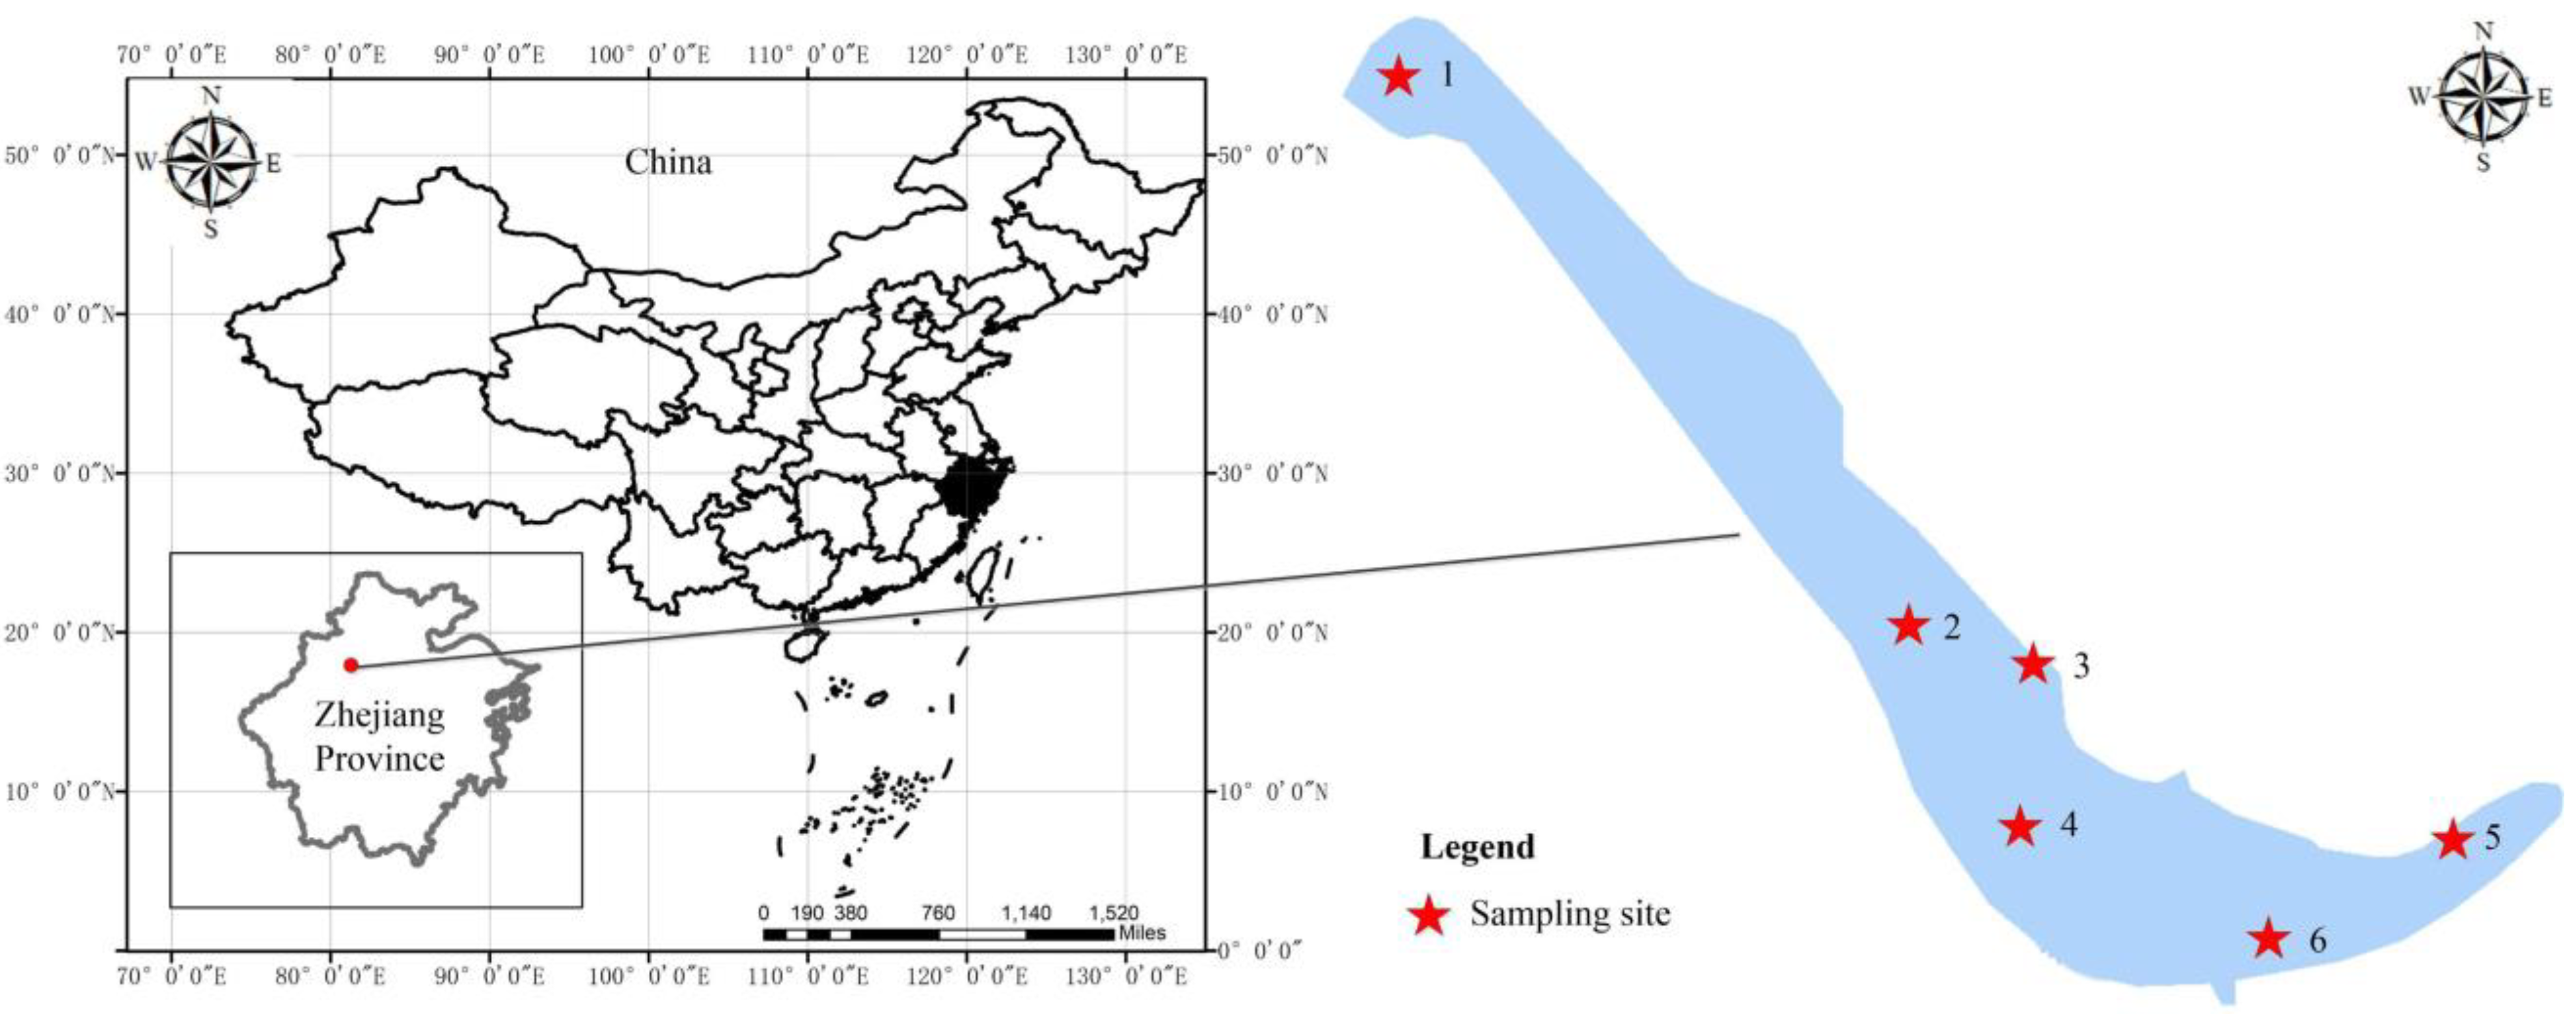
Waihu Reservoir is situated in Pujiang County, Jinhua City, Zhejiang Province, China (29°27′52″ N, 119°58′55″ E). It is located downstream of the Dongling Creek, a tributary of the Huyuan River, and has a catchment area of 20.67 km2 and a major stream length of 8 km. The geological composition of the dam site is Jurassic Huangjian Foraminiferan rhyolite. The topography of the valley is asymmetric, with the left bank at a lower elevation and the right bank more open, forming a stepped shape. The reservoir project was designed for a 50-year flood event, with validation against a 500-year flood event. The total capacity of the reservoir is 6.55 million m3. It serves as a key water storage and diversion project in the Western–Eastern Water Diversion Project, providing water for irrigation in four townships and twenty administrative villages along the Huyuan River, totaling approximately 10,500 acres. It is also an essential regulatory reservoir for the Waihu and seven additional cascade hydroelectric plants with a total installed capacity of 5310 KW. The Waihu Reservoir is a modest-scale reservoir that brings significant benefits in irrigation, flood control, power generation, fish culture, and water regulation.
The construction of the dam began in August 1977, and when the arched dam reached a height of 13 m, experts from the provincial water resources department and the Jinhua Regional Water Resources Bureau proposed modifications to the dam type. In November 1981, with the approval of the Provincial Water Resources Department, it was changed to a hyperbolic arch dam based on an elevation of 331.1 m (corresponding to a height of 13 m for the arch dam), reducing the thickness of the arch dam from 8.5 m to 6.29 m. In October 1987, the entire project was completed, except for the energy dissipation pond. The main dam is a hyperbolic masonry stone arch dam with a height of 40 m, a crest elevation of 358.16 m, a crest width of 3 m, and a wave wall height of 1.3 m. The auxiliary dam is a gravity dam constructed of masonry, measuring 10 m in height with a crest width of 3 m and a wave wall height of 1.3 m.
2.2. Monitoring Layout, Detection Items, and Analysis Methods
To cover the spatiotemporal variability of water quality parameters in the reservoir and considering the actual conditions of the reservoir, six water sampling monitoring points were determined as shown in Figure 1: Northwest junction (ST1), Dam center 1 (ST2), Northeast junction 1 (ST3), Dam center 2 (ST4), Northeast junction 2 (ST5), and Behind the Dam (ST6). At each monitoring point, three vertical monitoring points were set up along the left, middle, and right planes, with two sampling points established on each vertical line (Figure 1).
Water samples were collected from six stations (ST1~ST6) within the Waihu Reservoir. The sampling period was October 2013. Surface water samples were taken at a depth of 0.5 m below the surface, while deep water samples were taken from 0.5 m above the sediment layer. Each sample of water was taken twice. The detection parameters were determined based on the 24 indicators required for lakes (reservoirs) as specified by SEPA 2002 [36].
The determination of parameters followed the requirements of the Surface Water Environmental Quality Standard (GB3838_2002) [36] for lakes (reservoirs). The in situ measurements of depth were conducted using a depth gauge (SM-5A, Speedtech) and the depth and SD were measured using a 30 cm Secchi disk [37]. Chlorophyll-a (Chla) was filtered using a glass microfiber filter (GF/C Whatman, Kent, England) during its determination.
Total phosphorus (TP) in the samples was determined using the ammonium molybdate spectrophotometric method, with the digestion of the water samples using a 50 g/L ammonium molybdate solution, and a detection limit for TP of 0.01 mg/L. Total nitrogen (TN) was digested using a 40 g/L alkaline potassium persulfate solution and determined using ultraviolet spectrophotometry, with a detection limit of 0.05 mg/L. Ammonia nitrogen (NH3-N) was determined using the salicylate spectrophotometric method at a wavelength of 655 nm (HACH long-range nitrogen ammonia reagent kit), with a detection limit of 0.01 mg/L. CODMn was determined using the acid method with a detection limit of 0.5 mg/L. COD was determined using the dichroism method with a detection limit of 10 mg/L. BOD5 was determined using a dilution method with a detection limit of 2 mg/L. Water temperature (WT), dissolved oxygen (DO), and pH were directly measured using a YSI EXO2 multiparameter water quality monitor [38,39]. The trace metal elements copper, zinc, lead, and cadmium in the sample were determined by atomic absorption spectroscopy with detection limits of 0.001 mg/L, 0.05 mg/L, 0.01 mg/L, and 0.001 mg/L, respectively. The trace metal elements selenium, arsenic, and mercury in the sample were identified using cold atomic fluorescence spectroscopy, with detection limits of 0.00025 mg/L, 0.00006 mg/L, and 0.00005 mg/L, respectively. Spectrophotometry was used to detect trace amounts of the metallic element chromium in the sample, with a detection limit of 0.004 mg/L. Volatile phenols were determined by spectrophotometry after distillation with 4-aminophenol, with a detection limit of 0.002 mg/L. The hydrocarbons were determined using infrared spectroscopy, with a detection limit of 0.01 mg/L. Sulfides and anionic surfactants were determined using methylene blue spectrophotometry, with detection limits of 0.005 mg/L and 0.05 mg/L, respectively. Fluorides were determined using ion tomography with a detection limit of 0.02 mg/L. Cyanides were determined using the pyridine barbituric acid colimit assay, with a detection limit of 0.002 mg/L. Fecal coliforms were determined using the multiple tube fermentation method.
2.3. Data Processing and Evaluation Methods
In this paper, the distribution map of sampling points was generated by ArcGIS 10.2 software (Esri, Redlands, CA, USA), while data analysis and processing for mapping were conducted using Excel 2023 software (Microsoft Corp, Redmond, WA, USA).
2.3.1. The Single Index Method
The single index method is a traditional freshwater evaluation approach that establishes an evaluation system based on nutrient salts (N, P, etc.) by measuring transparency, nutrient concentration, and chlorophyll content, known as the ’first-generation‘ evaluation method [40]. The N/P ratio in the water reflects the specific nitrogen and phosphorus nutrient status. According to Liebig’s minimum law, plant growth is determined by the minimum amount of nutrients available in the external environments. Therefore, nitrogen and phosphorus have the smallest weight percentages in the algal molecular formula. Based on this, the critical N/P ratio should be 16:1 by element and 7.2:1 by weight. Theoretically, when the N/P ratio is below a certain threshold, nitrogen becomes the limiting factor for algal growth, whereas a higher N/P ratio indicates phosphorus as the limiting factor. In practice, the nitrogen and phosphorus required for algal growth are in the form of soluble NO3−, NH4+, or PO43−. It is generally accepted that phosphorus can be considered a growth limiting factor for algae when the nitrogen-to-phosphorus weight ratio exceeds 10.
In addition, chlorophyll-a and COD in water can also be evaluated from a single index perspective to assess the level of eutrophication in a body of water. Chlorophyll-a reflects the changes in phytoplankton, with chlorophyll-a content <1 µg/L indicating oligotrophic conditions, and content ranging from 1 to 10 µg/L indicating eutrophic conditions. Similarly, COD content <1 mg/L indicates oligotrophic conditions, while content ranging from 1 to 10 mg/L indicates eutrophic conditions.
2.3.2. The Weighted Comprehensive Scoring Method
The occurrence of eutrophication in lakes (reservoirs) is primarily attributed to the increased concentrations of nutrient elements such as nitrogen (N) and phosphorus (P) in the water, resulting in abnormal aquatic organisms and changes in water transparency. Therefore, in the description of eutrophication in lakes (reservoirs), TP, TN, COD, SD, and chlorophyll-a (Chla) were commonly selected as evaluation indicators. The weighted composite scoring method is commonly used as a basic evaluation model due to its convenience and simplicity in application. It has found a wide range of applications in numerous domestic and international water bodies. The evaluation expression may be described as follows:
where denotes the eutrophication fraction of a lake or reservoir; denotes the fractional value of the j-th parameter; and n denotes the number of parameters to be evaluated.
2.3.3. The Trophic Level Index (TLI) Method
The nutrient level index (TLI) recommended by the China National Environmental Monitoring Station was used to evaluate the water quality of the Waihu reservoir. TLI is a key water quality parameter that comprehensively considers the specific characteristics of reservoirs, including Chla, SD, TP, TN, CODMn, etc., as a comprehensive index to evaluate the degree of reservoir eutrophication [41].
The final calculation of the Trophic Level Index (TLI) involved the multiplication of the trophic level index by its respective weight. The specific formula used for this calculation is presented as follows:
where represents the Trophic Level Index (TLI) and represents the corresponding weight of the trophic level index for the jth parameter.
Now, taking Chla as the reference parameter, the normalized weight of the jth parameter was calculated according to formula (3):
where represents the correlation coefficient between the jth parameter and the reference parameter Chla and m represents the total number of evaluation parameters. The TLI for each indicator can be computed using Equations (4)–(8) as described by Jin et al. [39].
3. Results and Discussion
3.1. Reservoir Water Quality Analysis
Based on the test results, except for total nitrogen (TN) and total phosphorus (TP), additional indicators in Waihu Reservoir were relatively excellent and typically met the requirements of Class II or higher water standards according to [42]. It also meets the standards for the first-level protection area of centralized drinking water surface sources. However, if a single-factor index evaluation were conducted, the Waihu Reservoir (TN = 1.58 ± 0.06 mg/L) would be classified as Class IV water.
3.1.1. The Water Temperature and pH
Water temperature (WT) and pH are important factors that influence eutrophication in water bodies, as they can affect the bioavailability of nutrients and chemical reactions [43].
The increase in WT can accelerate the eutrophication process. Under high temperature conditions, the rate of chemical reactions in the water, including the biodegradation of nutrients and the growth rate of algae [44,45], increases. Furthermore, high temperatures can decrease the dissolved oxygen (DO) content in the water, exacerbating hypoxia and promoting eutrophication.
In this study, the WT of the Waihu Reservoir ranged from 21.5 to 21.7 °C. The upper 0–4 m constituted the surface temperature layer with little temperature difference, while the 4–12 m formed the thermocline zone with significant temperature gradients. Below 12 m, the temperature difference decreased greatly, and in this monitoring period, the temperature difference between surface water and lower layers was not significant. This may be due to the temperature decrease in autumn causing convection in the water, gradually eliminating the thermal stratification. This allows nutrients and dissolved oxygen to be evenly distributed in the water, providing favorable conditions for algal growth.
Moreover, the pH value of the water can influence the form and solubility of nutrients [46,47]. Under acidic conditions, certain nutrients such as phosphates are more soluble, making them more easily absorbed and utilized by organisms in the water, thus promoting eutrophication [48]. However, under alkaline conditions, these nutrients tend to exist in the form of precipitation or crystallization, reducing their bioavailability.
In this study, the pH values at various monitoring points in the reservoir remained stable, with a pH value of 7.13 ± 0.05, slightly alkaline. There was little difference between the surface and bottom water layers. If algae proliferate in large quantities, they will assimilate carbon dioxide, leading to a sharp increase in pH in the upper water layer. Conversely, due to stratification and oxygen consumption caused by decaying algae, the pH may slightly decrease in the lower water layers. Therefore, pH measurement can quickly reflect changes in algae and characterize the degree of eutrophication in water bodies.
In conclusion, changes in water temperature and pH can have an impact on water body eutrophication. Higher temperatures and acidic environments facilitate the process of eutrophication, whereas lower temperatures and alkaline environments tend to inhibit it. Therefore, controlling water temperature and maintaining an appropriate pH value are important measures for managing water body eutrophication.
3.1.2. The Oxygen Demand
The critical parameters for evaluating the degree of water pollution and the water quality status include chemical oxygen demand (COD), biological oxygen demand (BOD5), dissolved oxygen (DO), and permanganate index (CODMn), which are closely related to water eutrophication.
Elevated COD values generally indicate the presence of a large amount of organic and inorganic pollutants in the water [49,50]. In eutrophic bodies of water, COD values are frequently elevated due to the decomposition of algae and other aquatic plants after death, as well as the discharge of additional pollutants that increase the amount of oxidizable substances in the water. BOD5 is commonly used to measure the amount of organic matter in water that can be broken down by microorganisms. An elevated BOD5 value indicates a large amount of organic pollutants, and the biological decomposition of these substances consumes a significant amount of dissolved oxygen, leading to a decrease in DO in water and affecting the survival of other oxygen-dependent aquatic organisms [51,52,53]. In eutrophic bodies of water, DO is rapidly depleted due to the decomposition of a large number of dead algae, which can lead to hypoxia or anaerobic conditions that affect the biodiversity and ecological health of the body of water. CODMn uses potassium permanganate as an oxidant to measure the amount of organic matter that can be oxidized under acidic conditions [51,53]. It mainly reflects the amount of easily oxidized organic matter in the water. In eutrophic bodies, the CODMn values are generally elevated due to the presence of large amounts of organic matter.
Overall, elevated values of COD, BOD5, and CODMn are commonly associated with significant organic matter content in eutrophic bodies of water. The decomposition of these substances depletes the DO, resulting in water hypoxia. These parameters can thus be used together to assess the extent of water eutrophication and its potential impact on aquatic ecosystems. To control and manage water eutrophication, measures are needed to reduce the input of organic pollutants, improve the self-purification capacity of water bodies, and maintain DO at a level suitable for the survival of aquatic organisms.
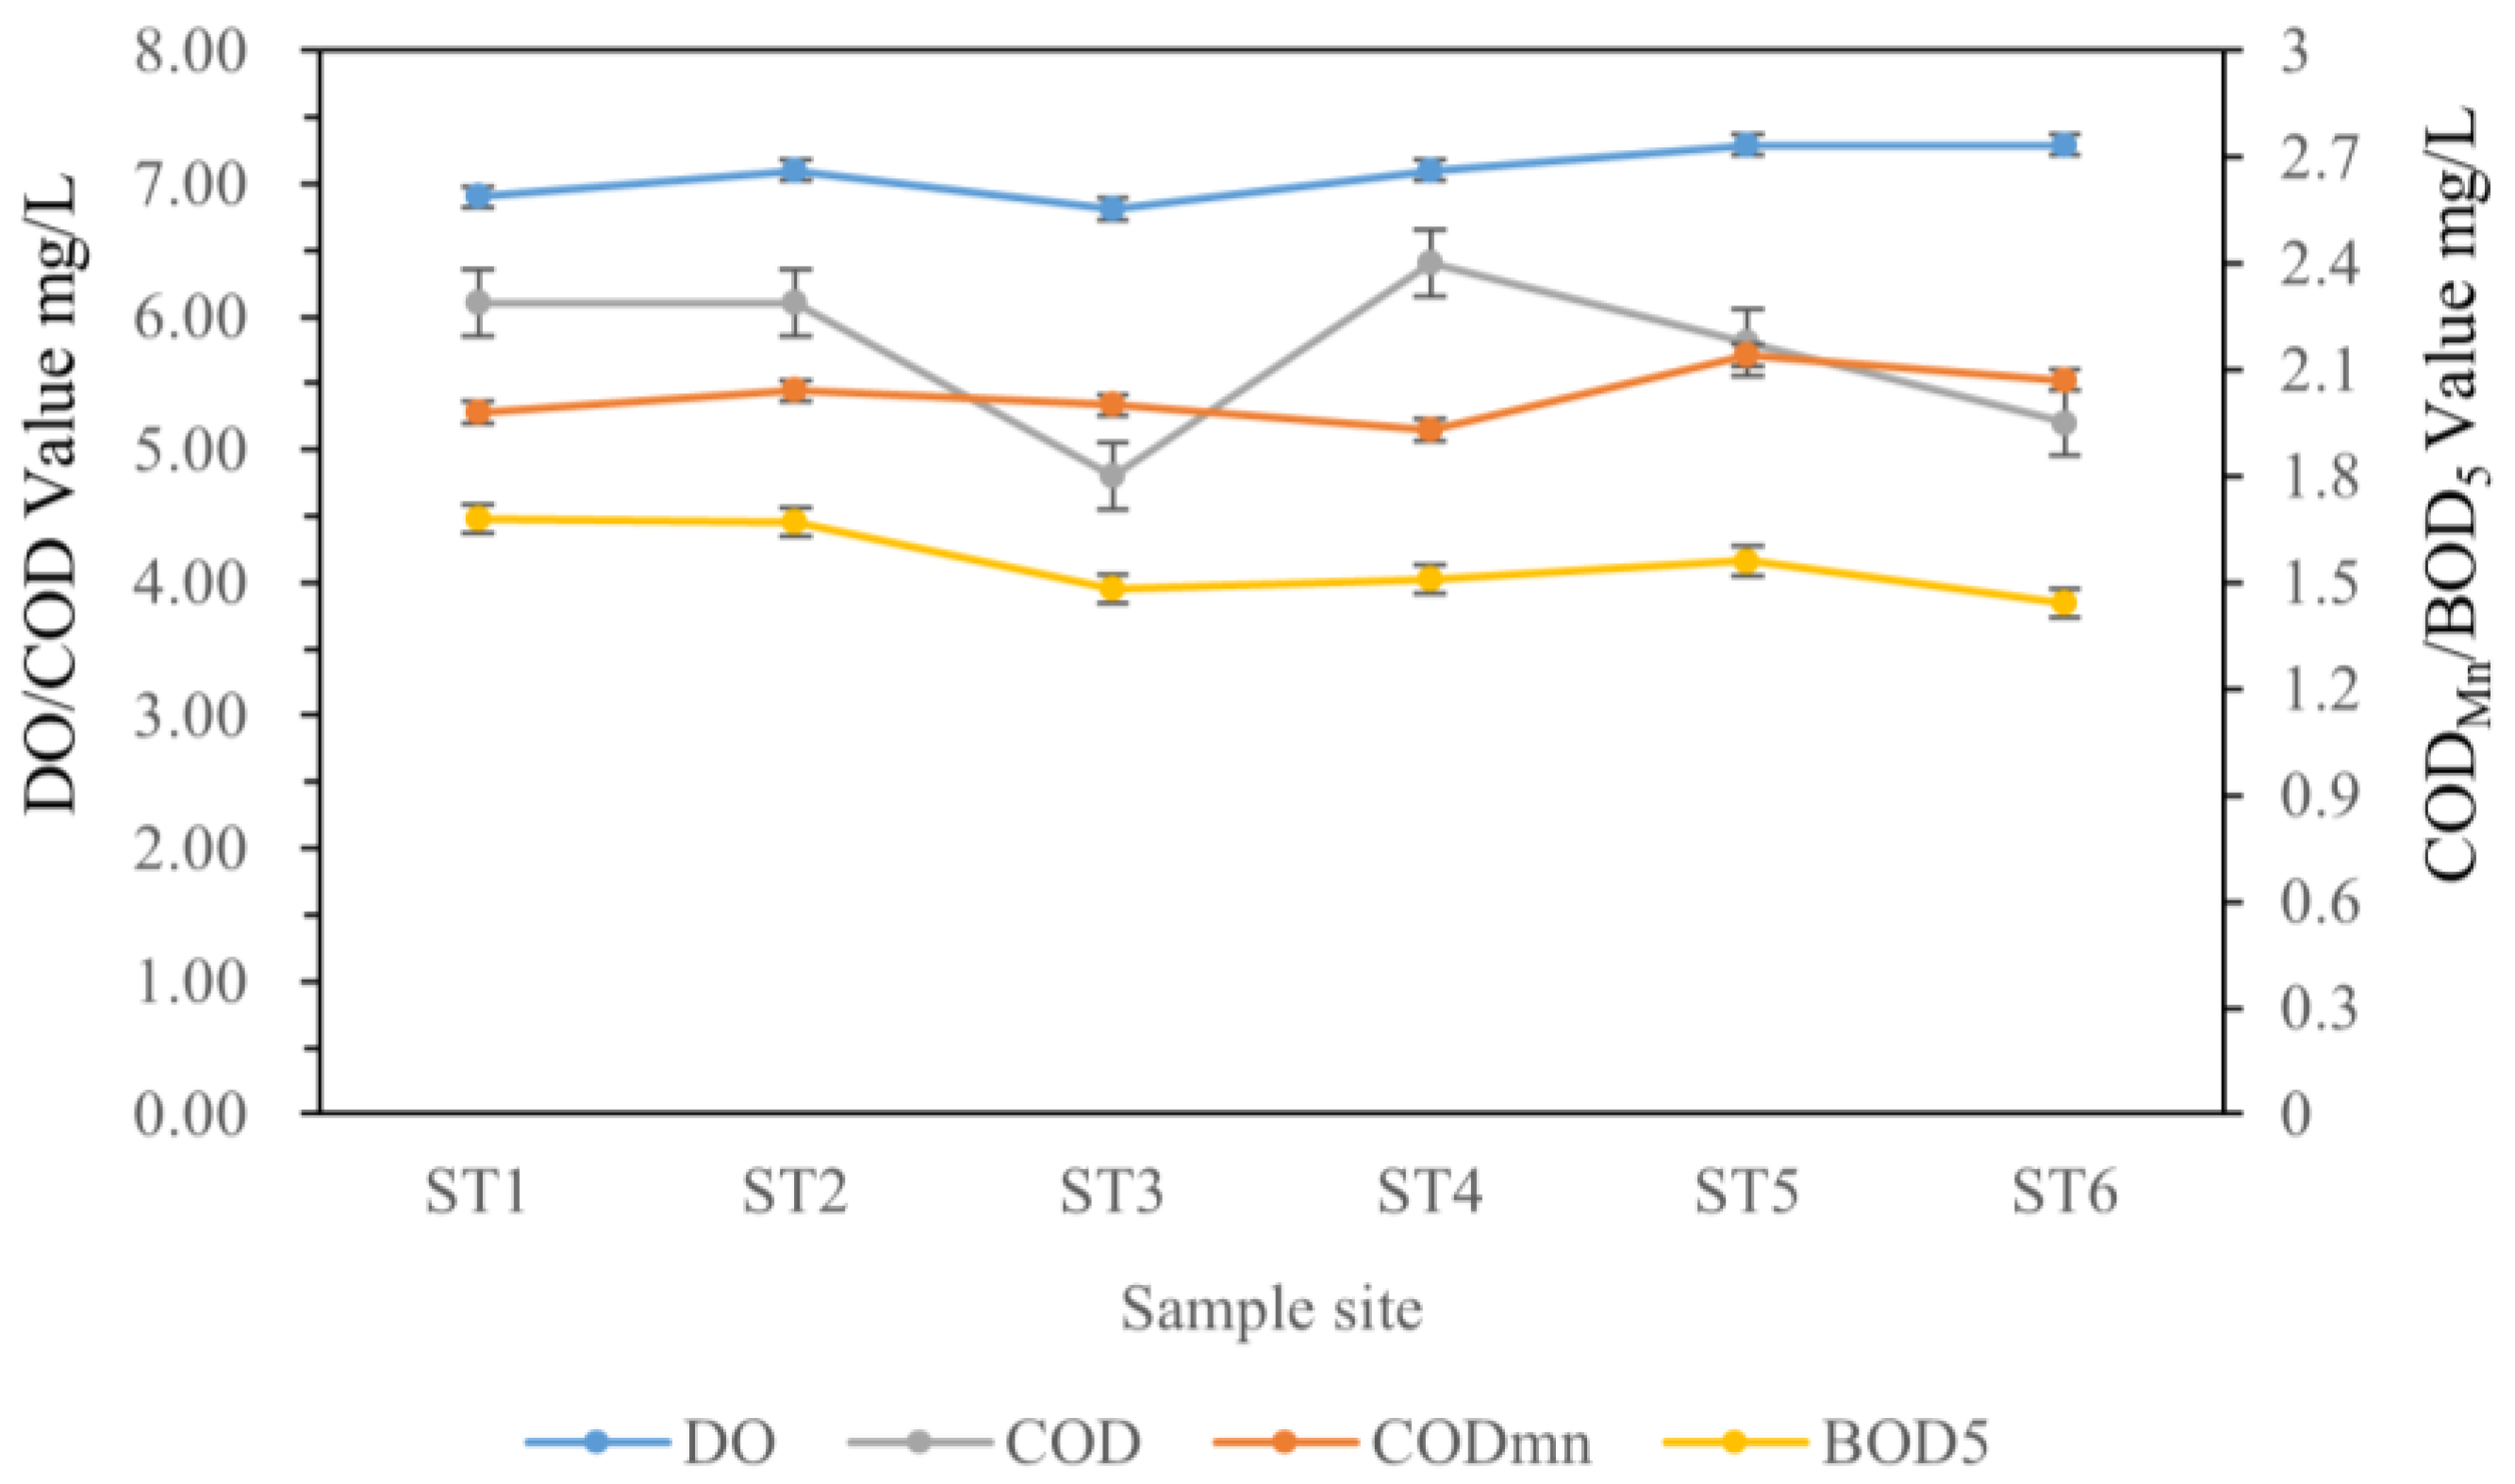
Figure 2 illustrates the variations in chemical oxygen demand (COD) values at different monitoring points in Waihu Reservoir. Overall, the dissolved oxygen (DO) values in the reservoir were typically elevated, with the surface water exhibiting DO saturation rates exceeding 80%. However, there is a clear stratification of DO values within the reservoir, with severe hypoxia observed in the lower layers. The CODMn, CODCr, and BOD5 values at various monitoring points in the reservoir were mostly low, meeting the Class I water standards [42]. Hence, it can be inferred that the reservoir water has low organic matter content and low levels of organic contamination.
3.1.3. The Eutrophic Substance
Nutrient enrichment has a significant effect on eutrophication in aquatic systems. Eutrophication typically refers to the excessive accumulation of nitrogen and phosphorus nutrients, particularly nitrogen and phosphorus, frequently originating from agricultural, in situ, and urban wastewater discharges. Eutrophication has numerous adverse effects on aquatic ecosystems, including harmful algal blooms, the deterioration of water quality, a decline in biodiversity, and the impairment of fisheries [54,55,56,57]. To tackle eutrophication, a wide range of measures need to be implemented, such as the proper management of agricultural and industrial wastewater discharges, the enhanced monitoring and remediation of water bodies, and the promotion of a circular economy. These measures contribute to reducing nutrient inputs into water bodies and safeguarding the health of aquatic ecosystems.
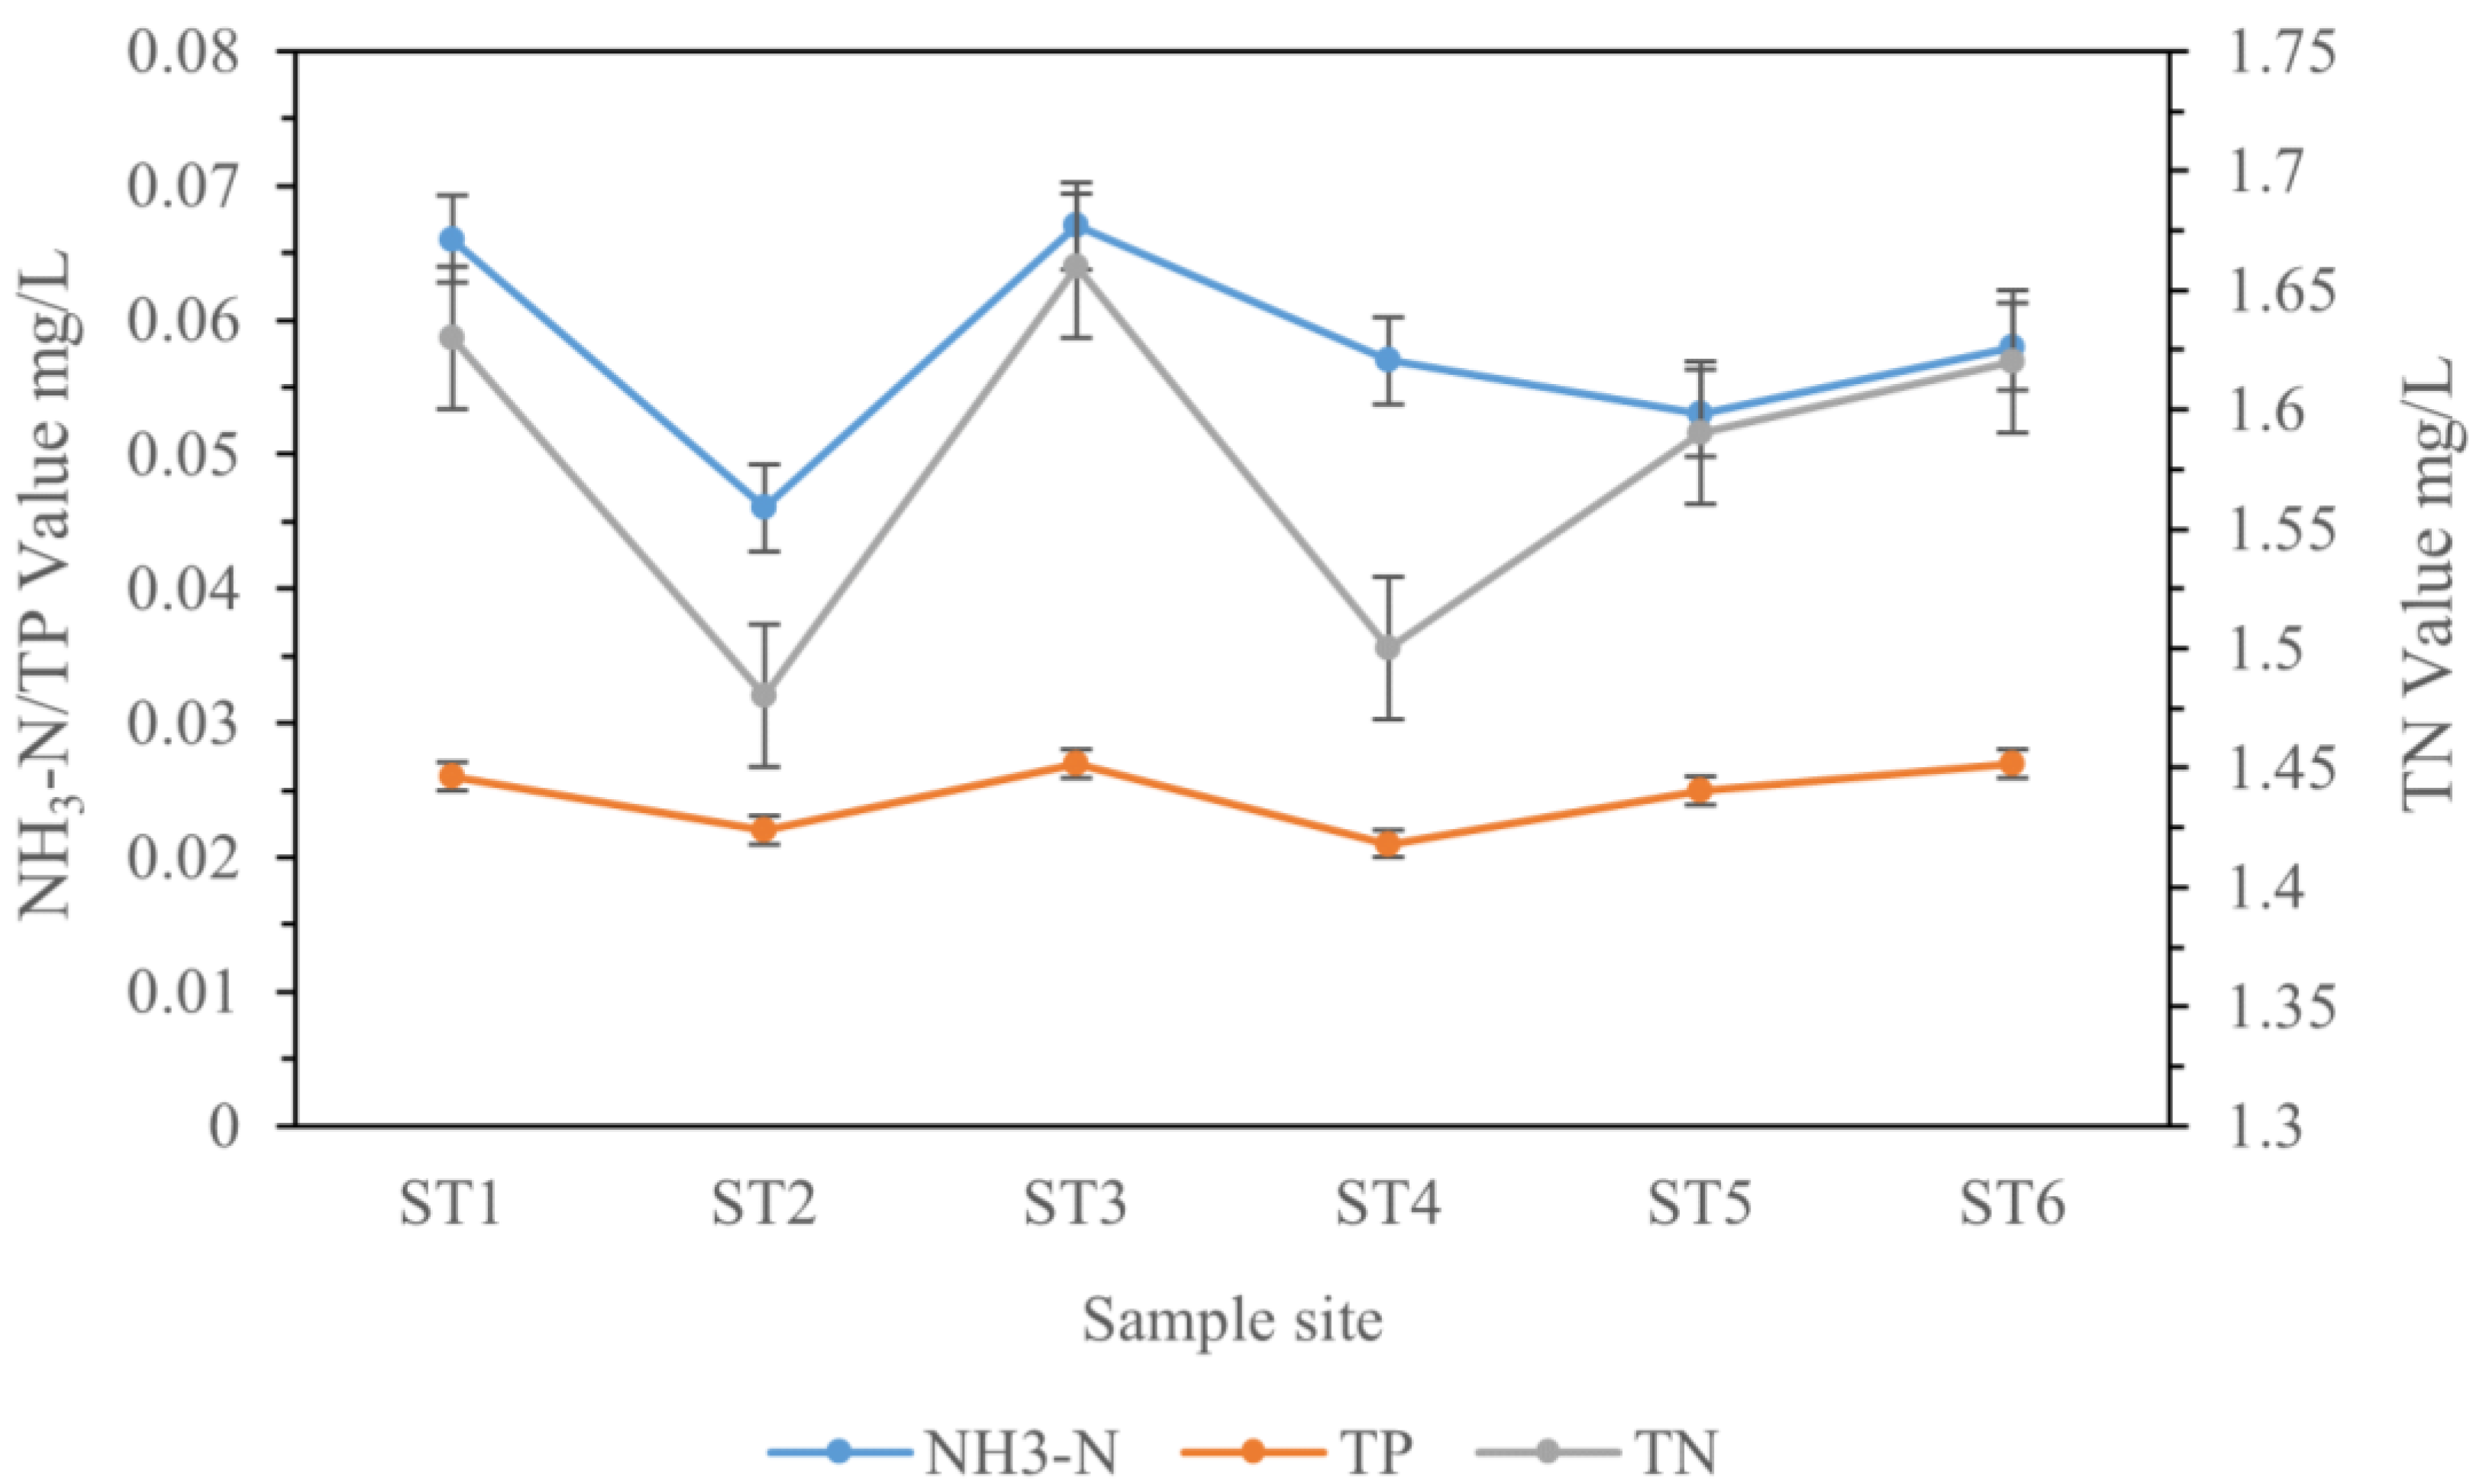
In this study, the monitoring indicators for nutrient enrichment were mainly total nitrogen (TN), total phosphorus (TP), and ammonia nitrogen (NH3-N). According to Figure 3, the TN level in the Waihu Reservoir remained consistently elevated, with an average concentration of 1.58 ± 0.06 mg/L. Referring to the “Surface Water Environmental Quality Standard” [42], the TN concentration fell mostly between Class IV and V, indicating a moderately polluted state. Nitrate nitrogen and nitrite nitrogen are the dominant forms of TN in the reservoir. As for the depth distribution, the TN concentration was relatively higher in the surface water, suggesting that external sources (runoff and rainfall) were the main contributors to TN in the reservoir. The TP concentration in the reservoir was 0.025 ± 0.003 mg/L, which fell primarily between Class II and III. In contrast to TN, TP exhibits a higher concentration in deep water layers. Combined with sediment analysis, the TP concentration in the reservoir sediment was 0.597 ± 0.027 mg/g, indicating that the release of TP from the sediment had a significant impact on the TP concentration in the water. Endogenous contamination was identified as the primary source of TP in the reservoir. It is worth noting that internationally accepted thresholds for eutrophication occurrence in lakes (reservoirs) are typically 0.02 mg/L for TP and 0.2 mg/L for TN, which were exceeded in all monitoring points of the Waihu Reservoir. The NH3-N concentration in the reservoir was 0.058 ± 0.008 mg/L, which was below the detection limit, indicating no pollution hazards in this regard.
Besides, based on the data collected from multiple monitoring points, it was observed that the concentrations of TN and TP in Waihu Reservoir were higher at the inflow point (ST1) and branches (ST3, ST5) compared to the middle (ST2, ST4) and downstream (outflow point) (ST6) of the dam. Hence, it can be inferred that the inclination of the reservoir towards eutrophication is primarily attributed to exogenous nitrogen and phosphorus inputs. The higher TN concentration at ST1 is most likely due to its proximity to a landfill site, where rainfall events may wash contaminants into the reservoir. The elevated TP concentration at ST3 may be related to the surrounding vegetation, as large amounts of fallen leaves decompose naturally during autumn. In addition, the narrow topography and moderate flow velocity of the reservoir hinder the dispersion of pollutants in this region.
3.1.4. The Heavy Metal Indicators
The impact of heavy metal indicators on water eutrophication is complex and diverse. While heavy metals themselves are not direct causes of eutrophication, they can exert various effects on eutrophication processes through multiple pathways, including bioaccumulation and biotoxicity, water chemistry balance and bioavailability, and microbial activity and biochemical processes [58,59,60,61].
Firstly, heavy metals accumulate in water bodies and are absorbed by organisms, entering the food chain. Elevated concentrations of heavy metals can have toxic effects on the growth, reproduction, and survival of aquatic organisms, resulting in reduced species abundance and disturbed ecological balance. In addition, heavy metals can affect fundamental biological processes such as photosynthesis and respiration, further disturbing the functioning of aquatic ecosystems. Secondly, the presence of certain heavy metals, such as iron and manganese, can alter the redox conditions of water bodies, thereby affecting the forms and bioavailability of nutrients. For instance, the redox reactions of heavy metals can influence the forms and solubility of phosphorus, subsequently impacting the occurrence and progression of eutrophication. Finally, heavy metals may inhibit the activity of microorganisms in water bodies, including those involved in nutrient cycling. Microorganisms play a crucial role in processes such as decomposition of organic matter and nitrogen cycling. The presence of heavy metals can disrupt these microbial processes and indirectly affect the development of eutrophication. In summary, the impact of heavy metal indicators on water eutrophication is multifaceted and closely related to factors such as bio-toxicity, water chemical balance, and microbial activity. Therefore, it is crucial to consider the presence and effects of heavy metals in the management and control of water eutrophication to safeguard the health and sustainability of aquatic ecosystems.
In this study, heavy metal indicators in water bodies, primarily copper, zinc, lead, cadmium, and mercury, were investigated. The results revealed that the heavy metal indicator in the Outer Lake reservoir is below the detection limit of the instrument, indicating that there is no heavy metal contamination problem. This finding is closely related to the absence of mining activities and industrial wastewater discharges in the reservoir area.
3.1.5. Other Pollution Indicators
The monitoring of additional indicators in a body of water includes inorganic salt indicators and biological indicators. Inorganic salt indicators mainly refer to sulfates, chlorides, and cyanides in the water. Sulfates originate primarily from human waste and industrial wastewater from certain industries such as the chemical, pharmaceutical, and paper industries. Chlorides and cyanides come mainly from industrial wastewater generated by electroplating, tanning, and coking processes. None of these inorganic salt indicators were detected in the Waihu Reservoir, further confirming the absence of industrial point source contamination within the reservoir area.
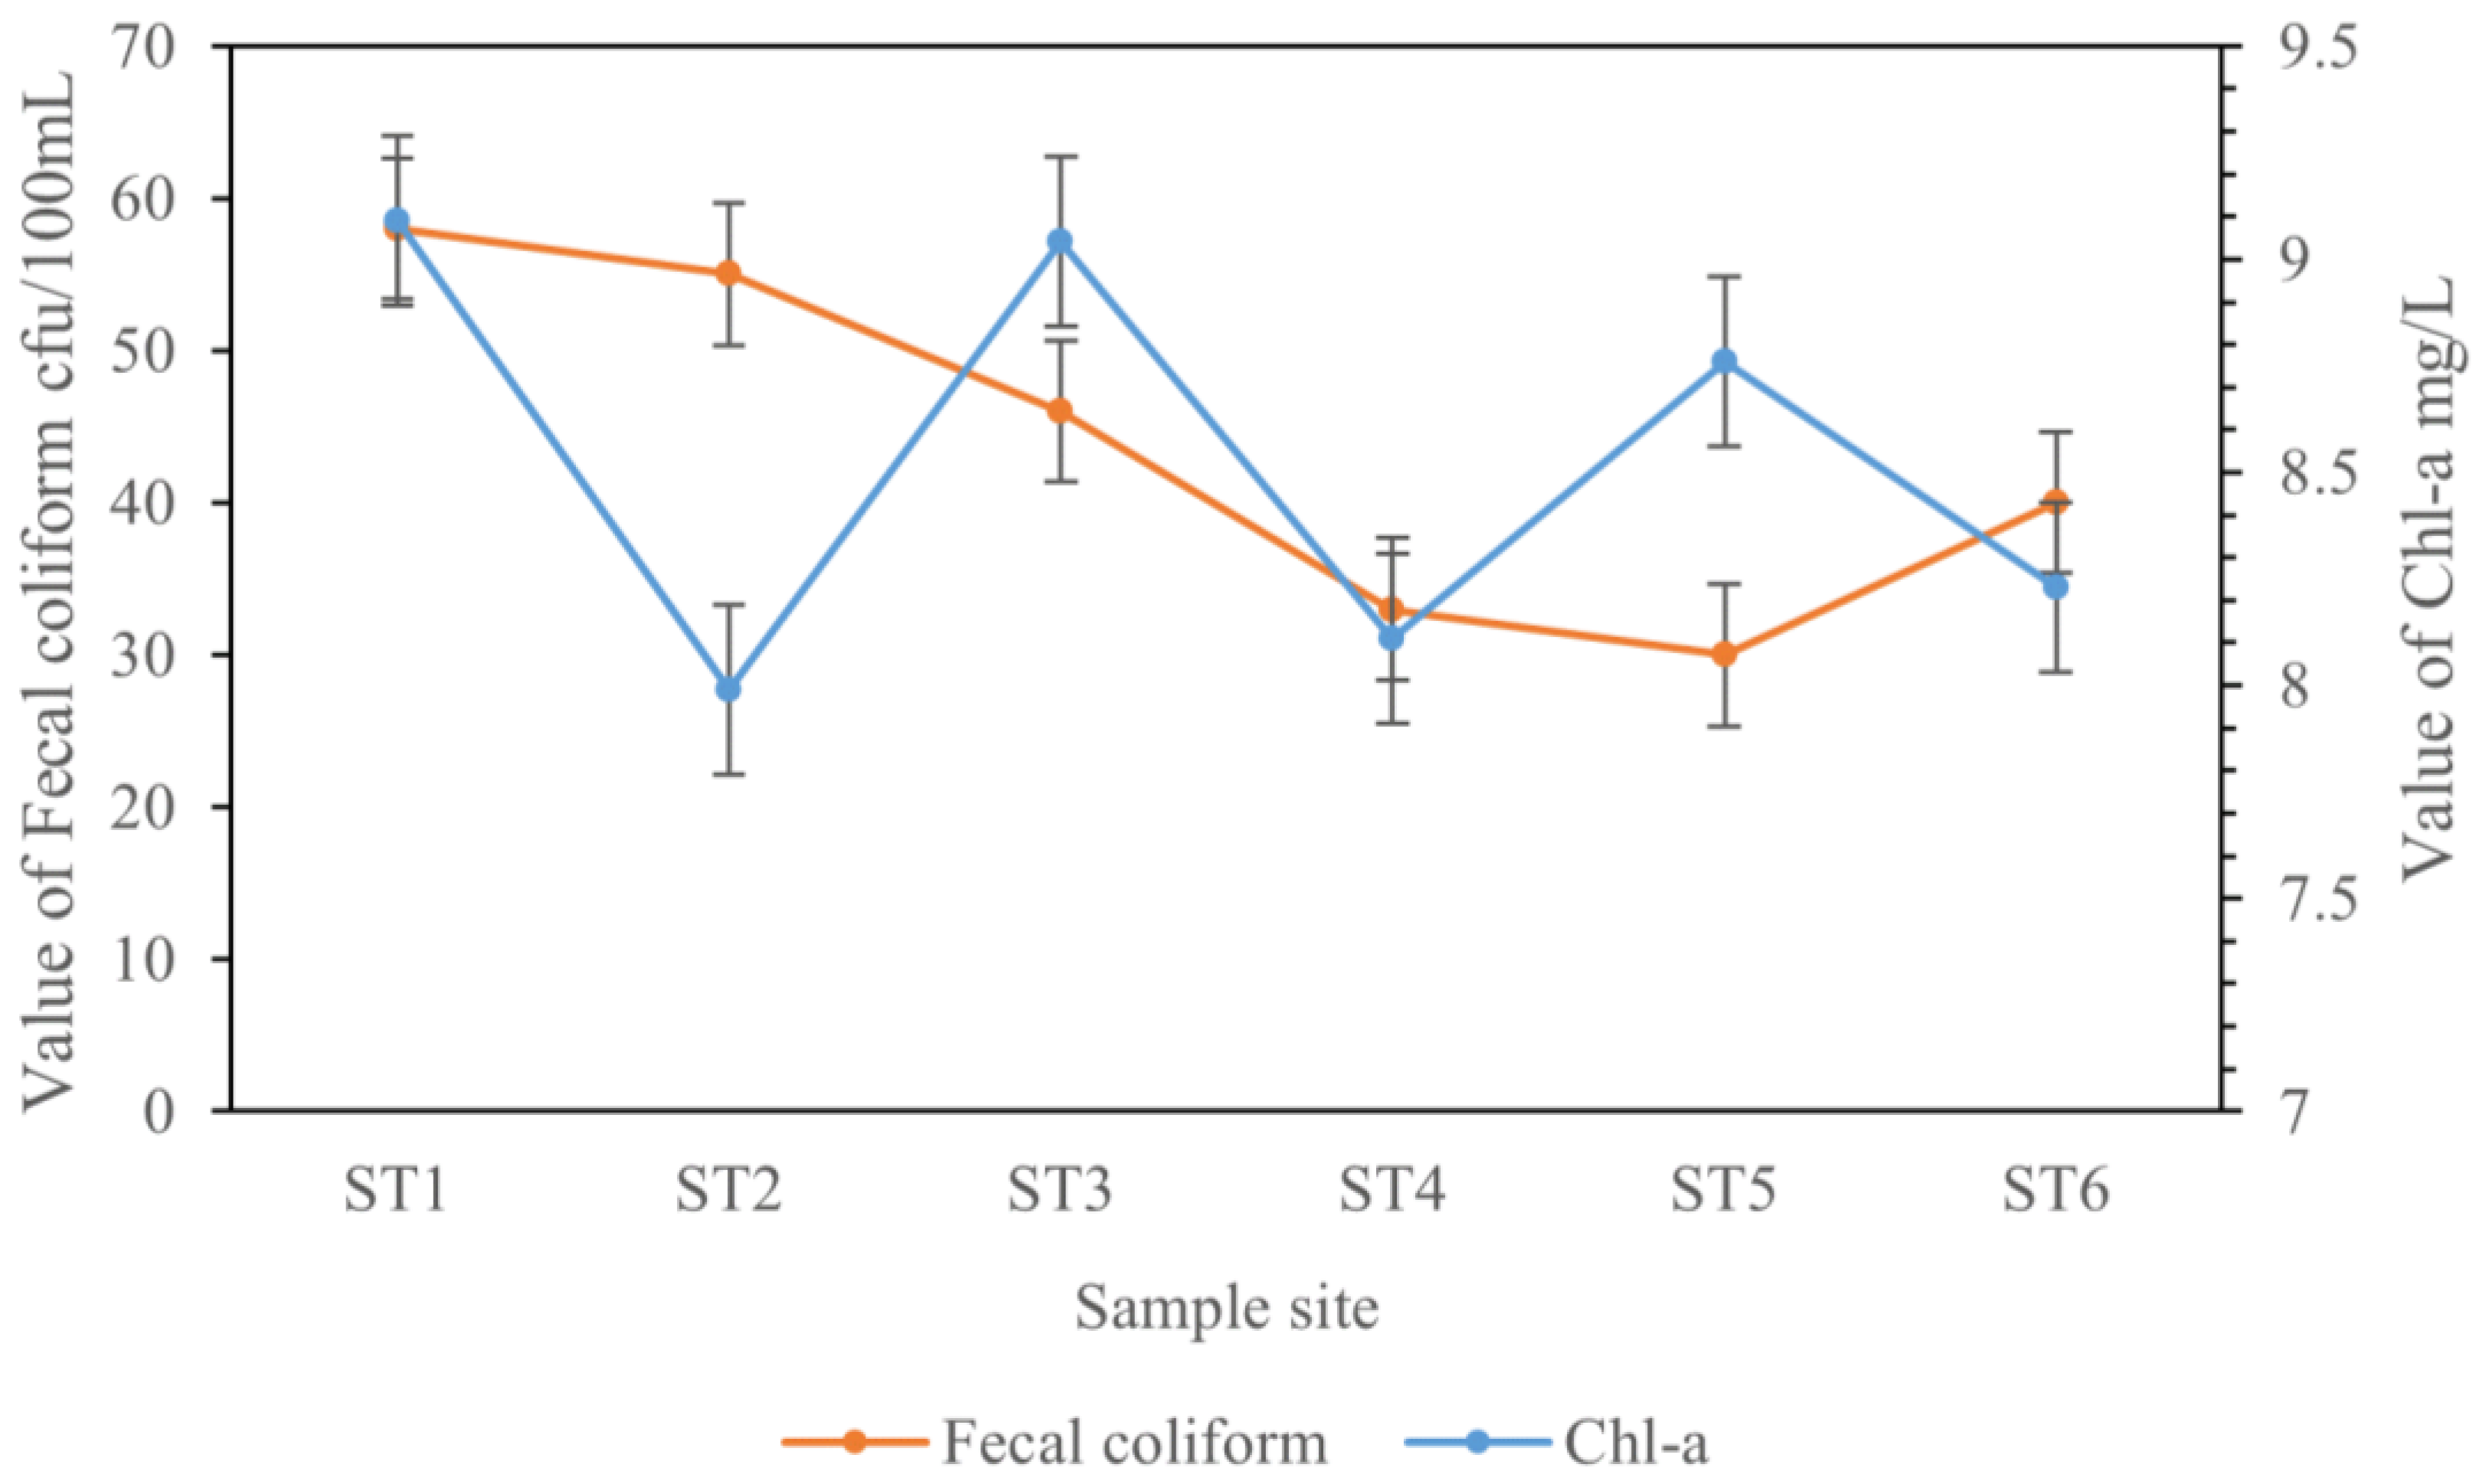
The monitoring of biological indicators included chlorophyll-a and fecal coliforms (Figure 4), chlorophyll-a, as the main component of chlorophyll, is closely related to the species and quantity of algae in the water, and its concentration affects watercolor, water quality, and primary productivity, serving as an indicative parameter, which reflects the nutrient level of the water body [62]. In the Waihu Reservoir, the concentration of chlorophyll-a was 8.54 ± 0.49 mg/m3, falling within the mesotrophic–eutrophic range (between 3.09 and 11 mg/m3), defined by the Organization for Economic Cooperation and Development (OECD) as a single indicator for the trophic status classification of lakes (reservoirs). No significant difference in chlorophyll-a concentration was observed between surface and deep water, suggesting that changes in water depth have minimal impact on chlorophyll-a concentration. Fecal coliforms serve as indicators of fecal contamination, primarily reflecting the presence of this bacterial group in the water [63]. The amount of fecal coliforms indicates the extent of fecal contamination and potential health risks. Fecal coliform counts at all monitoring sites at Waihu Reservoir met Class II water quality standards, indicating relatively low levels of fecal contamination from livestock and poultry farming activities within the reservoir area.
3.2. The Eutrophication Assessment of the Reservoir
Eutrophication of water bodies is the result of human activities that result in the uptake of significant amounts of nutrients, including nitrogen, phosphorus, and other elements essential for microbial growth, into moderately flowing bodies of water such as lakes, reservoirs, and rivers. This leads to the rapid proliferation of algae and other aquatic organisms, the decrease in dissolved oxygen, the deterioration of water quality, and the mass mortality of fish and other organisms. Water eutrophication, as defined by the OECD, encompasses a range of signs and changes resulting from elevated nutrient levels, resulting in the increased productivity of phytoplankton and macrophytes, the deterioration of water quality, and the degradation of water resource value. Moreover, considering the potential occurrence of toxic cyanobacterial populations, the World Health Organization (WHO) has established guideline values for drinking water supplies and recreational water [64].
The assessment of eutrophication in lakes (reservoirs) is a quantitative description of the nutritional levels of a specific stage in the development of eutrophication in the water body. Its main purpose is to scientifically evaluate the trophic status of lakes (reservoirs) through the detailed investigations of the representative indicators of eutrophication. This assessment aids in comprehending the eutrophication process and forecasting its future trends, thereby offering a scientific foundation for the regulation of water quality and the control of eutrophication in lakes (reservoirs).
With the deepening research on material cycling and energy flow processes, eutrophication assessment has become an important aspect of lake (reservoir) eutrophication studies [1,2]. Various methods for assessing lake (reservoir) eutrophication have been developed both domestically and internationally. Currently, the most commonly used methods include the single-indicator approach, the weighted composite scoring method, and the comprehensive trophic state index method [65,66]. In this study, we will employ these methods to assess the eutrophication of Waihu Reservoir and determine its degree of eutrophication.
3.2.1. The Single Index Method
According to these assessment methods, the TN and TP indicators in Waihu Reservoir reached the eutrophic (TN > 1.20 mg/L) and mesotrophic–eutrophic (TP > 0.025 mg/L) levels, respectively. Based on Liebig’s law of the minimum, the N/P ratio in the reservoir was determined to be 63:1 through this monitoring, indicating that eutrophication in this reservoir is primarily phosphorus driven, making it a typical phosphorus-limited eutrophic reservoir. In addition, chlorophyll-a and COD in the water can also be used as single indicators to assess the degree of eutrophication, and based on these two indicators, it can be inferred that the Waihu Reservoir is eutrophicated.
Internationally, it is commonly considered that a TP concentration of 0.02 mg/L and a TN concentration of 0.2 mg/L are the critical thresholds for algal bloom events in lakes (reservoirs). The monitoring values of eutrophication indicators such as TP and TN at Waihu Reservoir were compared with those of some domestic and international reservoirs where cyanobacteria outbreaks have occurred, as shown in Table 1.
The Waihu Reservoir exhibits a significant nutrient load, particularly in the form of niobium and phosphorus. The concentrations of these substances are comparable to, or even higher than, those observed in reservoirs where algal blooms have occurred both domestically and internationally. Under natural conditions, this reservoir does not experience eutrophication. However, for the same concentration of nitrogen and phosphorus indicators, the reservoir levels have reached or exceeded the standard for eutrophication control under the conditions of moderate water flow, suitable temperature, and proper light exposure. Hence, the reservoir possesses the essential material conditions for water eutrophication.
3.2.2. The Weighted Comprehensive Scoring Method
The eutrophication of lakes (reservoirs) is mainly due to the increasing concentration of nitrogen (N) and phosphorus (P) nutrients in the water, resulting in abnormal aquatic organisms and changes in water transparency. Table 2 presents the criteria for scoring and classifying eutrophication in lakes (reservoirs). On a scale of 0 to 100, each evaluation parameter is assigned a corresponding score. A higher total score indicates a higher degree of eutrophication in the lake or reservoir.
By applying Equation (1) to calculate the values for the Waihu Reservoir, the results are shown in Table 3. The calculated value of M for the Waihu Reservoir is 48.5. Referring to Table 2, the Waihu Reservoir falls into the mesotrophic–eutrophic category. Both the TN (65.8) and COD (54.3) indicators in the Waihu Reservoir have reached eutrophic levels.
3.2.3. The Trophic Level Index (TLI) Method
Based on the mechanism of eutrophication formation, the comprehensive trophic state index method used in reservoirs adopts the technical regulations for the evaluation and classification of eutrophication in lakes (reservoirs) implemented by the China Environmental Monitoring Station (GBT 23598-2009).
- Calculation of the integrated trophic state index
The Trophic State Index (TLI) is calculated by employing formulas (2–8) that utilize the average values of the following parameters: TN, TP, SD, chlorophyll-a (Chla), and CODMn [65]. The total score ranges from 0 to 100, and the scoring criteria can be referenced from [68].
- 2.
- Evaluation of the eutrophication status of the Waihu Reservoir
The above formula was used to calculate the integrated trophic state index for the Waihu Reservoir, and the results are shown in Table 4. Referring to the classification criteria [63], Waihu Reservoir falls into the mesotrophic–eutrophic category. Similar conclusions were also drawn by [3] for the Joumine Reservoir in Tunisia and [66] for the Bao’an Lake in Hubei Province using the same method.
3.3. Strategies for Eutrophication Pollution Control
Based on the above studies, it is clear that the water quality at Waihu Reservoir has reached mesotrophic–eutrophic levels, posing a potential risk of widespread algal blooms. The main factors contributing to this condition are elevated concentrations of TN and TP in the water, which are mainly attributed to both external and internal sources of contamination.
From field investigations, the following aspects of external pollution have been identified: Firstly, raw domestic sewage from the surrounding villages enters the reservoir directly or indirectly. Secondly, pesticides and fertilizers from agricultural fields, as well as rural solid waste and livestock manure, enter the water through surface runoff. Thirdly, water and soil erosion result in the influx of large amounts of sediment and humus into the reservoir, causing nitrogen and phosphorus contamination. Fourthly, additional sources of pollution, such as washing and fishing activities, are also considered.
Internal pollution manifests itself mainly in accumulated sediment at the bottom of the reservoir. Since the completion of Waihu Reservoir in October 1987, no dredging has been conducted in almost 30 years, leading to a significant accumulation of sediment. Sediment acts as an essential site for the migration and conversion of contaminants in the water, acting as both a sink and a source of pollutants. When water bodies are exposed to environmental pollution, pollutants can be adsorbed and deposited in sediment. Under the right conditions, these contaminants can be released back into the water, causing secondary pollution in the aquatic environment. Waihu Reservoir has accumulated 289.76 t of nitrogen and 139.80 t of phosphorus, making it a significant source of N and P releases.
Therefore, it is crucial to identify the causes of eutrophication and propose practical and feasible comprehensive measures for prevention, control, and remediation aimed at mitigating the impact of pollution sources on the water quality of reservoirs.
3.3.1. Measures to Reduce Exogenous Nutrient Input
Measures were taken to reduce the input of exogenous nutrients, primarily the reduction in N and P, and additional essential nutrients entering the water, causing eutrophication and pollution problems in water bodies.
- (1)
- Pollution control of rural domestic sewage: To adapt to the complex terrain and dispersed village scale in the Waihu Reservoir water source area, several measures for rural domestic sewage treatment were proposed, namely (1) household biogas technology, suitable for sparsely populated areas, treats feces and wastewater through the “one for three” model; (2) ecological wastewater treatment ponds, suitable for individual households or multiple households working together, reduce nitrogen and phosphorus content through ecological beds; (3) the buried anaerobic treatment method, suitable for densely populated villages, provides deep anaerobic treatment; (4) membrane bioreactor (MBR) technology, combining membrane technology and biological treatment, used in areas with high-standard sewage treatment requirements. These methods are designed to effectively manage domestic sewage in rural areas and reduce its environmental impact on water source areas.
- (2)
- To achieve the harmless treatment of domestic waste in the reservoir area, the establishment of a waste collection system in each village is crucial for pollution control of rural solid waste, including waste pits, collection points, vehicles, and transfer stations, implementing a management model of “group cleaning, village collection, town transportation, and county disposal.” In addition, it is necessary to strengthen environmental and exhaust management, increase the frequency of road cleaning, and use vegetation on the sides of roads to beautify the environment and reduce pollution.
- (3)
- The pollution control of agricultural fertilizers and pesticides: (1) To prevent pollution from agricultural fertilizers, it is necessary to reduce fertilizer usage and promote balanced and scientific fertilization methods, such as optimizing formulations and deep-layer fertilization, to improve fertilizer efficiency and reduce losses. The use of phototrophic bacteria and breeding technology can enhance nitrogen and phosphorus utilization in the soil, promoting soil ecological cycling and agricultural sustainability. (2) Regarding pesticide pollution, prevention should be prioritized, combining prevention and control measures, controlling usage, providing technical guidance, and promoting the use of biopesticides to protect the water environment in the reservoir area.
- (4)
- Pollution control of livestock and poultry farming: Each village in the Waihu Reservoir water source area has free-range chickens and ducks. To control the pollution of water quality caused by livestock farming, prohibited and restricted breeding areas should be established within the reservoir area and strict management and pollution control measures should be implemented. By promoting the harmless treatment technology for animal waste and adopting ecological farming practices, the environmental sustainability of agricultural production can be achieved, effectively reducing pollution from farming activities and protecting the water source of the reservoir.
- (5)
- Pollution prevention and the control of soil erosion. The containment of pollution caused by soil erosion focuses on addressing nitrogen and phosphorus pollution re-exposure from soil erosion. Commonly, engineering measures and vegetation measures are used to reduce soil erosion. (1) Engineering measures primarily involve implementing orchard management projects, carrying out slope protection projects, and establishing prestorage reservoirs and buffer zones. The authors of [69] have demonstrated the effectiveness of these measures by establishing artificial wetland systems to control pollution inflow into reservoirs. (2) Vegetation measures mainly include the construction of ecological restoration projects and vegetation planting.
- (6)
- The pollution control of alternative pollution sources: During field investigations, it was discovered that fishing activities occur throughout the year in the Waihu Reservoir, causing water pollution. Fishing bait contains large amounts of chemical additives, and the residue and garbage left by anglers is discharged directly into the water, leading to significant pollution. To protect water quality, it is urgently necessary to implement isolation and protection measures in the reservoir area, including the establishment of physical barriers (fences, enclosures, etc.) and biological barriers (protective forests, etc.), as well as the placement of no-fishing warning signs in the vicinity of the reservoir area. In addition, it is imperative to enhance environmental stewardship and enhance law enforcement efforts within the reservoir area. Educational and awareness programs should be conducted for villagers residing in the water source area to combat illegal fishing activities in the reservoir. Furthermore, any activities that may cause water pollution, including washing, tourism, and aquaculture, should be prohibited in the protected area for drinking water sources. Facilities that produce and store hazardous chemicals must maintain a legal distance from water sources and comply with environmental impact assessment standards. Vehicles transporting toxic and hazardous materials must adhere to relevant procedures and be equipped with necessary security measures such as leak-proof devices to ensure safe passage.
3.3.2. Measures to Control Endogenous Nutrient Release
Measures to control endogenous nutrient release primarily involve reducing the concentration of nutrients in the water, thereby mitigating eutrophication pollution and serving as an essential strategy for the protection of aquatic ecosystems, human health, and sustainable water utilization. Currently, engineering measures such as sediment dredging, deep water aeration, water dilution, and plastic film coverage on the sediment surface are employed to reduce the nutrient load in the sediment, as detailed in Table 5.
- (1)
- Sediment dredging: This method primarily involves removing accumulated nutrients in sediments to minimize their release into the water. It can effectively and rapidly reduce the nutrient load in the sediment, improving water quality. However, the dredging process may have some impact on sediment and benthic organisms, and it requires substantial human and physical resources.
- (2)
- Deepwater aeration: This method involves injecting oxygen into the bottom of water bodies to stimulate microbial metabolic activities in sediments, accelerating the decomposition and removal of organic matter. It enhances oxygen conduction in sediment, promotes microbial growth and metabolism, and facilitates the efficient removal of organic loads from sediment. However, it requires strong energy input and incurs elevated operational costs.
- (3)
- Water dilution: This method involves injecting a substantial quantity of pure water into the water body to dilute the nutrients in sediments and reduce their concentration. This is a simple and cost-effective way to rapidly dilute and flush nutrients from the sediment. However, it can cause significant fluctuations in water quality and can have some impact on aquatic ecosystems, and its effects may not be long-lasting.
- (4)
- Plastic film coverage on sediment surfaces: This method employs the use of plastic film on sediment surfaces to block the release pathway of nutrients from sediments, reducing their input into the water. Similarly, this technique is simple, cost-effective, and effective in reducing nutrient release from sediments. However, it may also have certain impacts on sediment and benthic organisms, requiring regular replacement and maintenance.
Based on the above comparative analysis, the most direct and effective method is sediment dredging, which has been successfully implemented in numerous cases, both domestically and internationally. For example, this technique has been applied in Lake Kasumigaura in Japan and Nanhu Lake in Changchun to control the release of endogenous nutrient substances [69,70,71,72].
Mechanical dredging measures can be employed for sediment dredging at Waihu Reservoir, primarily using dredging vessels, siphon sediment suction devices, and air pumps for sediment removal. In addition, a dredging plan should be developed based on the level of pollution and its impact on water quality before sediment dredging in the Waihu Reservoir. The plan should specify the extent and thickness of dredging, the volume of sediment to be removed, major pollutants, and excessive levels to avoid the secondary contamination of the reservoir during sediment disposal.
3.3.3. Ecological Restoration Techniques
Eutrophic bodies are typical aquatic ecosystems that require site-specific management. Numerous studies have demonstrated that after the operation of sediment dredging projects, the nutrient load in the sediment can be significantly reduced, resulting in improved water quality. However, the dominant species of phytoplankton remains indicative of eutrophication, indicating that the body of water remains eutrophic even after sediment dredging. Therefore, for the current stage of Waihu Reservoir management, it is necessary to combine engineering measures (sediment dredging) with ecological restoration to establish a robust reservoir ecosystem, enhance the inherent self-purification capability of the aquatic ecosystem, and achieve sustainable development in the management of Waihu Reservoir.
Currently, available biological restoration techniques mainly include microbiological and biofilm-based restoration techniques, constructed wetlands and floating island technology, biomanipulation techniques, and aquatic plant restoration techniques.
- (1)
- Microbiological and biofilm-based restoration techniques [73,74]. Microorganisms play a crucial role in the mineralization of organic matter as decomposers in lake ecosystems and as integral components of microbial food webs. They are essential participants in the cycle of matter and the flow of energy. Microbes can degrade environmental pollutants and eliminate or reduce their toxicity, making them an effective method for maintaining ecological balance in water bodies. Biofilms, which use copepods such as plastics as carriers, provide attachment conditions for microorganisms, protozoa, and microscopic zooplankton involved in pollutant purification. Organic substrates in water attached to biofilms are oxidized to achieve water purification. Common examples include tower biofilters and rotating biological contactors.
- (2)
- Constructed wetlands and floating island technology [75,76]. Ecological bed technology utilizes soilless cultivation techniques, uses polymer materials as carriers and substrates, and integrates modern agronomy and ecological engineering measures for the cultivation of plants on the water surface. “Biological floating islands” use materials such as plastic foam as carriers, enabling plants grown on floating islands to absorb nutrients from the water. The roots of these plants, along with the floating bed substrate, can remove suspended solids and other substances from the water, thus addressing eutrophication in water bodies.
- (3)
- Biomanipulation techniques [77]. Biomanipulation refers to a series of adjustments to aquatic organisms and their habitats to enhance certain interactions and reduce the biomass of phytoplankton. It is an ecological term introduced by Shapiro to control eutrophication by exploiting the decisive influence of food web structure on primary productivity in water bodies. The current policy of “water purification through fish cultivation and water quality improvement through fish” in Waihu Reservoir is an application of this technique. It can effectively control or reduce the abundance of phytoplankton in water, significantly reduce water treatment costs for water plants, and improve water quality, achieving mutually beneficial effects.
- (4)
- Aquatic plant restoration techniques [78]. This technique leverages the ecological approach of eutrophication control in lakes by exploiting the interactions among different trophic levels in the lake ecosystem to regulate the structure of the aquatic biota community, improve the structure and function of the aquatic ecosystem, and achieve the restoration of the aquatic ecosystem.
Regarding the specific choice of which biological restoration techniques to employ for the efficient purification of eutrophic water bodies in the Waihu Reservoir, it should be fully considered in conjunction with local environmental factors such as water flow rate, basin size, water depth, age, and function. Socio-economic factors should also be taken into account to determine the optimal treatment technique.
4. Conclusions
This study primarily involved the collection of water samples from an external lake reservoir and the analysis of the current water quality to determine the nutrient status of the reservoir. Based on this, a comprehensive analysis and discussion were conducted on the pollution sources (exogenous and endogenous) of the reservoir. Effective strategies for controlling eutrophication pollution have been proposed and some beneficial conclusions have been drawn:
- (1)
- The sampling and testing results of the external lake reservoir showed that, except for total nitrogen and total phosphorus, the additional indicators met the standards of a first-class protection zone for centralized domestic drinking water sources. In addition, various heavy metals and inorganic salt indicators in the reservoir are below the detection limit, indicating the absence of mining and industrial wastewater contamination in the surrounding area. Fecal coliform counts at all monitoring points met Class II water quality standards, indicating relatively mild fecal contamination from livestock and poultry farming within the reservoir area.
- (2)
- The evaluation results of eutrophication in the external lake reservoir indicated that, according to the single-factor index method, the reservoir was classified as eutrophic based on TN, chlorophyll-a, and COD indicators, and as moderately eutrophic to eutrophic based on the TP indicator, making it a typical phosphorus-limited eutrophic reservoir. The weighted comprehensive scoring method and comprehensive nutrient status index method classified the reservoir as moderately eutrophic to eutrophic, with TN and COD being the main contributing factors.
- (3)
- To control exogenous pollution in the external lake reservoir and reduce the influx of nutrients such as N and P into the water, comprehensive prevention and control measures should be implemented, including addressing domestic sewage, solid waste, pesticides and fertilizers, livestock and poultry farming, water loss, and fishing (bait) within the reservoir water source area. To control endogenous contamination and reduce the nutrient load of sediment, measures such as mechanical dredging are needed to remove sediment from the reservoir.
- (4)
- Finally, it is recommended that the current stage of reservoir management should adopt a comprehensive prevention and control technology that combines engineering measures (sediment dredging) with ecological restoration to accelerate the removal of nutrients from the water.
Author Contributions
Conceptualization and methodology, Y.Q.; investigation, R.C.; data curation, M.C. and A.Y.; writing—original draft preparation, Y.Q.; writing—review and editing, Y.Q.; visualization, X.C. and E.L.; supervision, D.X. All authors have read and agreed to the published version of the manuscript.
Funding
This research was funded by the Natural Science Foundation of Zhejiang province (no. LZJWZ23E080002); the Key Laboratory for Technology in Rural Water Management of Zhejiang Province (no. xky2023003); and the Research and Extension Projects of the Zhejiang Provincial Department of Ecology and Environment (2023HT0028).
Data Availability Statement
The data supporting the findings of this study are available within the article. Additional datasets used and/or analyzed during the current study are available from the corresponding author upon reasonable request.
Conflicts of Interest
Author Ruisi Cao was employed by the company Jiaxing Hydraulic and Hydropower Survey and Design Research Institute Co., Ltd. Author Erpeng Li was employed by the company Yunnan Electric Test & Research Institute Group Co., Ltd. The remaining authors declare that the research was conducted in the absence of any commercial or financial relationships that could be construed as a potential conflict of interest.
References
- Chen, Q.; Mei, K.; Dahlgren, R.A.; Wang, T.; Gong, J.; Zhang, M. Impacts of Land Use and Population Density on Seasonal Surface Water Quality Using a Modified Geographically Weighted Regression. Sci. Total Environ. 2016, 572, 450–466. [Google Scholar] [CrossRef] [PubMed]
- Le Moal, M.; Gascuel-Odoux, C.; Ménesguen, A.; Souchon, Y.; Étrillard, C.; Levain, A.; Moatar, F.; Pannard, A.; Souchu, P.; Lefebvre, A.; et al. Eutrophication: A New Wine in an Old Bottle? Sci. Total Environ. 2019, 651, 1–11. [Google Scholar] [CrossRef] [PubMed]
- Madyouni, H.; Almanza, V.; Benabdallah, S.; Joaquim-Justo, C.; Romdhane, M.S.; Habaieb, H.; Deliege, J.F. Assessment of Water Quality Variations and Trophic State of the Joumine Reservoir (Tunisia) by Multivariate Analysis. Water 2023, 15, 3019. [Google Scholar] [CrossRef]
- Chen, P.; Ye, G.; Xu, X.; Xi, W.; Xu, D. Water Environmental Capacity Analysis and Eutrophication Assessment of Water-Supplied Reservoirs. Desalination Water Treat. 2024, 317, 100200. [Google Scholar] [CrossRef]
- Wunderlin, D.A. The Suquía River Basin (Cordoba, Argentina): An Integrated Study on Its Hydrology, Pollution, Effects on Native Biota and Models to Evaluate Changes in Water Quality; Springer: Cham, Switzerland, 2018. [Google Scholar]
- Ogashawara, I.; Moreno-Madriñán, M.J. Improving inland water quality monitoring through remote sensing techniques. ISPRS Int. J. Geo-Inf. 2014, 3, 1234–1255. [Google Scholar] [CrossRef]
- Padedda, B.M.; Sechi, N.; Lai, G.G.; Mariani, M.A.; Pulina, S.; Sarria, M.; Satta, C.T.; Virdis, T.; Buscarinu, P.; Luglie, A. Consequences of eutrophication in the management of water resources in Mediterranean reservoirs: A case study of Lake Cedrino (Sardinia, Italy). Glob. Ecol. Conserv. 2017, 12, 21–35. [Google Scholar] [CrossRef]
- Vinçon-Leite, B.; Casenave, C. Modelling eutrophication in lake ecosystems: A review. Sci. Total Environ. 2019, 651, 2985–3001. [Google Scholar] [CrossRef] [PubMed]
- Glibert, P.M.; Al-Azri, A.; Icarus Allen, J.; Bouwman, A.F.; Beusen, A.H.W.; Burford, M.A.; Harrison, P.J.; Zhou, M. Key questions and recent research advances on harmful algal blooms in relation to nutrients and eutrophication. In Global Ecology and Oceanography of Harmful Algal Blooms; Springer: Cham, Switzerland, 2018; pp. 229–259. [Google Scholar]
- de Oliveira, T.F.; de Sousa Brandão, I.L.; Mannaerts, C.M.; Hauser-Davis, R.A.; de Oliveira, A.A.F.; Saraiva, A.C.F.; de Oliveira, M.A.; Ishihara, J.H. Using hydrodynamic and water quality variables to assess eutrophication in a tropical hydroelectric reservoir. J. Environ. Manag. 2020, 256, 109932. [Google Scholar] [CrossRef] [PubMed]
- Burkholder, J.M.; Kinder, C.A.; Dickey, D.A.; Reed, R.E.; Arellano, C.; James, J.L.; Mackenzie, L.M.; Allen, E.H.; Lindor, N.L.; Mathis, J.G.; et al. Classic indicators and diel dissolved oxygen versus trend analysis in assessing eutrophication of potable-water reservoirs. Ecol. Appl. 2022, 32, e2541. [Google Scholar] [CrossRef]
- Yan, H.Y.; Wang, G.Y.; Zhang, X.R.; Dong, J.H.; Shan, K.; Wu, D.; Huang, Y.; Zhou, B.T.; Su, Y.T. A fast method to evaluate water eutrophication. J. Cent. South Univ. 2016, 23, 3204–3216. [Google Scholar] [CrossRef]
- Joung, S.H.; Oh, H.M.; You, K.A. Dynamic variation of toxic and non-toxic Microcystis proportion in the eutrophic Daechung Reservoir in Korea. J. Microbiol. 2016, 54, 543–550. [Google Scholar] [CrossRef] [PubMed]
- Kornijów, R. Eutrophication and derivative concepts. Origins, compatibility and unresolved issues. Ecohydrol. Hydrobiol. 2023. [Google Scholar] [CrossRef]
- Keller, A.A.; Garner, K.; Rao, N.; Knipping, E.; Thomas, J. Hydrological models for climate-based assessments at the watershed scale: A critical review of existing hydrologic and water quality models. Sci. Total Environ. 2023, 867, 161209. [Google Scholar] [CrossRef] [PubMed]
- Patil, P.N.; Sawant, D.V.; Deshmukh, R.N. Physico-chemical parameters for testing of water–A review. Int. J. Environ. Sci. 2012, 3, 1194–1207. [Google Scholar]
- Staley, C.; Unno, T.; Gould, T.J.; Jarvis, B.; Phillips, J.; Cotner, J.B.; Sadowsky, M.J. Application of Illumina next-generation sequencing to characterize the bacterial community of the Upper Mississippi River. J. Appl. Microbiol. 2013, 115, 1147–1158. [Google Scholar] [CrossRef] [PubMed]
- Song, W.; Yinglan, A.; Wang, Y.; Fang, Q.; Tang, R. Study on remote sensing inversion and temporal-spatial variation of Hulun lake water quality based on machine learning. J. Contam. Hydrol. 2023, 260, 104282. [Google Scholar] [CrossRef] [PubMed]
- Nagatomo, Y.; Horii, S.; Hirai, J.; Hashihama, F.; Sado, T.; Fukuchi, T.; Miya, M.; Takahashi, K. Geographic distribution of micronektonic fish communities in the subtropical North Pacific: The effect of primary productivity and nitrogen fixation. Prog. Oceanogr. 2023, 217, 103086. [Google Scholar] [CrossRef]
- Gharaghani, M.A.; Mohammadpour, A.; Keshtkar, M.; Azhdarpoor, A.; Khaksefidi, R. Quality evaluation and health risk assessment of drinking water in Minab County: Hydrochemical analysis and artificial neural network modeling. Environ. Sci. Water Res. Technol. 2024, 10, 250–262. [Google Scholar] [CrossRef]
- Vu, C.T.; Zahrani, A.A.; Duan, L.; Wu, T. A Glass-Fiber-Optic Turbidity Sensor for Real-Time In Situ Water Quality Monitoring. Sensors 2023, 23, 7271. [Google Scholar] [CrossRef]
- Park, J.; Kim, K.T.; Lee, W.H. Recent advances in information and communications technology (ICT) and sensor technology for monitoring water quality. Water 2020, 12, 510. [Google Scholar] [CrossRef]
- Rose, L.; Mary, X.A.; Karthik, C. Integration of sensors for dam water quality analysis–a prototype. Water Sci. Technol. 2021, 84, 2842–2856. [Google Scholar] [CrossRef] [PubMed]
- Liu, C.; Li, H.; Zhang, Q. Research on sewage monitoring and water quality prediction based on wireless sensors and support vector machines. Wirel. Commun. Mob. Comput. 2020, 2020, 8852965. [Google Scholar] [CrossRef]
- GB/T 5750; Standard Examination Methods for Drinking Water. SAMR&SAC: Beijing, China, 2023. (In Chinese)
- HJ 353-2019; Technical Specification for Installation of Wastewater On-Line Monitoring System (CODcr, NH3-N; et al.). MEE: Beijing, China, 2023. (In Chinese)
- Carlson, R.E. A trophic state index for lakes 1. Limnol. Oceanogr. 1977, 22, 361–369. [Google Scholar] [CrossRef]
- Burns, N.M.; Rutherford, J.C.; Clayton, J.S. A monitoring and classification system for New Zealand lakes and reservoirs. Lake Reserv. Manag. 1999, 15, 255–271. [Google Scholar] [CrossRef]
- Trifonova, T.A.; Chesnokova, S.M.; Savelyev, O.V. Assessment of the Level of Trophic and Self-Cleaning Capacity of a Small Watercourse by Hydrochemical Indicators (on the Example of the Rpen River). South Russ. Ecol. Dev. 2021, 16, 88–97. [Google Scholar] [CrossRef]
- Liu, H.; He, B.; Zhou, Y.; Kutser, T.; Toming, K.; Feng, Q.; Yang, X.; Fu, C.; Yang, F.; Li, W.; et al. Trophic state assessment of optically diverse lakes using Sentinel-3-derived trophic level index. Int. J. Appl. Earth Obs. Geoinf. 2022, 114, 103026. [Google Scholar] [CrossRef]
- Wang, H.; Wang, Y.; Liu, W. Study on eutrophication control for south lake in Changchun. Chin. Geogr. Sci. 1995, 5, 265–274. [Google Scholar] [CrossRef]
- Qin, B. Lake eutrophication: Control countermeasures and recycling exploitation. Ecol. Eng. 2009, 35, 1569–1573. [Google Scholar] [CrossRef]
- Xu, J.; Huang, Y.; Li, Z.; Ni, S.; Huang, F.; Jia, J. Demonstration study of bypass stabilization pond system in the treatment of eutrophic water body. Water Sci. Technol. 2022, 85, 2601–2612. [Google Scholar] [CrossRef]
- Cornes, M.P. Exogenous sample contamination. Sources and interference. Clin. Biochem. 2016, 49, 1340–1345. [Google Scholar] [CrossRef]
- Ma, G.; Wang, S. Temporal and spatial distribution changing characteristics of exogenous pollution load into Dianchi Lake, Southwest of China. Environ. Earth Sci. 2015, 74, 3781–3793. [Google Scholar] [CrossRef]
- HJ/T 91-2002; Technical Specifications Requirements for Monitoring of Surface Water and Waste Water. SEPA: Beijing, China, 2002. (In Chinese)
- Nanjing Institute of Geography & Limnology Chinese Academy of Sciences. Technical Regulations for Lake Surveys; Science Press: Beijing, China, 2015; pp. 58–80. (In Chinese) [Google Scholar]
- Editional Board of Water and Wastewater Monitoring and Analysis Methods; Ministry of Environmental Potection of the People’s Republic of China. Water and Wastewater Monitoring and Analysis Methods, 4th ed.; China Environmental Science Press: Beijing, China, 2002; pp. 105–610. (In Chinese) [Google Scholar]
- Jin, X.C.; Tu, Q.Y. Lake Eutrophication Survey Specification, 2nd ed.; China Environmental Science Press: Beijing, China, 1990. (In Chinese) [Google Scholar]
- Cloem, I. First generation evaluation: An overview of its practice and a discussion of its present state. Am. J. Eval. 2001, 22, 257–273. [Google Scholar]
- Wang, S.T.; Lei, J.S.; Jia, H.Y.; Yang, C.G. Characteristics of Phytoplankton Community and Eutrophication Evaluation of the Three Gorges Reservoir. Ecol. Environ. Monit. Three Gorges 2020, 5, 32–41, (In Chinese with English Abstract). [Google Scholar]
- GB 3838-2002; Environmental Quality Standards for Surface Water. China Environmental Science Press: Beijing, China, 2002.
- Beretta-Blanco, A.; Carrasco-Letelier, L. Relevant factors in the eutrophication of the Uruguay River and the Río Negro. Sci. Total Environ. 2021, 761, 143299. [Google Scholar] [CrossRef]
- Chen, K.; Duan, L.; Liu, Q.; Zhang, Y.; Zhang, X.; Liu, F.; Zhang, H. Spatiotemporal changes in water quality parameters and the eutrophication in Lake Erhai of Southwest China. Water 2022, 14, 3398. [Google Scholar] [CrossRef]
- Yan, G.; Yin, X.; Wang, X.; Zhang, Y.; Wang, E.; Yu, Z.; Ma, X.; Huang, M. Effects of Summer and Autumn Drought on Eutrophication and the Phytoplankton Community in Dongting Lake in 2022. Toxics 2023, 11, 822. [Google Scholar] [CrossRef]
- Zeng, Y.; Chang, F.; Wen, X.; Duan, L.; Zhang, Y.; Liu, Q.; Zhang, H. Seasonal variation in the water quality and eutrophication of Lake Xingyun in Southwestern China. Water 2022, 14, 3677. [Google Scholar] [CrossRef]
- Zhang, L.; Liu, X.; Duddleston, K.; Hines, M.E. The effects of pH, temperature, and humic-like substances on anaerobic carbon degradation and methanogenesis in ombrotrophic and minerotrophic Alaskan peatlands. Aquat. Geochem. 2020, 26, 221–244. [Google Scholar] [CrossRef]
- Zhang, W.; Wan, W.; Lin, H.; Pan, X.; Lin, L.; Yang, Y. Nitrogen rather than phosphorus driving the biogeographic patterns of abundant bacterial taxa in a eutrophic plateau lake. Sci. Total Environ. 2022, 806, 150947. [Google Scholar] [CrossRef]
- Jia, J.; Xiao, H.; Peng, S.; Zhang, K. Study on Purification Efficiency of Novel Aquatic Plant Combinations and Characteristics of Microbial Community Disturbance in Eutrophic Water Bodies. Water 2023, 15, 2586. [Google Scholar] [CrossRef]
- Ma, H.; Li, Y.; Xu, D.; Tian, H.; Yang, H. Decontamination of multiple pollutants from eutrophic river water using iron-modification carbon/zeolite. J. Soils Sediments 2022, 22, 2329–2342. [Google Scholar] [CrossRef]
- Wei, H.; Wang, Y.; Liu, J.; Cao, Y.; Zhang, X. Spatiotemporal Variations of Water Eutrophication and Non-Point Source Pollution Prevention and Control in the Main Stream of the Yellow River in Henan Province from 2012 to 2021. Sustainability 2023, 15, 14754. [Google Scholar] [CrossRef]
- Cashel, F.S.; Knightes, C.D.; Lupo, C.; Iott, T.; Streich, K.; Conville, C.J.; Bridges, T.W.; Dombroski, I. Using monitoring and mechanistic modeling to improve understanding of eutrophication in a shallow New England estuary. J. Environ. Manag. 2024, 355, 120478. [Google Scholar] [CrossRef]
- Nguyen, T.T.; Némery, J.; Gratiot, N.; Strady, E.; Tran, V.Q.; Nguyen, A.T.; Aimé, J.; Peyne, A. Nutrient dynamics and eutrophication assessment in the tropical river system of Saigon–Dongnai (southern Vietnam). Sci. Total Environ. 2019, 653, 370–383. [Google Scholar] [CrossRef] [PubMed]
- Cormier, J.M.; Coffin, M.R.; Pater, C.C.; Knysh, K.M.; Gilmour, R.F., Jr.; Guyondet, T.; Courtenay, S.C.; van den Heuvel, M.R. Internal nutrients dominate load and drive hypoxia in a eutrophic estuary. Environ. Monit. Assess. 2023, 195, 1211. [Google Scholar] [CrossRef]
- Norris, B.; Laws, E.A. Nutrients and phytoplankton in a shallow, hypereutrophic urban lake: Prospects for restoration. Water 2017, 9, 431. [Google Scholar] [CrossRef]
- Hu, E.; Hu, L.; Zheng, Y.; Wu, Y.; Wang, X.; Sun, C.; Su, Y. Bacterial abundance and community structure in response to nutrients and photodegraded terrestrial humic acids in a eutrophic lake. Environ. Sci. Pollut. Res. 2022, 29, 8218–8231. [Google Scholar] [CrossRef]
- Zhang, J.; Kainz, M.J.; Wang, X.; Tan, X.; Zhang, Q. Eutrophication and loss of riparian shading influence food quality and trophic relation in stream food webs. Water Res. 2024, 249, 120926. [Google Scholar] [CrossRef]
- Jia, Y.; Chen, W.; Zuo, Y.; Lin, L.; Song, L. Heavy metal migration and risk transference associated with cyanobacterial blooms in eutrophic freshwater. Sci. Total Environ. 2018, 613–614, 1324–1330. [Google Scholar] [CrossRef]
- Wang, J.; Yuan, S.; Tang, L.; Pan, X.; Pu, X.; Li, R.; Shen, C. Contribution of heavy metal in driving microbial distribution in a eutrophic river. Sci. Total Environ. 2020, 712, 136295. [Google Scholar] [CrossRef]
- Wang, Y.; Wang, Y.; Zhang, W.; Yao, X.; Wang, B.; Wang, Z. Spatiotemporal changes of eutrophication and heavy metal pollution in the inflow river system of Baiyangdian after the establishment of Xiongan New Area. PeerJ 2022, 10, e13400. [Google Scholar] [CrossRef]
- Xing, W.; Wu, H.; Hao, B.; Huang, W.; Liu, G. Bioaccumulation of heavy metals by submerged macrophytes: Looking for hyperaccumulators in eutrophic lakes. Environ. Sci. Technol. 2013, 47, 4695–4703. [Google Scholar] [CrossRef]
- Pinardi, M.; Free, G.; Lotto, B.; Ghirardi, N.; Bartoli, M.; Bresciani, M. Exploiting high frequency monitoring and satellite imagery for assessing chlorophyll-a dynamics in a shallow eutrophic lake. J. Limnol. 2021, 80, 1–16. [Google Scholar] [CrossRef]
- Youssef, M.; El-Tanany, S.S.; Moatasim, Y.; Moniem, S.M.A.; Hemdan, B.A.; Ammar, N.S.; El-Taweel, G.E.; Ashmawy, A.M.; Badawy, M.I.; Lasheen, M.R.; et al. Assessment of toxicity and antimicrobial performance of polymeric inorganic coagulant and evaluation for eutrophication reduction. Sci. Rep. 2024, 14, 3391. [Google Scholar] [CrossRef] [PubMed]
- Jenhani, A.B.R.; Fathalli, A.; Djemali, I.; Changeux, T.; Romdhane, M.S. Tunisian reservoirs: Diagnosis and biological potentialities. Aquat. Living Resour. 2019, 32, 17. [Google Scholar] [CrossRef]
- Wang, H.; Wan, X.; Wang, S.; Xia, L.; Song, Y. Assessment of Eutrophication Characteristics and Evaluation of the First-Generation Eutrophication Model in the Nearshore Waters of Shantou City. Sustainability 2023, 15, 14866. [Google Scholar] [CrossRef]
- Leng, M.; Feng, L.; Wu, X.; Ge, X.; Lin, X.; Song, S.; Xu, R.; Sun, Z. Assessment of Water Eutrophication at Bao’an Lake in the Middle Reaches of the Yangtze River Based on Multiple Methods. Int. J. Environ. Res. Public Health 2023, 20, 4615. [Google Scholar] [CrossRef]
- Nguyen, H.Q.; Ha, N.T.; Pham, T.L. Inland harmful cyanobacterial bloom prediction in the eutrophic Tri An Reservoir using satellite band ratio and machine learning approaches. Environ. Sci. Pollut. Res. 2020, 27, 9135–9151. [Google Scholar] [CrossRef]
- Bilgin, A. Trophic state and limiting nutrient evaluations using trophic state/level index methods: A case study of Borçka Dam Lake. Environ. Monit. Assess. 2020, 192, 794. [Google Scholar] [CrossRef]
- Wu, H.; Wang, R.; Yan, P.; Wu, S.; Chen, Z.; Zhao, Y.; Cheng, C.; Hu, Z.; Zhuang, L.; Guo, Z.; et al. Constructed wetlands for pollution control. Nat. Rev. Earth Environ. 2023, 4, 218–234. [Google Scholar] [CrossRef]
- Murakami, K. Dredging for controlling eutrophication of Lake Kasumigaura, Japan. Lake Reserv. Manag. 1984, 1, 592–598. [Google Scholar] [CrossRef]
- Zhang, R.; Zeng, F.X.; Liu, W.J.; Zeng, R.J.; Jiang, H. Precise and economical dredging model of sediments and its field application: Case study of a river heavily polluted by organic matter, nitrogen, and phosphorus. Environ. Manag. 2014, 53, 1119–1131. [Google Scholar] [CrossRef] [PubMed]
- Mundahl, N.D.; Hoisington, J. Game fish response to dredging of a eutrophic urban lake in Minnesota. Lake Reserv. Manag. 2021, 37, 170–185. [Google Scholar] [CrossRef]
- Sonawane, J.M.; Rai, A.K.; Sharma, M.; Tripathi, M.; Prasad, R. Microbial biofilms: Recent advances and progress in environmental bioremediation. Sci. Total Environ. 2022, 824, 153843. [Google Scholar] [CrossRef]
- Syed, Z.; Sogani, M.; Rajvanshi, J.; Sonu, K. Microbial biofilms for environmental bioremediation of heavy metals: A review. Appl. Biochem. Biotechnol. 2023, 195, 5693–5711. [Google Scholar] [CrossRef] [PubMed]
- Kong, L.; Wang, L.; Wang, Q.; Mei, R.; Yang, Y. Study on new artificial floating island removing pollutants. Environ. Sci. Pollut. Res. 2019, 26, 17751–17761. [Google Scholar] [CrossRef]
- Allami, M.H.; Whelan, M.J.; Boom, A.; Harper, D.M. Ammonia Removal in Free-Surface Constructed Wetlands Employing Synthetic Floating Islands: Employing synthetic floating islands. Baghdad Sci. J. 2021, 18, 0253. [Google Scholar] [CrossRef]
- He, H.; Ning, X.; Chen, K.; Li, Q.; Li, K.; Liu, Z.; Jeppesen, E. Intraguild predation dampens trophic cascades in shallow aquatic mesocosms in the subtropics: Implications for lake restoration by biomanipulation. Freshw. Biol. 2021, 66, 1571–1580. [Google Scholar] [CrossRef]
- Rezania, S.; Kamyab, H.; Rupani, P.F.; Park, J.; Nawrot, N.; Wojciechowska, E.; Yadav, K.K.; Ghahroud, M.L.; Mohammadi, A.A.; Thirugnana, S.T.; et al. Recent advances on the removal of phosphorus in aquatic plant-based systems. Environ. Technol. Innov. 2021, 24, 101933. [Google Scholar] [CrossRef]
Figure 1.
Geographical location of Waihu reservoir and distribution of sampling points.

Figure 2.
The variations in DO, CODMn, COD, and BOD5 at different monitoring points in Waihu Reservoir.
Figure 2.
The variations in DO, CODMn, COD, and BOD5 at different monitoring points in Waihu Reservoir.

Figure 3.
The variations of TN, TP, and NH3-N at different monitoring points in Waihu Reservoir.

Figure 4.
The variations of chlorophyll-a and fecal coliforms at different monitoring points in Waihu Reservoir.
Figure 4.
The variations of chlorophyll-a and fecal coliforms at different monitoring points in Waihu Reservoir.


Table 1.
Comparison of eutrophication indicators in lakes (reservoirs) where algal blooms have occurred worldwide.
Table 1.
Comparison of eutrophication indicators in lakes (reservoirs) where algal blooms have occurred worldwide.
| Name of the Lake (Reservoir) | Time | TN (mg/L) | TP (mg/L) |
|---|---|---|---|
| Tri An [67] | 2016~2018 (Annual average) | 0.25~1.30 | 0.05~0.14 |
| Bao’an Lake [66] | 2018~2020 (Annual average) | 0.48~1.2 | 0.029~0.069 |
| Neuse [11] | 1985~1990 (Annual average) | 0.60~3.128 | 0.041~0.397 |
| Waihu | 2013 | 1.48~1.66 | 0.021~0.027 |
Table 2.
The scoring and classification criteria for eutrophication in lakes (reservoirs).
| The Trophic Status | Scoring Value | Parameter | ||||
|---|---|---|---|---|---|---|
| Chla (mg/m3) | TP (mg/L) | TN (mg/L) | COD (mg/L) | SD (m) | ||
| Oligotrophic | 10 | 0.5 | 0.001 | 0.02 | 0.15 | 10 |
| 20 | 1.0 | 0.004 | 0.05 | 0.4 | 5.0 | |
| Mesotrophic | 30 | 2.0 | 0.010 | 0.10 | 1.0 | 3.0 |
| 40 | 4.0 | 0.025 | 0.30 | 2.0 | 1.50 | |
| 50 | 10.0 | 0.050 | 0.50 | 4.0 | 1.0 | |
| Eutrophic | 60 | 26.0 | 0.10 | 1.0 | 8.0 | 0.5 |
| 70 | 64.0 | 0.20 | 2.0 | 10.0 | 0.4 | |
| 80 | 160.0 | 0.60 | 6.0 | 25.0 | 0.3 | |
| 90 | 400.0 | 0.90 | 9.0 | 40.0 | 0.2 | |
| 100 | 1000 | 1.30 | 16.0 | 60.0 | 0.12 | |
Table 3.
The calculation results of the trophic status of the Waihu Reservoir according to the M value method.
Table 3.
The calculation results of the trophic status of the Waihu Reservoir according to the M value method.
| Chla (mg/m3) | TP (mg/L) | TN (mg/L) | COD (mg/L) | SD (m) | M | |
|---|---|---|---|---|---|---|
| Waihu Reservoir | 8.54 | 0.025 | 1.58 | 5.73 | 2.29 | 48.5 |
Table 4.
The calculation results of the trophic status of Waihu Reservoir using the TLI value method.
Table 4.
The calculation results of the trophic status of Waihu Reservoir using the TLI value method.
| Name of Reservoir | Chla (mg/m3) | TN (mg/L) | TP (mg/L) | SD (m) | CODMn (mg/L) | TLI |
|---|---|---|---|---|---|---|
| Waihu Reservoir | 8.54 | 1.58 | 0.025 | 2.29 | 2.03 | 40.58 |
Table 5.
Comparison of advantages and disadvantages of various engineering measures.
| Engineering Measure | Advantage | Disadvantage |
|---|---|---|
| Sediment dredging | Quickly and effectively reduces nutrient load | It has a great influence on sediment organisms and benthos organisms. |
| Deep-water aeration | Promotes sediment decomposition and removal | High energy input. |
| Water dilution | Simple, easy, and low-cost | May cause drastic changes in water quality. |
| Plastic film coverage | Effectively reduces the release of nutrients | It has a large effect on sediment organisms and benthic organisms and requires regular replacement and maintenance. |
Disclaimer/Publisher’s Note: The statements, opinions and data contained in all publications are solely those of the individual author(s) and contributor(s) and not of MDPI and/or the editor(s). MDPI and/or the editor(s) disclaim responsibility for any injury to people or property resulting from any ideas, methods, instructions or products referred to in the content. |
© 2024 by the authors. Licensee MDPI, Basel, Switzerland. This article is an open access article distributed under the terms and conditions of the Creative Commons Attribution (CC BY) license (https://creativecommons.org/licenses/by/4.0/).
Share and Cite
MDPI and ACS Style
Qi, Y.; Cao, X.; Cao, R.; Cao, M.; Yan, A.; Li, E.; Xu, D. Research on the Analysis of and Countermeasures for the Eutrophication of Water Bodies: Waihu Reservoir as a Case Study. Processes 2024, 12, 796. https://doi.org/10.3390/pr12040796
AMA Style
Qi Y, Cao X, Cao R, Cao M, Yan A, Li E, Xu D. Research on the Analysis of and Countermeasures for the Eutrophication of Water Bodies: Waihu Reservoir as a Case Study. Processes. 2024; 12(4):796. https://doi.org/10.3390/pr12040796
Chicago/Turabian StyleQi, Yiting, Xin Cao, Ruisi Cao, Mingjie Cao, Ailan Yan, Erpeng Li, and Dong Xu. 2024. "Research on the Analysis of and Countermeasures for the Eutrophication of Water Bodies: Waihu Reservoir as a Case Study" Processes 12, no. 4: 796. https://doi.org/10.3390/pr12040796
Note that from the first issue of 2016, this journal uses article numbers instead of page numbers. See further details here.