
Optimizing Pneumonia Diagnosis Using RCGAN-CTL: A Strategy for Small or Limited Imaging Datasets

1
Center for Advanced Jet Engineering Technologies (CaJET), Key Laboratory of High-Efficiency and Clean Mechanical Manufacture (Ministry of Education), National Experimental Teaching Demonstration Center for Mechanical Engineering (Shandong University), School of Mechanical Engineering, Shandong University, Jinan 250061, China
2
School of Mechanical and Automotive Engineering, Qingdao University of Technology, Qingdao 266520, China
3
Relay Protection Institute, School of Electrical Engineering, Shandong University, Jinan 250061, China
*
Author to whom correspondence should be addressed.
Processes 2024, 12(3), 548; https://doi.org/10.3390/pr12030548
Submission received: 20 January 2024
/
Revised: 11 February 2024
/
Accepted: 12 February 2024
/
Published: 11 March 2024
(This article belongs to the Special Issue Application of Artificial Intelligence in Medical Assisted Decision System)
Abstract
:In response to the urgent need for efficient pneumonia diagnosis—a significant health challenge that has been intensified during the COVID-19 era—this study introduces the RCGAN-CTL model. This innovative approach combines a coupled generative adversarial network (GAN) with relativistic and conditional discriminators to optimize performance in contexts with limited data resources. It significantly enhances the efficacy of small or incomplete datasets through the integration of synthetic images generated by an advanced RCGAN. Rigorous evaluations using a wide range of lung X-ray images validate the model’s effectiveness. In binary classification tasks that differentiate between normal and pneumonia cases, RCGAN-CTL demonstrates exceptional accuracy, exceeding 99%, with an area under the curve (AUC) of around 95%. Its capabilities extend to a complex triple classification task, accurately distinguishing between normal, viral pneumonia, and bacterial pneumonia, with precision scores of 89.9%, 95.5%, and 90.5%, respectively. A notable improvement in sensitivity further evidences the model’s robustness. Comprehensive validation underscores RCGAN-CTL’s superior accuracy and reliability in both binary and triple classification scenarios. This advancement is pivotal for enhancing deep learning applications in medical diagnostics, presenting a significant tool in addressing the challenges of pneumonia diagnosis, a key concern in contemporary healthcare.
1. Introduction
Pneumonia, a respiratory infection characterized by lung dysfunction and potentially severe complications, such as coughing and chest tightness, was notably exacerbated by the emergence of a novel coronavirus in Wuhan, China, in 2019. Though originally confined to mammals, the virus spread rapidly and triggered a global pandemic that, as of 5 January 2023, has resulted in over 657 million confirmed COVID-19 cases and 6.67 million deaths worldwide. The neo-coronavirus’s swift propagation has placed enormous strain on healthcare systems worldwide, with diverse recombinant subtype variants rapidly proliferating. This trend has corresponded with an alarming rise in COVID-19-related viral and bacterial pneumonia, with one in five patients contracting respiratory ailments [1]. Elderly individuals and those with underlying medical conditions face a greater risk of pneumonia contraction. To address this critical health challenge, there is a need for efficient and convenient tools that offer low-cost, reliable, and effective treatment options for pneumonia screening and post-recovery evaluations.
Generally, radiologic image-based scanning techniques are utilized to diagnose inflammatory lung diseases. Different researchers have proposed diverse artificial intelligence (AI) solutions for images. ShowKat et al. [2] applied a transfer learning (TL) approach to extract pneumonia features by transferring information between individual domains and fine-tuning additional layers, such as the BN layer in the pre-trained network of TL, ResNet, to achieve fast and stable operation of the network. Chakraborty et al. [3] employed pre-trained VGG-19 deep learning architecture to classify various types of chest pneumonia X-ray images, using MongoDB as a database for storing images and categories. Avola et al. [4] conducted a study on 12 ImageNet pre-trained models to differentiate X-rays of healthy individuals from those of pneumonia patients to demonstrate that the existing architecture can effectively diagnose pneumonia. The study also employed the Grad-CAM algorithm for visualization and analysis. Manickam et al. [5] developed an approach based on segmenting chest X-ray images with the U-Net architecture to identify pneumonia and further employed the ImageNet dataset model to determine whether pneumonia is abnormal or not. Both Adam and SGD optimizers were used for batch analysis to extract features more efficiently, and the results showed that the accuracy of the ResNet50 model was significantly higher than that of the other models. Mamalakis et al. [6] developed a novel transfer learning network called DenResCov-19, which was developed using a CNN block with an additional layer that connects the DenseNet-121 and ResNet-50 networks, an approach that effectively compares the two competing network scenarios. The network has produced excellent results in classification problems for class II (healthy and pneumonia), class III (COVID-19, pneumonia, healthy), and class IV (COVID-19, pneumonia, healthy, TB). Lovey et al. [7] also used conditional generative adversarial network (CGAN) synthetic images directly as a dataset to participate in resnet50 model training, although due to CGAN one-time image generation, there are issues with feature fixation and overfitting, resulting in an accuracy of only 82.91% in identifying neo-crown pneumonia. Kaderuppan et al. [8] proposed a novel deep collaborative network called O-Net, which improves the quality of images (contrast and resolution) by simultaneously learning phase information and image features. Ayan et al. [9] used two convolutional networks, Xception and Vgg16, to diagnose pneumonia. Transfer learning and fine-tuning methods were used during the training process, and the results showed that the Xception network achieved better performance. Hammoudi et al. [10] used four different deep-learning models to diagnose pneumonia and compared their performance using ACC and F1-score. The DenseNet-121 model performed the best on ACC, achieving 94%, while the Xception model performed the best on the F1-score, achieving 93%. A classification method for chest X-rays using pre-trained CNN models and transfer learning techniques was proposed by Luján-García, et al. [11] Furthermore, a gradient-based class activation mapping (Grad-CAM) algorithm was employed to visualize the output of the CNN model and display the potential locations of pneumonia.
In addition to the aforementioned research findings, transfer learning [12] has displayed extensive applicability in various fields. Nonetheless, transfer learning fails to attain normal training outcomes in small datasets, particularly in scenarios where data is missing and has a significant likelihood of resulting in classification failure. To tackle this issue, a novel dataset enhancement method coupled GAN with relativistic discriminators and conditional transfer learning (RCGAN-CTL) is proposed, which enables the compensation of small or missing data samples in transfer learning. RCGAN, a network designed by Li [13] to merge infrared and visible images, is utilized in this study to investigate an enhanced RCGAN network that is applied to the medical imaging domain. The enhanced RCGAN network is employed in the data generation module to produce high-quality synthetic images, while the data classification module uses a CTL structure with suitable image complementary datasets participating in the transfer learning training. The primary advantages of the RCGAN-CTL approach are summarized below.
- (1)
- The quality of synthesized images is significantly enhanced by utilizing an enhanced RCGAN for data generation, which allows for the fusion of synthetic images belonging to the same category but possessing distinct characteristics through the input of a random vector and additional condition vectors.
- (2)
- CTL benefits from the use of the pre-training network to restrict the input transfer learning images and ensure the quality of synthetic images involved in training. Furthermore, transfer learning can update the parameters of the pre-training network to dynamically alter the conditional restrictions.
- (3)
- The RCGAN model is not simply linked to the CTL model, and the parameter update of CTL impacts the update of the random vector of RCGAN, resulting in more pliable and diverse features of the generated images in each cycle and reducing the overfitting phenomenon of the training process.
2. Theoretical Background
2.1. Conditional Generative Adversarial Networks
In this paper, RCGAN incorporates a conditional vector that is akin to CGAN [14]. However, RCGAN differentiates itself by enabling the network to generate specific, high-quality synthetic images by stacking generators and discriminators on top of the original architecture. The RCGAN model is comprised of D1 and D2 discriminators and G1 and G2 generators, which serve as its primary components. The coupled generators produce compliant data for fusion, whereas the coupled relativistic discriminators assess the similarity between the synthetic and real data. The discriminator and generator components engage in a reciprocal relationship. Here, the coupled generator employs feature fusion techniques to create enhanced images. Simultaneously, the coupled relativistic discriminator evaluates these images, guiding the process by identifying differences between the synthetic and authentic images.
Assuming that x represents the real data distribution and y represents a random noise vector, we can derive the subsequent objective function for GAN [15]:
in this context, signifies the expected value over the distribution of the true data, indicating an operation over the real, authentic data samples. Conversely, represents the expected value over the distribution of noise-generated data, referring to the operations performed on synthetic or artificially generated data samples. D(x) is the data produced by the generator, and G(y) denotes the discriminative output of the G network for the D network. To introduce an extra conditional vector z in the CGAN, it is imperative to merge z with both x and y. This process culminates in the CGAN [14] objective function:
when it comes to handling complex and intricate data types like images, CGAN holds an edge over GAN. This is because CGAN has the ability to govern data in compliance with conditional information, leading to greater flexibility in image processing.
Assuming two generators, G1 and G2, and two discriminators, D1 and D2, by incorporating supplementary conditional vectors z and ensuring that they all adhere to the minimum–maximum standard mutual constraint, the objective function of RCGAN can be expressed as follows:
in comparison to GAN, the improved RCGAN employs a coupled network to integrate diverse high-level features, mutually reinforcing one another to produce images with varying degrees of quality, from “normal” to “very high”, thereby endowing the synthetic images with multiple characteristics akin to those of genuine images.
2.2. Conditional Transfer Learning Based on Shared Parameters
The proposed conditional transfer learning method relies on shared parameters and aims to identify the common parameters or prior distributions between the models of the source and target data spaces. To achieve this objective, a pre-trained model is used as a screening condition, and transfer learning is employed. Specifically, the ImageNet pre-trained model is retrained using real image datasets while retaining the model parameters and setting the conditional pass function to complete the initialization setting of the screening module. During the pre-training phase, synthetic data is input into the TL network together with the real data to extract generic features. In the fine-tuning phase of the TL model, the model is fine-tuned to satisfy the data distribution for the target task.
Assuming that xi is the ith input sample and yi is the ith label, represents the predicted output of xi, and the loss function of the target can be obtained. In this context, represents the weights of the model, which are crucial parameters determining how the model processes and transforms the input data to make predictions. The objective function of the pre-training stage can be obtained by adding the regularization coefficient λ and the model parameter w1 to the loss function:
the objective function formula for the fine-tuning stage can be obtained by modifying the objective function of the pre-training stage with the introduction of a regularization coefficient denoted as lambda two and a modified model parameter represented by w2.
to enable the shared parameters to move in the direction of minimizing the loss function through the gradient descent algorithm, the formula requires extension and modification tailored to the specific tasks and models. Once the training is complete, the model parameters from the fine-tuning phase are transferred to the pre-training network, with the conditional screening network facilitating parameter updating.
3. Proposed Method
This paper proposes a method for image classification diagnosis in cases of missing or small datasets using a theoretical approach discussed in the previous subsection. The framework consists of a data generation module and a disease diagnosis module.
Traditionally, diagnosing diseases like pneumonia involves analyzing a large number of chest X-rays to identify patterns. However, gathering such a large number of images can be challenging due to patient privacy concerns. Extracting features from small batches of data has become more common in recent years, often with problems such as data deficiencies. The RCGAN-CTL approach has been adopted, with the data generation module introducing the enhanced coupled GAN with relativistic discriminators (RCGAN). In simpler terms, this module generates new X-ray images that are not real but are realistic enough to be used for training the model. In this study, the RCGAN has been adapted to better suit medical images by enhancing its complexity and capability to create more detailed synthetic images. The generator will use the similarities in images of the same class but with different features to generate a new image by combining the differences in the last layer. It essentially ‘learns’ from existing X-ray images to produce new ones that help in training the system. The relative discrimination guides the generator by comparing the relative differences between the two sets of real and synthetic images.
The disease diagnosis module incorporates conditional transfer learning (CTL) into its design, which helps the model learn more effectively from both real and synthetic images. The pre-training network generates synthetic images, which must score higher than 0.9 to be inputted into the TL network. The TL network is then trained after completing the pre-training, and the weight parameters are passed to the pre-training network to complete the update and optimize the input of random vectors in the RCGAN input layer. Each cycle populates the high-quality synthetic dataset into the real dataset of DL’s diagnostic classification, and the architecture is deployed based on data sharing. This enables the convolutional layer to extract spatial features from X-ray images while retaining the important weight parameters of the convolutional layer. This approach allows researchers to effectively use a smaller dataset of real X-rays by supplementing it with high-quality synthetic images. Ultimately, the RCGAN-CTL combination trained network achieves accurate prediction of X-ray category images from the defective dataset. Figure 1 depicts the network structure, where IS denotes the synthetic image, IR represents the real image, and ISP is the synthetic image generated by pre-training the network.
3.1. Experimental Data
The present study utilized a dataset sourced from Kermany et al. [16], who had DL models to analyze chest X-ray images. Specifically, the dataset comprised 5856 labeled chest X-ray images obtained from patients aged 1 to 5 years who were admitted to Guangzhou Women’s and Children’s Hospital. These images were segregated into two categories: Pneumonia and normal lung images. Of the total images, 1341 were normal lung images, while 3875 were images depicting lungs with pneumonia. The model constructed was trained using this dataset and subsequently tested using 227 normal images and 389 images of lungs affected by pneumonia. Notably, this study utilized a relatively small dataset that equivalently replaced the missing dataset commonly used in research.
A comprehensive data cleaning process was applied to the dataset from publicly available datasets by Kermany to ensure its quality and consistency. This involved removing irrelevant or low-quality images and standardizing image formats and resolutions, thereby refining the dataset to meet the specific research needs and enhancing model accuracy and reliability. The research employed this refined dataset for model training, complemented by an evaluation of an additional set of 227 normal and 389 pneumonia lung images. This methodology underscores the study’s commitment to employing rigorous data preparation and utilization strategies, aiming to achieve high-quality, research-specific data for precise model development and validation.
3.2. Data Pre-Processing
The complexity and variations present in the acquired images can be attributed to multiple factors, such as the scanning equipment used, working habits, and personal health. In addition, the images in the dataset may exhibit pixel non-uniformity issues. Therefore, to ensure uniformity in our proposed approach that employs a stacked network, it is crucial to preprocess the data.
To achieve this, the experiment executes a center crop pre-processing technique with the short edge of the image as the square’s edge length. This technique enables us to retain essential information from the original image. The next step involves scaling and resizing the image to 256 × 256 pixels and modifying the single-channel grayscale map into a three-channel image. Before commencing the formal training, we employ data augmentation methods such as flipping and rotating to simulate various forms of non-standard clinical images. This approach helps to ensure that the model is capable of effectively handling variations present in the dataset.
3.3. Data Generation Module
The coupled generator in this structure is designed to produce high-quality images with similar features to real images through the use of inverse convolution layers. These layers help to reduce the low-resolution input into a high-resolution output, with a filter size of 5 × 5. The generator is composed of two groups, each containing four deconvolution layers, three ReLU activation layers, three batch normalization layers, and a tanh layer composition. The input information is reprojected and reconstructed into a 4 × 4 × 1024 matrix, which is then input into the inverse convolution layers to generate an image. The step lengths in the convolution layers play a crucial role in the quality of the generated image. After optimization, the step lengths were set to 3, 2, 3, and 3, with the number of convolution kernels set to 256, 128, 64, and 3, respectively. To ensure comparability with the discriminator output for loss calculation, the image pixel range value of the generator is restricted to [−1, 1] using the tanh activation function. To further enhance joint learning of image features across multiple domains and reduce the amount of training data required, the weight parameters of the first two convolutional blocks are shared between the two generators. The structure of the coupled generator is illustrated in Figure 2.
The coupled relative discriminator consists primarily of five convolutional layers, three LeakyReLU activation layers, three batch normalization layers, and a LINEAR layer. The input data is an image with dimensions of 256 × 256 × 3, and each convolutional layer utilizes a 5 × 5 filter. An activation function of LeakyReLU is added following each convolutional layer to mitigate the gradient disappearance issue. The number of convolution kernels is 64, 128, 256, and 512 for the four convolutions, respectively. The final layer is a linear layer that transforms the flattened image features into an output value representing the similarity between the synthetic and real images. To decrease the quantity of required training data, the last two convolutional and linear layers share weight parameters. The structure of the coupled relativistic discriminator is presented in Figure 3.
3.4. Data Classification Module
The process of conditional transfer learning involves two phases, namely pre-training and transfer learning. The pre-training phase allows only eligible images to pass through, and the score of the corresponding category of the synthetic image should be greater than 0.9 to ensure that only high-quality synthetic images are used for training. This approach helps to improve the accuracy of the final model. The transfer learning phase partially completes the training and updates the pre-training network parameters. Transfer learning, which is composed of four main components, namely source and target domains, pre-trained models, fine-tuning techniques, and evaluation metrics, is used for this purpose. The ImageNet dataset is used as the source domain, while the target domain consists of the real dataset of chest X-ray and synthetic datasets. Common features extracted from the source domain are used for pre-training, and VGG19 is used for the target task, while AlexNet, ResNet18, and InceptionV3 are used to test the same dataset. This approach verifies that the RCGAN-CTL approach is broad-spectrum and generalizable and can be applied to different datasets and tasks. During the fine-tuning process, some layers are frozen to preserve the pre-training weight parameters, and the final fully connected layers are fine-tuned. The SoftmaxLayer and ClassificationLayer are cleaned up to adapt to the task in the target domain. The effectiveness of transfer learning is measured using evaluation metrics such as accuracy, recall, and F1-score. Additionally, roc curves and t-SNE downscaling are plotted to further evaluate the model’s performance, which can help with further optimization of the model and dataset.
4. Experiment Analysis
4.1. Experimental Setup
The experimental algorithms have been developed using the MATLAB R2022a software, with computer hardware configurations comprising a 12th generation Intel Core i9-12900KS 5.5 GHz CPU and NVIDIA GeForce RTX 3090 Ti GPU. The GPU consists of 10,752 CUDA cores, accelerated by cudnn with a maximum core frequency of 1860 MHz.
Throughout the training of the dataset, an array of data augmentation techniques were implemented to simulate a diverse range of clinical images. The MATLAB platform, especially its deep learning toolbox, played a crucial role in the generation of synthetic images. For the data generation module, the optimizer of choice was Adam [17], while for the data classification module, SGDM [18] was selected. The experiment was carried out with a miniBatchSize set to 256, a learnRate set to 0.0002, and a gradientDecayFactor of 0.5. The model underwent a total of three cycles of training, with the data generation module being trained for 10,000 epochs in each cycle and the data classification module being trained for 6 epochs in each cycle. Transfer learning training was conducted on 70% of the dataset designated as the training set, whilst the remaining 30% was utilized as the validation set. The experiment was performed with two classifications (normal/pneumonia) (viral pneumonia/bacterial pneumonia) and three classifications (normal/viral pneumonia/bacterial pneumonia), respectively. The diagram of the RCGAN used during the training process is presented in Figure 4. On the left side of the figure, we can see the sampling map, while the right side showcases the training process. Figure 5 displays the training graph for transfer learning based on VGG19. The accuracy of the training set is indicated by blue labels, while the cross-entropy loss of the training set is indicated by orange labels. Additionally, all validation sets are indicated by black labels represented by black dashed lines. To observe the trend curve, image normalization and smoothing of 0.6 were performed.
4.2. Performance Results
The RCGAN-CTL approach is characterized by its high scalability, facilitating the integration of the RCGAN data generation module with a variety of data classification models. In the validation of this approach’s generalizability across different models, the VGG19 model [19] was first trained and subsequently integrated with pre-trained transfer learning models, such as AlexNet [20], ResNet18 [21], and InceptionV3 [22], into the classification module. The optimal performance of the classification models was achieved through precise hyperparameter tuning.
Key metrics for the binary classification task (normal vs. pneumonia)—accuracy, precision, sensitivity, specificity, and F1-score—were computed from the confusion matrices, as visually represented in Figure 6. These metrics are crucial for evaluating the models’ performance. ROC curves were also constructed, and the AUC values were computed to discern the performance variations among the different neural networks. These variations are further detailed in the multifactor histograms shown in Figure 7, illustrating the results of the five metrics for each model.
Post-integration of the RCGAN data generation module with the dataset, it was observed that the accuracy of each classification model was notably high, each surpassing the 97% mark with commendable precision, sensitivity, and specificity. The F1-score remained consistently above 99.0%, reflecting a balanced measure of precision and sensitivity across the models. The AUC values, consistently around 95.0%, indicate the reliability and effectiveness of the classifiers. An in-depth evaluation of the five metrics suggests that the RCGAN-CTL approach exhibits significant generalizability, with the trained models showing ample accuracy and stability, thus, confirming the method’s efficacy without overfitting.
To assess the efficacy of RCGAN-CTL on multi-classification networks, VGG19 was trained using the RCGAN-CTL approach and, without it, employing the original dataset, as depicted in Figure 8. The confusion matrix was generated using the validation set, indicating a significant improvement in the model’s accuracy after implementing RCGAN-CTL. The existence of similar overlapping features between viral pneumonia and bacterial pneumonia [23] can result in the misidentification of images when VGG is trained directly with the original data, as shown in Figure 8a, where a considerable portion of viral pneumonia classification produces errors. However, the implementation of the RCGAN-CTL method has led to better performance. A comparison between Figure 8a,b shows that the accuracy has improved from 88.1% to 96.1%, and the precision of normal lungs, bacterial pneumonia, and viral pneumonia has increased from 75.8%, 94.2%, and 82.3% to 89.9%, 95.5%, and 90.5%, respectively. Additionally, the sensitivity has risen from 96.6%, 89.8%, and 65.8% to 97.6%, 92.8%, and 84.2%, resulting in improved F1-score values from 84.9%, 91.9%, and 73.2% to 93.6%, 94.1%, and 87.2%. The findings reveal that utilizing the RCGAN-CTL method can enhance the model’s ability to achieve accuracy, classification effectiveness, and stability in multiclassification tasks.
The ROC curves presented in Figure 9 depict the performance of the VGG19 models when utilizing the RCGAN-CTL method for both the dichotomous and trichotomous tasks. In Figure 9, the ROC curves for the VGG19 models using the RCGAN-CTL method are shown. Panel (a) indicates an AUC of 99.4%, demonstrating the model’s precision in differentiating between ‘normal’ from ‘pneumonia’ in chest radiographs. Panel (b) reveals an AUC of 98.1% for distinguishing between ‘viral’ and ‘bacterial’ pneumonia, critical for treatment planning. Panel (c) presents AUC values of 99.0% for ‘normal’, 98.9% for ‘viral’, and 97.3% for ‘bacterial’ pneumonia, showcasing the model’s capability to accurately classify these three distinct conditions. The high AUC values indicate that the models are capable of effectively distinguishing between normal and abnormal cases as well as accurately identifying the specific type of pneumonia present.
4.3. Performance Evaluation
The parameters procured after training the model utilizing the proposed technique have been elaborated in the prior subsection. In order to accentuate the benefits of the method, as well as make a comparison with advanced algorithms, experimental evaluations pertaining to dichotomous (normal/pneumonia) (viral pneumonia/bacterial pneumonia) and trichotomous (normal/viral pneumonia/bacterial pneumonia) scenarios were conducted. Table 1 exhibits a comparison of the RCGAN-CTL (TL using the VGG19 model) with other networks proposed by noted researchers, in relation to pneumonia detection performance, including the covxnet model [24]., the Inception V3 model (Kermany [16] et al., 2018), the VGG16 model (Rajaraman et al., 2018), and the integrated model (Chouhan et al., 2020). Covxnet [24] employs a novel deep dilation convolution architecture for pneumonia disease detection, which has been shown to exhibit superiority in comparison with other methods.
Table 1 clearly demonstrates the significant enhancement in performance metrics when VGG-19 is augmented with RCGAN-CTL, transforming it into RCGAN-VGG19. This transformation is pivotal, as it marks the transition of VGG-19 from a relatively weaker network into a formidable model capable of competing with and, in certain aspects, surpassing more advanced architectures. The essence of RCGAN-CTL lies in its strategy to augment the dataset, enriching the training material without the necessity of altering the fundamental architecture of the underlying classification model. This enhancement is evident in the comparative analysis of pneumonia detection performance, where RCGAN-VGG19 not only demonstrates a remarkable accuracy of 97.7% but also excels in precision, sensitivity, specificity, F1-score, and AUC.
In comparing VGG19 after using the RCGAN-CTL method with Covxnet [24] and Inception-CNN [25], the data illustrates RCGAN-CTL’s advanced diagnostic capability. Against Inception-CNN, RCGAN-CTL shows superior performance in the normal/pneumonia classification, with higher accuracy (97.7% vs. 95.7%). In comparison with Covxnet, RCGAN-CTL closely matches in accuracy (97.7% vs. 98.1%) and AUC (95.9% vs. 99.0%) while exhibiting complete sensitivity (100%) and a high F1-score (99.1%), indicating its proficiency in accurately identifying pneumonia. These results, combined with its high precision and specificity, highlight RCGAN-CTL’s superior diagnostic accuracy and robustness in diverse pneumonia classifications, suggesting its potential as a highly effective tool in medical imaging.
These metrics transcend mere numerical values; they embody the significant enhancement in performance bestowed upon the VGG-19 network by RCGAN-CTL. Such enhancement serves as a robust testament to the synergistic integration capacity of RCGAN-CTL with the classification framework, facilitating the extraction and augmentation of VGG-19’s inherent potential. As a result, the RCGAN-VGG19 model emerges, not merely aligning with the performance metrics of more sophisticated networks but, in specific instances, establishing new performance benchmarks. This underscores the transformative influence of RCGAN-CTL in augmenting the efficacy of pre-existing classification models.
The RCGAN-CTL method is unique in that it does not involve creating a new architecture or optimizing an existing one. Instead, it focuses on expanding the data used for training by integrating synthetic images that closely resemble real-world images. This approach has resulted in better performance for classification tasks, surpassing that of other similar models. The accuracy of the improved VGG19 network using this technique is almost equal to that of the Covxnet, but the Precision, Sensitivity, F1-score, and AUC indexes are significantly higher, indicating outstanding performance. The improved models created through this methodology are more robust while maintaining high accuracy. Overall, this approach has proven to be effective in enhancing the performance of existing models without the need for major architectural changes or optimization.
4.4. Feature Visualization
Utilizing the t-SNE dimensionality reduction technique [27] and the grad-cam technique [28] to visualize the model’s efficacy through data processing. VGG-19 consists of 16 convolutional layers and 3 fully connected layers. It is noteworthy that the last three fully connected layers harbor an excessive number of classification-related parameters, hence, rendering them unsuitable as input for t-SNE. Consequently, the second fully connected layer, with a dimensionality of 4096, known for retaining a more substantial amount of feature information, has been chosen as the t-SNE dimensionality reduction layer. The clustering of normal and pneumonia is shown in Figure 10, displaying an ideal clustering effect, which aids in clearly discerning the two image categories.
The three t-SNE plots depicted offer visual representations of data clusters extracted from features generated by a VGG19 neural network and processed using an RCGAN-CTL framework. These plots effectively demonstrate the separation and distribution of data points for various lung conditions. Plot (a) clearly differentiates the feature clusters of normal lung conditions from those affected by pneumonia. Plot (b) distinguishes between the feature clusters for viral pneumonia and bacterial pneumonia, revealing the differences in the feature space for these pneumonia subtypes. Plot (c) combines all three conditions, illustrating the relative positions and clustering of features for normal lungs, viral pneumonia, and bacterial pneumonia within a two-dimensional plane.
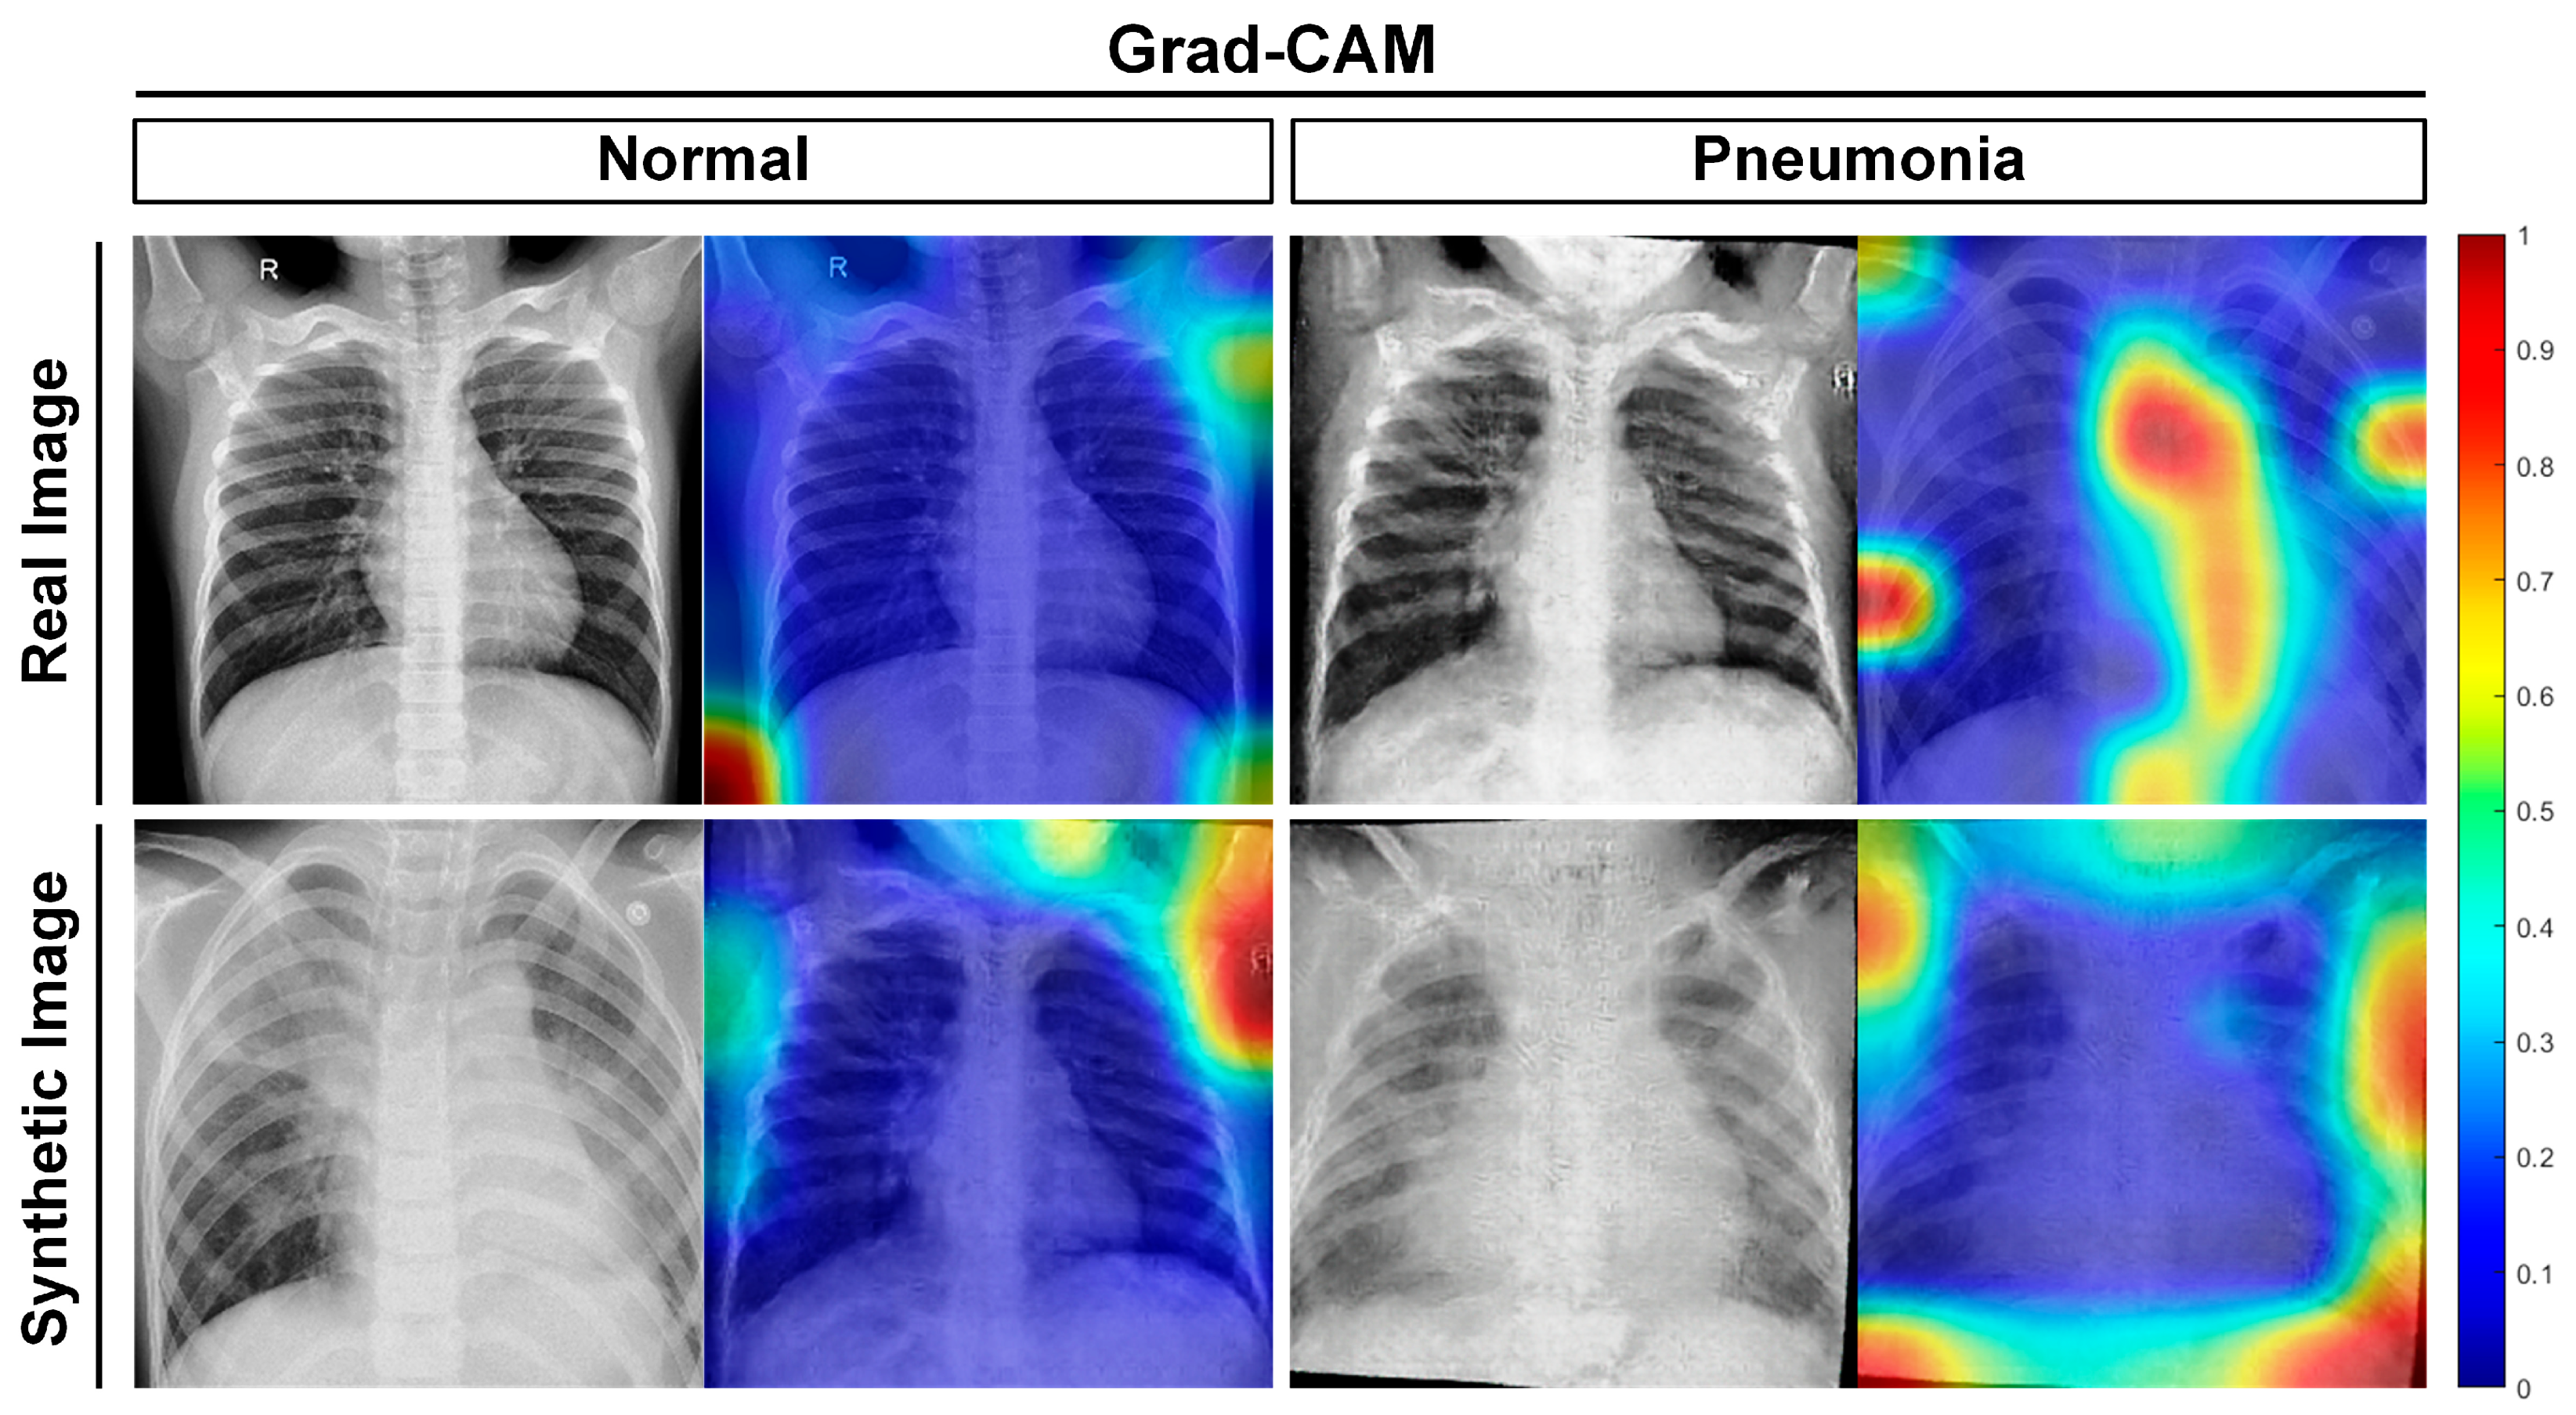
The figure’s description pertains to the use of gradient-based class activation mapping (Grad-CAM) for analyzing both real and synthetic images of normal and pathological lungs. It emphasizes that synthetic images produced by the RCGAN-CTL process showcase feature localization that closely resembles that of real images. Key radiological features of pneumonia, such as patchy consolidation and bilateral multifocal ground-glass opacities, are accurately localized in the synthetic images. This precision suggests that these images could effectively augment datasets for machine-learning applications. Furthermore, the lack of significant thermogram overlay in the normal lung images corroborates the model’s ability to discriminate between healthy and diseased tissue.
The utilization of the gradient-based class activation mapping technique involves the processing of real and synthetic images of normal lungs and pneumonia, respectively. As displayed in Figure 11, the Grad-CAM processed images are presented, with the top and bottom columns representing the real and synthetic images of normal and pneumonia, respectively. The findings indicate that the synthetic images exhibit similar feature localization to the real images, with pneumonia demonstrating a patchy solid localized area with bilateral multifocal ground glass-like shadows, sometimes accompanied by patchy solid lesions, with the thermogram surrounding or directly overlaying the lesioned area. Notably, none of the normal lung images exhibit significant thermogram overlay, indicating that the synthetic images are of sufficiently high quality for dataset expansion and that the RCGAN-CTL approach is reliable and valid.
5. Discussion
The results of the RCGAN-CTL method, as presented in this study, indicate a significant advancement in the field of medical imaging, particularly in the diagnosis of respiratory diseases using small or incomplete datasets. Compared to traditional approaches [29], the RCGAN-CTL method shows a notable improvement in dealing with limited data availability by generating high-quality synthetic images, thereby enhancing the diagnostic accuracy and robustness of the models.
However, it is critical to recognize that the success of the RCGAN-CTL method is closely tied to the quality and diversity of the synthetic images it generates. While the method has demonstrated promising outcomes, its performance might be challenged when applied to datasets characterized by extreme imbalances or rarity in case presentations [30]. This highlights the need for a comprehensive and diverse dataset to train robust models capable of generalizing well across various scenarios. Looking beyond respiratory diseases, the RCGAN-CTL approach holds potential for application in other medical imaging areas, such as oncology, neurology, and cardiology [31]. This is particularly relevant in scenarios where real-world data is scarce or difficult to collect, a common issue in medical research [32]. By augmenting datasets with synthetic yet realistic images, RCGAN-CTL could significantly contribute to improving diagnostic accuracies in these fields. The dependency of the RCGAN-CTL method on the initial quality of available data is a notable limitation. The generation and effectiveness of synthetic images are contingent upon the representativeness of the training set, which may limit the model’s applicability to conditions not included in the initial dataset [33]. Moreover, the computational intensity required by this method may not be feasible in resource-constrained settings. Future developments of the RCGAN-CTL model should focus on integrating more sophisticated image processing techniques to enhance the realism of synthetic images further. This could involve exploring advanced algorithms that optimize computational efficiency while maintaining high accuracy [34]. Collaboration with medical professionals could provide valuable insights into the clinical applicability of the model and guide future improvements [35].
6. Conclusions
A novel approach, named RCGAN-CTL, is proposed to improve the diagnosis of pneumonia on missing and small samples. This approach involves a network of RCGAN that incorporates conditional transfer learning. At each loop, synthetic images produced by RCGAN are inserted to enhance the dataset and assist in analyzing X-ray abnormalities from various dimensions by combining the visual field features of real and synthetic images. The principle behind this approach is to increase the size of the database expand the size of the database through the RCGAN network, which includes X-rays of normal individuals and patients with various types of pneumonia, and conditionally filter the images input to the transfer learning model accordingly. Despite a certain degree of feature overlap in different pneumonia images, the method has achieved satisfactory results through numerous controlled group experiments. It has exhibited remarkable generalization, accuracy, and robustness in various transfer learning environments and different types of classification tasks. and triple classification tasks. Lastly, the efficacy of RCGAN-CTL is verified through visualization techniques t-SNE and Grad-CAM, which analyze the effectiveness of synthesized images and decision sites. Additionally, this method can be applied to several different classification models to enhance the performance of the original model.
Author Contributions
Author Contributions: Conceptualization, K.H.; Methodology, S.H.; Software, K.H.; Writing-review and editing, K.H.; Funding acquisition, K.H.; Supervision, S.H.; Formal analysis, Y.Y. Conceptualization, S.H. All authors have read and agreed to the published version of the manuscript.
Funding
There Research received no external funding.
Data Availability Statement
The datasets used in the present study are publicly available, and ethical approval and informed consent were obtained in each original study. The data used to support the findings of this study are available from the corresponding author upon request. Kermany, Daniel; Zhang, Kang; Goldbaum, Michael (2018), “Large Dataset of Labeled Optical Coherence Tomography (OCT) and Chest X-ray Images”, Mendeley Data, V3, https://doi.org/10.17632/rscbjbr9sj.3 accessed on 6 June 2023. (https://data.mendeley.com/datasets/rscbjbr9sj), accessed on 6 June 2023.
Conflicts of Interest
The authors declare that they have no conflicts of interest.
References
- Mehta, T.; Mehendale, N. Classification of X-ray images into COVID-19, pneumonia, and TB using cGAN and fine-tuned deep transfer learning models. Res. Biomed. Eng. 2021, 37, 803–813. [Google Scholar] [CrossRef]
- Showkat, S.; Qureshi, S. Efficacy of Transfer Learning-based ResNet models in Chest X-ray image classification for detecting COVID-19 Pneumonia. Chemom. Intell. Lab. Syst. 2022, 224, 104534. [Google Scholar] [CrossRef]
- Chakraborty, S.; Paul, S.; Hasan, K.M.A. A Transfer Learning-Based Approach with Deep CNN for COVID-19- and Pneumonia-Affected Chest X-ray Image Classification. SN Comput. Sci. 2022, 3, 17. [Google Scholar] [CrossRef]
- Avola, D.; Bacciu, A.; Cinque, L.; Fagioli, A.; Marini, M.R.; Taiello, R. Study on transfer learning capabilities for pneumonia classification in chest-X-rays images. Comput. Methods Programs Biomed. 2022, 221, 106833. [Google Scholar] [CrossRef]
- Manickam, A.; Jiang, J.; Zhou, Y.; Sagar, A.; Soundrapandiyan, R.; Dinesh Jackson Samuel, R. Automated pneumonia detection on chest X-ray images: A deep learning approach with different optimizers and transfer learning architectures. Measurement 2021, 184, 109953. [Google Scholar] [CrossRef]
- Mamalakis, M.; Swift, A.J.; Vorselaars, B.; Ray, S.; Weeks, S.; Ding, W.; Clayton, R.H.; Mackenzie, L.S.; Banerjee, A. DenResCov-19: A deep transfer learning network for robust automatic classification of COVID-19, pneumonia, and tuberculosis from X-rays. Comput. Med. Imaging Graph. 2021, 94, 102008. [Google Scholar] [CrossRef]
- Loey, M.; Manogaran, G.; Khalifa, N.E.M. A deep transfer learning model with classical data augmentation and CGAN to detect COVID-19 from chest CT radiography digital images. Neural. Comput. Appl. 2020. [Google Scholar] [CrossRef]
- Kaderuppan, S.S.; Wong, W.L.E.; Sharma, A.; Woo, W.L. O-Net: A Fast and Precise Deep-Learning Architecture for Computational Super-Resolved Phase-Modulated Optical Microscopy. Microsc. Microanal. 2022, 28, 1584–1598. [Google Scholar] [CrossRef]
- Ayan, E.; Unver, H.M. Diagnosis of Pneumonia from Chest X-ray Images Using Deep Learning. In Proceedings of the 2019 Scientific Meeting on Electrical-Electronics & Biomedical Engineering and Computer Science (EBBT), Istanbul, Turkey, 24–26 April 2019. [Google Scholar]
- Hammoudi, K.; Benhabiles, H.; Melkemi, M.; Dornaika, F.; Arganda-Carreras, I.; Collard, D.; Scherpereel, A. Deep Learning on Chest X-ray Images to Detect and Evaluate Pneumonia Cases at the Era of COVID-19. J. Med. Syst. 2021, 45, 75. [Google Scholar] [CrossRef]
- Luján-García, J.; Yáñez-Márquez, C.; Villuendas-Rey, Y.; Camacho-Nieto, O. A Transfer Learning Method for Pneumonia Classification and Visualization. Appl. Sci. 2020, 10, 2908. [Google Scholar] [CrossRef]
- Pan, S.J.; Yang, Q. A Survey on Transfer Learning. IEEE Trans. Knowl. Data Eng. 2010, 22, 1345–1359. [Google Scholar] [CrossRef]
- Li, Q.; Lu, L.; Li, Z.; Wu, W.; Liu, Z.; Jeon, G.; Yang, X. Coupled GAN With Relativistic Discriminators for Infrared and Visible Images Fusion. IEEE Sens. J. 2021, 21, 7458–7467. [Google Scholar] [CrossRef]
- Mirza, M.; Osindero, S. Conditional Generative Adversarial Nets. arXiv 2014, arXiv:1411.1784. [Google Scholar]
- Goodfellow, I.; Pouget-Abadie, J.; Mirza, M.; Xu, B.; Warde-Farley, D.; Ozair, S.; Courville, A.; Bengio, Y. Generative adversarial networks. Commun. ACM 2020, 63, 139–144. [Google Scholar] [CrossRef]
- Kermany, D.S.; Goldbaum, M.; Cai, W.; Valentim, C.C.S.; Liang, H.; Baxter, S.L.; McKeown, A.; Yang, G.; Wu, X.; Yan, F.; et al. Identifying Medical Diagnoses and Treatable Diseases by Image-Based Deep Learning. Cell 2018, 172, 1122–1131. [Google Scholar] [CrossRef]
- Kingma, D.P.; Ba, J. Adam: A Method for Stochastic Optimization. arXiv 2017, arXiv:1412.6980. [Google Scholar]
- Qian, N. On the momentum term in gradient descent learning algorithms. Neural Netw. 1999, 12, 145–151. [Google Scholar] [CrossRef]
- He, K.; Zhang, X.; Ren, S.; Sun, J. Delving Deep into Rectifiers: Surpassing Human-Level Performance on ImageNet Classification. arXiv 2015, arXiv:1502.01852. [Google Scholar]
- Krizhevsky, A.; Sutskever, I.; Hinton, G. ImageNet classification with deep convolutional neural networks. Commun. ACM 2017, 60, 84–90. [Google Scholar] [CrossRef]
- He, K.; Zhang, X.; Ren, S.; Sun, J. Deep Residual Learning for Image Recognition. arXiv 2016, arXiv:1512.03385. [Google Scholar]
- Szegedy, C.; Vanhoucke, V.; Loffe, S.; Shlens, J.; Wojna, Z. Rethinking the Inception Architecture for Computer Vision. In Proceedings of the 2016 IEEE Conference On Computer Vision and Pattern Recognition (Cvpr), Las Vegas, NV, USA, 27–30 June 2016; pp. 2818–2826. [Google Scholar]
- Chung, M.; Bernheim, A.; Mei, X.; Zhang, N.; Huang, M.; Zeng, X.; Cui, J.; Xu, W.; Yang, Y.; Fayad, Z.A.; et al. CT Imaging Features of 2019 Novel Coronavirus (2019-nCoV). Radiology 2020, 295, 202–207. [Google Scholar] [CrossRef]
- Mahmud, T.; Rahman, M.A.; Fattah, S.A. CovXNet: A multi-dilation convolutional neural network for automatic COVID-19 and other pneumonia detection from chest X-ray images with transferable multi-receptive feature optimization. Comput. Biol. Med. 2020, 122, 103869. [Google Scholar] [CrossRef]
- Rajaraman, S.; Candemir, S.; Kim, I.; Thoma, G.; Antani, S. Visualization and Interpretation of Convolutional Neural Network Predictions in Detecting Pneumonia in Pediatric Chest Radiographs. Appl. Sci. 2018, 8, 1715. [Google Scholar] [CrossRef]
- Chouhan, V.; Singh, S.K.; Khamparia, A.; Gupta, D.; Tiwari, P.; Moreira, C.; Damaševičius, R.; de Albuquerque, V.H.C. A Novel Transfer Learning Based Approach for Pneumonia Detection in Chest X-ray Images. Appl. Sci. 2020, 10, 559. [Google Scholar] [CrossRef]
- Cai, T.T.; Ma, R. Theoretical Foundations of t-SNE for Visualizing High-Dimensional Clustered Data. arXiv 2021, arXiv:2105.07536. [Google Scholar]
- Selvaraju, R.R.; Cogswell, M.; Das, A.; Vedantam, R.; Parikh, D.; Batra, D. Grad-CAM: Visual Explanations from Deep Networks via Gradient-based Localization. In Proceedings of the 2017 IEEE International Conference on Computer Vision (Iccv), Venice, Italy, 22–29 October 2017; pp. 618–626. [Google Scholar]
- Bharati, S.; Podder, P.; Mondal, M.; Prasath, V.B. Medical imaging with deep learning for COVID-19 diagnosis: A comprehensive review. arXiv preprint 2021, arXiv:2107.09602. [Google Scholar]
- Ain, Q.U.; Akbar, S.; Hassan, S.A.; Naaqvi, Z. Diagnosis of Leukemia Disease through Deep Learning using Microscopic Images. In Proceedings of the 2022 2nd International Conference on Digital Futures and Transformative Technologies (ICoDT2), Rawalpindi, Pakistan, 24–26 May 2022; pp. 1–6. [Google Scholar]
- Wang, G.; Li, W.; Ourselin, S.; Vercauteren, T. Automatic brain tumor segmentation using cascaded anisotropic convolutional neural networks. In International MICCAI Brainlesion Workshop; Springer: Cham, Switzerland, 2019; pp. 178–190. [Google Scholar]
- Johnson, A.E.; Pollard, T.J.; Shen, L.; Lehman, L.-W.H.; Feng, M.; Ghassemi, M.; Moody, B.; Szolovits, P.; Celi, L.A.; Mark, R.G. MIMIC-III, a freely accessible critical care database. Sci. Data 2016, 3, 160035. [Google Scholar] [CrossRef] [PubMed]
- Frid-Adar, M.; Diamant, I.; Klang, E.; Amitai, M.; Goldberger, J.; Greenspan, H. GAN-based synthetic medical image augmentation for increased CNN per-formance in liver lesion classification. Neurocomputing 2018, 321, 321–331. [Google Scholar] [CrossRef]
- Li, Y.; Liu, S.; Yang, J.; Yang, M.H. Generative face completion. In Proceedings of the IEEE Conference on Computer Vision and Pattern Recognition, Honolulu, HI, USA, 21–26 July 2017; pp. 3911–3919. [Google Scholar]
- Esteva, A.; Robicquet, A.; Ramsundar, B.; Kuleshov, V.; DePristo, M.; Chou, K.; Cui, C.; Corrado, G.; Thrun, S.; Dean, J. A guide to deep learning in healthcare. Nat. Med. 2019, 25, 24–292. [Google Scholar] [CrossRef]
Figure 1.
Schematic structure of RCGAN-CTL. (Yellow: generator; Blue; Discriminator; Green: pre-training network; Orange: Transfer Learning Network).
Figure 1.
Schematic structure of RCGAN-CTL. (Yellow: generator; Blue; Discriminator; Green: pre-training network; Orange: Transfer Learning Network).
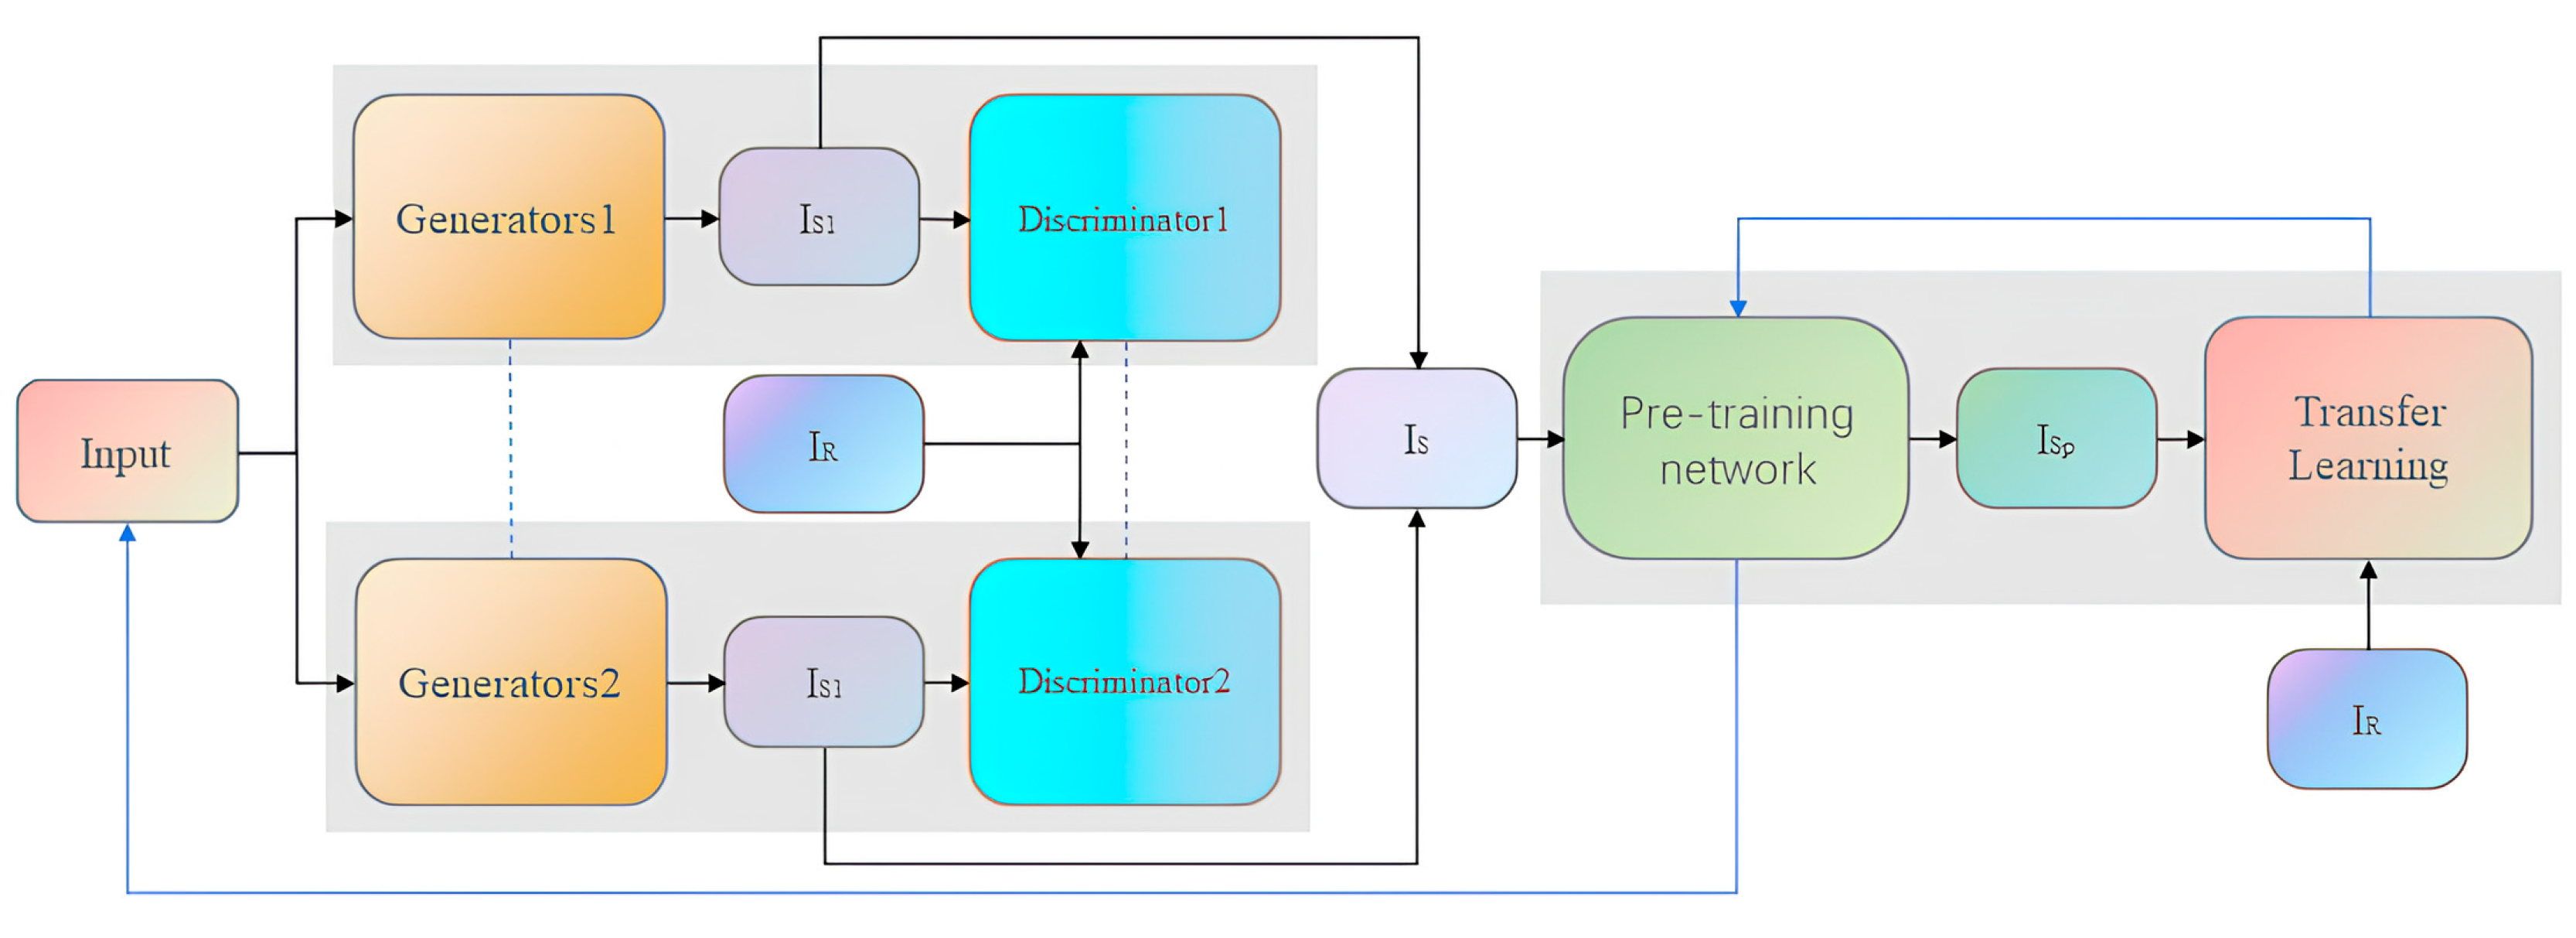
Figure 2.
Proposed enhanced coupling generators in RCGAN networks.

Figure 3.
Coupled relativistic discriminators in the proposed enhanced RCGAN network.
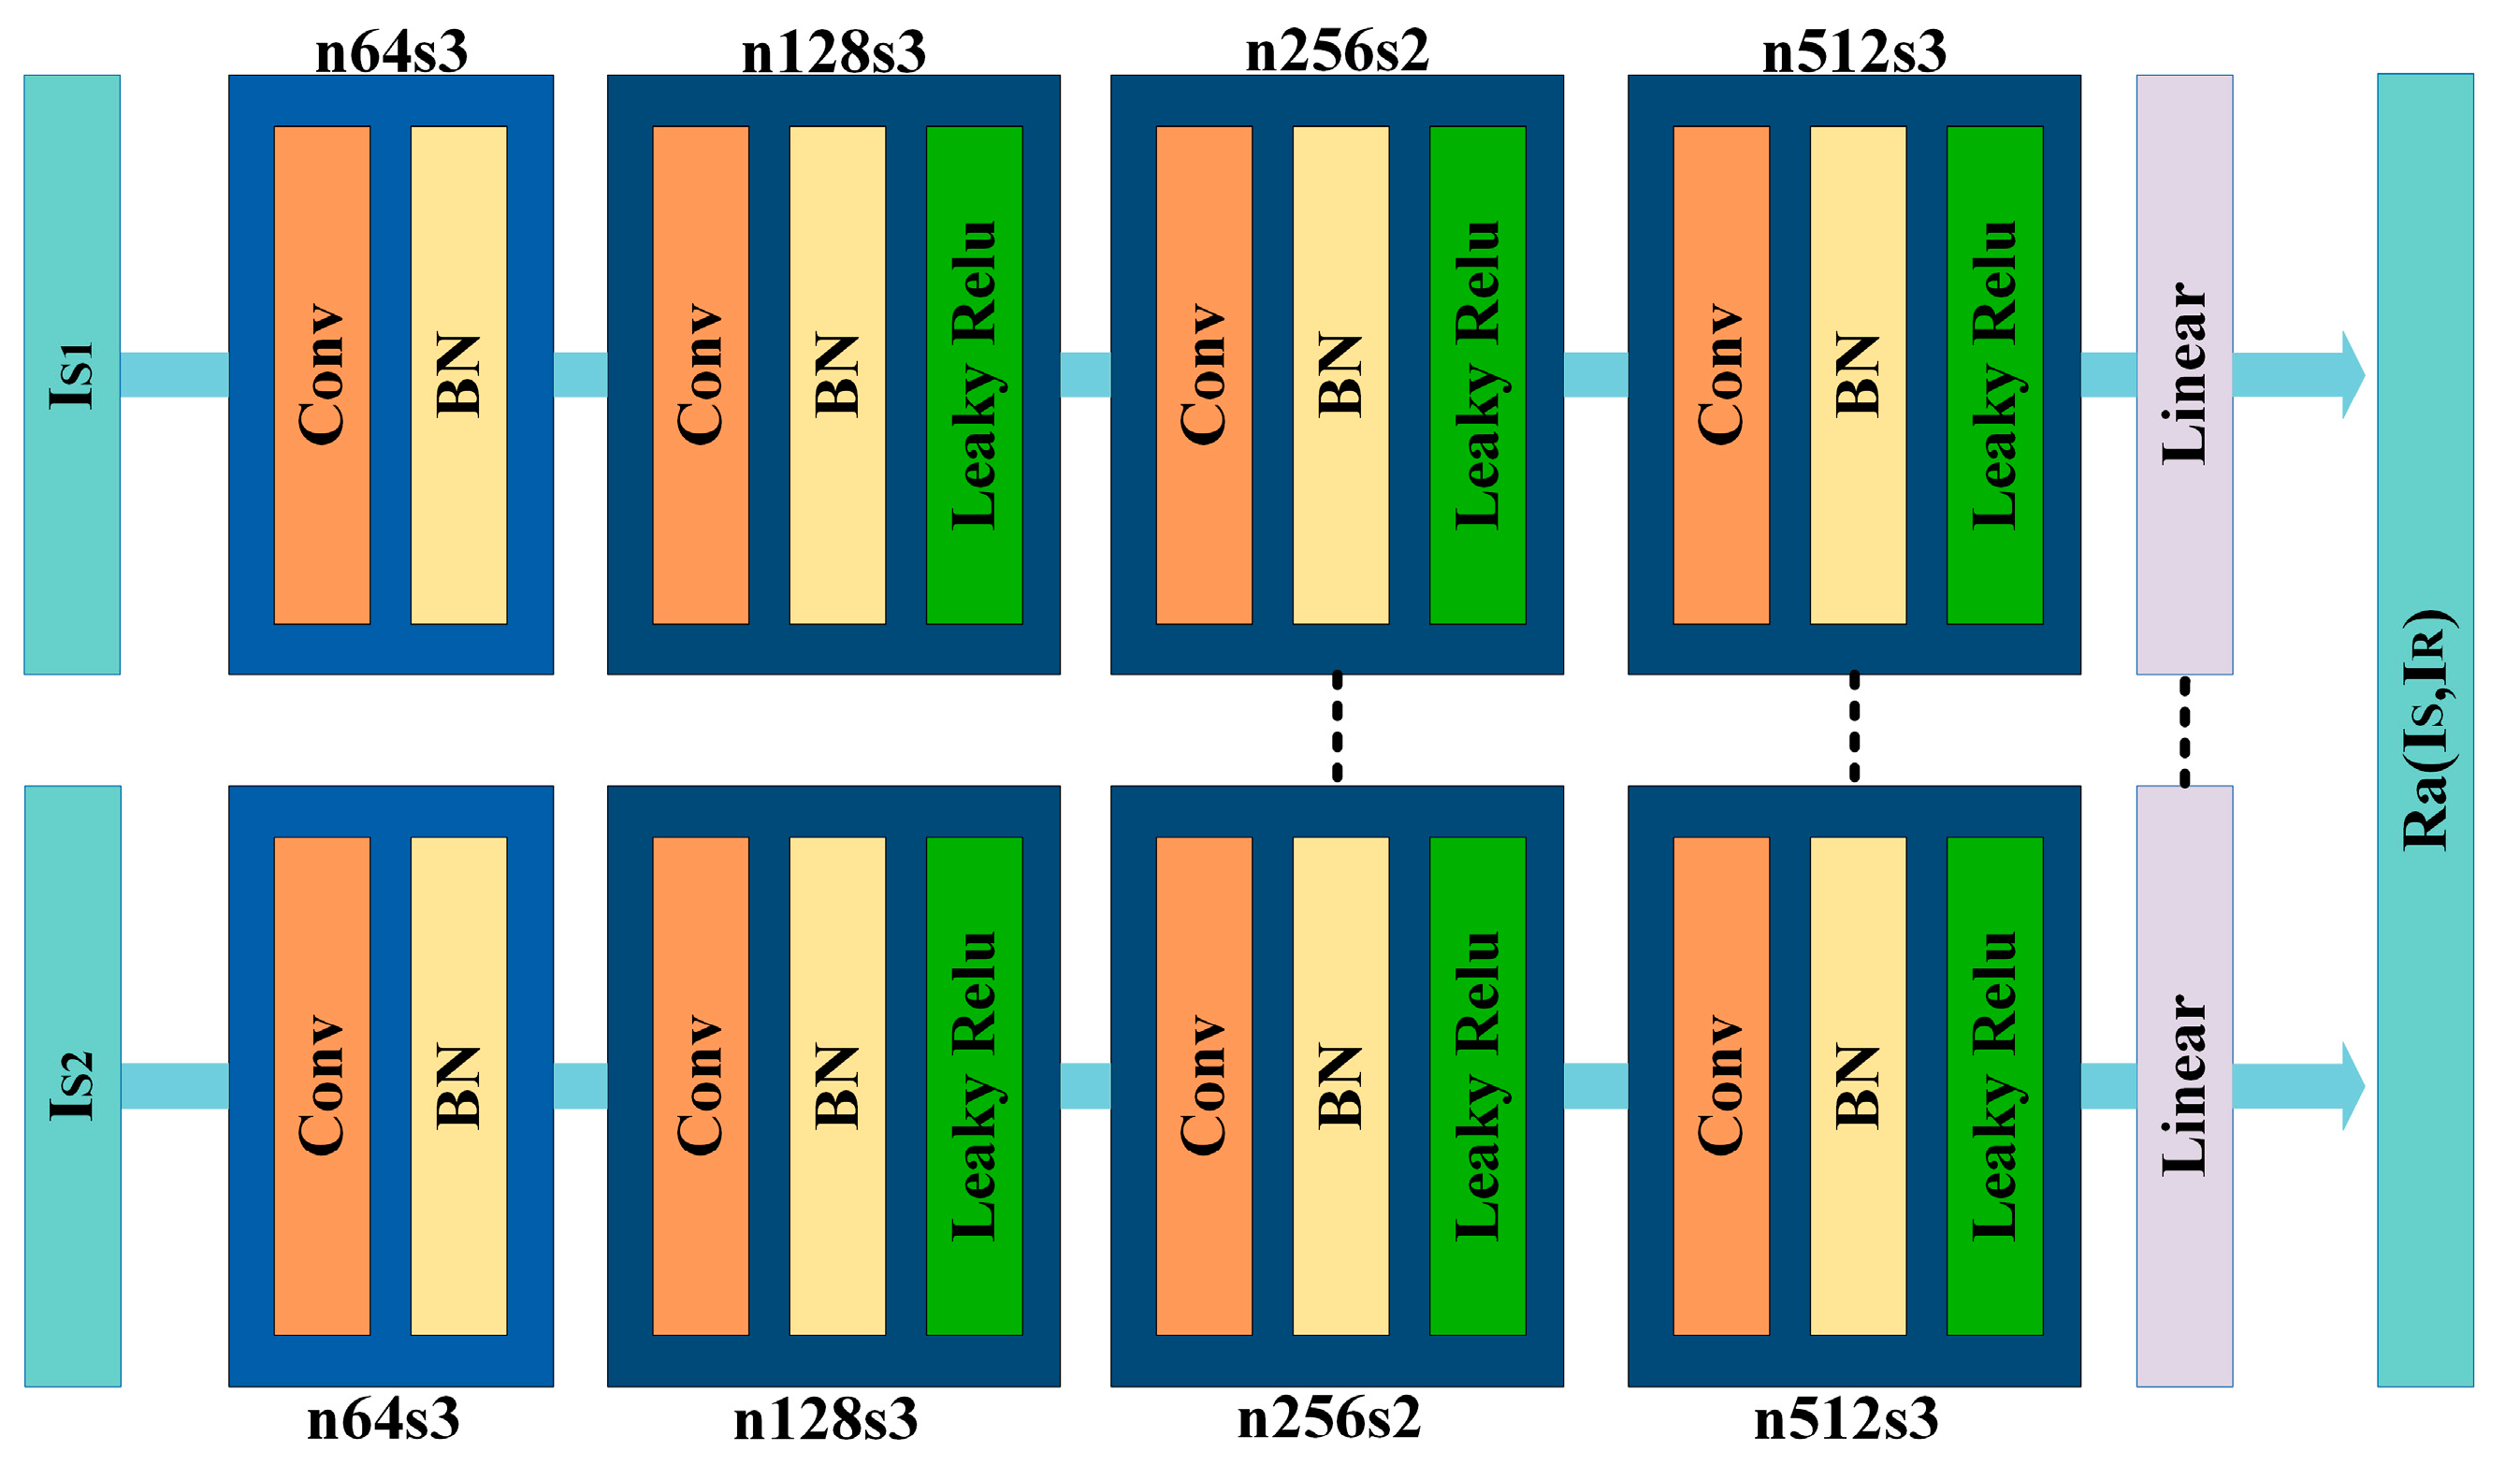
Figure 4.
Enhanced RCGAN for training and sampling of image output. ((a) Iterative sampling map; (b) Training process).
Figure 4.
Enhanced RCGAN for training and sampling of image output. ((a) Iterative sampling map; (b) Training process).
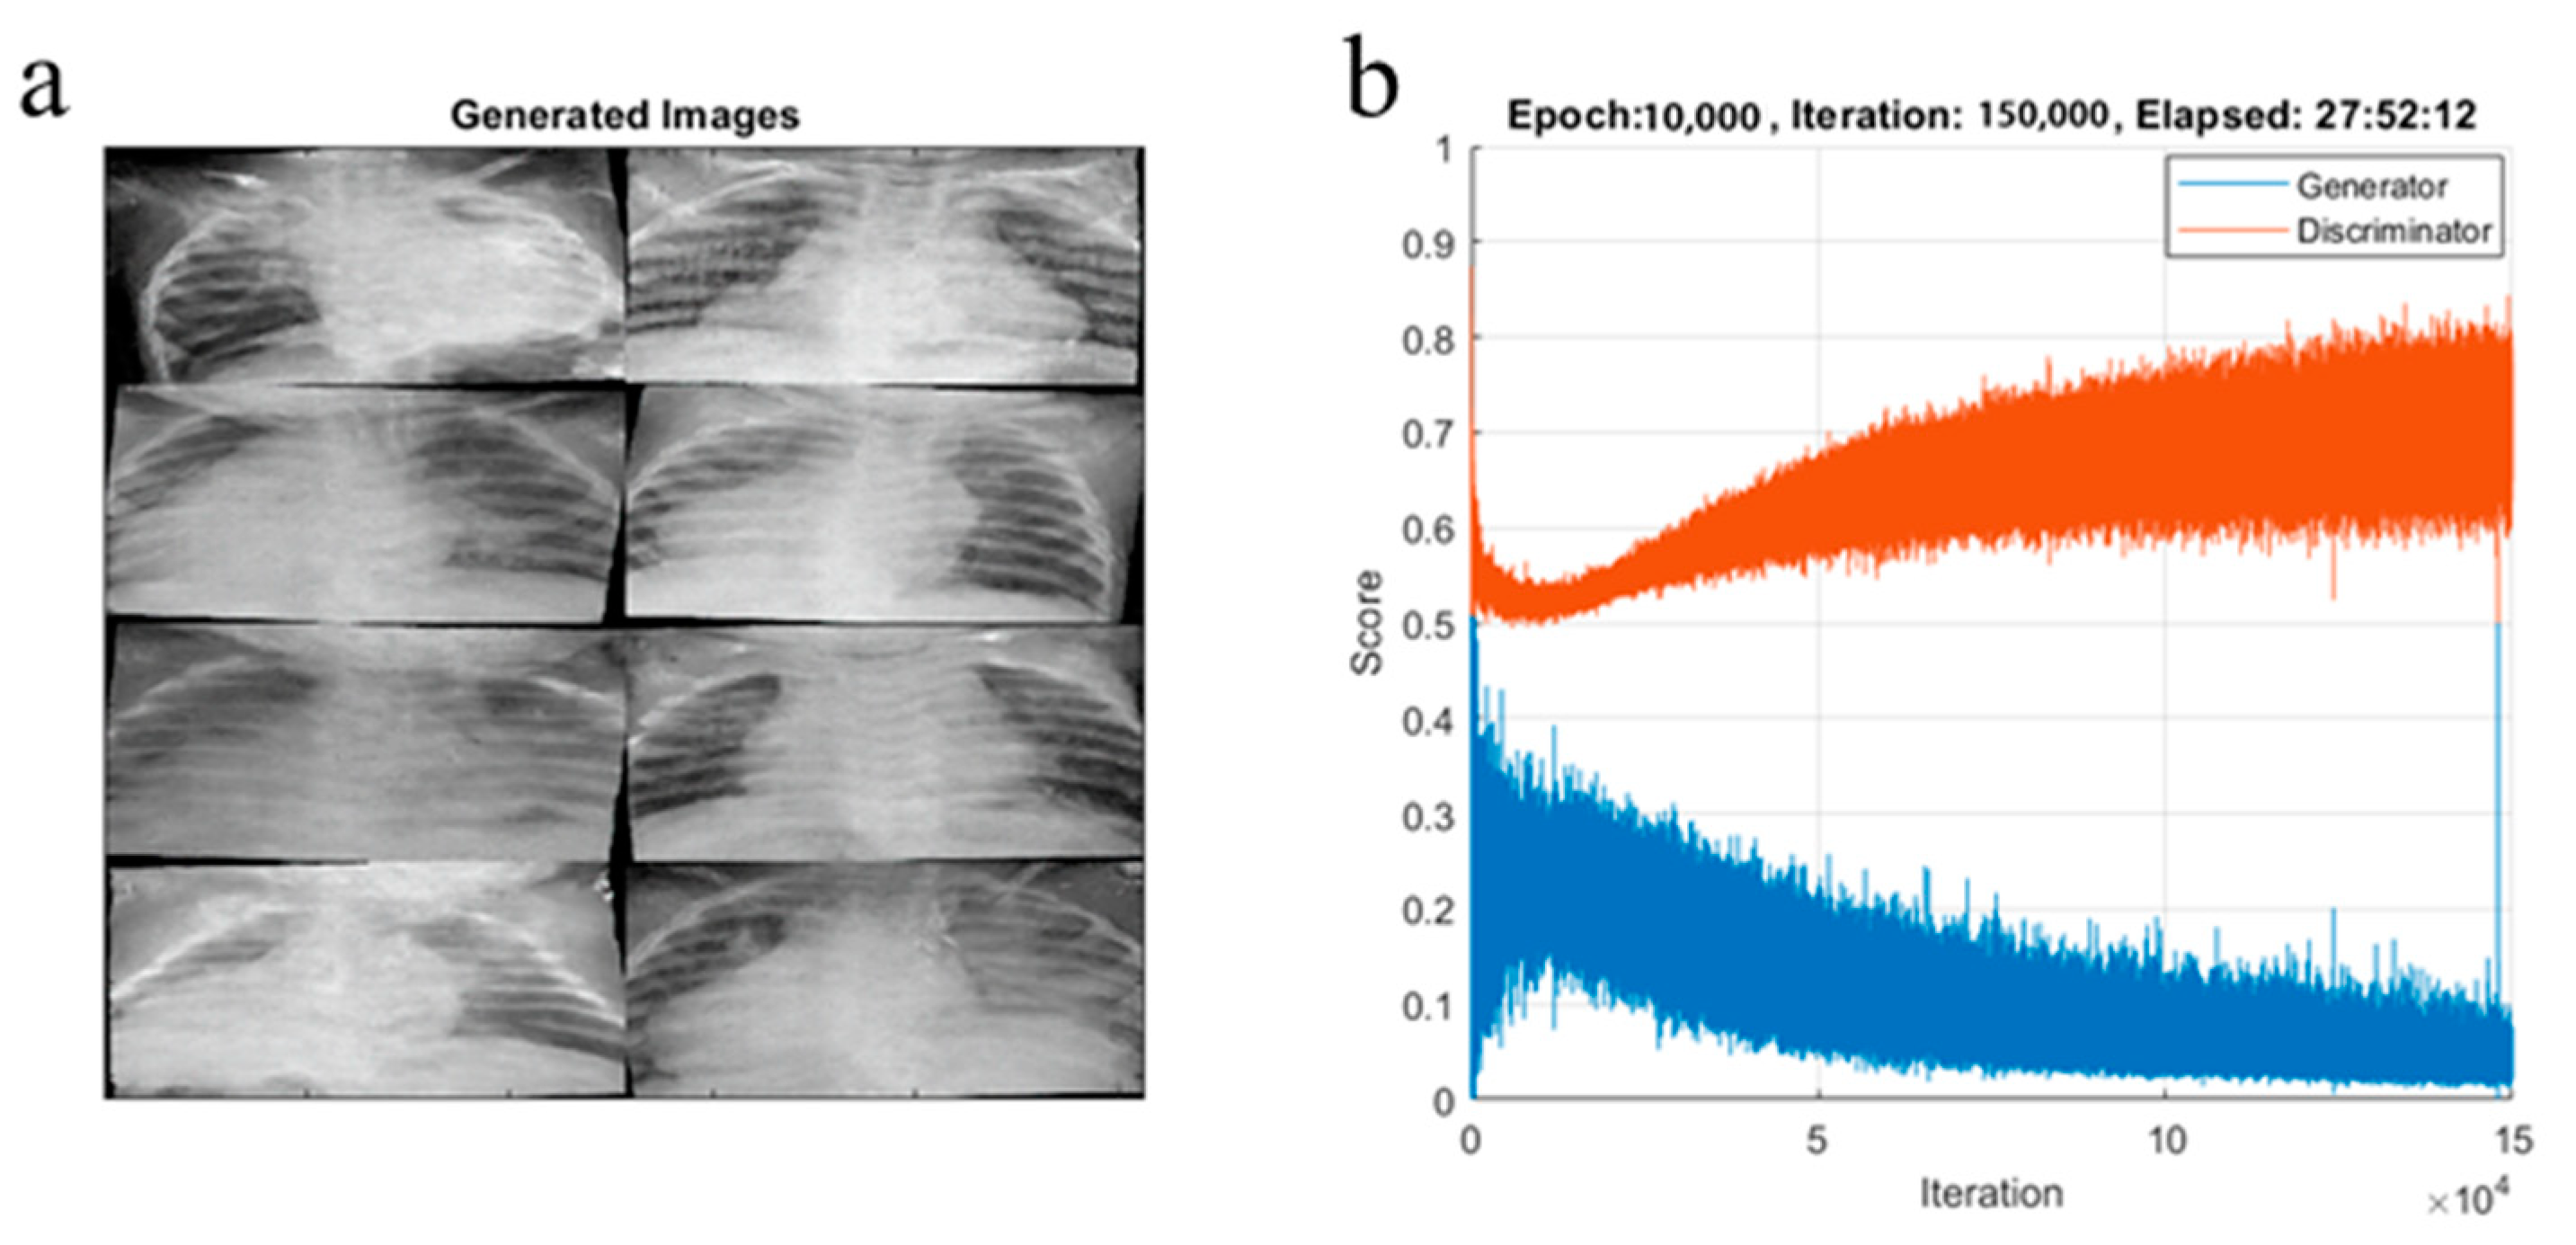
Figure 5.
The performance of the training and validation datasets during conditional transfer learning training is shown by a plot. (Blue: model accuracy; Orange: Model loss).
Figure 5.
The performance of the training and validation datasets during conditional transfer learning training is shown by a plot. (Blue: model accuracy; Orange: Model loss).

Figure 6.
Confusion matrix of the base Alexnet (a), Resnet18 (b), InceptionV3 (c), and VGG19 (d) transfer learning models.
Figure 6.
Confusion matrix of the base Alexnet (a), Resnet18 (b), InceptionV3 (c), and VGG19 (d) transfer learning models.
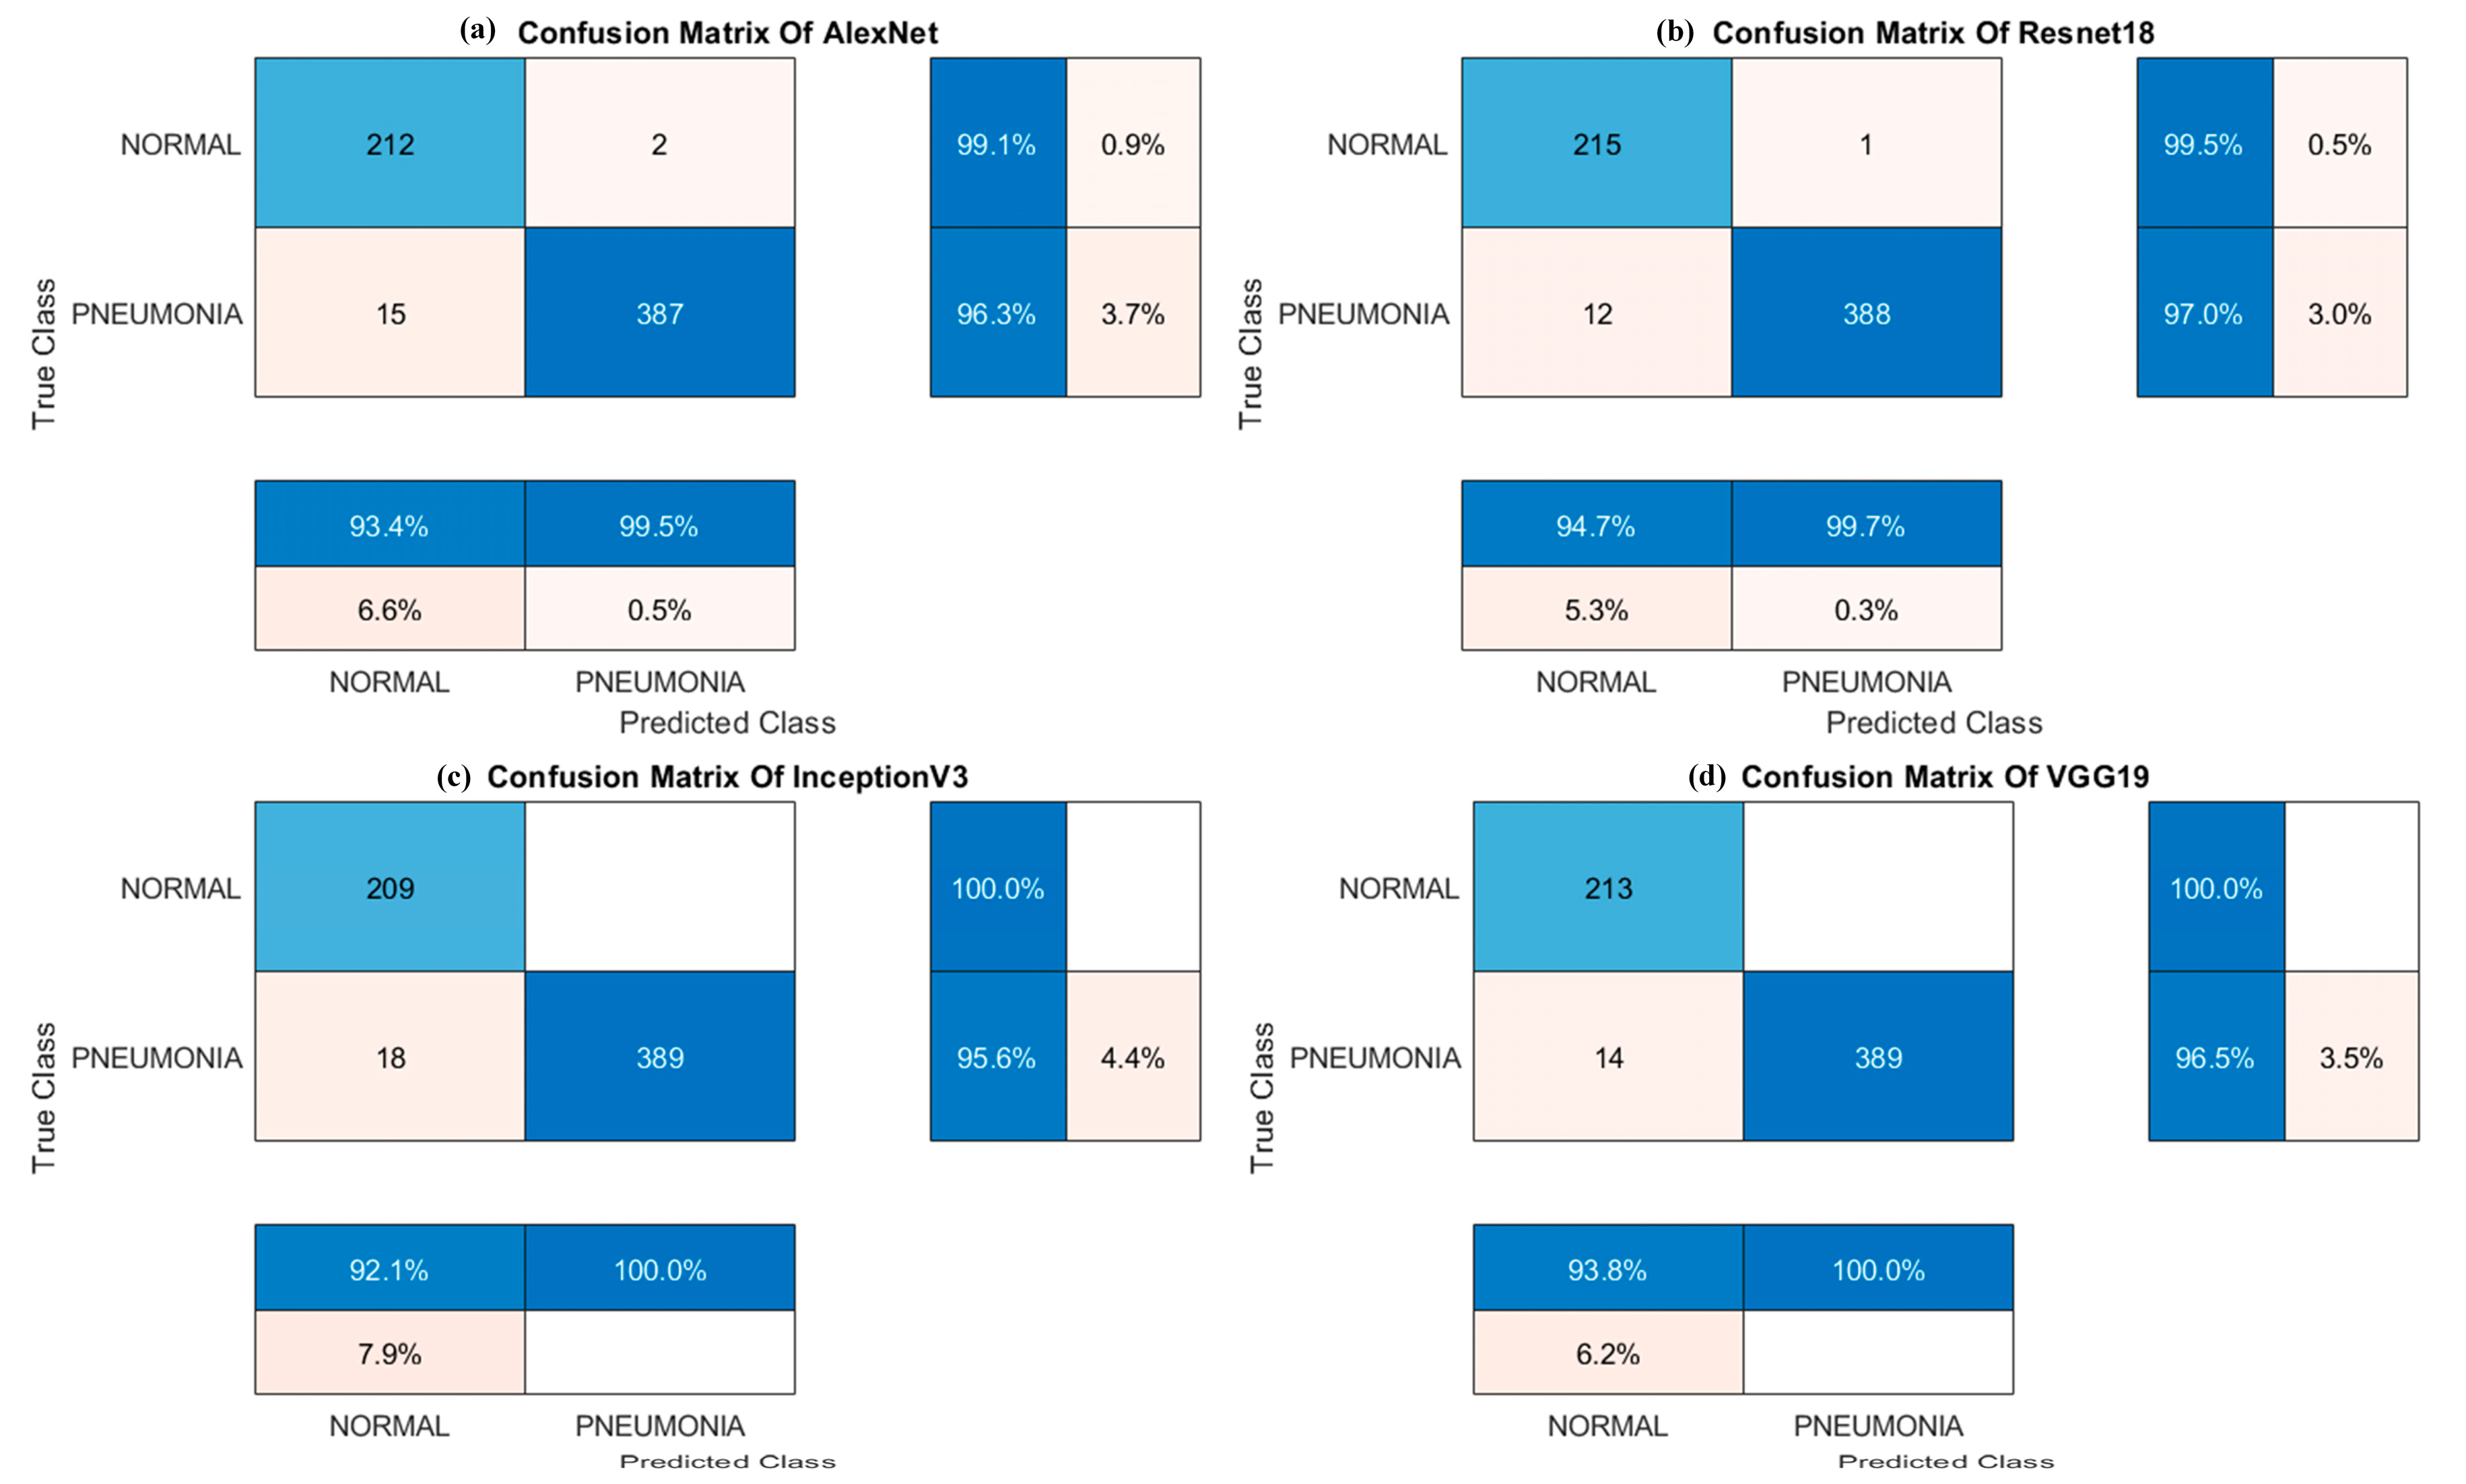
Figure 7.
Multifactor histograms of the four networks for the evaluation parameters of accuracy (ACC), precision (PRE), sensitivity (TPR), specificity (TNR), the area under the ROC curve (AUC), and F1-score (F1).
Figure 7.
Multifactor histograms of the four networks for the evaluation parameters of accuracy (ACC), precision (PRE), sensitivity (TPR), specificity (TNR), the area under the ROC curve (AUC), and F1-score (F1).
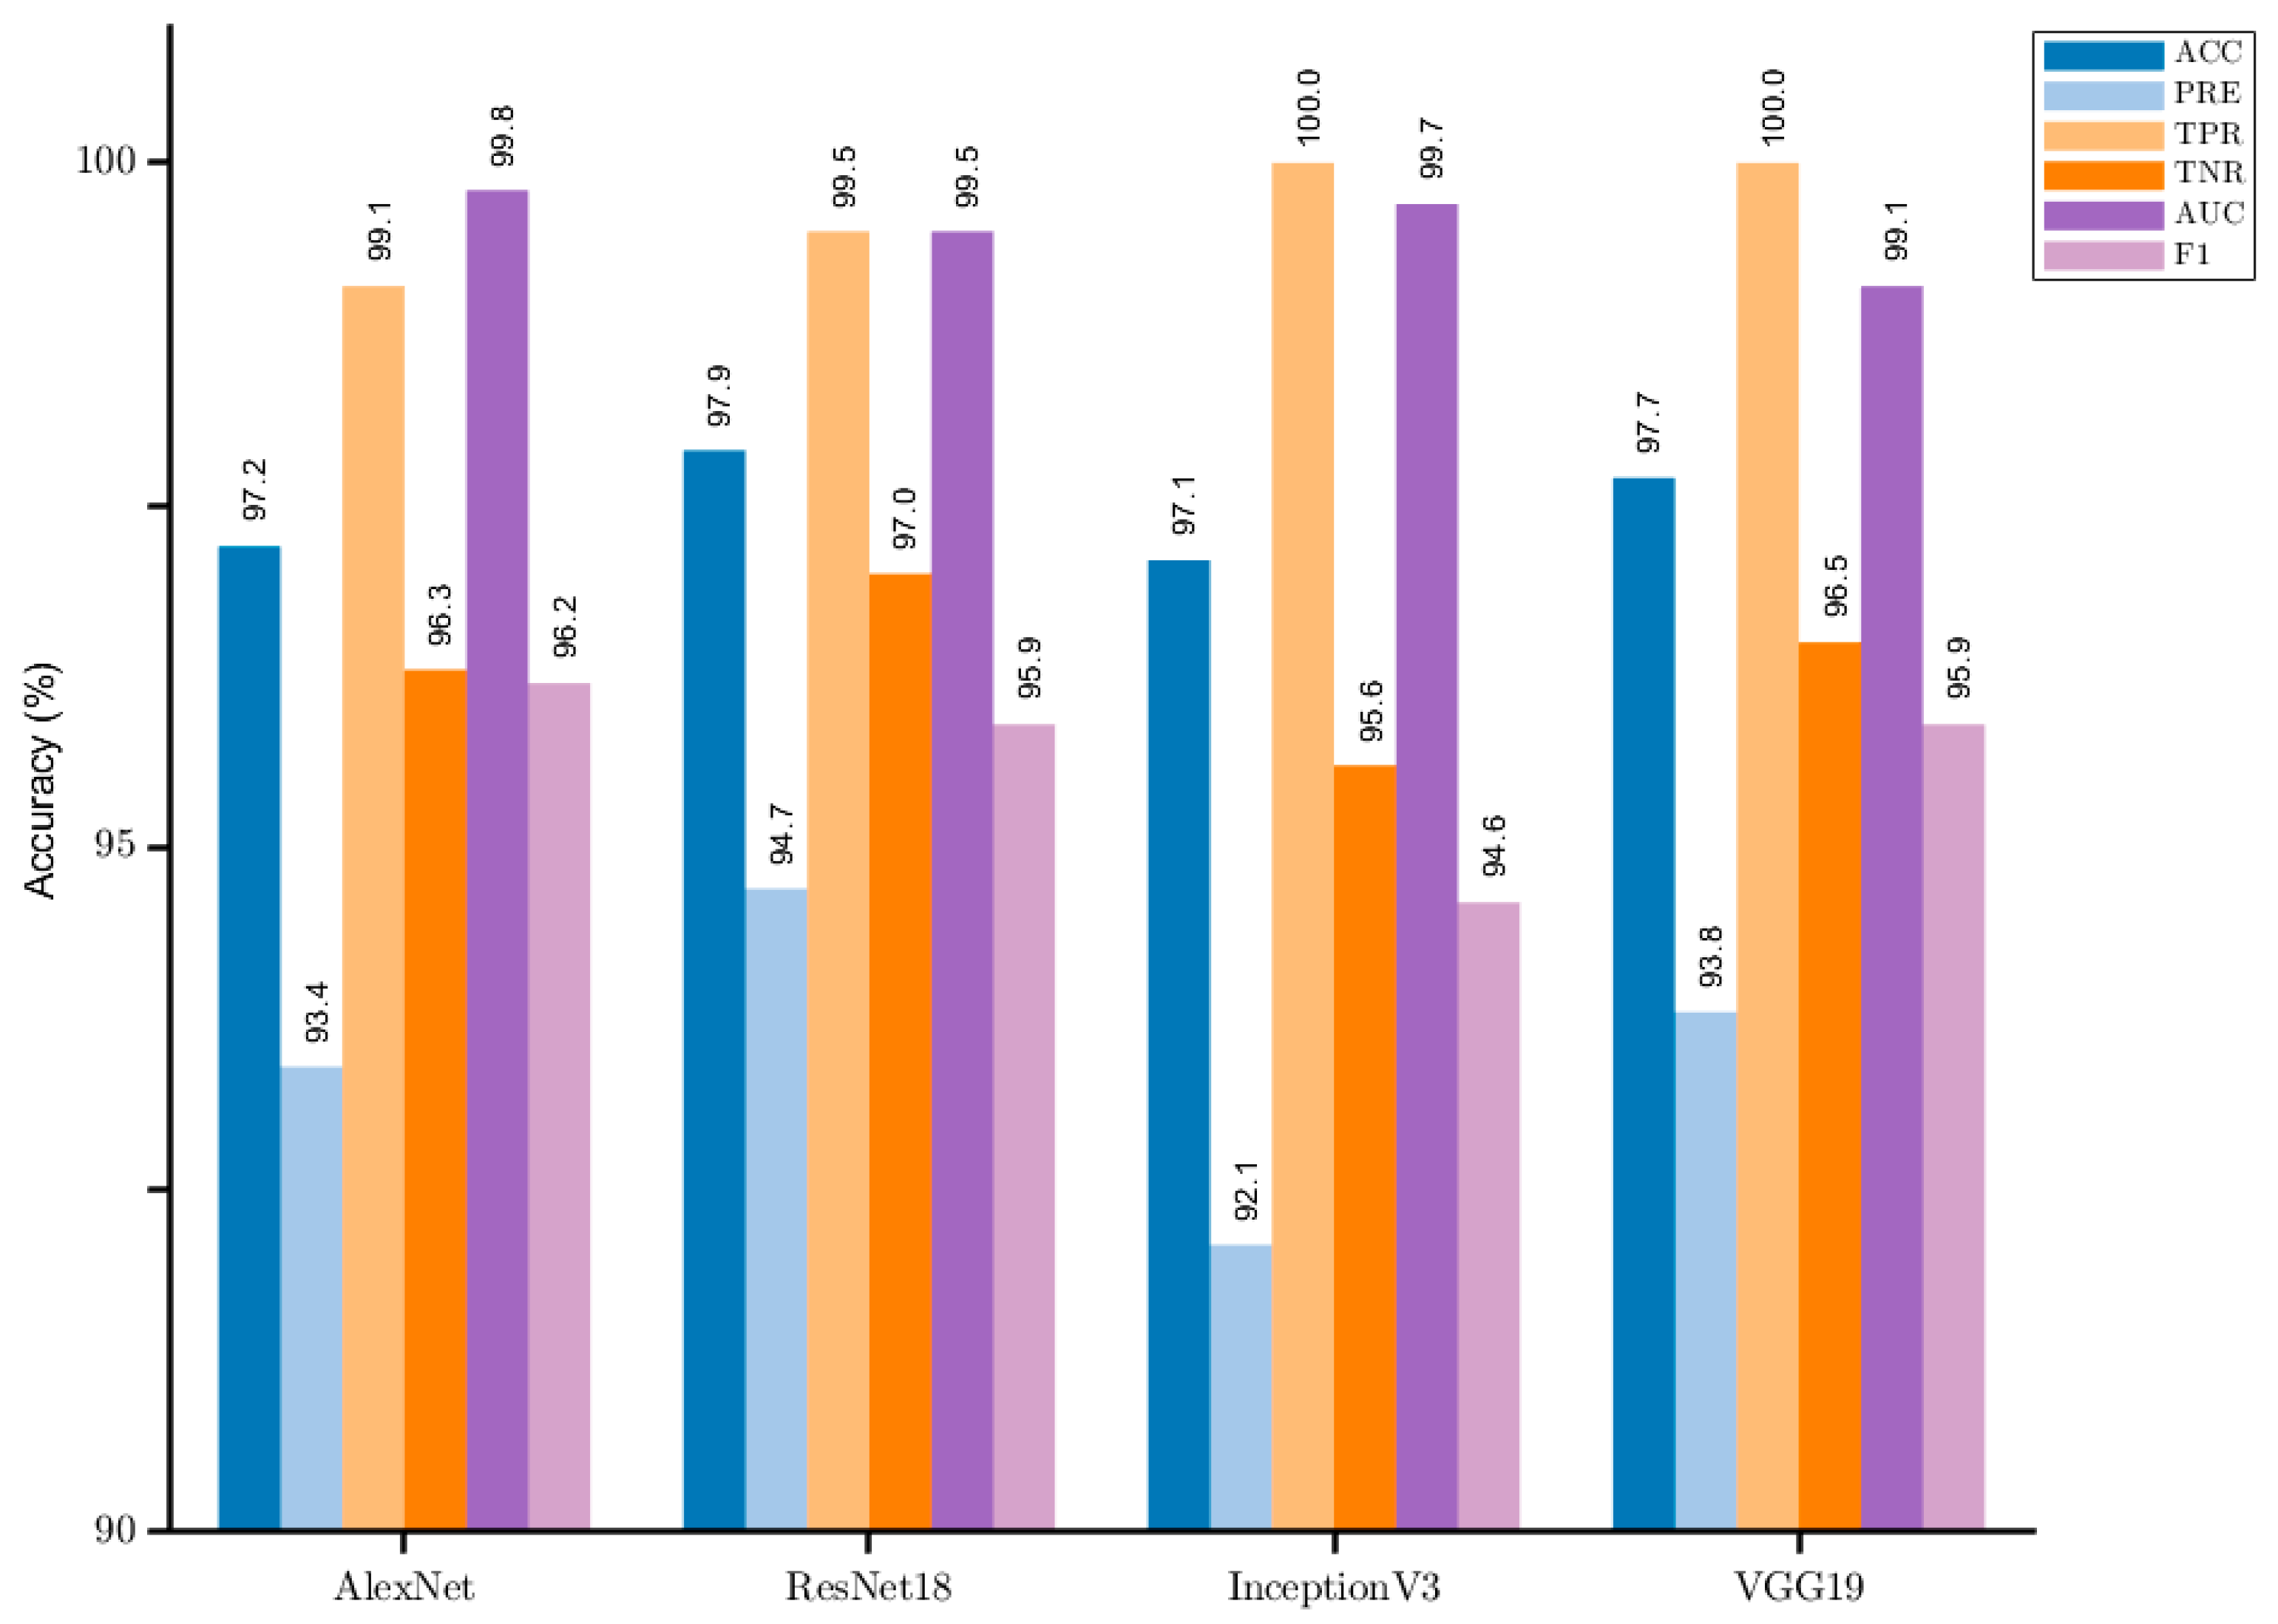
Figure 8.
Comparison of confusion matrix of VGG19 before and after using the RCGAN-CTL method. ((a) Confusion matrix based on VGG19; (b) Confusion matrix of VGG19 after using the RCGAN-CTL method).
Figure 8.
Comparison of confusion matrix of VGG19 before and after using the RCGAN-CTL method. ((a) Confusion matrix based on VGG19; (b) Confusion matrix of VGG19 after using the RCGAN-CTL method).

Figure 9.
Comparison of ROC curves of VGG19 based on RCGAN-CTL. ((a) normal/pneumonia; (b) viral pneumonia/bacterial pneumonia; (c) normal/viral pneumonia/bacterial pneumonia).
Figure 9.
Comparison of ROC curves of VGG19 based on RCGAN-CTL. ((a) normal/pneumonia; (b) viral pneumonia/bacterial pneumonia; (c) normal/viral pneumonia/bacterial pneumonia).
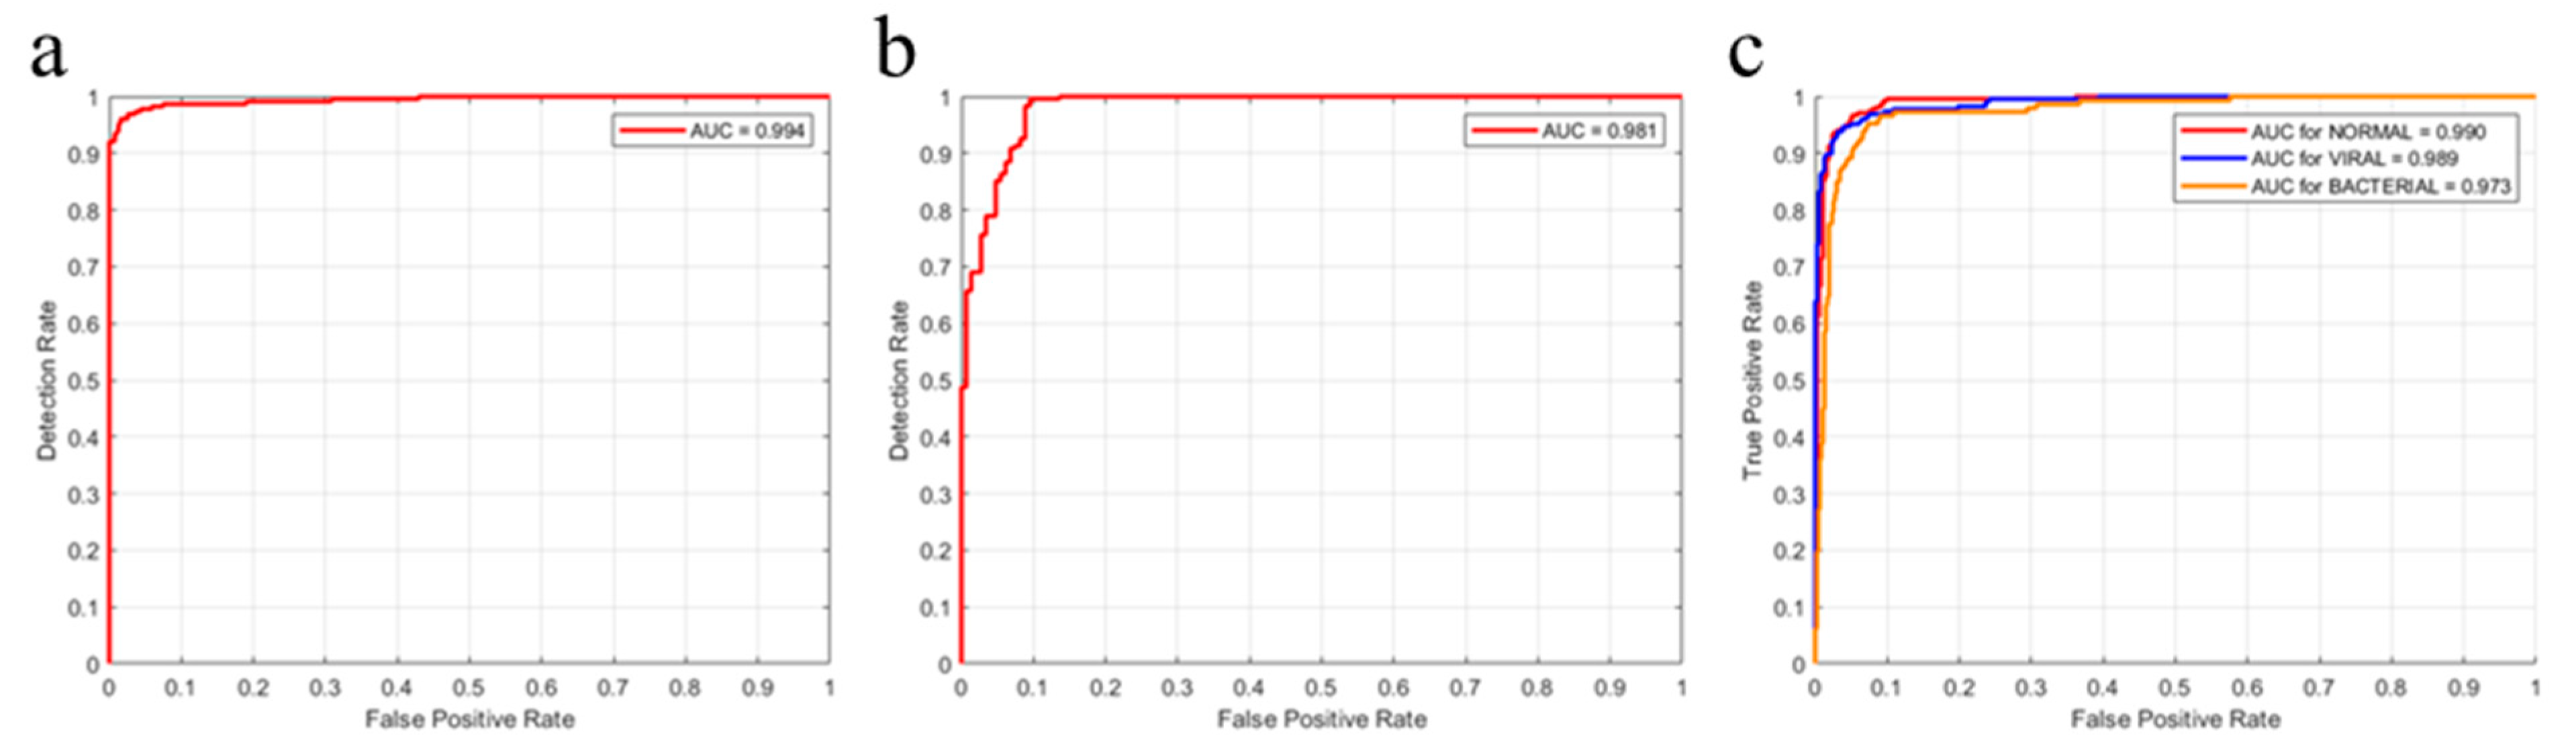
Figure 10.
t-SNE plot comparison of VGG19 based on RCGAN-CTL. ((a) normal/pneumonia; (b) viral pneumonia/bacterial pneumonia; (c) normal/viral pneumonia/bacterial pneumonia).
Figure 10.
t-SNE plot comparison of VGG19 based on RCGAN-CTL. ((a) normal/pneumonia; (b) viral pneumonia/bacterial pneumonia; (c) normal/viral pneumonia/bacterial pneumonia).
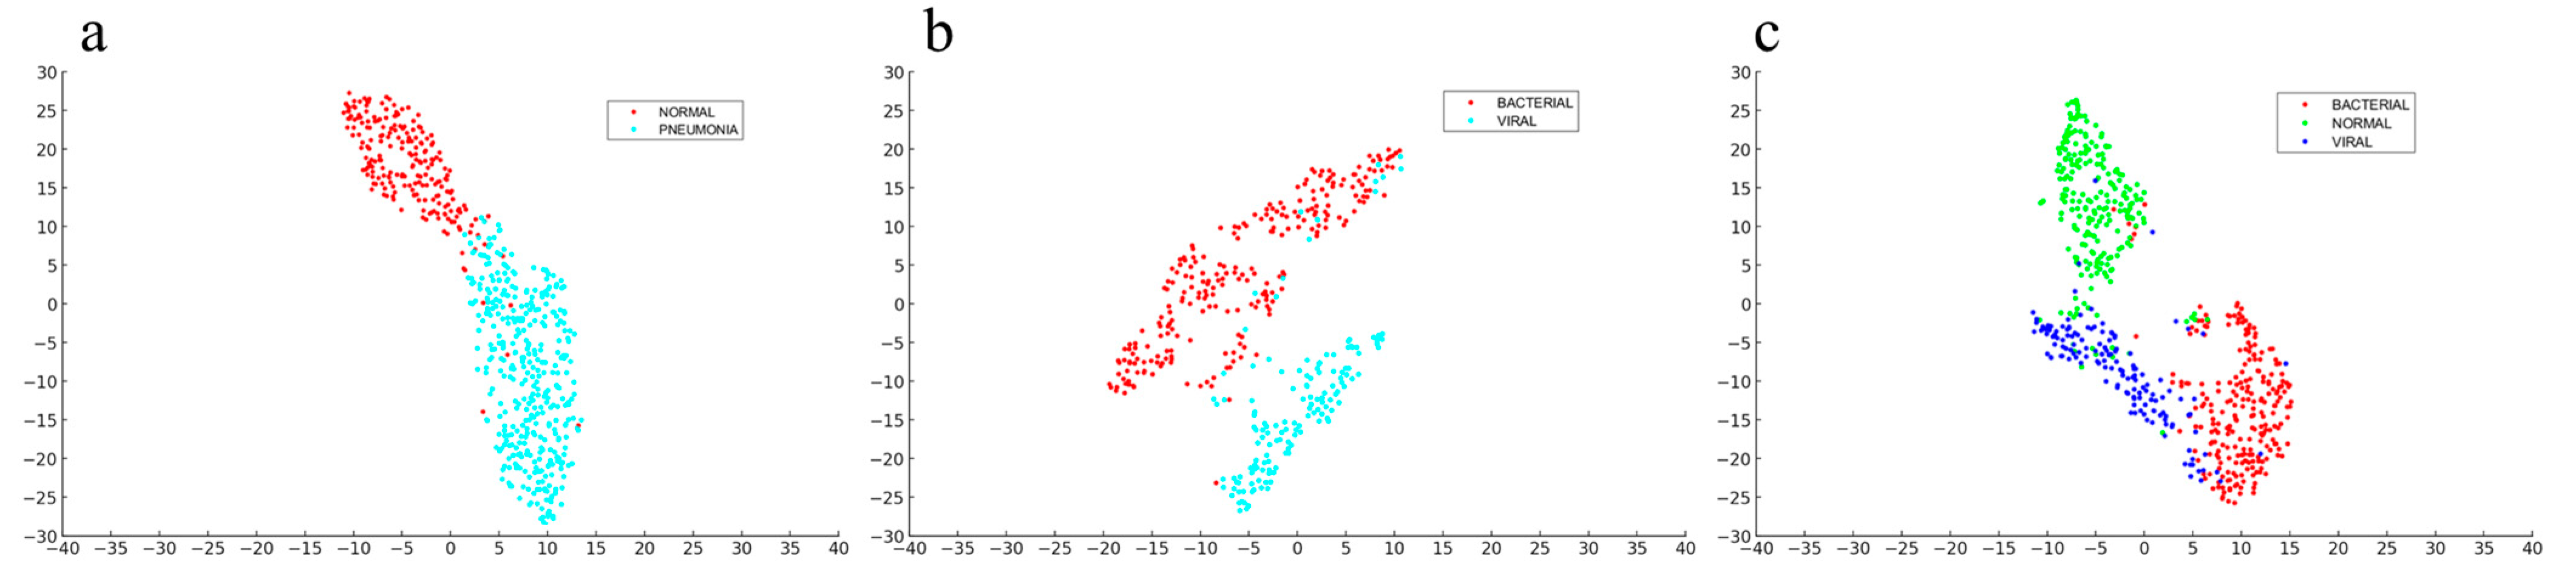
Figure 11.
Activation heat map obtained from RCGAN-CTL-based VGG19 by Grad-CAM technique to visualize and compare the real image with the curved part of the synthetic map decision.
Figure 11.
Activation heat map obtained from RCGAN-CTL-based VGG19 by Grad-CAM technique to visualize and compare the real image with the curved part of the synthetic map decision.

Table 1.
Comparison of the parameters of the proposed method in pneumonia detection with other advanced methods.
Table 1.
Comparison of the parameters of the proposed method in pneumonia detection with other advanced methods.
| Missions | Methods | Accuracy (%) | Precision (%) | Sensitivity (%) | Specificity (%) | F1-Score (%) | AUC (%) |
|---|---|---|---|---|---|---|---|
| Normal/pneumonia | Proposed | 97.7 | 93.8 | 100 | 96.5 | 99.1 | 95.9 |
| VGG-19 | 91.5 | 91.7 | 87.4 | 91.7 | 80.2 | 88.2 | |
| [24] | 98.1 | 98 | 98.5 | 97.9 | 98.3 | 99.4 | |
| [25] | 95.7 | 95.1 | 98.3 | 91.5 | 96.7 | 99.0 | |
| [16] | 92.8 | - | 93.3 | 90.1 | - | 96.8 | |
| [26] | 96.4 | 93.3 | 99.6 | - | - | 99.3 | |
| Bacterial pneumonia/viral pneumonia | Proposed | 94.6 | 99.6 | 92.3 | 99.2 | 95.8 | 98.1 |
| VGG-19 | 85.1 | 83.8 | 91.5 | 70.5 | 87.7 | 89.3 | |
| [24] | 95.1 | 94.4 | 96.1 | 94.3 | 95.5 | 97.6 | |
| [25] | 93.6 | 92.0 | 98.4 | 71.7 | 95.1 | 96.2 | |
| [16] | 90.7 | - | 88.6 | 90.9 | - | 94.0 | |
| Normal/bacterial pneumonia/viral pneumonia | Proposed | 96.1 | 92.0 | 91.5 | 95.2 | 91.7 | 98.6 |
| VGG-19 | 78.6 | 75.6 | 83.2 | 83.1 | 79.9 | 85.6 | |
| [24] | 91.7 | 92.9 | 92.1 | 93.6 | 92.6 | 94.1 | |
| [25] | 91.7 | 91.7 | 90.5 | 95.8 | 91.1 | 93.8 |
Disclaimer/Publisher’s Note: The statements, opinions and data contained in all publications are solely those of the individual author(s) and contributor(s) and not of MDPI and/or the editor(s). MDPI and/or the editor(s) disclaim responsibility for any injury to people or property resulting from any ideas, methods, instructions or products referred to in the content. |
© 2024 by the authors. Licensee MDPI, Basel, Switzerland. This article is an open access article distributed under the terms and conditions of the Creative Commons Attribution (CC BY) license (https://creativecommons.org/licenses/by/4.0/).
Share and Cite
MDPI and ACS Style
Han, K.; He, S.; Yu, Y. Optimizing Pneumonia Diagnosis Using RCGAN-CTL: A Strategy for Small or Limited Imaging Datasets. Processes 2024, 12, 548. https://doi.org/10.3390/pr12030548
AMA Style
Han K, He S, Yu Y. Optimizing Pneumonia Diagnosis Using RCGAN-CTL: A Strategy for Small or Limited Imaging Datasets. Processes. 2024; 12(3):548. https://doi.org/10.3390/pr12030548
Chicago/Turabian StyleHan, Ke, Shuai He, and Yue Yu. 2024. "Optimizing Pneumonia Diagnosis Using RCGAN-CTL: A Strategy for Small or Limited Imaging Datasets" Processes 12, no. 3: 548. https://doi.org/10.3390/pr12030548
Note that from the first issue of 2016, this journal uses article numbers instead of page numbers. See further details here.