


Exergy-Based Improvements of Sustainable Aviation Fuels: Comparing Biorefinery Pathways
by
 , , and
Pablo Silva Ortiz
1,*,
Silvio de Oliveira, Jr.
2,
Adriano Pinto Mariano
3,
Agnes Jocher
1 and
John Posada
4,* 1
School of Engineering and Design, Technical University of Munich (TUM), 85748 Garching, Germany
2
Polytechnic School, University of São Paulo (USP), São Paulo 05508-270, Brazil
3
Faculdade de Engenharia Quimica, Universidade Estadual de Campinas (UNICAMP), Campinas 13083-852, Brazil
4
Department of Biotechnology, Faculty of Applied Sciences, Delft University of Technology (TUDELFT), 2629 HZ Delft, The Netherlands
*
Authors to whom correspondence should be addressed.
Processes 2024, 12(3), 510; https://doi.org/10.3390/pr12030510
Submission received: 23 December 2023
/
Revised: 15 February 2024
/
Accepted: 23 February 2024
/
Published: 1 March 2024
(This article belongs to the Topic Advances in Efficiency, Cost, Optimization, Simulation and Environmental Impact of Energy Systems from ECOS 2023)
Abstract
:The aeronautical sector faces challenges in meeting its net-zero ambition by 2050. To achieve this target, much effort has been devoted to exploring sustainable aviation fuels (SAF). Accordingly, we evaluated the technical performance of potential SAF production in an integrated first- and second-generation sugarcane biorefinery focusing on Brazil. The CO2 equivalent and the renewability exergy indexes were used to assess environmental performance and impact throughout the supply chain. In addition, exergy efficiency (ηB) and average unitary exergy costs (AUEC) were used as complementary metrics to carry out a multi-criteria approach to determine the overall performance of the biorefinery pathways. The production capacity assumed for this analysis covers 10% of the fuel demand in 2020 at the international Brazilian airports of São Paulo and Rio de Janeiro, leading to a base capacity of 210 kt jet fuel/y. The process design includes sugarcane bagasse and straw as the feedstock of the biochemical processes, including diverse pre-treatment methods to convert lignocellulosic resources to biojet fuel, and lignin upgrade alternatives (cogeneration, fast pyrolysis, and gasification Fischer-Tropsch). The environmental analysis for all scenarios shows a GHG reduction potential due to a decrease of up to 30% in the CO2 equivalent exergy base emissions compared to fossil-based jet fuel.
1. Introduction
The aviation industry accounted for 2% of the total global anthropogenic carbon dioxide (CO2) emissions (approximately 859 million metric tons) in 2017, and long-term growth in the air transport sector is expected in the coming decades [1]. Therefore, the International Air Transport Association (IATA) recognizes the need to address the global challenge of climate change, primarily on Greenhouse Gas emissions, and has adopted a net-zero target by 2050 [2]. Moreover, the International Civil Aviation Organization (ICAO) agreed on the adoption of a global market-based scheme to limit international aviation carbon dioxide equivalent (CO2e) emissions based on the Carbon Offsetting and Reduction Scheme for International Aviation (CORSIA). CORSIA has been framed to allow offsetting through the implementation of credits or using CORSIA Eligible Fuels (CEFs), such that international aviation achieves neutral carbon growth as of 2020. CEFs include so-called sustainable aviation fuels (SAFs) as well as lower-carbon aviation fuels (LCAFs). For commercial utilization, SAFs must comply with the American Society for Testing and Materials (ASTM) International standards to be considered a drop-in substitute for petroleum-based aviation fuel [3]. For that, biomass conversion pathways (i.e., ethanol/alcohol-to-jet—ATJ, hydroprocessed esters and fatty acids—HEFA, Fischer-Tropsch synthesis—FT, aqueous phase reforming—APR, direct sugar to hydrocarbon—DSHC, and hydrotreated depolymerized cellulosic jet—HDCJ) have been developed. Figure 1 shows promising pathways for biojet fuel production based on the conversion systems. For instance, the application of these pathways is a function of feedstock, typically recognized between lipid-based (such as camelina oil, jatropha, algae) and carbohydrate-based (such as sugarcane and lignocellulosic biomass) feedstocks. In addition, conversion processes for lipid-based feedstocks include mainly hydroprocessing technologies. In contrast, carbohydrate-based feedstocks are typically converted via biochemical (into sugars) or thermochemical pathways (into bio-oils) based on gasification or pyrolysis processes. Hence, several types of synthesis (fermentative or catalytic) could be applied to upgrade sugars, alcohols, and syngas into biojet fuel [4].
These production pathways have already been assessed in the literature for their economic and environmental performance in the context of various supply chains [5,6,7]. For instance, de Jong et al. [5] performed a supply scenario of non-food renewable jet fuel (RJF) in the European Union (EU) vision 2030 based on biomass availability, conversion technologies, regulatory conditions, and the biomass demand analysis from other sectors (i.e., power, transport, heat, and chemicals). Model scenarios show that non-food RJF supply could reach 3.8–6.1 million t/year (equal to 165–261 PJ/y) by 2030. Santos et al. [6] present a techno-economic analysis (TEA) and an environmental assessment (LCA) of the whole production chain (i.e., biomass production, sugar extraction, biomass pretreatment, sugars fermentation, and products recovery and purification) of a sugarcane-based biorefinery focused on biojet fuel production. The authors also compared multiple options for biomass pretreatment and biojet fuel production routes from sugars and biomass. GHG emissions and non-renewable energy use (NREU) were mainly lower than 42.5 kgCO2eq/GJ and 700 MJ/GJ for all scenarios, respectively. Michailos [7] promoted the production of farnesane from bagasse, aiming at diversifying energy supplies and mitigating the environmental impacts of the aviation sector from the lignocellulosic sugars pathway to biojet fuel. The results show a mass yield of 0.121 kgjet fuel/kgdry bagasse and an energy efficiency of 26.5%. Cradle-to-grave GHG emissions reductions compared to fossil jet fuel can be approximately 47%.
Gerber et al. [8] presented a methodology to integrate LCA in thermo-economic models for the optimal conceptual design of energy conversion systems. De Jong et al., 2017 [9] compared the well-to-wake (WtWa) GHG emission performance of multiple renewable jet fuel (RJF) conversion pathways and explored the impact of different co-product allocation methods. The results show that FT yields the highest GHG emission reduction compared to fossil jet fuel (86–104%) of the pathways in scope, followed by Hydrothermal Liquefaction (77–80%) and sugarcane- (71–75%) and corn stover-based ATJ (60–75%). Capaz et al. [10] performed an attributional life-cycle assessment for ten RJF pathways in Brazil, considering the environmental trade-offs between climate change and other impact categories. The scope includes sugarcane and soybean for first-generation (1G) pathways and residual materials (wood and sugarcane residues, beef tallow, and used cooking oil) for second-generation (2G) pathways. Three certified technologies were analyzed: HEFA, ATJ, and FT. Results show that 1G pathways significantly reduce GHG compared to fossil kerosene from 55% (soybean/HEFA) to 65% (sugarcane/ATJ). Mussatto et al. [11] summarize and discuss different SAF technologies, their potential to be upscaled, and their techno-economic perspectives, as well as the comprehensive impact of SAF on sustainability from an industry point of view, focusing on the production and use of aviation biofuels.
In addition, the assessment of performance variables to accelerate the SAF deployment at different regional scales has been explored. Bhatt et al. [12] evaluated the implications of key variables including type and quantity of feedstock availability, SAF production cost, GHG emissions, and fuel/infrastructure logistics on the deployment of SAF in Chicago, USA. These authors demonstrated that woody biomass-based Fischer-Tropsch technology has the lowest fuel production costs of all pathways assessed, reducing GHG emissions by 86% compared to conventional jet fuel. Rojas Michaga et al. [13] evaluated the technical, economic, and environmental performance of a Power-to-Liquid (PtL) route for SAF production in the UK context. This SAF production system involves a direct air capture unit, an off-shore wind farm, an alkaline electrolyzer, and a processing plant (reverse water gas shift coupled with an FT reactor). A WtWa life-cycle assessment shows that the global warming potential (GWP) equals 21.43 gCO2eq/MJSAF, and is highly dependent on the upstream emissions of the off-shore wind electricity. The study concludes by estimating the required monetary value of SAF certificates for different scenarios under the UK SAF mandate guidelines. Sacchi et al. [14] showed a climate-neutral aviation fly strategy for Europe based on LCA and a time-dependent quantification of non-CO2 climate impacts. This study demonstrates from a technological standpoint that using electricity-based synthetic jet fuels and compensating for climate impacts via direct air carbon capture and storage can enable climate-neutral aviation.
However, while previous case studies have mainly focused on economic and environmental performances to identify the most promising SAF pathways, a multi-criteria approach based on complementary methods, such as exergy analysis, environmental assessment-GHG emissions, and renewability exergy measurement, has not yet been reported. This work presents a multi-criteria analysis to assess an integrated first- and second-generation sugarcane biorefinery for biojet fuel production in Brazil using performance indicators, namely exergy efficiency (ηB), carbon dioxide equivalents (CO2EE), average unitary exergy costs (AUEC), and the renewability exergy indicator (λ). As case studies, we examine biochemical processes to convert lignocellulosic resources to biojet fuel and lignin upgrade alternatives (cogeneration, fast pyrolysis, and gasification Fischer-Tropsch). Hence, a systematic comparison based on exergy and environmental analyses, renewable percentage, and exergy costs was used to determine the overall performance of the biorefinery pathways.
2. Materials and Methods
Twenty-four (24) biorefinery pathways were selected and assessed based on a pre-screening phase of eighty-one (81) configurations covering the conversion of (i). first-generation (1G) sugar (sucrose) and (ii). sugarcane bagasse for either production of second-generation (2G) sugar or direct conversion into jet fuel.
The multi-criteria approach includes mass, energy, and exergy balances of each biorefinery system based on theoretical and empirical correlations to determine the thermodynamic properties in the models. Then, exergy efficiencies, exergy losses, and the exergy use/export, as well as the environmental metric (i.e., specific CO2 equivalent emissions) related to the conversion processes, were considered performance indicators, allowing a systematic comparison based on an exergy-based analysis of the pathways. Hence, the interconnection among exergy and environmental analyses, renewable percentage, and exergy costs was used to determine the overall performance of the biorefinery scenarios. Mass, energy, and exergy balances were modeled in spreadsheets based on parameters [6] from a Brazilian modern plant. For the 2G production from bagasse, the following pre-treatment methods were assessed: dilute acid (DA), dilute acid + alkaline treatment (DA-A), steam explosion (SE), steam explosion + alkaline treatment (SE-A), organosolv (O), wet oxidation (WO), liquid hot water (LHW), and liquid hot water + alkaline treatment (LHW-A) [6]. Then, the resulting streams underwent detoxification and enzymatic hydrolysis to produce fermentable sugar. For lignin, three possibilities were considered: cogeneration (cogen), jet fuel production via fast pyrolysis (FPJ), and biojet fuel production via gasification Fischer-Tropsch (GFT). Moreover, auxiliary steps were analyzed for each biorefinery scenario based on the process data from Santos et al. [6], i.e., wastewater treatment (WWT) and H2 steam methane reforming (H2SMR). Table A1, Table A2, Table A3 and Table A4 present the technical parameters of the milling process, ethanol upgrade to jet process considerations, and operation parameters adopted in lignin fast pyrolysis and syngas Fischer-Tropsch. Lastly, Table A5 reports the main KPIs for each biorefinery (81 configurations) analyzed in the pre-screening step. Figure 2 shows a simplified flow chart of the processing sections and system boundaries adopted in this study.
2.1. Production Technologies and Processing Conditions
A sugarcane field with a productivity of 12,000 t of sugarcane (SC) per day was selected as it represents the processing capacity of a typical sugarcane mill in São Paulo State (SP-Brazil) operating 200 days a year.
The biorefinery plant is divided into four areas: SC milling, bagasse pre-treatment, fermentation, upgrade (intermediate products to jet fuel/thermochemical upgrade of lignin and bagasse to jet fuel), and auxiliary sections (Figure 2). The cane is transported on a conveyor belt to the plant. In this first step, sugarcane is chopped and cleaned. The bagasse (lignocellulosic fraction) is divided from the sugarcane juice (liquid fraction). Then, the juice is processed into sugar and ethanol. Sugar is produced by evaporation, clarification, and crystallization stages. The remaining juice (molasses stream), a high concentration of fermentable sugars, is converted into ethanol by fermentation with yeast. Lastly, the ethanol obtained in the fermentation step is separated by distillation from hydrated ethanol (95 wt%) and then separated using molecular sieves to produce anhydrous ethanol (99.8 wt%).
2.2. Exergy Assessment
The exergy analysis method, which combines the First and Second Laws of Thermodynamics, was used to assess the efficiency of sugarcane-based biorefineries for jet fuel production. Exergy is a thermodynamic propriety that represents the maximum work that could be obtained through reversible processes from a system that interacts with the components of the environment until the equilibrium state (e.g., mechanical, thermal, and chemical) is attained [16]. Therefore, exergy analysis provides a rational metric for evaluating the quality and quantity of a given energy resource. Based on the prevailing environmental conditions, it denotes the maximum of this particular energy resource that can be converted into work [17].
Exergy Balance
The SC biorefinery scenarios are based on the steady-state mass, energy, and exergy balances for each control volume (see Equations (1)–(3)), referring to all inlet and exit matter streams, work, and heat transfers adopted in the assessment [18].
where denotes the exergy flow rate of the process inputs (), the exergy flow rate of the process output (), and the Irreversibility rate (exergy destroyed). In this study, both chemical (bCH) and physical (bPH) exergies are determined due to the physico-chemical processes included.
- Exergy efficiency: The exergy efficiency for the biorefinery pathways is determined by the ratio between the sum of exergy products and the sum of exergy resources as given in Equation (4) [19].
- Irreversibility rate: The irreversibility rate was found by applying the exergy balance expression introduced in Equation (3).The specific exergy values [15] of the inputs considered were 5130 kJ/kg (SC), 16,725 kJ/kg (straw), and 9667 kJ/kg (SCbagasse). Concerning the exergy of the products, the values adopted in the simulations of the analyzed plants were 17,479 kJ/kg (sugar) and 27,042 kJ/kg (bioethanol). The specific chemical exergies are usually close to their lower heating value (LHV) for fuels in reference conditions of temperature and pressure (T0 and P0). The relation between bCH and LHV values for several fossils is mainly given in Szargut et al. [9], and for bio-based raw materials in Silva Ortiz et al. [8]. Table A6 shows the standard chemical exergy (bCH) per resource adopted. The technological comparisons carried out in Section 3.2 are based on the exergy efficiency calculations of each scenario, where the exergy of the products and the inputs are established based on the relation between bCH and LHV values.
2.3. Specific CO2 Equivalent Emissions
The environmental analysis is comprised of calculations for GHG emissions in a cradle-to-gate approach plus the cogeneration unit boundaries concerning the exergy of the products. Energy allocation was employed to determine the specific GHG emissions of the production of jet fuel using the various biorefinery configurations. Individual environmental impact factors per type of process input are given in Table A6 (e.g., feedstocks and utilities). The impact assessment method selected was ‘cane sugar production with ethanol by-product’ (Brazilian case-Activity) [20], and the impact category ‘Global Warming Potential (GWP 100 years)’ was determined as an environmental performance indicator. Hence, the environmental factors combined with the exergy value of the products yield the CO2 equivalent emissions in the exergy base (CO2EE); see Equation (5) [21],
2.4. Average Unitary Exergy Cost (AUEC)
AUEC represents the amount of exergy necessary to obtain one unit of product. AUEC is applied as a parameter to measure the cumulative irreversibility and exergy consumption, which occurs in the upstream processes to form a particular exergy stream [22]. Consequently, higher irreversibility translates into higher AUEC unit exergy costs. According to Equation (6), the average unit exergy cost c (kJ/kJ) of the biofuel production processes and the electricity can be established as the weighted average of the exergy costs of these products. More details about the unit exergy cost and exergy efficiency definitions applied to bioenergy systems are given in Silva Ortiz et al. [8].
2.5. Renewability Exergy Index
The exergo/environmental analysis concerning the renewability of biorefinery systems was conducted using the renewability exergy index (λ) [19]. The renewability index incorporates the exergy associated with the useful products (Bproducts or co-products) of a specified energy conversion process, the destroyed exergy (Bdestroyed), the exergy associated with non-renewable inputs (Bfossil), the exergy required to dispose of wastes, and the exergy flows related to emissions, residues, and untreated wastes, as detailed in Equation (7). Thus, analyzing the renewability of energy conversion processes contributes to an assessment by using thermodynamic parameters [23].
The value of the λ index indicates (i). 0 ≤ λ < 1 for environmentally unfavorable processes; (ii). λ = 1 for internally and externally reversible processes with non-renewable inputs; (iii). λ > 1 for processes environmentally favorable; and (iv). λ→∞ for reversible processes with renewable inputs and no wastes generated. When the renewability exergy index is greater than 1, the Bproducts can be used to “restore” the environment to the prevailing conditions before the process and still obtain a positive flow of exergy for another use. Note that λ is closely related to the control volume (CV) analyzed, due to the number of energy conversion processes involved. Hence, when the selected CV is expanded, the λ value decreases as a function of the irreversibility and the contribution of non-renewable (fossil) inputs to the process. It is essential to guarantee the compatibility of the CV when different systems are compared to prevent distortions during the evaluation. The interpretation of the renewability exergy index that focuses on bioethanol production routes is presented in Silva Ortiz et al. [21], which synthesizes the case studies related to biomass conversion via biochemical and thermochemical methods.
Usually, the application of exergy-based methods to measure the performance of biofuels refers to the evaluation of the exergy efficiency of biomass-to-biofuel conversion processes, including renewable and non-renewable resources. The sustainability and renewability of bioenergy processes involve many environmental and ecological aspects, such as emissions of greenhouse gases (e.g., the life-cycle assessment) or land-use changes. To quantify the degree of non-renewable resources in biofuel conversion processes, the exergy accounting should be performed over the entire bioenergy life cycle, from crop cultivation until the final biofuel is obtained in the conversion process [18]. Hence, the exergy concept became a key factor for various sustainability metrics for bioenergy systems [19] and biofuel production pathways [24,25].
3. Results and Discussion
The processes were assessed based on the mass, energy, and exergy balances of the twenty-four (24) biorefinery pathways selected. These criteria were used to evaluate each scenario’s performance according to technical, environmental, and economic exergy-based conditions.
3.1. Sugarcane Biorefineries Performance
The exergy performance for the twenty-four biorefinery scenarios is given in Figure 3. Overall, a better performance was obtained by combining the pre-treatment processes with the alkaline treatment (DA-A, SE-A, LHW-A) than by the lignocellulosic pre-treatments carried out alone (DA, SE, O, WO, and LHW). The main KPIs for each biorefinery analyzed in the pre-screening phase (81 configurations) are reported in the Appendix A section (Table A5).
In the bagasse pre-treatment methods, the wet oxidation (WO) process generated the highest exergy efficiency. The second-best pre-treatment option was organosolv (O-AA) for acetic acid recovery, which improves the biomass fiber conversion. Figure 3a shows the alternative uses for lignin (FPJ, GFT, and COGEN). The global exergy efficiency performed better for the scenarios that used fast pyrolysis (FPJ). Figure 3b depicts the specific CO2 equivalent emissions in the exergy base for the sugarcane biorefinery pathways. All technologies should lead to at least a 30% decrease in environmental impacts compared to 85–95 kg CO2 GJ−1 from conventional petroleum-based jet fuel [3].
Pathways employing dilute acid (DA), dilute acid + alkaline treatment (DA-A), and wet oxidation (WO) were ranked as having the highest emissions among the twenty-four scenarios. In contrast, steam explosion (SE), steam explosion + alkaline treatment (SE-A), and organosolv (O) remained consistently below the emission targets because of higher yields of jet fuel.
Thus, by applying the CO2 equivalent indicator and renewability exergy index, the exergy concept was used as an ecological metric to quantify the exergy losses and to determine the presence of emissions in the environment. In brief, the λ for the sugarcane biorefineries was environmentally unfavorable for all 24 scenarios, indicating that the exergy of the products cannot always be used to restore the environment to the conditions prior to operating the process, mainly due to the total irreversibility found in the jet fuel production and power generation processes.
Lastly, the exergy cost measures the cumulative irreversibility and exergy consumption (kJ/kJ). Thus, the AUEC was calculated for each biorefinery pathway focusing on jet fuel production (see Figure 3c). The lower exergy cost of the systems was obtained in the FPJ technology as an alternative to the lignin destination. Table 1 gives an overview of the primary KPIs for each renewable jet fuel scenario.
Similarly, Figure 4 indicates that the λ index performed better for the biorefinery systems that use fast pyrolysis as a method to process lignin, confirming the relationship between the technological pathway renewability and the exergy performance.
3.2. Benchmark of Renewable Jet Fuel Conversion Routes
In terms of biojet fuel production, when compared with the technologies based on integrating 1G and 1G–2G systems, the exergy performances of the hydrothermal liquefaction (HTL) processes using various catalysts such as water (H2O), sodium carbonate (Na2CO3), and iron (Fe) show the higher efficiencies and renewability index, followed by the hydroprocessed esters and fatty acids, Fischer-Tropsch, and alcohol-to-jet systems. These comparisons were calculated based on the screening of the technologies/feasibility level. Thus, the accuracy range with a typical variation (L: −20% to −30%) in low ranges is determined by the function of the state of process technology and data availability. In addition, the bagasse and straw consumption varies between authors for each technological route, which contrasts the exergy efficiency against the AUEC and, consequently, the CO2 emissions emitted in the atmosphere due to its operation and the exergy of the products for each scenario. Hence, the overall analysis was based on the fuel production rate and the surplus electricity available for sale to the grid as main products. The λ was defined according to Equation (7) within the exergy of the “fossil” (chemical and biochemical inputs), the exergy of products, the exergy associated with the CO2 emissions, and the irreversibilities.
To summarize the main results investigated by Klein et al. [26], Tzanetis et al. [27], Santos et al. [6], Alves et al. [28], and Braz and Mariano [29], Figure 5 provides the technical parameters included in the comparison of these biomass-based routes. In general, these publications adopted a cradle-to-gate approach, which focuses the analysis on the production of fuels and biobased products and excludes their final use (carbon burned associated with planes’ engines) and disposal/deactivation phases. Lastly, Figure 5 contrasts the renewable jet fuel conversion routes against the promising scenarios (top 3 pathways) determined by the selected KPIs in this study.
4. Conclusions
The environmental impact and global performance of twenty-four promising biojet fuel routes were determined via a multi-criteria decision support analysis based on the selected KPIs to quantify the irreversibility and rank these technologies.
Concerning the exergy-based performance analysis, the λindex performs better for all pathways that use fast pyrolysis as a technology for lignin destination. Nonetheless, the exergy of the products could not be used to restore the environment to the conditions prior to the processing. The exergy assessment demonstrates that pre-treatment methods combined with the alkaline treatment (e.g., DA-A, SE-A, LHW-A) have a higher global performance than standalone lignocellulosic pre-treatments (e.g., DA, SE, O, WO, and LHW). The environmental performance applying the carbon dioxide equivalent indicator and the renewability exergy index as impact criteria shows that all pathways lead to a 30% reduction of specific CO2 equivalent emissions in the exergy base compared to the conventional fossil-based jet fuels.
These insights on biomass-based fuels not only encourage further research in technology developments but also explore synergies across the competing biomass demand sectors (i.e., transport, heat, power, and biochemicals) to achieve competitiveness and significant potential for impact reduction regarding CO2 and primary energy use based on a regulatory context (Brazilian framework, Renovabio), biomass availability, and conversion technologies conditions. For instance, the analysis could be extended to non-drop-in fuels (ICAO fuel categorization), which require changes to existing and legacy airframes and fueling infrastructure (i.e., liquefied gas aviation fuels, cryogenic hydrogen, and electricity); the analysis may also consider heat integration strategies in the integrated biorefinery systems and the addition of fuel use projections and the final use step (aircraft and engine combustion).
Finally, these types of KPIs based on thermodynamic principles could support certification processes and the regulation of international aviation emissions towards implementing regional market-based measures by country/area. Specific focus could be given to drop-in and non-drop-in fuels and deploying pathways, including emissions-trading systems such as the European Union Emissions Trading System (EU-ETS) and policies/regulations to promote (CORSIA) sustainable aviation fuels.
Author Contributions
Conceptualization, P.S.O. and J.P.; methodology, P.S.O. and S.d.O.J.; validation, P.S.O., A.P.M. and A.J.; formal analysis, P.S.O. and A.P.M.; investigation, P.S.O., S.d.O.J., A.P.M., A.J. and J.P.; resources, A.J. and J.P.; data curation, P.S.O., A.P.M. and J.P.; writing—original draft preparation, P.S.O.; writing—review and editing, P.S.O., S.d.O.J., A.P.M., A.J. and J.P.; supervision, A.P.M., A.J. and J.P. All authors have read and agreed to the published version of the manuscript.
Funding
The second author acknowledges CNPq (Brazilian National Council for Scientific and Technological Development) for grant 306484/2020-0.
Data Availability Statement
Data are contained within the article.
Conflicts of Interest
The authors declare no conflicts of interest.
Nomenclature
| AUEC | Average unit exergy cost (kJ/kJ) |
| B | Exergy flow rate (kW) |
| b | Specific exergy (kJ/kg) |
| bch | Standard chemical exergy (kJ/kg) |
| c | Average unit exergy cost (kJ/kJ) |
| CO2EE | Specific CO2 equivalent emissions (exergy base) (kg/GJ) |
| CV | Control volume |
| I | Irreversibility rate (KW or MW) |
| h | Specific enthalpy (kJ/kg) |
| Mass flow rate, (kg/s) | |
| P | Pressure (kPa, bar) |
| Heat rate (kW) | |
| s | Specific entropy (kJ/kg K) |
| t | Temperature, (°C, K) |
| Power, (kW) | |
| x | Mole or mass fraction |
| ηB | Exergy efficiency (%) |
| Abbreviations | |
| ATJ | Alcohol-to-Jjet |
| DSHC | Direct Sugar to Hydrocarbon |
| CORSIA | Carbon Offsetting and Reduction Scheme for International Aviation |
| FT | Fischer-Tropsch |
| LCAF | Lower-Carbon Aviation Fuels |
| HDCJ | Hydrotreated Depolymerized Cellulosic Jet |
| HEFA | Hydroprocessed Esters and Fatty Acids |
| H2SMR | Hydrogen Steam Methane Reforming |
| NREU | Non-Renewable Energy Use |
| GFT | Gasification Fischer-Tropsch |
| GHG | Greenhouse gas emissions |
| GWP | Global Warming Potential |
| SC | Sugarcane |
| PtL | Power-to-Liquid |
| WWT | Wastewater Treatment |
| WtWa | Well-to-Wake |
| Greek symbols | |
| η | efficiency |
| λ | renewability exergy index |
Appendix A
Table A1 presents the technical parameters of the milling process adopted in this study, whereas Table A2 shows the main parameters considered in the ethanol upgrade to jet process. Furthermore, Table A3 and Table A4 display the operation parameters adopted in lignin fast pyrolysis and syngas Fischer-Tropsch, respectively. Lastly, Table A5 displays the key performance indicators for all the configurations analyzed and Table A6 gives the emission characterization factors and standard chemical exergy per resource.

Table A1.
Operation parameters of the milling process.
| Unit | Condition | Value | Units |
|---|---|---|---|
| Cleaning and crushing | Water make-up | 0.05 | m3/TC * |
| Fibers separation efficiency | 100 | % | |
| Bagasse moisture | 53.8 | % | |
| Imbibition water | 0.28 | ton/TC | |
| Imbibition water recycling | 100 | % | |
| Liming settling and filtration | Sugars (sucrose, glucose) recovered | 95 | % |
| Phosphoric Acid (H3PO4) | 0.2 | kg/ton SC | |
| Calcium oxide (CaO) | 1 | kg/TC | |
| Flocculant polymer | 2.5 | g/TC | |
| Fraction of soluble solids retained in filter | 65 | % | |
| Fraction of insoluble solids precipitated | 99.7 | % | |
| Washing water | 8.19 | kg/kgsugars | |
| Juice concentration | Pressure in 5th effect | 0.16 | bar |
| Temperature in 1st effect | 115 | °C | |
| Juice solids content to sell | 65 | % | |
| Juice solids content to fermentation | Defined in fermentation with constraints
| ||
Table A2.
Operation parameters considered in ethanol upgrade to jet process.
| Unit | Condition | Value |
|---|---|---|
| Pump | ΔP (bar) | 4 |
| Dehydration reactor | P (bar)0/T (°C) | 4/375 |
| Catalyst used | Heterogeneous, 0.5%La–2%P H-ZSM-5 | |
| Reactor specifications | Multi-tubular fixed bed in a furnace | |
| Decanter (Fraction of components in the gas outlet) | Water ethylene | 1.16% 100% |
| Compressor | ΔP (bar) | 30 |
| Oligomerization reactor butylene synthesis | P (bar)/T (°C) | 30/200 |
| Oligomerization reactorbutylene oligomerization | P (bar)/T (°C) | 89/200 |
| Oligomerization general | Catalyst | Ziegler Natta-type |
| Reactor type | Fixed bed | |
| Compressor of H2 | ΔP (bar) | 30 |
| Hydrogenation reactor and decanter | P (bar)/T (°C) | 30/250 |
| Catalyst | palladium and platinum over GAC | |
| WHSV (h−1) w/w | 3 | |
| Lifetime (years) | 5 | |
| H2 requirement (kg/kg olefins) | 0.05 | |
| H2 excess | 50% of the amount reacted | |
| Steam distillation | Live steam required (kg/kg paraffin) | 0.258 |
| Fraction of compounds in LPG stream | ||
| LPG Naphtha Water | 97% 32% 2.38% | |
| Fraction of compounds in naphtha stream | ||
| LPG Naphtha Water | 3% 62% 0.01% | |
Table A3.
Operation parameters considered in lignin fast pyrolysis.
| Unit | Condition | Value |
|---|---|---|
| Lignin dryer | Max. lignin moisture | 8% |
| T final (°C) FPJ | 307 | |
| Air make-up (kg air/kg water evaporated) | 2.605 | |
| Lignin grinder | Diameter of lignin particles (mm) | ≈2 |
| Fast pyrolysis fluidized auger bed | P (bar)/T (°C)/Residence time (s) | 1.5/500/2 |
| Sand/biomass (kg/kg) | 14.5 | |
| Fluidization gas/lignin (kg/wet kg lignin) | 3 | |
| Cyclone | Solid/gas separation efficiency | 100% |
| Quenching column | Chilled water/inlet stream (kg/kg) | 1.445 |
| Fraction of components in the bio-oil stream | ||
| Phenolics (organic liquid fraction bio-oil) Light ends Water Non-condensable compounds | 100% 49.34% 45.06% 0% | |
| Sand heater/Char combustor | T of gas and sand (°C) | 608 |
| O2 excess (kgO2/kgO2 consumed in char combustion) | 1.2 | |
Table A4.
Operation parameters adopted in syngas Fischer-Tropsch.
| Unit | Condition | Value |
|---|---|---|
| Syngas polishing | P (bar)/T (°C) | 25/150 |
| Packing/lignin flowrate (kg/kg dry lignin/day) | 0.853 | |
| Max. H2S concentration (kg/kg clean syngas) | 5.0 × 10⁻⁸ | |
| Max. NH3 concentration (kg/kg clean syngas) | 1.0 × 10⁻⁵ | |
| H2 SMR | P (bar)/T (°C) | 25/870 |
| Catalyst | Ni and aluminum | |
| Catalyst/H2 synthesized flowrate (kg/kg H2/day) | 0.058 | |
| HP steam/CH4 inlet (mol/mol) | 6 | |
| CH4 concentration in the outlet (%) | 1.5 | |
| T outlet (°C) of cooling water | 300 | |
| Water gas shift | Catalyst | Copper-zinc |
| Catalyst/lignin flowrate (kg/kg/day) | 0.00297 | |
| PSA | H2 recovery efficiency/Purity (%) | 85/100 |
| Packing | 2/3 with activated carbon and 1/3 with molecular sieve | |
| H2/carbon compounds in PSA outlet (mass %) | 0.0136 | |
| FT reactor | P (bar)/T (°C) | 25/200 |
| Catalyst | Cobalt on AlO3 | |
| Catalyst/lignin flowrate (kg/kg/day) | 0.0926 | |
| Separator/Decanter | Water/gas/organic phase separation efficiency | 100% |
| Hydroprocessing | H2 requirementminimum (kg H2/kg waxes) | 0.06 |
Table A5.
Key performance indicators for each biorefinery configuration.
| 1 | 2 | 3 | 4 | 5 | 6 | 7 | 8 | 9 | |
|---|---|---|---|---|---|---|---|---|---|
| pre-treatment | DA | DA | DA | DA | DA | DA | DA | DA | DA |
| technology | ATJ | ATJ | ATJ | DFJ | DFJ | DFJ | DFJ-DA | DFJ-DA | DFJ-DA |
| lignin destination | FPJ | GFT | cogen | FPJ | GFT | cogen | FPJ | GFT | cogen |
| ηB (%) | 43.16 | 40.55 | 37.88 | 20.63 | 19.54 | 15.54 | 22.15 | 19.14 | 16.22 |
| Binputs (KW) | 210,525 | 210,525 | 210,525 | 210,525 | 210,525 | 210,525 | 210,525 | 210,525 | 210,525 |
| Boutputs (KW) | 91,041 | 85,540 | 79,881 | 43,522 | 41,216 | 32,783 | 46,716 | 40,375 | 34,212 |
| I (KW) | 119,084 | 124,573 | 130,264 | 166,609 | 168,903 | 177,371 | 163,424 | 169,753 | 175,952 |
| AUEC (kJ/kJ) | 2.32 | 2.47 | 2.64 | 4.85 | 5.12 | 6.43 | 4.51 | 5.22 | 6.16 |
| 10 | 11 | 12 | 13 | 14 | 15 | 16 | 17 | 18 | |
| pre-treatment | DA-A | DA-A | DA-A | DA-A | DA-A | DA-A | DA-A | DA-A | DA-A |
| technology | ATJ | ATJ | ATJ | DFJ | DFJ | DFJ | DFJ-DA | DFJ-DA | DFJ-DA |
| lignin destination | FPJ | GFT | cogen | FPJ | GFT | cogen | FPJ | GFT | cogen |
| ηB (%) | 44.22 | 42.37 | 41.64 | 19.44 | 17.59 | 16.86 | 19.44 | 17.60 | 16.86 |
| Binputs (KW) | 210,525 | 210,525 | 210,525 | 210,525 | 210,525 | 210,525 | 210,525 | 210,525 | 210,525 |
| Boutputs (KW) | 93,282 | 89,383 | 87,827 | 41,011 | 37,113 | 35,557 | 41,011 | 37,113 | 35,557 |
| I (KW) | 116,831 | 120,726 | 122,296 | 169,109 | 173,005 | 174,575 | 169,119 | 173,014 | 174,585 |
| AUEC (kJ/kJ) | 2.26 | 2.36 | 2.40 | 5.14 | 5.68 | 5.93 | 5.14 | 5.68 | 5.93 |
| 19 | 20 | 21 | 22 | 23 | 24 | 25 | 26 | 27 | |
| pre-treatment | SE | SE | SE | SE | SE | SE | SE | SE | SE |
| technology | ATJ | ATJ | ATJ | DFJ | DFJ | DFJ | DFJ-DA | DFJ-DA | DFJ-DA |
| lignin destination | FPJ | GFT | cogen | FPJ | GFT | cogen | FPJ | GFT | cogen |
| ηB (%) | 43.25 | 40.69 | 38.37 | 20.43 | 17.87 | 15.55 | 20.43 | 17.88 | 15.55 |
| Binputs (KW) | 210,525 | 210,525 | 210,525 | 210,525 | 210,525 | 210,525 | 210,525 | 210,525 | 210,525 |
| Boutputs (KW) | 91,215 | 85,825 | 80,910 | 43,088 | 37,698 | 32,783 | 43,088 | 37,698 | 32,783 |
| I (KW) | 118,937 | 124,314 | 129,262 | 167,072 | 172,449 | 177,397 | 167,081 | 172,459 | 177,407 |
| AUEC (kJ/kJ) | 2.31 | 2.46 | 2.61 | 4.89 | 5.59 | 6.43 | 4.89 | 5.59 | 6.43 |
| 28 | 29 | 30 | 31 | 32 | 33 | 34 | 35 | 36 | |
| pre-treatment | SE-A | SE-A | SE-A | SE-A | SE-A | SE-A | SE-A | SE-A | SE-A |
| technology | ATJ | ATJ | ATJ | DFJ | DFJ | DFJ | DFJ-DA | DFJ-DA | DFJ-DA |
| lignin destination | FPJ | GFT | cogen | FPJ | GFT | cogen | FPJ | GFT | cogen |
| ηB (%) | 44.00 | 42.30 | 41.64 | 19.22 | 17.52 | 16.86 | 19.22 | 17.52 | 16.86 |
| Binputs (KW) | 210,525 | 210,525 | 210,525 | 210,525 | 210,525 | 210,525 | 210,525 | 210,525 | 210,525 |
| Boutputs (KW) | 92,806 | 89,222 | 87,827 | 40,536 | 36,951 | 35,557 | 40,536 | 36,951 | 35,557 |
| I (KW) | 117,323 | 120,904 | 122,312 | 169,602 | 173,183 | 174,591 | 169,608 | 173,189 | 174,596 |
| AUEC (kJ/kJ) | 2.27 | 2.36 | 2.40 | 5.20 | 5.71 | 5.93 | 5.20 | 5.71 | 5.93 |
| 37 | 38 | 39 | 40 | 41 | 42 | 43 | 44 | 45 | |
| pre-treatment | O-AA | O-AA | O-AA | O-AA | O-AA | O-AA | O-AA | O-AA | O-AA |
| technology | ATJ | ATJ | ATJ | DFJ | DFJ | DFJ | DFJ-DA | DFJ-DA | DFJ-DA |
| lignin destination | FPJ | GFT | cogen | FPJ | GFT | cogen | FPJ | GFT | cogen |
| ηB (%) | 44.43 | 43.29 | 40.65 | 20.24 | 19.10 | 16.46 | 20.24 | 19.10 | 16.46 |
| Binputs (KW) | 210,525 | 210,525 | 210,525 | 210,525 | 210,525 | 210,525 | 210,525 | 210,525 | 210,525 |
| Boutputs (KW) | 93,751 | 91,347 | 85,765 | 42,702 | 40,298 | 34,716 | 42,702 | 40,298 | 34,716 |
| I (KW) | 116,310 | 118,701 | 124,313 | 167,366 | 169,757 | 175,369 | 167,376 | 169,767 | 175,379 |
| AUEC (kJ/kJ) | 2.25 | 2.31 | 2.46 | 4.94 | 5.24 | 6.08 | 4.94 | 5.24 | 6.08 |
| 46 | 47 | 48 | 49 | 50 | 51 | 52 | 53 | 54 | |
| pre-treatment | O-GAC | O-GAC | O-GAC | O-GAC | O-GAC | O-GAC | O-GAC | O-GAC | O-GAC |
| technology | ATJ | ATJ | ATJ | DFJ | DFJ | DFJ | DFJ-DA | DFJ-DA | DFJ-DA |
| lignin destination | FPJ | GFT | cogen | FPJ | GFT | cogen | FPJ | GFT | cogen |
| ηB (%) | 44.44 | 43.29 | 40.65 | 20.24 | 19.10 | 16.46 | 20.24 | 19.10 | 16.46 |
| Binputs (KW) | 210,525 | 210,525 | 210,525 | 210,525 | 210,525 | 210,525 | 210,525 | 210,525 | 210,525 |
| Boutputs (KW) | 93,751 | 91,347 | 85,765 | 42,702 | 40,298 | 34,716 | 42,702 | 40,298 | 34,716 |
| I (KW) | 116,320 | 118,711 | 124,323 | 167,375 | 169,766 | 175,378 | 167,385 | 169,776 | 175,387 |
| AUEC (kJ/kJ) | 2.25 | 2.31 | 2.46 | 4.94 | 5.24 | 6.08 | 4.94 | 5.24 | 6.08 |
| 55 | 56 | 57 | 58 | 59 | 60 | 61 | 62 | 63 | |
| pre-treatment | WO | WO | WO | WO | WO | WO | WO | WO | WO |
| technology | ATJ | ATJ | ATJ | DFJ | DFJ | DFJ | DFJ-DA | DFJ-DA | DFJ-DA |
| lignin destination | FPJ | GFT | cogen | FPJ | GFT | cogen | FPJ | GFT | cogen |
| ηB (%) | 44.94 | 43.79 | 40.02 | 21.15 | 19.99 | 16.22 | 21.15 | 20.00 | 16.22 |
| Binputs (KW) | 210,525 | 210,525 | 210,525 | 210,525 | 210,525 | 210,525 | 210,525 | 210,525 | 210,525 |
| Boutputs (KW) | 94,808 | 92,370 | 84,408 | 44,612 | 42,174 | 34,212 | 44,612 | 42,174 | 34,212 |
| I (KW) | 115,286 | 117,749 | 125,743 | 165,527 | 167,954 | 175,948 | 165,537 | 167,963 | 175,958 |
| AUEC (kJ/kJ) | 2.23 | 2.28 | 2.50 | 4.73 | 5.00 | 6.16 | 4.73 | 5.00 | 6.16 |
| 64 | 65 | 66 | 67 | 68 | 69 | 70 | 71 | 72 | |
| pre-treatment | LHW | LHW | LHW | LHW | LHW | LHW | LHW | LHW | LHW |
| technology | ATJ | ATJ | ATJ | DFJ | DFJ | DFJ | DFJ-DA | DFJ-DA | DFJ-DA |
| lignin destination | FPJ | GFT | cogen | FPJ | GFT | cogen | FPJ | GFT | cogen |
| ηB (%) | 40.72 | 38.13 | 35.38 | 32.90 | 30.31 | 27.56 | 32.90 | 30.31 | 27.56 |
| Binputs (KW) | 210,525 | 210,525 | 210,525 | 210,525 | 210,525 | 210,525 | 210,525 | 210,525 | 210,525 |
| Boutputs (KW) | 85,884 | 80,430 | 74,629 | 69,389 | 63,935 | 58,133 | 69,389 | 63,935 | 58,133 |
| I (KW) | 124,231 | 129,671 | 135,508 | 140,733 | 146,174 | 152,011 | 140,742 | 146,183 | 152,020 |
| AUEC (kJ/kJ) | 2.46 | 2.62 | 2.83 | 3.04 | 3.30 | 3.63 | 3.04 | 3.30 | 3.63 |
| 73 | 74 | 75 | 76 | 77 | 78 | 79 | 80 | 81 | |
| pre-treatment | LHW-A | LHW-A | LHW-A | LHW-A | LHW-A | LHW-A | LHW-A | LHW-A | LHW-A |
| technology | ATJ | ATJ | ATJ | DFJ | DFJ | DFJ | DFJ-DA | DFJ-DA | DFJ-DA |
| lignin destination | FPJ | GFT | cogen | FPJ | GFT | cogen | FPJ | GFT | cogen |
| ηB (%) | 42.70 | 40.86 | 40.13 | 18.80 | 16.95 | 16.22 | 18.80 | 16.95 | 16.22 |
| Binputs (KW) | 210,525 | 210,525 | 210,525 | 210,525 | 210,525 | 210,525 | 210,525 | 210,525 | 210,525 |
| Boutputs (KW) | 90,085 | 86,197 | 84,647 | 39,649 | 35,762 | 34,212 | 39,649 | 35,762 | 34,212 |
| I (KW) | 120,014 | 123,898 | 125,463 | 170,459 | 174,343 | 175,908 | 170,469 | 174,353 | 175,917 |
| AUEC (kJ/kJ) | 2.34 | 2.45 | 2.49 | 5.32 | 5.90 | 6.17 | 5.32 | 5.90 | 6.17 |
TECHNOLOGIES: ATJ: Alcohol-to-Jet (fermentation); COGEN: Cogeneration; DFJ: Direct fermentation via farnesene; FPJ: Fast pyrolysis; GFT: Gasification Fischer-Tropsch. PRE-TREATMENTS: DA: Dilute-acid; DA-A: Dilute acid + alkaline treatment; SE: SO2 steam explosion; SE-A: Steam explosion + alkaline treatment; O: Organosolv; O-GAC: Organosolv + Granular activated carbon adsorption; WO: Alkaline wet oxidation; LHW: Liquid hot water; LHW-A: Liquid hot water + alkaline treatment.
Table A6.
GHG emission characterization factors and standard chemical exergy per resource.
| Resources (x) | Input/ Output + | GHG (kgCO2/x) | Units (x) | Notes | bCH (kJ/kmol) | bCH (MJ/kg) | |
|---|---|---|---|---|---|---|---|
| From Ecosphere (environment) | Sugarcane * | input | 0.034 | kg | Including transportation, without trash burning, with sugar yield of our process | - | 5.13 |
| SC bagasse * | input | 0.01 | kg | Using the yield of sugars, of sugarcane bagasse/sugarcane | - | 9.67 | |
| Enzyme * | input | 4.09 | kg | kg of enzyme (CH1.57N0.29O0.31S0.007) | 541,376 | 23.73 A | |
| Water ** | input | 0.002 | kg | Estimated from the electricity of a cooling pump with 80% efficiency to cool down 1 kg of chilled water | 900 | 0.05 | |
| Chemicals and others | (CH3)2CO ** | difference between input and output | 2.19 | kg | Acetone liquid | 1,788,500 | 30.85 |
| C2H4O2 ** | input | 1.403 | kg | Acetic acid via methanol carbonylation | 908,000 | 15.30 | |
| CaO ** | input | 0.15 | kg | Lime (100%) | 110,200 | 1.97 | |
| C10H14O2 | input | 3.163 | kg | kg CO2/kg tert-butyl catechol produced from lignin | 5,049,720 | 30.42 B | |
| Na2CO3 ** | input | 0.59 | kg | Sodium carbonate (caustic soda), 50%, Na2CO3 | 41,100 | 0.39 | |
| NaOH ** | input | 1.096 | kg | Analyzing 1 kg ‘Sodium hydroxide, 50% in H2O, production mix, at plant/RER U’ | 74,900 | 1.87 | |
| NH4OH ** | input | 2.089 | kg | Ammonia, liquid, at regional storehouse/kg/RER | 337,900 | 19.84 | |
| H3PO4 ** | input | 1.423 | kg | Commercial phosphoric acid (15%) used has a concentration of 85% by mass | 89,600 | 0.91 | |
| H2SO4 ** | input | 0.124 | kg | Sulfuric acid | 163,400 | 1.67 | |
| SO2 ** | input | 0.44 | kg | Sulfur dioxide, liquid | 313,400 | 4.89 | |
| Waste to landfill | output end life | 0.329 | kg | Disposal, average incineration residue, 0% water, to residual material landfill | - | - | |
| Electricity and Fuels | Electricity | input | 0.486 | kWh | Electricity, production mix RER/kWh/RER | - | - |
| Natural gas | input | 1.422 | kg | Emissions in production from fossil fuels (extraction, transportation, and processing) | 829,457 | 51.70 C | |
| Natural gas (emissions) | output | 2.284 | kg | Combustion of CH4 emissions | - | - | |
| Liquefied petroleum gas (LPG) | input | 2.871/0.139 | kg | Combustion emissions/extraction and processing of LPG, which typically consists of propane (C3H8) or a mixture of propane and butane (C4H10) | 2,483,915 | 45.01 C | |
| Gasoline (C8H18) | input | 2.789/0.503 | kg | Emissions in utilization and production from fossil fuels | 5,413,532 | 47.39 C | |
| Diesel (C12H23) | input | 2.966/0.568 | kg | Emissions in utilization and production from fossil fuels | 7,130,900 | 42.70 D | |
| Jet fuel (transportation) | output | 4.5/17.1 | t.km | São Paulo, by train (150 km), Rio de Janeiro, by train (570 km) | 7,565,100 | 45.30 D |
+ The main inventories of this section are based on Santos et al. [6]. * Calculated using the correlations linking the ratio of the standard chemical exergy (bCH) and the net calorific value of the substances [30]. ** Adopted values for bCHspec from Szargut et al. [9]. A For the enzymes, the composition (CH1.57N0.29O0.31S0.007) indicated per NREL was assumed [31]. B Predicted based on the correlations between the high heating value of the fuel and the chemical exergy of the combustion products (net heat of combustion) [32]. C Based on values and composition reported by Arango-Miranda et al. [33]. D Based on reference values given in Dincer and Rosen [34].
References
- Prussi, M.; Lee, U.; Wang, M.; Malina, R.; Valin, H.; Taheripour, F.; Velarde, C.; Staples, M.D.; Lonza, L.; Hileman, J.I. CORSIA: The first internationally adopted approach to calculate life-cycle GHG emissions for aviation fuels. Renew. Sustain. Energy Rev. 2021, 150, 111398. [Google Scholar] [CrossRef]
- IATA. Our Commitment to Fly Net Zero by 2050, (n.d.). Available online: https://www.iata.org/en/programs/environment/flynetzero/ (accessed on 18 May 2023).
- Wang, W.-C.; Tao, L. Bio-jet fuel conversion technologies. Renew. Sustain. Energy Rev. 2016, 53, 801–822. [Google Scholar] [CrossRef]
- Mupondwa, E.; Li, X.; Tabil, L. Chapter 6—Production of biojet fuel: Conversion technologies, technoeconomics, and commercial implementation. In Biofuels and Biorefining; Castro, F.I.G., Gutiérrez-Antonio, C., Eds.; Elsevier: Amsterdam, The Netherlands, 2022; pp. 157–213. [Google Scholar] [CrossRef]
- de Jong, S.; van Stralen, J.; Londo, M.; Hoefnagels, R.; Faaij, A.; Junginger, M. Renewable jet fuel supply scenarios in the European Union in 2021–2030 in the context of proposed biofuel policy and competing biomass demand. GCB Bioenergy 2018, 10, 661–682. [Google Scholar] [CrossRef]
- Santos, C.I.; Silva, C.C.; Mussatto, S.I.; Osseweijer, P.; van der Wielen, L.A.; Posada, J.A. Integrated 1st and 2nd generation sugarcane bio-refinery for jet fuel production in Brazil: Techno-economic and greenhouse gas emissions assessment. Renew. Energy 2018, 129, 733–747. [Google Scholar] [CrossRef]
- Michailos, S. Process design, economic evaluation and life cycle assessment of jet fuel production from sugar cane residue. Environ. Prog. Sustain. Energy 2017, 37, 1227–1235. [Google Scholar] [CrossRef]
- Gerber, L.; Gassner, M.; Maréchal, F. Systematic integration of LCA in process systems design: Application to combined fuel and electricity production from lignocellulosic biomass. Comput. Chem. Eng. 2011, 35, 1265–1280. [Google Scholar] [CrossRef]
- de Jong, S.; Antonissen, K.; Hoefnagels, R.; Lonza, L.; Wang, M.; Faaij, A.; Junginger, M. Life-cycle analysis of greenhouse gas emissions from renewable jet fuel production. Biotechnol. Biofuels 2017, 10, 64. [Google Scholar] [CrossRef]
- Capaz, R.S.; de Medeiros, E.M.; Falco, D.G.; Seabra, J.E.; Osseweijer, P.; Posada, J.A. Environmental trade-offs of renewable jet fuels in Brazil: Beyond the carbon footprint. Sci. Total. Environ. 2020, 714, 136696. [Google Scholar] [CrossRef]
- Mussatto, S.I.; Motta, I.L.; Filho, R.M.; van der Wielen, L.; Capaz, R.; Seabra, J.; Osseweijer, P.; Posada, J.; de Freitas Gonçalves, M.; Scorza, P.R.; et al. 5.16—Sustainable Aviation Fuels: Production, Use and Impact on Decarbonization. In Comprehensive Renewable Energy, 2nd ed.; Letcher, T.M., Ed.; Elsevier: Oxford, UK, 2022; pp. 348–371. [Google Scholar] [CrossRef]
- Bhatt, A.H.; Zhang, Y.; Milbrandt, A.; Newes, E.; Moriarty, K.; Klein, B.; Tao, L. Evaluation of performance variables to accelerate the deployment of sustainable aviation fuels at a regional scale. Energy Convers. Manag. 2023, 275, 116441. [Google Scholar] [CrossRef]
- Rojas-Michaga, M.F.; Michailos, S.; Cardozo, E.; Akram, M.; Hughes, K.J.; Ingham, D.; Pourkashanian, M. Sustainable aviation fuel (SAF) production through power-to-liquid (PtL): A combined techno-economic and life cycle assessment. Energy Convers. Manag. 2023, 292, 117427. [Google Scholar] [CrossRef]
- Sacchi, R.; Becattini, V.; Gabrielli, P.; Cox, B.; Dirnaichner, A.; Bauer, C.; Mazzotti, M. How to make climate-neutral aviation fly. Nat. Commun. 2023, 14, 3989. [Google Scholar] [CrossRef]
- Silva Ortiz, P.A.; Filho, R.M.; Posada, J. Mass and Heat Integration in Ethanol Production Mills for Enhanced Process Efficiency and Exergy-Based Renewability Performance. Processes 2019, 7, 670. [Google Scholar] [CrossRef]
- Szargut, J.; Morris, D.R.; Steward, F.R. Exergy Analysis of Thermal, Chemical, and Metallurgical Processes, 1st ed.; Hemisphere: Ipswich, UK, 1988. [Google Scholar]
- Ghannadzadeh, A. Exergy-aided environmental sustainability assessment of an ethylene dichloride–vinyl chloride production process. Chem. Eng. Res. Des. 2018, 130, 109–128. [Google Scholar] [CrossRef]
- Ptasinski, K. Efficiency of Biomass Energy: An Exergy Approach to Biofuels, Power, and Biorefineries; John Wiley & Sons, Ltd.: Hoboken, NJ, USA, 2016. [Google Scholar] [CrossRef]
- de Oliveira Junior, S. Exergy Analysis and Environmental Impact. In Exergy: Production, Cost and Renewability; de Oliveira Junior, S., Ed.; Springer: London, UK, 2013; pp. 281–303. [Google Scholar] [CrossRef]
- Ecoinvent. The Ecoinvent Database, (v 3.9); 2023. Available online: https://ecoinvent.org/database/ (accessed on 20 December 2023).
- Silva Ortiz, P.A.; Maréchal, F.; de Oliveira Junior, S. Exergy assessment and techno-economic optimization of bioethanol production routes. Fuel 2020, 279, 118327. [Google Scholar] [CrossRef]
- Lozano, M.; Valero, A. Theory of the exergetic cost. Energy 1993, 18, 939–960. [Google Scholar] [CrossRef]
- Velásquez, H.; De Oliveira, S.; Benjumea, P.; Pellegrini, L. Exergo-environmental evaluation of liquid biofuel production processes. Energy 2013, 54, 97–103. [Google Scholar] [CrossRef]
- Huysman, S.; Schaubroeck, T.; Dewulf, J. Exergy and Cumulative Exergy Use Analysis, in: Sustainability Assessment of Renewables-Based Products; John Wiley & Sons, Ltd.: Hoboken, NJ, USA, 2015; pp. 141–154. [Google Scholar] [CrossRef]
- Bakshi, B.R. Sustainable Engineering; Cambridge University Press (CUP): Cambridge, UK, 2019. [Google Scholar] [CrossRef]
- Klein, B.C.; Chagas, M.F.; Junqueira, T.L.; Rezende, M.C.A.F.; Cardoso, T.d.F.; Cavalett, O.; Bonomi, A. Techno-economic and environmental assessment of renewable jet fuel production in integrated Brazilian sugarcane biorefineries. Appl. Energy 2018, 209, 290–305. [Google Scholar] [CrossRef]
- Tzanetis, K.F.; Posada, J.A.; Ramirez, A. Analysis of biomass hydrothermal liquefaction and biocrude-oil upgrading for renewable jet fuel production: The impact of reaction conditions on production costs and GHG emissions performance. Renew. Energy 2017, 113, 1388–1398. [Google Scholar] [CrossRef]
- Alves, C.M.; Valk, M.; de Jong, S.; Bonomi, A.; van der Wielen, L.A.; Mussatto, S.I. Techno-economic assessment of biorefinery technologies for aviation biofuels supply chains in Brazil. Biofuels, Bioprod. Biorefining 2016, 11, 67–91. [Google Scholar] [CrossRef]
- Braz, D.S.; Mariano, A.P. Jet fuel production in eucalyptus pulp mills: Economics and carbon footprint of ethanol vs. butanol pathway. Bioresour. Technol. 2018, 268, 9–19. [Google Scholar] [CrossRef]
- Kotas, T.J. The Exergy Method of Thermal Plant Design; Butterworths: London, UK, 1985. [Google Scholar]
- Wooley, R.J.; Putsche, V. Development of An Aspen Plus Physical Property Database for Biofuels Components; National Renewable Energy Laboratory-NREL: Golden, CO, USA, 1996. Available online: http://www.nrel.gov/docs/legosti/old/20685.pdf (accessed on 20 December 2023).
- Butcher, M.G.; Meyer, P.A.; Hallen, R.T.; Albrecht, K.O.; Clayton, C.K.; Polikarpov, E.; Rappe, K.G.; Jones, S.B.; Magnuson, J.K. Fungal metabolites as precursors to renewable transportation fuels. Fuel 2018, 215, 123–141. [Google Scholar] [CrossRef]
- Arango-Miranda, R.; Hausler, R.; Romero-López, R.; Glaus, M.; Ibarra-Zavaleta, S.P. An Overview of Energy and Exergy Analysis to the Industrial Sector, a Contribution to Sustainability. Sustainability 2018, 10, 153. [Google Scholar] [CrossRef]
- Dincer, I.; Rosen, M.A. Chapter 3—Chemical exergy. In Exergy, 3rd ed.; Dincer, I., Rosen, M.A., Eds.; Elsevier: Amsterdam, The Netherlands, 2021; pp. 37–60. [Google Scholar] [CrossRef]
Figure 1.
Overview of biojet fuel conversion routes. Classification based on feedstock, biomass conversion technology, and final product (adapted from [4]).
Figure 1.
Overview of biojet fuel conversion routes. Classification based on feedstock, biomass conversion technology, and final product (adapted from [4]).
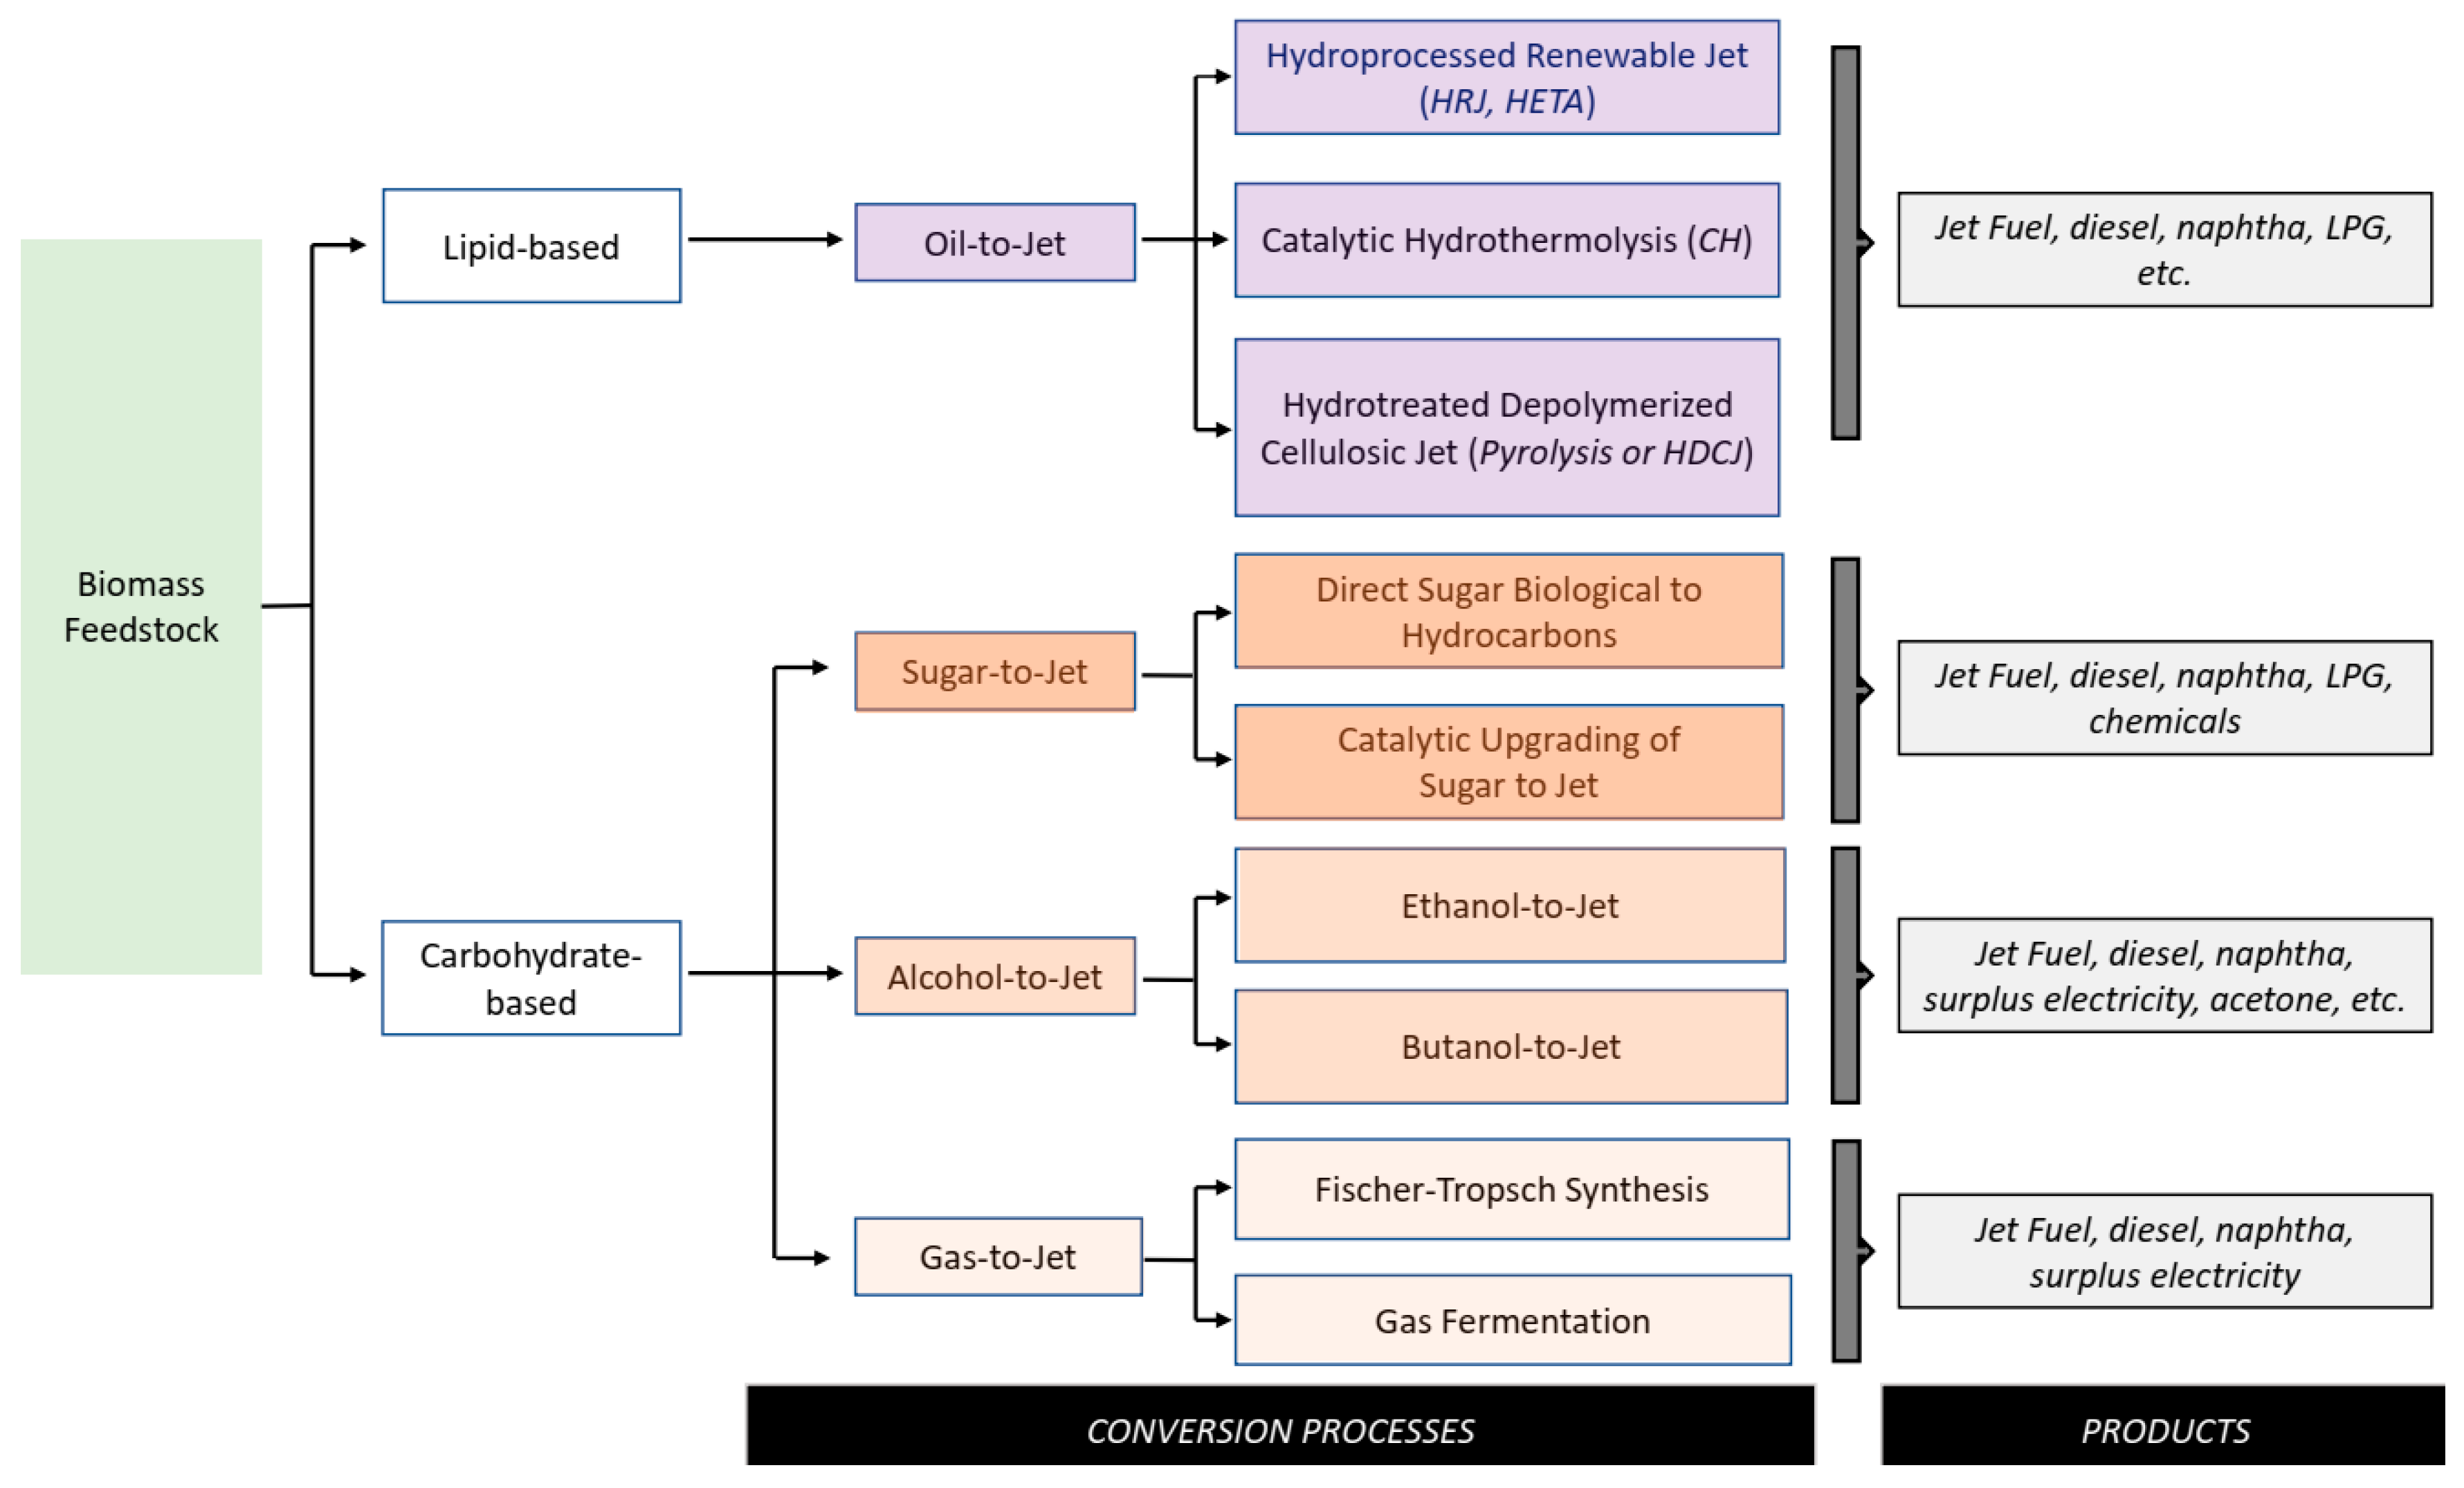
Figure 2.
Processing sections and system boundaries for exergy and environmental analysis (adapted from Santos et al. [6]).
Figure 2.
Processing sections and system boundaries for exergy and environmental analysis (adapted from Santos et al. [6]).
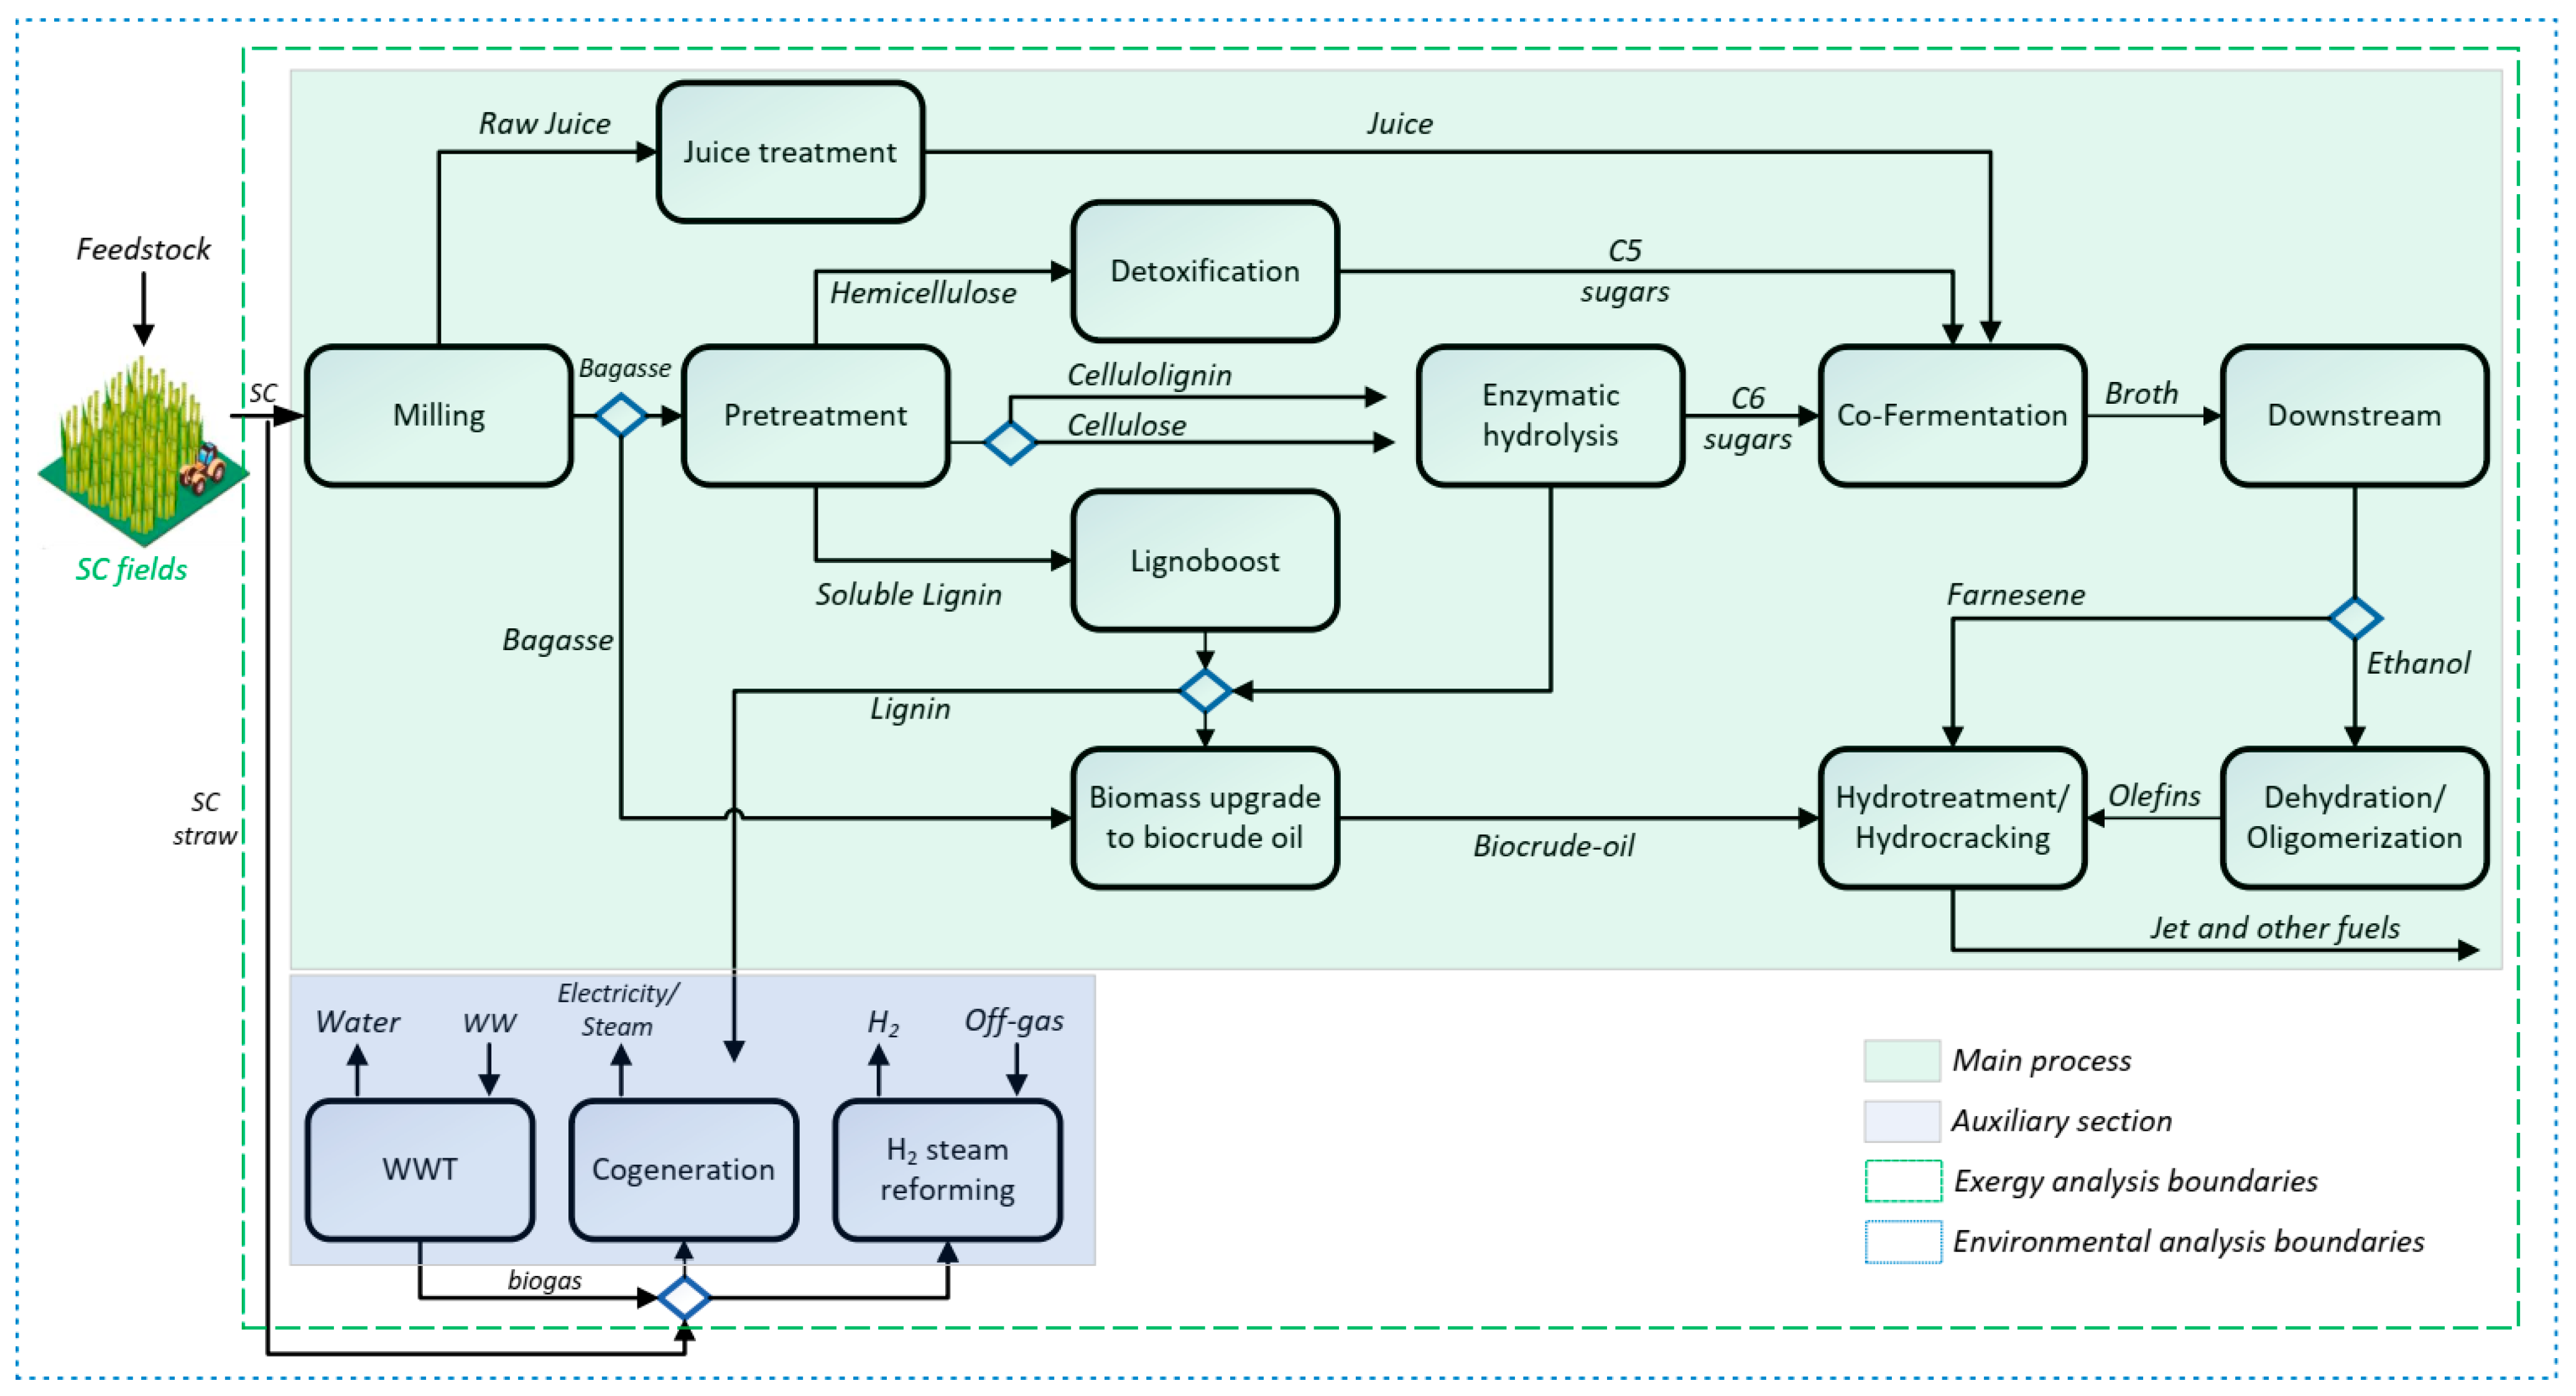
Figure 3.
Performance indicators: (a) exergy efficiency; (b) specific CO2 equivalent emissions; (c) AUEC.
Figure 3.
Performance indicators: (a) exergy efficiency; (b) specific CO2 equivalent emissions; (c) AUEC.
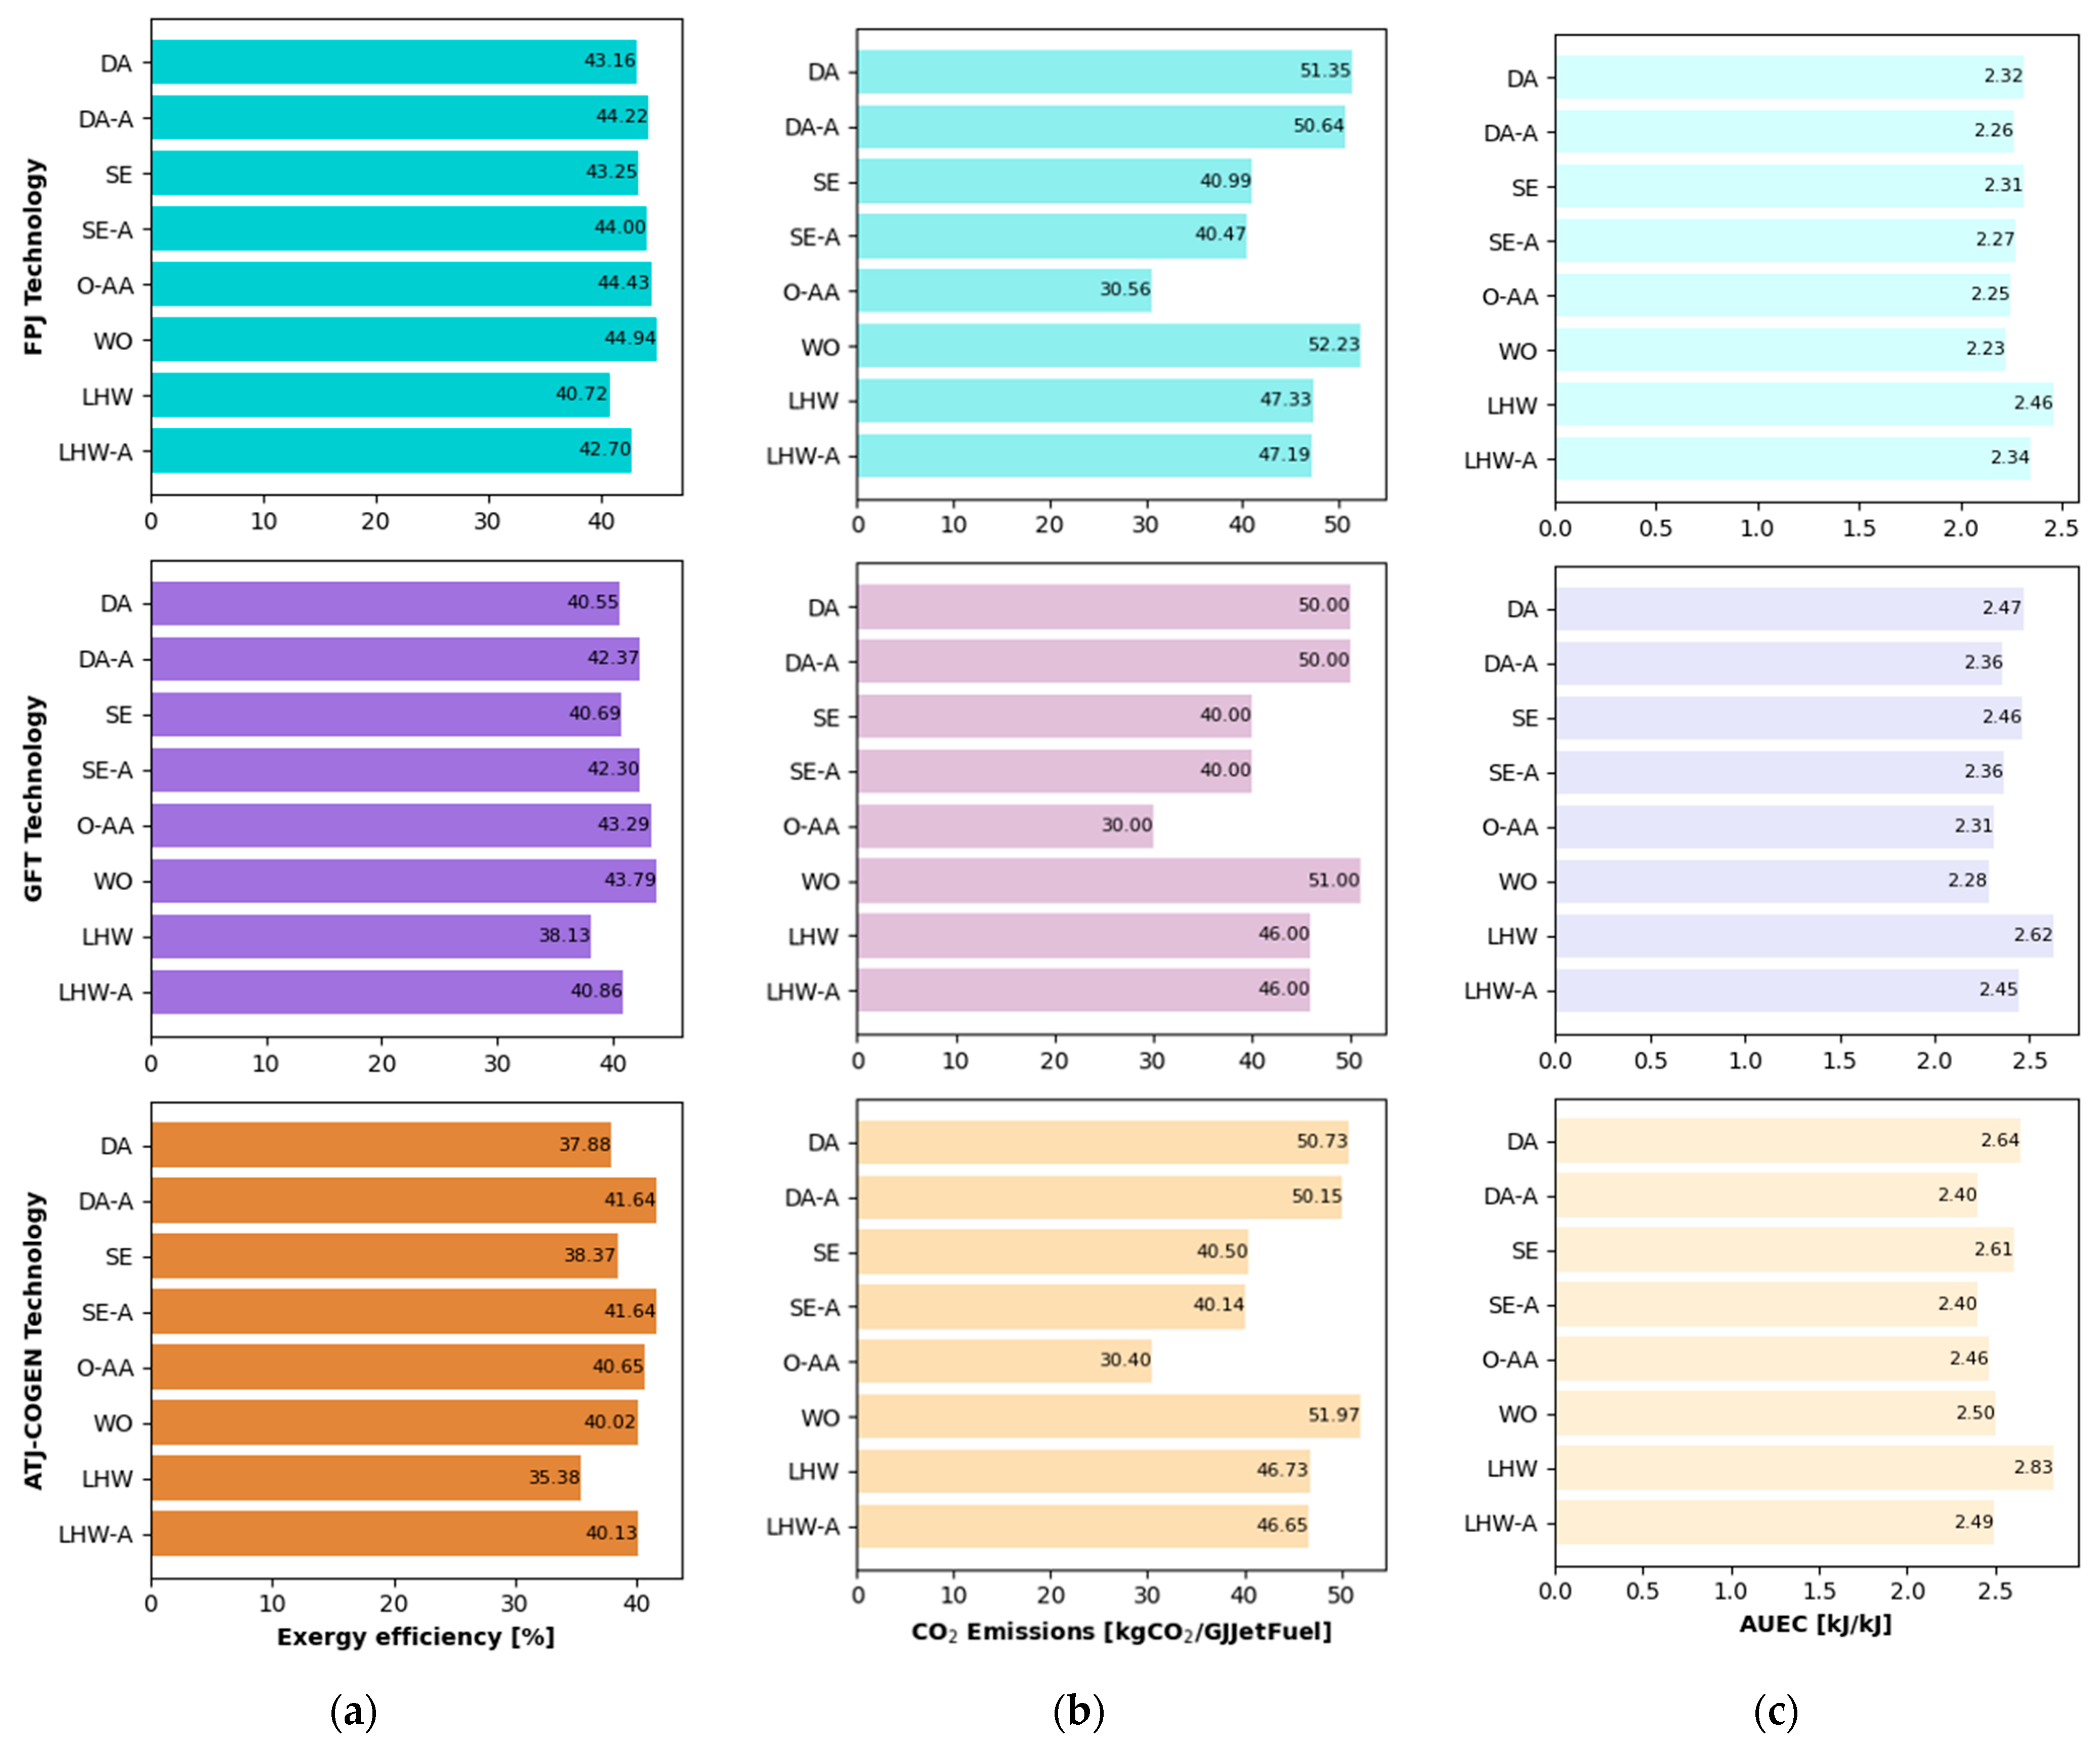
Figure 4.
Exergy efficiency and the renewability index correlation for SAF production routes.
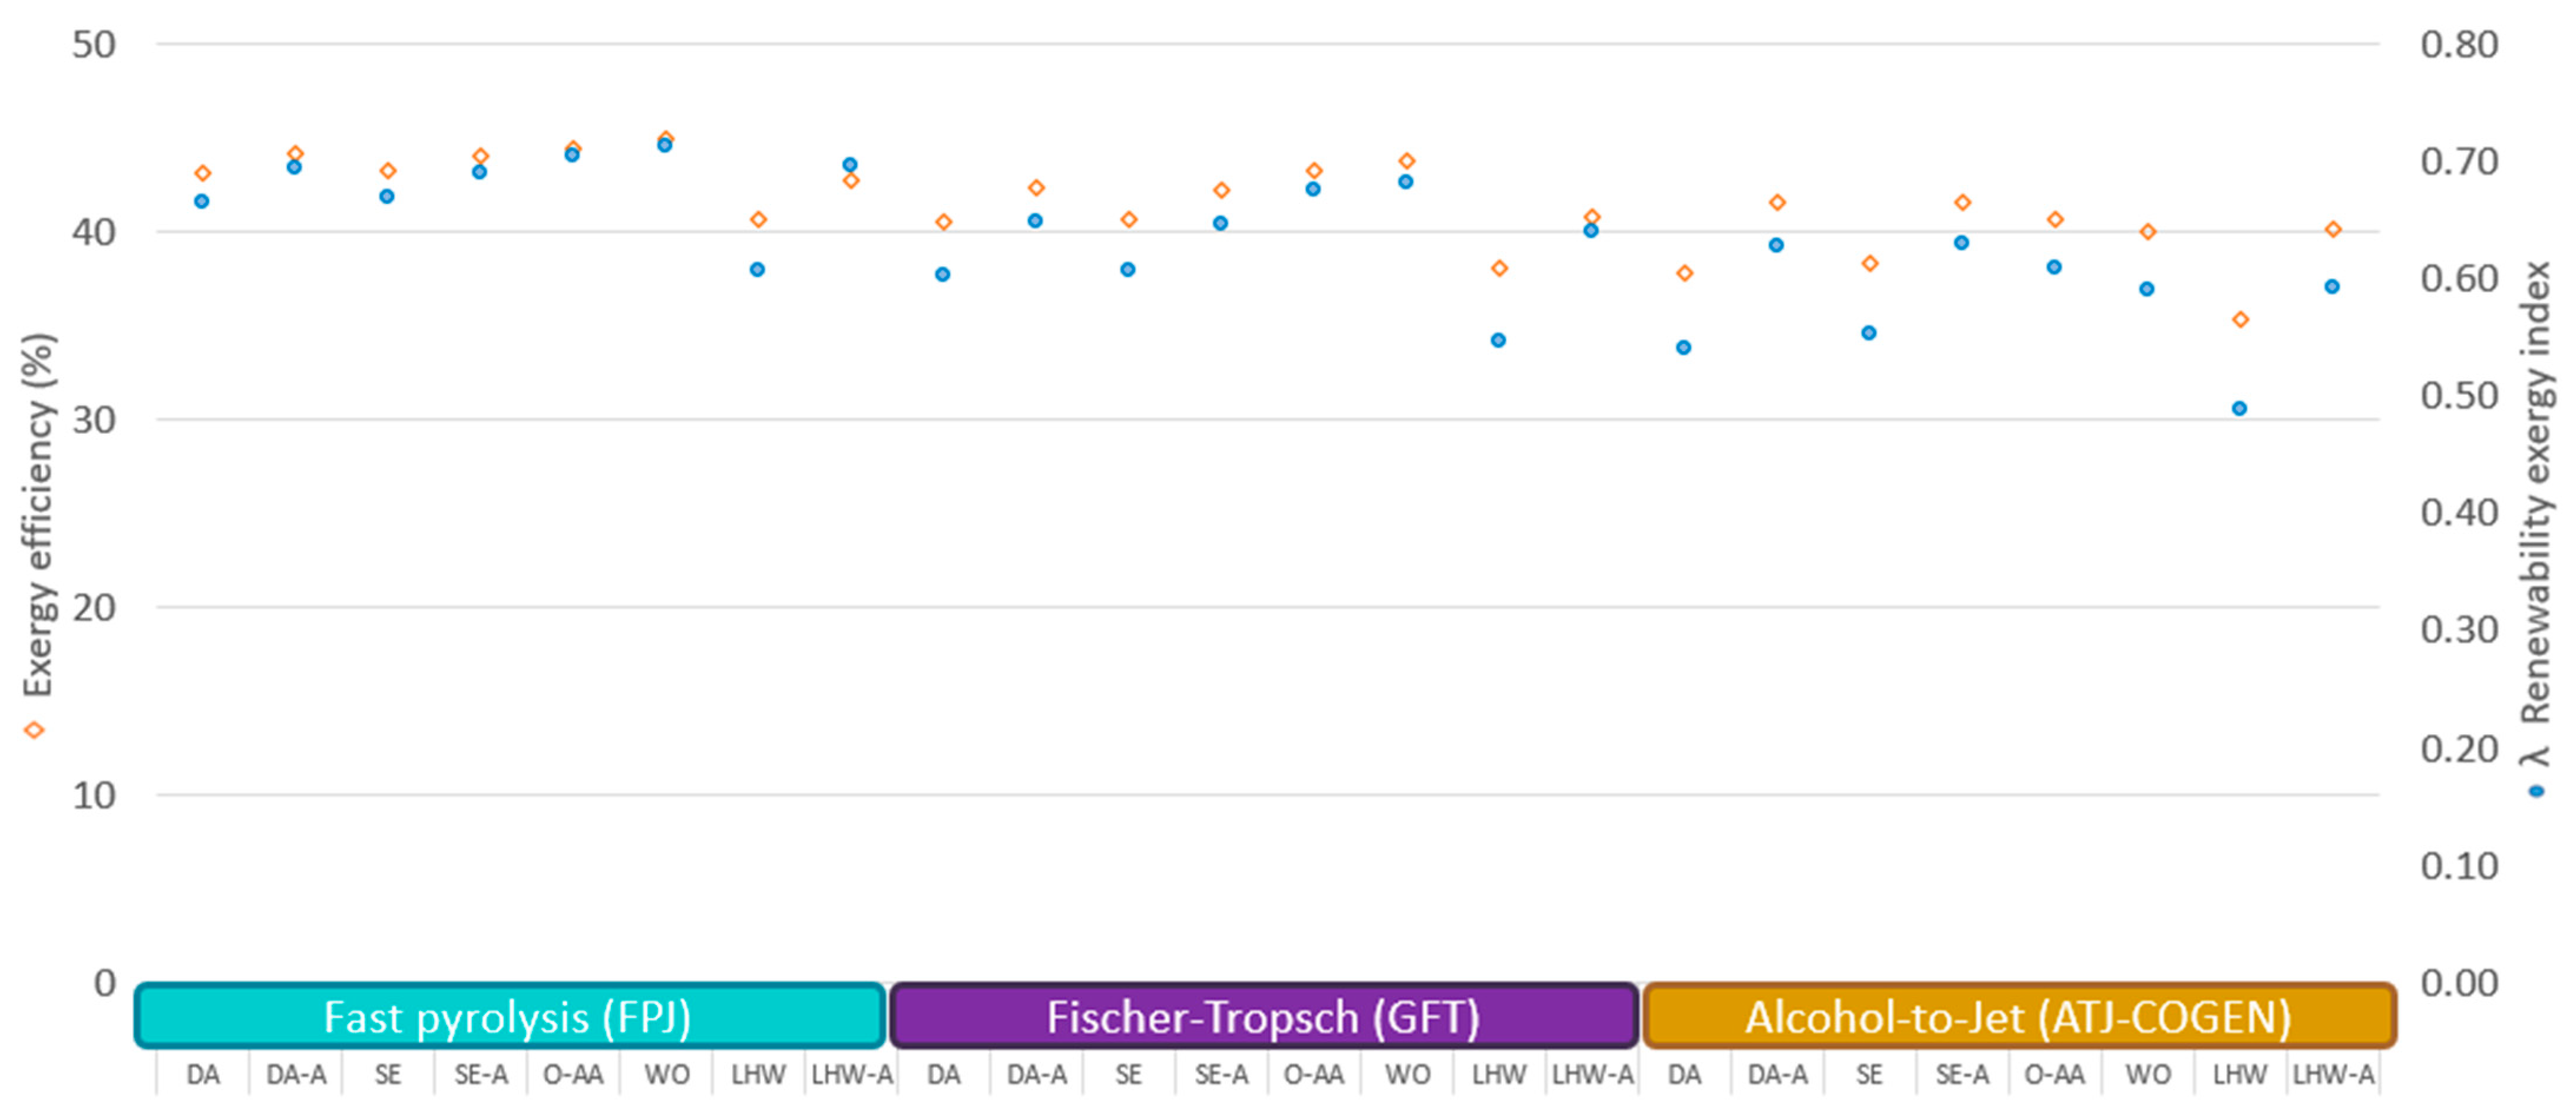
Figure 5.
Benchmark of production pathways for renewable jet fuel. HTL represents hydrothermal liquefaction systems; catalytic pyrolysis (CP); alcohol-to-jet (ATJ); hydroprocessed esters and fatty acids (HEFA); and Fischer-Tropsch (FT) scenarios. BtOH denotes the Butanol Scenario, and GMO is the Butanol Scenario using genetically modified organisms [26,27,28,29].
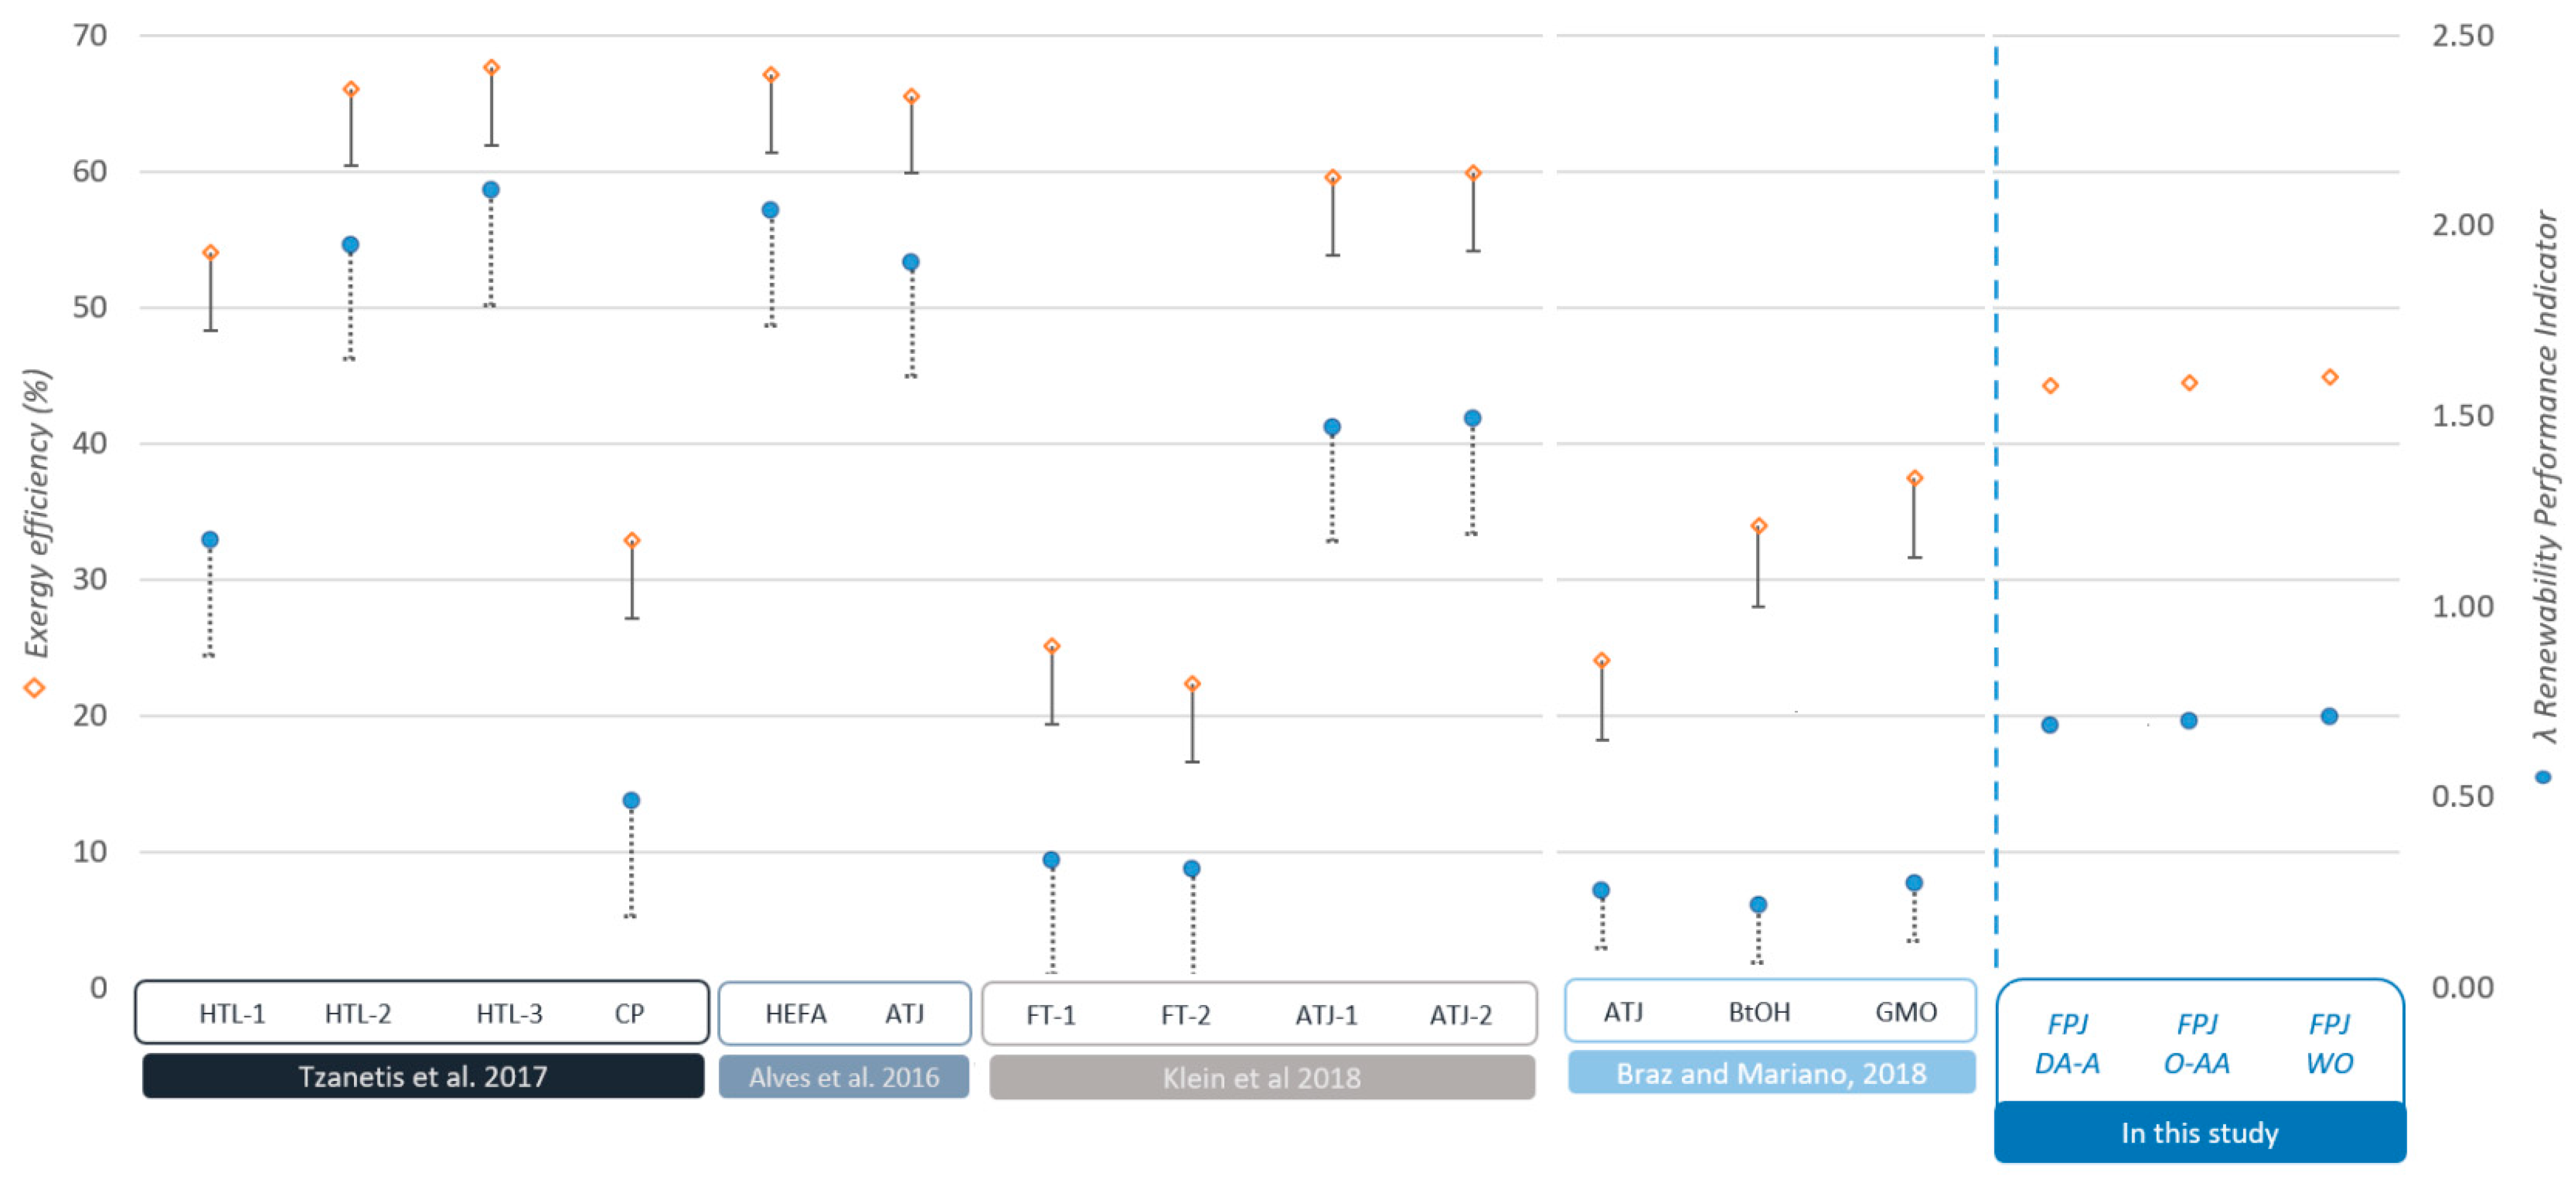
Table 1.
Key performance indicators for the renewable jet fuel configurations 1.
| Technology | FPJ | |||||||
|---|---|---|---|---|---|---|---|---|
| Pre-treatment | DA | DA-A | SE | SE-A | O-AA | WO | LHW | LHW-A |
| Exergy efficiency (%) | 43.16 | 44.22 | 43.25 | 44.00 | 44.43 | 44.94 | 40.72 | 42.70 |
| Irreversibility rate (MW) | 119 | 117 | 119 | 117 | 116 | 115 | 124 | 120 |
| AUEC (kJ/kJ) | 2.32 | 2.26 | 2.31 | 2.27 | 2.25 | 2.23 | 2.46 | 2.34 |
| GHG emission (kgCO2/GJJet Fuel) | 51.35 | 50.64 | 40.99 | 40.47 | 30.56 | 52.23 | 47.33 | 47.19 |
| λ | 0.67 | 0.69 | 0.67 | 0.69 | 0.70 | 0.71 | 0.61 | 0.70 |
| Technology | GFT | |||||||
| Pre-treatment | DA | DA-A | SE | SE-A | O-AA | WO | LHW | LHW-A |
| Exergy efficiency (%) | 40.55 | 42.37 | 40.69 | 42.30 | 43.29 | 43.79 | 38.13 | 40.86 |
| Irreversibility rate (MW) | 124 | 120 | 124 | 121 | 118 | 117 | 129 | 123 |
| AUEC (kJ/kJ) | 2.47 | 2.36 | 2.46 | 2.36 | 2.31 | 2.28 | 2.62 | 2.45 |
| GHG emission (kgCO2/GJJet Fuel) | 50.73 | 50.15 | 40.50 | 40.14 | 30.40 | 51.97 | 46.73 | 46.65 |
| λ | 0.60 | 0.65 | 0.61 | 0.65 | 0.67 | 0.68 | 0.55 | 0.64 |
| Technology | ATF (COGEN) | |||||||
| Pre-treatment | DA | DA-A | SE | SE-A | O-AA | WO | LHW | LHW-A |
| Exergy efficiency (%) | 37.88 | 41.64 | 38.37 | 41.64 | 40.65 | 40.02 | 35.38 | 40.13 |
| Irreversibility rate (MW) | 130 | 122 | 129 | 122 | 124 | 126 | 135 | 125 |
| AUEC (kJ/kJ) | 2.64 | 2.40 | 2.61 | 2.40 | 2.46 | 2.50 | 2.83 | 2.49 |
| GHG emission (kgCO2/GJJet Fuel) | 50.00 | 50.00 | 40.00 | 40.00 | 30.00 | 51.00 | 46.00 | 46.00 |
| λ | 0.54 | 0.63 | 0.55 | 0.63 | 0.61 | 0.59 | 0.49 | 0.59 |
1 They are determined based on the key performance indicators of Section 2.
Disclaimer/Publisher’s Note: The statements, opinions and data contained in all publications are solely those of the individual author(s) and contributor(s) and not of MDPI and/or the editor(s). MDPI and/or the editor(s) disclaim responsibility for any injury to people or property resulting from any ideas, methods, instructions or products referred to in the content. |
© 2024 by the authors. Licensee MDPI, Basel, Switzerland. This article is an open access article distributed under the terms and conditions of the Creative Commons Attribution (CC BY) license (https://creativecommons.org/licenses/by/4.0/).
Share and Cite
MDPI and ACS Style
Silva Ortiz, P.; de Oliveira, S., Jr.; Mariano, A.P.; Jocher, A.; Posada, J. Exergy-Based Improvements of Sustainable Aviation Fuels: Comparing Biorefinery Pathways. Processes 2024, 12, 510. https://doi.org/10.3390/pr12030510
AMA Style
Silva Ortiz P, de Oliveira S Jr., Mariano AP, Jocher A, Posada J. Exergy-Based Improvements of Sustainable Aviation Fuels: Comparing Biorefinery Pathways. Processes. 2024; 12(3):510. https://doi.org/10.3390/pr12030510
Chicago/Turabian StyleSilva Ortiz, Pablo, Silvio de Oliveira, Jr., Adriano Pinto Mariano, Agnes Jocher, and John Posada. 2024. "Exergy-Based Improvements of Sustainable Aviation Fuels: Comparing Biorefinery Pathways" Processes 12, no. 3: 510. https://doi.org/10.3390/pr12030510
Note that from the first issue of 2016, this journal uses article numbers instead of page numbers. See further details here.