Article

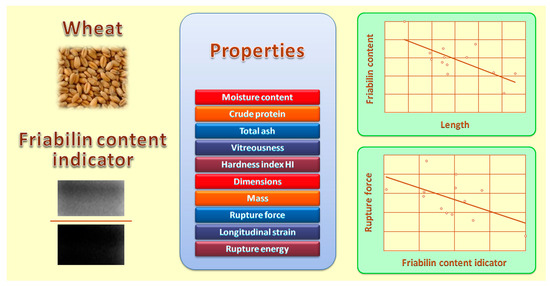
Correlations between a Friabilin Content Indicator and Selected Physicochemical and Mechanical Properties of Wheat Grain for Processing Suitability Assessment

by
Zdzisław Kaliniewicz
1,*,
Agnieszka Markowska-Mendik
1,
Małgorzata Warechowska
1,
Seweryn Lipiński
1 and
Sebastian Gasparis
2
1
Faculty of Technical Sciences, University of Warmia and Mazury in Olsztyn, Oczapowskiego 11, 10-719 Olsztyn, Poland
2
Department of Functional Genomics, Plant Breeding and Acclimatization Institute—National Research Institute, 05-870 Błonie, Poland
*
Author to whom correspondence should be addressed.
Processes 2024, 12(2), 398; https://doi.org/10.3390/pr12020398
Submission received: 11 January 2024 / Revised: 15 February 2024 / Accepted: 15 February 2024 / Published: 17 February 2024

Abstract

:
A new approach to determining the friabilin content of wheat grain was proposed. Electropherograms were taken, and the intensity of the friabilin bands was compared in the analyzed wheat cultivars and the cv. Chinese Spring. The friabilin content indicator was calculated in the grain of 17 common wheat cultivars, which differed mostly in their crude protein content and hardness index (HI). The basic properties of the kernels were measured in each wheat cultivar, and the correlations between the measured parameters and the friabilin content indicator were determined. In the analyzed wheat cultivars, the friabilin content indicator ranged from around 0.21 to around 0.77. This indicator was significantly correlated with the kernel length, thickness, mass, vitreousness, HI, and rupture force. The strongest correlation was observed between the friabilin content indicator and kernel length. An increase in the mean kernel length from around 5.4 mm to around 8.0 mm decreased the friabilin content indicator by approximately 51%. After the mean kernel length had been calculated in a given wheat cultivar, a certain value of the friabilin content indicator could be ascribed to this cultivar, and the energy consumption during grain grinding or milling could be partly predicted. In the group of analyzed wheat cultivars, the process of grain grinding would be the most energy-intensive in the cvs. Ceres, SMH200, and SMH214 and the least energy-intensive in the cvs. Chinese Spring, Julius, and Askalon.

Graphical Abstract

1. Introduction

Common wheat (Triticum aestivum L.) is one of the four most widely grown cereals in the world despite its high soil, environmental, and agronomic requirements. Wheat grain has numerous applications, mainly in the milling, food processing, cosmetic, and pharmaceutical industries. Wheat grain is also used in the production of animal feed and planting materials. Wheat grain contains 60–68% starch, 7–18% protein, 1.5–2.0% lipids, 2.0–2.5% cellulose, and 1.5–2.2% ash [1,2]. The endosperm is the most important part of each kernel, as it contains nutrients that are essential for seed germination. From a botanical point of view, the endosperm is composed of the aleurone layer and the starchy endosperm. However, from a technological point of view, the aleurone layer is regarded part of the seed coat that is removed together with bran during milling. The endosperm accounts for up to 83% of the kernel mass [2].
The processing suitability of wheat grain is determined mainly on the basis of its protein content. Grain for the bakery industry should contain a minimum of 11.5% protein on a dry matter (DM) basis, whereas grain for enhancing mixtures of medium- and low-quality grain should contain more than 14% protein [3]. Numerous authors have analyzed the correlations between the crude protein content and the mechanical properties of grain that determine the energy consumption during milling, as well as the sustainable use of this raw material in food processing. However, the reported results are often contradictory [4,5,6,7,8,9]. According to Hogg et al. [10], the kernel hardness is not determined by the total crude protein content but by the content of friabilin, a protein complex responsible for grain softness. Turnbull and Rahman [11], Laskowski and Różyło [12], and Pasha et al. [6] observed that the friabilin content was very high in kernels of soft wheat varieties and that its content decreased with a rise in the kernel hardness. Hard wheat, such as durum wheat (Triticum turgidum ssp. durum), do not contain friabilin due to the absence of genes encoding this protein. In grain, the endosperm texture is regulated by the Pina and Pinb puroindoline genes, which, together with the grain softness protein-1 gene (Gsp-1), are localized in the Ha locus on chromosome 5DS. These genes encode the puroindoline proteins PINA and PINB, which are subunits of friabilin, a protein with a molecular weight of 13 kDa [6,13,14,15,16]. The wild-type alleles of the Pin genes, i.e., Pina-D1a and Pinb-D1a, are responsible for grain softness, and mutations in one or both of these genes lead to the formation of hard grains [4,15,17,18,19]. Different types of mutations are responsible for different levels of grain hardness, such as intermediate, between soft wheat and durum wheat [6,14,20,21,22]. Immunodetection assays have revealed that the PIN proteins accumulate mainly in the endosperm on the surface of starch granules and in the aleurone layer [6,23,24,25,26]. According to Beecher et al. [27] and Chen et al. [28], the PIN proteins prevent the protein matrix from adhering to the starch granules, which decreases the endosperm density and leads to the formation of softer grains. In turn, hard wheat is characterized by a more compact endosperm and denser kernels.
Qualitative and quantitative analyses of the friabilin content can be performed with the use of reversed-phase high-performance liquid chromatography (RP-HPLC), which is a complex and expensive analytical technique [29,30,31]. In this method, peaks are registered on chromatograms and compared with a reference sample. However, according to Hogg et al. [10] and Martin et al. [32], SDS-PAGE is one of the most popular methods for identifying friabilin proteins. In this analytical technique, the proteins are separated using electrophoresis on polyacrylamide gel with the addition of sodium dodecyl sulfate (SDS) as the denaturing agent. In SDS-PAGE, the wheat cv. Chinese Spring is most often used as a reference to determine the friabilin content of other grain. Chinese Spring harbors the wild-type alleles of the puroindoline genes, Pina-D1a and Pinb-D1a, and it is characterized by a high content of PIN proteins [13,17,21]. When the proteins are separated using electrophoresis on polyacrylamide gel, the friabilin fraction produces bands with an estimated size of 13 kDa. The band intensity is determined by the content of puroindoline proteins. Li et al. [33] postulated the presence of associations between the protein content and the intensity of the corresponding bands, but they did not propose any indicators for measuring this trait. Hogg et al. [10] used an eight-point scale to quantify friabilin relative to a protein reference with a known friabilin content. However, visual inspection of the band intensity is not a highly accurate method due to observer bias. Therefore, a novel comparative approach was proposed in this study to determine the friabilin content of wheat grain. In the developed technique, the band intensity in the electropherograms was evaluated using computer-assisted image analysis. The friabilin content of the examined wheat cultivars was determined by comparing the band intensities against Chinese Spring as the reference cultivar.
An analysis of the correlations between the physical properties and the friabilin content of wheat grain may contribute to breeding wheat varieties with desirable traits in order to respond to changing consumer preferences and market demand and reduce food waste. The quality of the raw materials should be improved to streamline production processes, thus reducing energy and resource consumption. In turn, the physical properties and friabilin content of the grain of local wheat cultivars should be optimized to reduce dependency on grain imports, which translates into lower CO2 emissions, lower fuel consumption, and more efficient utilization of local natural resources such as soil and climate. This may also reduce the use of fertilizers and pesticides, thus contributing to minimizing the adverse environmental impacts of agricultural production [15,34,35].
The friabilin content of wheat grain was determined using a friabilin content indicator, which is a novel parameter introduced by the authors. Therefore, the aim of this study was to determine changes in the value of the friabilin content indicator in the grain of selected wheat cultivars and to analyze the correlations between this parameter and the other physicochemical properties of wheat grain.

2. Materials and Methods

2.1. Materials

The experimental material comprised the grain of 18 wheat cultivars that differed considerably in the mean values of their crude protein content and hardness index (HI) (Table 1). The grain was obtained from the IHAR Group Plant Breeding Company in Strzelce (cvs. Bamberka, Chinese Spring, Fregata, Nutka, Parabola, Radunia, and Tonacja), Smolice (cvs. Ceres, SMH87, SMH196, SMH200, and SMH214), and Agro-Plon, Ostróda (cvs. Askalon, Astoria, Cytra, Julius, Magic, and Türkis), in 2013. These companies belong to the Polish Seed Trade Association in Poznań, and they produce and distribute planting materials in Poland according to the applicable national and international standards. Initial grain samples of approximately 2 kg each were obtained from each wheat cultivar and were stored in a refrigerator at a temperature of around 4 °C. Before analysis, all the grain samples were brought to moisture content equilibrium by conditioning a thin layer of the grain at a temperature of 22 ± 1 °C and 54 ± 3% humidity for five days. Each layer of conditioned grain had an estimated thickness of 1 cm.

2.2. Approximate Composition, Vitreousness, and Hardness

The crude protein content of the wheat grain was determined using the Kjeldahl method (Nx5.7) and the KjelFlex K-360 apparatus (BÜCHI Labortechnik AG, Flawil, Switzerland) according to ISO standard 20483:2013 [36]. The total ash content was determined using the procedure described in ISO standard 2171:2007 [37]. Both analyses were performed in triplicate. The grain vitreousness was measured using a grain cutter (Zakład Badawczy Przemysłu Piekarskiego sp. z o.o., Bydgoszcz, Poland). A total of 50 kernels from each wheat cultivar were cut perpendicular to the long axis, and their vitreousness was visually inspected. Kernels with completely opaque surfaces were classified as starchy, and kernels with uniform, glassy surfaces were classified as vitreous [38]. Kernels were classified as semi-vitreous when both opaque and glassy areas were observed on their surface. In each grain batch, the vitreousness v (%) was calculated using the following formula:
v = 2 a + b
where a = number of vitreous kernels and b = number of semi-vitreous kernels.
The vitreousness analysis was conducted in five replicates for each wheat cultivar.
The grain HI and relative moisture content were measured using the SKCS 4100 system (Perten Instruments, New York, NY, USA) according to AACC procedure 55-31.01 [39]. The values of only two out of the four measured parameters were included in this analysis because it was assumed that the thickness and mass of the kernels could be more accurately determined with the use of a thickness gauge and a laboratory weighing scale, respectively. In the SKCS 4100 system, the HI is calculated for each kernel by measuring its resistance to fracture and comparing the result with the reference cultivar. In addition, the results were adjusted to 12% moisture content and a kernel mass of 35 mg [40]. In each test, a grain sample of around 30 g was placed in the hopper. Random kernels were automatically fed to the crushing unit. A total of 300 kernels from each sample were analyzed in the test.

2.3. Geometric Properties, Mass, and Mechanical Properties

The grain, for analyses of its geometric properties and kernel mass, was sampled according to ISO standard 24333:2009 [41]. Each sample comprised 60 kernels from each analyzed wheat cultivar, and the geometric properties and mass of the wheat kernels were measured according to the procedure proposed by Kaliniewicz et al. [9]. The basic seed dimensions were determined using a MWM 2325 workshop microscope (PZO, Warsaw, Poland) and a self-designed instrument for measuring the seed thickness. The length (L) and width (W) of each kernel were determined with an accuracy of 0.02 mm, and the kernel thickness (T) was determined with an accuracy of 0.01 mm. The mass (m) of the wheat kernels was determined using a WAA 100/C/2 digital weighing scale (Radwag, Radom, Poland) with an accuracy of 0.1 mg.
The measured parameters were used to calculate the aspect ratio (R) and the sphericity index (Φ) of each kernel:
R = W L · 100
Φ = T · W · L 3 L · 100
The same samples were used to determine the mechanical properties of the wheat grain. The mechanical properties were analyzed at room temperature (22 ± 1 °C) according to the procedure described by Kaliniewicz et al. [9]. The measurements were performed using the Instron Mecmesin MultiTest-i tensile and compression test system (Mecmesin Ltd., Slinfold, UK) and the EmperorTM Force testing system software (Version 1.18-408). The crosshead speed was set at 10 mm·min−1 (within a loading range of 0–1 kN) according to the recommendations made by Różyło and Laskowski [5] and Dziki et al. [42]. The compression test was interrupted when the rupture force decreased by a minimum of 10% and the first fracture was observed on the kernel. The rupture force (F), longitudinal strain (d), and rupture energy (E) were registered using the software installed in the test system. The relative strain (Δ) was calculated for each kernel with the use of formula (4) based on the registered values of the longitudinal strain (d) and kernel thickness (T) [9,43]:
= 100 · d T

2.4. SDS-PAGE Analysis

The puroindoline proteins in the endosperm of the analyzed wheat cultivars were separated using electrophoresis on polyacrylamide gel [32,44,45,46]. In the first stage of the analysis, the starch fraction of the wheat endosperm was purified according to the method described by Bettge et al. [47] with the modifications proposed by Chang et al. [48]. Kernel samples of around 200 mg each were ground in a mortar; a total of 0.6 mL of 0.1 M NaCl solution was added, and the mixture was shaken for 30 min. The aqueous suspension was removed with a pipette, placed in a new vial, and centrifuged for 3 min at a RCF pf 13,000× g (the same parameters were applied in successive centrifugation steps). The supernatant was discarded, 1 mL of H2O was added to the sediment, and the mixture was stirred and centrifuged. The water was removed, and 1 mL of 80% CsCl solution was added to the purified sediment. The mixture was stirred to obtain a homogeneous suspension and centrifuged, and the supernatant was discarded. The sediment was rinsed three times with 1 mL of H2O according to the above procedure. The purified sediment was suspended in 0.5 mL of acetone and centrifuged. The acetone was removed, and the purified starch sediment was left to dry. Approximately 50 mg of purified starch was collected from each sample; then, 150 μL of 1 M NaCl solution and 150 μL of isopropanol were added; and the mixture was shaken at a temperature of 45 °C for 60 min and centrifuged to separate the suspension. The aqueous phase was removed, combined with 150 μL of cooled acetone, and left overnight at a temperature of −20 °C. Next, 450 µL of acetone cooled to the same temperature was added, and the sample was left overnight at a temperature of −20 °C. After sediment precipitation, each sample was centrifuged, the supernatant was discarded, and the sediment was suspended in 50 µL of SDS-PAGE buffer.
The puroindoline proteins were separated via electrophoresis on polyacrylamide gel with SDS as the denaturing agent, according to the procedure described by Laemmli [49]. Before loading, each sample was incubated at a temperature of 75 °C for 10 min. The proteins were separated on two gel layers, including a layer of condensing gel (5% T, 2.6% C) and a layer of separating gel (15% T, 2.6% C), on plates measuring 180 mm × 160 mm × 1.5 mm. The separation was performed using a Hoefer SE660 electrophoresis unit (Hoefer, Inc., Holliston, MA, USA) at a constant current of 25 mA. The samples were loaded into wells, and the separation was run until the dye front had reached the bottom of the gel.
The separated proteins were stained according to the method described by Gromova and Celis [50] with the modifications proposed by Gasparis [51]. The proteins were stained with 0.2% aqueous solution of silver nitrate with a 0.076% addition of formaldehyde. Protein bands were visualized according to incubation in an aqueous solution of 6% sodium carbonate with a 0.0004% addition of sodium thiosulfate and a 0.05% addition of formaldehyde for 2–5 min. Each sample was rinsed with distilled water and fixed via immersion in 12% acetic acid solution with a 20% addition of methanol for 10 min. The samples were stored in 20% methanol solution.
Images of the separated protein fractions (Figure 1) were acquired using the Kodak Gel Logic 200 Imaging System (Kodak, Molecular Imaging Systems, New Haven, CT, USA). The acquired images were analyzed using MATLAB v. R2011b (MathWorks, Natick, MA, USA). In the first step, the gel region was cropped from the image, and its brightness was adjusted by increasing the contrast to the maximum value (from 0 to 256). In the next step, the region corresponding to the friabilin bands was cropped from the image, and the pixel values in this region were averaged and normalized in the range of 0–1 relative to the intensity of the bands obtained in the reference cultivar (Chinese Spring). The value of the friabilin content indicator (cf) was determined by comparing the intensity of the friabilin bands in the examined wheat cultivars with the intensity of the corresponding bands in the wheat cv. Chinese Spring.

2.5. Statistical Analysis

The results were processed using Statistica for Windows v. 13.3 (TIBCO, Palo Alto, CA, USA) at a significance level of α = 0.05. The following procedures were used in the statistical analyses: descriptive statistics, one-way analysis of variance (ANOVA), correlation analysis, and regression analysis. Differences between the grain parameters in the analyzed wheat cultivars were evaluated using Tukey’s test. Pearson’s correlation coefficients were calculated to determine the strength of the linear relationships between the grain parameters. Regression equations were plotted for highly correlated parameters.

3. Results and Discussion

3.1. Chemical Properties, Vitreousness, and the Hardness Index

Various indicators are used in analytical practice to characterize the grain of different wheat cultivars, including moisture, protein, and ash content; vitreousness; and the HI. The values of the parameters determined in the analyzed wheat cultivars are presented in Table 1. These parameters are considerably influenced by external factors, including environmental conditions and weather, and they can differ even within the same cultivar [52,53,54,55,56]. In the present study, the average dry basis (DB) moisture content of the wheat grain was determined within a relatively narrow range, from around 12.3% DB (SMH 87) to around 13.1% DB (Askalon and Bamberka), which indicates that the examined grain batches can be stored over prolonged periods of time and used in the production process. The average crude protein content was highest in the wheat cv. Fregata (approx. 15.4% DB) and lowest in the cv. SMH214 (approx. 12.2% DB). Other authors have reported a similar range of values [2,8,57,58]. It should also be noted that the grain of the wheat cvs. Türkis, Astoria, Fregata, Radunia, Parabola, Cytra, Askalon, Magic, and Bamberka contained a minimum of 14% protein; therefore, it can be used to enhance mixtures of medium- and low-quality grain. The total ash content ranged from 1.55% DB (Türkis) to 2.02% DB (Radunia), and these values were highly consistent with the data from the literature [2,8,53,58]. The lower the ash content of the grain, the lighter the color of the obtained flour. Grain with a high total ash content is particularly suitable for making brown and wholegrain bread [2,42]. Chinese Spring, Radunia, Parabola, SMH 87, and Ceres were characterized by the highest total ash content.
The sample of the reference wheat cv. Chinese Spring did not contain vitreous or semi-vitreous kernels, and the vitreousness was determined at 0% in this wheat cultivar. In the remaining cultivars, the vitreousness ranged from 2.6% (Türkis) to 89.4% (Bamberka). This parameter is mostly genetically conditioned but it can be modified by changes in weather and environmental conditions, in particular during the growing season, which can contribute to the grain’s apparent vitreousness [52,59]. Vitreous kernels are generally denser than starchy kernels, and they have to be soaked for a longer time before milling [60,61]. According to Woźniak and Gontarz [62], vitreous kernels are characterized by a higher processing suitability because flour with a high extraction rate can be obtained during milling. The grain of the cvs. Bamberka, Ceres, Askalon, and SMH200 was characterized by the highest vitreousness.
The mean values of the HI ranged from 39.7 (Chinese Spring) to 88.6 (SMH214). Based on this parameter, the analyzed wheats were divided into five hardness classes [63]: soft (Chinese Spring), medium soft (Türkis), medium hard (Astoria and Julius), hard (Fregata, Radunia, Parabola, Cytra, Tonacja, Askalon, Magic, and Nutka), and very hard (Bamberka, SMH 196, SMH87, Ceres, SMH200, and SMH214). The HI determined using the SKCS system is one of the most important parameters for evaluating the processing suitability of grain [15,26,64,65,66]. Wheat with a soft endosperm is generally processed into pastry flour; wheat with a medium hard endosperm is processed into baking flour; whereas that with a hard endosperm is used in the production of semolina, couscous, and expanded wheat. In soft wheat, the starch granules are more loosely embedded into the protein matrix than in hard wheat, and the produced flour is finer-grained [6,43,53,61,67].
Analysis of the grain parameters (Table 1) revealed the greatest similarities between the cvs. Askalon and Barmberka. Parabola and SMH296 were most similar whereas Julius was the least similar to the remaining wheat cultivars.

3.2. Geometric Properties and Mass

The mean values of the kernels’ geometric properties and mass are presented in Table 2. On average, the kernel mass was lowest in the cv. Chinese Spring (26.96 mg) and highest in the cv. Ceres (52.02 mg). Chinese Spring was also characterized by the smallest kernels. The longest kernels were noted in the cv. Ceres (7.99 mm), the widest kernels in the cv. Nutka (3.63 mm), and the thickest kernels in the cv. Bamberka (3.05 mm). The geometric properties and mass of the kernels play an important role during grain processing, sorting, separation, and milling [43]. According to Dziki and Laskowski [68], larger grains, in particular grains with a high sphericity index, are more suitable for producing flours with a high extraction rate because large kernels have a more desirable endosperm-to-bran ratio. The sphericity index was highest in the grain of the cv. Bamberka (65.35%) and lowest in the cv. Ceres (53.36%). The processing suitability of grain is evaluated based not only on the size of kernels but also their homogeneity [68], which was highest in the cv. Nutka and lowest in the cv. Parabola. In addition to genetic factors, the geometric properties and mass of the kernels are also affected by environmental conditions, and grain of the same wheat cultivar can differ considerably when grown in various regions. Nonetheless, the mean values of the geometric properties and mass were determined within the range reported in the literature [7,8,69,70,71].
The following pairs of wheat cultivars did not differ significantly in terms of their analyzed properties: Türkis and Fregata, Türkis and Bamberka, Astoria and Julius, Julius and Fregata, Julius and Bamberka, Fregata and Bamberka, Parabola and SMH214, Cytra and Askalon, Cytra and Magic, Tonacja and Nutka, Askalon and Magic, SMH196 and SMH87, SMH196 and Ceres, and SMH200 and SMH214. The grain of the cv. Julius was most similar whereas the grain of the cv. Chinese Spring was most different from the remaining wheat cultivars.

3.3. Mechanical Properties

The mechanical properties of the grain of the evaluated wheat cultivars are presented in Table 3. Its mechanical properties significantly influence the grain milling efficiency [5,8,42]. In this study, the average rupture force required to damage the kernels ranged from around 76 N (Chinese Spring) to around 155 N (Ceres). Similar rupture force values were given by Ibrahim et al. [55] in the grain of Hungarian wheat fertilized with different nitrogen rates. The longitudinal strain was determined in the range of 0.45 mm (Julius) to 0.64 mm (Nutka and Ceres), and the relative strain ranged from around 15.3% (Julius) to around 21.8% (Nutka). Similar rupture force values in wheat grain were noted by Markowski et al. [72], Dziki et al. [42], and Kalkan and Kara [71], but the cited authors reported a higher longitudinal strain and different values for the rupture energy. In the current study, the rupture energy ranged from 11.55 mJ (Chinese Spring) to 28.89 mJ (SMH214). Similar rupture force and rupture energy values in wheat grain were noted by Gorji et al. [73], Başlar et al. [7], and Voicu et al. [74]. The process of grain grinding would be the most energy-intensive in the cvs. Ceres, SMH200, and SMH214 and the least energy-intensive in the cvs. Chinese Spring, Julius, and Askalon.
No significant differences in the mechanical properties of the grain were observed in the following pairs of wheat cultivars: Türkis and Julius, Türkis and Cytra, Türkis and Askalon, Türkis and Magic, Astoria and Fregata, Astoria and Radunia, Astoria and Parabola, Astoria and Magic, Fregata and Radunia, Fregata and Parabola, Fregata and Magic, Fregata and Bamberka, Fregata and SMH196, Radunia and Parabola, Radunia and Magic, Radunia and Bamberka, Parabola and Bamberka, Parabola and SMH196, Cytra and Askalon, Cytra and Magic, Tonacja and Bamberka, Askalon and Magic, Bamberka and SMH196, and SMH200 and SMH214. The grain of the cv. Magic was most similar whereas the grain of the wheat cv. Ceres was most different from the remaining cultivars.
The cultivar pairs Cytra and Magic, Askalon and Magic, and SMH200 and SMH214 were most similar in terms of all the examined grain parameters. In turn, the greatest differences were observed between the cvs. Chinese Spring and Bamberka, and these pairs were always classified into different homogeneous groups. The grain of the cvs. Fregata and Parabola can be used to determine the physicochemical parameters of wheat kernels because these cultivars were most similar to the other wheat cultivars. In this respect, Chinese Spring differed most considerably from the remaining wheat cultivars.

3.4. Friabilin Content Indicator

According to Martin et al. [32], Chinese Spring should be used as the reference cultivar for determining the friabilin content of wheat grain in SDS-PAGE analysis. In the present study, the friabilin content indicator was set at 1 for the reference cultivar (Chinese Spring) (Figure 2). In the remaining wheat cultivars, this parameter ranged from 0.213 (SMH87) to 0.769 (Parabola). The wide practical application of the proposed approach to determining the friabilin content of wheat grain as a measurement method would require validation, which could not be conducted in this study. The results obtained with the use of this approach should also be compared with the results of measurements performed with other methods, such as RP-HPLC.
Contrary to the observations made by other authors [6,12,75], the friabilin content did not always decrease with an increase in the HI. According to Bhave and Morris [15], the kernel hardness is not affected by the total content of friabilin proteins but only by the protein fractions that are directly associated with starch. For this reason, kernels with the same content of friabilin proteins often differ in their HI values. Similar observations were made by Anjum and Walker [76], Geneix et al. [77], and Tu and Li [26], who concluded that significant differences in the hardness of the wheat kernels with a similar content of puroindoline proteins may suggest that this parameter is also influenced by other factors. Therefore, the value of the friabilin content indicator determined for the grain of a given wheat cultivar is not always correlated with its mechanical properties.

3.5. Correlations between the Fiabilin Content Indicator and the Physicochemical Properties of Grain

The correlation coefficients describing the strength of the relationships between the friabilin content indicator and selected physicochemical properties of wheat grain are presented in Table 4. The friabilin content indicator was bound by the strongest correlation with the kernel length (0.621) and by the weakest correlation with the total ash content (0.083). In addition to the mean kernel length, the friabilin content indicator was also significantly influenced by the mean kernel thickness, mass, rupture force, rupture energy, vitreousness, and HI. The correlation coefficients noted for these pairs were negative, which testifies to their inversely proportional relationship, where an increase in the value of one parameter induces a decrease in the value of the other parameter. The presence of correlations between the friabilin content of grain, its geometric properties, and the mass of its kernels could be a unique feature of wheat cultivars grown in Polish regions because no such relationships have been reported in the literature. The observed correlations could result from changes in the puroindoline profile with an increase in kernel size, but more detailed chemical analyses are needed to confirm this hypothesis. However, the friabilin content was found to be associated with the rupture force, rupture energy and HI in other studies, although these correlations were relatively weak. Geneix et al. [77] reported higher values of coefficients of correlation between the content of puroindoline proteins, the particle size index (PSI) (0.94), and the grain hardness measured using near-infrared spectroscopy (NIRS) (0.70). According to Hogg et al. [10], the wheat grain hardness is not correlated with the total content of puroindoline proteins but with the content of the PINA and PINB proteins. This observation could explain the findings of Mikulíková [14] and Tu and Li [26], who concluded that only approximately 60% of the variation in kernel hardness can be attributed to the friabilin content.
Due to the relatively weak correlations between the compared parameters, the derived regression equations were characterized by relatively low values of coefficients of determination (Figure 3). These relationships can be described with linear functions, and the highest value of the coefficient of determination was noted for the relationship between the kernel length and the friabilin content indicator (R2 = 0.39).
The friabilin content indicator decreased with a rise in the mean kernel length, thickness, and mass, and the noted decrease exceeded 50% in extreme cases. An increase in the friabilin content indicator also led to a decrease in the vitreousness, HI, rupture force, and rupture energy. The vitreousness decreased by around 70%, the HI decreased by around 40%, the rupture force decreased by around 40%, and the rupture energy decreased by around 50% when the friabilin content indicator increased from 0.21 to 1. This indicates that in a given wheat cultivar, the mean kernel length is associated with a certain value of the friabilin content indicator, and this information can be used to estimate the energy consumption during grain griding and milling.

4. Conclusions

In the proposed approach, the friabilin content of wheat grain was determined by comparing the intensity of the friabilin bands in electropherograms of the analyzed wheat cultivars and the reference cultivar. Image analysis software can be used to perform accurate measurements because visual inspection of the band intensity is not highly reliable.
In the grain of the analyzed wheat cultivars, the friabilin content ranged from around 0.21 (SMH87) to around 0.77 (Parabola) relative to the Chinese Spring reference.
The friabilin content indicator was significantly correlated with the mean kernel length, thickness, mass, vitreousness, HI, rupture force, and rupture energy. Among these parameters, this indicator was bound by the strongest correlation with the kernel length and by the weakest correlation with vitreousness.
The presence of a relatively low coefficient of correlation between the friabilin content indicator and grain hardness validates the hypothesis that wheat grain’s resistance to mechanical damage is conditioned not only by the content of puroindoline proteins but also by other factors.

Author Contributions

Conceptualization, A.M.-M. and M.W.; methodology, Z.K., A.M.-M., M.W. and S.G.; software, Z.K. and S.L.; validation, Z.K.; formal analysis, Z.K.; investigation, Z.K.; resources, A.M.-M.; data curation, A.M.-M. and S.G.; writing—original draft preparation, Z.K., A.M.-M. and M.W.; writing—review and editing, Z.K. and M.W.; visualization, Z.K.; supervision, Z.K.; project administration, Z.K. and M.W.; funding acquisition, Z.K. and A.M.-M. All authors have read and agreed to the published version of the manuscript.

Funding

This research received no external funding.

Institutional Review Board Statement

Not applicable.

Informed Consent Statement

Not applicable.

Data Availability Statement

The raw data supporting the conclusions of this article will be made available by the authors on request.

Conflicts of Interest

The authors declare no conflicts of interest.

References

  1. Kim, K.-H.; Kim, J.-Y. Understanding wheat starch metabolism in properties, environmental stress condition, and molecular approaches for value-added utilization. Plants 2021, 10, 2282. [Google Scholar] [CrossRef]
  2. Gooding, M.J.; Shewry, P.R. Wheat: Environment, Food and Health; Wiley Online Library: John Wiley & Sons Ltd.: Hoboken, NJ, USA, 2022. [Google Scholar] [CrossRef]
  3. Biel, W.; Maciorowski, L. Assessing nutritional value of grains of selected wheat cultivars. Zywn.-Nauk. Technol. Ja. 2012, 2, 45–55. [Google Scholar] [CrossRef]
  4. Groos, C.; Bervas, E.; Charmet, G. Genetic analysis of grain protein content, grain hardness and dough rheology in a hard × hard bread wheat progeny. J. Cereal Sci. 2004, 40, 93–100. [Google Scholar] [CrossRef]
  5. Różyło, R.; Laskowski, J. Study of relationships between physical ad technological properties of spring wheat grain. Acta Agroph. 2007, 9, 459–470. [Google Scholar]
  6. Pasha, I.; Anjum, F.M.; Morris, C.F. Grain hardness: A major determinant of wheat quality. Food Sci. Technol. Int. 2010, 16, 511–522. [Google Scholar] [CrossRef] [PubMed]
  7. Başlar, M.; Kalkan, F.; Kara, M.; Ertugay, M.F. Correlation between the protein content and mechanical properties of wheat. Turk. J. Agric. For. 2012, 36, 601–607. [Google Scholar] [CrossRef]
  8. Kasraei, M.; Nejadi, J.; Shafiei, S. Relationship between grain physicochemical and mechanical properties of some Iranian wheat cultivars. J. Agric. Sci. Technol. 2015, 17, 635–647. [Google Scholar]
  9. Kaliniewicz, Z.; Markowska-Mendik, A.; Warechowska, M. An evaluation of selected engineering properties of polish durum wheat grain. J. Cereal Sci. 2022, 104, 103401. [Google Scholar] [CrossRef]
  10. Hogg, A.C.; Sripo, T.; Beecher, B.; Martin, J.M.; Giroux, M.J. Wheat puroindolines interact to form friabilin and control wheat grain hardness. Theor. Appl. Genet. 2004, 108, 1089–1097. [Google Scholar] [CrossRef]
  11. Turnbull, K.-M.; Rahman, S. Endosperm texture in wheat. J. Cereal Sci. 2002, 36, 327–337. [Google Scholar] [CrossRef]
  12. Laskowski, J.; Różyło, R. Influence of gluten content and wheat glassiness on the wheat grain grinding energy. Acta Agroph. 2003, 2, 589–596. [Google Scholar]
  13. Morris, C.F. Puroindolines: The molecular genetic basis of wheat grain hardness. Plant Mol. Biol. 2002, 48, 633–647. [Google Scholar] [CrossRef] [PubMed]
  14. Mikulíková, D. The effect of friabilin on wheat grain hardness. Czech J. Genet. Plant Breed. 2007, 43, 35–43. [Google Scholar] [CrossRef]
  15. Bhave, M.; Morris, C.F. Molecular genetics of puroindolines and related genes: Regulation of expression, membrane binding properties and applications. Plant Mol. Biol. 2008, 66, 221–231. [Google Scholar] [CrossRef] [PubMed]
  16. Lullien-Pellerin, V.; Haraszi, R.; Anderssen, R.S.; Morris, C.F. Understanding the mechanics of wheat grain fractionation and the impact of puroindolines on milling and product quality. In Wheat Quality for Improving Processing and Human Health; Igrejas, G., Ikeda, T., Guzmán, C., Eds.; Springer: Cham, Switzerland, 2020; pp. 369–385. [Google Scholar] [CrossRef]
  17. Giroux, M.J.; Morris, C.F. Wheat grain hardness results from highly conserved mutations in the friabilin components puroindoline a and b. Proc. Natl. Acad. Sci. USA 1998, 95, 6262–6266. [Google Scholar] [CrossRef]
  18. Gazza, L.; Nocente, F.; Ng, P.K.W.; Pogna, N.E. Genetic and biochemical analysis of common wheat cultivars lacking puroindoline a. Theor. Appl. Genet. 2005, 110, 470–478. [Google Scholar] [CrossRef]
  19. Ni, D.; Yang, F.; Lin, L.; Sun, C.; Ye, X.; Wang, L.; Kong, X. Interrelating grain hardness index of wheat with physicochemical and structural properties of starch extracted therefrom. Foods 2022, 11, 1087. [Google Scholar] [CrossRef] [PubMed]
  20. Tranquilli, G.; Heaton, J.; Chicaiza, O.; Dubcovsky, J. Substitutions and deletions of genes related to grain hardness in wheat and their effect on grain texture. Crop Sci. 2002, 42, 1812–1817. [Google Scholar] [CrossRef]
  21. Gasparis, S.; Nadolska-Orczyk, A. Genetic background of wheat and triticale grain hardness. Biul. Inst. Hod. i Aklim. Roślin 2013, 267, 17–29. (In Polish) [Google Scholar]
  22. Nucia, A.; Okoń, S.; Tomczyńska-Mleko, M.; Nawrocka, A. Molecular and physical characterization of grain hardness in European spring common wheat (Triticum aestivum L.). 3 Biotech 2021, 11, 345. [Google Scholar] [CrossRef]
  23. Capparelli, R.; Amoroso, M.G.; Palumbo, D.; Iannaccone, M.; Faleri, C.; Cresti, M. Two plant puroindolines colocalize in wheat seed and in vitro synergistically fight against pathogens. Plant Mol. Biol. 2005, 58, 857–867. [Google Scholar] [CrossRef] [PubMed]
  24. Wiley, P.R.; Tosi, P.; Evrard, A.; Lovergrove, A.; Jones, H.D.; Shewry, P.R. Promoter analysis and immunolocalisation show that puroindoline genes are exclusively expressed in starchy endosperm cells of wheat grain. Plant Mol. Biol. 2007, 64, 125–136. [Google Scholar] [CrossRef] [PubMed]
  25. Feiz, L.; Wanjugi, H.W.; Melnyk, C.W.; Altossar, I.; Martin, J.M.; Giroux, M.J. Puroindolines co-localize to the starch granule surface and increase seed bound polar lipid content. J. Cereal Sci. 2009, 50, 91–98. [Google Scholar] [CrossRef]
  26. Tu, M.; Li, Y. Toward the genetic basis and multiple QTLs of kernel hardness in wheat. Plants 2020, 9, 1631. [Google Scholar] [CrossRef] [PubMed]
  27. Beecher, B.; Bettge, A.; Smidansky, E.; Giroux, M.J. Expression of wild-type PinB sequence in transgenic wheat complements a hard phenotype. Theor. Appl. Genet. 2002, 105, 870–877. [Google Scholar] [CrossRef] [PubMed]
  28. Chen, M.; Wilkinson, M.; Tosi, P.; He, G.; Shewry, P. Novel puroindoline and grain softness protein alleles in Aegilops species with the C, D, S, M and U genomes. Theor. Appl. Genet. 2005, 111, 1159–1166. [Google Scholar] [CrossRef] [PubMed]
  29. Qian, Y.; Preston, K.; Krokhin, O.; Mellish, J.; Ens, W. Characterization of wheat gluten proteins by HPLC and MALDI TOF mass spectrometry. J. Am. Soc. Mass Spectrom. 2008, 19, 1542–1550. [Google Scholar] [CrossRef]
  30. Obuchowski, W.; Salmanowicz, B.; Banaszak, Z.; Adamski, T.; Surma, M.; Kaczmarek, Z.; Majcher, M.; Ługowska, B.; Kuczyńska, A.; Krystkowiak, K. Grain hardness of wheat bred in Poland and its relationship to starch damage during milling. Int. Agrophys. 2010, 24, 69–74. [Google Scholar]
  31. Zhang, Y.; Hu, X.; Juhasz, A.; Islam, S.; Yu, Z.; Zhao, Y.; Li, G.; Ding, W.; Ma, W. Characterising avenin-like proteins (ALPs) from albumin/globulin fraction of wheat grains by RP-HPLC, SDS-PAGE, and MS/MS peptides sequencing. BMC Plant Biol. 2020, 20, 45. [Google Scholar] [CrossRef]
  32. Martin, J.M.; Meyer, F.D.; Smidansky, E.D.; Wanjugi, H.; Blechl, A.E.; Giroux, M.J. Complementation of the pina (null) allele with the wild type Pina sequence restores a soft phenotype in transgenic wheat. Theor. Appl. Genet. 2006, 113, 1563–1570. [Google Scholar] [CrossRef]
  33. Li, G.; He, Z.; Peňa, R.J.; Xia, X.; Lillemo, M.; Qixin, S. Identification of novel secaloindoline-a and secaloindoline-b alleles in CIMMYT hexaploid triticale lines. J. Cereal Sci. 2006, 43, 378–386. [Google Scholar] [CrossRef]
  34. Chantret, N.; Salse, J.; Sabot, F.; Rahman, S.; Bellec, A.; Laubin, B.; Dubois, I.; Dossat, C.; Sourdille, P.; Joudrier, P.; et al. Molecular basis of evolutionary events that shaped the Hardness locus in diploid and polyploid wheat species (Triticum and Aegilops). Plant Cell 2005, 17, 1033–1045. [Google Scholar] [CrossRef]
  35. Wanjugi, H.W.; Hogg, A.C.; Martin, J.M.; Giroux, M.J. The role of puroindoline A and B individually and in combination on grain hardness and starch association. Crop Sci. 2007, 47, 67–76. [Google Scholar] [CrossRef]
  36. ISO 20483:2013; Cereals and Pulses—Determination of the Nitrogen Content and Calculation of the Crude Protein Content—Kjeldahl Method. International Organization for Standardization: Geneva, Switzerland, 2013. Available online: https://www.iso.org/standard/59162.html (accessed on 16 January 2023).
  37. ISO 2171:2007; Cereals, Pulses and By-Products—Determination of Ash Yield by Incineration. International Organization for Standardization: Geneva, Switzerland, 2007. Available online: https://www.iso.org/standard/37264.html (accessed on 16 January 2023).
  38. Symons, S.J.; Van Schepdael, L.; Dexter, J.E. Measurement of hard vitreous kernels in durum wheat by machine vision. Cereal Chem. 2003, 80, 511–517. [Google Scholar] [CrossRef]
  39. AACC method 55-31.01. Single-kernel characterization system for wheat kernel texture. In AACC Approved Methods of Analysis, 11th ed.; Cereals & Grains Association: Eagan, MN, USA, 2010. [CrossRef]
  40. Martin, C.R.; Rousser, R.; Brabec, D.L. Development of a single-kernel wheat characterization system. Trans. ASAE 1993, 36, 1399–1404. [Google Scholar] [CrossRef]
  41. ISO 24333:2009; Cereals and Cereal Products—Sampling. International Organization for Standardization: Geneva, Switzerland, 2009. Available online: https://www.iso.org/standard/42165.html (accessed on 16 January 2023).
  42. Dziki, D.; Cacak-Pietrzak, G.; Miś, A.; Jończyk, K.; Gawlik-Dziki, U. Influence of wheat kernel physical properties on the pulverizing process. J. Food Sci. Technol. 2014, 51, 2648–2655. [Google Scholar] [CrossRef] [PubMed]
  43. Babić, L.; Babić, M.; Turan, J.; Matić-Kekić, S.; Radojčin, M.; Mehandžić-Stanišić, S.; Pavkova, I.; Zoranović, M. Physical and stress-strain properties of wheat (Triticum aestivum) kernel. J. Sci. Food Agric. 2011, 91, 1236–1243. [Google Scholar] [CrossRef] [PubMed]
  44. Morris, C.F.; Bhave, M. Reconciliation of D-genome puroindoline allele designations with current DNA sequence data. J. Cereal Sci. 2008, 48, 277–287. [Google Scholar] [CrossRef]
  45. Wang, J.; Sun, J.; Liu, D.; Yang, W.; Wang, D.; Tong, Y.; Zhang, A. Analysis of Pina and Pinb alleles in the micro-core collections of Chinese wheat germplasm by ecotilling and identification of a novel Pinb allele. J. Cereal Sci. 2008, 48, 836–842. [Google Scholar] [CrossRef]
  46. Feiz, L.; Martin, J.M.; Giroux, M.J. Creation and functional analysis of new puroindoline alleles in Triticum aestivum. Theor. Appl. Genet. 2009, 118, 247–257. [Google Scholar] [CrossRef] [PubMed]
  47. Bettge, A.D.; Morris, C.F.; Greenblatt, G.A. Assessing genotypic softness in single wheat kernels using starch granule-associated friabilin as a biochemical marker. Euphytica 1995, 86, 65–72. [Google Scholar] [CrossRef]
  48. Chang, C.; Zhang, H.P.; Xu, J.; Li, W.H.; Liu, G.T.; You, M.S.; Li, B.Y. Identification of allelic variations of puroindoline genes controlling grain hardness in wheat using a modified denaturing PAGE. Euphytica 2006, 152, 225–234. [Google Scholar] [CrossRef]
  49. Laemmli, U.K. Cleavage of structural proteins during the assembly of the head of bacteriophage T4. Nature 1970, 227, 680–685. [Google Scholar] [CrossRef] [PubMed]
  50. Gromova, I.; Celis, J.E. Chapter 27—Protein detection in gels by silver staining: A procedure compatible with mass spectrometry. In Cell Biology. A Laboratory Handbook, 3rd ed.; Celis, J.E., Carter, N., Simons, K., Eds.; Elsevier: Amsterdam, The Netherlands, 2006; Volume 4, pp. 219–223. [Google Scholar] [CrossRef]
  51. Gasparis, S. Analysis of Pina and Pinb Genes Determining Grain Hardness in Hexaploid Wheat and Their Orthologs in Triticale; Instytut Hodowli i Aklimatyzacji Roślin—Państwowy Instytut Badawczy: Radzików, Poland, 2012. (In Polish) [Google Scholar]
  52. Greffeuille, V.; Abecassis, J.; Rousset, M.; Oury, F.-X.; Faye, A.; L’Helgouac’h, C.B.; Lullien-Pellerin, V. Grain characterization and milling behaviour of near-isogenic lines differing by hardness. Theor. Appl. Genet. 2006, 114, 1–12. [Google Scholar] [CrossRef] [PubMed]
  53. Hrušková, M.; Švec, I. Wheat hardness in relation to other quality factors. Czech J. Food Sci. 2009, 27, 240–248. [Google Scholar] [CrossRef]
  54. Oury, F.X.; Lasme, P.; Michelet, C.; Rousset, M.; Abecassis, J.; Lullien-Pellerin, V. Relationships between wheat grain physical characteristics studied through near-isogenic lines with distinct puroindoline-b allele. Theor. Appl. Genet. 2015, 128, 913–929. [Google Scholar] [CrossRef] [PubMed]
  55. Ibrahim, A.; Varga, A.C.; Jolánkai, M.; Safranyik, F. Applying infrared technique as a nondestructive method to assess wheat grain hardness. Int. J. Sci. Qual. Anal. 2018, 4, 100–107. Available online: https://article.sciencepublishinggroup.com/pdf/10.11648.j.ijsqa.20180403.16.pdf (accessed on 16 January 2023).
  56. Manai-Djebali, H.; Oueslati, I.; Nouairi, I.; Taamalli, A.; Nait-Mohamed, S.; Mliki, A.; Ghorbel, A. Chemical composition of durum wheat kernels: Impact of the growing location. Euro-Mediterr. J. Environ. Integr. 2021, 6, 26. [Google Scholar] [CrossRef]
  57. El-Khayat, G.H.; Samaan, J.; Manthey, F.A.; Fuller, M.P.; Brennan, C.S. Durum wheat quality I: Some physical and chemical characteristics of Syrian durum wheat genotypes. Int. J. Food Sci. Technol. 2006, 41, 22–29. [Google Scholar] [CrossRef]
  58. Boz, H.; Gerçekaslan, K.E.; Karaoğlu, M.M.; Kotancilar, H.G. Differences in some physical and chemical properties of wheat grains from different parts within the spike. Turk. J. Agric. For. 2012, 36, 309–316. [Google Scholar] [CrossRef]
  59. Korkut, K.Z.; Bílgín, O.; Başer, Í.; Sağlam, N. Stability of grain vitreousness in durum wheat (Triticum durum L. Desf.) genotypes in the north-western region of Turkey. Turk. J. Agric. For. 2007, 31, 313–318. [Google Scholar]
  60. Manley, M.; du Toit, G.; Geladi, P. Tracking diffusion of conditioning water in single wheat kernels of different hardnesses by near infrared hyperspectral imaging. Anal. Chim. Acta 2011, 686, 64–75. [Google Scholar] [CrossRef] [PubMed]
  61. Fu, B.X.; Wang, K.; Dupuis, B.; Taylor, D.; Nam, S. Kernel vitreousness and protein content: Relationship, interaction and synergistic effects on durum wheat quality. J. Cereal Sci. 2017, 78, 2–9. [Google Scholar] [CrossRef]
  62. Woźniak, A.; Gontarz, D. Evaluation of selected quality features of grain of durum wheat cv. Floradur depending on tillage and nitrogen fertilisation. Acta Agroph. 2011, 18, 481–489. [Google Scholar]
  63. Mahesh, S.; Jayas, D.S.; Paliwal, J.; White, N.D.G. Comparison of partial least squares regression (PLSR) and principal components regression (PCR) methods for protein and hardness predictions using the near-infrared (NIR) hyperspectral images of bulk samples of Canadian wheat. Food Bioproc. Tech. 2015, 8, 31–40. [Google Scholar] [CrossRef]
  64. Dobraszczyk, B.J.; Withworth, M.B.; Vincent, J.F.V.; Khan, A.A. Single kernel wheat hardness and fracture properties in relation to density and the modeling of fracture in wheat endosperm. J. Cereal Sci. 2002, 35, 245–263. [Google Scholar] [CrossRef]
  65. Anderssen, R.; Haraszi, R. Characterizing and exploiting the rheology of wheat hardness. Eur. Food Res. Technol. 2009, 229, 159–174. [Google Scholar] [CrossRef]
  66. Erkinbaev, C.; Derksen, K.; Paliwal, J. Single kernel wheat hardness estimation using near infrared hyperspectral imaging. Infrared Phys. Technol. 2019, 98, 250–255. [Google Scholar] [CrossRef]
  67. Misailidis, N.; Campbell, G. Interpreting crush response profiles from the single kernel characterization system. J. Cereal Sci. 2013, 57, 222–229. [Google Scholar] [CrossRef]
  68. Dziki, D.; Laskowski, J. Wheat kernel physical properties and milling process. Acta Agroph. 2005, 6, 59–71. [Google Scholar]
  69. Yücel, C.; Baloch, F.S.; Özkan, H. Genetic analysis of some physical properties of bread wheat grain (Triticum aestivum L. em Thell). Turk. J. Agric. For. 2009, 33, 525–535. [Google Scholar] [CrossRef]
  70. Boac, J.M.; Casada, M.E.; Maghirang, R.G.; Harner, J.P., III. Material and interaction properties of selected grains and oilseeds for modeling discrete particles. Trans. ASABE 2010, 53, 1201–1216. [Google Scholar] [CrossRef]
  71. Kalkan, F.; Kara, M. Handling, frictional and technological properties of wheat as affected by moisture content and cultivar. Powder Technol. 2011, 213, 116–122. [Google Scholar] [CrossRef]
  72. Markowski, M.; Żuk-Gołaszewska, K.; Kwiatkowski, D. Influence of variety on selected physical and mechanical properties of wheat. Ind. Crops Prod. 2013, 47, 113–117. [Google Scholar] [CrossRef]
  73. Gorji, A.; Rajabipour, A.; Tawakoli, H. Fracture resistance of wheat grain as a function of moisture content, loading rate and grain orientation. Aust. J. Crop Sci. 2010, 4, 448–452. [Google Scholar]
  74. Voicu, G.; Tudosie (Stefan), E.M.; Ungureanu, N.; Constantin, G.A. Some mechanical characteristics of wheat seeds obtained by uniaxial compression tests. UPB Sci. Bull. Ser. D 2013, 75, 265–278. [Google Scholar]
  75. Langer, M.; Salmanowicz, B.P. Identification of puroindoline alleles in Polish wheat cultivars by molecular marker. Biul. Inst. Hod. Aklim. Rośl. 2009, 253, 93–101. (In Polish) [Google Scholar]
  76. Anjum, F.M.; Walker, C.E. Review on the significance of starch and protein to wheat kernel hardness. J. Sci. Food Agric. 2006, 56, 1–13. [Google Scholar] [CrossRef]
  77. Geneix, N.; Dalgalarrondo, M.; Tassy, C.; Nadaud, I.; Barret, P.; Bakan, B.; Elmorjani, K.; Marion, D. Relationships between puroindoline A-prolamin interactions and wheat grain hardness. PLoS ONE 2020, 15, e0225293. [Google Scholar] [CrossRef]
Figure 1. Determination of the friabilin content indicator in the analyzed wheat cultivars based on band intensity in SDS-PAGE electropherograms. Friabilin bands are outlined with a dashed line. A marker with a molecular weight of 15 kDa is marked with a red arrow.
Processes 12 00398 g001
Figure 2. Values of the friabilin content indicator and the grain hardness index (HI) in the analyzed wheat cultivars.
Processes 12 00398 g002
Figure 3. Relationships between the friabilin content indicator and the physical properties of wheat grain: (a) length and friabilin content indicator; (b) thickness and friabilin content indicator; (c) mass and friabilin content indicator; (d) friabilin content indicator and vitreousness; (e) friabilin content indicator and hardness index HI; (f) friabilin content indicator and rupture force; (g) friabilin content indicator and rupture energy.
Processes 12 00398 g003aProcesses 12 00398 g003b
Table 1. Approximate composition, vitreousness, and hardness index (mean value ± standard deviation) of wheat grain.
CultivarMoisture
[% DB]
Crude Protein
[% DM]
Total Ash
[% DM]
Vitreousness
[%]
Hardness Index HI [–]
Chinese Spring12.63 ± 0.32 de12.69 ± 0.03 bc2.01 ± 0.01 j0 a39.74 ± 11.56 a
Türkis12.75 ± 0.39 fg14.17 ± 0.01 g1.55 ± 0.01 a2.60 ± 0.55 a48.16 ± 16.36 b
Astoria12.83 ± 0.39 g14.82 ± 0.02 k1.68 ± 0.02 d54.00 ± 4.74 c53.22 ± 13.79 c
Julius12.99 ± 0.40 h13.66 ± 0.03 f1.64 ± 0.02 cd10.20 ± 2.39 b57.81 ± 16.83 d
Fregata12.57 ± 0.36 cd15.36 ± 0.10 l1.68 ± 0.02 d72.20 ± 1.92 de66.08 ± 12.82 e
Radunia12.60 ± 0.41 de14.52 ± 0.08 hi2.02 ± 0.01 j54.60 ± 1.95 c66.64 ± 14.09 e
Parabola12.62 ± 0.40 de14.78 ± 0.05 jk2.01 ± 0.01 j72.80 ± 3.08 de67.26 ± 13.80 e
Cytra12.80 ± 0.43 fg14.59 ± 0.06 ij1.85 ± 0.03 fg49.00 ± 1.23 c68.30 ± 14.66 e
Tonacja12.58 ± 0.43 de13.42 ± 0.12 e1.73 ± 0.02 e80.20 ± 1.48 ef70.35 ± 12.93 ef
Askalon13.08 ± 0.35 h14.11 ± 0.14 g1.62 ± 0.01 bc86.80 ± 2.77 gh73.89 ± 15.16 fg
Magic12.81 ± 0.43 fg14.58 ± 0.03 ij1.57 ± 0.01 ab61.60 ± 2.19 d76.76 ± 14.99 gh
Nutka12.70 ± 0.37 ef13.14 ± 0.05 d1.82 ± 0.01 f82.60 ± 2.41 fg77.87 ± 13.08 g–i
Bamberka13.07 ± 0.33 h14.31 ± 0.08 gh1.65 ± 0.01 cd89.40 ± 0.89 h80.56 ± 12.36 h–j
SMH19612.52 ± 0.48 cd12.72 ± 0.08 bc1.87 ± 0.01 gh77.20 ± 1.48 e81.89 ± 18.49 ij
SMH8712.34 ± 0.47 b13.52 ± 0.09 ef1.96 ± 0.01 i84.80 ± 1.64 f–h83.66 ± 16.84 j
Ceres12.16 ± 0.43 a12.85 ± 0.05 c1.93 ± 0.02 hi87.80 ± 2.27 h85.96 ± 17.40 k
SMH20012.46 ± 0.41 c12.52 ± 0.05 b1.84 ± 0.01 fg85.40 ± 1.67 gh88.17 ± 17.88 k
SMH21412.81 ± 0.44 g12.20 ± 0.02 a1.90 ± 0.01 hi81.20 ± 2.09 e–g88.62 ± 20.05 k
a,…,l—superscript letters denote significant differences between the examined properties at p < 0.05.
Table 2. Geometric properties and mass (mean value ± standard deviation) of wheat grain.
CultivarLength
[mm]
Width
[mm]
Thickness
[mm]
Mass
[mg]
Aspect Ratio
[%]
Sphericity
[%]
Chinese Spring5.41 ± 0.23 a2.76 ± 0.27 a2.46 ± 0.17 a26.960 ± 5.58 a50.91 ± 3.90 cd61.33 ± 2.56 gh
Türkis6.22 ± 0.39 c–e3.61 ± 0.39 ef2.96 ± 0.24 d–f47.38 ± 9.90 d–f58.03 ± 5.26 h65.05 ± 2.95 k
Astoria6.33 ± 0.37 e3.48 ± 0.32 c–f2.87 ± 0.29 b–e45.04 ± 10.33 c–e55.09 ± 4.15 e–g62.97 ± 3.04 h–j
Julius6.24 ± 0.40 de3.43 ± 0.33 b–f2.94 ± 0.23 d–f46.07 ± 9.49 c–f55.07 ± 4.96 e–g63.70 ± 2.76 i–k
Fregata6.23 ± 0.37 de3.52 ± 0.25 d-f3.04 ± 0.27 f47.97 ± 8.54 d–f56.55 ± 2.83 f–h65.10 ± 1.91 k
Radunia6.34 ± 0.38 e3.31 ± 0.35 bc2.95 ± 0.29 d–f42.86 ± 9.99 b–d52.20 ± 4.71 cd62.31 ± 3.16 g–i
Parabola6.96 ± 0.56 fg3.36 ± 0.35 b–d3.02 ± 0.32 ef49.06 ± 10.96 ef48.38 ± 5.20 bc59.36 ± 3.44 ef
Cytra5.78 ± 0.41 b3.29 ± 0.36 bc2.75 ± 0.24 bc37.46 ± 8.68 b56.97 ± 5.45 f–h64.68 ± 3.24 jk
Tonacja6.74 ± 0.40 f3.62 ± 0.25 f2.97 ± 0.23 d–f51.62 ± 8.16 f53.73 ± 3.16 de61.81 ± 2.12 gh
Askalon5.99 ± 0.26 b-d3.30 ± 0.31 bc2.73 ± 0.21 b40.51 ± 8.35 bc55.02 ± 4.06 e–g62.98 ± 2.51 h–j
Magic5.96 ± 0.38 bc3.26 ± 0.29 b2.82 ± 0.22 b–d40.89 ± 8.54 bc54.63 ± 3.61 d–f63.67 ± 2.18 i–k
Nutka6.93 ± 0.37 f3.63 ± 0.23 f2.94 ± 0.16 d–f51.50 ± 6.54 f52.41 ± 2.85 c–e60.57 ± 1.89 fg
Bamberka6.26 ± 0.31 e3.59 ± 0.30 ef3.05 ± 0.27 f49.77 ± 9.03 ef57.41 ± 3.94 gh65.35 ± 3.07 k
SMH1967.78 ± 0.50 jk3.27 ± 0.29 b3.03 ± 0.22 ef51.54 ± 10.10 f42.13 ± 3.84 a54.71 ± 2.80 ab
SMH877.54 ± 0.41 ij3.24 ± 0.24 b3.01 ± 0.26 ef50.49 ± 9.01 ef43.06 ± 2.79 a55.58 ± 2.39 bc
Ceres7.99 ± 0.40 k3.24 ± 0.27 b3.00 ± 0.24 ef52.02 ± 10.40 f40.57 ± 3.30 a53.36 ± 2.65 a
SMH2007.32 ± 0.47 hi3.37 ± 0.28 b–d2.90 ± 0.20 c–f48.10 ± 8.38 d-f46.22 ± 4.16 b56.76 ± 2.83 cd
SMH2147.20 ± 0.46 gh3.42 ± 0.26 b–e3.01 ± 0.21 ef48.88 ± 9.11 ef47.60 ± 3.57 b58.37 ± 2.74 de
a,…,k—superscript letters denote significant differences between the examined properties at p < 0.05.
Table 3. Mechanical properties (mean value ± standard deviation) of wheat grain.
CultivarRupture Force
[N]
Longitudinal Strain
[mm]
Relative Strain
[%]
Rupture Energy
[mJ]
Chinese Spring76.10 ± 13.22 a0.46 ± 0.05 a18.57 ± 1.75 fg11.55 ± 3.57 a
Türkis100.26 ± 18.70 b–d0.46 ± 0.04 a15.58 ± 1.63 ab15.51 ± 4.50 a–d
Astoria105.00 ± 18.93 b–e0.50 ± 0.05 bc17.50 ± 1.93 c–f18.69 ± 5.93 c–f
Julius92.43 ± 22.10 ab0.45 ± 0.05 a15.28 ± 1.83 a13.83 ± 5.07 ab
Fregata113.05 ± 22.06 c–f0.51 ± 0.06 b–e16.93 ± 2.16 b–d20.49 ± 7.60 ef
Radunia117.50 ± 27.90 d–f0.50 ± 0.06 b–d17.10 ± 1.73 c–e19.74 ± 6.83 d–f
Parabola111.96 ± 27.79 c–f0.52 ± 0.10 c–e17.40 ± 3.56 c–f20.49 ± 8.25 ef
Cytra102.76 ± 17.69 b–d0.46 ± 0.04 a16.79 ± 1.49 bc15.93 ± 4.04 a–d
Tonacja140.75 ± 19.93 gh0.54 ± 0.06 d–f18.29 ± 2.03 ef25.08 ± 7.14 gh
Askalon98.51 ± 21.39 bc0.46 ± 0.04 a16.93 ± 1.40 b–d14.81 ± 4.62 a–c
Magic112.32 ± 23.57 c–f0.48 ± 0.04 ab16.93 ± 1.51 b–d17.73 ± 5.47 b–e
Nutka123.70 ± 26.47 fg0.64 ± 0.07 h21.84 ± 2.13 j22.65 ± 7.63 fg
Bamberka126.10 ± 17.83 fg0.52 ± 0.05 c–e16.98 ± 1.17 c–e20.95 ± 4.49 e–g
SMH196122.41 ± 36.36 ef0.55 ± 0.07 ef18.22 ± 2.72 d–f21.32 ± 9.60 e–g
SMH87124.80 ± 28.39 fg0.60 ± 0.06 f19.91 ± 2.30 gh21.95 ± 7.59 e–g
Ceres154.87 ± 40.96 h0.64 ± 0.06 h21.27 ± 2.09 ij28.43 ± 10.34 h
SMH200154.35 ± 28.40 h0.58 ± 0.05 fg19.98 ± 1.85 hi27.69 ± 7.76 h
SMH214152.77 ± 37.99 h0.59 ± 0.06 g19.82 ± 1.97 gh28.89 ± 9.97 h
a,…,j—superscript letters denote significant differences between the examined properties at p < 0.05.
Table 4. Correlation coefficients denoting the strength of linear relationships between friabilin content and other properties of wheat grain.
PropertyCorrelation with Friabilin Content
Moisture0.368
Crude protein0.109
Total ash−0.083
Vitreousness−0.492
Hardness index, HI−0.600
Length−0.621
Width−0.153
Thickness−0.584
Mass−0.552
Aspect ratio0.436
Sphericity0.445
Rupture force−0.592
Longitudinal strain−0.435
Relative strain−0.213
Rupture energy−0.552
Values in bold denote significant correlations at 0.05. Critical value of the correlation coefficient—0.468. Sample size n = 18.
Disclaimer/Publisher’s Note: The statements, opinions and data contained in all publications are solely those of the individual author(s) and contributor(s) and not of MDPI and/or the editor(s). MDPI and/or the editor(s) disclaim responsibility for any injury to people or property resulting from any ideas, methods, instructions or products referred to in the content.

