

Experimental Investigation of a Pulsation Reactor via Optical Methods
by
 , , ,
, , ,
Chunliang Zhang
1,2,*,
Jakub Dostál
1,3,
Stefan Heidinger
1,3,
Stefan Günther
2 and
Stefan Odenbach
2 1
Boysen-TU Dresden-Research Training Group, Technische Universität Dresden, Chemnitzer Straße 48b, 01062 Dresden, Germany
2
Chair of Magnetofluiddynamics, Measuring and Automation Technology, Institute of Mechatronic Engineering, Technische Universität Dresden, George-Bähr-Straße 3, 01069 Dresden, Germany
3
Chair of Energy Process Engineering, Institute of Process Engineering and Environmental Technology, Technische Universität Dresden, George-Bähr-Straße 3b, 01069 Dresden, Germany
*
Author to whom correspondence should be addressed.
Processes 2024, 12(2), 385; https://doi.org/10.3390/pr12020385
Submission received: 19 January 2024
/
Revised: 7 February 2024
/
Accepted: 9 February 2024
/
Published: 15 February 2024
(This article belongs to the Special Issue Green Chemistry: Microwave Synthesis, Latest Approaches towards Sustainable Processes)
Abstract
:Material treatment in pulsation reactors (PRs) offers the potential to synthesize powdery products with desirable properties, such as nano-sized particles and high specific surface areas, on an industrial scale. These exceptional material characteristics arise from specific process parameters within PRs, characterized by the periodically varying conditions and the resulting enhanced heat and mass transfer between the medium and the particulate material. Understanding flame behavior and the re-ignition mechanism is crucial to controlling the efficiency and stability of the pulse combustion process. In order to accomplish this objective, an investigation was conducted into flame behavior within the combustion chamber of a Helmholtz-type pulsation reactor. The study was focused on primarily analyzing the flame propagation process and examining flame velocity throughout the operational cycle of the reactor. Two optical methods—natural flame luminosity (NFL) and particle image velocimetry (PIV)—were applied in related experiments. An analysis of the NFL measurement data revealed a correlation between the intensity of light emitted by the pulsed flame and the air-fuel equivalence ratio (range from 0.89 to 2.08 in this study). It is observed that a lower air-fuel equivalence ratio leads to higher flame luminosity in the PR. In addition, in order to study the parameters related to system stability and energy transfer efficiency, this study also focuses on the local velocity field measurement method and an example of a fluid flow result in a combustion chamber by using a phase-locked PIV measurement system upgraded from a classic PIV system. The presented results herein contribute to the characterization of flame propagation within a pulsation reactor, as well as in pulsatile flows over one working cycle in a broader context, with flow velocity in the center of the combustion chamber ranging from 1.5 m/s to 5 m/s. Furthermore, this study offers insights into the applicable experimental methodologies for investigating the intricate interplay between flames and flows within combustion processes.
1. Introduction
The efficient production of novel materials holds significant application potential across various industrial sectors, with pulsation reactor technology emerging as a viable approach for material synthesis. Since the early 2000s, pulsation reactors have been used to produce powders in industrial applications [1]. The purpose of this study is to optimize the combustion process to acquire the most favorable characteristics of catalysts (potential catalysts, for example, LaMnO3, CuMn2O4, and CeO2).
The Helmholtz pulsation reactor working principle is introduced in Section 1.1. The theory of pulsating combustion, as well as the PR operation cycle, together with the potential re-ignition mechanisms, are addressed in Section 1.2. The scope of this work is described in Section 1.3, and the investigated characteristics are introduced in Section 1.4. These are followed by a description of the applied experimental methods in Section 2. Here, image acquisition via a high-speed camera is described in detail in Section 2.1, and the PIV method is described in Section 2.2. The investigated operation points of PR are introduced in Section 2.3. Afterward, the results are presented and discussed in Section 3, nd the conclusions and outlook are presented in Section 4.
1.1. Pulsation Reactors for Material Treatment
A typical laboratory pulsation reactor, as displayed in Figure 1, is an apparatus in which a mixture of air and natural gas is repeatedly ignited in the combustion chamber. This affects the hot gas pressure wave that develops in the adjacent tailpipe (TP); for this reason, it is occasionally referred to as the resonance tube. At the beginning of the TP, material for treatment will be injected into the pulsating hot gas stream and separated from the stream at the end of the TP. The particular process conditions in the TP allow for a variety of continuous material treatment applications, e.g., drying, calcination, and annealing [2,3]. However, PRs are primarily recognized for the possibility of synthesizing ultra-fine powdery products with advantageous properties at an industrial scale [4,5,6]. For example, Heidinger et al. [7] describe the synthesis of zirconia and silica nanoparticles in the PR.
The remarkable product properties can be attributed to the process parameters in a PR, i.e., periodically varying pressure, flow velocity, etc., and the resulting enhanced and persistent heat and mass transfer [7,9,10]. The process conditions can be controlled by setting the operating parameters and choosing the geometry of the combustion chamber and the tailpipe in such a way that a certain resonance frequency naturally tends to develop. Figure 2 shows an overview of four levels of parameters and how they relate to the next level. The first level of operating parameters can be influenced or designed directly. The precursor materials and their proportions, along with the type of carrier liquid, are determined by the desired product composition. In Figure 2, these are represented by the category called Material. The frequency of the present pressure wave depends (besides temperature, [11] determining the speed of sound in the particular medium) on the geometry of the combustion chamber and the tailpipe [8]. Together, they form the Helmholtz resonator system, which is described in more detail in Section 1.2. The flow of fuel and air directly affects the pressure and velocity distribution in the resonance tube. The heat generated during the combustion process affects the temperature distribution in the resonance tube. However, despite the decades-long application of pulsation reactor technology in industry [12], it is still far from fully developed or understood. Through a comprehensive analysis of flame behavior in the pulsation reactor, a profound comprehension of the underlying characteristics governing combustion phenomena can be acquired. It includes unsteady combustion phenomena, high flame temperature and velocity, flame pulse period, persistence and controllability, and combustion instability. Factors such as the position and shape of the flame and combustion efficiency cause temperature variations in the resonance tube. These parameters (depending on the process conditions) set the product properties, as they influence the occurring chemical reactions, the heat and mass transfer between the gas and product particles, and the particle residence time in the reactor. Therefore, understanding how the PR operation parameters relate to the process parameters is crucial in the pursuit of configurable and tailored product proprieties [13].
1.2. Pulsating Combustion and the Theory of Re-Ignition Background of the PR
In order to comprehend the generation of a pulsed flame, a fundamental understanding of the theory of pulsating combustion is essential. As stated in [14], for example, the general principle of pulsating combustion is similar to combustion-driven oscillations (CDOs). Moreover, the condition for self-excited pressure oscillations during combustion, originally formulated by Lord Rayleigh [15,16] and known as the Rayleigh criterion, applies to both processes [17]. While CDOs are undesirable, pulsating combustion can be perceived as a positive utilization of the effect. A pulsation reactor used for thermal material treatment represents such an application.
In general, three groups of pulsation reactors are distinguished: the Schmidt-, Rijke-, and Helmholtz-type pulsation reactors. For thermal material treatment, however, the Helmholtz-type pulsation reactor is almost exclusively used. It acts in a way similar to the acoustic Helmholtz resonator [18,19,20], the resonant frequency of which is determined as [21,22,23].
where is the cavity (combustion chamber, in the case of a PR) volume, and and are the cross-sectional area and length of the neck (tailpipe, in the case of a PR), respectively. A Helmholtz-type pulsation reactor usually consists of inlet valves, a combustion chamber, and a tailpipe (see Figure 1). While its design is rather simple, the operation is more complex, as various thermodynamic, fluid-dynamic, and acoustic effects are involved [24,25,26]. An illustration of a PR operation cycle is displayed in Figure 3. The individual stages are as follows:
- Ignition and combustion (A→B): The combustible mixture (air and a gaseous fuel) is injected into the combustion chamber where it is ignited. The spark plug, which is usually used for the initial ignition, or the glow igniter, as in the case of the present pulsation reactor, is switched off once self-excited periodic combustion develops.
- Expansion (B→C): Both the temperature and pressure increase as a consequence of the combustion process. The combustion products are pushed out of the combustion chamber through the exhaust pipe, resulting in the pressure in the combustion chamber decreasing.
- Intake (C→D): When the combustion chamber drops below the ambient value, the fresh mixture is sucked in.
- Compression (D→A): The negative gauge pressure in the combustion chamber results in a portion of the hot flue gas traveling back from the tailpipe into the combustion chamber again. It compresses and heats up the fresh mixture, which is re-ignited, and the cycle repeats.
The study of re-ignition mechanisms shall contribute to understanding the phenomenon of transient interruptions and re-ignition in the combustion process, thus improving the stability of the combustion system. By understanding the re-ignition mechanism, combustion chambers and fuel mixing and supply systems can be designed and optimized to ensure the continuity and stability of the combustion process. In addition, it can help improve the efficiency of fuel utilization and reduce energy losses, thus increasing energy use efficiency.
Many previous investigations [14,24,25,27] state that the fresh mixture is ignited as a consequence of mixing with the portion of the hot flue gas back from the tailpipe into the combustion chamber. The research by Zhonghua [24], for example, suggests that (a combination of) three other factors might be responsible for the re-ignition:
- hot gas remnants near the inlet;
- the high temperature of the combustion chamber walls;
- the unburned mixture that can sustain the flame until the beginning of the next cycle.
However, the question of the re-ignition mechanisms remains open until this point. Thus, one of the aims of the present work is to identify the presence of an unburned mixture from the previous cycle during a working cycle. Comparing the conditions of glow ignition and no glow ignition is relevant to the study, as it relates to the operational safety of the flame. Glow ignition is when the fuel in the combustion chamber ignites without the intent to ignite, which is a pre-ignition method of the combustion chamber, allowing for ignition at relatively low pre-ignition temperatures and pressures. The utilization of this approach reduces the risks associated with ignition, thereby providing a protective mechanism for the equipment [28,29,30].
1.3. Scope of the Investigations
The efficiency of energy transfer within a flame directly impacts the overall efficiency of energy utilization during the combustion process. By specifically investigating and optimizing flame energy transfer, it is possible to enhance the thermal efficiency of the combustion system while simultaneously reducing energy consumption and emission generation. The energy transfer efficiency of pulsed flames is influenced by various factors, such as the air-fuel ratio, fuel properties, combustion chamber design, ignition mechanism, combustion process instability, and combustion conditions (temperature, pressure, fluid flow, etc.) [30,31]. The instability of pulsed combustion is related to the state of the flame, such as turbulent flames. Here, the flame front dynamics model is helpful to explore such instability [32]. In 1979, Marble and Candel [33] first presented a flame front dynamics model in which flame velocity and flow velocity are related to instability as two important parameters.
Menon and Jou (1991) [34] integrated a large eddy simulation (LES) of the flow with a depiction of the flame front dynamics through a kinematic equation involving a progress variable, G. The definition of the progress variable, G, and its compliance with a conservation equation of a particular form were addressed:
In this equation, v represents the fluid velocity, with G taking the value of 1 in the fresh mixture and 0 in the combustion products. denotes the local turbulent flame speed, which is contingent upon the sub-grid-scale turbulence intensity, , and the laminar flame speed, . The heat release within the flame is characterized by expressing the specific enthalpy in relation to the progress variable G:
While existing model-based investigations on unsteady flames have been conducted, experimental research in this domain remains nascent. Given the progress in measurement technologies, particularly the advancements in high-speed cameras, there exists a prospect for quantifying and visualizing high-frequency pulse flames, thereby enhancing our comprehension of flame dynamics and combustion stability in pulse burners. This study is driven by the primary objective of fulfilling this purpose. This study aims to explore several main aspects:
- -
- Identify how flame behavior relates to the various stages of the combustion cycle, visualizing the turbulence present in the flame.
- -
- Investigate the impact of air-fuel equivalence ratio and power density input on the flame, encompassing parameters such as flame luminosity and flame velocity. In the context of natural gas combustion, the luminosity of the flame can be used as an indicator of the radiative heat transfer, with higher luminous radiation levels correlating to increased flame temperature, and is consequent in the thermal efficiency of the combustion process [35].
- -
- A higher pulsed flame velocity signifies an increased propagation speed, resulting in a more rapid energy release into the surrounding environment, potentially leading to a higher energy transfer rate. Therefore, in this study, the estimated speed of flame propagation within a given system needs to be clarified. Additionally, the study examines the stability of the combustion process by analyzing velocity variation.
- -
- In addition, a couple of further characteristics of the process, e.g., the temporal development of the flow velocity distribution during a cycle, have been investigated and will be discussed in the results section.
The measurement of flame propagation serves as a valuable tool for identifying regions within the combustion system where incomplete combustion or inefficient fuel-air mixing occurs. Additionally, flame propagation significantly impacts the stability and controllability of the combustion process. By accurately measuring the propagation of flames, it becomes possible to identify potential sources of instability or oscillations within the combustion system. This information allows for the adjustment of operating parameters to maintain a stable and controlled combustion process. The flame in the combustion chamber emits visible light, serving as an indication of the different phases of the periodic working process and re-ignition mechanism. Among all the optical measurement techniques, natural flame luminosity (NFL) imaging is one of the simplest approaches to visualizing the combustion processes [36,37]. The NFL method has a wide range of applications in flame measurement; for example, Wang et al. [38] applied it to the measurement of diesel spray flame. Due to the pulsed flames being nonsteady, high-frequency flames, a high-speed camera needs to be used to obtain comprehensive flame characteristic information.
Keller et al. previously measured the flow velocity inside a PR combustion chamber using the Schlieren flow visualization and laser Doppler velocimeter (LDV) methods [39]. However, compared to the LDV technique, the particle image velocimetry (PIV) method is a non-intrusive measurement technique that can be used without disturbing the fluid flow to a greater extent [40], which is a new application in the study of PRs. Based on the high-frequency working conditions of the PR, this study adopted phase-locked PIV technology (described in the experimental method section).
1.4. Investigated PR Characteristics Related to This Study
The focus of this work is the effect of fuel and air supply. In this case, however, the flow field and the behavior of the flame are investigated. The parameters used for the quantification of fuel and air supply are the air-fuel equivalence ratio, , and the power density input, .
The power density input is meant to determine the mass flow rate of fuel entering the PR. It is introduced as the power input divided by the combustion chamber volume:
where the power input is determined by the amount of fuel and its heating value. Specifically, it is calculated as a product of the mass flow rate and (lower) heating value of each combustible component, and , respectively, summed over all combustible components contained in the fuel, . This might further be expressed in terms of the total fuel mass flow rate, , as
where represents the mass fractions of the combustible components contained in the fuel. Provided that the fuel composition is known, its mass flow rate is determined by applying relation (4) to (5) as
With the fuel mass flow rate given by relation (6), the air-fuel equivalence ratio, , determines the mass flow rate of air entering the system. The air-fuel equivalence ratio represents the ratio between the actual and the stoichiometric air-fuel (mass) ratio, i.e.,
The air mass flow rate is then easily expressed from (7) as
where, at this point, the only unknown is the stoichiometric air-fuel ratio, . This is the ideal (theoretical) mass of air needed for the complete combustion of the fuel, divided by the mass of the fuel. The stoichiometric air-fuel ratio is fully determined by the fuel (and air) composition, i.e., by the mass fractions of oxygen, the individual combustible components, and the reactions describing their combustion. On the assumption that the fuel does not contain any oxygen, and, on the other hand, there is no combustible component included in the air either, is obtained as
In this equation, represents the mass fraction of oxygen in air, and stand for the molar mass of oxygen and of the individual combustible components, respectively. Finally, and are the stoichiometric coefficients corresponding to oxygen and the particular combustible component in the reaction describing its combustion, respectively.
2. Experimental Method
2.1. Flame Imaging via a High-Speed Camera
Combustion, especially the mechanisms of the re-ignition process, was investigated via flame observations in the combustion chamber. Thus, it is necessary to conduct comprehensive and complete time-resolved imaging to monitor the flame in order to fully understand its behavior. For such a purpose, a high-speed camera FASTCAM Mini AX50 (Photron, San Diego, CA, USA) [41] with a frame rate of 2000 fps with a resolution of 1024 × 1024 pixels was used (Figure 4). The predominant chemical constituents of both gas and air present in this PR include nitrogen (), oxygen (), carbon dioxide (), carbon monoxide (CO), and hydrocarbon molecules, such as methane () and ethylene (H4), as well as water vapor (O). Thus, numerous self-excited species are produced through chemical reactions within the flame, such as (513 nm to 516.5 nm), (430 nm to 431.5 nm), (340 nm to 650 nm), and (306.5 nm to 310 nm) [35,37,42,43]. The majority of the self-exciting species present in the combustion chamber exhibit photon emission, falling within the range of detectability by camera sensors, thereby establishing flame imaging as a feasible technique for the observation and analysis of flame dynamics. Consequently, the imaging technique utilizing the camera sensor enables a comprehensive study of flame luminosity and propagation, with the wavelength range for the camera sensor’s detection specified as 400 nm to 700 nm. The grayscale value within the 0–255 range is able to serve as an indicator for the luminosity of a grayscale image [44]. The illuminance can be used to draw conclusions about chemical combustion reactions, which also allows for statements to be made about energy efficiency. However, the illuminance cannot be measured directly with the camera used, but according to the manufacturer’s specification, the relationship between the gray value and illuminance is linear over the entire measuring range. Thus, quantitative evaluations are possible due to this proportionality.
Keeping in mind the expected PR frequency of 40 Hz to 50 Hz [7], 30–50 consecutive image frames were recorded per each pulse period. The frequency of the phenomenon is primarily dictated by several factors: (1) the dimensions and structural characteristics of the cavity, (2) the inherent physical properties of the gaseous medium, (3) the oscillation frequency emitted by the driving force source, and (4) the manner in which the reactor interfaces with the surrounding external environment.
The position of the camera is fixed at a distance of 500 in front of the combustion chamber, which balances the influence of the noise of the high temperature around the combustion chamber on the performance of the camera and the imaging ability of the camera to capture the complete flame. The focus adjustment and exposure settings are determined based on the distance within the combustion chamber and the specific area of interest to ensure optimal visibility of crucial flame details. The wall temperature of the combustion chamber is between 100 °C and 200 °C. The measuring setup is shown in Figure 4.
2.2. Particle Image Velocimetry (PIV) for Flow Velocity Measurements
PIV is an optical visualization technique that allows for the instantaneous measurement of the velocity field of a fluid flow, and, among other applications, it allows for the characterization of the vorticity of the flow. This technique is non-intrusive and avoids disturbing the velocity distribution of the flow compared to other traditional intrusive measurement techniques, such as hot wire or hot film anemometry [40,45]. The working principle of the PIV technique is based on measuring the displacement of tracing particles that follow the flow between two consecutive camera images; the flow area being measured is illuminated by a continuous or pulsed laser. This experiment used a pulsed laser because it is able to emit higher laser energy in a very short time, which is beneficial for measuring faster flows. A camera captures pairs of images, depicting the positions of these particles at distinct time instances, with synchronization achieved between the image pairs and the laser pulses at a specific time interval, . Following this, digital image processing techniques, such as the cross-correlation method, are employed to ascertain the velocity vector field in this case [40].
As important components of the PIV system, a FlowSense EO Camera (Maximum resolution 2048 × 2048 pixels, CCD sensor, Dantec Dynamics, Skovlunde, Denmark) and a DualPower Pulsed Laser (Dantec Dynamics, Denmark) producing green light with a wavelength of 532 with a pulse-frequency of 10 were used for measurement (Figure 5). particles with a diameter of 0.5–2 are used as tracing particles, seeded by a SAG410 particle generator (Topas, Dresden, Germany). Considering the experimental conditions, flow characteristics, and required spatial and temporal resolution, particles with a diameter of approximately 1 were found to be the most fitting, whereas particles that are too small may be difficult to identify in the images and particles that are too large cannot follow the flow well.
However, the frequency of the PR ranges from 40 Hz to 50 Hz [7] (obtained from the measured pressure signal by using the FFT method), while the DualPower laser and CCD camera only have a maximum frequency of 10 Hz. According to the Nyquist theorem, the sampling frequency during measurement should be at least two times the highest frequency of the signal [46]; the direct measurement of such high-frequency PRs using these components is not sufficient. In order to solve this problem, a new application of phase-locked PIV represents a viable solution. An advanced PIV system suitable for measurements of unsteady flows was designed.
The concept of phase-locked PIV is depicted in Figure 6. During image acquisition, a second measurement signal, the pressure signal, is synchronously recorded with a sufficiently high sampling frequency (10 kHz). This dataset enables the correlation of the acquired images with their corresponding positions within the pulsation cycle. In the phase-locked PIV system, a highly sensitive microphone Model 377B26 (PCB PIEZOTRONICS, Depew, NY, USA) with a 160 mm probe tip designed for operating temperatures ranging from −40 °C to 800 °C was utilized.
The synchronization of the camera shutter with periodic motion facilitates the acquisition of image pairs at distinct phase points. Subsequently, during image processing, the image pairs are gathered at the same phase point within each cycle ( and , and , and and in Figure 6; ultimately, there are enough phases to describe the flow velocity change within a working cycle. This process enables the precise determination of the velocity and direction of the tracing particles. Particle velocity is obtained by measuring the displacement of the particle, which occurs over a time interval (10 s). This calculation involves the utilization of DynamicStudio software (Dantec Dynamics, Denmark) to compute a cross-correlation in the sampling frequency space. The position of each phase in the cycle is determined by the delay time, which is the time of the measuring point from the trigger point.
For the acquisition of phase-locked PIV measurement results, one can first identify the number of phases within a single working cycle of the PR, as indicated by the pressure monitor for characterization. In this experiment, 11 phases were selected for a complete description of the flow velocity within the cycles. The PIV algorithm in the software computes the velocity field from 10 to 15 images per phase and determines the optimal solution by averaging this. In this experiment, it is divided into interrogation windows of 16 × 16 pixels for the cross-correlation calculation.
The phase-locked PIV measurement area is the field of view of the camera (Figure 7). In order to reduce the impact of the reflection of the measured glass pipe on the PIV results, the first consideration is adding appropriate filters to the camera before the experiment, including adding a green light filter to the camera lens, meaning only green light can pass through the filter and be captured by the camera. On the other hand, a polarization filter is added to reduce reflection. Reflection can also be reduced to a certain extent by adjusting the incident angle of the laser sheet during the experiment. In this experiment, the incident angle was adjusted to degrees to the greatest extent to reduce light reflection, and the deviation was within . In the image post-processing, the method of calculating the mean gray value of the image is adopted. As shown in Figure 7, there are reflections of different intensities in the yellow box areas in the original image Figure 7a. The calculated mean gray value pair of 1000 image pairs is displayed in Figure 7b. Subsequently, the mean image pair was subtracted from the gray value of the selected image pair for cross-correlation calculation to obtain the image in Figure 7c. Finally, the particle velocity vectors of selected image pairs was calculated, as seen in Figure 7d.
The average velocity of the interrogation windows in the x-direction and y-direction was calculated; thus, the average streamwise velocity, , was combined with the transverse velocity, , distribution. The length-based velocity distribution (), which is more dependent on the velocity component , can be obtained.
The methods used in the measurement system designed in this investigation can also be transferred to PRs of other dimensions. In specific operations, it is necessary to measure the diameter of the combustion chamber, the working frequency, the environmental temperature, and the humidity caused by the PR (to be tested) determine the measurement distance of the high-speed camera, and the internal flow temperature determines the selection of the pressure sensor (different pressure sensors can withstand different temperature ranges).
2.3. The Operation Points and Image Processing of the Flame Measurement
As introduced earlier, the present experiment also aims to investigate the effects of and on the flame. Therefore, this experiment measured 40 operation points (OPs), and the value of ranged from a minimum of 0.76 to a maximum of 2.08. However, this study selected five typical OPs of glow ignition and one OP of nonglow ignition for detailed analysis and discussion. Three operation points under different (OP1, OP2, and OP3) and three operating points under different (OP3, OP4, and OP5) were used (see Table 1). While in most cases the glow igniter was used, the PR operated without any glow ignition at OP6. In addition, in order to observe and analyze the flame under stable pulsation conditions, all of the selected operating points are subject to such conditions, which are presented by Dostál et al. [8]. Each operating point corresponds to a time duration of 1–2 s. As a result, approximately 55 cycles of image data were obtained for each operating point. In these cycles, 10 cycles with superior imaging quality were chosen for detailed analysis of flame behavior.
The process of re-ignition in PRs can be confirmed and visualized in imaging studies of flames; therefore, it is necessary in this study to detect the stage changes of the flame in the image series.
In the investigation of flame image cycles, it is a crucial preliminary task to identify the starting point of each cycle. As the flame primarily originates from the vicinity of the igniter, examining the periodic fluctuations in greyscale values in the area surrounding the igniter was found to be a suitable method. As shown in Figure 8, region A is selected as the analysis region for greyscale values close to the ignitor.
The starting point of the flame development cycle is determined by selecting the position within each cycle that corresponds to the minimum gray value. Due to various external influences, such as slight variations in temperature and pressure within the combustion chamber, the flame distribution is not replicated precisely in each cycle. Nonetheless, it is evident that the four stages of combustion exhibit a consistent pattern of recurrence, which will be shown in the results section.
The uncertainty study of this experiment, which consists of three parts, should also be taken into account. The first part is the uncertainty of the PR operation, which is shown in the control of the air and fuel inlets. There are two flowmeters at the air inlet and the gas inlet. The experimental operating conditions for airflow rate and gas flow rate are adjusted according to the value displayed on the flowmeters with an uncertainty range of less than 5%. The second part is ability of tracing particles to follow in the PIV system. This study used multiple sets of pre-tests before the experiment to determine the size and material of the particles that have a good following ability and can be clearly imaged under the camera in the PIV system, with an error of approximately 2%. The third part is the accuracy of the measurement equipment. The sensors used in this study have high precision, but the resolution and frame rate selection of the high-speed camera, the brightness of the measurement environment, and the interference of the flame light in the combustion chamber on the camera imaging are all important. The optimal measurement conditions were selected, and the overall uncertainty of measurement equipment was controlled within 2% through pre-tests. It is difficult to make a global quantitative statement about how great the overall uncertainty resulting from these influences is. Validation measurements are, therefore, planned for further investigations. However, it can be estimated that this overall uncertainty is in the lower single-digit percentage range.
3. Results and Discussion
3.1. Flame Behavior
Within the confines of a controlled chamber housing a pre-arranged mixture of fuel and oxidizer, flame propagation ensues, subsequent to the initiation of ignition, through the transfer of thermal energy from the combustion region to the yet unreacted mixture in the PR, thereby augmenting the flow temperature and facilitating the expansion of the flame throughout [30]. The study’s results on the example of this laboratory’s PR reveal the correlation between the flame cycle and the four stages observed in the theoretical working cycle of the PR (see Figure 1). Furthermore, the investigation examines the influence of power input density on flame characteristics, as well as the effects of the air-fuel equivalence ratio on flame dynamics, specifically exploring the relationship between these parameters and flame luminosity and velocity.
3.1.1. Flame Propagation
Assigning pseudo colors to each gray level (represented by RGB colors ranging from 0 to 255) in the monochrome image can help highlight differences in gray-level values when describing the brightness of the flame.
During the working cycle, the ignition process generates a flame at the igniter, which then spreads outward (depicted in Figure 3A,B: Ignition and Combustion), eventually reaching the glass wall and bottom of the combustion chamber before extending upwards. The flame gradually intensifies and concentrates toward the center of the combustion chamber (B,C: Expansion). As the flame approaches the tailpipe, the brightness decreases, and the flame near the igniter also diminishes (C,D: Intake). The flame reaches its minimum area when the reaction in the combustion chamber is complete but does not completely extinguish (D–A: Compression) (Figure 9). Throughout the working cycle, a flame is present in the combustion chamber, with a small amount of the flame remaining before the start of the next cycle (Figure 10). The propagation details are shown in Figure 11 and Figure 12. From this process, it can be found that the flame expands in different directions of the combustion chamber during the working cycle rather than directly extending to the TP, which may indicate the uneven temperature distribution and uneven gas mixing in the combustion chamber.
As observed in Figure 10, in the process of re-igniting the flame, the subsequent flame cycle commences while the flame of the previous cycle is still present but not entirely extinguished (referred to as point k, where the light intensity of the flame has not reached the lowest value in the cycle). This observation serves as evidence that the flame within the combustion chamber persists throughout the stable pulse combustion, thereby validating the continuous nature of the combustion process.
Since it is difficult to directly observe the approximate area and local distribution of the flame in the pseudo-color image (Figure 9), the temporal variations in flame intensity were delineated by selecting seven specific areas (Area1 to Area7 in Figure 9a). The intensities in different areas are shown in Figure 11 and Figure 12).
The flame spreads upwards from the moment of ignition and then expands across the entire combustion chamber until it fills the bottom of the combustion chamber (Figure 11), finally moving to the tailpipe (from Area5 to Area6, then from Area6 to Area7) until a cycle of combustion is basically completed (Figure 12). Figure 12a does not show obvious periodicity. This is given by the fact that the pressure and temperature distribution in different areas of the combustion chamber are different in each cycle, and the flame position and luminosity will not be completely repeatable. In the Intake stage, Area7 (the area close to the tailpipe inlet) shows an obvious increase in flame intensity, which may caused by the fluid inertia from the Expansion to the Intake stage.
In order to describe the flame propagation process in detail and to detect turbulence, this study uses the calculation method of cross-correlation to carry out image processing of the flame. For each time point from a to k in Figure 10, the displacement of the flame is calculated by two consecutive frames. The intensity of turbulence can be expressed using vorticity calculations.
Figure 13 expresses the distribution of flame velocity and vorticity when Time/Cycle is .
Figure 14 illustrates the presence of turbulence and a higher increase in flame turbulence during the progression of Expansion and Intake. This phenomenon can be attributed to pronounced variations in pressure and temperature, spanning from the initial Ignition to the completion of Expansion, which instigates the rapid filling of unburned gas into the different areas of the combustion chamber. Consequently, the flame rapidly propagates in divergent directions. In particular, in the vicinity of the chamber wall and the chamber’s bottom, affected by the shape of the combustion chamber, the flow exhibits reduced stability, thus leading to greater instability in flame propagation (also shown in Figure 9). The flame turbulence intensity reaches the maximum when Time/Cycle is approximately .
Upon comparing the grayscale values of the flame images acquired at OP1, OP2, and OP3 for identical values at 2.08, it was determined that alterations in did not result in substantial changes in flame luminosity, or the change is not obvious. As is visible in Figure 15, OP4 and OP5 represent values equivalent to OP3, with different values of , decreasing from OP3 to OP5. Pseudo-color images of the flame cycles for OP4 and OP5 are also presented in Figure 16.
It can be observed in Figure 16 that OP5 shows a noticeable and substantial increase in flame luminosity. Notably, it attains near-maximum luminosity levels throughout the duration of a stable pulse combustion process.
The flame luminosity is strongly influenced by , with higher flame luminosity in the case of a rich mixture (OP5, ) and lower flame luminosity in the case of a lean mixture (OP3 and OP4, ) [30]. Generally, as the air-fuel equivalence ratio becomes smaller, the flame luminosity increases. This phenomenon can be proved by the conclusions of this experiment (Figure 15).
At OP6, without the glow igniter, the mixture does not spontaneously ignite prematurely but, rather, is ignited after the temperature reaches the ignition point. Under the same air-fuel equivalence ratio and mixture flow rate (OP5 and OP6), nonglow ignition exhibits a delayed temperature reaching the combustion point and, consequently, delayed flame generation compared to glow ignition conditions where preheating is present. Therefore, as described in the introduction, the use of glow ignition serves for operational safety.
3.1.2. Flame Velocity
This experiment uses the method of measuring flame displacement in a short time to calculate the flame propagation speed. The center area of the flame (Area 2 in Figure 17) was selected for two reasons: (1) flame propagation initiates in the central region and expands outward, accompanied by significant heat release during combustion, and (2) the flam’s center generally exhibits greater stability compared to the flame edges, making it more representative of the main speed and direction of flame motion.
Theoretically, the flame velocity exhibits a nonlinear relationship with the parameter within the range of 0.76 to 2.08 [47] (the range of air-fuel equivalence ratio of stable pulsation investigated by Dostál et al. [8]). Based on the experimental data in Figure 17, the flame velocity will gradually increase when is low. However, some of the curves start to drop when reaches a number between 1 and 2 ( = 1467, 1834, 2200, 3301 kW/m3) due to excess air diluting the fuel under typical pulse combustion conditions or the temperature within the flame being reduced, thereby reducing combustion efficiency. In addition, flame velocity instability also depends on the location and size of the area being measured. Overall, as the power density input increases, flame velocity will show an upward trend, but there is a certain instability. Several factors could be considered to explain this phenomenon:
- -
- Combustion instability: In certain air-fuel equivalence ratio ranges, the combustion process may be affected by instabilities (aerodynamic effects, vortex motion, etc.), resulting in fluctuations in flame velocity;
- -
- Inhomogeneity of combustion mixing: In a pulsed flame system, there may be inhomogeneity in the mixing process of fuel and oxidant, resulting in spatial and temporal fluctuations in the combustion rate;
- -
- Changes in the propagation path: As the air-fuel ratio changes, the flame propagation path may change, which may be caused by turbulent flow, wall effects, etc.
When remains constant, an increase in power density input has a significant impact on flame velocity, resulting in an observable increase. Power density input is highly influential in determining the speed at which the flame propagates.
In comparison to scenarios with excessively low values of , achieving the full combustion of fuel under OP4 conditions minimizes the energy waste caused by unburned fuel. Conversely, if exceeds optimal levels, an abundance of residual oxygen may result, leading to flame elongation and the potential occurrence of a flame within the tailpipe. This phenomenon elevates temperatures within the tailpipe, thereby influencing the particulate matter state during the material preparation process. The presence of a tailpipe flame may compromise PR stability by perturbing gas flow dynamics, thereby engendering unstable operational parameters. In addition, it was observed that higher power density, which implies a higher total flow rate through the PR, leads to intensified turbulence and a higher pressure amplitude, which is expected to have a positive impact on the mixing as well. Therefore, in this study, the air-fuel equivalence ratio of OP4 close to 1.5 is a well-balanced choice for the combustion process.
Flame luminosity under different types of fuel leads to similar photometric trends with variations in light intensity and wavelength based on specific chemical reactions. In contrast, the flame velocity findings may not directly transfer to other fuel types due to differences in reaction kinetics, but the overall trend and periodic phase changes can still be compared and discussed across variations. The geometry of the combustion chamber and especially of the transition part between the combustion chamber and the tailpipe will play an important role regarding flame stability. A smooth transition between the combustion chamber and the tailpipe might be beneficial for flame stability, as the resistance for the flue gas to leave the combustion chamber would be smaller.
3.2. Phase-Locked PIV Measurement Result for the Flow in the PR
Since the velocity field distribution in the combustion chamber is very complex, it is not only related to the operating conditions of the combustion reaction gas and air flow rate but also to the shape (and volume) of the combustion chamber. Therefore, in order to investigate the velocity that the fluid flow may reach in the main combustion reaction zone (outer zone of complete combustion and middle zone of partial combustion), this experiment described the velocity field in the center of the combustion chamber under operating conditions (OP4, 35 × 21 ; 2D imaging; Figure 7), which is the typical stable pulse combustion for lean mixture conditions.
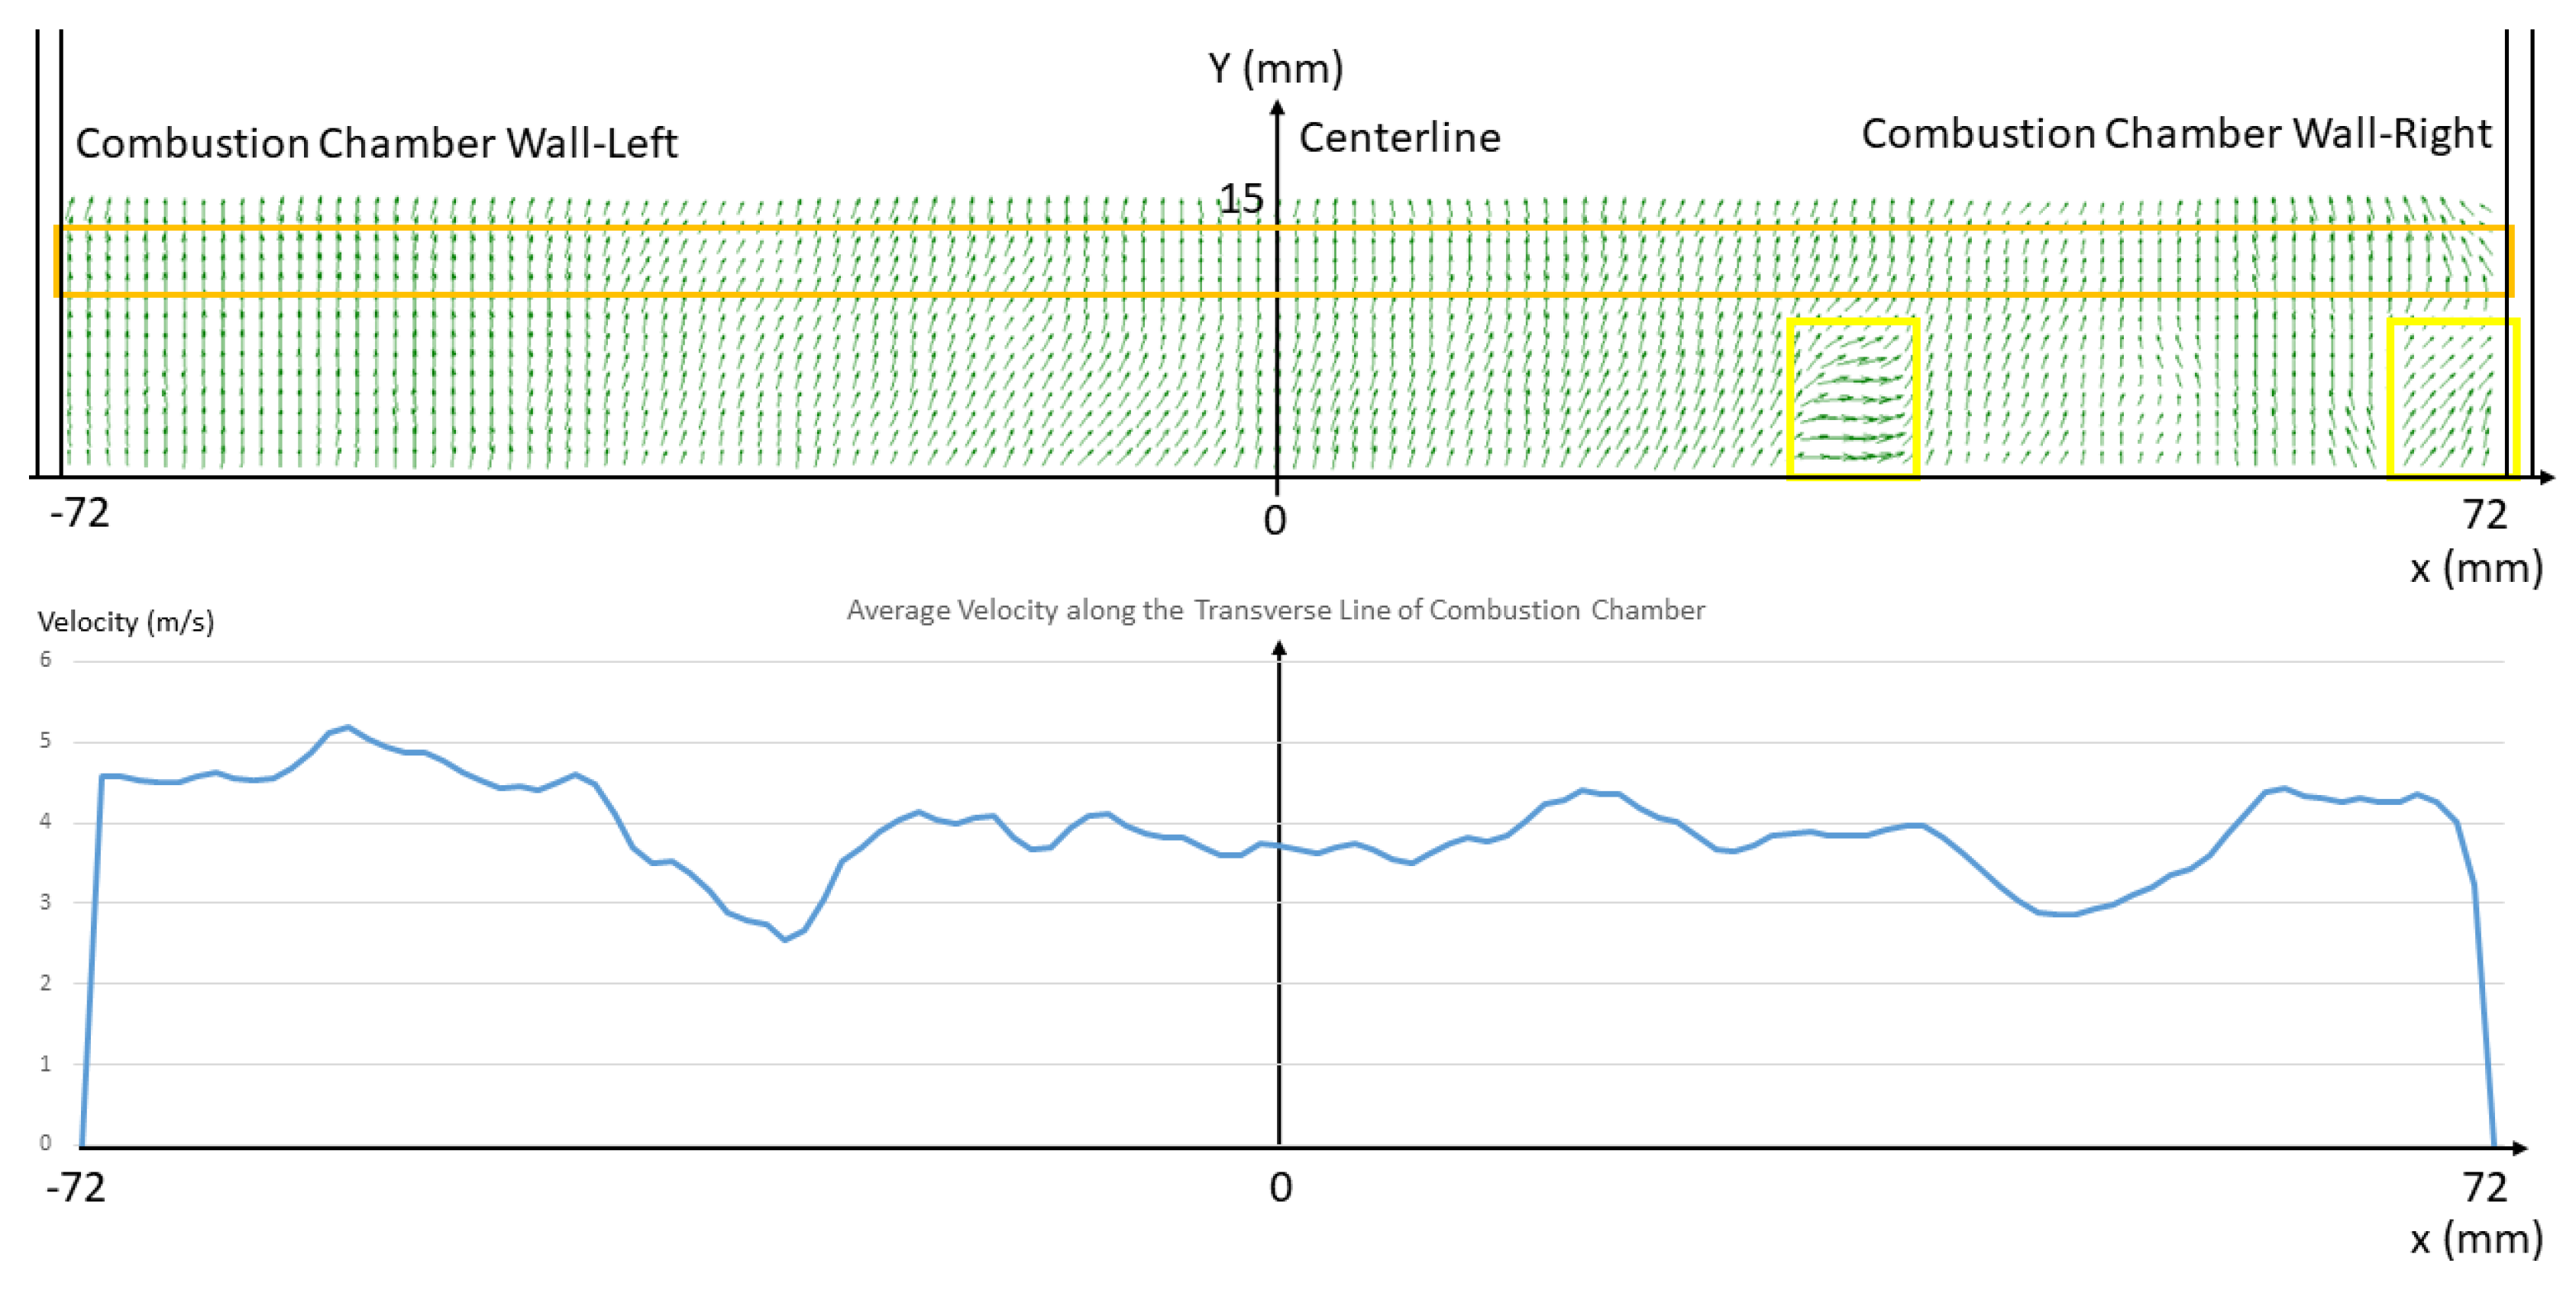
The velocity vector distributions of each phase were selected to describe the velocity field under the phase-locked PIV technique. By specifying the direction of movement towards the tailpipe as positive, the average velocity direction over each phase is positive, meaning that most of the fluid flow in the central region of the combustion chamber moves in the direction of entry into the tailpipe. The flow velocity near the wall will exhibit some non-uniformity due to wall friction, viscous effects, and possible boundary layer turbulence phenomena.
The theoretical calculations use a flow density from 0.40 kg/m3 to 0.55 kg/m3, a dynamic viscosity of 0.035 mPa · s to 0.045 mPa · s, a chamber diameter of m, and a maximum flow velocity of 10 m/s. The Reynolds number in the entire combustion chamber ranges from 2.5 k to 14 k. Laminar flow is more common in the middle part of the combustion chamber.
The mean velocity range of the different phases calculated for several images for each phase is 1.5 m/s to 5 m/s. The average mean velocity of component in one cycle first increases to the maximum value (phase 4 in Figure 20, phase 5, and phase 6) corresponding to the voltage signal of the pressure sensor, then decreases to the minimum value of about 2 m/s. The average mean velocity of component is −1 m/s to 1 m/s, with no significant variability in the different phases. The velocity in one cycle exhibits local inhomogeneity, which might be attributed to the uneven mixing of fuel and gas or instability in the combustion process, such as flame instability. It provides measurement methods and data for the fluid velocity parameters in the models in Section 1.3, which can offer supplementary data support that is conducive to the computation of energy transfer rates.
4. Conclusions and Outlook
In this study, optical measurement methods (high-speed camera imaging of the flame and PIV) were applied to the measurement of the flame and flow in a combustion chamber of a PR to investigate the basic characteristics and behavior of the flame, including flame behavior in the four stages of the PR working process, as well as flame velocity and flame luminosity. The main findings of this study include, on the one hand, the design of a measurement system for measuring the flame and flow in the combustion chamber and the possibility of generalizing the phase-locked PIV method to other PRs, especially with high-frequency burners. On the other hand, the measurement results include the influence of the air-fuel equivalence ratio on flame luminosity, the relationship between input power density and flame velocity, and the flow velocity range and change trend in the central area within a working cycle.
Experiments have proven that the air-fuel equivalence ratio , indeed, has a considerable impact on the luminosity of the flame. A value lower than 1 correlates with higher luminosity, indicating the presence of unburned fuel and lower combustion efficiency. When exceeds 1, it implies that there is an excess of air in the mixture, resulting in less unburned fuel.
The size of the power density input has no obvious effect on the flame luminosity. However, the flame velocity is influenced by the power density input, and a positive correlation exists between them. Specifically, under a fixed air-fuel equivalence ratio , an increase in power density input leads to a corresponding increase in flame velocity. Further experimental research is needed to explore the relationship more comprehensively. In theory, it can be supposed that power density input can impact the velocity of the flow within the flame.
The range of mean flow velocity in the flame area is 1.5 m/s to 5 m/s when . The velocity amplitude is about m/s and experiences changes as the pressure changes during a working cycle.
The pulse combustion processes under several operating conditions demonstrated in this study all proceed in the self-ignition mechanism formed after external ignition, which is continuously and well-imaged under a high-speed camera, proving that the re-ignition phenomenon is able to occur in the PR material production process. In consideration of Zhonghua’s three hypothetical reasons for the re-ignition [24], through infrared temperature measuring instruments, this study found that the gas inlet combustion chamber wall does have a higher temperature, around 650 K to 700 K, which may help to improve the re-ignition ability of the flame, as a high wall temperature increases the diffusion rate of the fuel and makes it easier for the fuel to mix with oxygen (Figure 4). Strong oscillations in the localized areas of the flame and the consistent presence of the flame during successive periods indicate the presence of unburned mixture, but this requires further investigation via the compositional chemistry analysis of the combustion reaction. In addition, further research is needed to investigate the influence of high-temperature hot gas near the inlet on flame re-ignition. This can be accomplished by installing a high-temperature-resistant thermocouple at the inlet to measure the temperature of both the inlet and the surrounding gas.
Further development in this study could involve temperature measurements within the flame by utilizing a temperature sensor capable of measuring temperatures up to 2000 °C, coupled with pressure measurements, to investigate the causes of the partial ignition of flames [30].
Theoretically, it can be assumed that an increase in flow velocity can increase the speed of flame propagation up to a certain point where further increases in velocity may have a diminishing effect or even a negative effect on flame propagation. This might be demonstrated through more comprehensive PIV measurements of the flow in the combustion chamber, allowing for further investigation of the relationship between flame propagation and the flow velocity field. The turbulence of the flow in the combustion chamber can also increase the mixing of gas and air, which can also be further studied by the vorticity calculated by the PIV measurement result.
Most PRs that are currently put into industrial production are composed of two parts: a combustion chamber and a tailpipe. The structure is similar to the laboratory-scale PR used in this experiment. While sharing common operating principles, differences arise primarily from differences in scale, the composition of the fuel, and the proportions of each component. Certain empirical findings, such as the correlation between the air-fuel equivalence ratio and flame luminosity, alongside the fluctuation patterns and tendencies of mean flow velocity throughout a working cycle, are transferable across PRs of diverse dimensions. Nonetheless, the distribution of flame turbulence intensity and the velocity magnitude in specific regions undergo alterations due to variations in PR geometry. This study’s objective lies in quantifying turbulence distribution and velocity profiles within extant reactor designs, thereby facilitating the exploration of geometrical configurations conducive to heightened operational efficiency and stability. In addition, both the combustion chamber and the tailpipe exhibit cylindrical geometry of a specific diameter devoid of any transitional elements, resulting in an abrupt alteration in the cross-sectional dimensions of the fluid at the interface, thereby inducing heightened turbulence. In order to address this issue and enhance fluid flow stability, it is proposed to modify the connection between the combustion chamber and the tailpipe by incorporating a sloped and arched design, including the bottom of the combustion chamber. Moreover, this modification could help mitigate fluid resistance and minimize turbulence losses within the combustion chamber.
Author Contributions
Experimental investigation and Image and Data Processing: C.Z.; Writing, editing, and review: C.Z., J.D., S.H., S.G. and S.O.; Supervision: S.G. and S.O. All authors have read and agreed to the published version of the manuscript.
Funding
The authors would like to thank the Boysen-TU Dresden-Research Training Group for the financial support that has made this publication possible. The Research Training Group is co-financed by TU Dresden and the Friedrich and Elisabeth Boysen Foundation. Grant number: BOY-135.
Data Availability Statement
Data are available from the corresponding author upon reasonable request.
Acknowledgments
This research is conducted as a joint project at Technische Universität Dresden with the Chair of Magnetofluiddynamics, Measuring and Automation Technology (S. Odenbach) and the Chair of Energy Process Engineering (M. Beckmann). We are also grateful to the Chair of Hydrogen and Nuclear Energy (A. Hurtado) for the support in experimental equipment.
Conflicts of Interest
The authors declare no conflict of interest.
References
- Leidolph, L.; Ambrosius, S. Method and Thermal Reactor for Creating Particles. EP1927394B1, 26 August 2009. [Google Scholar]
- Kudra, T. Pulse-Combustion Drying: Status and Potentials. Dry. Technol. 2008, 26, 1409–1420. [Google Scholar] [CrossRef]
- Fraenkel, S.; Nogueira, J.; Carvalho, J.; Costa, F. Heat transfer coefficients for drying in pulsating flows. Int. Commun. Heat Mass Transf. 1998, 25, 471–480. [Google Scholar] [CrossRef]
- Klaus, C.; Wegner, K.; Rammelt, T.; Ommer, M. New Challenges in Thermal Processing. Interceram Int. Ceram. Rev. 2021, 70, 22–25. [Google Scholar] [CrossRef]
- Hoffmann, C.; Ommer, M. Reaktoren für Fluid-Feststoff-Reaktionen: Pulsationsreaktoren; Springer Spektrum: Berlin/Heidelberg, Germany, 2019; pp. 1–19. [Google Scholar] [CrossRef]
- Begand, S. Herstellung Nanoskaliger Oxidpulver Durch Thermisch Gesteuerte Synthese in Einem Pulsationsreaktor. Ph.D. Thesis, Der Naturwissenschaftlich-Technischen Fakultät der Chemie, Pharmazie und Werkstoffwissenschaften der Universitat des Saarlandes, Saarbrücken, Germany, 2001. [Google Scholar]
- Heidinger, S.; Spranger, F.; Dostál, J.; Zhang, C.; Klaus, C. Material Treatment in the Pulsation Reactor—From Flame Spray Pyrolysis to Industrial Scale. Sustainability 2022, 14, 3232. [Google Scholar] [CrossRef]
- Dostál, J.; Heidinger, S.; Klaus, C.; Unz, S.; Beckmann, M. Effects of Fuel Input on Pulsation Reactor Behavior—An Experimental Study. Processes 2023, 11, 444. [Google Scholar] [CrossRef]
- Xu, W.; Jiang, G.; An, L.; Liu, Y. Numerical and experimental study of acoustically enhanced heat transfer from a single particle in flue gas. Combust. Sci. Technol. 2018, 190, 1158–1177. [Google Scholar] [CrossRef]
- Heidinger, S.; Unz, S.; Beckmann, M. Heat and Mass Transfer to Particles in One-Dimensional Oscillating Flows. Processes 2023, 11, 173. [Google Scholar] [CrossRef]
- Von Helmholtz, H. On the Sensations of Tone as a Physiological Basis for the Theory of Music. Nature 1875, 12, 449–452. [Google Scholar] [CrossRef]
- Dahm, B. Ein Beitrag zum Instationären Wärmeübergang auf Teilchen im Hinblick auf Eine Verfahrenstechnische Optimierung des Schmidtrohres. Ph.D. Thesis, Hochschule für Architektur und Bauwesen Weimar, Weimar, Germany, 1975. [Google Scholar]
- Klaus, C.; Wegner, K.; Ommer, M. Partikelsynthese im Pulsationsreaktor—Von der Idee zur Produktion. In Proceedings of the 30 Deutscher Flammentag, Hannover-Garbsen, Germany, 28–29 September 2021; pp. 582–590. [Google Scholar]
- Putnam, A.A.; Belles, F.E.; Kentfield, J.A.C. Pulse Combustion. Prog. Energy Combust. Sci. 1986, 12, 43–79. [Google Scholar] [CrossRef]
- Rayleigh, L.; Strutt, J.W. The Explanation of Certain Acoustical Phenomena. Nature 1878, 18, 319–321. [Google Scholar] [CrossRef]
- Rayleigh, L.; Strutt, J.W. The Theory of Sound; Cambridge University Press: Cambridge, UK, 2011. [Google Scholar] [CrossRef]
- Lieuwen, T.C.; Yang, V. Combustion Instabilities in Gas Turbine Engines: Operational Experience, Fundamental Mechanisms, and Modeling; American Institute of Aeronautics and Astronautics, Inc.: Reston, VA, USA, 2005. [Google Scholar] [CrossRef]
- Zinn, B.T. A Theoretical Study of Non-Linear damping by helmholtz resonators. J. Sound Vib. 1970, 13, 347–356. [Google Scholar] [CrossRef]
- Tang, P.K.; Sirignano, W.A. Theory of a Generalized Helmholtz Resonator. J. Sound Vib. 1973, 26, 247–262. [Google Scholar] [CrossRef]
- Ahrens, F.W.; Kartsounes, G.T. Pulse Combustion Technology for Heating Applications: Quarterly Progress Report April–June 1978; Argonne National Laboratory (ANL): Argonne, IL, USA, 1978. [Google Scholar]
- Panton, R.L.; Miller, J.M. Resonant Frequencies of Cylindrical Helmholtz Resonators. J. Acoust. Soc. Am. 1975, 57, 1533–1535. [Google Scholar] [CrossRef]
- Howe, M.S. On the Helmholtz Resonator. J. Sound Vib. 1976, 45, 427–440. [Google Scholar] [CrossRef]
- Großgebauer, S. Mathematische Modellierung und Experimentelle Untersuchung von Selbstständig Pulsierenden Brennern zur Stoffbehandlung. Ph.D. Thesis, Technische Universität Dresden, Dresden, Germany, 2008. [Google Scholar]
- Zhonghua, W. Mathematical Modeling of Pulse Combustion and its Applications to Innovative Thermal Drying Techniques. Ph.D. Thesis, National University of Singapore, Singapore, 2007. [Google Scholar]
- Meng, X.; de Jong, W.; Kudra, T. A State-of-the-Art Review of Pulse Combustion: Principles, Modeling, Applications and R&D Issues. Renew. Sustain. Energy Rev. 2016, 55, 73–114. [Google Scholar]
- Uemichi, A.; Kanetsuki, I.; Kaneko, S. (Eds.) Combustion Oscillation in Gas Turbine Combustor for Fuel Mixture of Hydrogen and Natural Gas. In Proceedings of the ASME 2017 Pressure Vessels and Piping Conference, Waikoloa, HI, USA, 16–20 July 2017. [Google Scholar] [CrossRef]
- Plavnik, G. (Ed.) Pulse Combustion Technology. In Proceedings of the 14th Annual North American Waste-to-Energy Conference, Tampa, FL, USA, 1–3 May 2006. [CrossRef]
- Raine, R.; Thorwarth, H. Performance and Combustion Characteristics of a Glow-Ignition Two-Stroke Engine; SAE Technical Papers; SAE International Headquarters: Warrendale, PA, USA, 2004. [Google Scholar] [CrossRef]
- Pan, K.; Wallace, J.S. Numerical studies of the ignition characteristics of a high-pressure gas jet in compression ignition engines with glow plug ignition assist: Part 2-Effects of multi-opening glow plug shields. Int. J. Engine Res. 2018, 19, 977–1001. [Google Scholar] [CrossRef]
- Mcallister, S.; Chen, J.Y.; Fernandez-Pello, A. Fundamentals of Combustion Processes; Springer: New York, NY, USA, 2011. [Google Scholar] [CrossRef]
- Glassman, I.; Yetter, R.A.; Glumac, N.G. (Eds.) Combustion, 5th ed.; Academic Press: Boston, MA, USA, 2015; pp. 655–680. [Google Scholar]
- Candel, S.; Huynh, C.; Poinsot, T. Some Modeling Methods of Combustion Instabilities. In Unsteady Combustion; Culick, F., Heitor, M.V., Whitelaw, J.H., Eds.; Springer: Dordrecht, The Netherlands, 1996; pp. 83–112. [Google Scholar] [CrossRef]
- Marble, F.E.; Candel, S.M. An analytical study of the non-steady behavior of large combustors. Symp. (Int.) Combust. 1979, 17, 761–769. [Google Scholar] [CrossRef]
- Menon, S.; Jou, W.H. Large-Eddy simulations of combustion instability in an axisymmetric Ramjet combustor. Combust. Sci. Technol. 1991, 75, 53–72. [Google Scholar] [CrossRef]
- Javadi, S.M.; Moghiman, M. Experimental Study of Natural Gas Temperature Effects on the Flame Luminosity and No Emission. Int. J. Spray Combust. Dyn. 2012, 4, 175–184. [Google Scholar] [CrossRef]
- Abu-Jrai, A.M.; Al-Muhtaseb, A.H.; Hasan, A.O. Combustion, performance, and selective catalytic reduction of NOx for a diesel engine operated with combined tri fuel (H2, CH4, and conventional diesel). Energy 2017, 119, 901–910. [Google Scholar] [CrossRef]
- Cheng, Q.; Ahmad, Z.; Kaario, O.; Vuorinen, V.; Larmi, M. Effect of Hydrogen Enhancement on Natural Flame Luminosity of Tri-Fuel Combustion in an Optical Engine. Energies 2022, 15, 9080. [Google Scholar] [CrossRef]
- Wang, Y.; Feng, L.; Geng, C.; Chen, B.; Liu, H.; Yao, M. Natural Flame Luminosity and Emission Spectra of Diesel Spray Flame under Oxygen-Enriched Condition in an Optical Constant Volume Vessel. In Proceedings of the SAE International Powertrains, Fuels and Lubricants Meeting, Heidelberg, Germany, 17–19 September 2018. [Google Scholar] [CrossRef]
- Keller, J.O.; Saito, K. Measu rements of the Combusting Flow in a Pulse Combustor. Combust. Sci. Technol. 1987, 53, 137–163. [Google Scholar] [CrossRef]
- Raffel, M.; Willert, C.; Scarano, F.; Kähler, C.J.; Wereley, S.T.; Kompenhans, J. Particle Image Velocimetry—A Practical Guide, 3rd ed.; Springer: Berlin/Heidelberg, Germany, 2018; Volume 1, pp. 1–669. [Google Scholar]
- Photron. Product Datasheet Mini AX FASTCAM Series by Photron; Photron USA, Inc.: San Diego, CA, USA, 2017. [Google Scholar]
- Gaydon, A. The Spectroscopy of Flames; Springer: Dordrecht, The Netherlands, 2012. [Google Scholar]
- Cheng, T.S.; Wu, C.Y.; Li, Y.H.; Chao, Y.C. Chemiluminescence measurements of local equivalence ratio in a partially premixed flame. Combust. Sci. Technol. 2006, 178, 1821–1841. [Google Scholar] [CrossRef]
- Xi, Z.; Fu, Z.; Sabir, S.W.; Hu, X.; Jiang, Y.; Zhang, T. Experimental Analysis on Flame Flickering of a Swirl Partially Premixed Combustion. Energies 2018, 11, 2430. [Google Scholar] [CrossRef]
- Hasse, L.; Dunckel, M. Hot Wire and Hot Film Anemometers. In Air-Sea Interaction: Instruments and Methods; Dobson, F., Hasse, L., Davis, R., Eds.; Springer: Boston, MA, USA, 1980; pp. 47–63. [Google Scholar] [CrossRef]
- Weik, M.H. Computer Science and Communications Dictionary; Kluwer Academic Publishers: Norwell, MA, USA, 2000. [Google Scholar]
- Benim, A.C.; Syed, K.J. Chapter 3—Properties of Hydrogen-Containing Fuels. In Flashback Mechanisms in Lean Premixed Gas Turbine Combustion; Benim, A.C., Syed, K.J., Eds.; Academic Press: Boston, MA, USA, 2015; pp. 19–24. [Google Scholar] [CrossRef]
Figure 1.
Illustration of a typical Helmholtz−type pulsation reactor used for thermal material treatment [4,8].

Figure 2.
Cascade of dependencies (from operating parameters to product properties) for material treatment in a pulsation reactor (this paper investigates the flame and flow in a combustion chamber).
Figure 2.
Cascade of dependencies (from operating parameters to product properties) for material treatment in a pulsation reactor (this paper investigates the flame and flow in a combustion chamber).
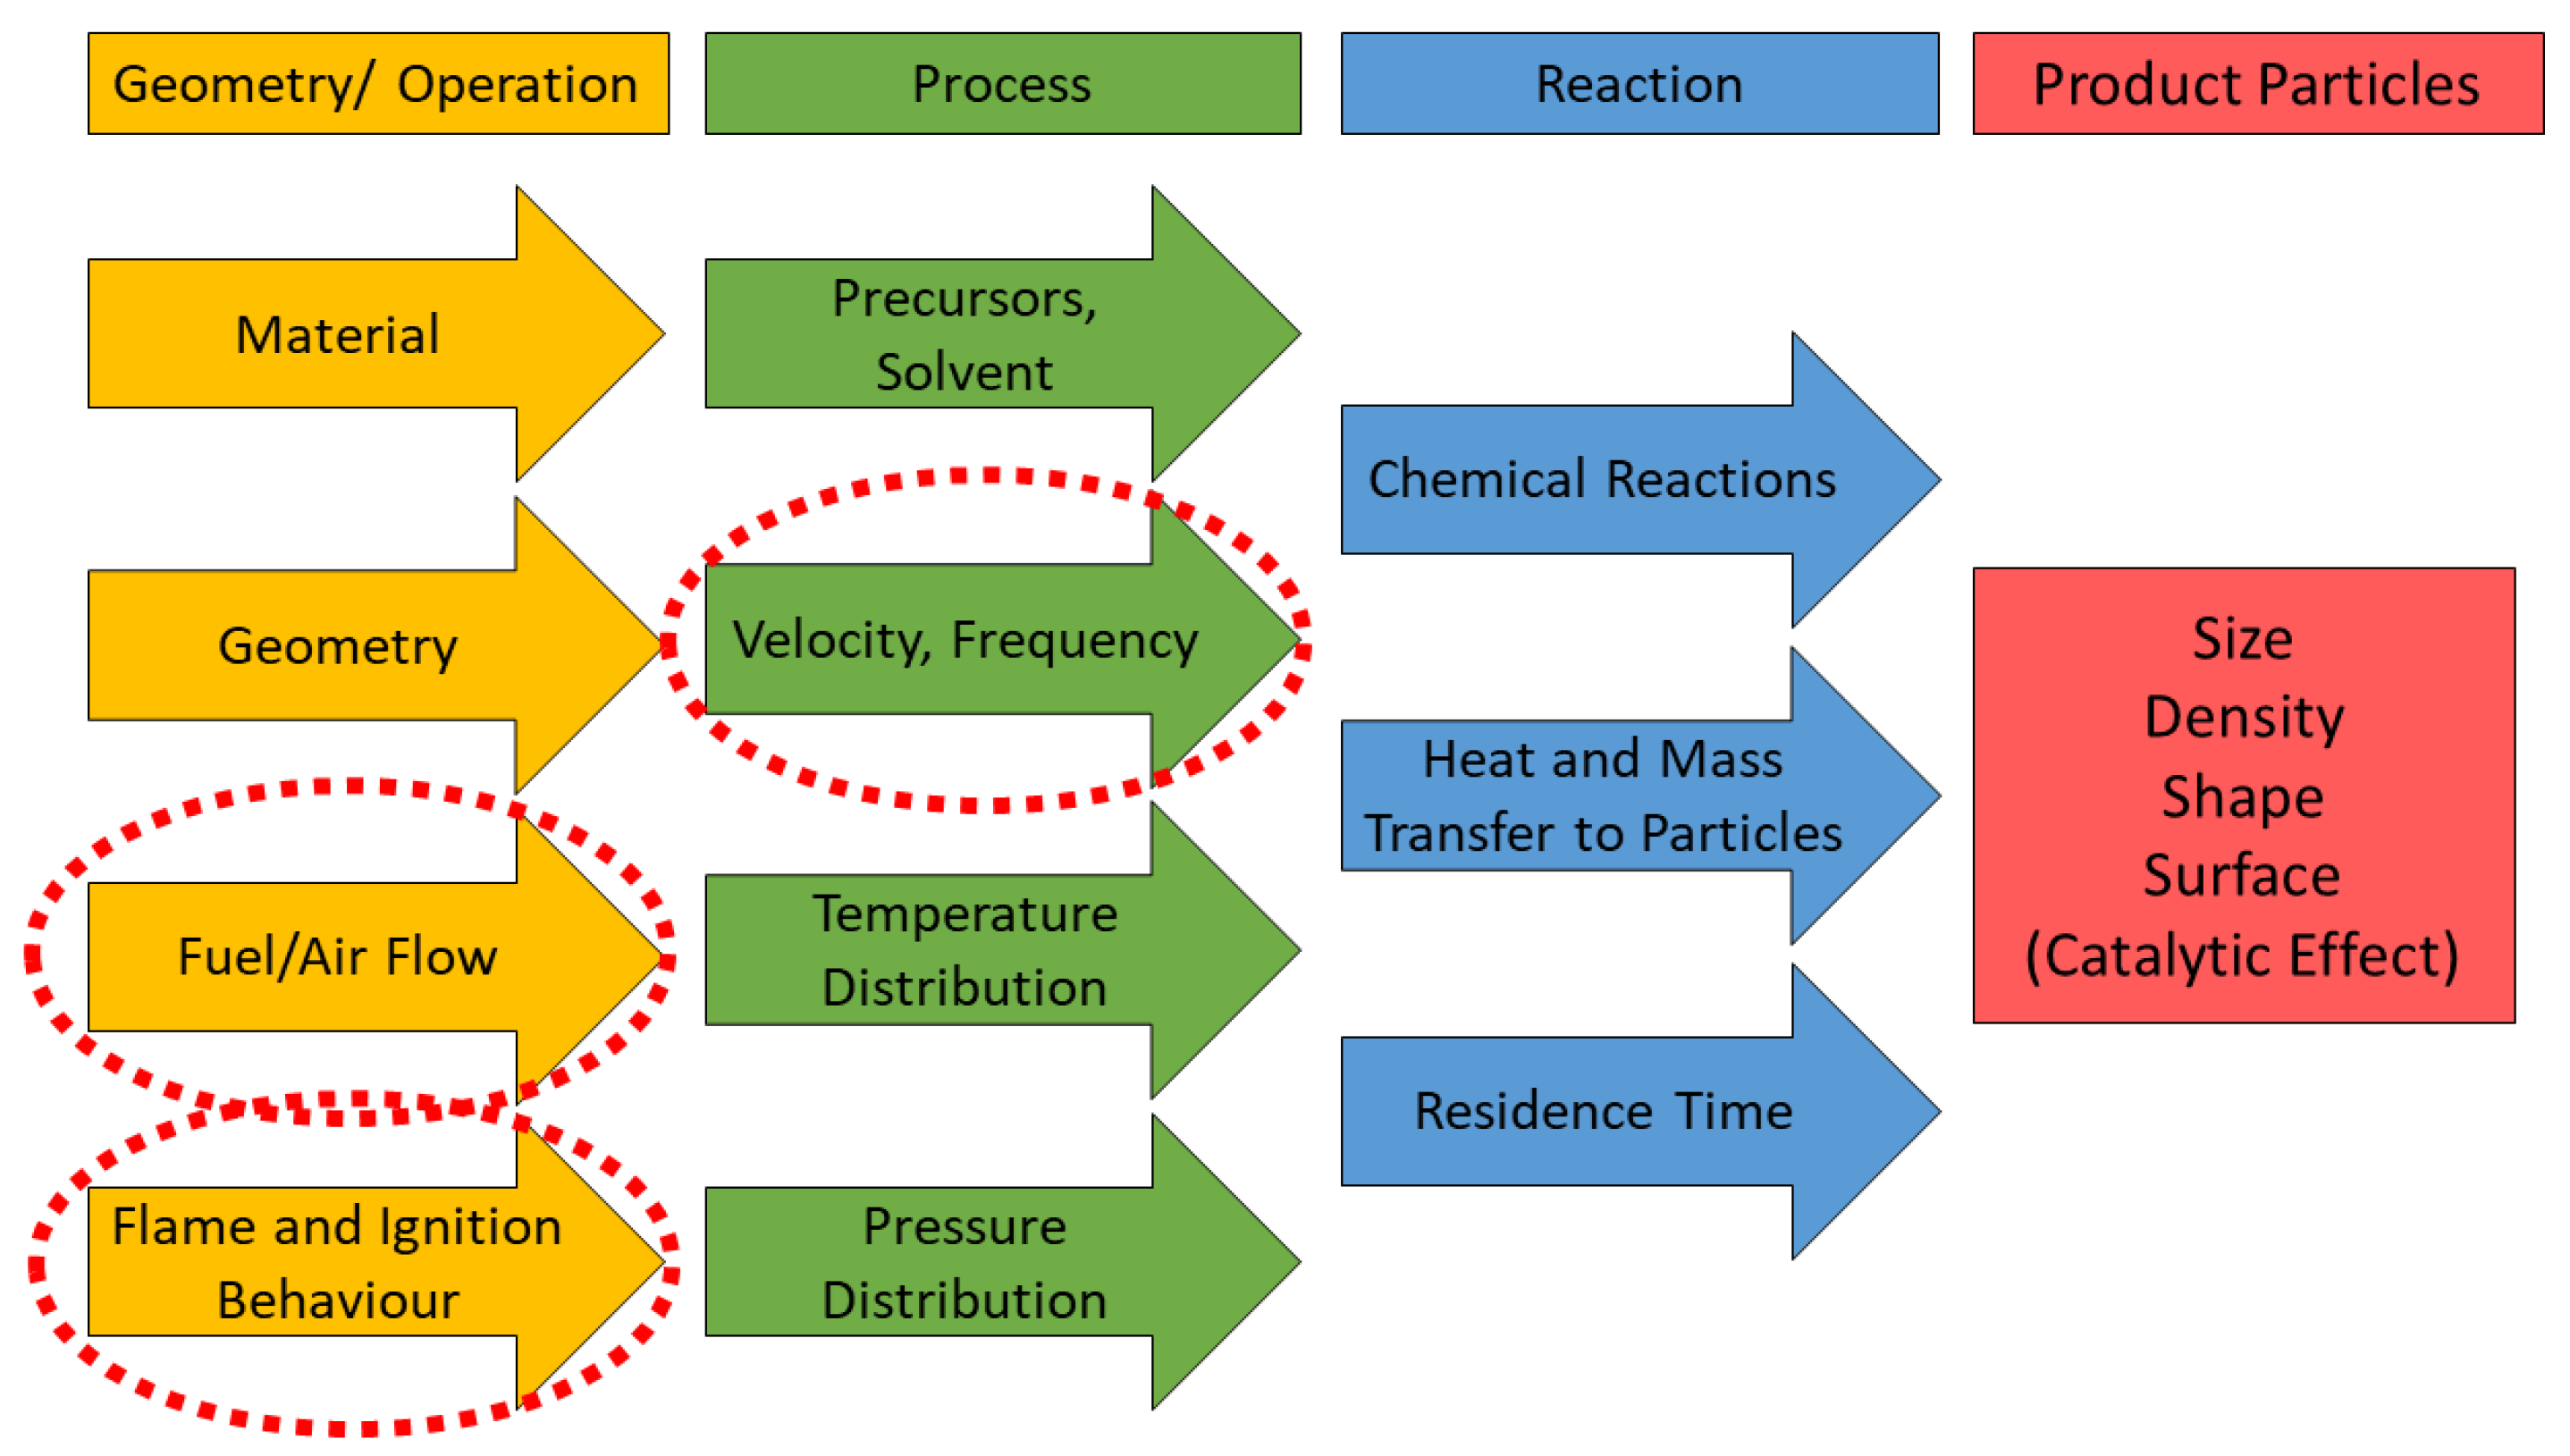
Figure 3.
The pulsation reactor operation cycle [13]. 1. Ignition and Combustion: A combustible mixture is ignited in the combustion chamber. 2. Expansion: The increasing pressure caused by the combustion process pushes the combustion products out of the combustion chamber. Additionally, the inlet valves are either closed (mechanical valves), or back-flow might occur (aerodynamic valves). 3. Intake: Pressure in the combustion chamber drops below the ambient pressure, resulting in fresh mixture being driven into the combustion chamber again. 4. Compression: As a consequence of the negative gauge pressure in the combustion chamber, a portion of the flue gas travels back, resulting in the fresh mixture being compressed and heated up. The mixture is re-ignited and the cycle repeats.

Figure 4.
The experimental pulsation reactor setup, with a high-speed camera to capture the combustion chamber. All dimensions are introduced in mm. The actual orientation is vertical. The temperature of the combustion chamber steel wall is 100 °C to 200 °C, and the temperature of the combustion chamber glass wall around the gas inlet is 650 K to 700 K, as measured by an infrared thermal camera.
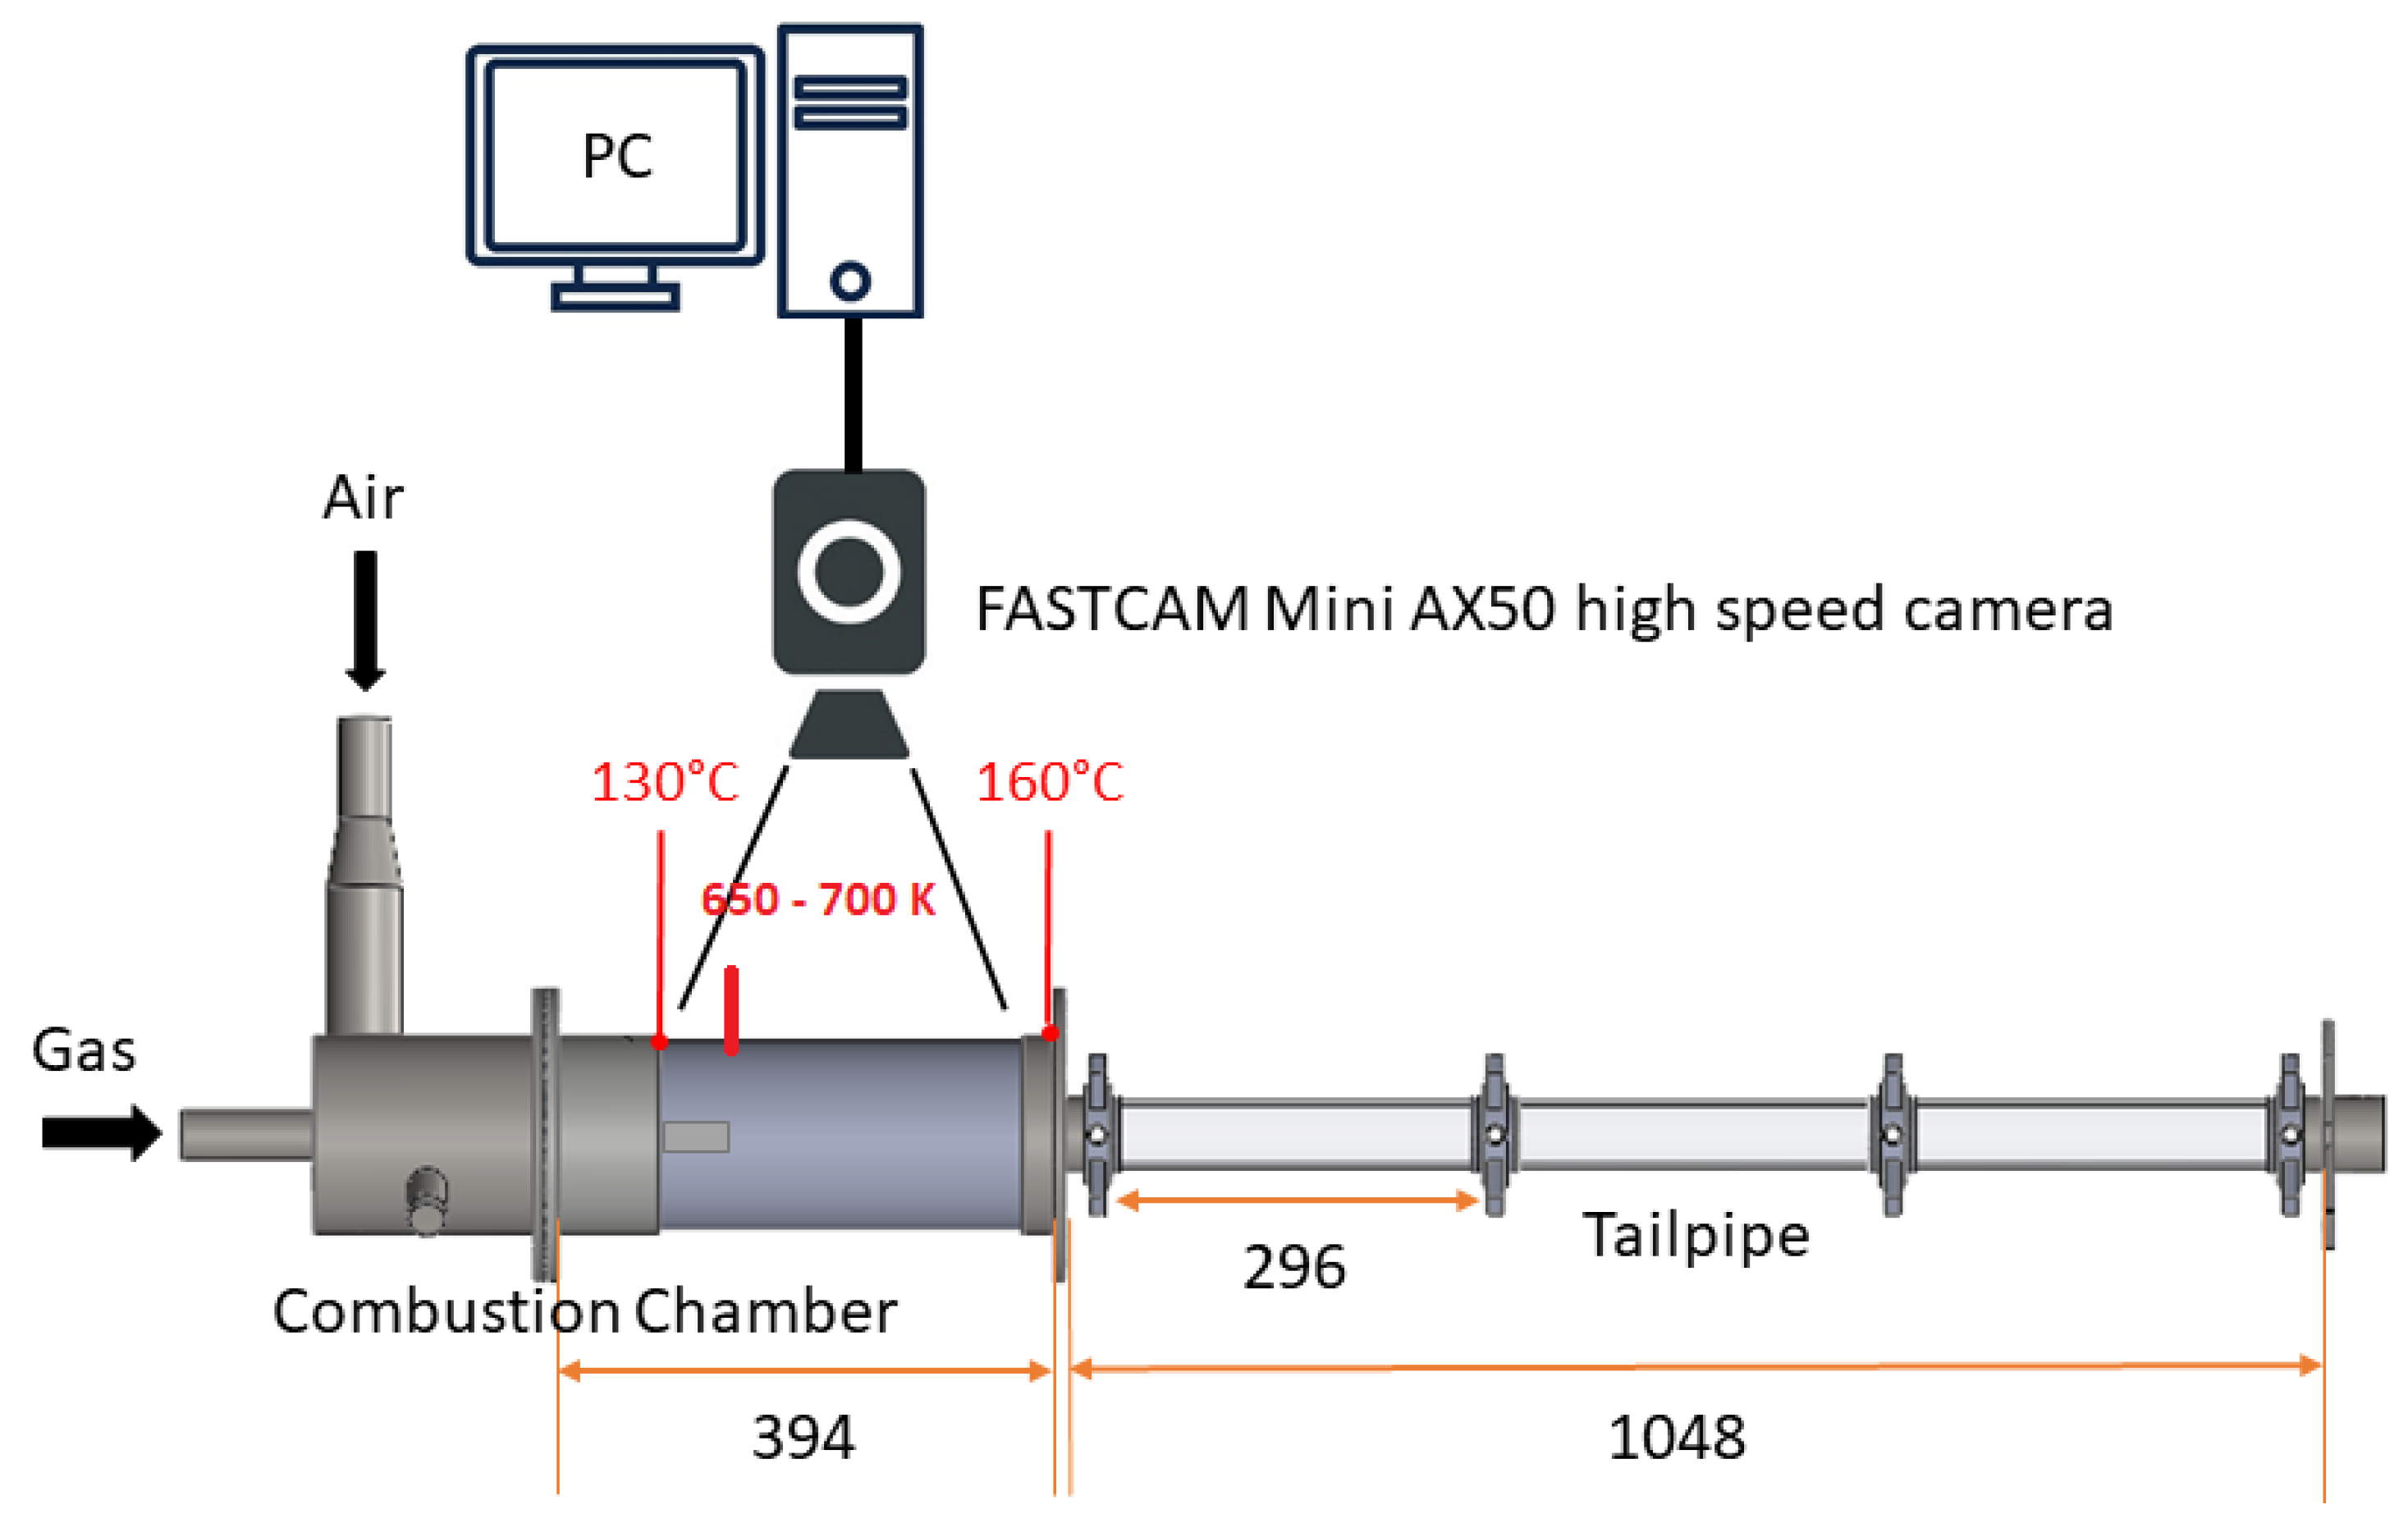
Figure 5.
The experimental pulsation reactor setup, with the PIV system, using a parallel laser. The signal detection pressure sensor (microphone with a frequency response from 2 Hz to 20 kHz) is installed in the side hole on the metal ring of the tailpipe.
Figure 5.
The experimental pulsation reactor setup, with the PIV system, using a parallel laser. The signal detection pressure sensor (microphone with a frequency response from 2 Hz to 20 kHz) is installed in the side hole on the metal ring of the tailpipe.

Figure 6.
Phase−locked PIV acquisition principle for the high−frequency PR, from signal acquisition to velocity description in one working cycle.
Figure 6.
Phase−locked PIV acquisition principle for the high−frequency PR, from signal acquisition to velocity description in one working cycle.
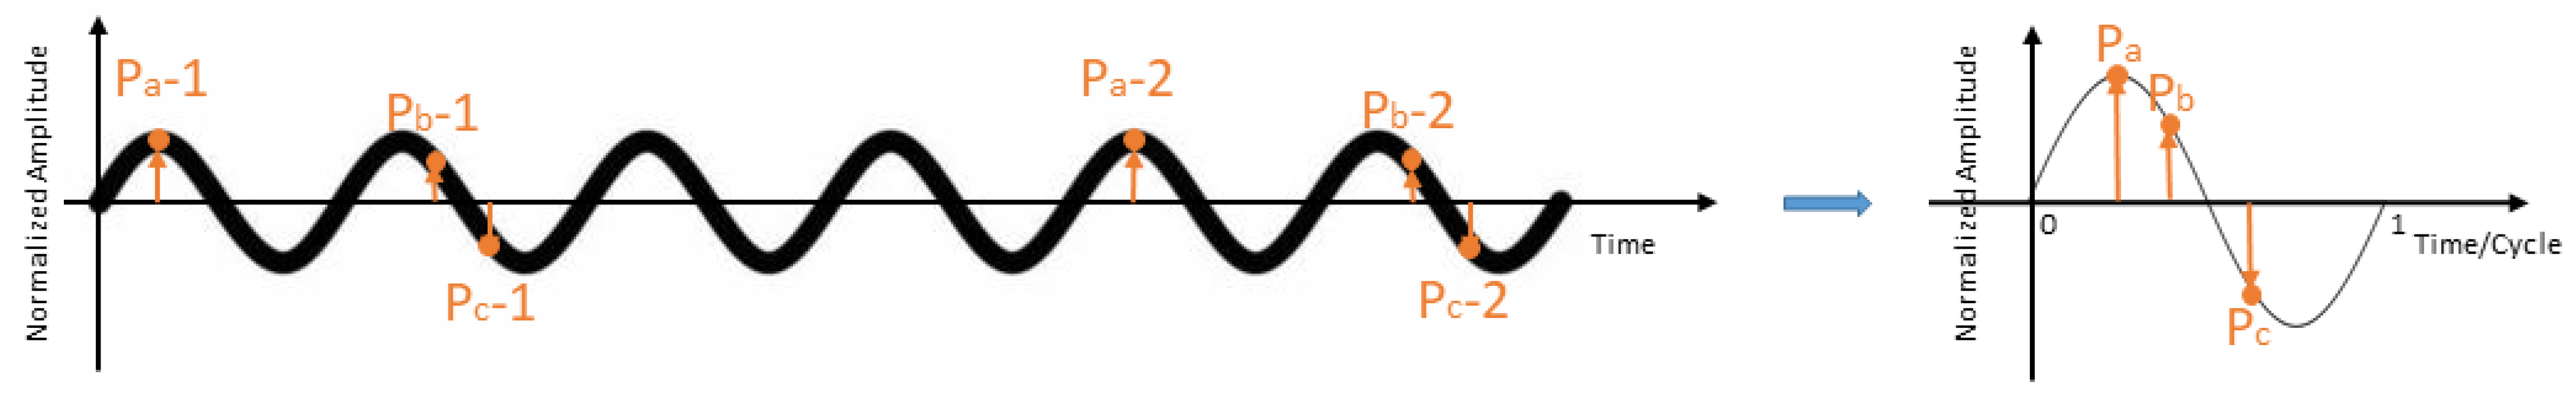
Figure 7.
Phase−locked PIV, measuring the area in the combustion chamber. (a) Original image with particles. The yellow areas are the reflected light from the glass wall; (b) mean image—the average of 1000 images using mean pixel gray values; (c) image (a) with the common background (b) removed using Image Arithmetics; (d) velocity vectors using the cross−correlation method of PIV.
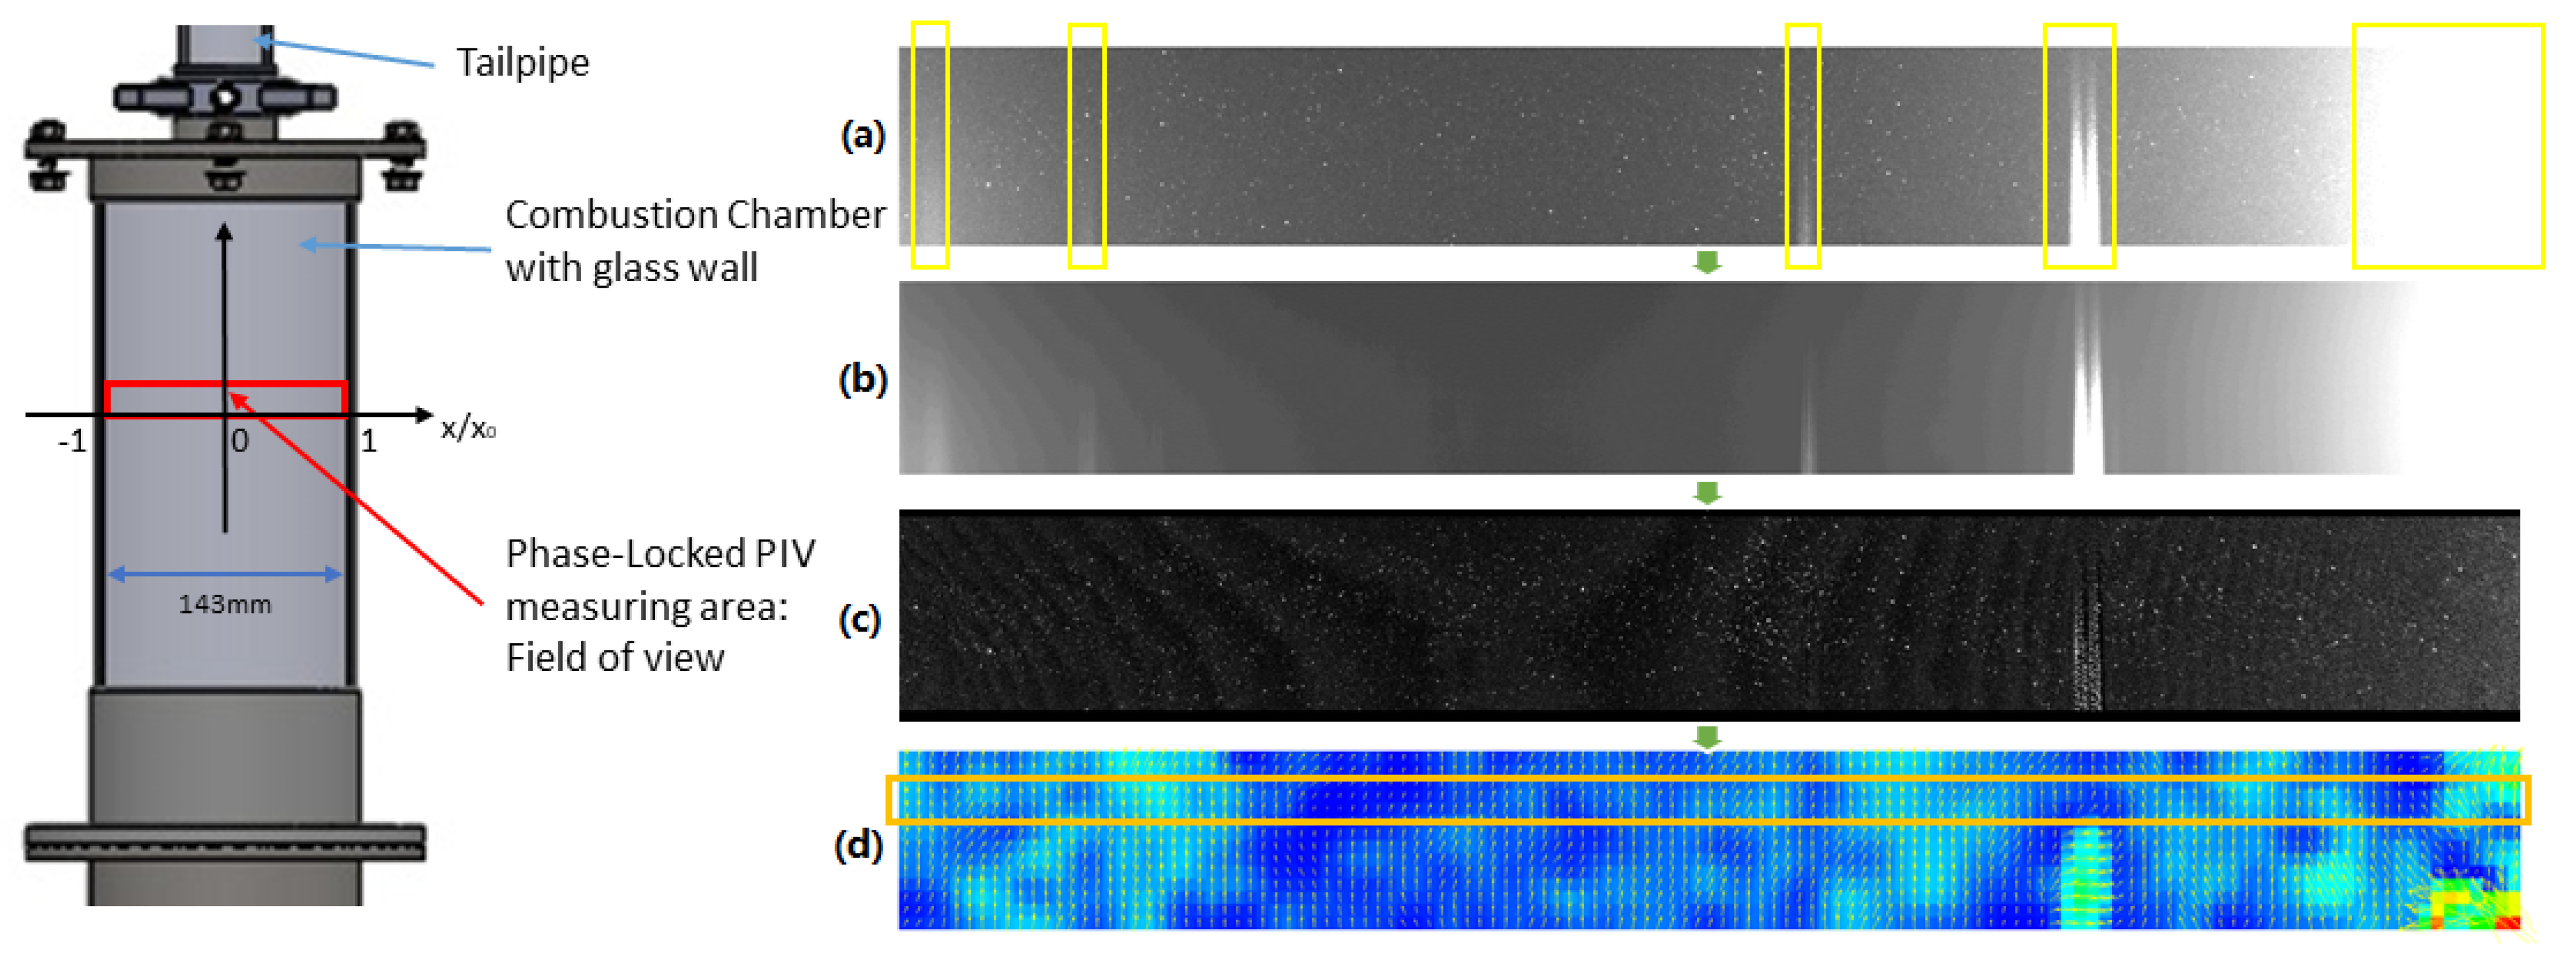
Figure 8.
Flames visualization, with a gray calculated area value.

Figure 9.
Flame cycle (from subfigure a–k) pseudo color visualization of OP4 ( = 2567 [kW/m3], ); the four stages (A−B, B−C, C−D, and D−A) of pulse combustion (details shown in Figure 11 and Figure 12).
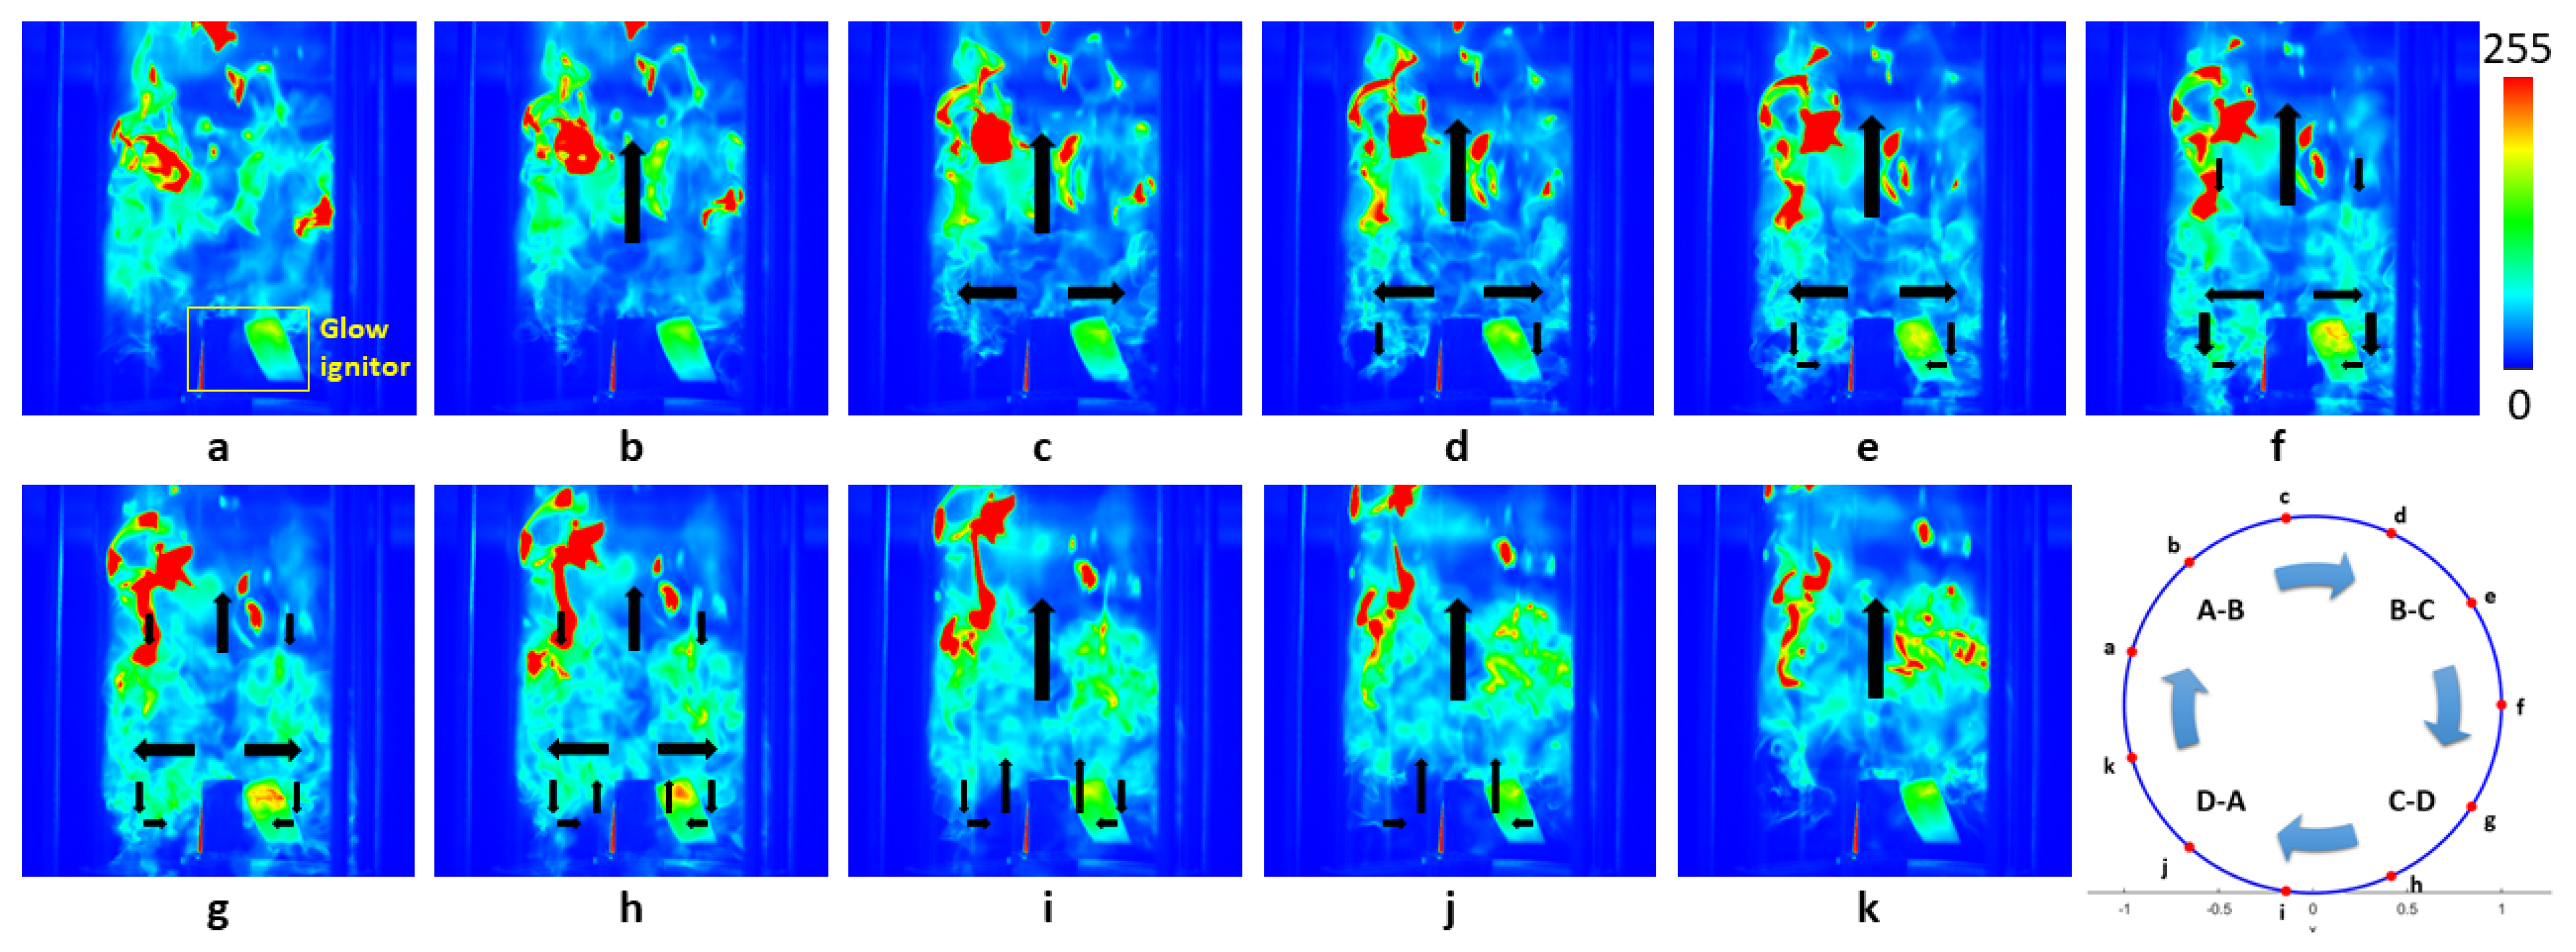
Figure 10.
Intensity of OP4 in three cycles. The light intensity of the entire flame area (blue box), which is calculated via the gray value, initially undergoes a decrease from point a to point c, reaching the low point in the cycle. This decline can be attributed to the presence of the unburned mixture from the previous working cycle. Subsequently, the light intensity gradually increases, reaching its peak around point h in the cycle. Finally, it undergoes another decline.
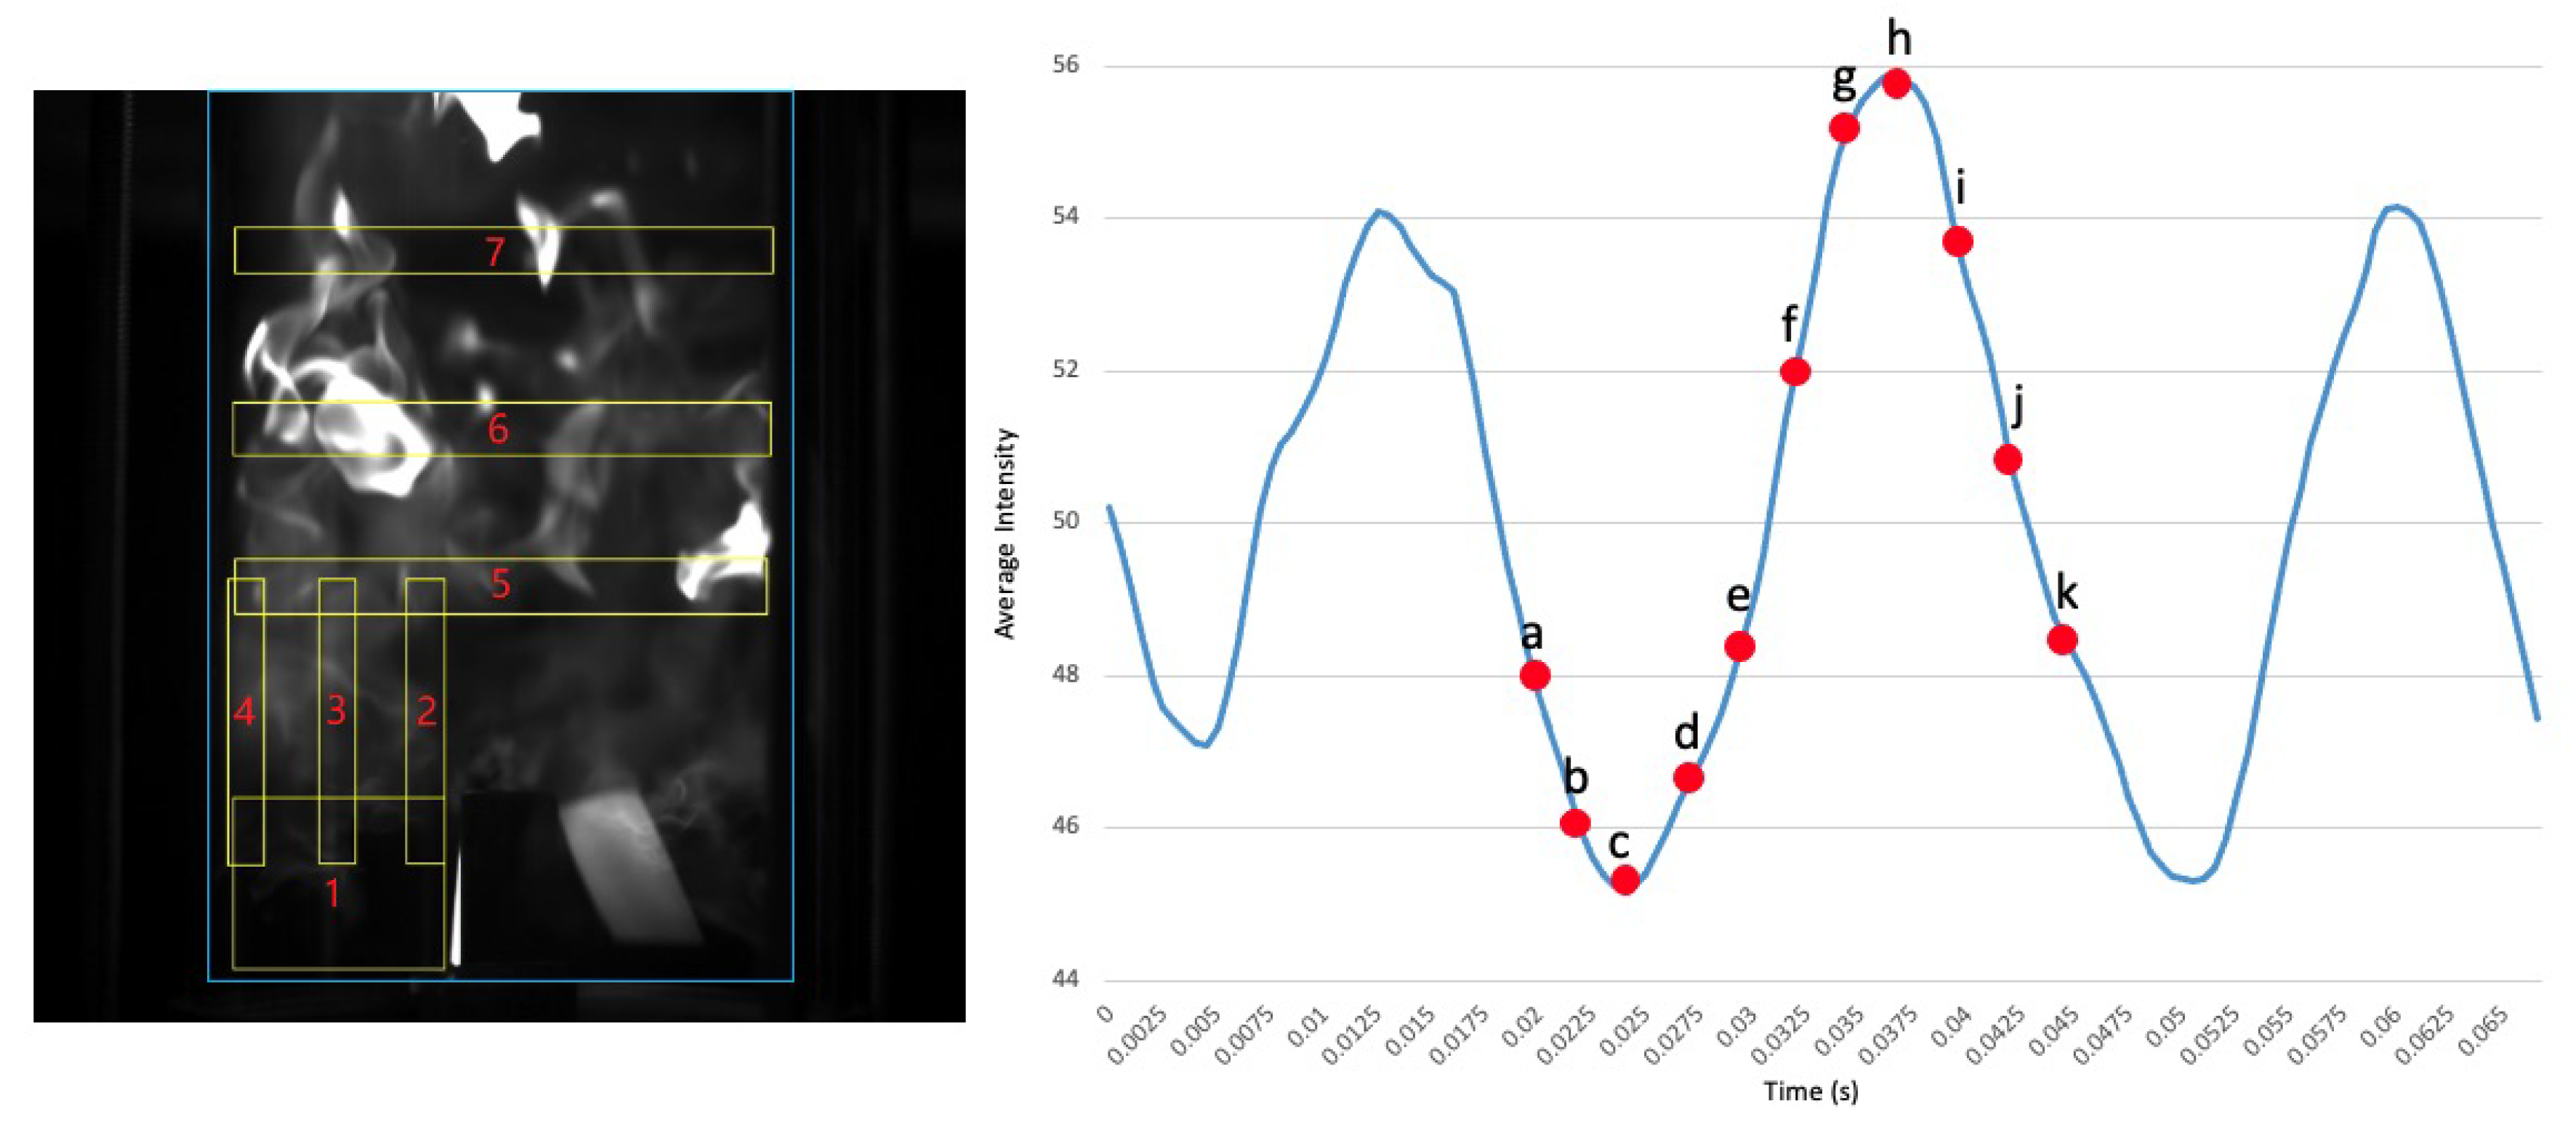
Figure 11.
Flame average intensity of different areas in the bottom region of OP4, indicates the flame propagation.
Figure 11.
Flame average intensity of different areas in the bottom region of OP4, indicates the flame propagation.

Figure 12.
Flame average intensity of different areas in the upper region of OP4, indicates the flame propagation.
Figure 12.
Flame average intensity of different areas in the upper region of OP4, indicates the flame propagation.

Figure 13.
The figure shows the flame velocity and vorticity distribution for OP4 at a Time/Cycle equal to . The selected area is the area where the entire flame exists (see the blue box in Figure 10).
Figure 13.
The figure shows the flame velocity and vorticity distribution for OP4 at a Time/Cycle equal to . The selected area is the area where the entire flame exists (see the blue box in Figure 10).
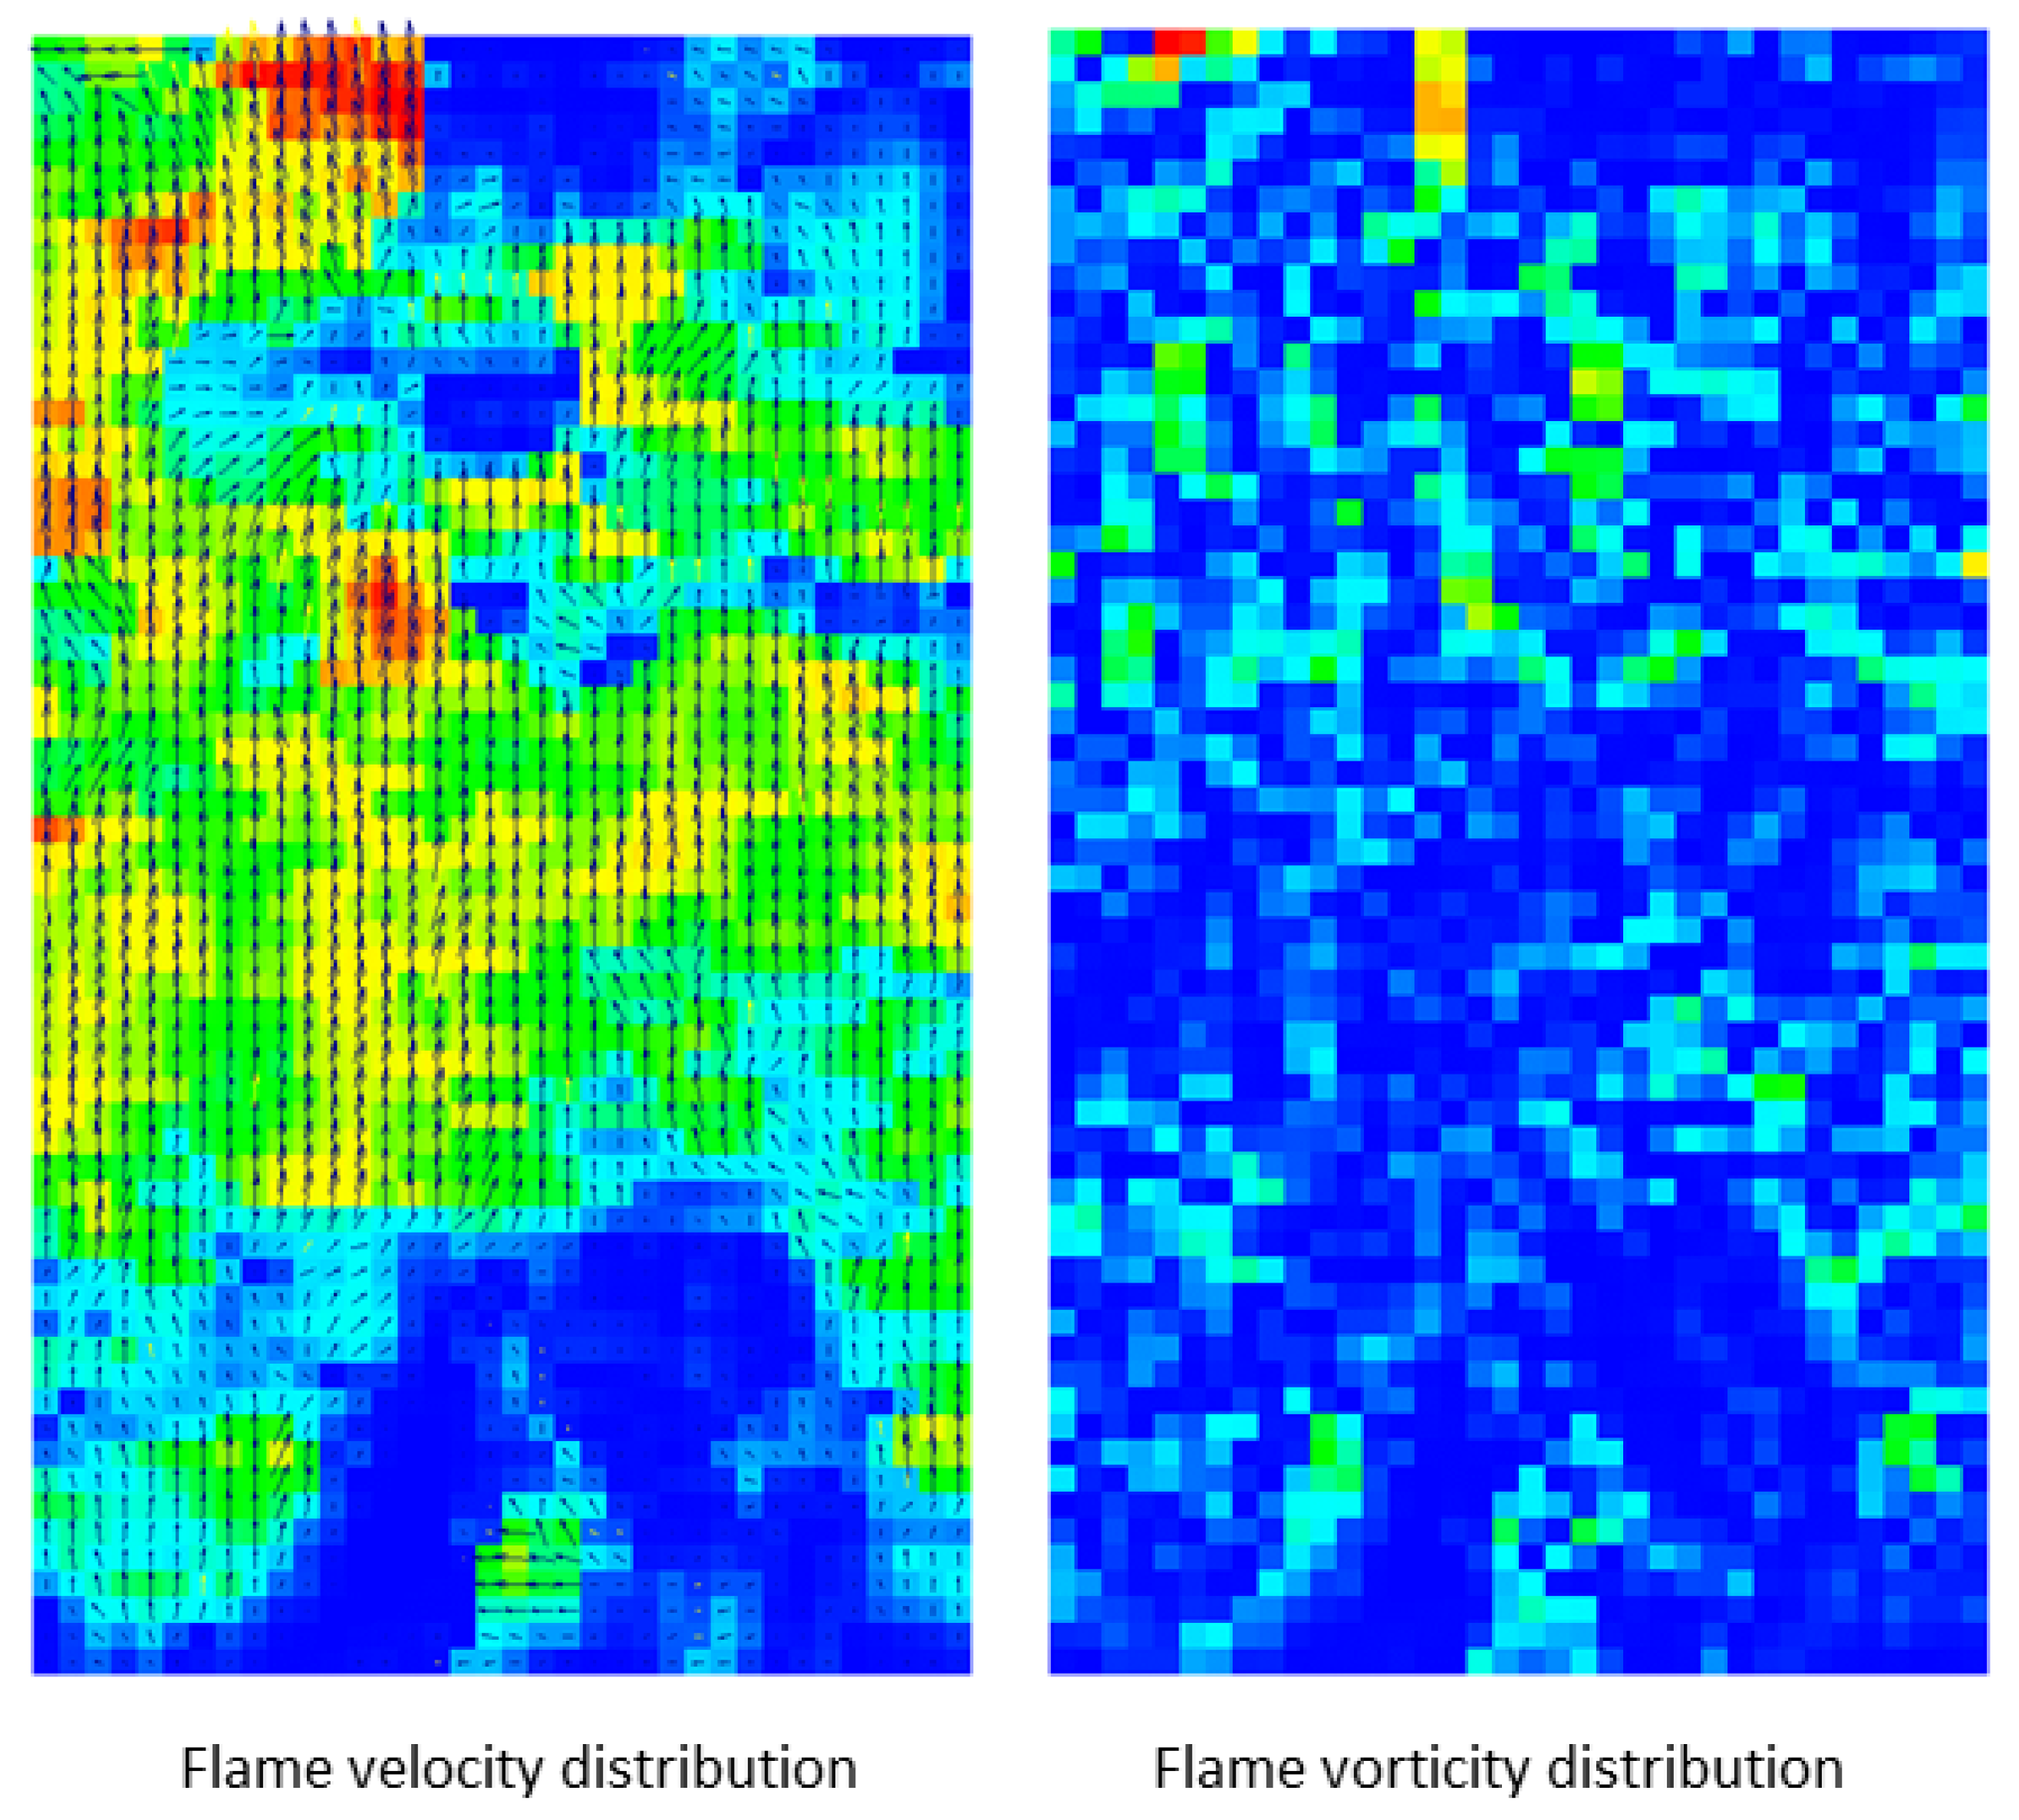
Figure 14.
Flame average vorticity in the measuring area during three cycles, given exemplarily for OP4.
Figure 14.
Flame average vorticity in the measuring area during three cycles, given exemplarily for OP4.

Figure 15.
Luminosity at different operation points, quantified by average pixel intensity.
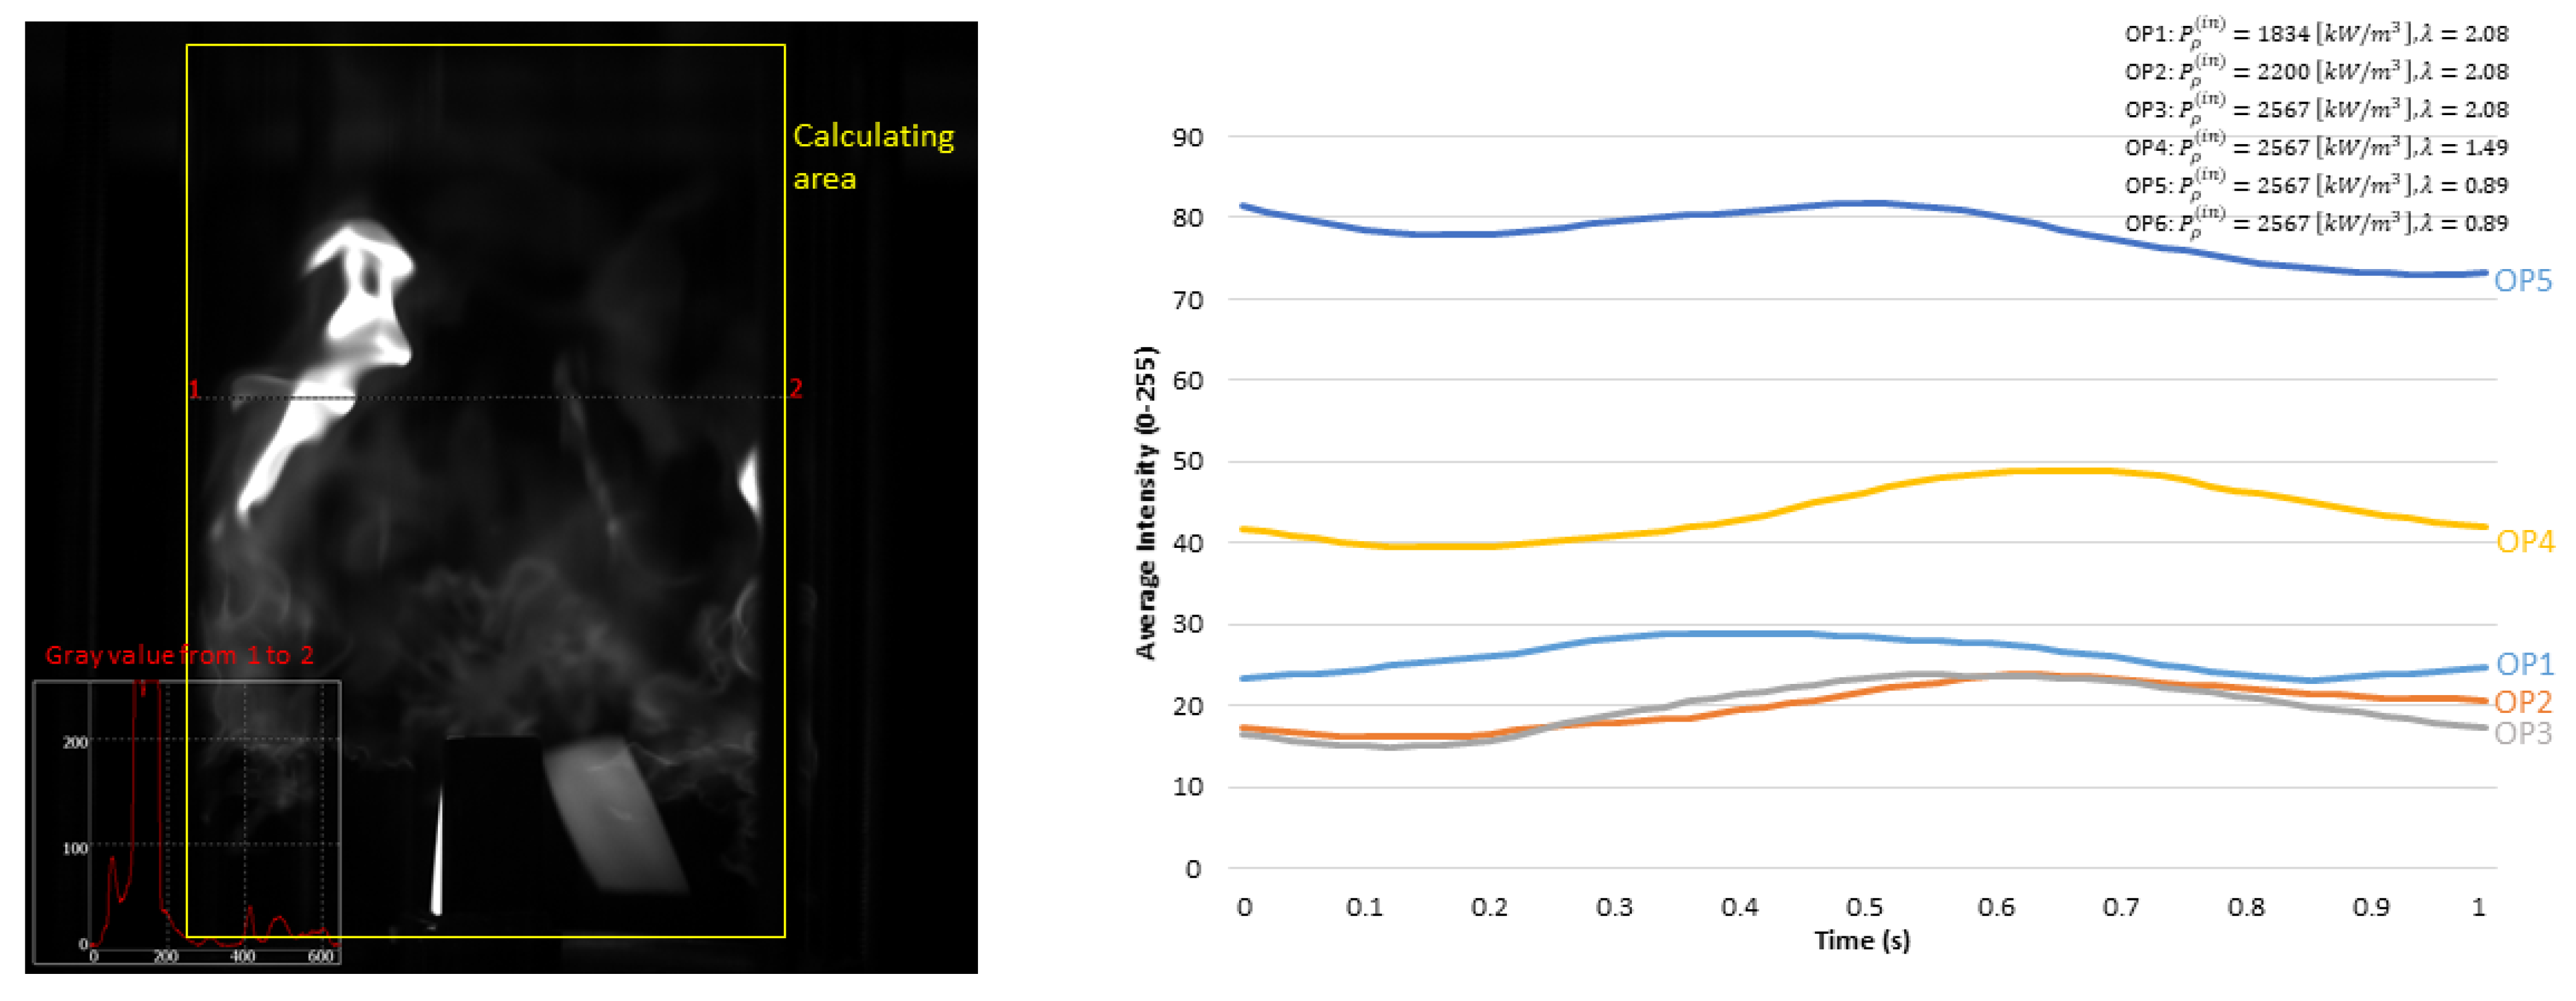
Figure 16.
Flames visualization of different operation points from OP1 to OP5 at “Phase a” of a working cycle (RGB bar from intensity 0 to 255).
Figure 16.
Flames visualization of different operation points from OP1 to OP5 at “Phase a” of a working cycle (RGB bar from intensity 0 to 255).
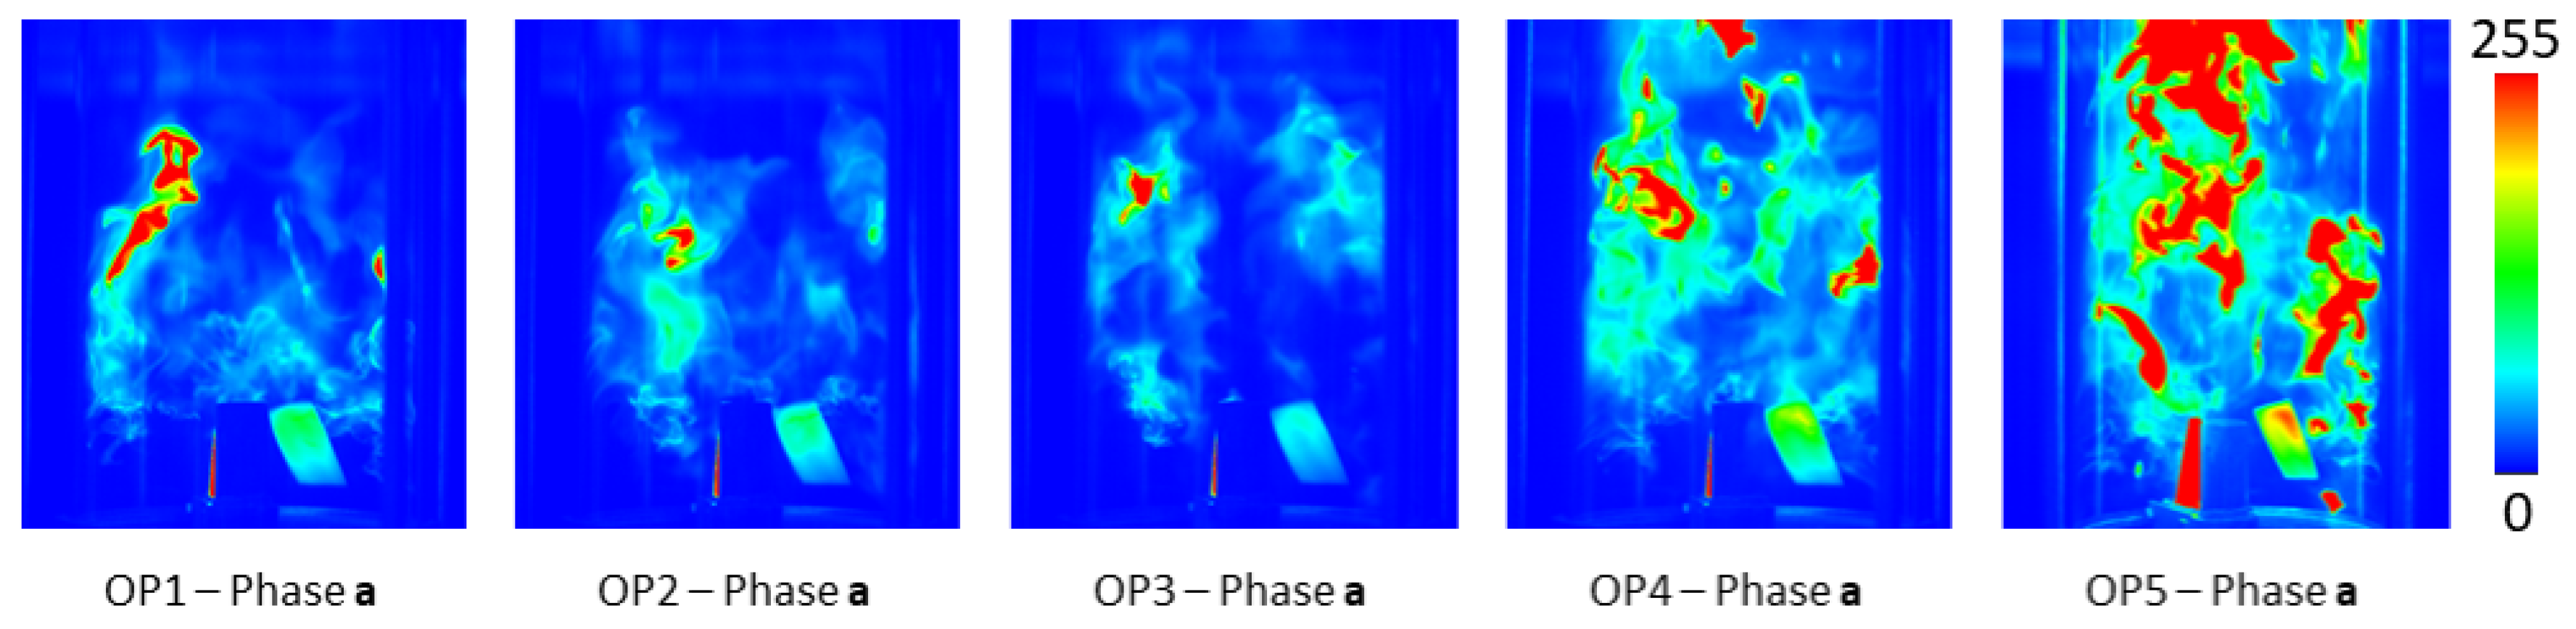
Figure 17.
Average flame velocity inside a specific area with different air−fuel equivalence ratios and power density input (fitted curves for different working conditions).
Figure 17.
Average flame velocity inside a specific area with different air−fuel equivalence ratios and power density input (fitted curves for different working conditions).
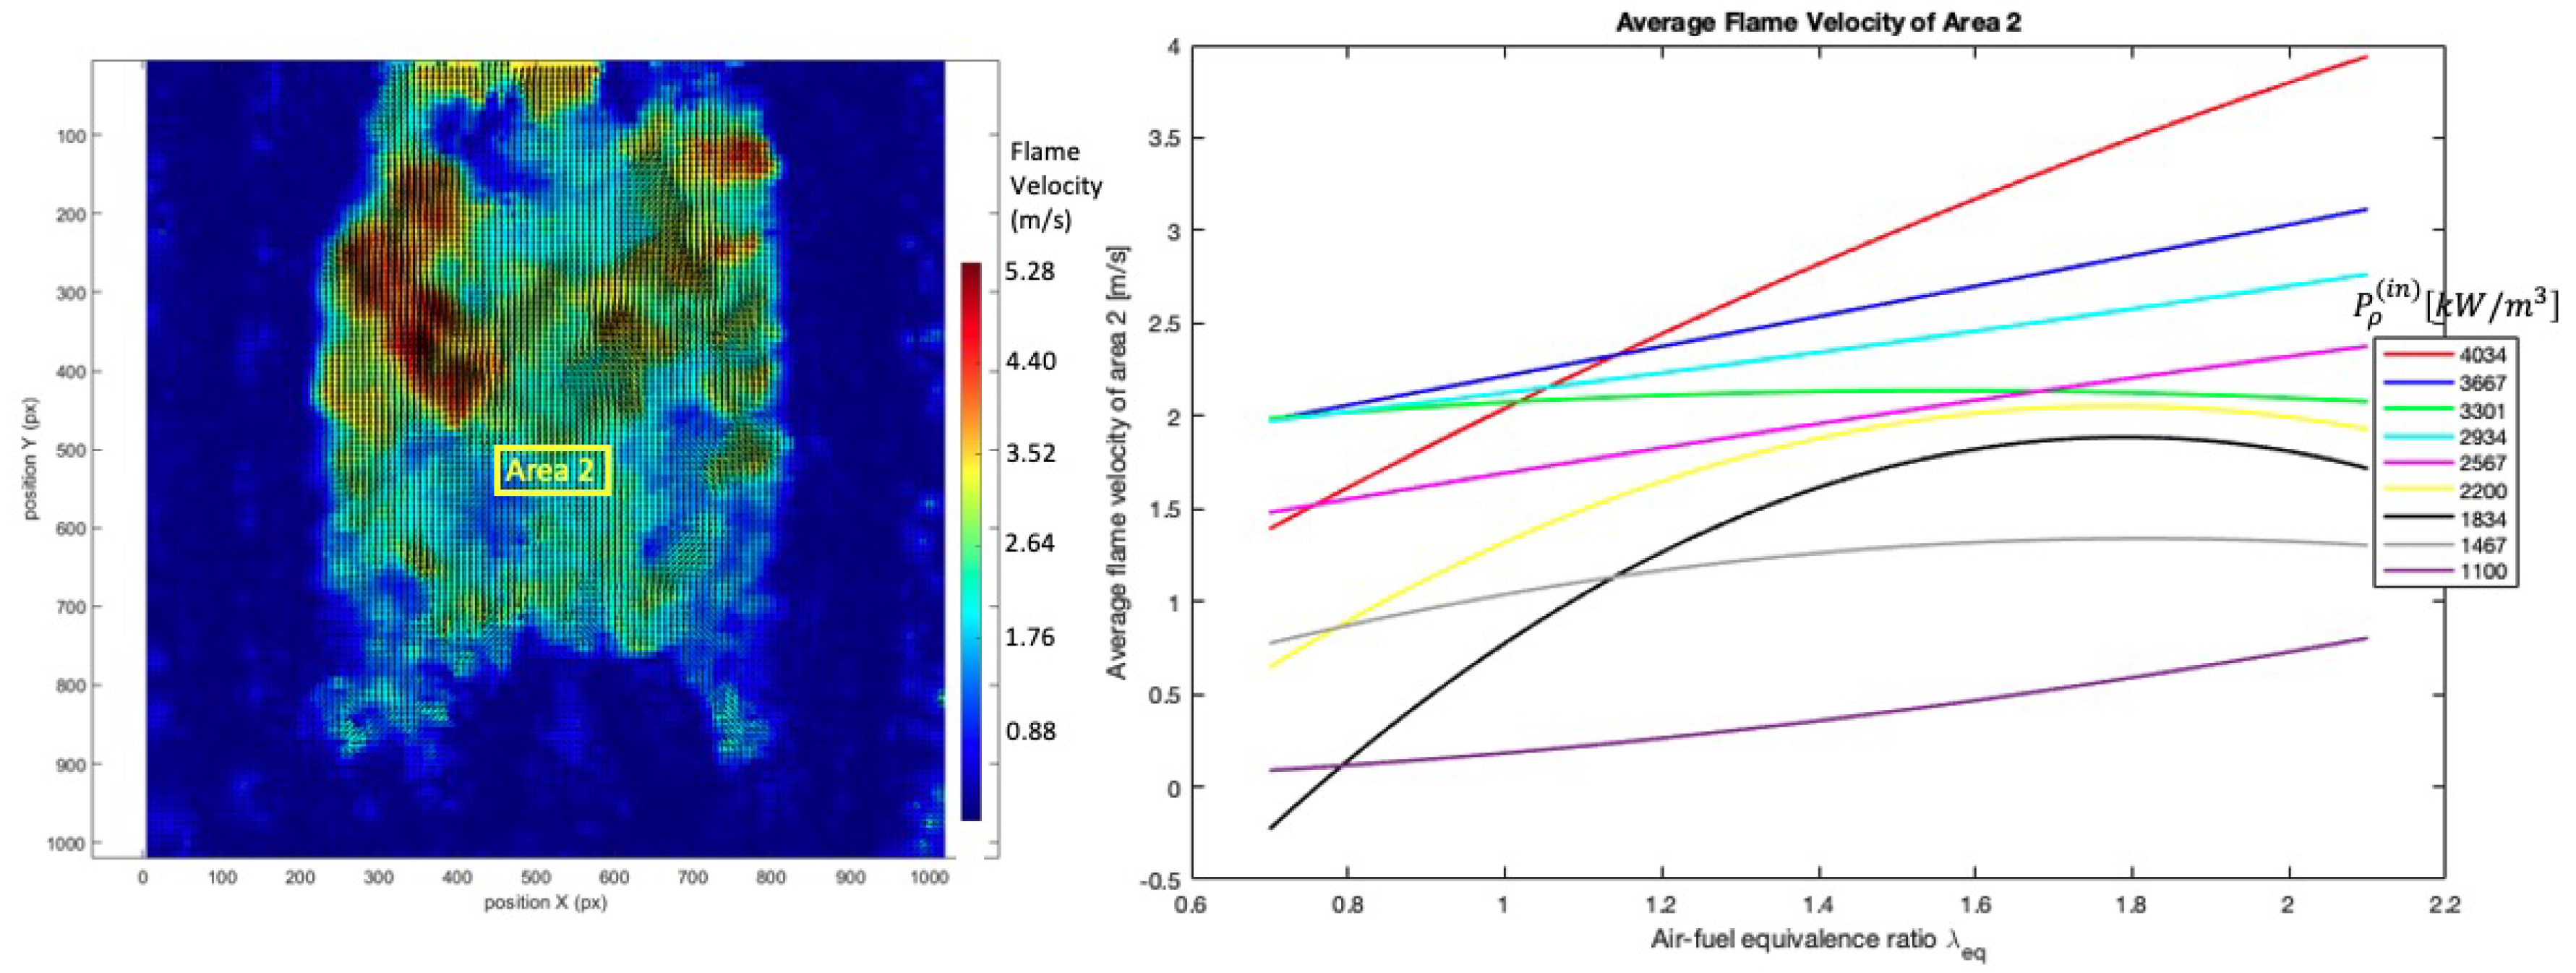
Figure 18.
Phase−locked PIV streamlines for flow in the combustion chamber for the center measuring position in Figure 7.
Figure 18.
Phase−locked PIV streamlines for flow in the combustion chamber for the center measuring position in Figure 7.

Figure 19.
Flow velocity of component in the combustion chamber with the fraction of time in one working cycle (from 0, 0.1,…, to 1, there are 11 phases total).
Figure 19.
Flow velocity of component in the combustion chamber with the fraction of time in one working cycle (from 0, 0.1,…, to 1, there are 11 phases total).
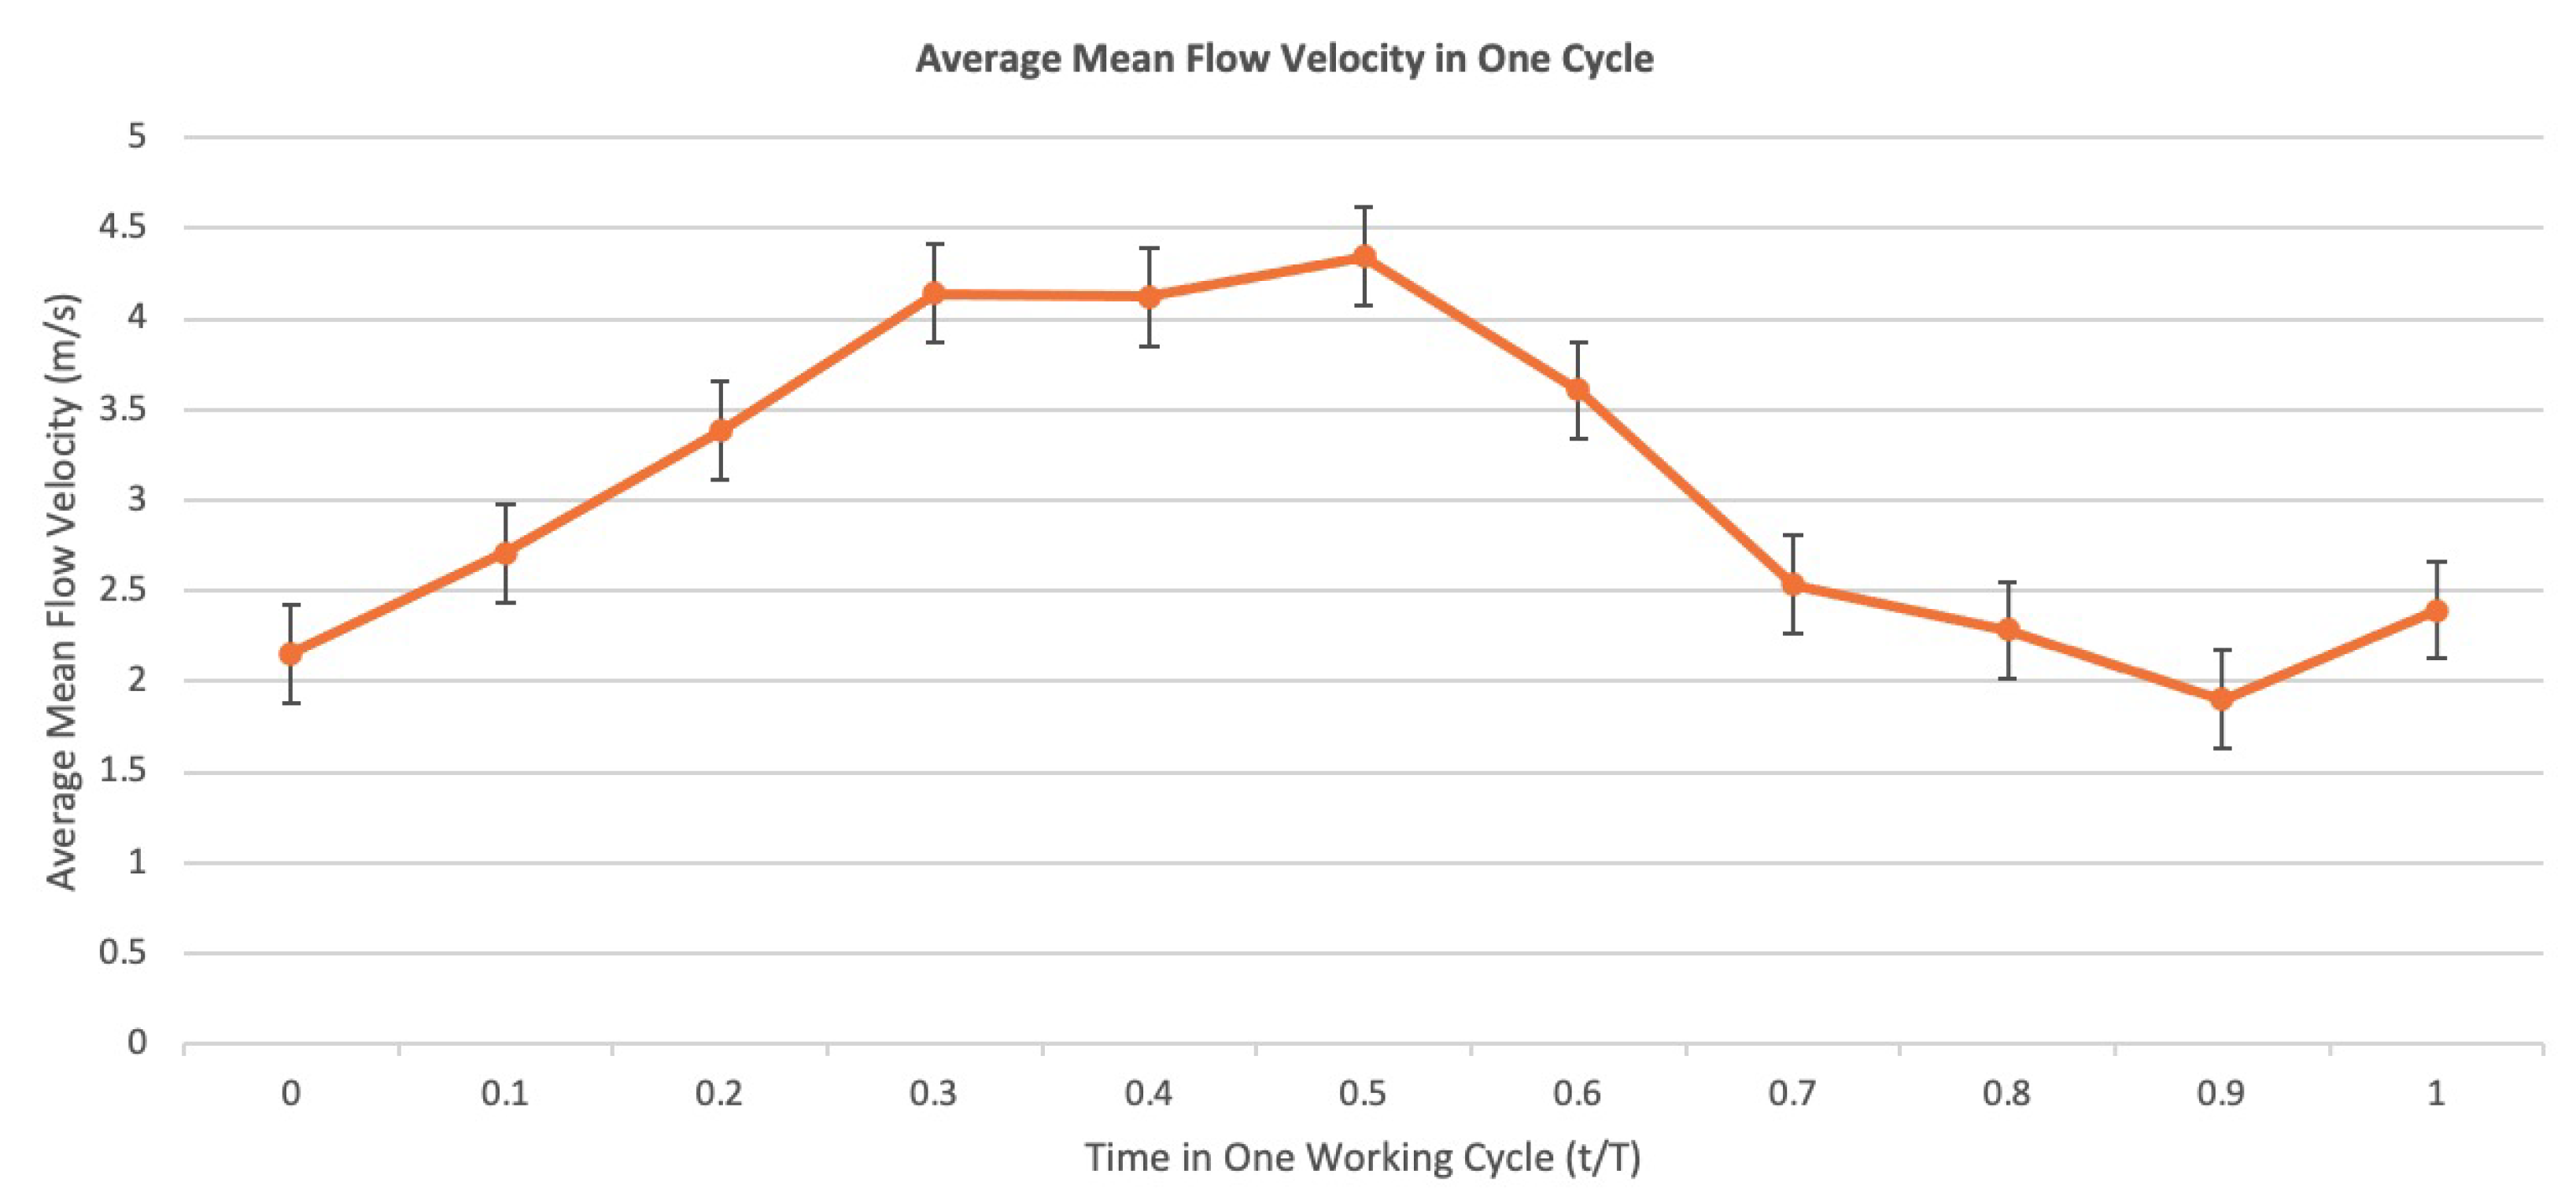
Figure 20.
Velocity vector map of Phase 4. The yellow box areas are light reflection areas that are difficult to avoid in experiments and image post−processing. The orange box area is the average velocity calculated area.
Figure 20.
Velocity vector map of Phase 4. The yellow box areas are light reflection areas that are difficult to avoid in experiments and image post−processing. The orange box area is the average velocity calculated area.

Table 1.
Overview of the measured operation points for the flame. The values of power density input and air-fuel equivalence ratio are calculated by Dostál et al. [8].
Table 1.
Overview of the measured operation points for the flame. The values of power density input and air-fuel equivalence ratio are calculated by Dostál et al. [8].
| Operation Point | Power Density Input [kW/m3] | Air-Fuel Equivalence Ratio | Airflow Rate [Nm3/h] | Gasflow Rate [Nm3/h] | Frequency [Hz] | Glow Ignition |
|---|---|---|---|---|---|---|
| OP1 | 1834 | 2.08 | 25 | 1.25 | 40.37 | Yes |
| OP2 | 2200 | 2.08 | 30 | 1.50 | 40.09 | Yes |
| OP3 | 2567 | 2.08 | 35 | 1.75 | 38.92 | Yes |
| OP4 | 2567 | 1.49 | 25 | 1.75 | 41.08 | Yes |
| OP5 | 2567 | 0.89 | 15 | 1.75 | 41.49 | Yes |
| OP6 | 2567 | 0.89 | 15 | 1.75 | 41.49 | No |
Disclaimer/Publisher’s Note: The statements, opinions and data contained in all publications are solely those of the individual author(s) and contributor(s) and not of MDPI and/or the editor(s). MDPI and/or the editor(s) disclaim responsibility for any injury to people or property resulting from any ideas, methods, instructions or products referred to in the content. |
© 2024 by the authors. Licensee MDPI, Basel, Switzerland. This article is an open access article distributed under the terms and conditions of the Creative Commons Attribution (CC BY) license (https://creativecommons.org/licenses/by/4.0/).
Share and Cite
MDPI and ACS Style
Zhang, C.; Dostál, J.; Heidinger, S.; Günther, S.; Odenbach, S. Experimental Investigation of a Pulsation Reactor via Optical Methods. Processes 2024, 12, 385. https://doi.org/10.3390/pr12020385
AMA Style
Zhang C, Dostál J, Heidinger S, Günther S, Odenbach S. Experimental Investigation of a Pulsation Reactor via Optical Methods. Processes. 2024; 12(2):385. https://doi.org/10.3390/pr12020385
Chicago/Turabian StyleZhang, Chunliang, Jakub Dostál, Stefan Heidinger, Stefan Günther, and Stefan Odenbach. 2024. "Experimental Investigation of a Pulsation Reactor via Optical Methods" Processes 12, no. 2: 385. https://doi.org/10.3390/pr12020385
Note that from the first issue of 2016, this journal uses article numbers instead of page numbers. See further details here.