
A New Comprehensive Indicator for Monitoring Anaerobic Digestion: A Principal Component Analysis Approach
by
 , ,
, ,
Ru Jia
1,2, 
Young-Chae Song
1,2,* ,
,
Zhengkai An
1,2 ,
,
Keugtae Kim
3,
Chae-Young Lee
4 and
Byung-Uk Bae
5 1
Department of Environmental Engineering, Korea Maritime and Ocean University, Busan 49112, Republic of Korea
2
Interdisciplinary Major of Ocean Renewable Energy Engineering, Busan 49112, Republic of Korea
3
Department of Biological and Environmental Science, Dongguk University, Gyeonggi 10326, Republic of Korea
4
Division of Civil, Environmental and Energy Engineering, The University of Suwon, Gyeonggi 18323, Republic of Korea
5
Department of Civil and Environmental Engineering, Daejeon University, Daejeon 34520, Republic of Korea
*
Author to whom correspondence should be addressed.
Processes 2024, 12(1), 59; https://doi.org/10.3390/pr12010059
Submission received: 20 November 2023
/
Revised: 14 December 2023
/
Accepted: 25 December 2023
/
Published: 26 December 2023
(This article belongs to the Special Issue Anaerobic Processes, Monitoring and Intelligence Control)
Abstract
:This paper has proposed a comprehensive indicator based on principal component analysis (PCA) for diagnosing the state of anaerobic digestion. Various state and performance variables were monitored under different operational modes, including start-up, interruption and resumption of substrate supply, and impulse organic loading rates. While these individual variables are useful for estimating the state of anaerobic digestion, they must be interpreted by experts. Coupled indicators combine these variables with the effect of offering more detailed insights, but they are limited in their universal applicability. Time-series eigenvalues reflected the anaerobic digestion process occurring in response to operational changes: Stable states were identified by eigenvalue peaks below 1.0, and they had an average below 0.2. Slightly perturbed states were identified by a consistent decrease in eigenvalue peaks from a value of below 4.0 or by observing isolated peaks below 3.0. Disturbed states were identified by repeated eigenvalue peaks over 3.0, and they had an average above 0.6. The long-term persistence of these peaks signals an increasing kinetic imbalance, which could lead to process failure. Ultimately, this study demonstrates that time-series eigenvalue analysis is an effective comprehensive indicator for identifying kinetic imbalances in anaerobic digestion.
1. Introduction
Anaerobic digestion is a sustainable environmental technology that has been widely employed for over a century for purposes such as stabilizing organic wastes—including sewage sludge, food wastes, and livestock wastes—and producing methane as a valuable byproduct [1,2]. In anaerobic digestion, organic matter is decomposed through a series of interdependent and complex biochemical reactions, including hydrolysis, acidogenesis, acetogenesis, and methanogenesis [3]. Organic solid wastes containing polymeric materials, such as municipal solid wastes, undergo relatively slow hydrolysis that often serves as the rate-limiting step in overall anaerobic digestion [4,5,6]. However, the metabolic rates of methanogenic archaea are slower than those of acidogenic bacteria while also being more sensitive to changes in environmental factors, such as pH and temperature, as well as changes in the levels of intermediates and toxic substances [7,8,9]. When acidogenesis outpaces methanogenesis, the VFAs—as an intermediate—can accumulate, thus consuming alkalinity and lowering the pH to further suppress methanogenic activity [8]. This can worsen the kinetic imbalance of the anaerobic digestion process and ultimately lead to process failure [8,10].
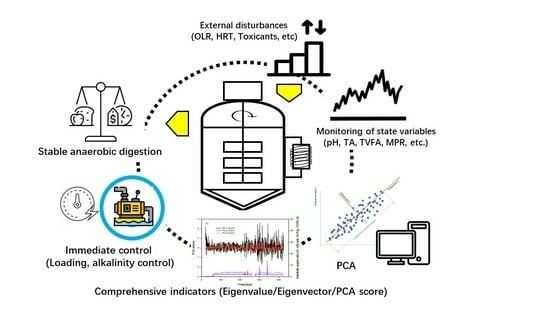
To ensure the stable operation of anaerobic digesters, it is crucial to monitor the state of anaerobic digestion in real-time and respond promptly to any observed issues [1]. Several single and coupled indicators that function according to their threshold values have been proposed to assess the state of anaerobic digestion [11,12]. Single indicators often include state and performance variables related to the environment, intermediate metabolites, organic residuals, and biogas production. These single indicators provide valuable information about the state of anaerobic digestion, but they need to be integrated to gain deeper insights into the state as a whole, which can be challenging [13,14]. Meanwhile, coupled indicators are derived from combinations of two or three single indicators, including the ratio of total volatile fatty acids (TVFA) to total alkalinity (TA), the ratio of propionate to acetate, and the accumulation rate of TVFA relative to methane production rate (MPR); these indicators can also provide early warning signs of unstable anaerobic digestion and its potential for further exacerbation [15,16]. However, the relationships between the variables that are used in the coupled indicators may vary depending on the substrate or type of anaerobic digestion, which can affect the accuracy of the assessment results [9,11,14]. Further, there is currently no universal indicator that can be used to diagnose the state of anaerobic digestion [13,14,16].
Researchers have recently shown growing interest in developing new and innovative approaches to assess the state of anaerobic digestion [13,16]. These approaches are varied, as they incorporate multiple variables and utilize advanced techniques—including monitoring for changes in the microbial community, thermodynamic analysis, stable isotope analysis, and machine learning algorithms—to provide a more comprehensive understanding of the anaerobic digestion state [17,18]. For instance, changes in the Gibbs free energy values for syntrophic oxidations of propionate and acetate can help better identify the state of anaerobic digestion in response to the organic overloading rate, thus indicating their potential utility as alternative early-warning indicators [17]. Although these indicators can be used to accurately diagnose the state of anaerobic digestion, their detection often requires complex analytical processes and sophisticated equipment, which can complicate widespread implementation [16,17,18]. To address these challenges, researchers have sought techniques for evaluating the state of anaerobic digestion that are more straightforward and accessible [8,13]. One interesting approach that was recently proposed involves estimating the kinetic imbalance of anaerobic digestion based on the relationship between methanogenesis and acidogenesis rates [19]. While this approach has the advantage of being simple, it has the limitation of not being able to fully respond to subtle changes in kinetic imbalance that may occur under various conditions in anaerobic digestion, as it only reflects a few of the important factors involved in anaerobic digestion. The state of anaerobic digestion can be better assessed across various operating modes by analyzing all monitored data simultaneously. Principal component analysis (PCA) is a statistical technique that can be used for simplifying complex multidimensional data while uncovering underlying patterns and structures within the data [20,21,22]. So, PCA can be a useful tool for the comprehensive diagnosis of state changes within complex systems such as anaerobic digestion.
With this background, the present work focused on searching for an intuitive and comprehensive indicator that can be used to monitor the state of anaerobic digestion To begin, single and combined indicators were used to diagnose the state of anaerobic digestion under various operational modes, such as stepwise changes in the organic loading rate (OLR), interruption and resumption of substrate supply, and impulse OLRs. Next, the effectiveness and limitations of these indicators were critically evaluated. Then, as a new comprehensive indicator, this study examined fluctuations in time-series eigenvalues derived from principal component analysis (PCA), and it also proposed guidelines to be used in the diagnosis of the state of anaerobic digestion. The findings indicate that this innovative indicator could significantly enhance the consistency and stability of anaerobic digestion.
2. Materials and Methods
2.1. Setup and Operation of an Anaerobic Digester
A horizontal drum-type anaerobic digester (50 L) that featured a shaft equipped with a blade at the center was installed and wrapped with a heating coil to maintain a temperature of 35 °C. The feed substrate was created as a mixture of equal volumes of hydrothermally liquefied sludge and pulverized food waste. Co-anaerobic digestion of hydrothermal liquefied sludge and food waste is an anaerobic digestion method that has recently gained popularity due to its potential to maximize sludge reduction and increase biogas production. The hydrothermally liquefied sludge was prepared by treating waste-activated sludge obtained from a domestic wastewater treatment plant (Incheon, Republic of Korea) at 190 °C for 2 h. The food waste was collected from a university dining room, pulverized using a household blender, and sifted through a sieve. The hydrothermally liquefied sludge and pulverized food waste were stored separately in a refrigerator at 4 °C until use. The characteristics of the feed substrate have been thoroughly described in a prior study [19]. The main characteristics of the feed substrate are as follows: pH 5.73 ± 0.04, TVFA 3.30 ± 0.19 g HAc/L, TA 4.66 ± 0.53 g CaCO3/L, total solids (TS) 72.76 ± 1.74 g/L, volatile solids (VS) 56.27 ± 2.29 g/L, chemical oxygen demand (COD) 88.07 ± 6.68 g/L, and soluble chemical oxygen demand (SCOD) 47.79 ± 6.09 g/L. The seed sludge for the start-up of the anaerobic digester was sourced from an anaerobic digester in a water reclamation center (Busan, Republic of Korea).
After inoculating the seed sludge until it reached a steady state, the anaerobic digester was operated in start-up mode for 62 days, as detailed in the previous study [19]. During this period, the OLR was increased stepwise by adjusting the substrate supply rate (Figure 1). Subsequently, the anaerobic digester was operated in a steady-state mode until the 220th day by supplying the substrate at rates of 1.7 L/d or 2.2 L/d, which respectively correspond to hydraulic retention times (HRTs) of 30 and 20 days. On the 221st, 227th, and 239th days, experiments for weak impulse OLRs were conducted by increasing the substrate supply rates to 150%, 150%, and 200%, respectively, for a single day. Furthermore, the substrate supply was interrupted from the 259th day and resumed on the 278th day. The experiments for intensive impulse OLRs were conducted on the 300th and 340th days by increasing the substrate supply rates to 300% and 500% for a single day.
2.2. Single and Coupled Indicators for the AD State
During the operation of an anaerobic digester, various variables were monitored to assess the process, including pH, TA, TVFA, TS, VS, TCOD, SCOD, MPR, and CH4 (%), based on the biochemical reactions of the process. These variables were classified into four groups: (i) environmental variables (pH and TA); (ii) intermediate variables (TVFA and SCOD); (iii) organic residual variables (VS and COD); (iv) biogas variables (MPR and CH4 (%)). Each was selected as a single indicator to assess the state and performance of anaerobic digestion and was obtained using the following methods. A digestate sample was collected from the effluent line of the anaerobic digester daily, and its pH was measured using a pH meter (YSI 1200, Yellow Springs, OH, USA). The TVFA (g HAc/L) and TA (g CaCO3/L) were measured using the titration method [23]. Standard methods were used to analyze the other variables of the digestate, including the TS (g/L), vs. (g/L), COD (g/L), and SCOD (g/L). Biogas production was monitored daily using a wet gas meter (W-NK, Inagi-shi, Japan). The methane content in the biogas was analyzed by a gas chromatograph (Series 580, GawMac Instrument C., Bethlehem, PA, USA) equipped with a thermal conductivity detector and Porapak Q column (6ft × 1/8 in, SS). MPR (L/d) was calculated by multiplying the daily biogas production by CH4 (%). Furthermore, based on previous studies, these single indicators were combined to assess anaerobic digestion states that cannot be easily discerned from a single indicator alone [12,15,19]. The coupled indicators comprised the ratio of TVFA to TA, the ratio of the specific accumulation rate of TVFA relative to MPR, the ratio of CH4 (%) to CO2 (%) in the biogas (MC ratio), and an instability index (ISI). The ISI was defined as the difference between the acidogenesis rate (AR) and the methanogenesis rate (MR) relative to MR.
2.3. Principal Component Analysis for Comprehensive Indicators
The time-series data involved in the state and performance were normalized to have a mean of 0.0 and a variance of 1.0 using the StandardScaler function of the Scikit-learn library in Python. A sliding window algorithm having a window size of 3 was then used to transform the normalized data into 3D data with 2D datasets. PCA was implemented for the time-series 2D dataset using the PCA function of the decomposition module in the Scikit-learn library, with the parameter ‘n_components’ set to 2. Among the PCA attributes, the eigenvalues and eigenvectors were obtained from the ‘components_’ and ‘explained_variance_’ functions, respectively. The moving range, average, and standard deviation of the eigenvalues were calculated for each 2D data using the “max” and “min” functions of the numpy library in Python and the “mean” and “std” functions, respectively. The principal component (PC) score was obtained by multiplying the data in the time-series window by the eigenvectors corresponding to the PC of interest.
3. Results and Discussion
3.1. Single Indicators for the State of Anaerobic Digestion
The changes in the OLRs perturbed the kinetic balance of the anaerobic digestion state, and this was reflected in the individual state and performance variables. Thus, each state and performance variable can serve as a single indicator reflecting the state of anaerobic digestion [19]. The fluctuations in these single indicators depend on the changes in the OLRs and are also influenced by the history of changes in the anaerobic digestion state [4,10,24].
Start-up period: In the digestate, as the OLR increased stepwise, the biogas variables—including MPR and CH4 (%)—increased, while the organic residuals—such as vs. and COD—decreased progressively (Figure 2). In the intermediates, SCOD gradually decreased, while TVFA levels remained low. These observations suggest that during the start-up period under low OLR conditions, the acidogenesis of hydrolyzed monomers improved progressively, and the generated VFAs were converted into methane without delay. The increased OLR also raised the alkalinity, which buffered the pH to maintain it in the range of 7.5–8.0. The feed substrate, consisting of a mixture of hydrothermally liquefied sludge and pulverized food waste, contains a high organic nitrogen content. The observed increase in alkalinity with increasing OLR is likely attributed to the ammonia released from the acidogenesis of organic nitrogen in the feed substrate. In general, acidogenic bacteria and methanogenic archaea with different metabolic rates have different adaptation times to new environments [10,25]. The differences in the adaptation time between acidogenic bacteria and methanogenic archaea appear to have caused a kinetic imbalance in the anaerobic digestion process during the start-up period. The changes in the single indicators suggest that the anaerobic digestion process transitioned from an initial perturbed state to a stable state during the start-up period, thus indicating that the initial kinetic imbalance was effectively controlled by increasing the OLR stepwise.
Steady-state operation: Following the start-up period, the fluctuations in the organic residual variables were minor at the HRT of 30 days. Moreover, the alkalinity was sufficient to buffer the pH to the average of 7.58 [26], while the MPR and CH4 (%) were stable at approximately 24.76 L/d and 63.26%, respectively (Figure 2b,d). Interestingly, among intermediates, TVFA was consistently low at approximately 0.93 g HAc/L, which was only 61% of the SCOD of 1.52 g/L (Figure 2c). This suggests that the anaerobic digestion processes, including hydrolysis, acidogenesis, and methanogenesis, were well-balanced kinetically [3,7,8]. The change in HRT from 30 to 20 days increased the OLR, which increased the MPR to 34.46 L/d, while the other single indicators did not appear to show any fluctuations (Figure 2c). This indicates that the anaerobic digestion process was quite stable at an HRT of 30 days, and that it remained stable when the HRT was changed to 20 days.
Impulse OLRs of 200% or less: Applying weak impulse OLRs of 200% or less led to the appearance of some transient surges in hydrolysis and acidogenesis, as indicated by increases in intermediates, including SCOD and TVFA (Figure 2b,c). However, these surges quickly faded. There were slight changes in MPR and TA along with barely detectable changes in pH and CH4 (%). Impulse OLRs of 200% or less may cause transient kinetic imbalances in anaerobic digestion; the present findings suggest that such imbalances can be immediately rectified. Therefore, it can be concluded that the anaerobic digestion process was in a slightly perturbed state.
Interruption and resumption of substrate supply: When the substrate supply to anaerobic microorganisms is interrupted, the available substrates are gradually depleted, leading to reduced microbial activity and methane production [4,8,19]. This results in an altered balance of the microbial community, which makes it more susceptible to environmental changes and reduces its resilience [8,19]. During the interruption of substrate supply for 0.67 HRTs, there were no pronounced fluctuations in most single indicators. Although there were decreases in organic residuals and slight fluctuations in biogas variables, these were insufficient to accurately diagnose the state of anaerobic digestion. Researchers have suggested that when the substrate supply is interrupted, the state of anaerobic digestion can be better captured by additional indicators, such as changes in the microbial community or changes in the composition and concentration of intermediates such as VFAs [27,28].
Interestingly, when the substrate supply was resumed, there were significant increases in the environmental variables (pH and TA), intermediates variables (TVFA and SCOD), and organic residual variables (VS and COD). However, there were also slight decreases in the biogas variables, including MPR and CH4 (%), along with increased variability. Moreover, acidogenic bacteria and methanogenic archaea have differing abilities to recover from decreased activity [8]. This suggests that the sudden resumption of substrate supply after the interruption significantly perturbed the kinetic balance in the anaerobic digestion process.
Strong impulse OLRs of 300% or more: After applying an impulse OLR of 300%, the single indicators showed complex responses. TVFA was accumulated and reached up to 6.59 g HAc/L; concurrently, there was a temporary dip in the alkalinity and pH levels, both of which later increased significantly. Meanwhile, the levels of the organic residuals, including vs. and COD, consistently rose, while MPR and CH4 (%) significantly fluctuated over time. Altogether, these results suggest that excess supply of the substrate leads to accumulations of the intermediates, such as SCOD and VFAs. These accumulations further inhibit methanogenesis, thereby perturbing the kinetic balance of the anaerobic digestion process. However, after 0.4 HRT, there was also a notable increase in the MPR and a decrease in TVFA. This demonstrates the unique characteristic of methanogen archaea, in that they can even adapt to high VFA concentrations. It should be noted that the inhibitory effect of VFAs on these archaea may not be significant at pH levels above 7 [29,30]. It is likely that prolonged exposure to elevated concentrations of TVFA caused the dominant species within the methanogenic archaea community to shift toward those with a higher metabolic rate. Notably, within the acetoclastic methanogenic archaea, while the genus Methanosaeta is known for its higher substrate affinity, the genus Methanosarcina, which is another group of methanogenic archaea, exhibits a faster metabolic rate [31,32].
An intensive impulse OLR of 500% led to further increases in intermediate variables. Specifically, TVFA levels surged to 8.35 g HAc/L, which was only about 25% of SCOD. Moreover, organic residual levels, including vs. and COD, increased, while MPR and CH4 (%) decreased. These changes indicate that both acidogenesis and methanogenesis processes were heavily perturbed. However, the overall anaerobic digestion process was not completely disrupted, as the high alkalinity buffered the pH above 7.0. After the anaerobic digester was operated for approximately 0.87 HRT, the VFA levels gradually decreased, thereby improving the conversion of organic matter to methane. Despite this improvement, the variability in biogas variables such as MPR and CH4 (%), remained high, and the instability of the anaerobic digestion process persisted, as it did not fully recover even after extended operation for about three HRT periods, thereby indicating that the state was heavily perturbed.
Individual single indicators provide partial clues about the kinetic imbalance of anaerobic digestion, but they do not offer comprehensive insight into the instability of the overall anaerobic digestion process. It appears to be the case that the state of anaerobic digestion could be diagnosed more accurately from the fluctuations and correlations for multiple single indicators.
3.2. Coupled Indicators for the State of Anaerobic Digestion
Coupled indicators, which are combinations of single indicators, offer a more comprehensive understanding of the anaerobic digestion process, revealing insights that may otherwise be overlooked when using single indicators [14,16,18]. The coupled indicators that have been examined to this point include the accumulation rate of TVFA relative to MPR, the ratio of TFVA to TA, the ratio of methane content to carbon dioxide in biogas (MC ratio), and the ratio of the difference between acidogenesis rate (AR) and methanogenesis rate (MR) to the MR, as has been previously reported in the literature [12,15,19]. The ratio of TVFA to TA reflects the buffering capacity against pH drops [33,34]. In a kinetically balanced anaerobic digestion, the ratio of TVFA to TA is typically below 0.4 [35,36]. If this ratio rises above 1.0, it suggests the presence of an accumulation of VFAs, which can potentially lead to a pH drop and an unstable state of anaerobic digestion [37]. Throughout the operation of the anaerobic digester from the start-up to the steady state, the ratio of TVFA to TA remained stable at an average of around 0.10. In response to impulse OLRs not exceeding 200%, it exhibited only minor transient increases to about 0.17 (Figure 3a). However, the ratio of TVFA to TA did not capture various changes that are detectable by single indicators, particularly during the start-up period. After the interrupted substrate supply was resumed, or when a high impulse OLR of 300% or more was applied, single indicators pointed to a notable kinetic imbalance in the anaerobic digestion process. Crucially, the ratio of TVFA to TA was less than 0.89, which was beneath the known instability threshold value of 1.0. It appears to be the case that the ratio of TVFA to TA can vary based on substrate characteristics, the process type, and the operational conditions [11,14]. While the ratio of TVFA to TA serves as a coupled indicator that offers useful insights into the state of anaerobic digestion, it is important to recognize that its use as a universal indicator for process instability is constrained by various variable determinants [33,35,36].
The specific accumulation rate of TVFA relative to MPR could serve as another coupled indicator for a perturbation in anaerobic digestion [15]. This specific accumulation rate of TVFA significantly fluctuated with changes in OLR throughout the whole operation of the anaerobic digester (Figure 3b). During the start-up period, the specific accumulation rate of TVFA varied slightly within a range of −2.23~2.76, and it was relatively stable until an impulse OLR of 200% was applied. However, with the resumption of substrate supply and impulse OLRs of 300% or more, the specific accumulation rate of TVFA markedly fluctuated within ranges of −4.29 to 4.09. These results suggest that variability in the specific accumulation rate of TVFA represents changes in the kinetic balance of anaerobic digestion processes and is related to the magnitude of impulse OLR [8,15]. However, the changes in the state of anaerobic digestion during the interruption of substrate supply were not properly reflected in the specific accumulation rate of TVFA. Further, the MPR is highly dependent on methane yield, which varies according to the substrate or process types [14,27]. Taken together, these relationships suggest that the specific accumulation rate of TVFA is a reasonable coupled indicator for an anaerobic digestion state, but that it is subject to being biased by the history of the previous state of anaerobic digestion. Therefore, it is difficult to provide a quantitative explanation for the instability of anaerobic digestion using only the specific accumulation rate of TVFA.
The MC ratio can also be used as a coupled indicator for the instability of anaerobic digestion [14,38]. During the start-up period, as the OLR was increased stepwise, the MC ratio increased from 0.64 to 1.98. The MC ratio remained stable at an average of 1.87 when the anaerobic digestion state reached a stable state at HRTs of 20 days and 30 days. The behaviors of the MC ratio with OLR were consistent with the increases in the gaseous single indicators, MPR and CH4 (%). At impulse OLRs up to 200%, the MC ratio was at an average value of 1.84, which was similar to the value observed during the steady state, thus indicating that the anaerobic digestion process was quite stable. Nonetheless, there was a slight uptick in the fluctuation of the MC ratio, which reflected the marginal response of the microbial community to the small impulse OLRs. Although this increased fluctuation did not significantly alter the average MC ratio, it could suggest the beginning of a stress response in the microbial ecosystem, which hints at its limits in handling OLR increments without causing substantial perturbations to the process stability. The MC ratio fluctuated significantly after the interruption and subsequent resumption of substrate supply, particularly following high impulse OLRs of 300% or more. These considerable shifts in OLR may lead to a kinetic imbalance in the anaerobic digestion process. The wide range of the MC ratio from 0.63 to 3.95 reflects the intense response of the anaerobic microbial community to these changes (Figure 3c). Previous research has suggested that an MC ratio below 1.2 serves as an early warning of potential kinetic imbalances in the anaerobic digestion process [12,39]. However, the MC ratio is not a definitive measure, as it is affected by variables such as the type of substrate used and the pH-dependent solubility of carbon dioxide. These factors imply that the MC ratio can act as an indicative but not exclusive measure of the kinetic imbalance in the anaerobic digestion process when considering certain constraints [11,14,40].
The instability index (ISI), which is defined as the difference between acidogenesis rate (AR) and methanogenesis rate (MR) relative to MR, can also serve as a coupled indicator that is useful in reflecting the instability of anaerobic digestion [19]. The pattern of ISI fluctuations that occurred in response to variations in OLR was similar to the specific accumulation rate of VFA across various operational modes. During the initial startup period, there were minor fluctuations in the ISI, which signaled a slightly perturbed state of the anaerobic digestion process. The subsequent stable ISI was indicative of the fact that the process reached a steady state (Figure 3d). Moreover, following the abrupt resumption of substrate supply and impulse OLRs of 300% or more, significant and repeated peaks were noted in the ISI. These peaks suggest that the anaerobic digestion process was substantially perturbed. However, the ISI only reflects changes in the MR and AR. Thus, the ISI had limitations in monitoring minor perturbations that occurred after applying small impulse OLRs of less than 200% or after interrupting the substrate supply.
3.3. Comprehensive Indicators Based on PCA
The eigenvalues reflect the extent of variance in the data along the principal axes identified by PCA, and eigenvectors indicate the direction of this variance [20,21]. When PCA was applied to the monitored data from the anaerobic digester, the eigenvalues rapidly fluctuated over time (Figure 4a), which might reflect comprehensive changes in the state of anaerobic digestion [18,21]. The first principal component (PC1) explained up to 85.6% of the total variance in the state and performance data, while the second principal component (PC2) only accounted for 14.1% of the total variance. At the beginning of the anaerobic digester operation, the eigenvalue for the PC1 was quite high, at 3.55 (Table 1). However, as the OLR was increased stepwise, the eigenvalues gradually decreased, with small fluctuations, and they eventually stabilized at a low value. This trend in eigenvalues implies that the start-up of anaerobic digestion was smooth [8]. Therefore, if even a large eigenvalue of 3 or more continues to decrease, it can be considered to be the case that a slightly perturbed state was gradually improved. This demonstrates that the eigenvalues effectively capture the transition from the slight initial perturbed state to the steady state of anaerobic digestion during the start-up period.
When subjected to small impulse OLRs of 200% or less, the eigenvalues exhibited single peaks of 2.47 or less. This indicates that the eigenvalues accurately reflect the transient kinetic imbalance caused by small external disturbances in anaerobic digestion. However, while the substrate supply was interrupted for 0.67 HRT, small eigenvalue peaks below 1.28 were observed, which is a feature that is distinct from the steady state. This suggests that, compared to other single or coupled indicators, the time-series fluctuation of the eigenvalue more accurately reflects changes in the instability of anaerobic digestion when the available substrate was depleted.
However, after resuming the substrate supply, the eigenvalues showed repeated large peaks, as they reached a maximum value of 4.39 and had an average value of 1.37. This pattern suggests that the abrupt resumption of the substrate supply induced kinetic imbalances, which led to increased variability in the state and performance variables, thereby implying an instability of anaerobic digestion [7,41,42]. Similar patterns were observed following the application of a high impulse OLR of 300%, with eigenvalue peaks less than 5.81 over a short term of 0.5 HRTs and an average peak value of 2.18. These patterns indicate a considerable perturbation in the kinetic balance of anaerobic digestion. However, the fluctuations in the eigenvalue were greatly reduced from 0.5 HRTs, and small repeated peaks appeared, suggesting that the kinetic imbalance was improved.
Interestingly, after applying an intensive impulse OLR of 500%, the eigenvalue peaks reached a maximum of 4.70, which was surprisingly lower than that observed at the impulse OLR of 300%. Moreover, large fluctuations in eigenvalues persisted for extended periods of 3 HRTs, and there was a slight decrease in the maximum peak of eigenvalues. This intensive impulse OLR led to a severe and prolonged perturbation in the kinetic balance of the anaerobic digestion process, as measured by a single indicator. The hysteresis phenomenon in anaerobic digestion also appears to be reflected in the fluctuations in the time-series eigenvalues. Therefore, it is worth noting that, when diagnosing the kinetic instability of anaerobic digestion with the behaviors of eigenvalues, it is important to consider not only the magnitude of eigenvalue fluctuations but also their sustained repetitiveness. These results suggest that fluctuations in time-series eigenvalues are a valuable tool for comprehensive diagnosis of the anaerobic digestion state. This is particularly useful under various conditions, even for those without in-depth knowledge of the correlation between single and coupled indicators.
The eigenvectors, which indicate the direction of variance that the eigenvalues contribute to the data, exhibited substantial repeated fluctuations between −1.0 and +1.0 (Figure 5). However, the fluctuations in these eigenvectors in response to changes in OLR varied depending on each state and performance variable. During the entire period of anaerobic digester operation, fluctuations in eigenvectors that were considered to be related to changes in OLR were observed in both PC1 and PC2 for alkalinity, TVFA, and SCOD. However, among the state and performance variables, while the eigenvector for CH4 (%) fluctuated significantly and there were substantial fluctuations in MPR, pH, VS, and COD, these did not have a large direct correlation with changes in OLR. The eigenvectors can identify variables that are sensitive to the kinetic imbalance of anaerobic digestion, but their correlations are expected to vary depending on the history of changes in the anaerobic digestion state.
The PC score is a value representing a weighted sum of the data projected onto the principal component axes [18,22]. The time series PC scores that appeared in response to changes in OLRs were similar to the eigenvalues (Figure 4b). However, at a steady state, the fluctuation in PC scores was consistent but relatively large in amplitude; by contrast, compared to the eigenvalue, the response of PC scores to impulse OLRs was relatively small in magnitude (Table 1). If preprocessed using a method such as a log scaling to amplify the impact of severe kinetic imbalances and reduce the magnitude of fluctuations under a steady state, the PC score can serve as another effective comprehensive indicator of the anaerobic digestion state.
3.4. Implications
Anaerobic digestion is frequently subject to external perturbations, including sudden changes in hydraulic and organic loads, fluctuations in temperature, and exposure to toxic substances [14,15,43]. Methanogenic archaea metabolize more slowly than acidogenic bacteria, and their metabolic rates are more sensitive to environmental changes [7,8,9]. Hence, methanogenesis cannot respond to external perturbations as quickly as hydrolysis or acidogenesis. The influence of external perturbations on the kinetic balance in the anaerobic digestion process can be observed through fluctuations in performance and state variables [8,43]. Kinetic imbalances can destabilize the anaerobic digestion process [44,45]. If exacerbated, such instability can lead to failure in overall anaerobic digestion, but it can be quickly restored to its normal state using simple measures in the early stages, such as controlling the hydraulic or organic loads and supplementing the alkalinity [37]. Therefore, real-time monitoring of the instability of the anaerobic digestion process is essential for operating anaerobic digesters.
Until now, the instability of anaerobic digestion has primarily been assessed using single indicators based on state and performance variables, or coupled indicators of these single indicators. Nevertheless, the response of each state and performance variable can differ based on the type and intensity of the disturbance. These responses are also influenced by factors such as the type of substrate and process, as well as the operating conditions. Moreover, the hysteresis phenomena—which is influenced by the history of prior anaerobic digestion states—may be reflected in these responses. Therefore, significant expertise was required to assess the state of anaerobic digestion from single indicators [46,47]. Coupled indicators such as TVFA to TA ratio, specific VFA accumulation rate, MC ratio, and the ratio of VFA accumulation to AR are more informative in assessing instability [14,15,16]. However, as previously reported coupled indicators are only based on two or three variables, there are limits to their generalizability for diagnosing the instability of anaerobic digestion under various conditions [13,16,38].
The instability of anaerobic digestion can be better diagnosed by interpreting all monitoring variables comprehensively. PCA is a useful tool for creating composite scores, such as eigenvalues or PC scores, by considering variable contributions to variance [20,21,22]. Monitoring state and performance variables over time and analyzing them with PCA allowed the identification of anaerobic digestion states across different operational modes, such as start-up, substrate supply interruption and resumption, and various impulse OLRs, based on eigenvalue fluctuations.
The state of anaerobic digestion can be summarized based on the range, average, and pattern of the fluctuations in eigenvalues obtained from PCA for the monitored variables in various operational modes of the anaerobic digester. As detailed in Table 2, these are as follows: (i) Stable state: the eigenvalues are stable over time, with the peaks remaining below 1.0 with an average below 0.2. This indicates that the anaerobic digestion processes are kinetically well-balanced. (ii) Slightly perturbed state: the eigenvalue peaks continuously decrease from below 4.0, with an average of less than 0.6. This is typically observed during the initial start-up period of anaerobic digesters, and it indicates that the anaerobic digestion process is slightly disturbed, but the start-up operations can continue carefully in the same manner. Moreover, there may be a single eigenvalue peak below 3.0 or smaller, but there may also be recurring small peaks with an average below 0.6. This suggests a state in which the anaerobic digestion process is slightly disturbed but can easily restore its kinetic balance. (iii) Perturbed state: the presence of repeated eigenvalue peaks over 3.0, along with an average greater than 0.6 for a short period within 0.5 HRTs, indicates that the kinetic balance of the anaerobic digestion process is perturbed. If additional external disturbances are applied to this state, the instability of anaerobic digestion can easily worsen, thus necessitating active intervention to restore the kinetic balance. (iv) Severely perturbed state: the presence of repeated peaks over 3.0 for a period longer than 1.0 HRT, along with an average of eigenvalues greater than 0.6, indicate a severely perturbed state. This state suggests that the kinetic imbalance in the anaerobic digestion process is intensified, which could potentially lead to a high risk of process failure.
This approach of diagnosing anaerobic digestion stability through the dynamic behavior of eigenvalues, which is derived from PCA of routinely monitored state and performance variables, can be effectively applied in the operation of anaerobic digesters. However, the reliability of this method may vary if the available variables, such as pH, alkalinity, intermediates, organic residuals, and biogas production, do not adequately reflect the instability of the anaerobic digestion process, as indicated by the eigenvectors. Such eigenvalue-based comprehensive indicators, relying on the variability of various state and performance variables, are expected to apply to various types of anaerobic digesters. However, it should be noted that the criteria for magnitude, average, and dynamic behaviors of the eigenvalues may be varied from those presented in Table 2. Therefore, further validation for this approach is imperative to augment the accuracy and reliability of this approach, particularly when confronted with the intricacies of real-world scenarios and the myriad of operating modes for different types of anaerobic digesters. Nonetheless, it is worth noting that this method has outstanding adaptability and utility in diagnosing the instability of anaerobic digestion.
Recent years have seen notable advancements in techniques for monitoring operational full-scale digesters, including the use of deep learning and electrochemical sensors [14,38,48]. These technologies enable the prediction of state and performance variables and offer alternatives to traditional wet analysis, thus simplifying the monitoring process. For instance, electrochemical sensors provide real-time data on crucial parameters including pH, electric conductivity, and oxidation-reduction potential [1,19]. Further, data-driven models, such as a combined model of convolutional neural network as well as long- and short-term memory, can be used to process sensor data to extract meaningful insights about the state of anaerobic digestion [1,48]. The combination of these technologies with PCA-based diagnostics could lead to comprehensive indicators that not only offer real-time monitoring but also serve as early warning systems to help prevent failures in anaerobic digestion processes. It is expected to be crucial to integrate these techniques with PCA in the future to enhance the stability and efficiency of anaerobic digesters, which could potentially revolutionize their operation and control.
4. Conclusions
A pioneering approach has been proposed for robustly assessing the stability of anaerobic digestion processes, which are based on the dynamic behavior of eigenvalues obtained through the application of principal component analysis (PCA) for the state and performance variables in anaerobic digestion. This innovative method offers a superior means of comprehensively diagnosing anaerobic digestion states across a spectrum of operational modes, with the potential to significantly bolster the stability of the anaerobic digestion processes. While further validation is essential to enhance accuracy and reliability, especially in the face of complex real-world conditions and diverse operating modes, this approach exhibits remarkable versatility. By concurrently considering time series variations across a multitude of variables monitored in anaerobic digestion, the dynamic behavior of time series eigenvalue holds the promise of comprehensive diagnosis and enhancement of process stability. This groundbreaking approach, rooted in the analysis of time series eigenvalue for state and performance variables, would contribute to the assessment and improvement of anaerobic digestion process stability.
Author Contributions
Conceptualization, Y.-C.S., R.J., Z.A., K.K., C.-Y.L. and B.-U.B.; methodology, Y.-C.S. and R.J.; software, Y.-C.S., R.J. and Z.A.; validation, Y.-C.S. and R.J.; formal analysis, Y.-C.S., R.J. and K.K.; investigation, Y.-C.S. and C.-Y.L.; resources, Y.-C.S. and B.-U.B.; data curation, R.J.; writing—original draft preparation, Y.-C.S. and R.J.; writing—review and editing, Y.-C.S. and R.J.; visualization, Y.-C.S.; supervision, Y.-C.S.; project administration, Y.-C.S.; funding acquisition, Y.-C.S. All authors have read and agreed to the published version of the manuscript.
Funding
This work was supported by the National Research Foundation of Korea (NRF) grant funded by the Korean government (MIST) (NRF-2022R1A2C1009440).
Data Availability Statement
Data are contained within the article.
Conflicts of Interest
The authors declare no conflicts of interest.
References
- Jia, R.; Song, Y.C.; Piao, D.M.; Kim, K.; Lee, C.Y.; Park, J. Exploration of deep learning models for real-time monitoring of state and performance of anaerobic digestion with online sensors. Bioresour. Technol. 2022, 363, 127908. [Google Scholar] [CrossRef] [PubMed]
- Feng, Q.; Song, Y.C.; Yoo, K.; Kuppanan, N.; Subudhi, S.; Lal, B. Polarized electrode enhances biological direct interspecies electron transfer for methane production in upflow anaerobic bioelectrochemical reactor. Chemosphere 2018, 204, 186–192. [Google Scholar] [CrossRef] [PubMed]
- Feng, Q.; Song, Y.C.; Kim, D.H.; Kim, M.S.; Kim, D.H. Influence of the temperature and hydraulic retention time in bioelectrochemical anaerobic digestion of sewage sludge. Int. J. Hydrog. Energy 2019, 44, 2170–2179. [Google Scholar] [CrossRef]
- Li, L.; He, Q.; Ma, Y.; Wang, X.; Peng, X. A mesophilic anaerobic digester for treating food waste: Process stability and microbial community analysis using pyrosequencing. Microb. Cell Factories 2016, 15, 65. [Google Scholar] [CrossRef] [PubMed]
- Vavilin, V.A.; Fernandez, B.; Palatsi, J.; Flotats, X. Hydrolysis kinetics in anaerobic degradation of particulate organic material: An overview. Waste Manag. 2008, 28, 939–951. [Google Scholar] [CrossRef]
- Yang, C.; Wu, H.; Cai, M.; Zhou, Y.; Guo, C.; Han, Y.; Zhang, L. Valorization of Biomass-Derived Polymers to Functional Biochar Materials for Supercapacitor Applications via Pyrolysis: Advances and Perspectives. Polymers 2023, 15, 2741. [Google Scholar] [CrossRef]
- Peces, M.; Astals, S.; Jensen, P.D.; Clarke, W.P. Deterministic mechanisms define the long-term anaerobic digestion microbiome and its functionality regardless of the initial microbial community. Water Res. 2018, 141, 366–376. [Google Scholar] [CrossRef]
- Jiang, M.; Qiao, W.; Wang, Y.; Zou, T.; Lin, M.; Dong, R. Balancing acidogenesis and methanogenesis metabolism in thermophilic anaerobic digestion of food waste under a high loading rate. Sci. Total Environ. 2022, 24, 153867. [Google Scholar] [CrossRef]
- Li, L.; Peng, X.; Wang, X.; Wu, D. Anaerobic digestion of food waste: A review focusing on process stability. Bioresour. Technol. 2018, 48, 20–28. [Google Scholar] [CrossRef]
- Li, L.; He, Q.; Ma, Y.; Wang, X.; Peng, X. Dynamics of microbial community in a mesophilic anaerobic digester treating food waste: Relationship between community structure and process stability. Bioresour. Technol. 2015, 189, 113–120. [Google Scholar] [CrossRef]
- Ajayi-Banji, A.; Rahman, S. A review of process parameters influence in solid-state anaerobic digestion: Focus on performance stability thresholds. Renew. Sustain. Energy Rev. 2022, 67, 112756. [Google Scholar] [CrossRef]
- Li, D.; Ran, Y.; Chen, L.; Cao, Q.; Li, Z.; Liu, X. Instability diagnosis and syntrophic acetate oxidation during thermophilic digestion of vegetable waste. Water Res. 2018, 139, 263–271. [Google Scholar] [CrossRef] [PubMed]
- Ren, Y.; Wang, C.; He, Z.; Qin, Y.; Li, Y.Y. Biogas production performance and system stability monitoring in thermophilic anaerobic co-digestion of lipids and food waste. Bioresour. Technol. 2022, 358, 127432. [Google Scholar] [CrossRef] [PubMed]
- Wu, D.; Li, L.; Peng, Y.; Yang, P.; Peng, X.; Sun, Y.; Wang, X. State indicators of anaerobic digestion: A critical review on process monitoring and diagnosis. Renew. Sustain. Energy Rev. 2021, 148, 111260. [Google Scholar] [CrossRef]
- Dong, F.; Zhao, Q.B.; Li, W.W.; Sheng, G.P.; Zhao, J.B.; Tang, Y.; Yu, H.Q.; Kubota, K.; Li, Y.Y.; Harada, H. Novel online monitoring and alert system for anaerobic digestion reactors. Environ. Sci. Technol. 2011, 45, 9093–9100. [Google Scholar] [CrossRef] [PubMed]
- Sun, H.; Ni, P.; Angelidaki, I.; Dong, R.; Wu, S. Exploring stability indicators for efficient monitoring of anaerobic digestion of pig manure under perturbations. Waste Manag. 2019, 91, 139–146. [Google Scholar] [CrossRef] [PubMed]
- Wu, D.; Li, L.; Zhen, F.; Liu, H.; Xiao, F.; Sun, Y.; Peng, X.; Li, Y.; Wang, X. Thermodynamics of volatile fatty acid degradation during anaerobic digestion under organic overload stress: The potential to better identify process stability. Water Res. 2022, 214, 118187. [Google Scholar] [CrossRef]
- Awhangbo, L.; Bendoula, R.; Roger, J.M.; Béline, F. Detection of early imbalances in semi-continuous anaerobic co-digestion process based on instantaneous biogas production rate. Water Res. 2020, 171, 115444. [Google Scholar] [CrossRef]
- Jia, R.; Song, Y.-C.; An, Z.; Kim, K.; Oa, S.-W. Unraveling Anaerobic Digestion Instability: A Simple Index Based on the Kinetic Balance of Biochemical Reactions. Processes 2023, 11, 2852. [Google Scholar] [CrossRef]
- Yu, J. Local and global principal component analysis for process monitoring. J. Process Control 2012, 22, 1358–1373. [Google Scholar] [CrossRef]
- Kim, M.; Chul, P.; Kim, W.; Cui, F. Application of data smoothing and principal component analysis to develop a parameter ranking system for the anaerobic digestion process. Chemosphere 2022, 299, 134444. [Google Scholar] [CrossRef] [PubMed]
- Castura, J.C.; Varela, P.; Næs, T. Investigating paired comparisons after principal component analysis. Food Qual. Prefer. 2023, 106, 104814. [Google Scholar] [CrossRef]
- Anderson, G.K.; Yang, G. Determination of bicarbonate and total volatile acid concentration in anaerobic digesters using a simple titration. Water Environ. Res. 1992, 64, 53–59. [Google Scholar] [CrossRef]
- Nguyen, D.; Gadhamshetty, V.; Nitayavardhana, S.; Khanal, S.K. Automatic process control in anaerobic digestion technology: A critical review. Bioresour. Technol. 2015, 193, 513–522. [Google Scholar] [CrossRef] [PubMed]
- De la Rubia, M.A.; Riau, V.; Raposo, F.; Borja, R. Thermophilic anaerobic digestion of sewage sludge: Focus on the influence of the start-up. A review. Crit. Rev. Biotechnol. 2013, 33, 448–460. [Google Scholar] [CrossRef] [PubMed]
- Jantsch, T.G.; Mattiasson, B. An automated spectrophotometric system for monitoring buffer capacity in anaerobic digestion processes. Water Res. 2004, 38, 3645–3650. [Google Scholar] [CrossRef] [PubMed]
- Wu, D.; Peng, X.; Li, L.; Yang, P.; Peng, Y.; Liu, H.; Wang, X. Commercial biogas plants: Review on operational parameters and guide for performance optimization. Fuel 2021, 303, 121282. [Google Scholar] [CrossRef]
- Steinberg, L.M.; Regan, J.M. Phylogenetic comparison of the methanogenic communities from an acidic, oligotrophic fen and an anaerobic digester treating municipal wastewater sludge. Appl. Environ. Microbiol. 2008, 74, 6663–6671. [Google Scholar] [CrossRef]
- Kim, I.S.; Hwang, M.H.; Jang, N.J.; Hyun, S.H.; Lee, S.T. Effect of low pH on the activity of hydrogen utilizing methanogen in bio-hydrogen process. Int. J. Hydrogen Energy 2004, 29, 1133–1140. [Google Scholar] [CrossRef]
- Wang, Y.; Zhang, Y.; Wang, J.; Meng, L. Effects of volatile fatty acid concentrations on methane yield and methanogenic bacteria. Biomass Bioenergy 2009, 33, 848–853. [Google Scholar] [CrossRef]
- Guo, X.; Wang, C.; Sun, F.; Zhu, W.; Wu, W. A comparison of microbial characteristics between the thermophilic and mesophilic anaerobic digesters exposed to elevated food waste loadings. Bioresour. Technol. 2014, 152, 420–428. [Google Scholar] [CrossRef] [PubMed]
- Wang, Y.N.; Wang, Q.; Li, Y.; Wang, H.; Gao, Y.; Sun, Y.; Wang, B.; Bian, R.; Li, W.; Zhan, M. Impact of incineration slag co-disposed with municipal solid waste on methane production and methanogens ecology in landfills. Bioresour. Technol. 2023, 377, 128978. [Google Scholar] [CrossRef] [PubMed]
- Li, L.; He, Q.; Wei, Y.; He, Q.; Peng, X. Early warning indicators for monitoring the process failure of anaerobic digestion system of food waste. Bioresour. Technol. 2014, 171, 491–494. [Google Scholar] [CrossRef] [PubMed]
- Abd Nasir, M.A.; Jahim, J.M.; Abdul, P.M.; Silvamany, H.; Maaroff, R.M.; Yunus, M.F.M. The use of acidified palm oil mill effluent for thermophilic biomethane production by changing the hydraulic retention time in anaerobic sequencing batch reactor. Int. J. Hydrogen Energy 2019, 44, 3373–3381. [Google Scholar] [CrossRef]
- Aromolaran, A.; Sartaj, M.; Abdallah, M. Supplemental Sewage Scum and Organic Municipal Solid Waste Addition to the Anaerobic Digestion of Thickened Waste Activated Sludge: Biomethane Potential and Microbiome Analysis. Fermentation 2023, 9, 237. [Google Scholar] [CrossRef]
- Li, W.; Khalid, H.; Zhu, Z.; Zhang, R.; Liu, G.; Chen, C.; Thorin, E. Methane production through anaerobic digestion: Participation and digestion characteristics of cellulose, hemicellulose and lignin. Appl. Energy 2018, 226, 1219–1228. [Google Scholar] [CrossRef]
- Kafle, G.K.; Kim, S.H. Sludge exchange process on two serial CSTRs anaerobic digestions: Process failure and recovery. Bioresour. Technol. 2011, 102, 6815–6822. [Google Scholar] [CrossRef]
- Zou, J.; Nie, E.; Lü, F.; Peng, W.; Zhang, H.; He, P. Screening of early warning indicators for full-scale dry anaerobic digestion of household kitchen waste. Environ. Res. 2022, 214, 114136. [Google Scholar] [CrossRef]
- Li, D.; Chen, L.; Liu, X.; Mei, Z.; Ren, H.; Cao, Q.; Yan, Z. Instability mechanisms and early warning indicators for mesophilic anaerobic digestion of vegetable waste. Bioresour. Technol. 2017, 245, 90–97. [Google Scholar] [CrossRef]
- Wu, D.; Li, L.; Zhao, X.; Peng, Y.; Yang, P.; Peng, X. Anaerobic digestion: A review on process monitoring. Renew. Sustain. Energy Rev. 2019, 103, 1–12. [Google Scholar] [CrossRef]
- Maspolim, Y.; Zhou, Y.; Guo, C.; Xiao, K.; Ng, W.J. Determination of the archaeal and bacterial communities in two-phase and single-stage anaerobic systems by 454 pyrosequencing. J. Environ. Sci. 2015, 36, 121–129. [Google Scholar] [CrossRef] [PubMed]
- Hao, X.; Liu, R.; van Loosdrecht, M.C.; Cao, D. Batch influences of exogenous hydrogen on both acidogenesis and methanogenesis of excess sludge. Chem. Eng. J. 2017, 317, 544–550. [Google Scholar] [CrossRef]
- Dupla, M.; Conte, T.; Bouvier, J.C.; Bernet, N.; Steyer, J.P. Dynamic evaluation of a fixed bed anaerobic digestion process in response to organic overloads and toxicant shock loads. Water Sci. Technol. 2004, 49, 61–68. [Google Scholar] [CrossRef] [PubMed]
- Chen, Y.; Qin, Z.; Zhang, P.; Li, X.; Feng, L. Polycyclic aromatic hydrocarbons stimulate acidogenesis, acetogenesis and methanogenesis during anaerobic co-digestion of waste activated sludge and food waste. Bioresour. Technol. 2022, 360, 127567. [Google Scholar] [CrossRef]
- Meegoda, J.N.; Li, B.; Patel, K.; Wang, L.B. A review of the processes, parameters, and optimization of anaerobic digestion. Int. J. Environ. Res. Public Health 2018, 15, 2224. [Google Scholar] [CrossRef]
- Paranjpe, A.; Saxena, S.; Jain, P. A Review on Performance Improvement of Anaerobic Digestion Using Co-Digestion of Food Waste and Sewage Sludge. J. Environ. Manag. 2023, 338, 117733. [Google Scholar] [CrossRef]
- Lü, F.; Chen, W.; Duan, H.; Zhang, H.; Shao, L.; He, P. Monitor process state of batch anaerobic digestion in reliance on volatile and semi-volatile metabolome. Bioresour. Technol. 2022, 351, 126953. [Google Scholar] [CrossRef]
- McCormick, M.; Villa, A.E. LSTM and 1-D convolutional neural networks for predictive monitoring of the anaerobic digestion process. In Artificial Neural Networks and Machine Learning–ICANN 2019: Workshop and Special Session; ICAN, Lecture Notes in Computer Science; Springer: Cham, Switzerland, 2019; Volume 11731, pp. 725–736. [Google Scholar] [CrossRef]
Figure 1.
Changes in (a) substrate supply rate (Q) and (b) organic loading rate (OLR) during anaerobic digester operation.
Figure 1.
Changes in (a) substrate supply rate (Q) and (b) organic loading rate (OLR) during anaerobic digester operation.

Figure 2.
Behaviors of the single indicators for the anaerobic digestion state depending on the OLR: (a) environmental variables: pH and total alkalinity (TA); (b) intermediate variables: total volatile fatty acids (TVFA) and soluble chemical oxygen demand (SCOD); (c) organic residual variables: volatile solids (VS) and chemical oxygen demand (COD); (d) biogas variables: methane production rate (MPR) and methane content (CH4 (%)).

Figure 3.
Fluctuations in coupled indicators for the state of anaerobic digestion depending on the change in organic loading rate (OLR): (a) ratio of total volatile fatty acids (TVFA) to total alkalinity (TA); (b) specific accumulation rate of total volatile fatty acids (TVFA) relative to methane production rate (MPR); (c) ratio of methane content to carbon dioxide in biogas (MC ratio); (d) instability index (ISI) of anaerobic digestion.

Figure 4.
Fluctuations in the (a) eigenvalues and (b) principal components (PC) scores over time depending on the change in organic loading rate (OLR).
Figure 4.
Fluctuations in the (a) eigenvalues and (b) principal components (PC) scores over time depending on the change in organic loading rate (OLR).

Figure 5.
Fluctuations in eigenvectors over time depending on changes in organic loading rate (OLR) in the anaerobic digester: (a) total alkalinity (TA) for principal component 1 (PC1) and principal component 2 (PC2); (b) total volatile fatty acids (TVFA) for PC1 and PC2; (c) soluble chemical oxygen demand (SCOD) for PC1 and PC2; (d) methane production rate (MPR) and methane content (CH4(%)) for PC1.


Table 1.
Summary of single indicators and comprehensive indicators under different anaerobic digestion conditions.
Table 1.
Summary of single indicators and comprehensive indicators under different anaerobic digestion conditions.
| Operational Modes | Single Indicators | Comprehensive Indicators | |||
|---|---|---|---|---|---|
| Eigenvalues | PC Score Range | State | |||
| Range /Average | Trends | ||||
| Start-up | Decreases in vs. and COD; low SCOD, TVFA; increases in MPR and CH4 (%) | 0.01~3.55 /0.47 | Decrease | −0.62~2.17 | Slightly disturbed |
| Steady-state | Stable for all single indicators | 0.02~0.52 /0.15 | Stable | −0.65~0.73 | Stable |
| Impulse OLRs (<200%) | Small fluctuations in SCOD, TVFA, MPR, and TA | 0.07~2.47 /0.44 | Single peak | −0.90~1.38 | Slightly disturbed |
| Interruption of substrate supply | Small fluctuations in all single indicators | 0.06~1.28 /0.40 | Repeated small peaks | −0.57~0.93 | Slightly disturbed |
| Resumption of substrate supply | Increases in VS, COD, TVFA, SOD, pH, and TA; decreases in MPR, CH4 (%) | 0.03~4.39 /1.37 | Repeated large peaks | −1.40~2.42 | Disturbed |
| 300% impulse OLR (short-term) | Increases in TVFA, TA, pH, VS, and COD; large fluctuations in CH4 (%) | 0.34~5.81 /2.18 | Repeated large peaks | −1.70~2.58 | Disturbed |
| 300% impulse OLR (long-term) | Increase in MPR; decreases in TVFA | 0.06~1.53 /0.60 | Repeated small peaks | −0.89~1.11 | Slightly disturbed |
| 500% impulse OLR (short-term) | Increases in COD, VS, TVFA, and SCOD; decreases in MPR and CH4 (%) | 0.09~4.70 /0.80 | Repeated large peaks | −1.32~2.50 | Severely disturbed |
| 500% impulse OLR (long-term) | Decrease in TVFA; high variability of MPR and CH4 (%) | 0.06~3.17 /0.77 | Repeated large peaks | −1.35~1.96 | Severely disturbed |
Table 2.
Maximum, average, and fluctuation pattern of eigenvalue, and anaerobic digestion state.
| Eigenvalue Maximum | Eigenvalue Average | Fluctuation Pattern | State |
|---|---|---|---|
| <1.0 | <0.2 | Stable | Stable |
| <4.0 | <0.6 | Decreasing | Slight perturbed |
| <3.0 | <0.6 | Single or repeated small peaks | Slight perturbed |
| >3.0 | >0.6 | Repeated peaks in short-term | Perturbed |
| >3.0 | >0.6 | Repeated peaks in long-term | Severely perturbed |
Disclaimer/Publisher’s Note: The statements, opinions and data contained in all publications are solely those of the individual author(s) and contributor(s) and not of MDPI and/or the editor(s). MDPI and/or the editor(s) disclaim responsibility for any injury to people or property resulting from any ideas, methods, instructions or products referred to in the content. |
© 2023 by the authors. Licensee MDPI, Basel, Switzerland. This article is an open access article distributed under the terms and conditions of the Creative Commons Attribution (CC BY) license (https://creativecommons.org/licenses/by/4.0/).
Share and Cite
MDPI and ACS Style
Jia, R.; Song, Y.-C.; An, Z.; Kim, K.; Lee, C.-Y.; Bae, B.-U. A New Comprehensive Indicator for Monitoring Anaerobic Digestion: A Principal Component Analysis Approach. Processes 2024, 12, 59. https://doi.org/10.3390/pr12010059
AMA Style
Jia R, Song Y-C, An Z, Kim K, Lee C-Y, Bae B-U. A New Comprehensive Indicator for Monitoring Anaerobic Digestion: A Principal Component Analysis Approach. Processes. 2024; 12(1):59. https://doi.org/10.3390/pr12010059
Chicago/Turabian StyleJia, Ru, Young-Chae Song, Zhengkai An, Keugtae Kim, Chae-Young Lee, and Byung-Uk Bae. 2024. "A New Comprehensive Indicator for Monitoring Anaerobic Digestion: A Principal Component Analysis Approach" Processes 12, no. 1: 59. https://doi.org/10.3390/pr12010059
Note that from the first issue of 2016, this journal uses article numbers instead of page numbers. See further details here.