Abstract
Operating time series data collected and stored in historian must be managed to extract their full potential. Part 1 of this paper proposed a structured way (a sophisticated approach) to process industrial data; this first part explains in detail the data processing framework used as the basis for the costing analysis present in the second part of this series. The framework considers the analysis scope definition, data management steps, and operating regimes detection and identification. The added value of this proposed framework is demonstrated in Part 2 via the use of cost accounting for operational problem-solving (debottlenecking), i.e., its practicality is validated via its application alongside a cost analysis on the brownstock washing department of a kraft pulp mill. The traditional debottlenecking approach assumes a single operating condition considering that operating regimes allow for a much more sophisticated debottlenecking study of the washing department. With the use of operations-driven cost modeling (contingent on activity-based costing concepts) and processed time series data corresponding to steady-state operation, incremental profit can be assigned to each operating regime in order to identify the most cost-efficient one. The overall objective of this two-part series is to convert processed industrial steady-state data and cost information into knowledge that can be used to optimize the washing department of a chemical pulp mill. More specifically, different operating regimes are assessed, and the most suitable operating strategy is defined. The application of activity-based costing on a large amount of historically processed industrial data led to the improvement in the operation. The identified optimal way to operate (pulp throughput, pulp conductivity, defoamer and bleaching chemical quantity, etc.) led to a profit of CAD 49 M per year. Lastly, a contribution analysis of the regimes based on PCA highlighted how the process was operated when the preferred performances happened.
1. Introduction
Every plant exploits some level of cost-control strategies in order to ensure its financial performance and maintain a competitive position in the marketplace. Over the past decade, the strategy employed by North American pulp and paper mills has been to lay off staff, downsize operations, and sometimes close down [1]. However, in the short term, some mills are adopting a strategy of minimizing production costs. For this purpose, financial and cost accounting are exploited. Financial accounting is required to establish the company’s financial statements, prepared according to standardized guidelines. Cost accounting, on the other hand, is used internally by management to study plant operations and make decisions to maximize the plant’s profits; it provides valuable insight to decision makers. The results of this analysis are confidential and are never made public, unlike its counterpart, financial accounting [2]. In addition to decision making, cost accounting is used to solve operation problems and maximize product margins [3,4,5]. To conclude with the strategies put forward by mills in the paper industry, in addition to minimizing their production cost, some of them tend toward diversification of their product portfolio, i.e., biorefinery.
Nevertheless, the relationship between industrial process data (time series data) and cost information is underexploited in the pulp and paper industry. Interviews conducted with process experts in the sector highlighted that the production costs per product and per operating regime are often unknown and that it would be interesting to know the cost of operating in different regimes [6]. These refer to a specific set of operating conditions, including both controlled parameters and ambient conditions, and by choices in the process operation. Different set points for a parameter, the use of one or two production lines, and the opening and closing of a recirculation loop are examples of operating regimes.
Furthermore, a cost analysis can only be as good as the process data provided to perform the analysis. In this perspective, a data management framework was proposed in Part 1 of this paper [7]. This framework considers, among the other steps, the reduction in measurement and process noise in process data. Different data processing techniques to reduce those high-frequency components, i.e., noise, are compared in [8]. The wavelet transforms were found to be robust and were used to establish heuristics to process a wide range of signals in a timely, efficient manner. Furthermore, the framework helps explain the variations in the process and highlights which variables were responsible for the variations by considering operating regimes. Operating regime detection helps to better understand how a mill operates and increases the ability to interpret process data thoroughly and deeply. It provides additional information on process operation and offers an applicable way of defining the best mode for achieving a more cost-efficient process. Therefore, recognizing different operating regimes opens the door to many new opportunities. This paper focuses on steady-state operating conditions.
Part 2 of this paper proposes a concrete application of the framework. It highlights an example where it is worthwhile and justifiable to use the framework to solve an operational problem. The operating regimes are considered to refine the operating cost estimates in a pulp mill.
The objective of this paper is to make use of the data management framework alongside an activity-based costing analysis to solve an optimization problem in the washing department of a pulp mill and therefore assess how to improve the process. More precisely, the activity-based costing assessment would provide the incremental cost and value generated by a product in each operating regime, and knowing these regimes as well as their associated cost, an optimization analysis could identify the preferred conditions. Therefore, the value of the framework is demonstrated in an industrial context by solving a process optimization problem that benefits from the recognition of steady-state operating regimes and associated costs. Steady-state operations are defined in Part 1.
In the case of this publication, optimization stands for the selection of the least and most performant conditions. It is a practical evaluation of that considering the entire operation in order to be able to improve the profitability globally and thereby optimize the washing system. To do just that, operating costs are evaluated and compared for different operating regimes to identify settings that imply better performance.
All analyses as part of this paper are based on historical data. Retrieving these past data at the granularity of sub-hours (every minute, for instance) over a long period of time (multiple months) allows the classification of whether the process units were steady or unsteady. The spans identified as steady may then be used in process optimization. Therefore, this could be called “optimizing the past”. Optimizing the past leads to lessons for how to improve the future. Therefore, the past is characterized in a robust way, understood better, and optimized in order to identify the optimal way to operate in the future. This approach is taking the past and extrapolating it to the future in a practical way.
This paper starts with an overview of cost accounting historical background (Section 2) and operating cost assessment in the industry (Section 3) as well as optimization analysis in the pulp and paper sector presented in the literature (Section 4). In Section 5, the proposed approach to merge the data management framework exhibited in Part 1 with a cost analysis, focusing particularly on operating regimes, is described using real-world data from a pulp mill as an illustrative example. The detailed characteristics of the data used in this Part 2 are found in Part 1. A short summary of the case study background is stated in Section 6, whereas the following sections exhibits the optimization problem definition. Section 7 explains and discusses the results obtained as part of this analysis, and the added value sought by the framework. Lastly, a conclusion is drawn in Section 8.
2. Cost Accounting Historical Background
Cost accounting counts three families of costs: raw materials, labor, and overhead [2]. The first is classified as variable costs that fluctuate according to the quantity of products manufactured. Labor is largely a fixed cost; in general, it does not fluctuate up or down with changes in production, but if it does, it will not change proportionally to production. The third can either be variable or fixed, i.e., that does not vary according to the level of production—they are always recurring. The overhead costs refer to the expenses associated with the proper functioning of the company, and expenses required to maintain the business.
In addition to being fixed or variable, costs can be classified as direct, i.e., including everything directly related to the production of a product, or indirect, i.e., expenses that are difficult to attribute to a single product, not related to the production of a product [3].
Cost accounting consists of classifying, analyzing, and allocating the different types of costs to the products that the plant produces and then taking action to control and optimize these costs. Specifically, it involves identifying which products or regimes are the most profitable and which are the least profitable for the plant. Also, this method makes it possible to study the efficiency of resource consumption, optimize procedures, identify process bottlenecks and study their impact on production and reduce operating costs [3,4,5]. Capital costs are not covered in the scope of this analysis. In a design process, there is a large emphasis on capital costs. However, for process improvements, there is significantly less attention paid to capital costs, and there is a lot of value to be extracted via considering operating costs in conjunction with process data.
The accuracy with which these three cost elements—raw materials, labor, and overhead—are evaluated will impact the reliability of the decision-making process. At the beginning of the 20th century, their evaluation was relatively simple since variable costs represented the majority of manufacturing costs, and the range of products manufactured was generally quite limited [2,9]. In fact, the proportion of overhead costs was negligible compared to the costs of labor and raw materials [10]. However, times are changing and production that was heavily labor-based is now shifting to a largely automation-based environment [2,11]. Thus, correctly allocating overhead and indirect costs to products is more complex, and misallocation of these costs creates a distortion in the evaluation of product production costs [2,10].
There are different methods of cost accounting. The evaluation of costs differs according to the technique used. The first one is the cost–volume–profit analysis; it is widely used in the paper industry [2]. The total fixed and variable costs evaluated for the total quantity of products manufactured are used to calculate the level of production at which the company begins to make a profit [4]. A second approach, which is also very common in the pulp and paper industry, is standard cost accounting. The latter uses ratios that compare the labor and raw materials currently used to produce a product to what is required under so-called standard conditions [4]. Both of these methods were developed nearly 100 years ago, at the beginning of the industrial era, during which manufacturing costs were dominated by variable elements [10]. In fact, these approaches consider all types of costs to vary with regard to production volume and thus create inaccuracy in fixed costs. Furthermore, overhead costs are allocated without looking for a cause-and-effect relationship. Instead, they are allocated arbitrarily, making traditional methods highly inappropriate in a multiproduct environment [10]. Furthermore, traditional methods do not allow for the calculation of margins for individual products [2,10].
It was found that the increase in overhead costs compared to direct costs is obvious in the manufacturing sector [12]. Hence, the allocation of these costs must be more equitable with respect to the different products [12]. Therefore, the distortion of the cost of production (accounting for the overhead and other indirect costs based on simple volume-based measures, including labor and machine hours) increases further over the years as overhead and other indirect costs become more and more important [2,4,9,11]. These methods were (and still are) employed because of their simplicity; they are widely known and understood, and the models employing them are inexpensive to maintain. Yet, they have not evolved even though labor has long since ceased to dominate production costs. Poor cost allocation can lead to poor decision making.
A more recent method based on business functions and activities adds more levels of detail to the cost structure: the activity-based costing (ABC) method. This approach, as its name indicates, identifies the activities incurred by industrial plants, allocates to them the cost of the resources they consume, and then attributes these activities to products via activity cost drivers. Thus, the final products consume activities that themselves consume resources. The activities consequently represent the intermediate stage, and the cost of the resources is no longer assigned directly to the products according to their production volume [3,4,9,13].
ABC method emerged in the 1980s in response to overhead cost allocation discrepancies [9]. Indeed, labor and raw materials are quite easily traceable to the different products, but it is more difficult to allocate indirect costs and overheads directly to products. ABC allows overhead costs to be associated with certain products in a rational manner. It allows a clear representation of the revenues generated and the consumption of resources [13]. This method uses a very specific lexicon presented in the table below (Table 1).

Table 1.
Lexicon used in the ABC approach [10,11].
Figure 1 shows the PWCs in the case of a retrofit design case study defined at an existing integrated newsprint mill. These are divided into two categories: those related to process support and those related to production [14].
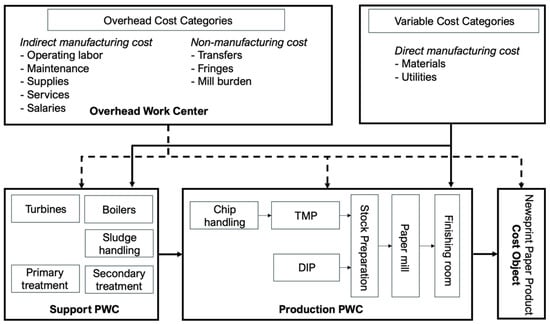
Figure 1.
PWCs division into support and production, adapted from [14].
Figure 2 shows a simplified representation of the steps to be followed in applying the ABC method. With this approach, resources are linked to activities by resource drivers, and similarly, activities are linked to cost objects by cost drivers. It can be seen that the ABC method is implemented via two logical steps, while traditional accounting has only one. This is because the latter does not consider the causal relationship between what causes the cost of an activity and the activity itself. Instead, costs are allocated in an ad hoc manner or on the basis of production volume [15].
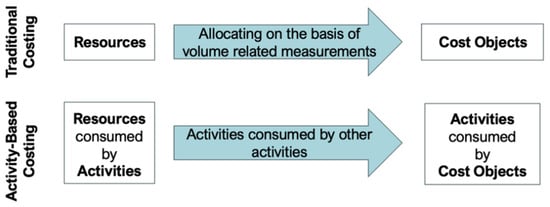
Figure 2.
ABC method vs. traditional cost analysis method, adapted from [10].
The process-oriented character of ABC and the causal relationships between cost drivers and activities increase the accuracy of the cost data, help management understand their actual costs, and potentially improve their profits. On the other hand, traditional costing methods cannot encompass this critical linkage between actual causes (activities) and associated costs.
ABC considers different levels of activities and their expenses—resources consumed (Table 2). The consumption of resources at the unit level varies according to the number of units produced; for the batch level, it varies according to the number of batches produced, and for the product level, it varies according to the number of different types of products. Only the expenses of these first three levels should be allocated to products. Thus, expenses related to the facility level that support the operations of the entire plant—i.e., utilities, insurance, security, building maintenance—are never attributed to cost objects; they are kept at the plant level [13]. The utilities are those of the heating and lighting of the building, whereas energy at the unit level refers to process heating. As shown in Table 2, the cost drivers at the unit level are direct labor and raw materials and are directly assigned to the units produced. Energy utilities are strongly dependent on which products are produced and the current operating conditions for different unit processes. The cost of energy is allocated based on balances. At the batch level, the cost drivers affect an entire production batch, e.g., the number of machine installations, number of deliveries to customers, number of batches, etc. At the product level, the production activities may be placing orders, product engineering, and order scheduling [16].
Table 2.
Hierarchy of operating expenses (inspired by [13]).
ABC allows for long-term decision making with respect to operations and design [17]. ABC makes it possible to differentiate the expenses incurred for the production of individual units from those for a set of products, regardless of the number of units sold. It only depends on the level of activity and thus on the consumption of resources. Traditional cost analysis methods, on the other hand, consider that all activities are carried out only at the unit level.
Furthermore, traditional accounting systems tend to aggregate costs over a manufacturing period while considering solely a single standard recipe. However, the cost information might incorporate various changes in process operation (due to disturbances, raw material variation, operating regimes transition, etc.). Hence, recognizing that within the manufacturing period, the cost will most likely differ from one product to another, as well as within the production process for the same product, is critical and can be carried out via activity-based costing.
There are several industrial applications and/or development of process-driven accounting frameworks based on the activity-based philosophy. Some are discussed in the following section.
3. Operating Cost Assessment in Pulp and Paper Industry
ABC method is process- and operation-oriented: it establishes what unites cost objects and activities and is suitable for analyzing the operating costs of a continuous production. There are many applications of this process-oriented cost model. First, an approach that integrates environmental metrics to ABC principles for analytical economic and environmental assessment for decision-making activities has been developed; environmentally related opportunities were ranked with the aim of improving competitiveness while reducing environmental impact [15]. Second, an oil refinery used ABC to evaluate the costs of by-products as well as the main product. Indeed, this method improves the evaluation of the costs of each product when several products are manufactured simultaneously [18]. In addition, the ABC approach has been used to evaluate the performance of investments in manufacturing companies [19]. ABC has also been used to perform a comparative life-cycle cost analysis of different plant budget scenarios to identify different key factors [20,21]. Lastly, a template was proposed to assist decision making surrounding operations to enable continuous improvement using the ABC method [17].
Now focusing on the pulp and paper sector, the activity-based costing method was employed for cost modeling and analysis in the case of a virtual paper mill [22]. Following a very extensive analysis considering both general and process-specific cost drivers (chosen carefully), the results show that the ABC method is a pragmatic cost calculation approach, and with the parameters used, it was estimated that papermaking can still be profitable in Nordic conditions. Given that ABC delivers accurate information for strategic and tactical decisions [22], processes that generate higher costs than added value were identified by mill managers. Korpunen and Paltakari mentioned that the traditional costing methods do not necessarily provide process-based information and that some marginal products or raw materials sometimes go unnoticed, and that may therefore lead to false determination of prices [22]. The authors showed that a slight change in the market prices may be critical for profitability and that a few errors in cost estimations may eventually lead any business to a detrimental result.
Other similar studies, i.e., activity-based costing for the pulp and paper industry sector, were performed [23,24,25,26,27,28,29]. For instance, Janssen presented a bottom-up approach to business modeling by exploiting the potential of real-time process data, ABC cost data, and environmental data for process decision making [30]. The business model concept was illustrated via an application in an integrated newsprint mill.
Also, a sophisticated approach was proposed to integrate cost and process information to provide an operations-driven costing approach (ODCA) [31,32], which is essentially the adaptation of ABC for continuous processes and, in particular, for pulp and paper processes. Notwithstanding the advantages of ABC presented above, this approach was initially for discrete manufacturing, car parts, and assembly lines. ODCA allows a thorough understanding and interpretation of resource consumption. This method links the costs to the process operations using ABC. The latter was developed by accountants as well as process engineers in the pulp and paper industry as it requires an in-depth understanding of the process operations [10]. ODCA seeks to minimize production costs. It identifies which operating regimes are unprofitable and hence should be avoided, as well as the margin for each product; it can be used as an operational decision support tool. The knowledge of individual product margins allows us to identify which products should be emphasized more [2]. Finally, ODCA has been applied to assess production costs for different production campaign runs; the results show that the manufacturing cost of the same product varies significantly from one campaign (regime) to another [32]. It has also been used to analyze and optimize the supply chain of a forest industry mill [31].
Each product from the pulp and paper mills is manufactured according to a specific recipe. However, each of these recipes can be produced according to different operating strategies, i.e., operating regimes. With this in mind, Korbel proposed to use an ODCA to evaluate the production cost of different products under different operating regimes [10].
The more traditional cost analysis methods analyze the different product (grades) margins using a somewhat nominal approach to cost allocation [2]. However, ODCA, coupled with the operation regimes, is based on a process engineering perspective and thus provides a better understanding of costs and the product margins for each campaign. Indeed, this technique relies on the use of a process model that presents the operations in a pseudo-steady-state regime. Together, the cost and process models allow us to evaluate the probability of each operation regime occurring and their individual and respective profitability [2]. Thus, this information is used to make decisions at the plant operations level. This approach operates in a bottom-up manner, i.e., from the identification of the different operation regimes to the process model to the collection of cost data, and then to the calculation of operation costs. Figure 3 shows the overall information exchange that takes place with ODCA.
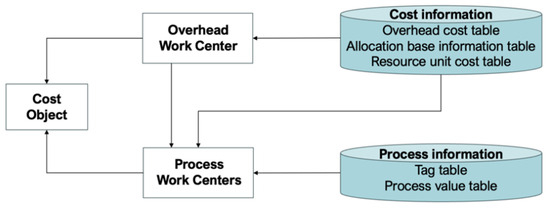
Figure 3.
Information exchange between the process model and economic data, adapted from [32].
In addition, ODCA allows the economic evaluation of continuous processes generating a range of products. It offers great insight into decision making, permits the identification of the optimal regimes by allowing the visualization of how costs vary with each regime, and gives the production cost and margin of different products for each operating regime. While it helps to identify operating regimes that are not cost-effective, some of these are inherent to the process and are unavoidable. Figure 4 shows the contrast between traditional costing methods and operation-driven costing approaches. The latter starts with the identification of the operating regimes.
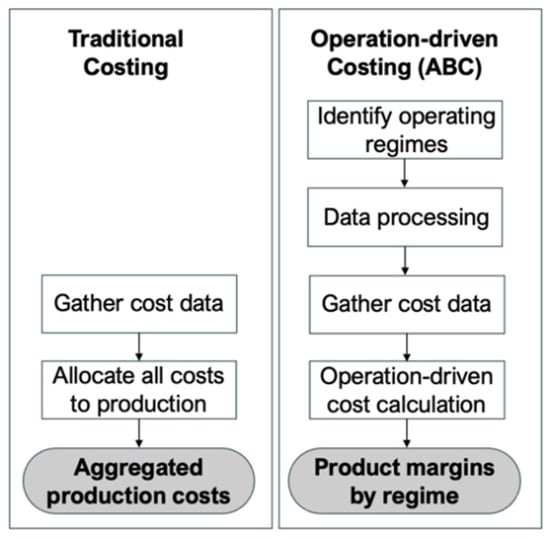
Figure 4.
Comparison of cost analysis methodologies, adapted from [10].
Therefore, operations-driven costing approaches combine the cost and the operating regimes, allowing one to assess the cost of each regime. A cost analysis is going to be applied in combination with the data processing framework proposed in Part 1 of this paper [7] to solve an optimization problem in the pulp and paper sector. The cost analysis approach used in Part 2 is consistent with the ODCA approach presented previously; the major difference resides in the processed data used in the cost analysis (data that were rigorously processed using the framework) and the emphasis put on operating regimes. Furthermore, the above reference studies focused on newsprint production or thermo-mechanical pulping mills, whereas this case study is more complex in that it considers the kraft pulping process. The main contribution is from the superimposition of costing information on processed time series data from the data management framework and the demonstration of a debottlenecking study of the washing department of a kraft pulp mill. Therefore, the following section discusses cases of optimization in the pulp and paper industry in more detail, with a particular focus on the consideration of operating regimes in the identification of the solution.
4. Optimization Analysis in the Pulp and Paper Sector
There are few papers addressing optimization analysis related to the pulp and paper industry, such as one on energy optimization [33]. Another aims to improve washing efficiency and reduce water consumption by determining the optimum wash water usage level in a brown stock washing operation—the level at which washing losses are satisfactory [34]. Additionally, a study that aimed to improve the efficiency of a chemical pulp mill’s brownstock washing (BSW) line was carried out [35]. The results indicate that the amount of brownstock washing losses may be reduced by controlling the dilution factor. Furthermore, another paper intended to review the cost parameters in brownstock washing and explore their sensitivities as well as the equipment performance, all that to present a cost optimization [36]. Lastly, Chew et al. presented an optimization model aiming for simultaneous water and energy saving for BSW systems in a pulp and paper mill as well as a sensitivity analysis to explore the relationship between washing efficiency and utilities, i.e., water and energy consumption [37]. All of these studies had no consideration for operating regimes.
Nevertheless, a paper tackled the optimization of washer performance by calculating the displacement ratio [38]. In this case, the results indicate that optimal operation of the pressure filter in the brown stock washing was sought by changing the processing experimental conditions and control parameters. Therefore, the type of wood pulp varies (pine or birch), as well as the production rate, the feed pulp consistency, the dilution factor, and the purity of the wash filtrate (kappa number). Hence, there is this idea of considering different recipes or operating conditions and identifying the optimal one in the context of the operation of pressure filters.
In another paper, the concept of operating regimes was put forward via the consideration of varying seasonal conditions (heat load variations). In a chemical pulp mill, a multi-period optimization model for design decisions that considers the operational limits of the steam production units as well as the heat load variations over the year was proposed [39]. It was mentioned that a conventional approach that considers fixed annual averages (single-period) of process parameters would risk leading to sub-optimal solutions in the context of reducing the process heating demand because of neglecting the variations in heat demand and the operational limits [39]. Therefore, the approach suggested considered modeling the varying heat demand. As a result of the comparison of the aforementioned approach and the conventional approach, the latter shows significant errors and arrives at an inadequate estimation of the optimal solution, which provides poor guidance regarding financial decision making. The results of the optimization analysis can only be correctly determined by properly including heat load variations data. The exact same idea was also addressed in [40]. These studies considered only the seasonal variations in steam demand. However, the different production rates, product campaigns, and ambient temperatures are all additional factors for process steam demand variations. Furthermore, electricity and raw material (biomass) prices also vary over time and may significantly impact the optimal operation of the system.
Therefore, a model for design optimization of kraft pulp mill steam utility systems, subject to variations in energy (electricity) prices and operating conditions, including steam production and demands, is presented in [41]. The latter is used to study how these variations affect investment decisions. The model included more sources of variations and tried to overcome the challenges that come with the modeling tasks, such as those related to data reliability, uncertainties in cost data, lack of documentation and technical specifications, the poor correspondence between literature models and measurement data as well as the wide range of sources of variations for which correlations are often difficult to identify [41]. The optimal investment obtained when accounting for the varying conditions was compared with the one found when only a single operating and price scenario is considered, and it was shown that the former may identify solutions with more flexibility than those identified with a single-period model.
As has been demonstrated, there is no optimization analysis that considers operating regimes in all of their complexity to highlight the optimal way to operate in terms of cost, throughput volume, and pulp quality in the washing department. The following section details the methodology employed to do so.
Using activity-based costing philosophy or operation-driven cost approach provides an estimation of how much resources are consumed in each operating regime; it allows a deeper understanding of operating costs. Rectified steady-state data integrated into a cost model are used as the basis for management decision making. The interpretation of the results of the data-driven costing method employed in this paper leads to the optimization of the operation in the washing department. While, as part of this paper, an optimization problem is solved, there will not be any optimization algorithm per se; it is not a mathematical optimization but rather a practical one. It is a case study where the operations are improved via the identification of the most suitable operating regime to produce in—the one that minimizes the production cost and maximizes the throughput and product quality.
5. Methodology: Operating Regimes-Driven Cost Analysis for Problem Resolution
Continuous processes, such as chemical pulp mills, are often characterized by a multiple-product environment and numerous operating regimes. Therefore, it is crucial to evaluate the costs and revenues for each regime to make sure they are all profitable. Enhancing the insights and understanding of the cost variances between different operating regimes (production recipes) in the washing department of a chemical pulp mill is achieved by the following:
- Defining the objective of the process optimization problem to be solved;
- Applying the framework proposed in Part 1 to obtain reconciled steady-state data in each operating regime;
- Evaluating the operating cost for each operating regime using activity-based costing;
- Addressing the optimization objectives to find the optimal solution to the optimization problem, i.e., propose an improved way to operate the washing department.
The optimization problem is detailed in Section 6.1; the goal is to improve the operations by identifying which regimes maximize the profit of the washing department for a given product (the same product was produced in all assessed regimes). The result will provide insights and support informed decision making. The process data required to model it are processed based on the steps presented in [7]. Namely, in order to perform the activity-based costing analysis, the process information is acquired using signal processing, steady-state detection, and data reconciliation techniques for each operating regime (detected as part of the aforementioned framework).
The data processing framework characterizes the operations, and then a cost model is superimposed on the processed data. The cost analysis employed in the third step is described in detail by the operations-driven cost model initially introduced by Laflamme-Mayer et al. [32]. The first stage is to characterize the process operations based on process data that were dissected to describe the multiple operating regimes, and identify the different resources and activities of the department. Next, the consumption of resources is assigned to the different activities, and then the activities are assigned to the cost objects. Thus, the activities serve as a link between the consumption of resources and the cost objects [13]. In a nutshell, the cost information is extracted, and cost drivers are defined and organized into matrices that correspond to the underlying fundamental mass and energy equations. The production cost per ton of product (cost object) is evaluated. The cost model used as part of this analysis evaluates the profits based on mill operation figures; the revenues are those of the pulp “sold” to the downstream department, and the costs include the bleaching chemicals and defoamer.
Once the operating costs are calculated for each regime (step 3), discussions with operators and process engineers at the mill allow for the interpretation of the information, the feasibility of all regimes, a deeper understanding of how the process operates, and then the identification of potential solutions to maximize the washing performance.
Then, the most suitable operating regimes are identified by considering the allocation of the manufacturing costs to the product made in each regime in combination with the inside from a critical analysis of the steady-state conditions (discussions with process experts). Hence, a suitable regime is one that is more than solely profitable; it is also viable, understandable, and repeatable. The criteria used to determine the suitability of operating regimes, aside from profitability, include the pulp conductivity, the amount of pulp produced, and the duration of the regime. The result of this analysis will support informed decision making, provide insights, highlight potential areas for improvement, and lead to the identification of an improved way to operate the washing department. Hence, by analyzing and interpreting the outcomes of the operation-driven cost model, an improved way to operate will be identified. Further analysis to understand the causes of good and bad performances of operating regimes is performed with a principal component analysis.
6. Case Study: Brownstock Washing Department in a Dissolving Pulp Mill
The pulp, which has just been cooked, is composed of fibers (cellulose) and impurities suspended in black liquor. The latter contains dissolved wood components, including lignin (the Kappa number is an indicator of the lignin content in the pulp) and the chemicals initially present in the cooking liquor. The principal objective of brownstock washing (BSW) is to separate the dissolved organics and spent cooking chemicals from the pulp so that the latter may then be bleached and the liquor sent to the evaporators. In other words, the goal is to recover spent pulping chemicals as efficiently as possible and to minimize black liquor solids carryover to the bleach plant to reduce excessive bleaching chemical usage.
If the pulp is poorly washed, some dissolved components will remain and will impact the bleaching process, which would hence require more chemicals. On the other hand, an over-washed pulp would mean a too-diluted black liquor, which would increase the steam demand of the evaporators; the amount of water to evaporate rises, and therefore the energy demand increases proportionally.
The brownstock washing principles (for drum washers) are dilution, extraction, and displacement. First, the pulp is diluted in the washer vat, decreasing the concentration of dissolved solids (DS) in the black liquor. The dilution factor (DF) represents the mass of added water (wash liquor of the shower flow) minus the mass of liquid leaving with the pulp (liquor of the pulp stream), all that is divided by the pulp mass. Then, removing liquid from the pulp/liquor suspension reduces the total amount of DS; however, the concentration stays the same. Lastly, the shower liquid flows through the pulp mat, replacing the liquid already present in the pulp (which is removed via the vacuum of the drum). The displacement ratio is a measure of washing efficiency.
Other indicators of the washing performance are the viscosity and brightness that are indirect measures of the fraction of cellulose in the pulp. The drum rotation velocity can affect the thickness of the sheet forming on the drum; to obtain the optimum sheet thickness, the best range is 2–3.5 rotations/min [42]. Furthermore, the wash water temperature can impact the washing efficiency as a higher temperature will increase the DS removal. It is easier to dissolve liquor (solids are more dissolved) at a higher temperature; it is a question of liquor solubility. Therefore, viscosity decreases, and water can enter the pulp more easily, i.e., the viscosity goes down; hence, the pulp drainage rate (freeness) is improved.
Lastly, the feed and discharge consistencies affect the energy consumption of the equipment and therefore may affect the performance as well.
The BSW department of the specific mill targeted as part of this case study uses three different pieces of equipment to remove different components from the pulp (Figure 5). First off is the two-knotters cascade system used to remove uncooked wood fibers and knots. Then, the actual washing is carried out in two parallel lines of rotary washers (dissolved cooking components) arranged in a classic counter-current setup. The two different washing lines are not always working simultaneously. This happens when there is an operation problem happening either upstream, in the digesters, or downstream, in the bleaching department. Finally, is the three-screens cascade system and cleaners utilized to remove other debris (plastic, shives, sand, etc.).
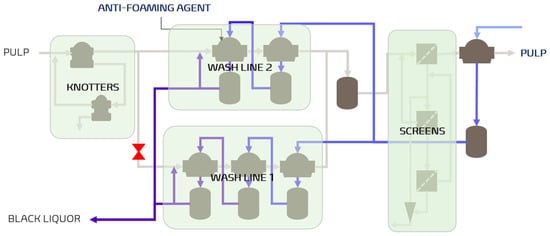
Figure 5.
Brownstock washing department considered in this case study. The valve in red shows that wash line 1 might be closed when needed.
This department presents several operating challenges; it is one of the areas most affected by variations and significant fluctuations in the digesters. The washing department, which operates continuously, is indeed quite unstable given the pulping department that precedes it, which operates in batches (discharge every 90 min). The blowing tank at the entrance of the department is not sufficient to counteract the fluctuations—these fluctuations are reflected on the tank level—a buffer tank should be considered. Also, the low capacity of the washing department means that in order to wash all the pulp coming out of the digesters, the washers are operated at high speed, which makes them more difficult to control—the speed at which the digesters are running influences the speed of operation of the washers; the latter must not slow down the digesters. This makes the wash department a major bottleneck. However, operating the washers at their maximum capacity, which could result in a loss of control over the operation and thus reduce the quality of the pulp wash, causes too much lignin to remain in the pulp and ends up in the bleaching department, resulting in much higher bleaching agent costs.
Moreover, the operators have little room for maneuver in this department; in order to wash the pulp correctly, they must put in just enough water so as not to have too much filtrate (and therefore black liquor, which will impact the other departments), put in the right amount of defoamer and try to keep up with the speed of the digesters (find the right operating speed).
Thus, one strategy proposed to incrementally optimize or debottleneck the washing department operations is to identify opportunities requiring no capital investment (keeping the same equipment) based on data analysis performed using the framework presented in [7], which considered the operating regimes and production costs. The preferred (more efficient) washing operating conditions (regimes) will be identified as described in the following section.
6.1. Optimization Problem Definition
Optimizing the washing department, i.e., maximizing the washing performance, must be in relation to its main objective: removing unwanted components from the pulp. In particular, this should be carried out in the most economical way possible by maximizing the profit for a maximum of dissolved solids removed from the pulp.
To maximize washing quality/performance is to minimize a pulp cleanliness indicator: the conductivity. The quality of pulp washing is indirectly measured by its conductivity at the end of the department; the lower its value, the higher the quality. The conductivity is caused by the black liquor (lignin) that remains in the pulp. A high conductivity value means that the pulp contains lignin (the component that the washing department is trying to remove as much as possible—this is what consumes the bleaching chemicals and causes the pulp to be brown). Hence, the cost of bleaching is related to the lignin content; a high lignin content left in the pulp leads to higher bleaching chemical costs. Therefore, the ideal production rate respects the washer load capacity and considers that overloading leads to poorer washing efficiency.
The goal is not to obtain the lowest conductivity at any cost; it is to find an equilibrium. The mill aims to produce as much pulp as possible for the same conductivity (or the lowest conductivity for the same pulp flow). Therefore, maximizing the dissolved solids removed from the pulp does not rime with adding an infinite number of showers, as this would produce a consequent amount of black liquor that would need to be evaporated, which would require a lot of steam. Since this would require too much wash water and consequently too much steam for evaporation downstream, that would not be the most economical solution. To maximize washing performance, there is a constraint on the pulp conductivity: it must be below the threshold of 5000 µmhos.
Identifying a preferred operating regime and unprofitable (or less profitable) ones would be to solve the optimization problem; in other words, ascertain what conditions (operating parameters) would meet the following objective function: maximize profits. This objective function considers the maximization of the overall yield/capacity of the washing department (pulp throughput quantity) as this impacts the revenues and the minimization of the costs, i.e., the quantity of defoamer and the bleaching chemical usage.
The maximization of the overall capacity of the washing department must account for the physical constraints of the department, i.e., the maximum pulp production capacities of each washer. The goal is to identify the regime that shows the highest amount of pulp delivered to the thick, unbleached pulp tank. However, there is a trade-off between the capacity and the pulp quality (the washing performance).
The costs of operating under the different regimes are assessed. Foam formation is one of the main difficulties which negatively affects brownstock washing efficiency. Foam forms when wood chips contain high concentrations of extractives or when air entrainment occurs in the system. Foaming can cause production loss and increase chemical consumption. Defoamer (anti-foaming agent) is used to remove foam, which prevents proper washing; sufficient anti-foaming agent usage increases washer capacity. The required anti-foaming agent quantity increases proportionally with the pulp production; the units are therefore kg per ton of pulp.
Lastly, the cost of water is not considered since its unit cost is minor relative to other costs. In the cost model, the pulp throughput is the main driver of the profit, followed by the bleaching chemicals costs and defoamer. Something more critical would be the quantity (amount) of water sent to the evaporators—more water will overload the evaporators and could slow down the digesters. Overloading the evaporators is very costly and will slow down the washers. Hence, the cost of evaporation per ton of pulp should be assessed, but this analysis stops at the bleaching department and does not consider the evaporation department. Ultimately, minimizing the cost of water evaporation indirectly minimizes the amount of water (shower flow) used at the same time. However, there is a trade-off; the operators should consume as little water as possible without compromising the washing performance.
The result of this optimization analysis is the identification of the best (ideal) way to operate the washing department. The solution is not in the form of a design modification generating capital investment. As a matter of fact, paper mills are currently trying to do the most with as little capital investment as possible; therefore, solutions requiring little to no investment are prioritized. The various operating regimes are going to be classified based on the added value (profit) they bring, considering their feasibility. The activity-based costing analysis will provide the marginal cost of incremental production in each operating regime. The amount of time the process can produce in the different operating regimes is also going to be acknowledged.
6.2. Washing Department Debottlenecking and Cost Optimization
In order to concretize the systematic approach proposed in [7] and its value, the operating costs of each regime are considered. These are not evaluated in an absolute way but rather in relation to the average production of dissolving pulp, which is the reference or baseline. More specifically, knowing that the mill’s objective is to produce as much pulp as possible, the cost analysis focuses on the profit generated for the additional (above average) tons of pulp produced. Also, this analysis performed in collaboration with the technical department at the mill demonstrated that the revenues generated from the sale of the pulp produced always cover the costs of additional consumption of defoamer and bleaching chemicals. Every ton of pulp produced above average brings an incremental profit. Therefore, the goal is identifying the best way to operate to make the most money and finding the operating regimes that are the most profitable.
Each different way of operating is assigned a profit obtained with respect to a baseline, which is estimated at 475 tons/day. Resources considered in this operation-driven cost analysis are the average amount of defoamer and bleaching chemicals consumed during the different operating regimes. The washing department is not energy intensive; therefore, energy cost was not considered. Activities that consume these resources are the usage of the washers and the reactions happening in the bleaching towers. The cost object is the washing department.
By considering the absolute production costs per ton of pulp produced and their breakdown into direct and indirect costs, it is possible to identify that for each additional ton of pulp produced compared to the average, the mill makes a gain. Therefore, considering the amount of pulp produced above average and the amount of raw material consumed, by subtracting the costs from the gain, it is possible to obtain the profit for each operating regime.
This marginal cost analysis provides the profits per operating regime for a year of operation (355 days). However, the feasibility must be accounted for: identify how many days a year it is possible to operate this way and reduce the operating costs. A key constraint and driver for this entire study is the fact that these costs may be saved in specific conditions when the washing department is, in fact, the mill’s bottleneck. Hence, the optimal way to operate found in this analysis would be less impactful if another department was the bottleneck of the process; this analysis would suddenly be way less useful.
The targeted application or analysis dictates which operating regimes are required and how they should be defined (the level of data aggregation or granularity). A possible avenue would be to focus on identifying operating regimes that are less cost-effective and assess whether they are essential and/or avoidable. However, the operating regimes identified for this case study are those in the summertime (where the mill operates at its fullest) and especially when the process is running smoothly (producing more than 475 tons of pulp per day). Therefore, days where less than 15 batches were produced were not considered; less than 15 batches indicates a problem in the operations: these data are not representative of good operations.
The scope of this publication is limited to stable operating conditions, i.e., steady-state operating regimes when evaluating the washing process performance. People with little mill experience tend to think that processes run smoothly most of the time; however, in reality, it is the opposite; there is more often than not something wrong somewhere in the process. Unstable periods may be caused by a plethora of reasons, and trying to optimize these would turn out in a number of scenarios impossible to assess. Furthermore, these periods do not affect the way the process is supposed to be operated normally. Hence, generally, plants do fault detection but always try to find the optimal way to operate when the process is in steady state and always try to return to this state. They are interested in knowing when and why the process is running smoothly (in which conditions) and how to maximize these conditions and try to maintain them as long as possible—perhaps more than trying to solve all issues given their occurrences.
During summertime, the plant operates at a higher production rate, and the washing department is the limiting factor. Thus, the maximum capacity of the equipment in this department is often reached, and this results in lower washing performance. In winter, production rates are lower, which brings more stability to the operation—the wash flow is easier to control; the washing department is not the bottleneck, the digesters are. Thus, having less pulp to process causes the washing department to perform better in winter. The lower pulp production rate is caused by a decrease in the digester’s capacity; cycles (cooking time) are longer. Hence, fewer batches are produced each day. However, having a lower production is never economically desirable. Thus, in general within the mill, seasons play a critical role in the operations of the process. For the digesters, the mill has different recipes (cooking parameters) defined according to the season. The different ways of operating the digesters impact the rest of the process. Therefore, the chosen operating regimes analyzed are from summer operations since they have the most opportunity for improvement in terms of the washing department.
The steady-state operating regimes identified using the proposed framework [7] should last at least 12 h. It is the minimal time for the steady state to be representative, considering that shift rotations happen twice a day. During each shift, the working team is responsible for achieving the department’s objectives. Given the fact that some operating regimes lasted longer than 12 h, these regimes show an overlap between the teams. The operating regimes are compared based on which team of operators was working during the operating regime duration; those are assimilated to different production scenarios as different operator teams will not necessarily take the same action when reacting to an event (problem) happening at the mill. There is a difference between normal operations in the mill and when there is an operational problem. When the process deviates from its normal course, it is normal to see operators reacting differently to the situation. However, once the issue is fixed, the process will try to reach a steady state again, and the different teams must return to the optimal way to operate. The different teams are reflected in the data itself; it is inherent to the data.
Table 3 and Figure 6 show the connection between the way the process is operated and the different operator teams. The objective is to observe if a team is better, see what they are doing right, and ask the other operator teams to do the same, if possible. Following this operational optimization, recipes must be standardized with control loops and KPIs follow-up (control plan in which operators write down hourly readings to make sure the process is operating close to its optimal parameters) for the different teams to act uniformly. The operating regimes are also distinguished by key parameters, including their averaged pulp production and quality (conductivity) values and their profit relative to the averaged production.
Table 3.
Key parameters for all detected operating regimes.
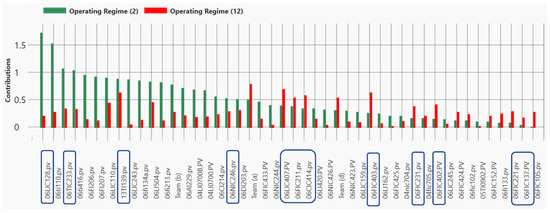
Figure 6.
Variables contribution for operating regimes 2 and 12. Variables in the rectangles are discussed below.
Table 3 presents the key parameter values averaged over the run length (duration of each operating regime). The total operating time for each operating regime is specified in the second column. The last column provides the profit in millions of dollars per year for each operating regime. Given the different operating regimes identified based on the framework presented in Part 1, the most favorable ones can be recognized according to the parameter values that uniquely define each one of the operating regimes. Over the period of time under study, there are no significant variations in the feedstock or digesters operation.
From Table 3, it is possible to observe that the preferred combination is operating regime 12. It generates a profit of CAD 49 M per year, and it is obtained when the process is operated by teams A and B, that 754 tons/day are produced, and the conductivity of the pulp is 4389 µmhos. In order to assess the reasons behind the performance of operating regime 12, it was compared with the least performing one, operating regime 2. Even if both are steady-state operating periods happening when the process is producing more than 15 batches of pulp a day, i.e., preferred mill operations, a profit of CAD 19 M differentiates between these two operating regimes. Therefore, a contribution analysis of these operating regimes emphasized which variables varied and impacted the most the operating regimes in the washing department. The identification of these critical variables addresses and explains the differences between operating regimes and highlights how the process was operated when the preferred performances happened (Figure 6). The logic or the rationale behind the identified impactful controlled variables is ascertained with the collaboration of a process expert.
Figure 6 shows that the variability (what differentiate operating regime 2 and 12) is mostly explained first by 06LIC128, which is the 1A washer level. It is a variable that is controlled by operators. They decide the level in the washer; it is not a consequence of some other action in the process. The level of the 1A washer can influence the way the mill performs, and that can influence the amount of pulp throughput, hence generating profit. The level is almost 50% higher during operating regime 2 compared to operating regime 12. It is observed that operating regimes 1 to 5 are running at a higher level, whereas operating regimes 6 to 12 are showing a lower 1A washer level and are producing, in general, more pulp, thus reducing costs further.
Furthermore, 06NIC246, which is the consistency of the stream leaving the mixing tank, explains the difference between the two regimes as well. It is found that operating around 2.150 leads to better performance (operating regime 12) compared to 1.916 for operating regime 2.
A third interesting variable is 06LIC407, the level of the filtrate tank of the thickener. The operators modify its value to reach an overflow, thinking that it would increase the pulp throughput. However, operating regime 12 produces the most amount of pulp throughput with its level of the filtrate tank of the thickener 17% lower than the one exhibited by operating regime 2.
Another interesting controlled variable is 06CIC414, the pulp conductivity. Unlike what the operators commonly believe, high pulp throughput does not rime with conductivity higher than 5000 µmhos, i.e., it is not required to push conductivity to values higher than 5000 to reach high pulp quantity. In all 12 operating regimes representing good operating periods, the conductivity is systematically below 5000. This proves that it is possible to achieve high pulp throughput with low conductivity. This result is quite interesting as it demonstrates that even if the pulp throughput is high, the pulp may be washed correctly. Operating regime 12 proves that it is possible to obtain an important quantity of pulp for a conductivity that is similar to those of the other regimes producing less pulp; it is as good or even better, i.e., the highest pulp throughput does not lead to the highest pulp conductivity.
Lastly, the shower water flow, which includes 06FIC402, 06FIC403, 06FIC137, 06FIC211, 06FIC221, and 06FIC231, are controlled by operators; these are major leverages. Better performance is obtained when more water is added via the showers (this comes at a cost that could be assessed in future work). It was found that all six variables showed higher values in operating regime 12 compared to operating regime 2. Furthermore, the shower water temperature (06TIC233) is controlled by operators by adding hot or warm water to the shower water flow. This variable is equally as important as the shower water flow. In the same way, warm water temperature (13TI139) greatly impacts the washing performance. Higher temperature leads to higher washing performance. Even if this variable is not a control loop, it would be interesting to assess how warmer water can be obtained on a continuous basis.
Another variable that is not controlled but greatly affects the washing performance is 06TI416 (temperature of the unbleached pulp tank). Higher temperature rimes with easier washing operations and higher pulp throughput. This temperature indicator is impacted by the shower water temperature and the pulp temperature at the entrance of the thickener.
Therefore, focusing especially on controlled variables in order to understand what operators did differently in operating regime 12, it was found that the variables that have the most potential to influence the process for better results are 1A washer level, pulp consistency, level of the filtrate tank of the thickener and shower water flow and temperature.
Finally, a succinct analysis of the impact of the work team is undertaken. Since Teams A and B, and C and D work together, Figure 7 shows the variables contribution to each pair of teams.
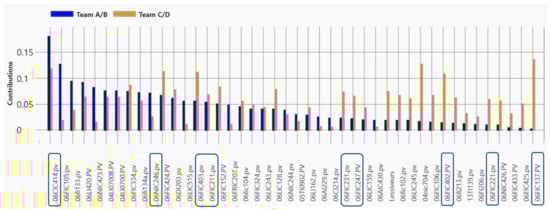
Figure 7.
Variables contribution for Teams A/B and C/D. Variables in the rectangles are discussed below.
Figure 7 illustrates their different way of operating the process; the impact of the working team is reflected in several variables, including the pulp conductivity (06CIC414), the pulp consistency (06NIC246), pulp throughput (06FIC247), shower water flow (06FIC402, 06FIC403, 06FIC137, 06FIC211, 06FIC221, and 06FIC231). Team A/B showed higher conductivity values; they used less water and produced slightly less pulp, and its conductivity was lower. Globally, further analysis should be completed to assess which team performs better than the others.
7. Results and Discussion: Framework’s Added-Value Concretization, Advantages, Limitations and Risks
At the mill, experts are trying to do the most with what they have without capital investment modifications. For instance, in order to optimize and debottleneck the washing department, they would start by stabilizing the process-controlled variables. The most important variable is thought to be the consistency at the outlet of the blow tank; the consistency varies each time there is a digester discharge. By stabilizing this consistency, the pulp going into the washing department should be stable. Then, considering that the pulp is discharged into a blow tank that does not have enough capacity, experts at the mill suggested that they could use an old tank that does not function to act as a buffer. This buffer tank would help reduce the consistency variations as well. This stabilization should supposedly give the possibility to increase the washing capacity. Moreover, considering that the washing efficiency decreases with the temperature since lignin remains stuck on the fibers and will not come off with cold water, i.e., pulp washing is easier with higher wash water temperature, it should be possible to optimize the operations of the washing department by installing a steam heater on the wash water flow for the winter conditions. By doing so, the production gap between summer and winter conditions could be reduced, and the process could remain more stable throughout the year. Therefore, controlling the process water temperature better would provide more capacity. However, even if having warmer water in winter would lead to better performance, digesters are more of a bottleneck during winter than the washers and a large steam heater would be required to heat winter water to reach the same temperature as in the summer. Hence, further analysis should assess the benefits versus the efforts required. A last option, which is not without investment cost, would be to replace existing washers with ones with more capacity. This is out of the scope of this analysis but could be tackled in future work.
Therefore, considering the steps undertaken in practice by the mills, data analysis, and operating regime detection and identification are proposed. In this paper, the brownstock washing department was optimized (debottlenecked), given the superimposition of processed operating data and cost information. Here, debottlenecking is assimilated to increasing the efficiency of the department as the capacity cannot be increased without investment, which was a constraint in this case. The results were presented to mill experts (operators and senior process engineers) as a complement to what they were already doing at the mill level. They were very interested in implementing the findings (optimal set points—a way to operate that may be automated and solely manually controlled by operators) to optimize the washing department during summertime. This analysis is intended to provide meaningful (impactful) solutions that could be implemented in a cost-effective and timely manner.
Data processing and manipulation is relative to the objective of the analysis, the data usage; it is purpose-specific. Based on the purpose of this case study, the framework, i.e., the operating regimes, was required. In other terms, the level of precision acquired by using the framework was necessary; by considering solely the summertime average for all variables, it would not be possible to identify an improved way to operate. Distinguishing between the different operating regimes leads to a deeper understanding of what is happening in the process; operating regimes are used to answer questions and solve problems in a plant.
Solving this optimization problem showed the value and benefits of using the proposed framework; it adds significant value for process understanding and troubleshooting. The framework (especially the identification of operating regimes) gives insight into process variability; it helps explain where the variations in the process come from, when exactly they happened, and which variables were impacted. Furthermore, processed data resulting from the framework is a starting point or the basis for numerous analyses or decision making that could take place at the mill. Having good quality (processed) data and operating regimes obtained via the combination of data-driven approaches and process interpretation may lead to an increase in the mill’s profit. Potential applications of the framework alongside a cost model include retrofit projects such as the implementation of a biorefinery. Also, by knowing the maximum capacity of each unit operation in the process or equipment in a system, processed data for each operating regime help to make recommendations for low-cost changes to increase capacity (debottleneck).
Furthermore, together, the framework and the operation-driven cost model increase transparency, understanding of cause and effect, and granularity (detail) of optimization results and allow the identification of critical variables at the operation level. They also provided improved insights into production costs, enhanced cost-control via benchmarking key performance indicators (process variables in Table 3), and helped to increase the overall corporate profitability.
Therefore, the framework led to an increased understanding of the operations in a process, and operation-driven cost analysis supports informed decision making. It provides information on the various cost objects and studies their profitability as part of a decision-making process. Decision making based on the data from the framework improves the efficiency and profitability of operations. Overlaying processed data from the framework onto ABC data by considering the plant operations helps make better decisions regarding operations. It provides the marginal cost of each operating regime by allocating overhead to cost objects in direct response to their consumption and identifies which operating regime creates the most value.
In summary, assigning costs to the operating regimes allows us to solve operation problems and identify regimes that are the most profitable. Thus, in order to answer operational questions, the definition of the various regimes is essential. Economic data combined with operating regimes uncovered hidden insights into various drivers of profitability, leading to the minimization of the operating costs of the washing department as well as the identification of the actions to take to increase profits.
Therefore, operating in the preferred conditions prescribed by operating regime 12 led to an increased or higher throughput. This productivity increase rimes in high performance: high-quality products, cost reduction, revenue increase, and operational flexibility. These preferred operating conditions increased profitability. Hence, advanced data analytics combined with its context (process knowledge) gives more insight and leads to a deeper understating of the process.
The following paragraphs mention ideas for future work; these are outside the scope delimited in this publication. This future work section makes explicit reference to the shortcomings of the studied approach. First, in the evaluation of the profits, the impact of additional steam required was not considered. In other words, the bleaching department is included (represented by bleaching chemical usage) but not the evaporation section (which similarly could be represented by steam usage). This is explained by the fact that the effects of the washing department on the evaporators are much less direct than those of the bleaching department. Since the evaporators are not the bottleneck in this analysis, the amount of pulp produced is what matters the most. The scope of this paper is limited to the effects of the washing department at the pulp level, i.e., the recovery cycle is not considered. Future work could focus on the pulp as well as on the recovery cycle and study the optimal amount of shower flow, as it is a trade-off between maximizing it to obtain a clean pulp and minimizing it to save energy at the evaporation level. If the recovery cycle is considered, this is at the core of the washing department’s operational optimization problem.
Furthermore, another paper could also consider the shortfall in revenue when the brownstock washing department is the mill bottleneck and assess how much it costs to not be available to the full capacity of the digesters. This would require a bottleneck analysis to highlight when the BSW was the bottleneck and how much more pulp could have been produced if that had been optimized.
In future work, it would be pertinent to evaluate if the values in Table 3 are random, for instance, by assessing how often regime 12 is repeated in the process throughout the year (or summertime). Process experts mentioned that even if this regime showing good performance is random, the operating parameters found as part of this analysis are sustainable; it is possible for the operators to repeat regime 12. It would also be interesting to assess if operating this way led to a statistically significant improvement in the washing department. Finally, future work should evaluate the possibility of avoiding regime 2. A study must assess why this regime is taking place at the mill and if it is possible to eliminate it as it is the less profitable one out of the 12 regimes found, i.e., how we can eliminate this suboptimum regime.
Moreover, experts mentioned that the value of the framework could increase tremendously if it could be used online, in real-time, to establish, for instance, if the operations are deviating from normal operations and to assess the underlying cause. Furthermore, the proposed framework focuses on steady-state operations; transient state, the time between steady-state periods, is not considered. To maximize its profit, it could be interesting for a mill to assess the cost of the transition between the steady-state regime and try to minimize the transition time.
Lastly, instead of superimposing a cost model to the data obtained from the proposed framework, an environmental analysis could have been performed to highlight the most problematic regime and reduce the environmental impact.
8. Conclusions
The data storage capacities of modern process automation systems have grown rapidly. Nowadays, the systems are able to store hundreds of measurements in databases. However, these data have limited value until they are transformed into information. Using data manipulation approaches allows us to take full advantage of the data collected.
Knowing the implications of each operating regime in an industrial process guides the management in their decision-making process. Plants have different operating regimes, and process data must be interpreted based on these regimes in order to make more informed design and operating decisions. Operating regime detection and identification help to better understand how the mill operates and increase the ability to interpret process data thoroughly and deeply. It provides additional information on process operation and offers an applicable way of defining the best mode for achieving a more efficient and cost-efficient process. Therefore, recognizing different operating regimes opens the door to many new opportunities.
This paper presents a case study where operating regimes are required. The operations of the washing department of a chemical pulp mill are assessed in order to identify the preferred operating regime in terms of pulp throughput (06FIC247.PV), pulp quality (conductivity—06CIC414.PV), defoamer usage (06FIC132.PV), etc. The preferred operating regime is expressed in terms of settings, parameters, or conditions that can be controlled or manipulated (temperature, flows, consistency, conductivity, defoamer agent quantity, bleaching chemical product amount, etc.).
The washing performance optimization objective function considers the maximization of the pulp throughput quantity and the washing quality, as well as the minimization of the anti-foaming agent quantity and bleaching chemical, i.e., profit maximization. The cost analysis considered the activity-based costing philosophy; the rate of resource spending is traced to an activity, and the activity is then traced to the product.
The washing process performance is assessed for 12 steady-state operating conditions, and an optimization analysis explored and compared these scenarios to highlight an improved way to operate (preferred combination of set point values) and recognize which controlled variables are responsible for this high performance. Therefore, the optimization analysis identifies which operating regimes are presenting an improved performance, i.e., when the process is showing the highest pulp throughput, minimal pulp conductivity (higher washing performance), and minimal cost.
A contribution analysis highlighted which variables characterized the highest washing performance, i.e., in which variables it is possible to observe this difference in the operations. This is assessed by comparing operating regimes 2 and 12 that, respectively, showed the lowest and highest profit (and overall washing performance). It is possible to conclude that when the process is operated this way, higher profits are achieved: 1A washer level, level of the filtrate tank of the thickener, pulp conductivity kept low, and consistency of the stream leaving the mixing tank, showers water flow, showers water temperature kept high. A concise analysis assessed if the different operating conditions of the controlled variables that impact the operations matched the operator’s schedule.
The analysis performed as part of this paper proved the potential of the framework and exhibited why operating regimes were required to solve this specific operating problem. For proper data-driven decisions or actions, clean and processed data are required, especially the detection of operating regimes.
Therefore, processed data obtained from the proposed framework, combined with cost information, are interpreted to identify profitable operations. The most cost-efficient operating regime is detected and the reasons explaining its high performance are assessed. This is achieved by using data-driven techniques in conjunction with process knowledge. Hence, to make smart decisions based on a huge volume of operating data collected from complex industrial processes, cost information, and operating regimes should be considered.
Using a process data management framework allowed the identification of potential benefits that could be attained by the mill; hence, it brings tremendous value to the process expert. Knowing operating regimes improves the ability to solve operating problems and identify the most cost-efficient regime. Controlled variables that appear to influence the performance of the washing department are identified. Further analysis, starting with a design of the experiment, could isolate the effect of each variable, assess their relations, prove that these variables impact the performance, explain further how they lead to a higher performance, and confirm the preferred operating scenario.
Lastly, an application of the framework to a dissolving pulp mill demonstrated that this practical data processing tool is suitable for deployment in mills and can be implemented in processing industries. Indeed, although it was applied to the pulp and paper sector, it is applicable to any other continuous and semi-continuous process industries without major changes. Obviously, each data processing step must be specialized for the type of industry and even specialized for a particular plant. The framework can be generalizable, but the parameters are specifically selected since the measurements are different for different industries, plants, and instruments.
The pulp and paper sector stands on the cusp of significant change. Capitalizing on recent advances in data-driven methodologies, especially machine learning, can significantly elevate the industry’s present state. A survey addressing the current state of this industry regarding data usage and data processing is presented in [6]. This publication is shedding some light on the most probable and impactful trajectories looking ahead; there are an increasing number of sophisticated routes for data management, including those that will learn from historical time-series data, and AI-based decision making will become more and more present.
Author Contributions
Conceptualization, É.T.; methodology, É.T., C.L. and P.S.; validation, É.T. and C.L.; formal analysis, É.T., C.L. and P.S.; investigation, É.T.; data curation, C.L.; writing—original draft, É.T.; writing—review & editing, É.T., C.L. and P.S.; supervision, P.S.; project administration, P.S.; funding acquisition, P.S. All authors have read and agreed to the published version of the manuscript.
Funding
This research was funded by the Natural Sciences and Engineering Research Council of Canada (NSERC), grant number 529681-18.
Data Availability Statement
Data available on request due to restrictions e.g., privacy or ethical. The data presented in this study are available on request from the corresponding author. The data are not publicly available due to confidentiality reasons.
Acknowledgments
The authors gratefully acknowledge the financial support of the Natural Sciences and Engineering Research Council of Canada (NSERC).
Conflicts of Interest
Author Christian Ledoux was employed by the company Fortress Specialty Cellulose. The remaining authors declare that the research was conducted in the absence of any commercial or financial relationships that could be construed as a potential conflict of interest
References
- CBC. Pulp and Paper Woes Reach Far and Wide. Available online: https://www.cbc.ca/news/business/pulp-and-paper-woes-reach-far-and-wide-1.830189 (accessed on 9 June 2023).
- El-Halwagi, M.M.; Stuart, P.R. Integrated Biorefineries: Design, Analysis, and Optimization; CRC Press: Boca Raton, FL, USA, 2013. [Google Scholar]
- Murphy, C.B. What Are the Types of Costs in Cost Accounting? Available online: https://www.investopedia.com/ask/answers/041415/what-are-different-types-costs-cost-accounting.asp (accessed on 10 April 2023).
- AccountingTools. Cost Accounting Definition. Available online: https://www.accountingtools.com/articles/what-is-cost-accounting.html (accessed on 10 April 2023).
- Averkamp, H. What Is Cost Accounting? Available online: https://www.accountingcoach.com/blog/what-is-cost-accounting (accessed on 10 April 2023).
- Thibault, É.; Chioua, M.; McKay, M.; Korbel, M.; Patience, G.S.; Stuart, P.R. Experimental methods in chemical engineering: Data processing and data usage in decision-making. Can. J. Chem. Eng. 2023, 101, 6055–6078. [Google Scholar] [CrossRef]
- Thibault, É.; Kelly, J.D.; Lebreux Desilets, F.; Chioua, M.; Poulin, B.; Stuart, P. Industrial Data-Driven Processing Framework Combining Process Knowledge for Improved Decision Making—Part 1: Framework Development. Processes 2023, 11, 2376. [Google Scholar] [CrossRef]
- Thibault, É.; Désilets, F.L.; Poulin, B.; Chioua, M.; Stuart, P. Comparison of signal processing methods considering their optimal parameters using synthetic signals in a heat exchanger network simulation. Comput. Chem. Eng. 2023, 178, 108380. [Google Scholar] [CrossRef]
- Cooper, R.; Kaplan, R.S. How Cost Accounting Distorts Product Costs. Manag. Account. 1988, 69, 20. [Google Scholar]
- Korbel, M. On-Line Steady-State Data Reconciliation for Advanced Cost Analysis in the Pulp and Paper Industry; Polytechnique Montreal: Montreal, QC, Canada, 2011. [Google Scholar]
- Cooper, R.; Kaplan, R.S. Measure Costs Right: Make The Right Decision. CPA J. 1990, 60, 38. [Google Scholar]
- Tatsiopoulos, I.P.; Panayiotou, N. The integration of activity based costing and enterprise modeling for reengineering purposes. Int. J. Prod. Econ. 2000, 66, 33–44. [Google Scholar] [CrossRef]
- Cooper, R.; Kaplan, R.S. Profit Priorities from Activity-based Costing. Harv. Bus. Rev. U6 1991, 69, 130–135. [Google Scholar]
- Janssen, M.; Naliwajka, P.; Stuart, P. Development of an operations-driven cost model for continuous processes part II: Retrofit process design application. J. Sci. Technol. For. Prod. Process. 2012, 2, 43–54. [Google Scholar]
- Emblemsvåg, J.; Bras, B. Activity-Based Cost and Environmental Management: A Different Approach to ISO 14000 Compliance; Kluwer Academic Publishers: Norwell, MA, USA, 2000. [Google Scholar]
- Quesada-Pineda, H. The ABCs of Cost Allocation in the Wood Products Industry: Applications in the Furniture Industry. Va. Coop. Ext. 2004, 5, 420–147. [Google Scholar]
- Greenwood, T.G.; Reeve, J.M. Activity-based cost management for continuous improvement: A process design framework. J. Cost Manag. Manuf. Ind. 1992, 5, 22–40. [Google Scholar]
- Wang, C.; Shan, L.; Zhou, L.; Zhang, G. Study on the Application of ABC System in the Refinery Industry. In Global Design to Gain a Competitive Edge: An Holistic and Collaborative Design Approach Based on Computational Tools; Springer: London, UK, 2008; pp. 773–781. [Google Scholar]
- Sawhney, R.S. An activity-based approach for evaluating strategic investments in manufacturing companies. J. Manuf. Syst. 1991, 10, 353–367. [Google Scholar] [CrossRef]
- Rivero, E.J.; Emblemsvåg, J. Activity-based life-cycle costing in long-range planning. Rev. Account. Financ. 2007, 6, 370–390. [Google Scholar] [CrossRef]
- Emblemsvåg, J. Life-Cycle Costing: Using Activity-Based Costing and Monte Carlo Methods to Manage Future Costs and Risks; John Wiley & Sons, Inc.: Hoboken, NJ, USA, 2003. [Google Scholar]
- Korpunen, H.; Paltakari, J. Testing an activity-based costing model with a virtual paper mill. Nord. Pulp Pap. Res. J. 2013, 28, 146–155. [Google Scholar] [CrossRef]
- Korpunen, H.; Virtanen, P.; Dahl, O.; Jylhä, P.; Uusitalo, J. An activity-based cost calculation for a kraft pulp mill. Tappi J. 2012, 11, 19–27. [Google Scholar] [CrossRef]
- Hsieh, C.L.; Tsai, W.H.; Chang, Y.C. Green Activity-Based Costing Production Decision Model for Recycled Paper. Energies 2020, 13, 2413. [Google Scholar] [CrossRef]
- Nurminen, T.; Korpunen, H.; Uusitalo, J. Applying the Activity-Based Costing to Cut-to-Length Timber Harvesting and Trucking. Silva Fenn. 2009, 43, 847–870. [Google Scholar] [CrossRef]
- Kropivek, J.; Jot, M.; Groelj, P.; Kuzman, M.K.; Kari, M.; Merela, M.; Buar, D.G. Innovative model of the cost price calculation of products from invasive non-native wood species based on the ftdabc method. Forests 2021, 12, 1519. [Google Scholar] [CrossRef]
- Tsai, W.-H.; Shen, Y.-S.; Lee, P.-L.; Chen, H.-C.; Kuo, L.; Huang, C.-C. Integrating information about the cost of carbon through activity-based costing. J. Clean. Prod. 2012, 36, 102–111. [Google Scholar] [CrossRef]
- Steen, M.; Steensland, T. Real-time profit monitoring and activity-based cost management. Tappi J. 1994, 77, 105–111. [Google Scholar]
- Fogelholm, J.; Hamalainen, E. Cybernetic modelling and updating of economic steering systems in the paper industries. Syst. Sci. 2005, 31, 117–125. [Google Scholar]
- Janssen, M.; Stuart, P.R. Business Model Framework for Using Real-Time Process Data for Design Decision Making. In Proceedings of the Canadian Design Engineering Network Conference, McGill University, Montreal, QC, Canada, 29–30 July 2004. [Google Scholar]
- Laflamme-Mayer, M.; Linkewich, J.; Stuart, P.R. Methodology for Using Real-Time Process Data for Cost Modeling and Supply Chain Decision Support in the Pulp and Paper Industry; Southam Business Communication Inc.: Don Mills, ON, Canada, 2008; Volume 109, pp. 44–51. [Google Scholar]
- Laflamme-Mayer, M.; Janssen, M.; Stuart, P. Development of an operations-driven cost model for continuous processes Part 1: Framework for design and operations decision making. J. Sci. Technol. For. Prod. Process. 2011, 1, 32–41. [Google Scholar]
- Marinova, M.; Mateos-Espejel, E.; Jemaa, N.; Paris, J. Addressing the increased energy demand of a Kraft mill biorefinery: The hemicellulose extraction case. Chem. Eng. Res. Des. 2009, 87, 1269–1275. [Google Scholar] [CrossRef]
- Kopra, R.; Kari, E.; Harinen, M.; Tirri, T.; Dahl, O. Optimization of wash water usage in brown stock washing. In Proceedings of the 2010 TAPPI PEERS Conference and 9th Research Forum on Recycling, Norfolk, VA, USA, 18–21 October 2010; Volume 1, pp. 660–695. [Google Scholar] [CrossRef]
- Kopra, R.; Koivula, K.; Dahl, O. Optimization of a brownstock washing line. Tappi J. 2015, 14, 83–91. [Google Scholar] [CrossRef]
- Cantrell, J. Brownstock washing cost optimization. In Proceedings of the TAPPI, Pulping, Engineering, Environmental, Recycling, Sustainability, St. Louis, MO, USA, 27–30 October 2019. [Google Scholar]
- Chew, I.M.L.; Foo, D.C.Y.; Bonhivers, J.-C.; Stuart, P.; Alva-Argaez, A.; Savulescu, L.E. A model-based approach for simultaneous water and energy reduction in a pulp and paper mill. Appl. Therm. Eng. 2013, 51, 393–400. [Google Scholar] [CrossRef]
- Kopra, R.; Karjalainen, S.; Tirri, T.; Dahl, O. Optimisation of pressure filter performance using refractometer measurements -Mill investigations. Appita J. 2011, 64, 49–54. [Google Scholar]
- Svensson, E.; Berntsson, T. Operational Flexibility in Pulp Mill Steam Production at off-design Heat Loads. Chem. Eng. Trans. 2013, 35, 919–924. [Google Scholar]
- Svensson, E. Flexibility to Seasonal Demand Variations in Pulp Mill Steam Production: The Effect of Steam Savings Leading to Off-design Heat Loads. Appl. Therm. Eng. 2014, 70, 1180–1188. [Google Scholar] [CrossRef]
- Svensson, E.; Edland, R.; Langner, C.; Harvey, S. Assessing the value of a diversified by-product portfolio to allow for increased production flexibility in pulp mills. Nord. Pulp Pap. Res. J. 2020, 35, 533–558. [Google Scholar] [CrossRef]
- Villarreal, H.G. Assessment and Enhancement of the Performance of the Pulp Washing Operation in Kraft Mills. Ph.D. Thesis, École Polytechnique de Montréal, Montreal, QC, Canada, 2011. [Google Scholar]
Disclaimer/Publisher’s Note: The statements, opinions and data contained in all publications are solely those of the individual author(s) and contributor(s) and not of MDPI and/or the editor(s). MDPI and/or the editor(s) disclaim responsibility for any injury to people or property resulting from any ideas, methods, instructions or products referred to in the content. |
© 2023 by the authors. Licensee MDPI, Basel, Switzerland. This article is an open access article distributed under the terms and conditions of the Creative Commons Attribution (CC BY) license (https://creativecommons.org/licenses/by/4.0/).