

Hydraulic Design of Sediment-Trapping Basin in Wadis Using Empirical Equations and Deposition Processes


1
Civil Engineering Department, College of Engineering, Prince Sattam Bin Abdul-Aziz University, Al-Kharaj 11942, Saudi Arabia
2
Department of Civil Engineering, Faculty of Engineering, Red Sea University, Port Sudan 36481, Sudan
3
Coastal Research Institute (CoRI), National Water Research Center, Alexandria 21415, Egypt
*
Author to whom correspondence should be addressed.
Processes 2023, 11(9), 2729; https://doi.org/10.3390/pr11092729
Submission received: 20 May 2023
/
Revised: 18 August 2023
/
Accepted: 28 August 2023
/
Published: 12 September 2023
(This article belongs to the Special Issue Bioremediation Processes of Contaminated Soil and Sediments)
Abstract
:Reservoirs overflow during flood season because of sedimentation cycles, which severely affects their effectiveness. Siltation is a major problem in dams constructed in waterways in arid and semi-arid areas. Therefore, the reservoirs in wadis lose their capacity due to sedimentation. This study determines an optimal design of the trapping basin on steep slope areas for Wadi Bishah in the Asir region of southwestern Saudi Arabia. The empirical design criteria of the sediment-trapping basin is used to mitigate the effects of sedimentation in the King Fahd Dam. The empirical design of the trapping basin constructed upstream of the dam located in the wadi is presented. Moreover, the annual suspended and bed sediment load (Qs and Qb) techniques for estimating the volume of sediments are used, and the relationship between the sediment trapping efficiency and size is determined. The sediment trapping in Wadi Bishah upstream sediment-trapping basins is selected to reduce the amount of sediment. One of the important results of this study tries to create a new concept to trap sediment in wadis, which are located in arid and semi-arid areas. The results obtained were evaluated using theoretical and empirical equations to determine the appropriate size of the basin. The results demonstrate that the optimal dimensions for the sediment confinement basin are Lb × Wb × hs = 3500 × 500 × 1.5 m. Also, for these dimensions, the basin efficiency was assumed to be in the range of 60–70%. The trap basin should be constructed at open check dams upstream (U/S) of the proposed basin to enhance its efficiency. Further investigation is required to understand the transport and deposition of sediments, particularly fine sediments in the basin. Additionally, the effects of sediment traps in Wadi Bishah should be assessed during the construction of these structures to aid water resource management and mitigate flood disasters.
1. Introduction
The sedimentation of reservoirs is a severe problem encountered in dams globally. Therefore, it is crucial to develop methods to prevent the sedimentation of dams. Siltation is a significant problem in barriers. Particularly, dams built in arid and semi-arid waterways are affected by siltation. Consequently, reservoirs lose their capacity due to the sedimentation process and problems such as the clogging of outlet structures. Two methods can be used to reduce reservoir sedimentation, namely sediment retention in the watershed area and sediment removal from the reservoir [1]. Preventing erosion is generally preferable to capturing sediment from eroded areas. Other methods such as vegetation are considered infeasible. Hence, sediment-trapping basins are typically selected as support systems. The World Commission on Dams (WCD) reported in 2000 that reservoirs worldwide are losing approximately 1% of their storage capacity annually [2]. Sedimentation causes severe problems in dams by reducing useful storage and the capacity of dams for flood routing. This increases flooding hazards in the dam and downstream regions. Sediments can lead to additional problems and floating debris during floods in outlet structures by clogging them, resulting in dangerous situations or damaging trash screens [2,3]. If the sediment inflow is large relative to that of the reservoir storage capacity, the useful life of the reservoir is significantly reduced. For example, a small reservoir on the Solomon River near Osborne, Kansas, was filled with sediment during the first year of operation [4,5]. According to the (ICOLD 1989) definition, sediment deposition occurs when the flow enters the reservoir due to decreased flow velocity. Therefore, a reduction in the transport capacity of the flow occurs [6]. Several methods are used to estimate the annual sediment load trapped in dams because computing the sediment load in streams is difficult. The sediment load principle for rivers can be divided into three types—calculating the suspended load, estimating the bed load, and computing the total sediment load. Additionally, sedimentation models such as sedimentation and river hydraulics (SRH-1D) and CCHE2D models have been developed that can estimate the average sediment accumulation. These models have been applied to high dams in Egypt and the Angereb dam in Ethiopia. The SRH-1D model is one dimensional and contains 14 sediment transport equations. The basic data requirements for the model can be divided into three broad categories, namely geometric, spatial and temporal, hydraulic, and sediment data [7,8]. The modeling approach using CCHE2D has proven to be a useful tool to monitor future water flow and sediment deposition in reservoirs [9].
Morris and Fan (1997) describe two strategies to reduce the sediment yield entering a reservoir: either prevent erosion or trap eroded sediment before it reaches the reservoirs [10]. Figure 1 below is helpful in showing that there are several levels at which management effort can be targeted to reduce silt retention by reservoirs either using broad-scale land management type plans or aiming at the reservoir itself or the dam.
Sediment trapping by upstream dams is a crucial factor that controls sedimentation in reservoirs. However, there are two potential drawbacks of using this strategy as a long-term protection measure. First, the sediment retention capacity of the upstream reservoir is limited. Second, owners of upstream sites might modify their operations to allow sediment to flow downstream [10]. Torrential hazard mitigation is an important issue in steep slope areas, wherein morphological changes are characteristically short and abrupt, and new protection methods are constantly being developed [11]. Vegetation cover is crucial for preventing erosion and scouring in the watershed area. Therefore, clearing native vegetation is a well-documented cause of increased soil erosion [12]. Detention or trapping basins are constructed to trap sediments that might settle in the stream networks. Settling basins are formed in reaches where the flow velocities are reduced to the limit required to ensure that sediment settles in the basin. The main advantage of settling basins is obtaining high sediment trap efficiency. In contrast, it has disadvantages such as the higher cost and reduction in the trap efficiency that occurs as basins fill with sediment. In order to achieve the required design standards, a settling basin is typically created adjacent to the headwork of hydroelectric plants to facilitate the settlement and exclusion of sediments [13,14]. Measures for sediment trap have been widely employed in the Yellow River basin. They comprise the construction of structures to retain sediment on slopes and within sediment settling basins and dam systems in channels called check dams, which capture sediment discharged from the slope. Additionally, these dams act as sources of water for residents and agricultural enterprises in several cases [15]. M.M et al. 2012 evaluated the settling basin design criteria directly downstream of the gravity canal intake for the prevention of sedimentation. Heavy sediment-laden rivers such as the Tana River feed Kenya’s canal network. Sediment traps can significantly disrupt the sediment regime, severely affecting the river ecology and environmental conditions. However, these effects vary depending on the system. Hence, further research is required to determine the effect of sediment traps in mountain streams to assist resource managers to mitigate flooding hazards and ensure the future construction of these structures [16]. A popular metric to evaluate the efficacy of desanding facilities is trapping efficiency [17]. Current design guidelines include the transition zone and intake channel shapes to increase the efficiency of desanding facilities’ trapping processes. The King Fahd Dam is annually exposed to a considerable volume of sediments, which decrease its design capacity. It is located in the Bishah Valley and was constructed in 1997. The King Fahad Dam is one of the largest dams in the Kingdom of Saudi Arabia, and it does not have a system for sediment control. Therefore, this study attempts to provide practical solutions for sedimentation in the King Fahd Dam using the sediment-trapping basin technique and empirical equations, considering the future performance and efficiency of these basins.
2. Materials and Methods
2.1. Study Area
Wadi Bishah is located in the southwestern region of Saudi Arabia, Wadi. It is a major drainage system which originates in the high-altitude mountain regions 2380–2112 m above the sea level. Figure 2 shows the location map of Wadi Bishah and King Fahad Dam (previously known as the Bishah dam) is located in the Asir province, which is approximately 35 km south and southwest (S_SW) of Bishah town, which is approximately 350 km SE of Taif city. The purpose of the dam is to recharge the aquifer and perform flood protection of the Bishah valley.
The main length of Wadi Bishah is 287 km from upstream (E: 42.20 N: 19.27) to downstream (E: 43.57 N: 21.32) represented as an inlet point and outlet point. The catchment area of the King Fahd Dam site is 7600 km2. Figure 3 shows the topographic map of the study area constructed by Alshaikh in 2015 [18].
2.2. King Fahd Dam
The King Fahd Dam is the second largest gravity concrete dam (after the High Dam in Egypt in terms of size) in the Middle East and was constructed in 1997. The King Fahad Dam site is 3 km upstream of Aqiliyah village, as shown in Figure 4.
The King Fahad Dam is administered by the Ministry of Environment, Water, and Agriculture. It was the highest dam in Saudi Arabia (H = 68 m) before the construction of Hali Dam (H = 106 m) was completed in 2009. The reservoir of the King Fahad Dam has the largest storage capacity of 325,000,000 m3. The water body upstream of the dam is used for controlled agriculture, irrigation of neighboring farms, replenishing groundwater, and compensating for surface water loss due to the drought along Wadi Bishah. The dam was constructed to protect the area from flooding, feed the water-bearing sedimentary layers, compensate for water withdrawal from the area’s groundwater reservoir, and feed a water-purification plant.
Table 1 lists the structural specifications of the King Fahad Dam (body of dam and dam control structures, (MOEAW, 1983).
2.3. Rainfall Data
There are four rainfall stations near the study area (Station Nos. 65, 82, 80, and 81). The rainfall data were recorded at rainfall gauge station 65. The details of rainfall stations are shown in Table 2, and the locations of these rainfall gauges are illustrated in Figure 5.
The Wadi Bishah drainage basin area is characterized by arid and semi-arid conditions. The rainfall values of the catchment area of the Bishah dam were calculated using the rainfall data of the stations, as shown in Table 3, which lists the descriptive statistics of the daily maximum rainfall (DMR) (mm) for the (Wadi Bishah, M001) station using the Hyfran plus model.
2.4. Proposed Location of Sediment-Trapping Basin
The purpose of a sediment trap basin is to facilitate the sedimentation process by reducing the velocity and turbulence of the river watercourse. It is crucial to select an optimum location for this trapping basin. An optimum site for a sedimentation basin depends on the flow velocity (minimum flow velocities) and satellite images (https://earthexplorer.usgs.gov/, accessed on 1 March 2022).
The following criteria should be considered to determine the location of a sediment-trapping basin in Wadi.
- The sediment-trapping basin should be at a location that is easy for maintenance and cleaning works.
- The sediment-trapping basin should be in an area with a large width to reduce the flow velocity.
- Satellite images should be used to select an optimum location for the trapping basin.
- The basin should be located in the mainstream to ensure that the sediments are collected from the minor streams.
USGS Maps (U.S. Geological Survey) were used in this study. Figure 6 shows several surveying locations of sediment-trapping basins upstream of the King Fahd Dam in Wadi Bisha. The most appropriate location for the sediment-trapping basin was 16 km upstream of the King Fahd dam and 8 km upstream of the reservoir at the eastern branch. These sections had the largest cross-sectional area and minimum flow velocity, as shown in Figure 6.
2.5. Chezy’s Formula for Uniform Open-Channel Flow
The several governing equations used in this study were Chezy’s formula, which is probably the first formula derived for uniform and steady flow.
The Chezy equation for the flow is
where V is the average velocity (m/s); R is the hydraulic radius equal to (A/P); S is the slope of the bed of the channel (m/km) (slope from section to section); and C is Chezy’s coefficient of bed roughness.
A represents the area of water of the section and is calculated using Equation (3).
P is the wetted perimeter of the section (m) and is expressed as
where b is the bed width (m), y (= h) is the depth of water (m), and z is the side slope.
It was reported by Chow in 1959 that the side slope is 1:1 for soil with stone lining or earth for large channels, 3:2 for clay or soil for small ditches, and 2:1 for sandy soil [20].
2.6. Design Considerations of Trapping Basin Design
For the empirical design of the sediment-trapping basin, it is vital to define the main design criteria. It may include the following.
- It is preferable to consider the bed load as 10–15% of the suspended load.
- It is not required to trap fine particles, which are sediment particles smaller than 63 microns in size.
- The sediment-trapping basins are designed to trap the majority of the particle sizes greater than 0.063 mm, which includes fine sand and coarser materials such as gravel.
- Setting the minimum basin trap efficiency as 60–70%.
- The ratio of the basin length\width is maintained in the range of 4–10 as recommended.
- The fine particles such as silt and sand need to trap with the structure of a check dam.
2.6.1. Length of Settling Basin (
The sediment-trapping efficiency of the settling basins increases with an increase in the size of the sediment to be extracted. The volume of sediment extracted is primarily determined by the size of the sediment and the volume of discharge diverted through the basin [13].
Camp in 1946 presented a relationship that described the distance (L) a specific sediment particle of settling velocity Us should travel [21].
The required distance () of a trapping basin should be defined using the following empirical equation:
whereis the upstream stream water depth (inlet of basin); is the sediment settling basin length and is the average flow velocity within the basin.
Us is assumed for ideal situations of medium silt particles, wherein fine silt and clay pass through the trapping basin and are deposited in the King Fahd Dam. The settling velocity of a sediment particle (mean diameter less than 0.10 mm) settling in water mixed with sediment can be determined using the approach of van Rijn (1987) as follows:
where Us is the particle fall velocity in a mixed sediment-water (m/s); C is the mean sediment volume concentration (mg/L); ds is the mean sediment particle diameter; a is a coefficient (a = 4–5 for particles in the range of 50–500 mm); γs is the specific weight of the sediment (γs =2.65 t/m3); γw is the specific weight of water (γw = 62.4 lb/ft3, 9810N/m3); and υ is the kinematic viscosity of water (m2/s) [22]. The kinematic viscosity is related to the temperature of water in the gravity canal as follows (van Rijn 1987):
2.6.2. Surface Area of Settling Basin (As)
The required surface area (A) of a perfect sediment-trapping basin should be defined through several formulas. Camp in 1946 proposed an equation to determine the area of the trapping basin as follows:
where As is the surface area of the trapping basin (m2); Lb is the sediment-trapping basin length (m); Wb is the sediment-trapping basin width (m); Q is the flood discharge rate (m3/s) corresponding to return period 10–100 years (peak).
2.6.3. Width of Surface Area of Trapping Basin (Wb)
Equation (9) can be used to evaluate the width of the settling basin water surface Wb for a trapezoidal stream.
where hb is the water depth within the trapping basin (m); hb is the water depth selected primarily by the designer and represents the water height planned in the trapping basin; Wb is the sediment-trapping basin width; Wbottom is width at the bottom of the settling basin (m); and z is the slope of sides {(H: V, z = H/Z), (for 1:2, z = 2)}.
Equation (10) determines the basin width for the minimum length of the detention bsin (Lb)
2.6.4. Trapping Basin Storage Volume of Sediments (Vs)
Equation (11) shows that the quantities of sediment accumulated over three years are determined by the sediment loads entering the trapping basin, the portion of target sediment removed (R), and the settling velocity of sediment particles in the basin.
where Vs is the volume of the sediment storage required (m3); Ac is the contributing watershed area in km2; R is the trap efficiency (%); TSL (SYR) is the sediment loading rate (m3/km2/year); and F is frequency in years.
2.6.5. Sediment-Trapping Efficiency and Sediment Particles Sizes
Elfiky in 2008 developed the following empirical relation to determine the percentage (%) of sediment trapped in the settling basin:
where ξb is the sediment-trapping efficiency; Us is the particle settling velocity in water (m/s); As is the surface area of the trapping basin (m2); and Q is the flood rate (m3/s).
3. Results of Hydraulic Design
The design of a debris basin is a three-step process. The first step is determining the critical sediment size or other critical aspects of the inflowing sediment load that should not be exceeded during the design event for the downstream conveyance system to function correctly. The second step is calculating the grain size distribution and volume of the inflowing load. The third step is determining the hydraulic characteristics of the basin required to trap the target grain size without trapping extremely fine material. A few researchers in 2016 had reported that sediment traps with open check dams are widely used structures for flood hazard mitigation. The main dimensions of the basin illustrated in Figure 7 are Lb × Wb × ds. These dimensions are crucial as they significantly affect the trap efficiency [23].
3.1. Data Required for Sediment-Trapping Basin Design
In general, the data required for the design of the trapping basin can be grouped into three broad categories, geometric, hydraulic, and sediment data.
These data establish the boundary conditions required to solve empirical equations and proposed options. The data collection was analyzed and processed to fit the criteria of design.
- (1).
- Geometric Data
The geometric data describe the cross-sections and longitudinal profile of the Wadi Bishah basin. The cross-section describes the area (A), depth (d, h), wetted perimeter (P), and hydraulic radius (R) of the natural stream (basin inlet). The longitudinal profile describes the slope of Wadi (S) near the basin, which is defined by a distance and elevation above a reference point (AMSL).
- (2).
- Hydraulic Data
The hydraulic data include the upstream and downstream flood conditions. The flow velocity (v) and discharge (Q) are determined.
- (3).
- Sediment Data Collected and Analysis
3.1.1. Sediment Data
Flow and sediment-transport data are analyzed and simulated to obtain the following.
- -
- The flow duration curve (FDC).
- -
- The sediment-rating curves (SRC).
The geometric data described the cross-section and longitudinal profile of Wadi Bishah near the inlet of the trapping basin. The digital elevation model (DEM) fitted the slope and the slope was determined as 10.6 m/km; see Figure 8.
3.1.2. Hydraulic Data
- A.
- Calculating the Flow Velocity
The minimum velocity of the Wadi Bishah trapping basin cross-section (inlet) is crucial to design the trapping basin. The shape of cross-sections was determined using Global Mapper-V24. A sample section was included to obtain the optimum hydraulic trapezoidal section for the basin with streamside slopes of 1:1. A velocity profile was used to determine the velocity for a cross-section.
The flow is uniform in the trapezoidal section of an open channel shown in Figure 9, considering all cross-sections as trapezoidal.
It was reported by Chow in 1959 that the side slope is 1:1 for soil with stone lining or earth for large channels, 3:2 for clay or soil for small ditches, and 2:1 for sandy soil [20].
Therefore, after substituting Equations (1)–(4) in the correct order (see Figure 9), we obtain the following equations.
Chezy’s coefficient of bed depends on the assumptions about the Manning’s roughness coefficient of the surface material of soil in the Wadi (an inlet of the basin→earth channel—gravelly) [24].
The slope of the channel bed is m/km (slope from section to section; see Figure 8).
The velocity obtained using Chezy’s formula is as follows:
Therefore, a velocity of 4.49 m/s was used for the design. The geometric parameters according to the cross-section (inlet of basin) are slope 7.15 × 10⁻³ (m/m), channel bed- width 76.65 (m), area 142.8 (m2), P 81.8 (m), R 1.75 (m), C 43.89, and velocity 4.49 (m/s); accordingly, the cross-sectional survey of the Wadi was performed.
- B.
- Design Flows Wadi Bishah (Qdesign)
The discharge rate used for designing a water–sediment-trapping basin should fit the surface runoff conditions that are usually observed during the most frequent rainfall event, and a discharge rate of Q peak = 2688 m3/s (MEWA,2020) was selected for this study show in Figure 10.
3.1.3. Collection of Sediment Data and Analysis
The sedimentation measurements of Wadi Bishah in 1973 shown below in Table 4 adopted the maximum value of SSC [25].
- A.
- Sediment Gradation:
The sediment particle size was defined using the Unified Soil Classification System (AGUS), as listed in Table 5. The maximum clay, silt, and sand sizes considered for the trapping basin design were 0.004, 0.0625, and 0.2 mm, respectively. These values are listed in Table 6.
- B.
- Total Sediment Load Entering the Trapping Basin
Different techniques are used for estimating the total annual sediment load (QT = Qb+ Qs). Several prediction methods have been reported for estimating total sediment load using suspended sediment concentration SSC and optimization approaches [6]. The annual average sediment load was 1823130.208 m3/year, as listed in Table 7 and Table 8.
The scenarios below related to the flood period, which occurs (365,120,60 days) of the year. The 3 Scenario 3-3 was selected because it was reflective of the historical data of Wadi Bishah watershed sediment yield, which is (SYR 1973 =192 m3/year/km2→1,459,200 m3/year) (MOWE, 1973). Ministry of Water and Electricity.

The annual total sediment load in m3/year at the entrance to the trapping basin, including suspended and bed sediment loads, is 1,519,275.173 + 303,855.0346 = 1,823,130.208 m3/year.
Table 8 lists the magnitudes of the total sediment load estimated according to the grain size analysis of Wadi Bishah.
Table 8 shows that the trap efficiency R(%) for the clay and silt was 30%→71.966 m3/km2/year, and that for the coarse material was 70%→167.921; therefore, R was assumed in the range of 60–70% for the estimation of the trapping basin volume (Vs).
3.2. Hydraulic Design of Sediment-Trapping Basin
A sediment-trapping basin was designed to reduce the sediment particles flowing through Wadi Bishah to King Fahd Dam. This study used theoretical and empirical equations to determine the minimum volume of the trapping basin required to trap sediments. Parameters such as the length of the settling basin (Lb), settling velocity of the sediment particle (Us), surface area of the settling basin (As), and width of the surface area of the settling basin (Wb) were used.
- A.
- Length of Settling Basin (:
Us is assumed for ideal situations of medium silt particles, wherein fine silt and clay pass through the trapping basin and are deposited in the King Fahd Dam, where and = is the sediment particle settling velocity (=0.0023).
Here,is the upstream stream water depth (inlet of basin). It can be observed from Equation (5) that is the sediment settling basin length and = is the average flow velocity within the basin.
The equation below is an empirical formula adopted by Camp in 1946. It describes the distance (Lb) traveled by a specific sediment particle for a settling velocity Us [21].
- B.
- Surface Area of Settling Basin (As)
- C.
- Width of Surface Area of Trapping Basin (Wb)
To determine the basin width for the minimum length of the detention basin (Lb)
Table 9 lists the trapping basin parameters of the Wadi.
A rectangle shape with an Lb/Wb ratio greater than 2 is recommended to increase the trap efficiency in the basin while designing a trapping basin. The basin parameters are provided in Table 9 and Figure 11.
- D.
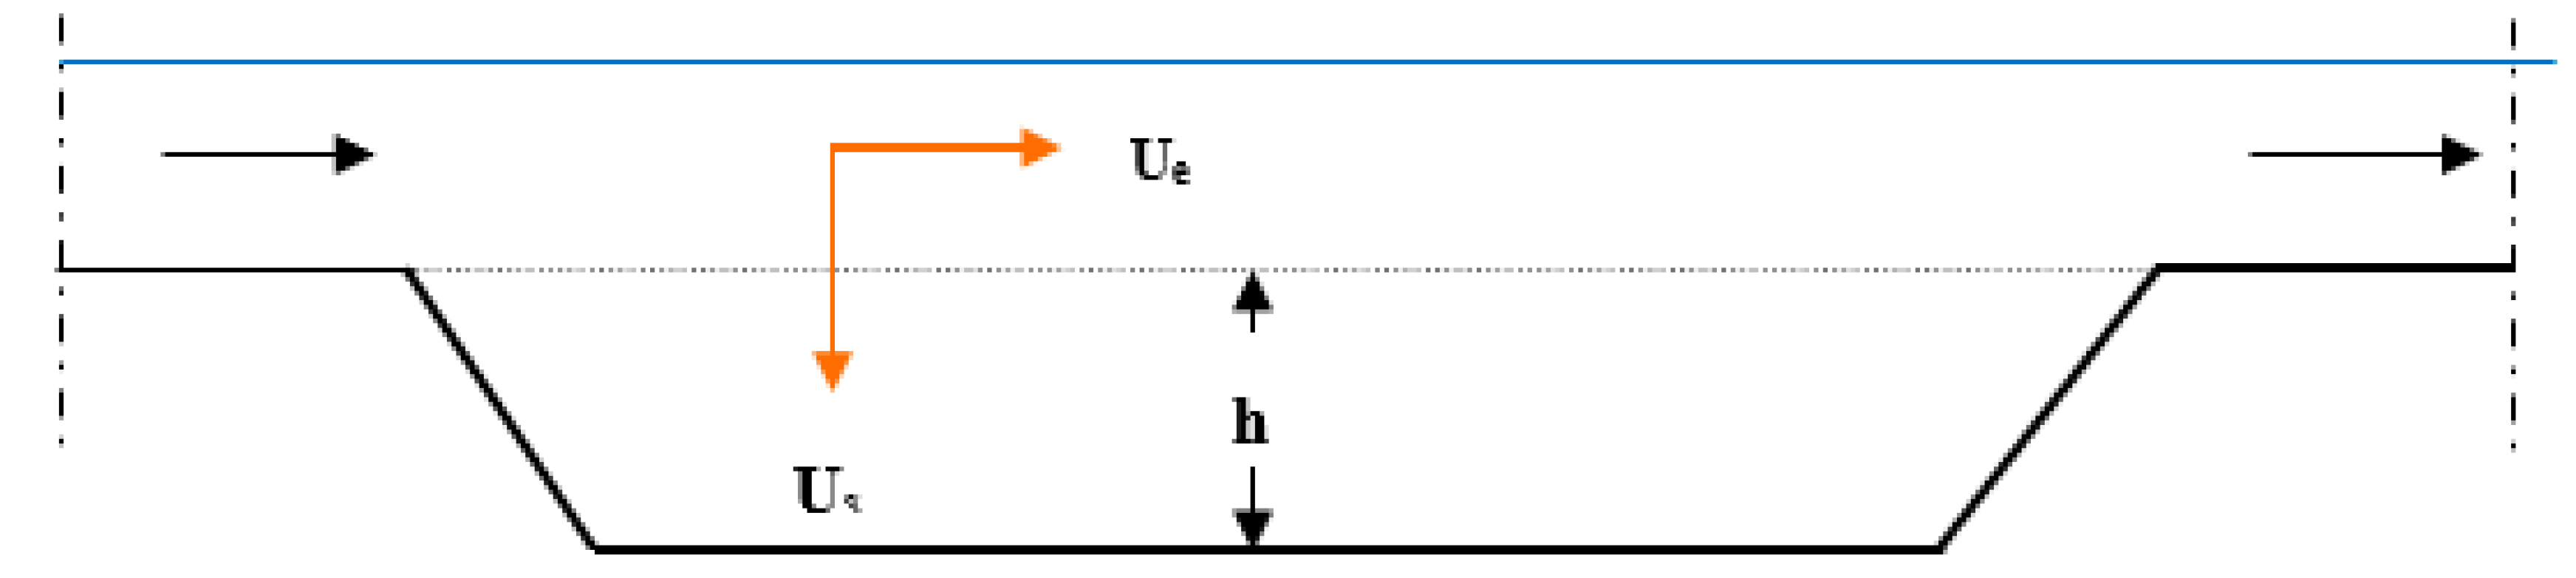
- Minimum Depth of Trapping Basin (hs)
It is necessary to prevent the re-suspension of sediment particles once they have settled to the bed of the trapping basin. This is performed by lowering the flow velocity near the bed basin (tangential velocity, vtan) to a level lower than that of the velocity at which sediment particle re-suspension occurs (entrainment velocity, Uent). Sufficient flow depth and flow area should be maintained in the trapping basin during frequent rainfall events to achieve this objective. Figure 12 depicts these velocities.
- E.
- Trapping Basin Storage Volume of Sediments (Vs)
The provision of sufficient storage for settled sediment to prevent the requirement for frequent desilting is a consideration during the design of a settling basin. The settling basin storage volume (Vs) should be greater than that of the volume of the accumulated sediment over the desired desilting years. The optimum frequency of desilting the settling basin is at intervals of three years. The quantities of sediment TSL (SYR) accumulated over three years are determined with the trap efficiency (R %) assumed as 60–70%. The Wadi Bishah watershed area (7600 km2) sediment yield rate S·Y·R shown in Table 8 is 167.921 (m3/km2/year). The trap efficiency (%) is assumed as 60–70%, the frequency varies each year. Equation (17) is used to estimate sediment storage volume in the sediment-trapping basin. Equation (17) and Table 8: V3years = 2.4 × 10⁶ m3, Vb = 2.6 × 10⁶ m3. Therefore, the basin storage volume (Vb) is sufficient for the accumulated sediment over three years. The maintenance and cleaning of the deposits trapped in the basin should be performed at an interval of three years.
4. Discussions
Sediment-trapping basins provide a feasible solution to the problems of siltation, which is important to reservoir life; one of the important results of this study tries to create a new concept to trap sediment in wadis in arid and semi-arid regions. This study provides a proposal of sediment-trapping basins to trap sediments that helps to effectively manage and control sediment in reservoirs. This option of sediment control and trap is a feasible solution for reaching the optimal design of dams located on steep slope areas such as Wadi Bishah in the south of Saudi Arabia. The sediment-trapping basin is one of the mitigation measures that can be taken in order to reduce the amount of sediment inflow (watershed rehabilitation as structural measures). Sediment-trapping basins do not prevent erosion; they trap eroded watershed soil before it can arrive at dams. Therefore, it is of course far better to prevent erosion than it is to trap sediment from eroded areas. The sediment-settling basin is selected in this study because other procedures such as vegetation are not feasible. Sediment trapping is only a temporary measure unless it is combined with sediment removal, and sediment removal from the reservoir would probably be materially more difficult and costly than removal from detention basins. Sediment traps with open check dams are widely used structures for flood hazard mitigation. Sediment-trapping basins are built with sufficient sediment load storage capacity to ensure sediment removal at an interval of three years. The trapping basin must be emptied after seasonal flood events (in the period of drought Wadi Bishah). The best periods for desilting work are October to the first of December and from March to April. The optimum settling basin dimensions are Lb × Wb × hs = 3500 × 500 × 1.5 m. Also, for these dimensions, the basin efficiency was assumed to be in the range of 60–70%. For these dimensions, the detention basin should be enough to receive about 30% of the suspended sediment load, and all the sediment of sizes larger than 0.03 mm should be trapped in the settling basin with a basin trap efficiency of 60–70%. The relationship between the settling velocity US of sediment entering the basin and basin length Lb indicated that the minimum values of settling velocity increase the length of the sediment-trapping basin and thus increases the detention time (and hence trap efficiency, R). The relationship between basin areas As and values of settling velocity US for medium sand, fine sand, medium silt and clay with sediment trap efficiency of 60–70% indicated that the minimum values of settling velocity increase the surface area of the settling basin and thus increases the detention time (and hence trap efficiency, R). Finally, for more efficiency, it is recommended to construct sediment traps with open check dams, which are widely used structures for flood hazard mitigation. Sediment-trapping basins are built with sufficient sediment load storage capacity to ensure sediment removal at an interval of three years. Open check dams should be constructed upstream of the trap basin to enhance the efficiency of the sediment-trapping basin. The Wadi Bishah trapping basin should be emptied (during the period of drought in Wadi Bishah) following seasonal flood events.
5. Conclusions
The optimum sediment-trapping basin dimensions were Lb × Wb × hs= 3500 × 500 × 1.5 m. The optimum location for a sediment-trapping basin was 16 km upstream of the King Fahd Dam and 8 km from the end of the lake at the western branch. These sections had the largest cross-sectional area and minimum flow velocity. The trap efficiency of the basin was estimated to be in the range of 60–70% because sediments, except clay and fine silt (40–30%), were trapped. Sediment particles of sizes larger than 0.03 mm should settled and be trapped in the sediment-trapping basin with a basin trap efficiency of 60%. A check dam with spillway gates should be constructed at the basin outlet with a height of 2 m and width of 500 m to increase the trap efficiency of the sediment-trapping basin. The Wadi Bishah trapping basin should be emptied after seasonal flood events (in the period of drought).
Author Contributions
Conceptualization, A.T.B.T. and A.A.; methodology, A.T.B.T. and A.M.A.M.; formal analysis, A.T.B.T.; investigation, A.T.B.T. and A.M.A.M.; resources, A.A.; data curation, A.T.B.T. and A.A.; writing—original draft preparation, A.T.B.T. and A.A.; writing—review and editing, A.T.B.T. and A.M.A.M.; supervision, A.M.A.M.; funding acquisition, A.T.B.T. All authors have read and agreed to the published version of the manuscript.
Funding
This research received no external funding.
Data Availability Statement
Data can be made available upon reasonable request.
Acknowledgments
The authors gratefully acknowledge that: “This study is supported via funding from Prince Sattam bin Abdulaziz University, project number (PSAU/2023/R/1444)”.
Conflicts of Interest
The authors declare no conflict of interest.
Abbreviations
| WCD | World Commission on Dams |
| GIS | Geographical Information System |
| U/S | Upstream |
| D/S | Downstream |
| SRH-1D | Sedimentation and River Hydraulics—One Dimension |
| CCHE2D | Center for Computational Hydro science and Engineering Two Dimension |
| MOEAW | Ministry of Water, Environment and Agriculture |
| USGS | United States Geological Survey |
| DEM | Digital Elevation Model |
| DMR | Daily Maximum Rainfall |
| AMSL | Above Mean Sea Level |
| FDC | Flow Duration Curve |
| SRC | Sediment-Rating Curves |
| AGUS | Unified Soil Classification System |
| MOWE | Ministry of Water and Electricity |
| DSF | Daily Suspended Flow |
| SSD | Daily Suspended Sediment |
| SL | Suspended load |
| BL | Bed Load |
| BM | Bed Material Load |
| TSS | Total Suspended Solids |
| SSC | Suspended Sediment Concentration |
| FISP | Federal Interagency Sedimentation Project |
| NTU | Nephelometric Turbidity Unit |
References
- Schleiss, A.J.; Franca, M.J.; Juez, C.; De Cesare, G. Reservoir sedimentation. J. Hydraul. Res. 2016, 54, 595–614. [Google Scholar] [CrossRef]
- WCD. Dams and Development: A New Framework for Decision-Making; Earth Scan Publications Ltd.: London, UK, 2000; 356p. [Google Scholar]
- Adamo, N.; Al-Ansari, N.; Sissakian, V.; Laue, J.; Knutsson, S. Dam safety: Sediments and debris problems. J. Earth Sci. Geotech. Eng. 2021, 11, 27–63. [Google Scholar] [CrossRef] [PubMed]
- Linsley, R.K.; Franzini, J.B. Water Resources Engineering; McGraw Hill: New York, NY, USA, 1979; 688p. [Google Scholar]
- Ezz-Aldeen, M.; Hassan, R.; Ali, A.; Al-Ansari, N.; Knutsson, S. Watershed sediment and its effect on storage Capacity: Case Study of Dokan Dam Reservoir. Water 2018, 10, 858. [Google Scholar] [CrossRef]
- ICOLD. Selecting Parameters for Large Dams—Guidelines and Recommendations: ICOLD Committee on Seismic Aspects of Large Dams, Bulletin; International Commission on Large Dams: Paris, France, 1989; Volume 72, p. 36. [Google Scholar]
- Aldrees, A.; Bakheit, A.T.; Assilzadeh, H. Prediction of total sediment load: A case study of Wadi Arbaat in eastern Sudan. Smart Struct. Syst. 2020, 26, 781–796. [Google Scholar] [CrossRef]
- Zeleke, T.; Moussa, A.M.; El-Manadely, M.S. Prediction of sediment inflows to Angereb dam reservoir using the SRH -1D sediment transport model. Lakes Reserv. Res. Manag. 2013, 18, 366–371. [Google Scholar] [CrossRef]
- Moussa, A.M.A. Predicting the deposition in the Aswan High Dam Reservoir using a 2-D model. Ain Shams Eng. J. 2013, 4, 143–153. [Google Scholar] [CrossRef]
- Morris, G.L.; Fan, J. Reservoir Sedimentation Handbook; McGraw-Hill Book Company: New York, NY, USA, 1997; 784p. [Google Scholar]
- Mizuyama, T. Structural Countermeasures for Debris Flow Disasters. Int. J. Eros. Control. Eng. 2008, 1, 38–43. [Google Scholar] [CrossRef]
- Pimentel, D. Soil Erosion and the Threat to Food Security and the Environment. Ecosyst. Health 2000, 6, 221–226. [Google Scholar] [CrossRef]
- Vanoni, V.A. (Ed.) Sedimentation Engineering: American Society of Civil Engineers, Manuals and Reports on Engineering Practice; American Society of Civil Engineers (ASCE): New York, NY, USA, 1975; No. 54; 745p. [Google Scholar]
- Iyer, J.C.; James, E.J. Model studies for the design of inlet transition of settling basins of hydropower projects in high sediment yield areas: A review. ISH J. Hydraul. Eng. 2022, 29, 351–359. [Google Scholar] [CrossRef]
- Zhang, X.; She, D. Quantifying the sediment reduction efficiency of key dams in the Coarse Sandy Hilly Catchments region of the Yellow River basin, China. J. Hydrol. 2021, 602, 126721. [Google Scholar] [CrossRef]
- Elfiky, M.M.; Nassar, M.A.; Elnikhely, E.A. Numerical Modeling of Sedimentation process in Settling Basins (Case Study Tana River). In Proceedings of the VII International Conference on Environmental Hydrology & Its Engineering Aspect and the First Symposium—Environmental Impacts on Nile Water Resources, Cairo, Egypt, 25–27 September 2012. [Google Scholar]
- Paschmann, C.; Vetsch, D.F.; Boes, R.M. Design of Desanding Facilities for Hydropower Schemes Based on Trapping Efficiency. Water 2022, 14, 520. [Google Scholar] [CrossRef]
- Mathers, K.L.; Kowarik, C.; Rachelly, C.; Robinson, C.T.; Weber, C. The effects of sediment traps on instream habitat and macro invertebrates of mountain streams. J. Environ. Manag. 2021, 295, 113066. [Google Scholar] [CrossRef] [PubMed]
- Alshaikh, A. Vegetation cover density and land surface Temperature Interrelationship Using Satellite Data, Case Study of Wadi Bisha, South KSA. Adv. Remote. Sens. 2015, 4, 248–262. [Google Scholar] [CrossRef]
- Chow, V.T. Open Channel Hydraulics; McGraw Hill Book Company: New York, NY, USA, 1959. [Google Scholar]
- Camp, T.R. Sedimentation and the design of settling tanks. Trans. Am. Soc. Civ. Eng. 1946, 111, 895–936. [Google Scholar] [CrossRef]
- Van Rijn, L.C. Mathematical modeling of Morphological Processes in the case of Suspended Sediment Transport. Delft Hydraul. Commun. 1987, 382. [Google Scholar]
- Piton, G.; Recking, A. Design of sediment traps with open check dams. I: Hydraulic and deposition processes. J. Hydraul. Eng. 2016, 142, 04015045. [Google Scholar] [CrossRef]
- Arcement, G.J.; Schneider, V.R. Guide for Selecting Manning’s Roughness Coefficients for Natural Channels and Flood Plains; US Government Printing Office: Washington, DC, USA, 1989.
- Ministry of Electricity and Water (The Ministry of Environment, Water and Agriculture); General Directorate of Projects Execution Department (Investigations, Studies and Detailed Design for Surface Dam on Wadi Bishah). The Final Report for Design the Bishah Dam (Hard Copy); Ministry of Electricity and Water (The Ministry of Environment, Water and Agriculture): Riyadh, Saudi Arabia, 1983; Volume 1. [Google Scholar]
Figure 1.
Sediment management and control diagram.

Figure 2.
Location map of study area (Wadi Bishah).

Figure 3.
Satellite images covering the study area (Alshaikh, A. (2015)) [“Reprinted/adapted with permission from Ref. [19]. Copyright year 2015, Alshaikh, A and Scientific Research Publishing Inc”].
Figure 3.
Satellite images covering the study area (Alshaikh, A. (2015)) [“Reprinted/adapted with permission from Ref. [19]. Copyright year 2015, Alshaikh, A and Scientific Research Publishing Inc”].
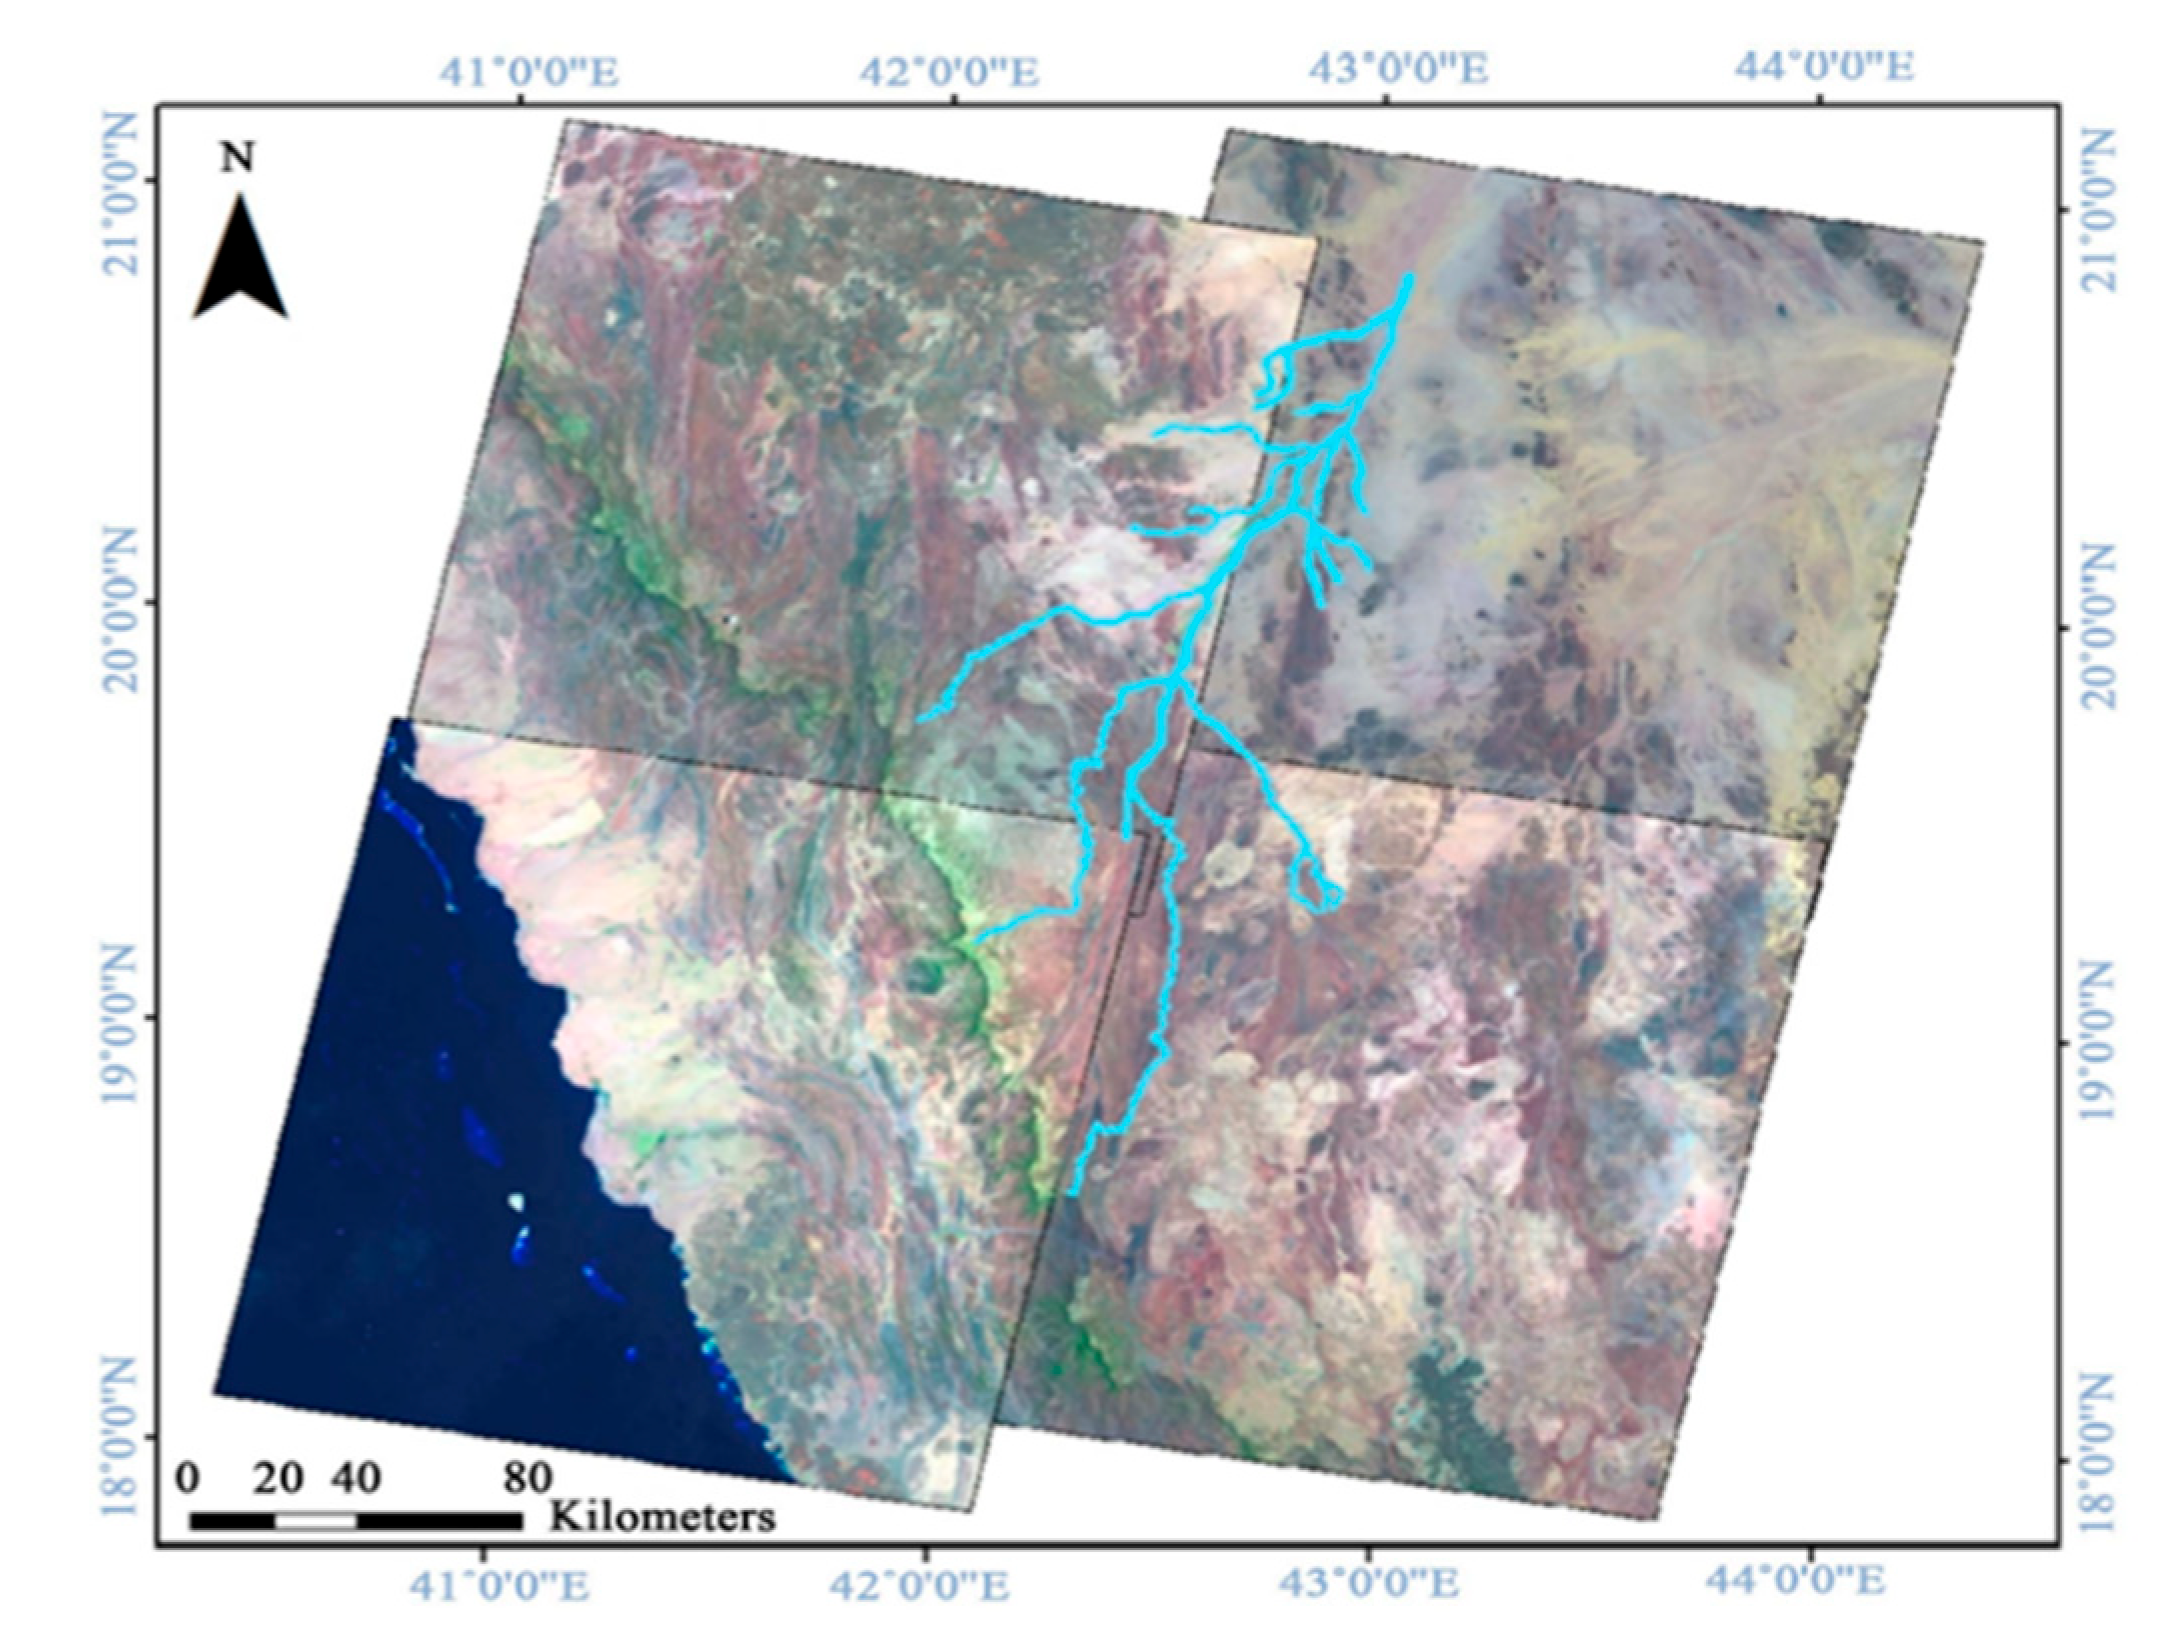
Figure 4.
Location of the King Fahad Dam.

Figure 5.
Meteorological stations in the study area.
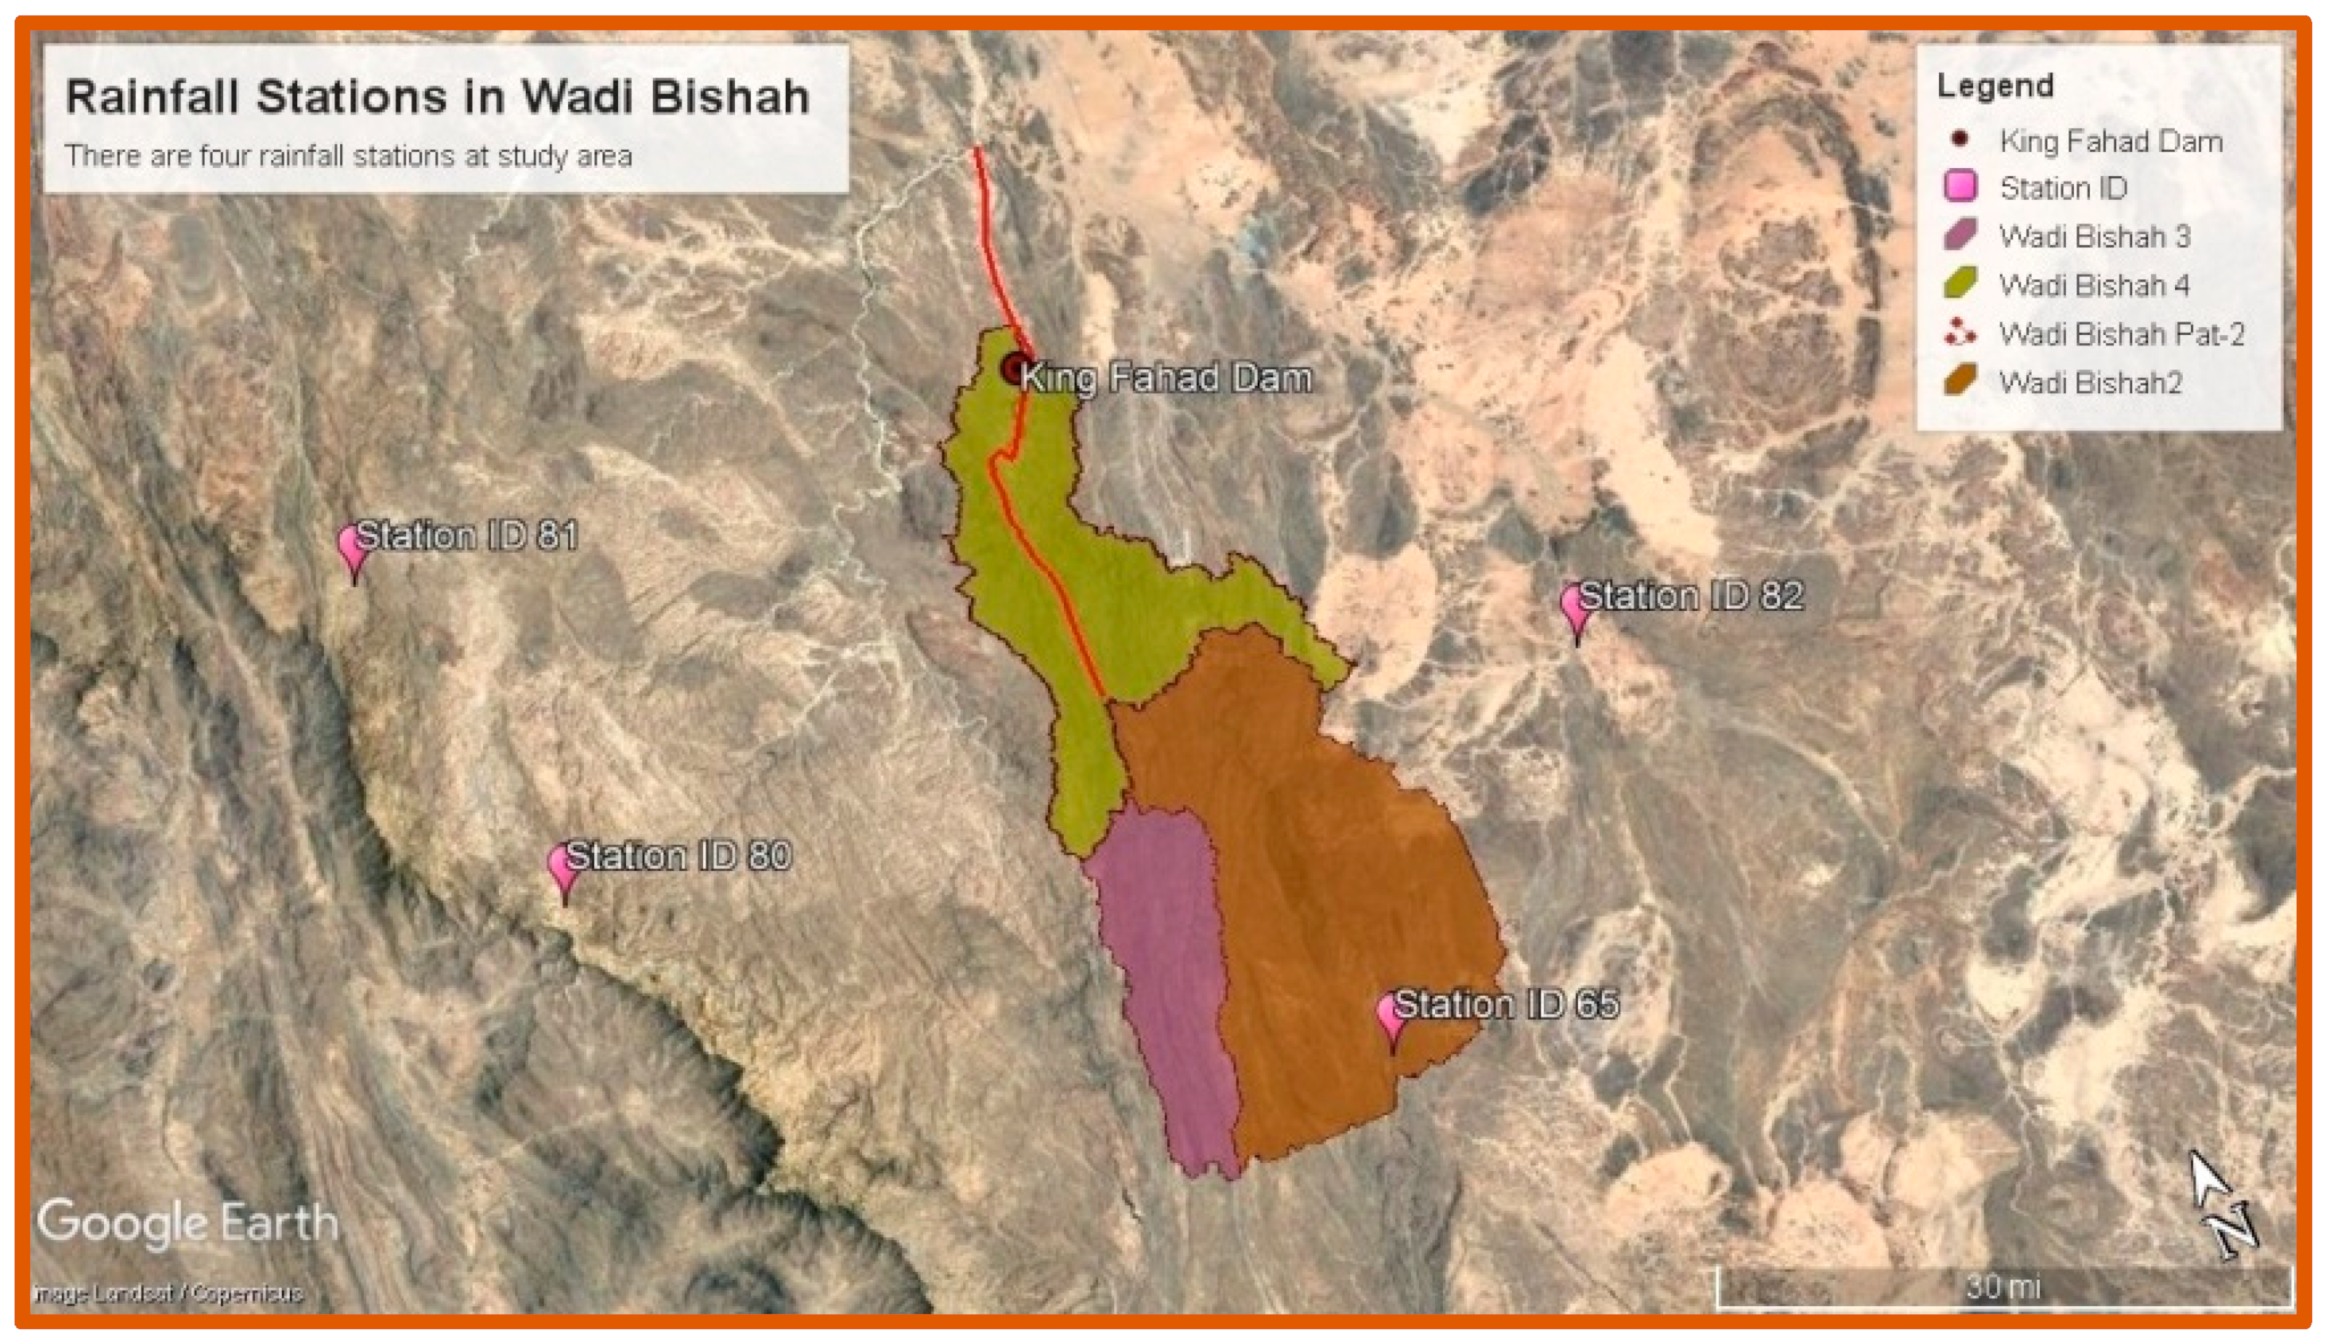
Figure 6.
King Fahad Dam and the proposed sediment-trapping basin location (USGS).

Figure 7.
Longitudinal profile of the sediment-trapping basin.
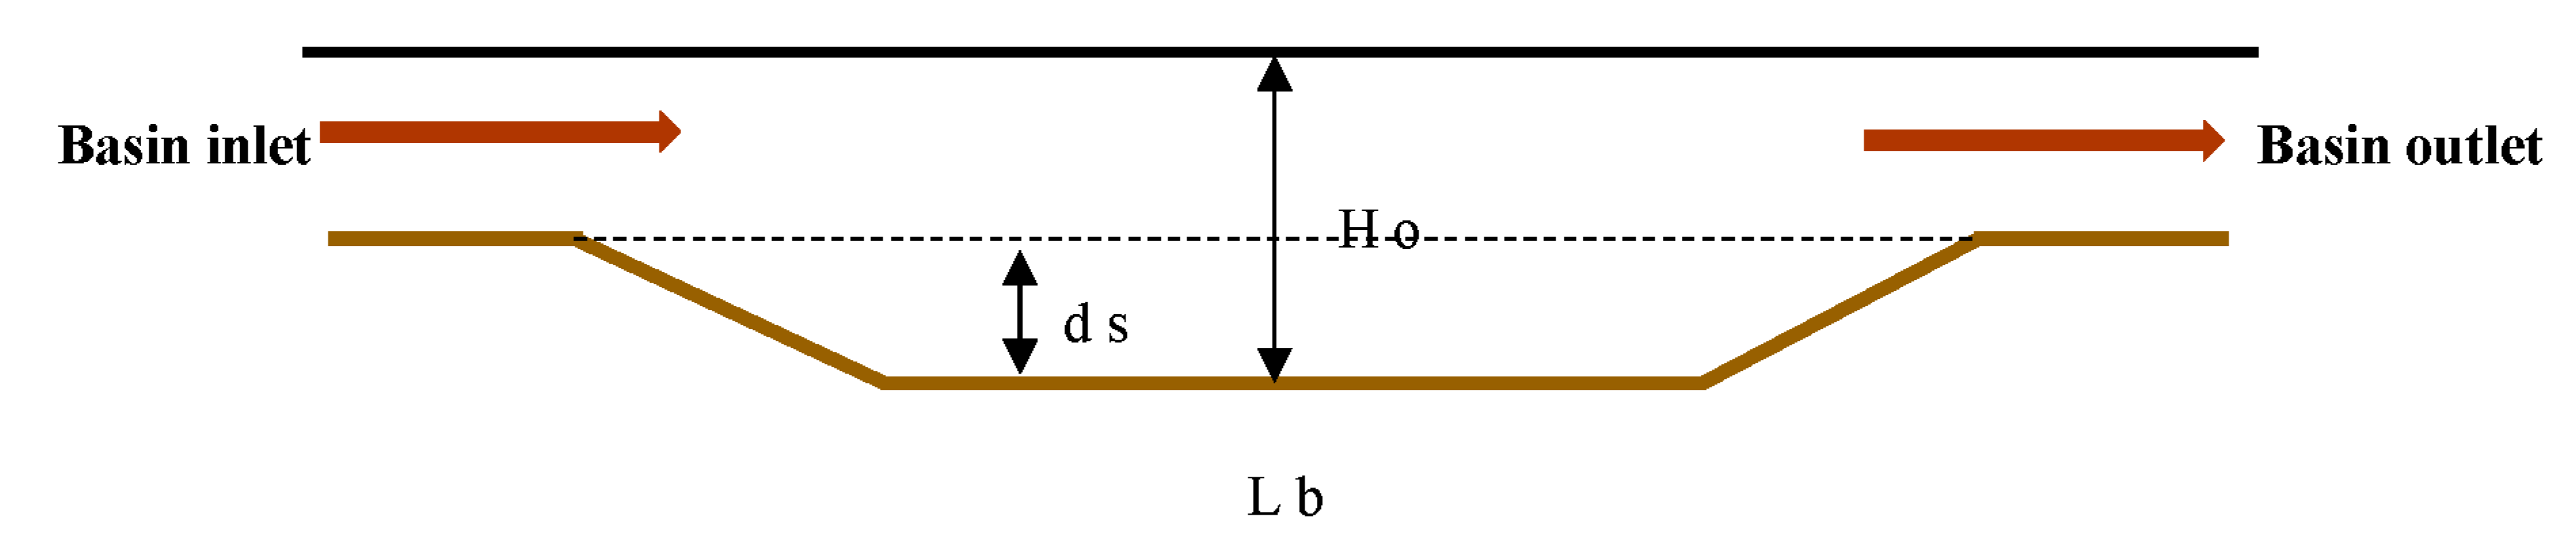
Figure 8.
Longitudinal slope Global Mapper (DEM).

Figure 9.
Cross-section of the inlet of the basin (obtained using Global Mapper-V24).
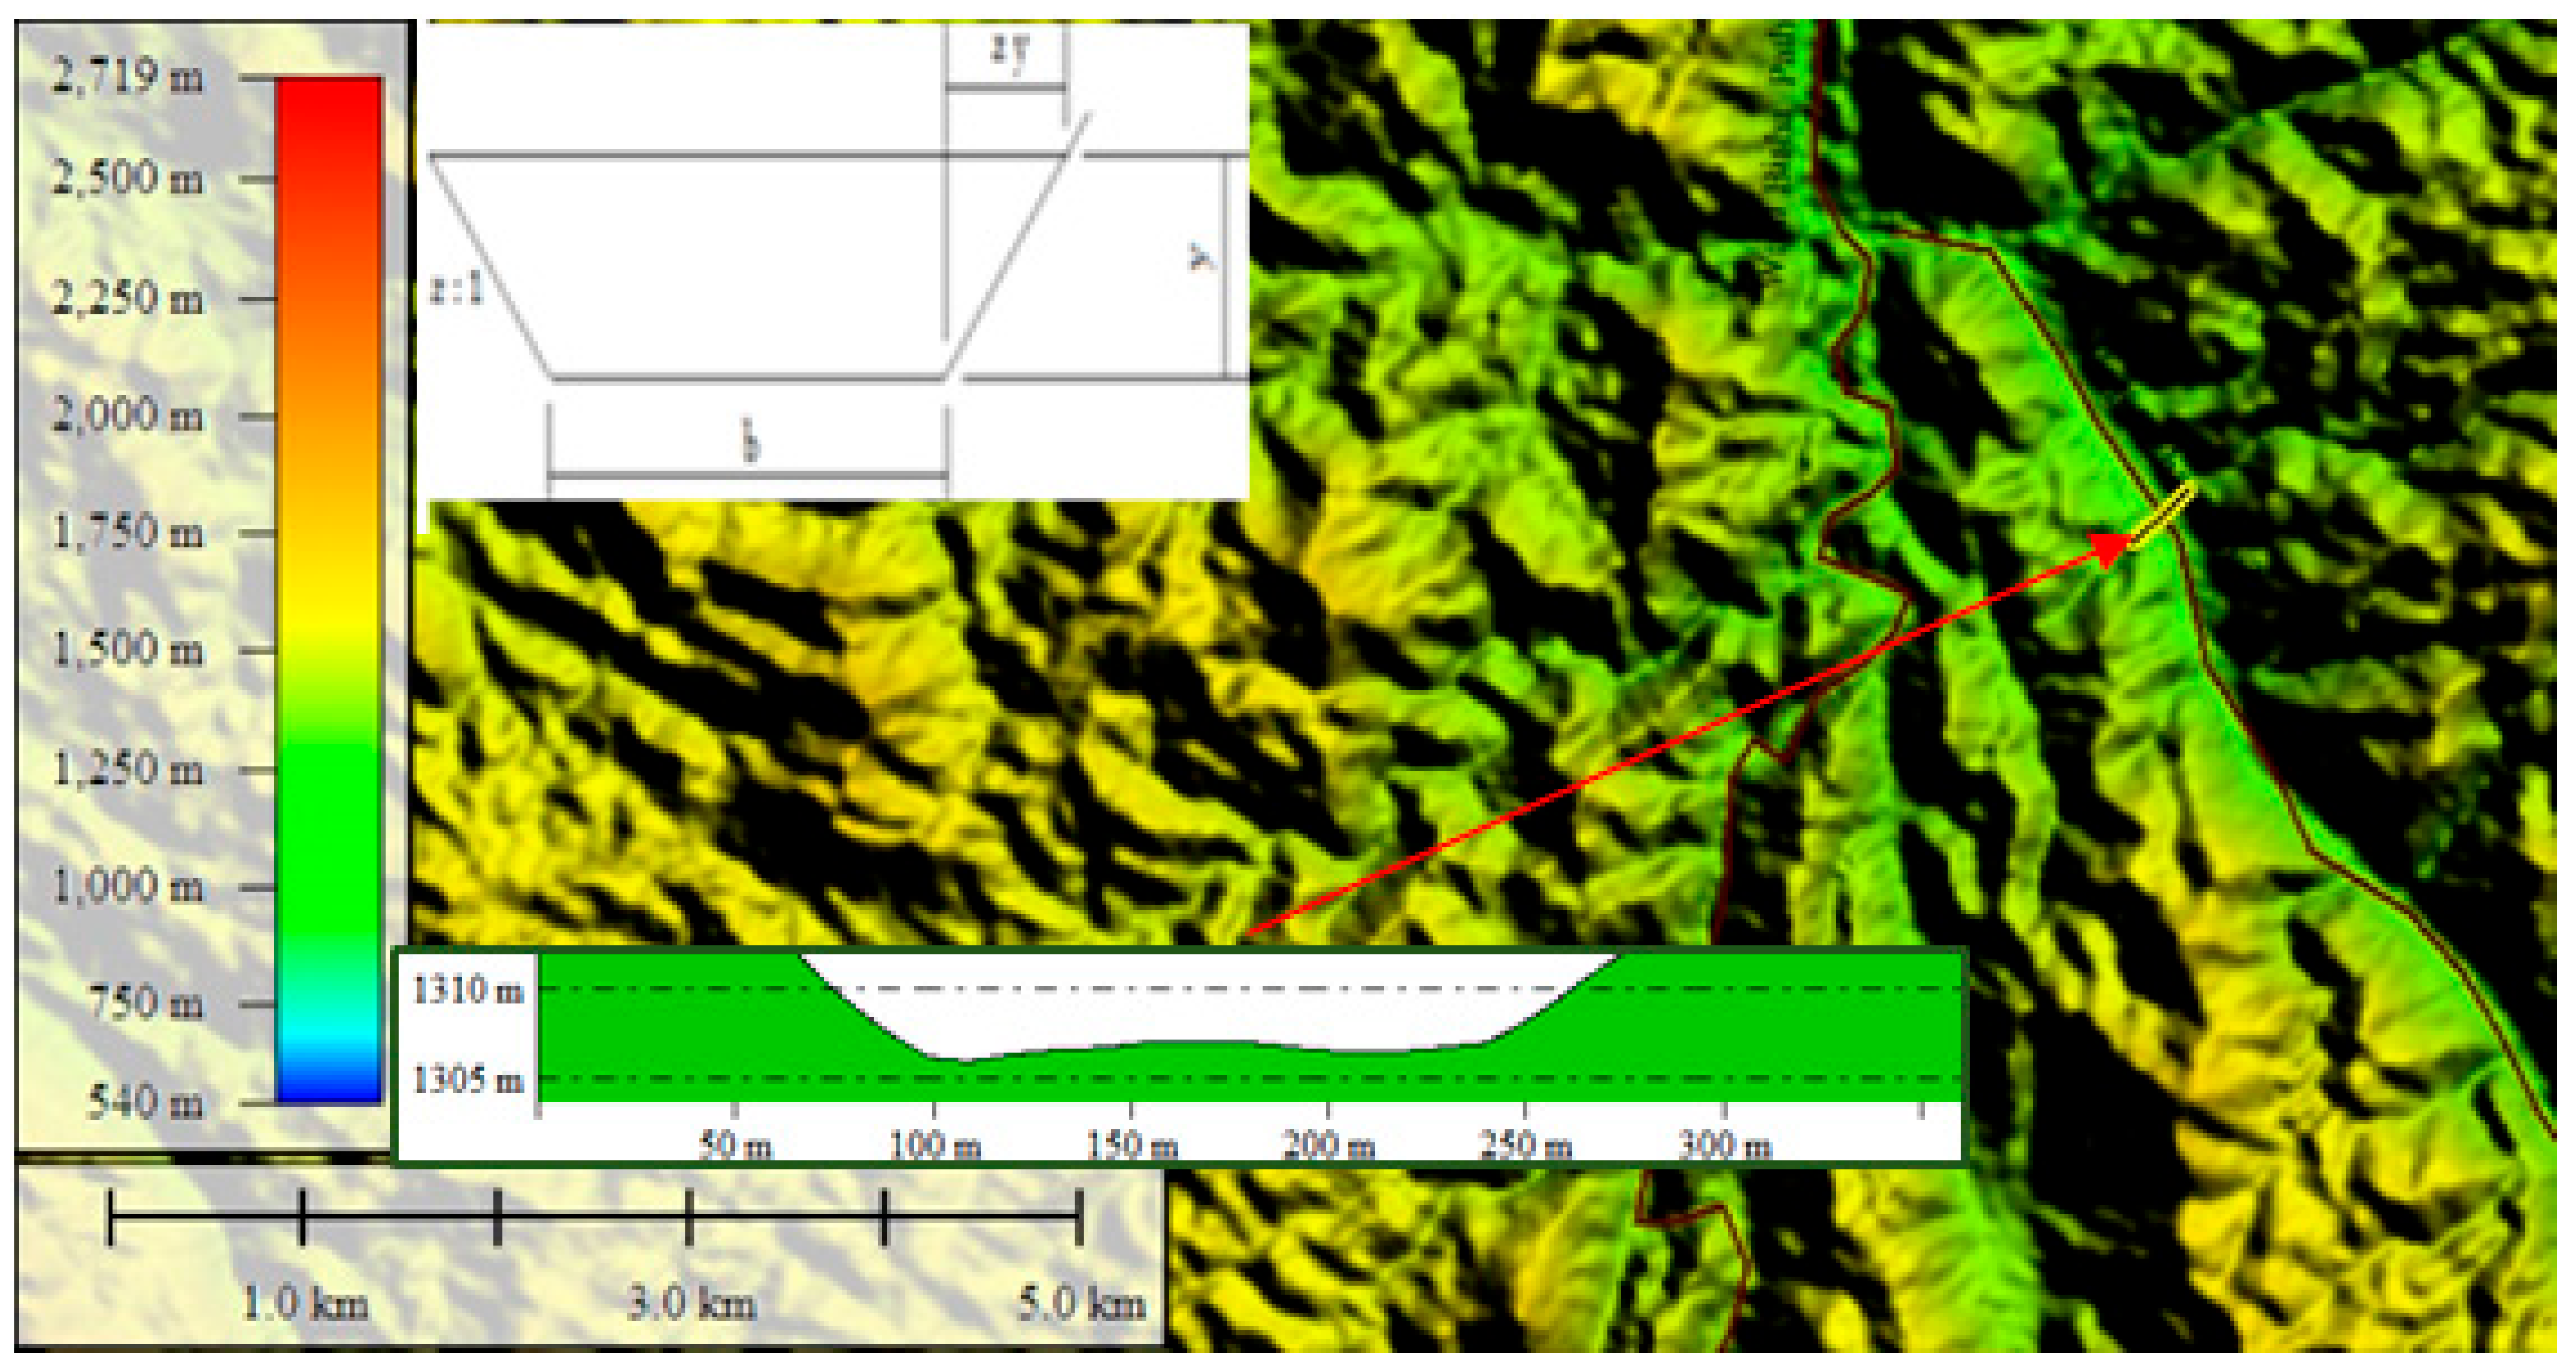
Figure 10.
Wadi Bishah hydrograph (fitting with flow data).

Figure 11.
Definition plan of the proposed trapping basin.

Figure 12.
Depth, entrainment velocity (Uent), and settling velocity (Us) in the basin section.

Table 1.
Specifications of King Fahad Dam and its reservoir.
| Reservoir Data of King Fahad Dam | |
|---|---|
| Maximum Reservoir Level | 1315.70 m above sea level (a.s.l) |
| Reservoir Level for Dead Storage | 1283.00 m above sea level (a.s.l) |
| Maximum Reservoir Volume | 325 × 106 m3 |
| Reservoir Volume for Flood Control | 252 × 106 m3 |
| Dead Storage Volume | 73 × 106 m3 |
| Details of King Fahad Dam | |
| Type | Concrete Gravity Dam |
| Crest Elevation | 1318.00 m above sea level (a.s.l) |
| Crest Width | 6 m |
| Crest Length | 507.00 m |
| River Bed Elevation | 1250.00 m above sea level (a.s.l) |
| Foundation Elevation | 1205.00 m above sea level (a.s.l) |
| Height from Bed Level | 68 m |
| Total Volume of Concrete | 1,492,000 m3 |
Table 2.
Geographical location of the meteorological stations.
| No. | M. Station | Coordinates | Altitude (m) | Data Period | Region | |
|---|---|---|---|---|---|---|
| Longitude (°) E | Latitude (°) N | |||||
| 1. | Station 65 | 42°31′60.00″ | 19°51′60.00″ | 1607 | 1965–2018 | Asir |
| 2. | Station 82 | 42°48′0.00″ | 19°19′60.00″ | 1477 | 1965–2018 | Asir |
| 3. | Station 80 | 41°58′60.00″ | 19°27′60.00″ | 2249 | 1965–2018 | Asir |
| 4. | Station 81 | 41°55′60.00″ | 19°45′0.00″ | 1759 | 1965–2018 | Asir |
Table 3.
Basic statistics of rainfall data.
| Basic Statistics of Rainfall Data | |
|---|---|
| No. of observations (year) | 56 |
| Minimum (mm) | 0 |
| Maximum (mm) | 190.4 |
| Average (mm) | 64 |
| Standard deviation (S.D) (mm) | 50.7 |
| Median (mm) | 52.6 |
| Coefficient of variation (Cv) | 0.793 |
| Skewness coefficient (Cs) | 0.773 |
| Kurtosis coefficient (Ck) | 2.67 |
Table 4.
The concentration SSC mg/L as suspended measurements.
| Station | Period Survey | Number of Measurements | Maximum of SSC (mg/L) |
|---|---|---|---|
| A-403, Hashbel | 14.5.1973–14.6.1973 | 4 | 6700 |
| A-402, Hashbel | 29.4.1972–16.5.1973 | 32 | 29,400 |
| A-406, Hashbel | 15.3.1972–16.5.1973 | 22 | 86,800 |
| SSC= 6700 mg/L | |||
Table 5.
Particle size classification (AGUSCS).
| Type of Sediment Materials | Description | Sediment Size Range (mm) |
|---|---|---|
| Gravel | Very coarse gravel | 64–32 |
| Coarse gravel | 32–16 | |
| Medium gravel | 16–8 | |
| Fine gravel | 8–4 | |
| Very fine gravel | 4–2 | |
| Sand | Very coarse sand | 2.0–1.0 |
| Coarse sand | 1.0–0.5 | |
| Medium sand | 0.5–0.25 | |
| Fine sand | 0.25–0.125 | |
| Very fine sand | 0.125–0.062 | |
| Silt | Coarse silt | 0.062–0.031 |
| Medium silt | 0.031–0.016 | |
| Fine silt | 0.016–0.008 | |
| Very fine silt | 0.008–0.004 | |
| Clay | Coarse clay | 0.004–0.002 |
| Medium clay | 0.002–0.001 | |
| Fine clay | 0.0010–0.0005 | |
| Very fine clay | 0.0005–0.00024 |
Table 6.
Sediment gradation of trapping basin design.
| Type of Sediment | Range of Grain Size (mm) | Percentage (%) | New Percentage (%) | ||
|---|---|---|---|---|---|
| Upper Limit | Lower Limit | Average (d Average) | |||
| Clay | 0.004 | 0.002 | 0.003 | 20 | 30 |
| Silt | 0 062 | 0 031 | 0.03 | 10 | |
| Fine sand | 0.0625 | 0.25 | 0.13 | 30 | 70 |
| Medium sand | 0.25 | 0.5 | 0.375 | 10 | |
| Coarse sand | 1.0 | 0.5 | 0.75 | 10 | |
| Fine gravel | 8 | 4 | 6 | 20 | |
| Medium gravel | 16 | 8 | 12 | ||
| Coarse gravel | 32 | 16 | 24 | ||
Table 7.
Suspended-sediment discharge (SSD) for Wadi Bishah.
| Ray 1 | Ray 2 | Ray 3 | Ray 4 | Ray 5 | Ray 6 | |
|---|---|---|---|---|---|---|
| % Time Increment | Time Increment | Average of Time Increment | Daily Flow (Qflow) | D.S.F (Qs) | S.S.D for Time Increment | |
| % | Δ% | % | m3/s | Ton/day | Ton | |
| 1. | 0.02 | 0.02 | 0.01 | 0 | 0 | 0 |
| 2. | 0.1 | 0.08 | 0.06 | 270 | 155,574 | 124.4592 |
| 3. | 0.2 | 0.10 | 0.15 | 540 | 311,148 | 311.148 |
| 4. | 0.5 | 0.30 | 0.40 | 810 | 466,722 | 1400.166 |
| 5. | 1.0 | 0. 5 | 0.75 | 1080 | 622,296 | 3111.48 |
| 6. | 2.0 | 1.0 | 1.5 | 1350 | 777,870 | 7778.7 |
| 7. | 3.0 | 1.0 | 2.5 | 1620 | 933,444 | 9334.44 |
| 8. | 5.0 | 2.0 | 4.0 | 1890 | 1,089,018 | 21,780.36 |
| 9. | 9.0 | 4.0 | 7.0 | 2160 | 1,244,592 | 49,783.68 |
| 10. | 15.0 | 6.0 | 12.0 | 2688 | 1,548,825.6 | 92,929.536 |
| 11. | 25.0 | 10.0 | 20.0 | 2388 | 1,375,965.6 | 137,596.56 |
| 12. | 35.0 | 10.0 | 30.0 | 2088 | 1,203,105.6 | 120,310.56 |
| 13. | 45.0 | 10.0 | 40.0 | 1788 | 1,030,245.6 | 103,024.56 |
| 14. | 55.0 | 10.0 | 50.0 | 1488 | 857,385.6 | 85,738.56 |
| 15. | 65.0 | 10.0 | 60.0 | 1188 | 684,525.6 | 68,452.56 |
| 16. | 75.0 | 10.0 | 70.0 | 908 | 523,189.6 | 52,318.96 |
| 17. | 85.0 | 10.0 | 80.0 | 628 | 361,853.6 | 36,185.36 |
| 18. | 95.0 | 10.0 | 90.0 | 358 | 206,279.6 | 20,627.96 |
| 19. | 99.0 | 4.0 | 97.5 | 90 | 51,858 | 2074.32 |
| 20. | 99.8 | 0.8 | 99.4 | 40 | 23,048 | 184.384 |
| Total | 99.8 | - | - | - | 813,067.7532 | |
| ||||||
Table 8.
Annual quantities of sediment expected to enter the trapping basin.
| Type of Sediment | Particle size (ds) | Percentage (m) | Annual Quantities (Ton/Year) | Rate (m3/km2/year) | Trap Efficiency ® (%) |
|---|---|---|---|---|---|
| Clay | 0.003 | 20 | 364,626.0416 | 47.977 | 30%→71.966 |
| Silt | 0.03 | 10 | 182,313.0208 | 23.989 | |
| Fine sand | 0.13 | 30 | 546,939.0624 | 71.966 | 70%→167.921 |
| Medium sand | 0.5 | 10 | 182,313.0208 | 23.989 | |
| Coarse sand | 1 | 10 | 182,313.0208 | 23.989 | |
| Fine gravel | 6 | 20 | 364,626.0416 | 47.977 | |
| Total | 100% | 1,823,130.208 | 239.887 | 71.966 + 71.966 | |
Table 9.
Main dimensions and parameters for Wadi Bishah trapping basin related to coarse silt.
| Particle Type | D (mm) | Us (m/s) | Time | Uent (m/s) | Lb (m) | AS (m) | Wb (m) | Ainflow (m2) |
|---|---|---|---|---|---|---|---|---|
| Coarse silt | 0.062 | 0.0023 | 9 min | 0.11 | 4007.6 | 1,418,696 | 333 | 752.25 |
| Description | (m) | (m) | Area(m2) | Q Peak (m3/s) | Design Velocity (m/sec) | hs(m) | ||
| Basin | 3500 | 500 | 2688 | 4 | 1.5 | |||
Disclaimer/Publisher’s Note: The statements, opinions and data contained in all publications are solely those of the individual author(s) and contributor(s) and not of MDPI and/or the editor(s). MDPI and/or the editor(s) disclaim responsibility for any injury to people or property resulting from any ideas, methods, instructions or products referred to in the content. |
© 2023 by the authors. Licensee MDPI, Basel, Switzerland. This article is an open access article distributed under the terms and conditions of the Creative Commons Attribution (CC BY) license (https://creativecommons.org/licenses/by/4.0/).
Share and Cite
MDPI and ACS Style
Taha, A.T.B.; Aldrees, A.; Moussa, A.M.A. Hydraulic Design of Sediment-Trapping Basin in Wadis Using Empirical Equations and Deposition Processes. Processes 2023, 11, 2729. https://doi.org/10.3390/pr11092729
AMA Style
Taha ATB, Aldrees A, Moussa AMA. Hydraulic Design of Sediment-Trapping Basin in Wadis Using Empirical Equations and Deposition Processes. Processes. 2023; 11(9):2729. https://doi.org/10.3390/pr11092729
Chicago/Turabian StyleTaha, Abubakr Taha Bakheit, Ali Aldrees, and Ahmed Moustafa Ahmed Moussa. 2023. "Hydraulic Design of Sediment-Trapping Basin in Wadis Using Empirical Equations and Deposition Processes" Processes 11, no. 9: 2729. https://doi.org/10.3390/pr11092729
Note that from the first issue of 2016, this journal uses article numbers instead of page numbers. See further details here.