
Decentralized Control Strategy for Participation of Electric Vehicles in Distribution Voltage Control
Electric Power Research Institute of State Grid Jiangsu Electric Power Co., Ltd., Nanjing 211103, China
*
Author to whom correspondence should be addressed.
Processes 2023, 11(9), 2552; https://doi.org/10.3390/pr11092552
Submission received: 5 June 2023
/
Revised: 12 August 2023
/
Accepted: 18 August 2023
/
Published: 25 August 2023
(This article belongs to the Section Energy Systems)
Abstract
:With the accelerating transportation electrification, increasing numbers of electric vehicles (EVs) are connected to distribution networks via electric vehicle charging stations (EVCSs). Due to the uncertain charging behaviors of EV users, concentrated high-power EV charging during peak hours can result in significant undervoltage issues, affecting the regular operation of distribution networks and having detrimental effects on regular EV charging. Conventional EV charging scheduling methods are conducted in a centralized way, requiring extensive investment in communication infrastructure and intensive computing power. Accordingly, this paper proposes a novel decentralized voltage control scheme with the participation of EVs and EVCSs. The proposed control scheme first divides the distribution network into clusters based on a modified modularity index. Then, it applies the rolling optimization-based control of the EVs and EVCSs within each cluster to solve the regional voltage problems. The optimization window length is self-adapted based on the monitored states of the grid-connected EVs and EVCSs. Case studies show that the proposed decentralized voltage control strategy could effectively address the undervoltage violation issues and alleviate the pressure on peak shaving during peak hours, while satisfying the charging requirements of EV users.
1. Introduction
With the increasingly severe problems of environmental pollution and energy scarcity, it is urgent to take adequate measures to reduce energy consumption and accelerate the exploitation of non-renewable resources. As the electrification of transportation is of vital importance to the path to net-zero carbon, an explosive growth of electrical vehicles (EVs) and their charging stations (EVCSs) has been seen in the last decade [1]. On the one hand, although the fast adoption of EVs is beneficial to the decarbonization of transportation, the significant load demand due to system-wide EV charging can be superimposed on the grid peak load, which may further enlarge the existing difference between the peak and valley loads of the electric power system and increase the difficulty of peak modulation [2]. On the other hand, acting as the grid interaction between EVs and the power grid, EVCSs are made up of fully controllable AC/DC and DC/DC converters capable of dynamically controlling their active and reactive power outputs at their grid integration points. This feature provides EVs and EVCSs with the potential to participate in flexible grid regulation and grid-balancing services [3]. Accordingly, the large-scale access to EVs will inevitably affect the normal operation of the grid, which, if not guided and controlled, will lead to voltage quality degradation, excessive network loss, harmonics, etc., seriously affecting the voltage stability of the system and bringing new challenges to the safe, high-quality and economic operation of the power system [4,5,6,7]. To mitigate the adverse impacts of EV charging on the voltage profiles of power grids, both the device-level adaptation of the local controllers of EVCSs and system-level EV charging scheduling schemes are required [8], which have been widely investigated by global scholars.
Conventionally, the control of distribution networks is conducted by the distribution system operator (DSO) in a centralized approach, in which all controllable devices are directly managed by the DSO. The common controllable devices in distribution networks include on-load tap changers (OLTCs), switchable capacitor banks (SCBs), voltage regulators, etc., which feature limited quantities and control cycles. After the control objects are extended to widely distributed resources, like EVs and PVs, the application of centralized control requires extensive investment in communication infrastructures and an exponentially growing demand for computing power. In contrast, decentralized control has become a promising approach to regulating distributed resources due to its inherent advantages of flexibility and robustness. When decentralized control is applied, the distribution network is first partitioned into different areas, and each area is equipped with a local controller. The local controller is capable of regulating the distributed resources within its belonging area in a centralized way. The communication between different areas is achieved via the information exchange between their local controllers, implying that only a sparse communication infrastructure is required.
Decentralized control has been widely applied in distribution network management. For example, Ref. [9] proposes a hierarchical decentralized control framework for managing the multi-energy microgrids integrated with EVs, PVs, gas turbines, etc. However, the EV charging uncertainties and the multi-time-step operations (due to the SoC constraint) were not considered in the analysis. Ref. [10] proposes reinforcement learning-based decentralized voltage control for the active distribution network, for which the optimal operating settings of the PVs within each cluster are achieved by implementing the Federated Multi-agent Actor–Critic Learning technique. Similarly, Ref. [11] integrated multi-agent reinforcement learning for the decentralized voltage control of an ADN. It divided the ADN into several sub-systems, and each sub-system was modeled as an agent, for which its action strategy was determined via a well-trained deep neutral network. However, none of these studies exploited the distribution network clustering/partitioning method, which has a direct impact on the system-wide control performance. Ref. [12] proposes a decentralized control method for PV inverters in which their unused capacity can be utilized in the form of droop-based reactive power compensation. However, the droop-based local controller cannot ensure optimal coordination among different PV inverters. In summary, the existing literature on decentralized distribution network control mostly considers distributed PV systems, while the applicability and implementation approach of decentralized control to the fast-growing EVs and EVCSs still remain unclear. Moreover, the current literature normally applied the decentralized distribution network control in a snapshot mode. When decentralized control is applied to EVs and EVCSs, a multiple-time-step operation has to be conducted to meet the desired departure SoCs of all EVs. Finally, the participation of EVs in decentralized distribution network control can be achieved either via reactive power compensation or active charging/discharging power scheduling, but the comparative analysis of these two approaches is rarely seen in the current literature.
Concerning the research on distribution voltage control with the participation of EVs, existing approaches can generally be divided into the centralized approach and the decentralized approach. For example, Ref. [13] proposed a centralized distribution voltage control method based on the active charging power scheduling of EVs. It assumes that the EV-charging demands of all participants are known in advance, which is unrealistic in practical EV scheduling. Ref. [14] introduced a centralized distribution voltage control strategy based on the model protective control of EVCSs’ reactive power. The strategy was evaluated on a modified IEEE 33-bus distribution system, but its scalability to large-scale distribution networks remains a crucial challenge. Ref. [15] proposed a cooperative control strategy of EVs, PVs and OLTCs which is realized in a centralized approach. However, the uncertainties of EV charging demands were not exploited in the analysis.
Regarding the decentralized distribution voltage control, Ref. [16] proposed a random-access framework to coordinate the EV charging behaviors, to mitigate voltage violations. The proposed control scheme is for each EV, which relies on dedicated communication infrastructures. Ref. [17] introduced a decentralized optimization-based EV charging scheduling approach to address the voltage violation issues. It is based on the snapshot analysis without considering the SoC constraints of EV batteries. Ref. [18] proposed a decentralized EV charging control method to ensure the voltage does not drop below the minimum allowable value. The controller is integrated into each EVBC and can automatically adjust the EV charging power with respect to the monitored grid-side voltage. Accordingly, no communication is required between different controllers, and the coordinated operation of EVBCs is ignored. Similarly, Ref. [19] integrated an MPC controller into the EVBC, making EVBC capable of adjusting its reactive power according to all bus voltages. Although the voltage controller is implemented in a decentralized approach, communication among EVBCs is still required to receive information on the system-wide bus voltages.
To summarize, the main limitations of the existing literature on the research of EV-based grid voltage regulation are as follows:
- Existing voltage control schemes are mainly based on the active charging power scheduling of EVs without fully exploiting the reactive power compensation capability of EVCSs;
- The EV-battery-SoC constraints and the uncertainties of EV charging demands indicate that the EV charging scheduling has to be conducted at multiple time steps, whereas current studies consider snapshot operations only;
- The distribution network partitioning method is not integrated into the current decentralized distribution voltage schemes.
To cover the research deficiencies in this topic, this paper proposes a novel decentralized voltage control scheme of distribution networks using the states of EVs and EVCSs, with the main contributions summarized below: (1) a dynamic grid partitioning method is integrated into the decentralized control scheme based on the modified modularity index; (2) the EV charging scheduling is conducted at multiple time steps based on the recorded states of EVCSs and the connected EVs; and (3) to alleviate the computation burden and avoid the extensive investment on communication infrastructures, each network cluster is managed by its local controller which only schedules the EVs and EVCSs within its belonging area. The merits and demerits of the proposed decentralized distribution voltage control scheme and those control schemes in the existing literature are tabulated in Table 1. This paper is structured as below: it begins with investigating the grid support mechanism of EVs and EVCSs, followed by proposing a modified modularity index-based partitioning method for distribution networks rich in EVs and EVCSs. Afterward, the conventional distribution voltage regulation method via the cooperative control of OLTC transformers and capacitor banks (SCBs) is reviewed, followed by the proposal of a novel decentralized voltage control scheme. The proposed voltage control method is validated through case studies on the modified IEEE 123-node test feeder.
2. Materials and Methods
2.1. The Grid Voltage Support Mechanism of EVs and EVCSs
The grid voltage support capability of EVBC is derived from its four-quadrant power flow control. By taking a simplified five-bus feeder with EVCSs connected as an example (as in Figure 1), the voltage difference between bus 0 and bus 1 can be represented by (1), while the corresponding branch power flow P1 and Q1 are represented by (2) and (3), respectively. The voltage difference between bus 0 and bus 1 can be influenced by the aggregate active power and reactive power demands of bus 1 and its downstream buses. As EVCSs are made up of fully controllable power electronic (PE) converters, it is possible to provide active control of bus voltages through the bidirectional active and reactive power control of EVCSs and the coordinated charging schemes among different EVCSs.
where U0 and U1 are the terminal voltages of bus 0 and bus 1, respectively; the line impedance between bus 0 and bus 1 is represented by + , with its corresponding branch power flow represented by + ; for bus 1, its power consumption of the preliminary load is represented by + ; and the active and reactive power demands of EVCS connected at bus 1 are represented by and , respectively.
To provide the bidirectional active and reactive power exchange between the distribution network and the EVs, bidirectional AC/DC and DC/DC converters with dedicated control systems are required. The general circuit topology supporting V2G technology is illustrated in Figure 2, which comprises a three-phase H-bridge AC/DC converter and a dual active bridge (DAB) DC/DC converter [20]. Specifically, the H-bridge converter provides a real-time shaping of the grid-side feed-in current while maintaining a relatively constant DC-link voltage. The DAB converter scales the DC-link voltage to a value suitable for the EV battery while providing electric isolation between the grid and battery sides. At the AC/DC conversion stage, it is evident that the H-bridge converter is responsible for the four-quadrant power flow control of EVCS. To facilitate the grid-side current control for a three-phase system, the grid-side voltage and current waveforms, vg and ig, and the converter output AC voltage, vs, are transformed from abc framework into dq framework, with their correlations represented by (4) and (5) [20]. It can be observed from (4) and (5) that the grid-side current of EVBC at dq axis (id and iq) has a direct impact on the corresponding converter output voltage (vsd and vsq). The related grid-side active and reactive powers, pg and qg, are represented by (6) and (7), which indicates that the active and reactive power exchange between EVs and the power grid can be controlled by real-time monitoring and regulating the AC voltage and current outputs of the H-bridge converter, as in (8).
where and are the grid supply voltage under the dq framework, the dq components of the AC voltage output of the converter are represented by and , L and refer to the value of the series-connected inductor and the angular frequency of the power grid, and are close to zero for a stable system and, hence, can be ignored.
In addition, the involvement of EVs and EVCSs in the voltage regulation of distribution networks has to satisfy the operational constraints of EVs and EVCSs. During the EV charging process, the EV charging and discharging powers have to be kept below the threshold values while the desired departure battery state-of-charge (SoC) has to be met. Specifically, EVCSs participating in the grid voltage regulation are featured by four-quadrant operation, as illustrated in Figure 3a. For EVCS operating under either charging mode (i.e., p > 0) or discharging mode (p < 0), it is capable of producing bidirectional reactive power. For any time instance, t, the active power of EVCS, Pt should be kept within the operation boundary [Pdis,max, Pcha,max], while the corresponding reactive power Qt has to be within the range of (Sr is the rated power of EVCS). Apart from the operational constraints of EVCSs, the desired EV battery SoC has to be met once the EV gets disconnected from EVBC. As illustrated in Figure 3b, assuming an EV arrives at the EVCS with the battery SoC equaling SoCarr, and SoCarr is within the range of [SoCmin, SoCmax], the EV can participate in either the charging scheduling or the discharging scheduling. It should be noted that the slope of the SoC curve in Figure 3b equals the EV charging/discharging power. Moreover, only when the time required for the uncontrolled EV charging is less than the expected EV departure time, tdep, the EV is capable of participating in the charging scheduling (i.e., tarr + (SoCdep − SoCarr)Cb/Pcha,max < tdep). To form the upper boundary of the operation region of battery SoC, EV is first charged to SoCmax at a power of Pcha,max and then maintained at SoCmax for a certain time, followed by being discharged to the required departure battery SoC, SoCdep, at a rate of Pdis,max, as represented by the red curve in Figure 3b. The lower boundary of the operation region of battery SoC can be defined oppositely and is represented by the blue curve. No matter what kind of control scheme is applied to EVs and EVCSs, their safe operation regions (i.e., the colored areas in Figure 3a,b) must always be satisfied. The corresponding mathematical modeling of the complete EV charging cycle can be represented by (9)–(15).
Pdis,max ≤ Pt ≤ Pcha,max
2.2. The Partitioning Method and Index for Distribution Networks Integrated with EVs
2.2.1. Principles of the Distribution Network Partitioning Method
As EVs typically get charged at low voltage distribution, which is rich in grid integration points, it is hard to coordinate the EV charging behaviors across the whole network simultaneously. Moreover, the active- and reactive-power-based voltage sensitivity for nodes at different electrical distances from the substation can be diversified. Specifically, according to the classic power flow equations in (16), the variation of active power and reactive powers (ΔP and ΔQ) injected into a specific node has a direct impact on its voltage phase angle and magnitude difference (Δθ and ΔU) [21]. Ref. (16) can be rewritten as (17) and (18) where SPU and SQU refer to the active-power-based voltage sensitivity and the reactive-power-based voltage sensitivity. The voltage magnitude at any given node i, Ui, can be represented by (19), indicating that Ui is not only affected by active and reactive powers injected into different nodes, but also determined by the power-dependent voltage sensitives of those nodes. Therefore, grouping the nodes with similar power voltage sensitives into one cluster is possible. In this way, the voltage regulation of the formed cluster can achieve improved performance with minimum impact on the voltage profiles of the adjacent clusters.
where J is the Jacobian matrix, SPU and SQU refer to the active-power-based voltage sensitivity matrix and the reactive-power-based voltage sensitivity matrix, while their corresponding matrix element is represented by and ; N is the total number of nodes from the feeder source node to node i.
Conventionally, the Louvain algorithm can achieve network partitioning, which is a type of community detection algorithm [22]. It is based on a performance evaluation index of distribution portioning named the modularity index, as defined by (19)–(21). The modularity index reflects the nodes’ physical coupling conditions, mainly determined by the network structure. A higher modularity index indicates stronger couplings of nodes within the same cluster and weaker couplings among different clusters. The original modularity index does not consider the electrical characteristics of power distribution networks with EVs connected. To address this issue, a modified modularity index is proposed by integrating the power-based voltage sensitivity into the original modularity index. Specifically, the index in the original modularity definition formulation in (19) is replaced by index defined in (22), which is the weighted sum of the active- and reactive-power-based voltage sensitivity indices. By taking into (18), the modified modularity index, , can be obtained, as in (23). As the power-based voltage sensitivities of nodes are determined by both the line impedances and the physical interconnection conditions among those nodes, the replacement of with can ensure the electrical coupling conditions and the physical interconnection conditions among different nodes are simultaneously considered during the process of distribution network partitioning.
where is an index to describe the connection condition between node i and node j; equals 1 when there exits edge/edges between node i and node j, and equals 0 when there is no edge between the two nodes; is the sum of for all edges connected to node i; m is the weighted sum of ; is an index to describe if node i and node j belong to same cluster; equals 1 if node i and node j are within the same cluster and equals 0 if not; is an index to determine if the distribution network partitioning is based on the active-power-based-voltage sensitivity ( = 1) or the reactive-power-based voltage sensitivity ( = 0); and are the corresponding updated values of and when is replaced by .
2.2.2. The Distribution Network Partitioning Method
With the modified modularity index, the partitioning method for distribution networks with EVs connected is proposed, with its implementation process summarized by the following steps.
- (1)
- Initiate the distribution network partitioning by making each node an individual cluster;
- (2)
- Apply the preliminary node clustering based on the radial topology of the distribution network. Specifically, if a feeder branch has an EVCS connected and it is not located at the feeder end, the grid-integration point of EVCS and its downstream nodes are assigned into one cluster (named an EV cluster). If a feeder branch has no EVCSs connected, the feeder branch source node and all its downstream nodes are assigned to one cluster (named a load cluster). The preliminary node-clustering process is illustrated in Figure 4;
- (3)
- Apply the preliminary distribution network partitioning based on . For any EV cluster, find its adjacent isolated nodes and temporarily assign each of them to the cluster. Assign the isolated node with the highest to the EV cluster to form the updated cluster. Repeat the process until there is no isolated node in the distribution network;
- (4)
- Merge the clusters based on the objective function (24) until reaches its maximum value.
The whole procedure of the distribution network partitioning is illustrated in Figure 5 and will be applied to the decentralized voltage control introduced in Section 2.3. Moreover, as the active and reactive power regulation of an EVCS is closely related to the charging status of the connected EVs which are featured by spatiotemporal uncertainties, a dynamic distribution network partitioning method is adopted, with its update frequency determined by the control timer interval of the decentralized voltage control.
2.3. Decentralized Distribution Voltage Control with the Involvement of EVs and EVCSs
2.3.1. Principles of the Decentralized Voltage Control Scheme
In general, the distribution voltage control framework with the involvement of diversified voltage support resources can be represented by Figure 6, which is made of three layers, including the physical system layer, the power prediction layer and the decision-making layer. Specifically, the power prediction layer performs the short-term or long-term power consumption predictions of EVs and primary loads. The physical system layer includes the regional distribution network under voltage regulation, the traditional voltage regulation resources and the distributed PE-based voltage support resources like EVCSs. The optimal operational conditions of the diversified voltage regulation resources are defined from the decision-making layer where the multi-objective optimization is conducted. As the control time scales and the grid interaction mechanisms for the conventional voltage regulation resources, EVs and EVCSs are differentiated, the analytical equations of their control strategies are also diversified, which will be analyzed in the following.
Conventionally, distribution network operators (DNOs) rely on voltage support resources like OLTC transformers, SCBs and voltage regulators for the grid voltage control. Those equipment are generally equipped with local controllers that automatically adjust their operation settings based on the monitored terminal voltage. As those devices change their operation settings via mechanical switching, a type of discrete control action, frequent mechanical switching, may reduce the device’s lifetime. To solve this issue, their day-ahead operation schedules can be directly received from DNO with their local controllers being disabled. Specifically, with the day-ahead prediction of all power consumptions and generations, DNO first evaluates the initial state of the distribution network by executing the power flow analysis. For the cases of a potential violation of voltage emergence limits, optimal power flow is conducted to pursue the feasible operation schedules of conventional voltage regulation resources. Once the day-ahead operation settings are allocated to those devices, they will operate as scheduled during the day without reacting to the variation of their terminal voltage. Due to the limited voltage regulation capability of discrete voltage regulators, they cannot effectively address voltage issues like voltage violation and fluctuation.
In contrast, EVCSs can dynamically adjust their active and reactive powers via the fully controllable AC/DC converters integrated into EVCSs. The continuous power-adjusting capability of EVCSs makes them desirable grid voltage regulation resources. To get involved in the grid voltage control, EVs under the same charging time slot are grouped with their charging and discharging powers optimized during the decision-making stage. Due to the diversity and uncertainty of EV and EVCS types, EV charging behaviors and the EV-battery SoC, the EVs and EVCSs’ grid voltage support capability is time-varying and hard to predict. To address this issue, a rolling optimization-based control framework of EVs and EVCSs is proposed, which can adaptatively adjust the control time slots depending on the current states of EVs and EVCSs, as illustrated in Figure 7. For example, assuming four EVs are connected to EVCSs with diversified arrival times and departure times (the colored arrows represent the corresponding charging time durations in Figure 8), the rolling window length at any instance t, LRWt, equals the longest remaining charging duration of all available grid-integrated EVs at time instance t, as in (25). Under each rolling window, the active and reactive powers of EVCSs are optimized to achieve maximum voltage support capability, and only the optimal solutions achieved for the first time slot of the rolling window are utilized. The moving step between two successive rolling windows is a single time slot which the DNO predefines.
where represents the rolling window length at time instance t, the expected departure of kth EV is represented by tdep,k, while the total number of grid-connected EVs at time instance t is represented by .
In addition, with the large-scale EVs and EVCS deployment, the conventional centralized control of all EVs and EVCSs is computationally intensive and hard to implement practically. Therefore, the distribution network is first partitioned into optimal numbers of subareas by applying the partitioning method introduced in Section 2.2. Then, for each cluster, its bus voltages will be regulated via the four-quadrant power flow control of EVs and EVCSs within the cluster. The architecture and the implementation procedure of the proposed decentralized voltage control scheme are illustrated in Figure 8 and Figure 9. Specifically, the target distribution network nodes (with EVs and EVCSs connected) are first optimally divided into clusters (via the network partitioning method in Section 2.2). Each cluster is equipped with a local controller responsible for the charging scheduling of EVs and EVCSs within the cluster. The action strategies of each controller are only determined by the EV availability and the bus voltages within the cluster. Once the network partitioning is done, select the root cluster and apply the rolling optimization-based control of EVs and EVCSs within the cluster. The optimization objective is to avoid voltage violations and alleviate the voltage deviation and fluctuation within the cluster. It is achieved by optimally scheduling the active or reactive power of EVCSs while satisfying the EV users’ charging. Once the optimal charging schemes for EVs connected within the root cluster are acquired, the next step is to regulate the EV charging behaviors within the downstream clusters similarly. If any of the adjacent downstream clusters have voltage violations occur, merge those clusters into the root cluster and rerun the rolling optimization-based EV and EVCS control for the root cluster. Repeat the above process until the last cluster at the feeder branch’s end has been covered. The final outputs are the optimal EV charging schemes for all clusters. It should be noted that the network partitioning is continuously updated with the moving of the control window (as illustrated in Figure 7).
2.3.2. Modeling of Distribution Voltage Control with Conventional Voltage-Support Resources
For the distribution voltage regulation with conventional voltage support resources like SCBs and OLTC transformers, their optimal daily operation curves have to be defined a day ahead to avoid frequent mechanical switching. Due to the limited number of set points and the action costs of OLTC transformers and SCBs, distribution voltage control with conventional voltage support resources aims to mitigate potential undervoltage violations while minimizing overall system operating cost, as in (26) and (27). The considered operational constraints are the minimum and maximum tap positions of OLTC transformers, the maximum allowed daily action times of OLTC transformers, and the number of switchable CBs within SCBs, as represented by (28)–(31). The input information required for solving the formed optimization problem is the network topology of the target distribution network and the day-ahead prediction of the power consumption at all buses.
where the bus voltage violations are denoted as , with its penalty factor represented by ; the operation costs of OLTC taps and capacitor banks are denoted as and respectively; the lower and upper boundaries of allowed bus voltages are denoted as and ; the nbth bus voltage at time t is represented as Vnb,t, while the total number of buses is denoted as Nbus; refers to the power losses at time t with its marginal price represented by ; for the kth OLTC transformer, its tap position at time t is represented by while for jth SCB, the number of switched-on capacitor banks at time t is denoted as ; the minimum and maximum allowed tap positions of kth OLTC transformer are represented by and while the maximum allowed daily action times is symbolized by ; for the jth SCB, its total number of switchable capacitor banks is expressed as .
2.3.3. Modeling of Distribution Voltage Regulation with the Four-Quadrant Power Control of EVs and EVCSs
Due to the spatiotemporal uncertainties of EV charging patterns and the resultant time-varying voltage support capabilities of EVs and EVCSs, a rolling optimization-based control scheme of EVs and EVCSs is applied, with its sliding control window adaptatively modified according to the charging states of EVs and EVCSs, as discussed in Section 2.3.1. As analyzed in Section 2.1, the distribution voltage support with EVs and EVCSs can be achieved by dynamically adjusting the bidirectional active or reactive power exchange between the EVCSs and the distribution network, resulting in a different formulation of the optimization problem. Specifically, for the distribution voltage regulation with the active power support of EVs and EVCS, the control variables are the active powers of EVCSs while the reactive power outputs from EVCSs are set to zero (assuming all EVCSs are operating at unity power factor). All control variables must meet the power and energy constraints of EVs and EVCSs as represented by (9)–(15). The optimization target for each sliding control window is to minimize the bus voltage deviations and alleviate the bus voltage fluctuations, as represented by (32).
where LRWts is the sliding window length at time ts, Vref refers to the reference per-unit bus voltage (set at 1 pu), and are are the weighting factors for the mitigation of bus voltage deviation and the alleviation of bus voltage fluctuation ( + = 1).
Suppose the distribution voltage support participation of EVs and EVCs is achieved through adjusting the reactive power output of EVCSs. In that case, the control variables become the reactive powers of EVCSs. In contrast, the remaining active power delivering capability of EVCSs should still be capable of completing the EV charging task, as represented by (33) and (34). For the reactive-power-based distribution voltage regulation, its control objective is the same as that of the active-power-based distribution voltage support, as in (32).
3. Case Studies
To evaluate the performance of the proposed decentralized voltage control scheme based on the active or reactive power support of EVs and EVCSs, case studies will be performed on the modified IEEE 123-node test feeder. As shown in Figure 10, the modified IEEE 123-node test feeder has 11 EVCSs. All EVCSs are equipped with V2G controllers and can provide four-quadrant power control at the grid integration point. As shown in Figure 11, the daily load profiles utilized on the target grid are taken from the database disclosed by a UK DNO, which exhibits increased power demand from 6 p.m. to 10 p.m. [23]. The distribution network also has six OLTC transformers and four SCBs connected, with their basic information provided in [24]. The lower and upper boundaries of allowed per-unit bus voltages are 0.95 pu and 1.05 pu, respectively. The analysis is conducted via the co-simulation between OpenDSS and MATLAB while the self-adaptive multi-population-based JAYA algorithm (SDMP-JAYA) is applied as the solver for the optimization models introduced in Section 2.3 [25]. As the SDMP-JAYA algorithm may have slight variations of simulation results between different executions, each optimization model is repeatedly solved 50 times, with the best solution taken as the final output. The simulation is performed on an Intel Core i7-8850H with a 2.6 GHz CPU, 32 GB RAM, and 64-bit operating system PC.
To emulate the charging uncertainties of EVs, the varieties of EV type, EV charging period, battery capacity, rated power of the EVBC, and the arrival time and departure time battery SoC are considered in the case studies. Specifically, the considered EV type includes private cars, buses, taxis and exclusively used cars (refers to company vehicles here). According to the data from the national household travel survey (conducted by the US Department of Transportation), EVs of different transport types can be characterized by unique charging patterns as indicated in Table 2 [26,27]. As the EV arrival time to the EVCS and the arrival time battery SoC are the key uncertain factors affecting the EV charging demand, different distribution functions represent them. It is assumed that all four EV transport types have their arrival time battery SoC normally distributed. Regarding the EV arrival time to the EVCS, taxis, private cars and exclusively used cars have their EV arrival time to the EVCS following a normal distribution (as represented by (35)), while EVs of the bus type have their arrival time to the EVCS evenly distributed. To intuitively illustrate the impact of the EV charging type on the aggregate EV charging demand, 700 EVs are allocated to each EV type with their aggregate EV charging demand achieved through Monte Carlo simulation, as shown in Figure 12. It indicates that the EV compositions directly affect the aggregate EV charging demand. According to the current market penetration level of different EV transport types, it is assumed that the EV-type composition applied in the case studies is 85% private cars, 2% buses, 5% taxis and 8% exclusively used cars, with the daily number of EVs charged at the 11 EVCSs equaling 700. Moreover, the EV charging locations are randomly selected among the 11 EVCSs. Before the distribution voltage regulation is activated, the bus voltages of the test feeder with disordered EV charging behaviors are illustrated in Figure 12. It is noticed that most nodes experienced undervoltage violation issues during 8 p.m.~12 p.m., with the minimum bus voltage as low as 0.92 pu. This is attributed to the fact that most EVs get charged during peak hours when the pressure on the distribution network is highest. In addition, it is noticed from Figure 13 that the bus voltage drop becomes more severe with the increasing distance from the substation, which is due to the significant voltage drop across the distribution cables.
where tarr and ut are the EV arrival time to EVCS and its expected value, respectively; the standard deviation is represented by .
For the case with the OLTC transformer and SCB-based distribution voltage regulation, the control scheme is modeled by following the procedure presented in Section 2.3.1, and the optimal daily operating settings of OLTC transformers and SCBs are achieved by solving the formed optimization problem, as in Figure 14. The expected bus voltages achieved from the OLTC transformer and SCB-based distribution voltage regulation are given in Figure 15. It turns out that OLTC transformers and SCBs have to adjust their operation settings during the peak hours (7 p.m.~11 p.m.), to mitigate the undervoltage violations brought out by excessive EV charging. Although the undervoltage violation issue is significantly alleviated compared to the bus voltages without voltage regulation (i.e., Figure 13), apparent voltage deviation and voltage fluctuation still exist during peak hours due to the limited number of setting points of OLTC transformers and SCBs [28].
To further relieve the voltage fluctuation and deviation issue, EVs and EVCSs are utilized as distributed voltage support resources, with decentralized voltage control being applied (i.e., Figure 8). The decentralized voltage control is further divided into two steps: (1) perform the distribution network partitioning based on the modified modularity index, ; (2) perform rolling optimization-based control for EVs and EVCSs within each cluster. Due to the uncertain charging behaviors of EV users, dynamic network partitioning is required, with its update frequency determined by the control time interval. Moreover, as the modified modularity index, , is calculated from the power-dependent voltage sensitives, can exhibit different values by using the active-power-based voltage sensitivity index and by using the reactive-power-based voltage sensitivity index (corresponds to and , respectively), resulting in different network partitioning results. For example, the optimal network partitioning results (at 8 p.m.) based on and are illustrated in Figure 16, with the corresponding values shown in Figure 17. It is observed that the optimal number of clusters under and under are 10 and 8, respectively. Meanwhile, as the voltage support of EVs and EVCSs can be achieved via active or reactive power scheduling, the network partitioning and the subsequent decentralized voltage control should also be conducted based on either active or reactive power scheduling.
Based on the optimal distribution network partitioning results, the next step is to perform the decentralized voltage control to all the clusters. The final obtained optimal EV charging schemes are illustrated in Figure 18, with the scheduled active and reactive powers of EVCSs shown in Figure 19. The bus voltages achieved under the two types of decentralized voltage control schemes are illustrated in Figure 20. For both the APS-based decentralized voltage control and the RPS-based decentralized voltage control, almost all buses get improved voltage profiles with respect to the bus voltages (i.e., Figure 15) achieved by the OLTC transformer and SCB-based distribution voltage control, as indicated by Figure 20. It is mainly attributed to the dynamical active- or reactive-power scheduling of EVCSs during the peak hours, as indicated in Figure 19. Specifically, when the APS-based decentralized voltage control is activated, an EVCS transits the role from a consumer to a prosumer via its bidirectional active power control capability. In this way, the EVCSs turn into distributed generators when the undervoltage issue becomes severe, as indicated in Figure 19a. Similarly, after the RPS-based decentralized voltage control is applied, EVCSs start to provide reactive power support during peak hours (11 a.m.~2 p.m., 8 p.m.~11 p.m.) to avoid the significant voltage drop due to peak EV charging demands, as indicated in Figure 19b. A comparison of the aggregate EV charging demand between uncontrolled charging and APS-based scheduled charging is illustrated in Figure 21. The aggregate EV charging demand during peak hours is significantly alleviated with a maximum of 81% power reduction achieved. The daily energy demand due to EV charging is reduced from 13.3 MWh to 4.0 MWh, achieving a 70% energy reduction.
In the end, a comparison of the minimum and average bus voltages under different voltage regulation schemes is provided in Figure 22. The APS-based decentralized voltage control performs similarly to the RPS-based decentralized voltage control, and both can somewhat alleviate the voltage deviation and fluctuation issues. After applying the proposed decentralized voltage, the minimum and average voltage drops are 0.04 pu and 0.02 pu, respectively. Moreover, no undervoltage violation issue occurs with the application of the OLTC transformer and SCB-based distribution voltage control combined with the APS-based or RPS-based decentralized voltage control. With the aid of the four-quadrant control capability of EVCSs, the proposed decentralized voltage control schemes can effectively address voltage violation issues during peak charging hours.
4. Conclusions
According to the case studies in Section 3, it can be concluded that the OLTC transformer and SCB-based conventional distribution voltage control scheme cannot effectively solve the voltage issues due to their limited operation setting points and lifetime-affected switching actions. Accordingly, the distribution voltage regulation via the conventional voltage support resources should be applied day-ahead according to the day-ahead prediction of the grid load profiles and the EV charging demands. Unlike OLTC transformers and SCBs, EVCSs are made up of fully controllable AC/DC and DC/DC power converters capable of providing the four-quadrant power control at the grid integration point. Therefore, EVs and EVCSs become ideal distributed voltage support resources for intraday distribution voltage regulation. In this context, a decentralized voltage control scheme is proposed to exploit the voltage support capability of EVs and EVCSs fully. It comprises the distribution network partitioning and the rolling optimization-based control of EVs and EVCSs within each cluster. The dynamic distribution network partitioning ensures the regional voltage regulation will not interfere with the voltage profiles of the other clusters, while the rolling optimization-based control of EVs and EVCSs deals with the spatiotemporal uncertainties of EV charging behaviors. As the decentralized voltage control can be achieved either by APS or RPS of EVs and EVCSs, a comparative analysis is conducted in Section 3, and both of them can contribute to effectively alleviating bus voltage deviation and fluctuation. The selected case studies demonstrate that the proposed decentralized voltage control scheme achieves an average voltage drop as low as 0.02 pu. Moreover, a maximum of 81% power reduction can be achieved during peak hours, greatly alleviating the pressure on peak shaving. Compared to the conventional centralized voltage control scheme, the proposed decentralized voltage control offers several advantages, including fewer requirements of communication systems, lower computational burdens, higher reliability and enhanced effectiveness.
It is also noticed that the decentralized voltage control via the four-quadrant power control of EVs and EVCSs cannot fully address the voltage issues, mainly due to the constraint of satisfying the EV charging requirements of all EV users. In this case, the installation of battery energy storage systems (BESSs) at EVCSs can be a potential solution to further enhance the grid voltage support capability of EVs and EVCSs, due to a mild decoupling achieved between the EV charging behaviors and the grid voltage support of EVCSs. With the newly added BESSs, EVs and BESSs can provide active- or reactive-power support to the power grid via dedicated EVCSs. Therefore, future work will incorporate BESSs into the proposed decentralized voltage control scheme.
Author Contributions
Conceptualization, X.F. and J.L.; methodology, J.L. and Y.Y.; software, J.L. and X.Y.; validation, J.L. and Y.Y.; formal analysis, X.F. and J.L.; investigation, X.F. and J.L.; resources, X.F. and Y.Y.; data curation, X.F.; writing—original draft preparation, J.L. and Y.Y.; writing—review and editing, X.F. and X.Y.; visualization, X.F. and Y.Y.; supervision, X.F.; project administration, X.F. and Y.Y.; funding acquisition, X.F. and X.Y. All authors have read and agreed to the published version of the manuscript.
Funding
This research was funded by the Science and Technology Project of Electric Power Research Institute of State Grid Jiangsu Electric Power Co., Ltd., (No. J2022026), research on the coordinated voltage control of distribution networks with high penetration of EVs and its application.
Data Availability Statement
Data are contained within the article.
Conflicts of Interest
The authors declare no conflict of interest.
References
- The Global EV Outlook. Available online: https://www.iea.org/reports/global-ev-outlook-2021 (accessed on 6 August 2021).
- Vagropoulos, S.I.; Balaskas, G.A.; Bakirtzis, A.G. An investigation of plug-in electric vehicle charging impact on power systems scheduling and energy costs. IEEE Trans. Power Syst. 2017, 32, 1902–1912. [Google Scholar] [CrossRef]
- Chukwu, U.C.; Mahajan, S.M. V2G electric power capacity estimation and ancillary service market evaluation. In Proceedings of the IEEE Power and Energy Society General Meeting, Detroit, MI, USA, 24–28 July 2011; pp. 1–8. [Google Scholar]
- Leou, R.; Su, C.; Lu, C. Stochastic analyses of electric vehicle charging impacts on distribution network. IEEE Trans. Power Syst. 2014, 29, 1055–1063. [Google Scholar] [CrossRef]
- Yang, H.; Yang, S.; Xu, Y.; Cao, E.; Lai, M.; Dong, Z. Electric vehicle route optimization considering time-of-use electricity price by learnable partheno-genetic algorithm. IEEE Trans. Smart Grid 2015, 6, 657–666. [Google Scholar] [CrossRef]
- De Hoog, J.; Alpcan, T.; Brazil, M.; Thomas, D.A.; Mareels, I. Optimal charging of electric vehicles taking distribution network constraints into account. IEEE Trans. Power Syst. 2015, 30, 365–375. [Google Scholar] [CrossRef]
- Hu, W.; Su, C.; Chen, Z.; Bak-Jensen, B. Optimal operation of plug-in electric vehicles in power systems with high wind power penetrations. IEEE Trans. Sustain. Energy 2013, 4, 577–585. [Google Scholar]
- Chen, T.; Zhang, B.; Pourbabak, H.; Kavousi-Fard, A.; Su, W. Optimal routing and charging of an electric vehicle fleet for high-efficiency dynamic transit systems. IEEE Trans. Smart Grid 2018, 9, 3563–3572. [Google Scholar] [CrossRef]
- Mansouri, S.A.; Jordehi, A.R.; Marzband, M.; Tostado-Véliz, M.; Jurado, F.; Aguado, J.A. An IoT-enabled hierarchical decentralized framework for multi-energy microgrids market management in the presence of smart prosumers using a deep learning-based forecaster. Appl. Energy 2023, 333, 120560. [Google Scholar] [CrossRef]
- Liu, H.; Wu, W. Federated Reinforcement Learning for Decentralized Voltage Control in Distribution Networks. IEEE Trans. Smart Grid 2022, 13, 3840–3843. [Google Scholar] [CrossRef]
- Zhang, M.; Xu, Q.; Magnússon, S.; Pilawa-Podgurski, R.C.; Guo, G. Multi-Agent Deep Reinforcement Learning for Decentralized Voltage-Var Control in Distribution Power System. In Proceedings of the 2022 IEEE Energy Conversion Congress and Exposition (ECCE), Detroit, MI, USA, 9–13 October 2022. [Google Scholar]
- Jafari, M.R.; Parniani, M.; Ravanji, M.H. Decentralized Control of OLTC and PV Inverters for Voltage Regulation in Radial Dis-tribution Networks with High PV Penetration. IEEE Trans. Power Deliv. 2022, 37, 4827–4837. [Google Scholar] [CrossRef]
- Luo, X.; Chan, K.W. Real-time scheduling of electric vehicles charging in low-voltage residential distribution systems to minimise power losses and improve voltage profile. IET Gener. Transm. Distrib. 2014, 8, 516–529. [Google Scholar] [CrossRef]
- Dutta, A.; Ganguly, S.; Kumar, C. Coordinated Volt/Var Control of PV and EV Interfaced Active Distribution Networks Based on Dual-Stage Model Predictive Control. IEEE Syst. J. 2022, 16, 4291–4300. [Google Scholar] [CrossRef]
- Li, H.; Azzouz, M.A.; Hamad, A.A. Cooperative Voltage Control in MV Distribution Networks with Electric Vehicle Charging Stations and Photovoltaic DGs. IEEE Syst. J. 2021, 15, 2989–3000. [Google Scholar] [CrossRef]
- Zhou, K.; Cai, L. Randomized PHEV Charging under Distribution Grid Constraints. IEEE Trans. Smart Grid 2014, 5, 879–887. [Google Scholar] [CrossRef]
- Beaude, O.; He, Y.; Hennebel, M. Introducing Decentralized EV Charging Coordination for the Voltage Regulation. In Proceedings of the IEEE PES ISGT Europe 2013, Lyngby, Denmark, 6–9 October 2013; pp. 1–5. [Google Scholar]
- Kriukov, A.; Gavrilas, M.; Ivanov, O.; Grigoras, G.; Neagu, B.-C.; Scarlatache, F. Novel Decentralized Voltage-Centered EV Charging Control Algorithm Using DSRC System in Low Voltage Distribution Networks. IEEE Access 2021, 9, 164779–164800. [Google Scholar] [CrossRef]
- Hu, J.; Ye, C.; Ding, Y.; Tang, J.; Liu, S. A Distributed MPC to Exploit Reactive Power V2G for Real-Time Voltage Regulation in Distribution Networks. IEEE Trans. Smart Grid 2022, 13, 576–588. [Google Scholar] [CrossRef]
- Sawalha, H.F.; Batarseh, M.G. An Improved Two-Stage Bidirectional Converter for Electric Vehicles to Grid Applications. In Proceedings of the 2022 International Conference on Electrical, Computer and Energy Technologies (ICECET), Prague, Czech Republic, 20–22 July 2022; pp. 1–6. [Google Scholar]
- Zhao, B.; Xu, Z.; Xu, C.; Wang, C.; Lin, F. Network Partition-Based Zonal Voltage Control for Distribution Networks with Distributed PV Systems. IEEE Trans. Smart Grid 2018, 9, 4087–4098. [Google Scholar] [CrossRef]
- Girvan, M.; Newman, M.E. Community structure in social and biological networks. Proc. Nat. Acad. Sci. USA 2002, 99, 7821–7826. [Google Scholar] [CrossRef] [PubMed]
- Electricity North West. Low Voltage Network Solutions Closedown Report. 2014. Available online: https://www.enwl.co.uk/go-net-zero/innovation/smaller-projects/low-carbon-networks-fund/low-voltage-network-solutions/low-voltage-networksolutions-closedown-report/ (accessed on 6 August 2023).
- IEEE. PES Distribution Systems Analysis Subcommittee Radial Test Feeders. Available online: https://cmte.ieee.org/pestestfeeders/resources/ (accessed on 6 August 2023).
- Xu, X.; Li, Q.; Sheng, M.; Gao, H. An Optimization-based Approach for the Distribution Network Electric Vehicle Hosting Capacity Assessment. In Proceedings of the 2022 China Automation Congress (CAC), Xiamen, China, 25–27 November 2022; pp. 3795–3800. [Google Scholar]
- Vyas, A.; Santini, D. Use of National Surveys for Estimating ‘Full’ PHEV Potential for Oil Use Reduction [EB/OL]. 21 July 2008. Available online: http://www.transportation.anl.gov/pdfs/HV/525.pdf (accessed on 6 August 2023).
- Li, D.; Zheng, J.; Shi, M.; Li, T.; Shao, H.; Liang, X. Prediction of time and space distribution of electric vehicle charging load. Electr. Power Eng. Technol. 2019, 38, 75–83. [Google Scholar]
- Zou, D.; Chen, G.; Xu, X. Architecture design of automatic voltage control system for active distribution network. Electr. Power Eng. Technol. 2019, 38, 42–47. [Google Scholar]
Figure 1.
Illustration of a simplified five-bus feeder with EVCSs connected.

Figure 2.
The general circuit diagram of an EVCS supporting V2G technology.
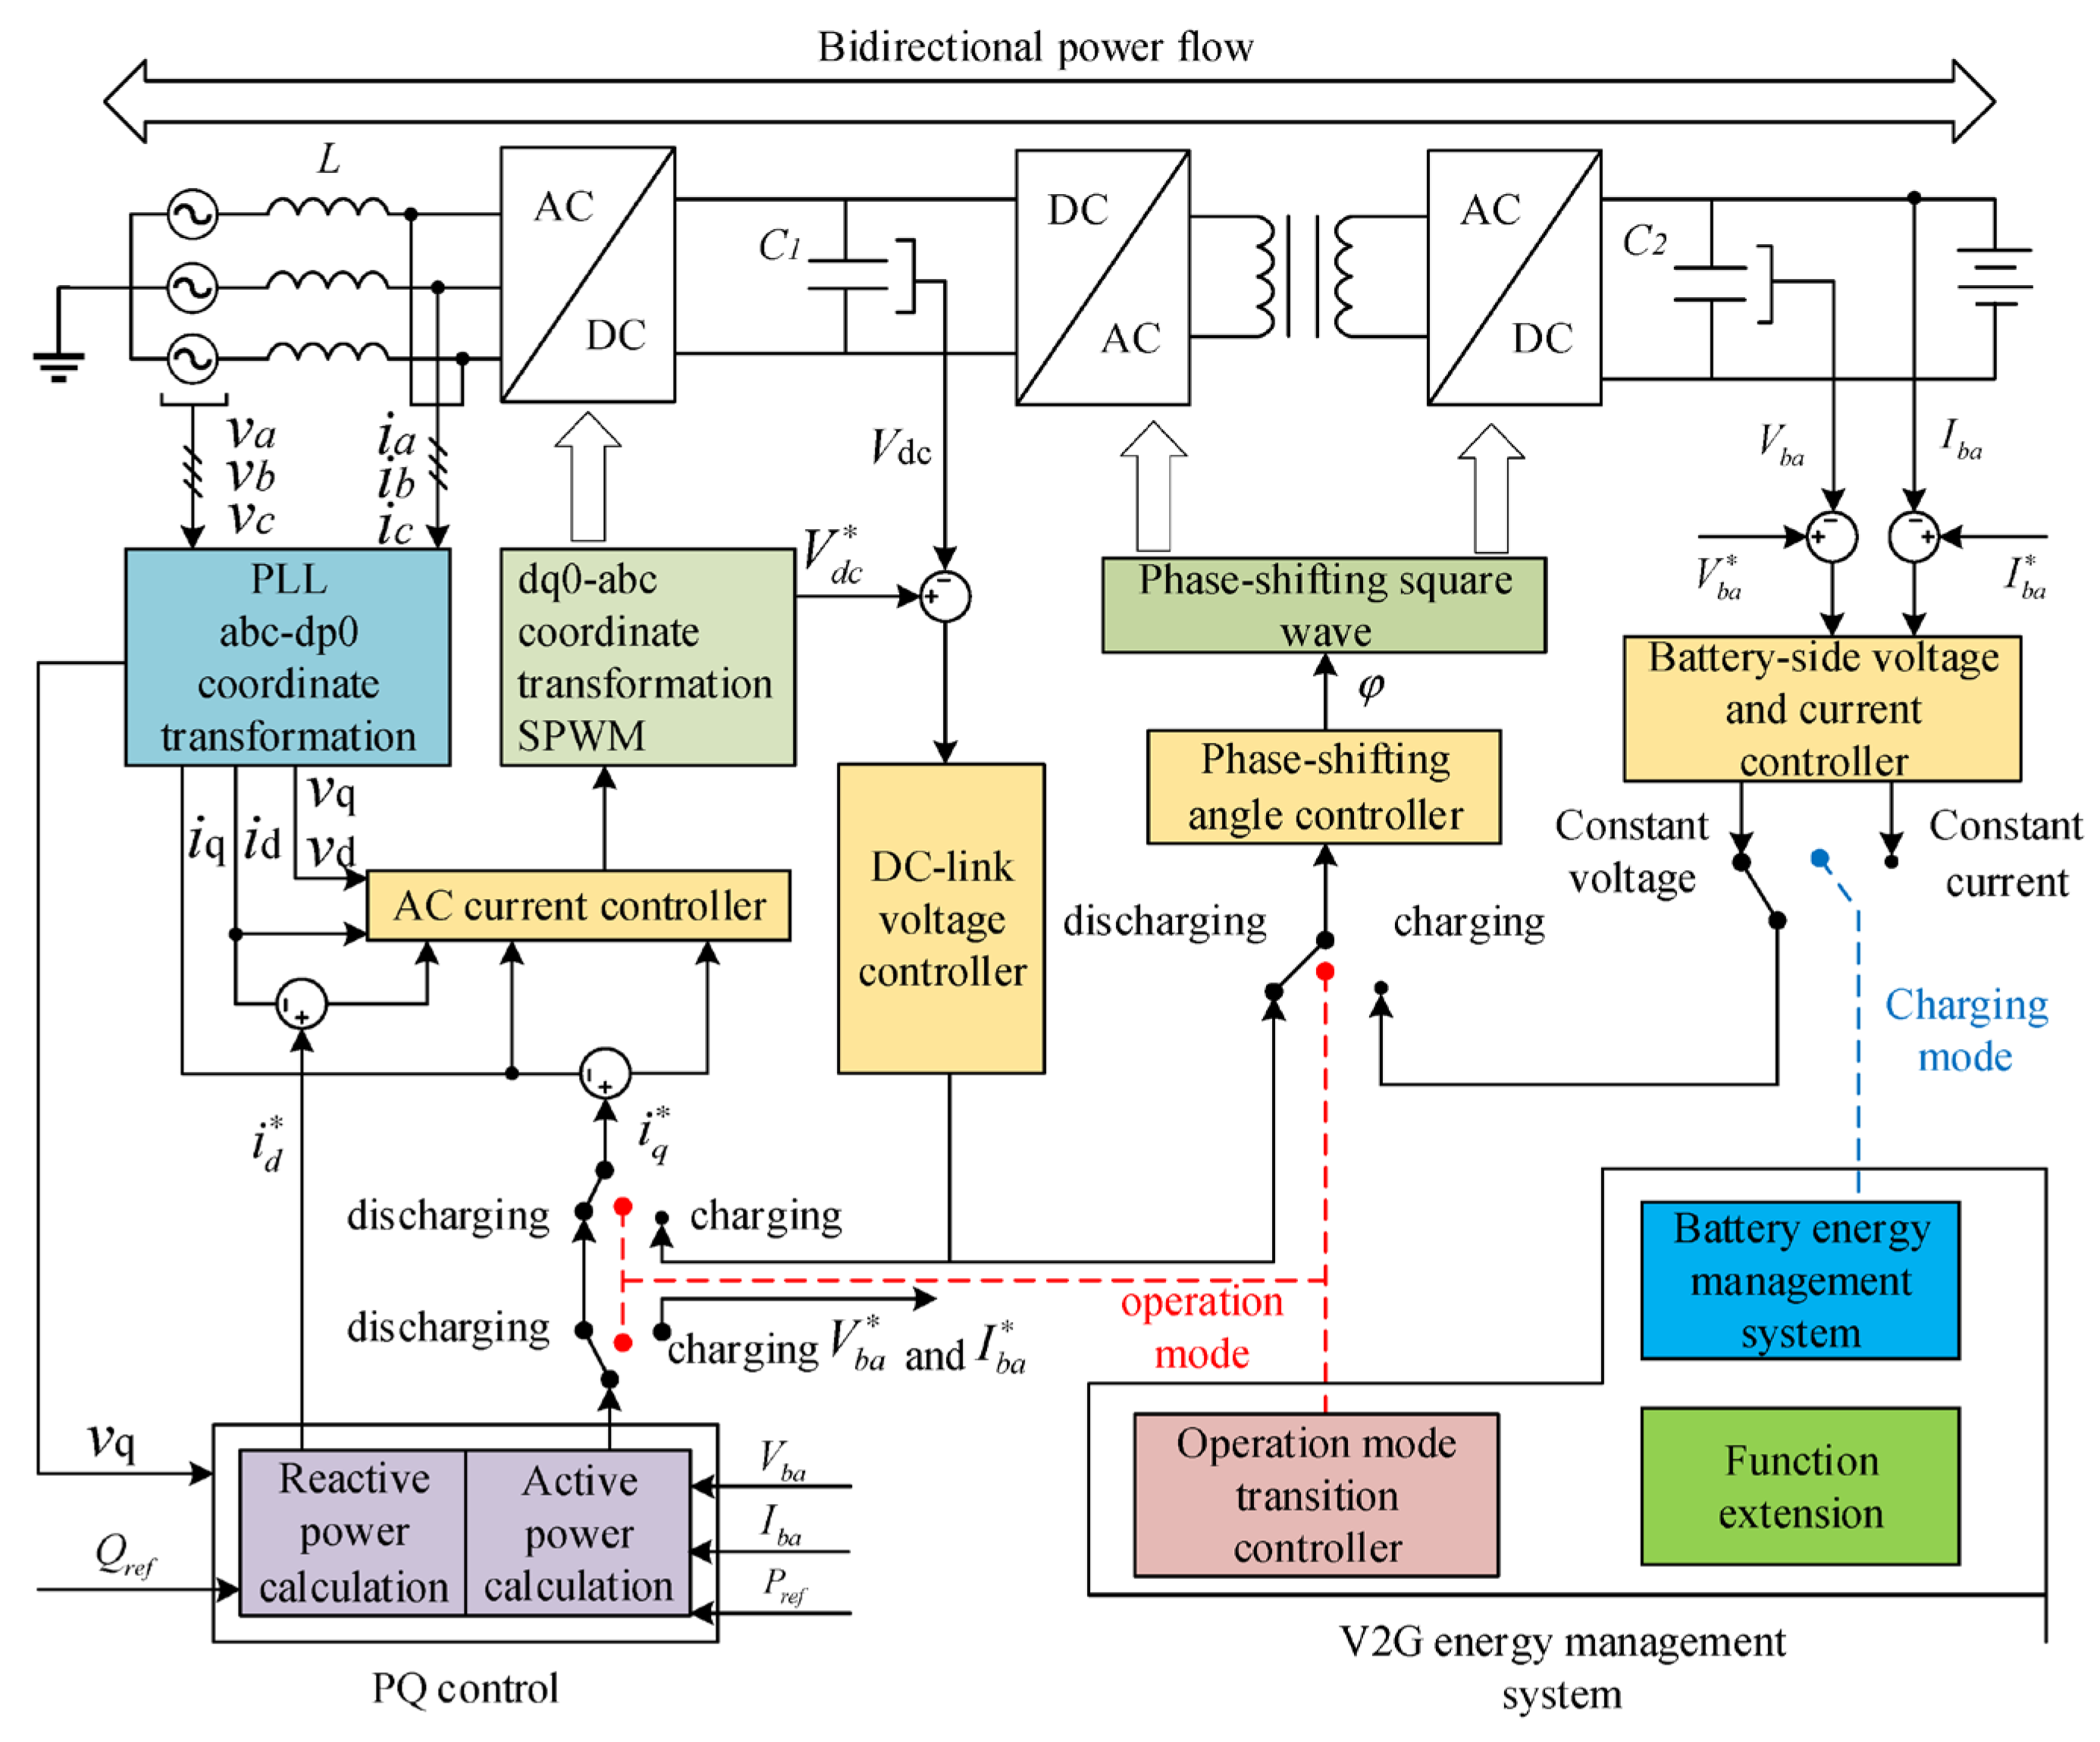
Figure 3.
Illustration of the operational constraints of EVCSs and EVs having the grid voltage support capability: (a) the four-quadrant operation region of EVCSs; (b) the operation region of EV battery SoC.
Figure 3.
Illustration of the operational constraints of EVCSs and EVs having the grid voltage support capability: (a) the four-quadrant operation region of EVCSs; (b) the operation region of EV battery SoC.
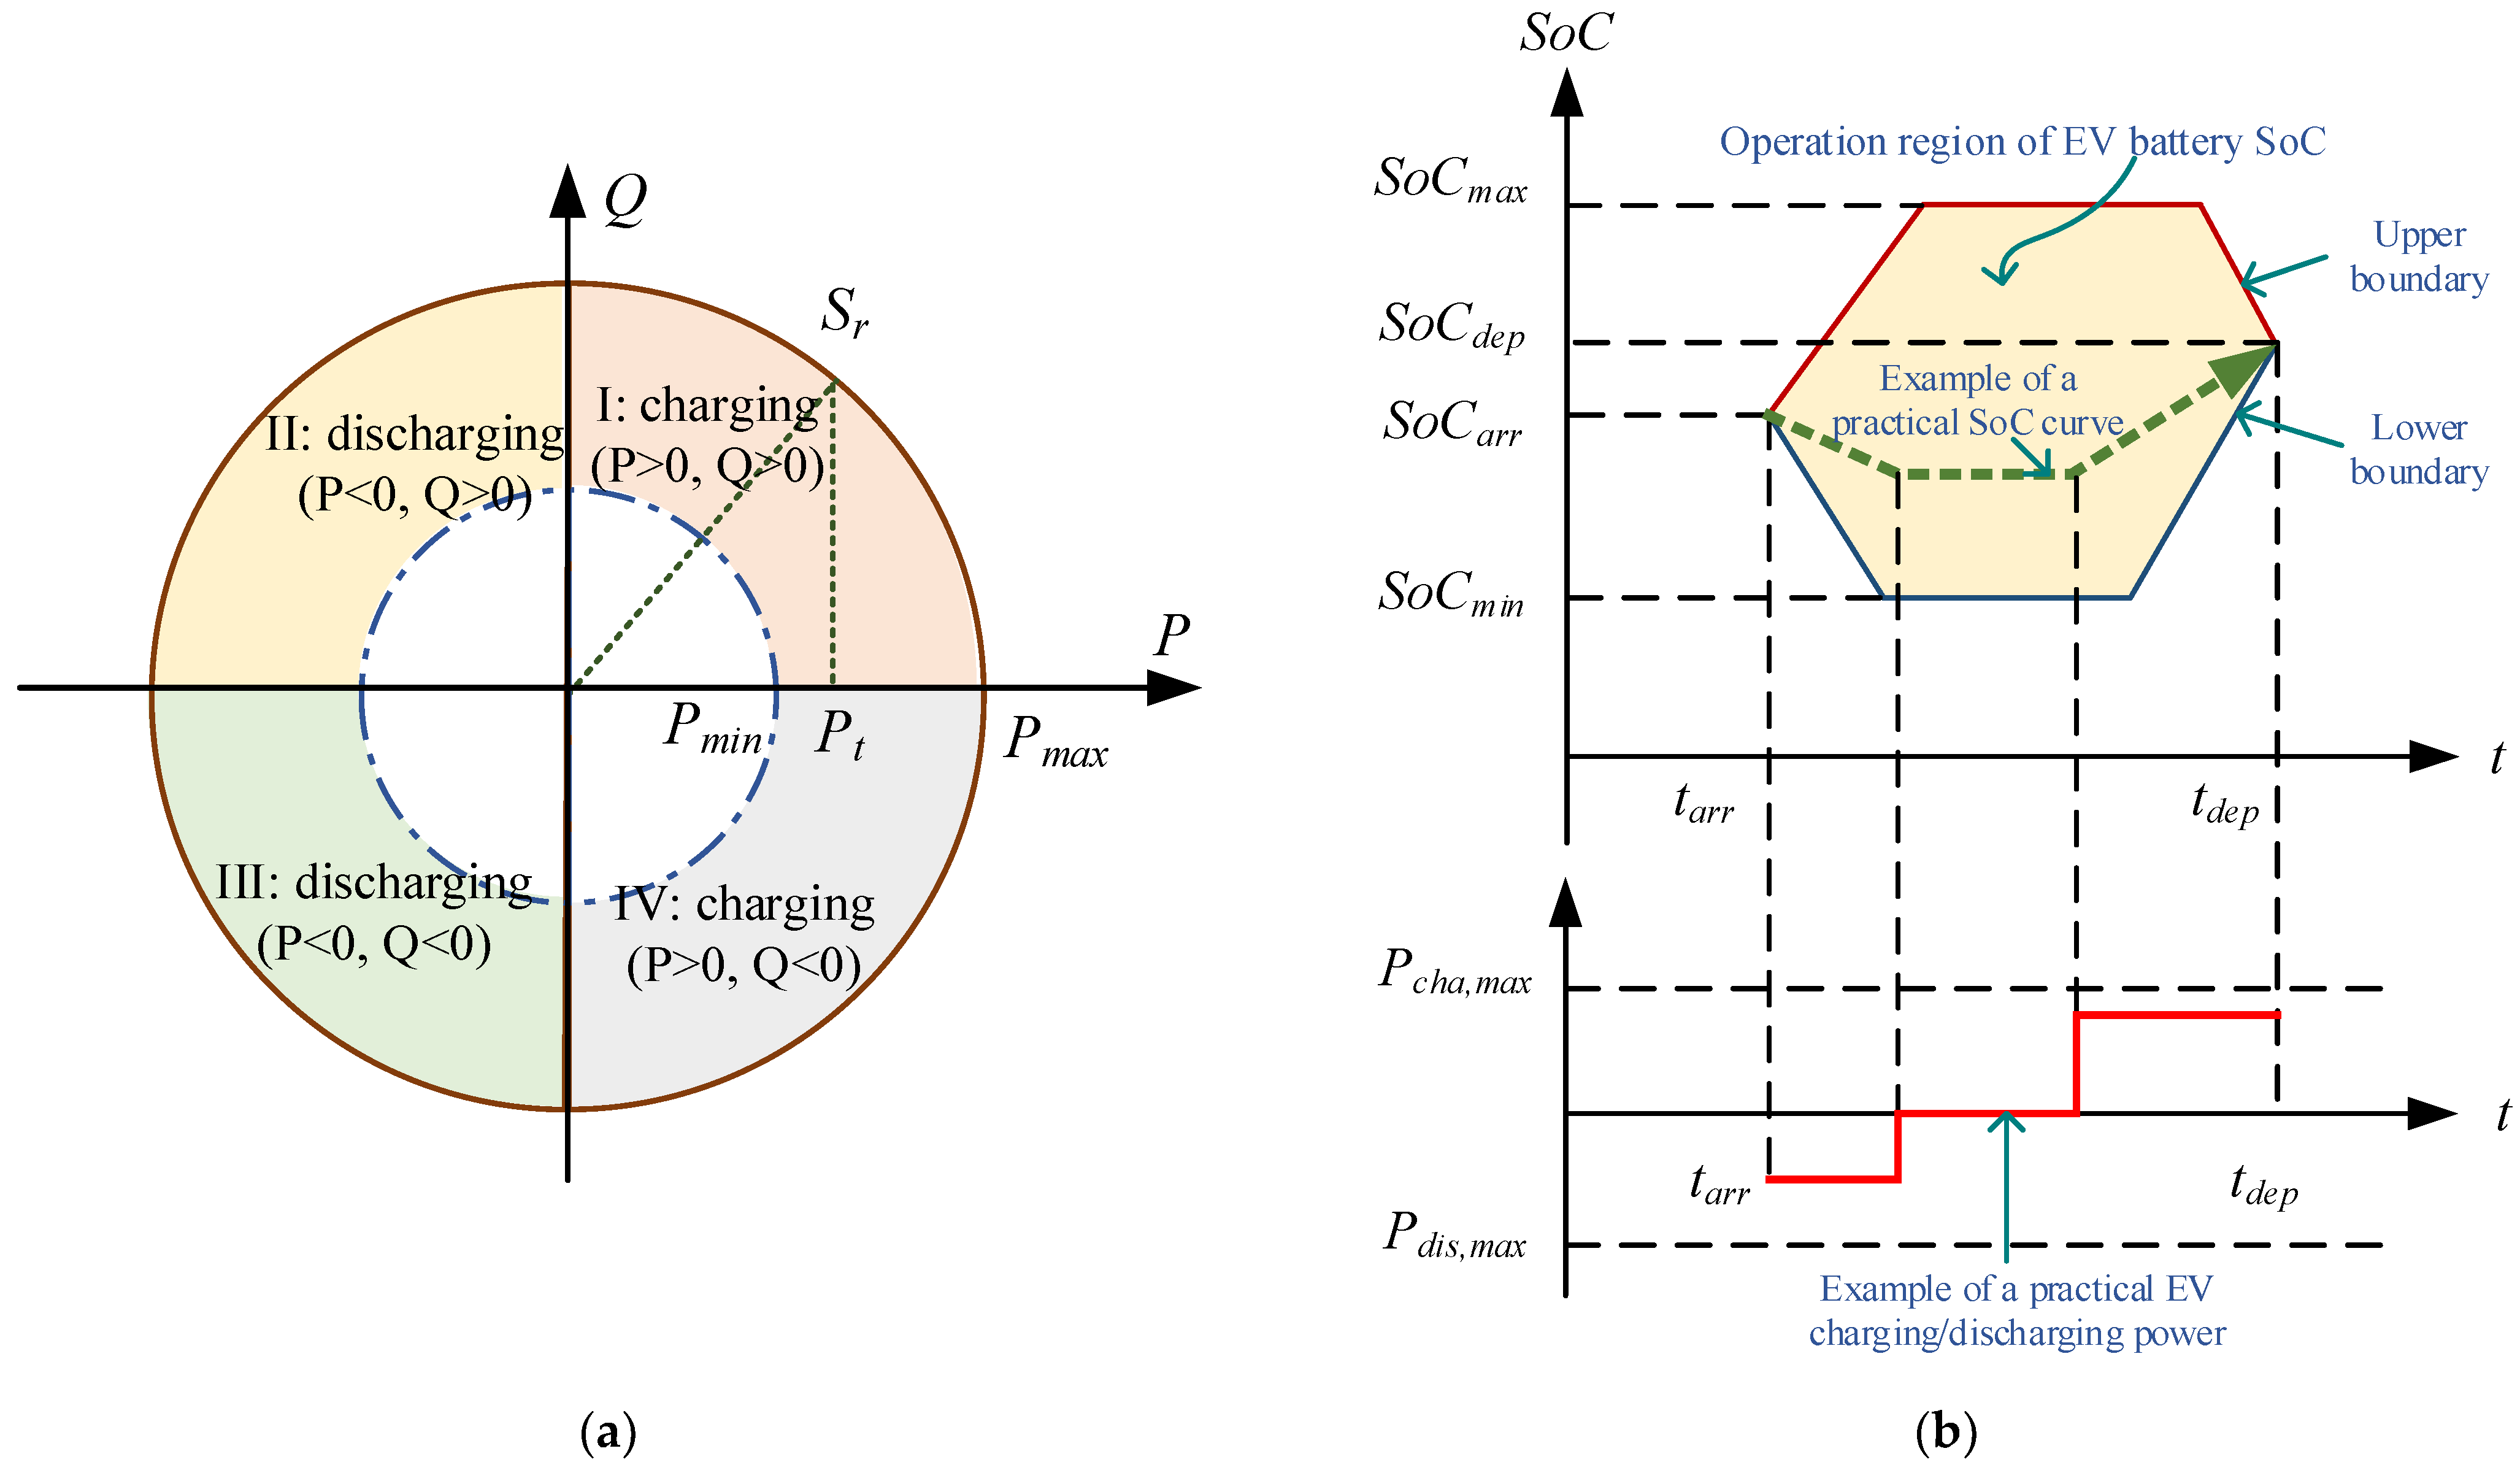
Figure 4.
Illustration of the preliminary node-clustering process for the distribution network with EVCSs connected.
Figure 4.
Illustration of the preliminary node-clustering process for the distribution network with EVCSs connected.

Figure 5.
The procedure of distribution network partitioning with EVCSs connected (a) the flowchart of implementation procedure; (b) an example of the network partitioning process.
Figure 5.
The procedure of distribution network partitioning with EVCSs connected (a) the flowchart of implementation procedure; (b) an example of the network partitioning process.
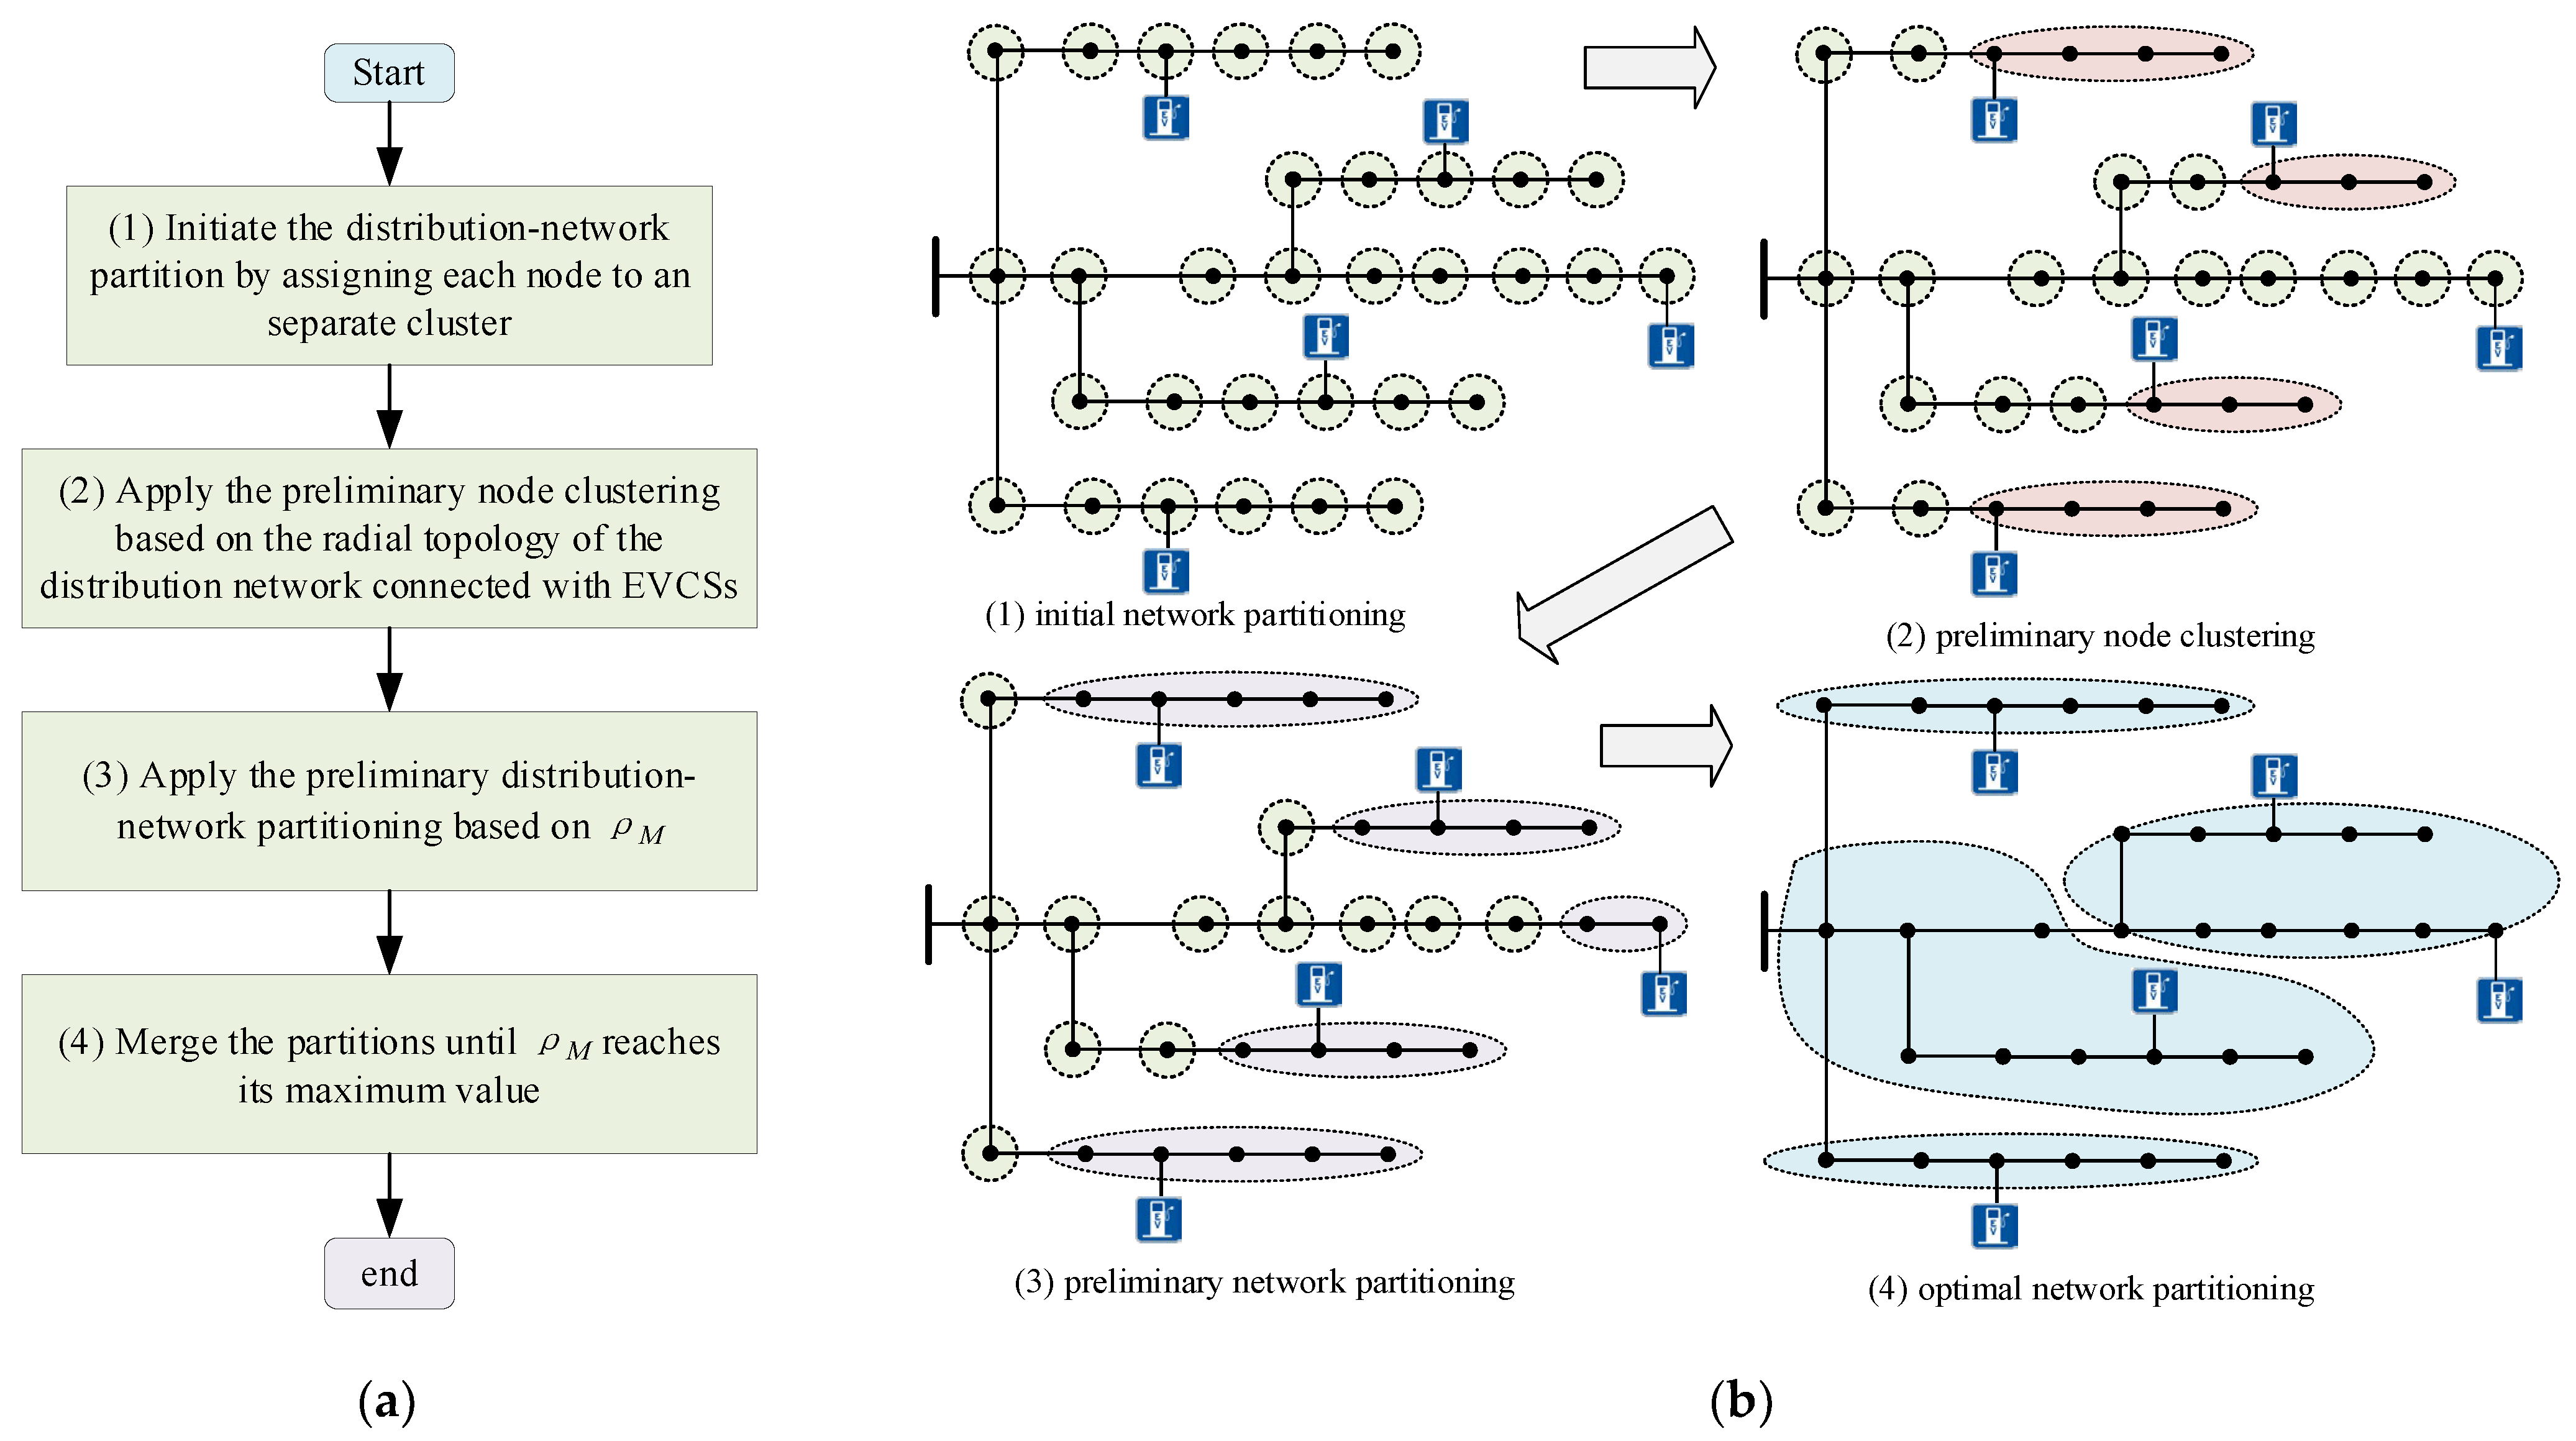
Figure 6.
The general distribution voltage control framework with the involvement of diversified voltage support resources.
Figure 6.
The general distribution voltage control framework with the involvement of diversified voltage support resources.
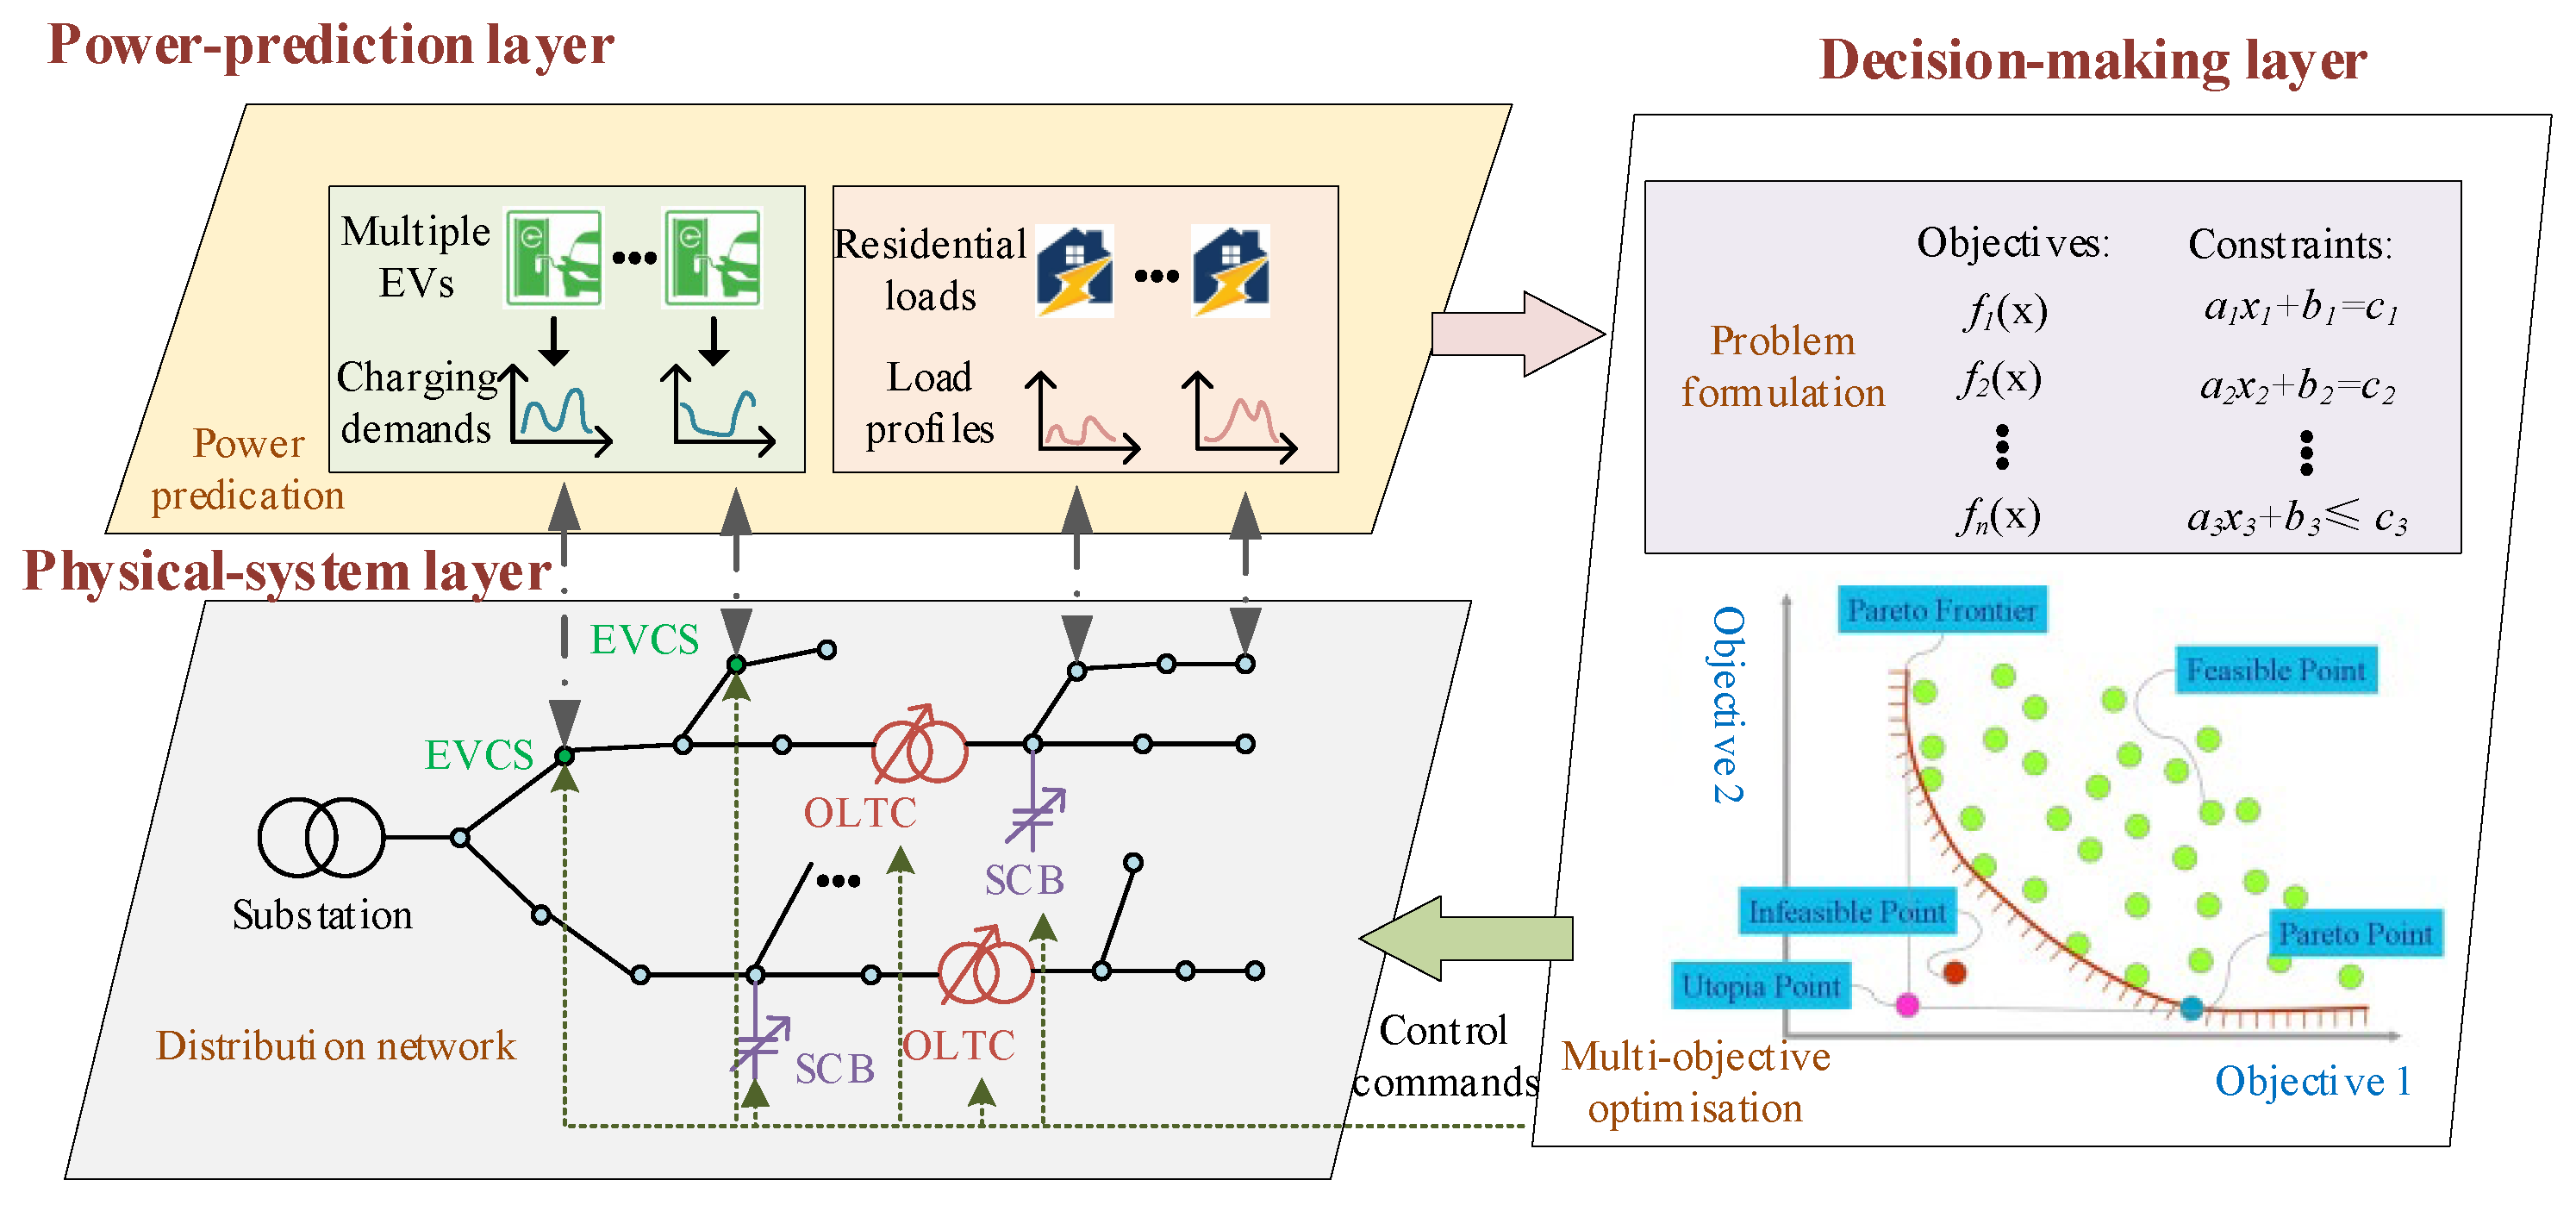
Figure 7.
Illustration of the rolling optimization-based control framework of EVs and EVCSs.

Figure 8.
The architecture and the generalized implementation procedure of the proposed decentralized voltage control scheme.
Figure 8.
The architecture and the generalized implementation procedure of the proposed decentralized voltage control scheme.

Figure 9.
The flowchart of the decentralized voltage control scheme for the participation of EVs and EVCSs.
Figure 9.
The flowchart of the decentralized voltage control scheme for the participation of EVs and EVCSs.

Figure 10.
The IEEE 123-node test feeder having EVs and EVCSs integrated.
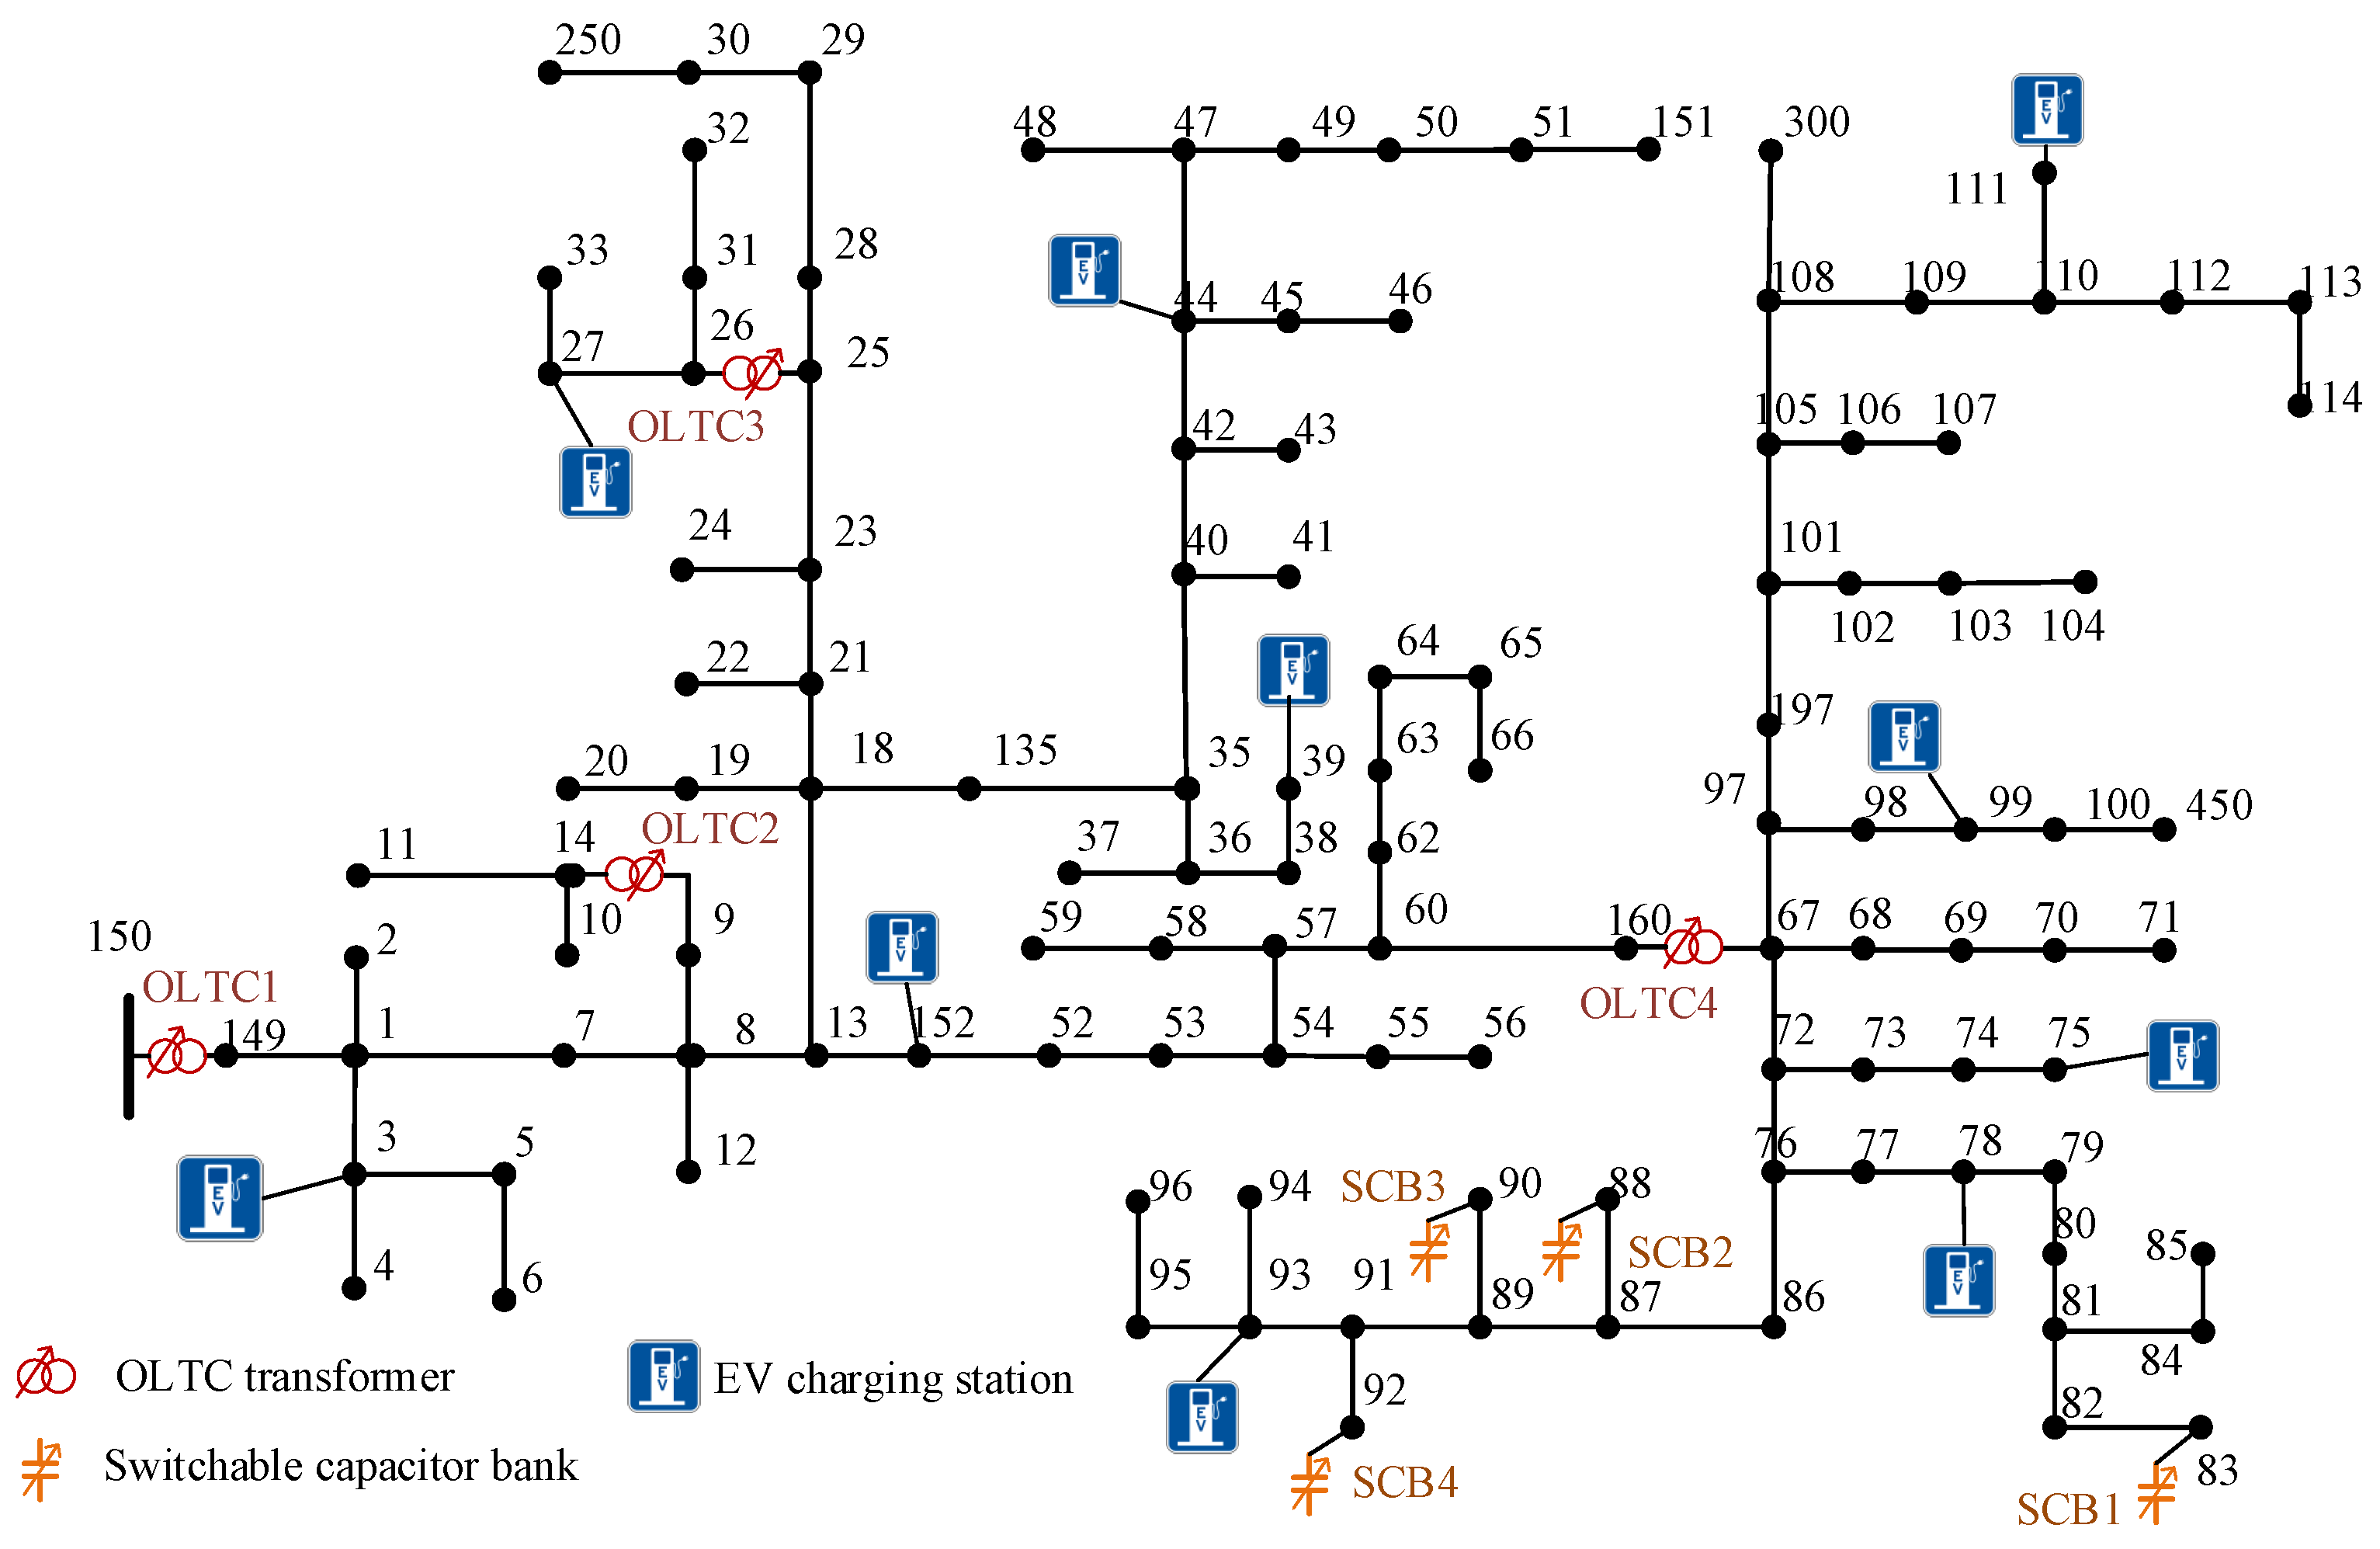
Figure 11.
The daily load profiles utilized on the target distribution network.
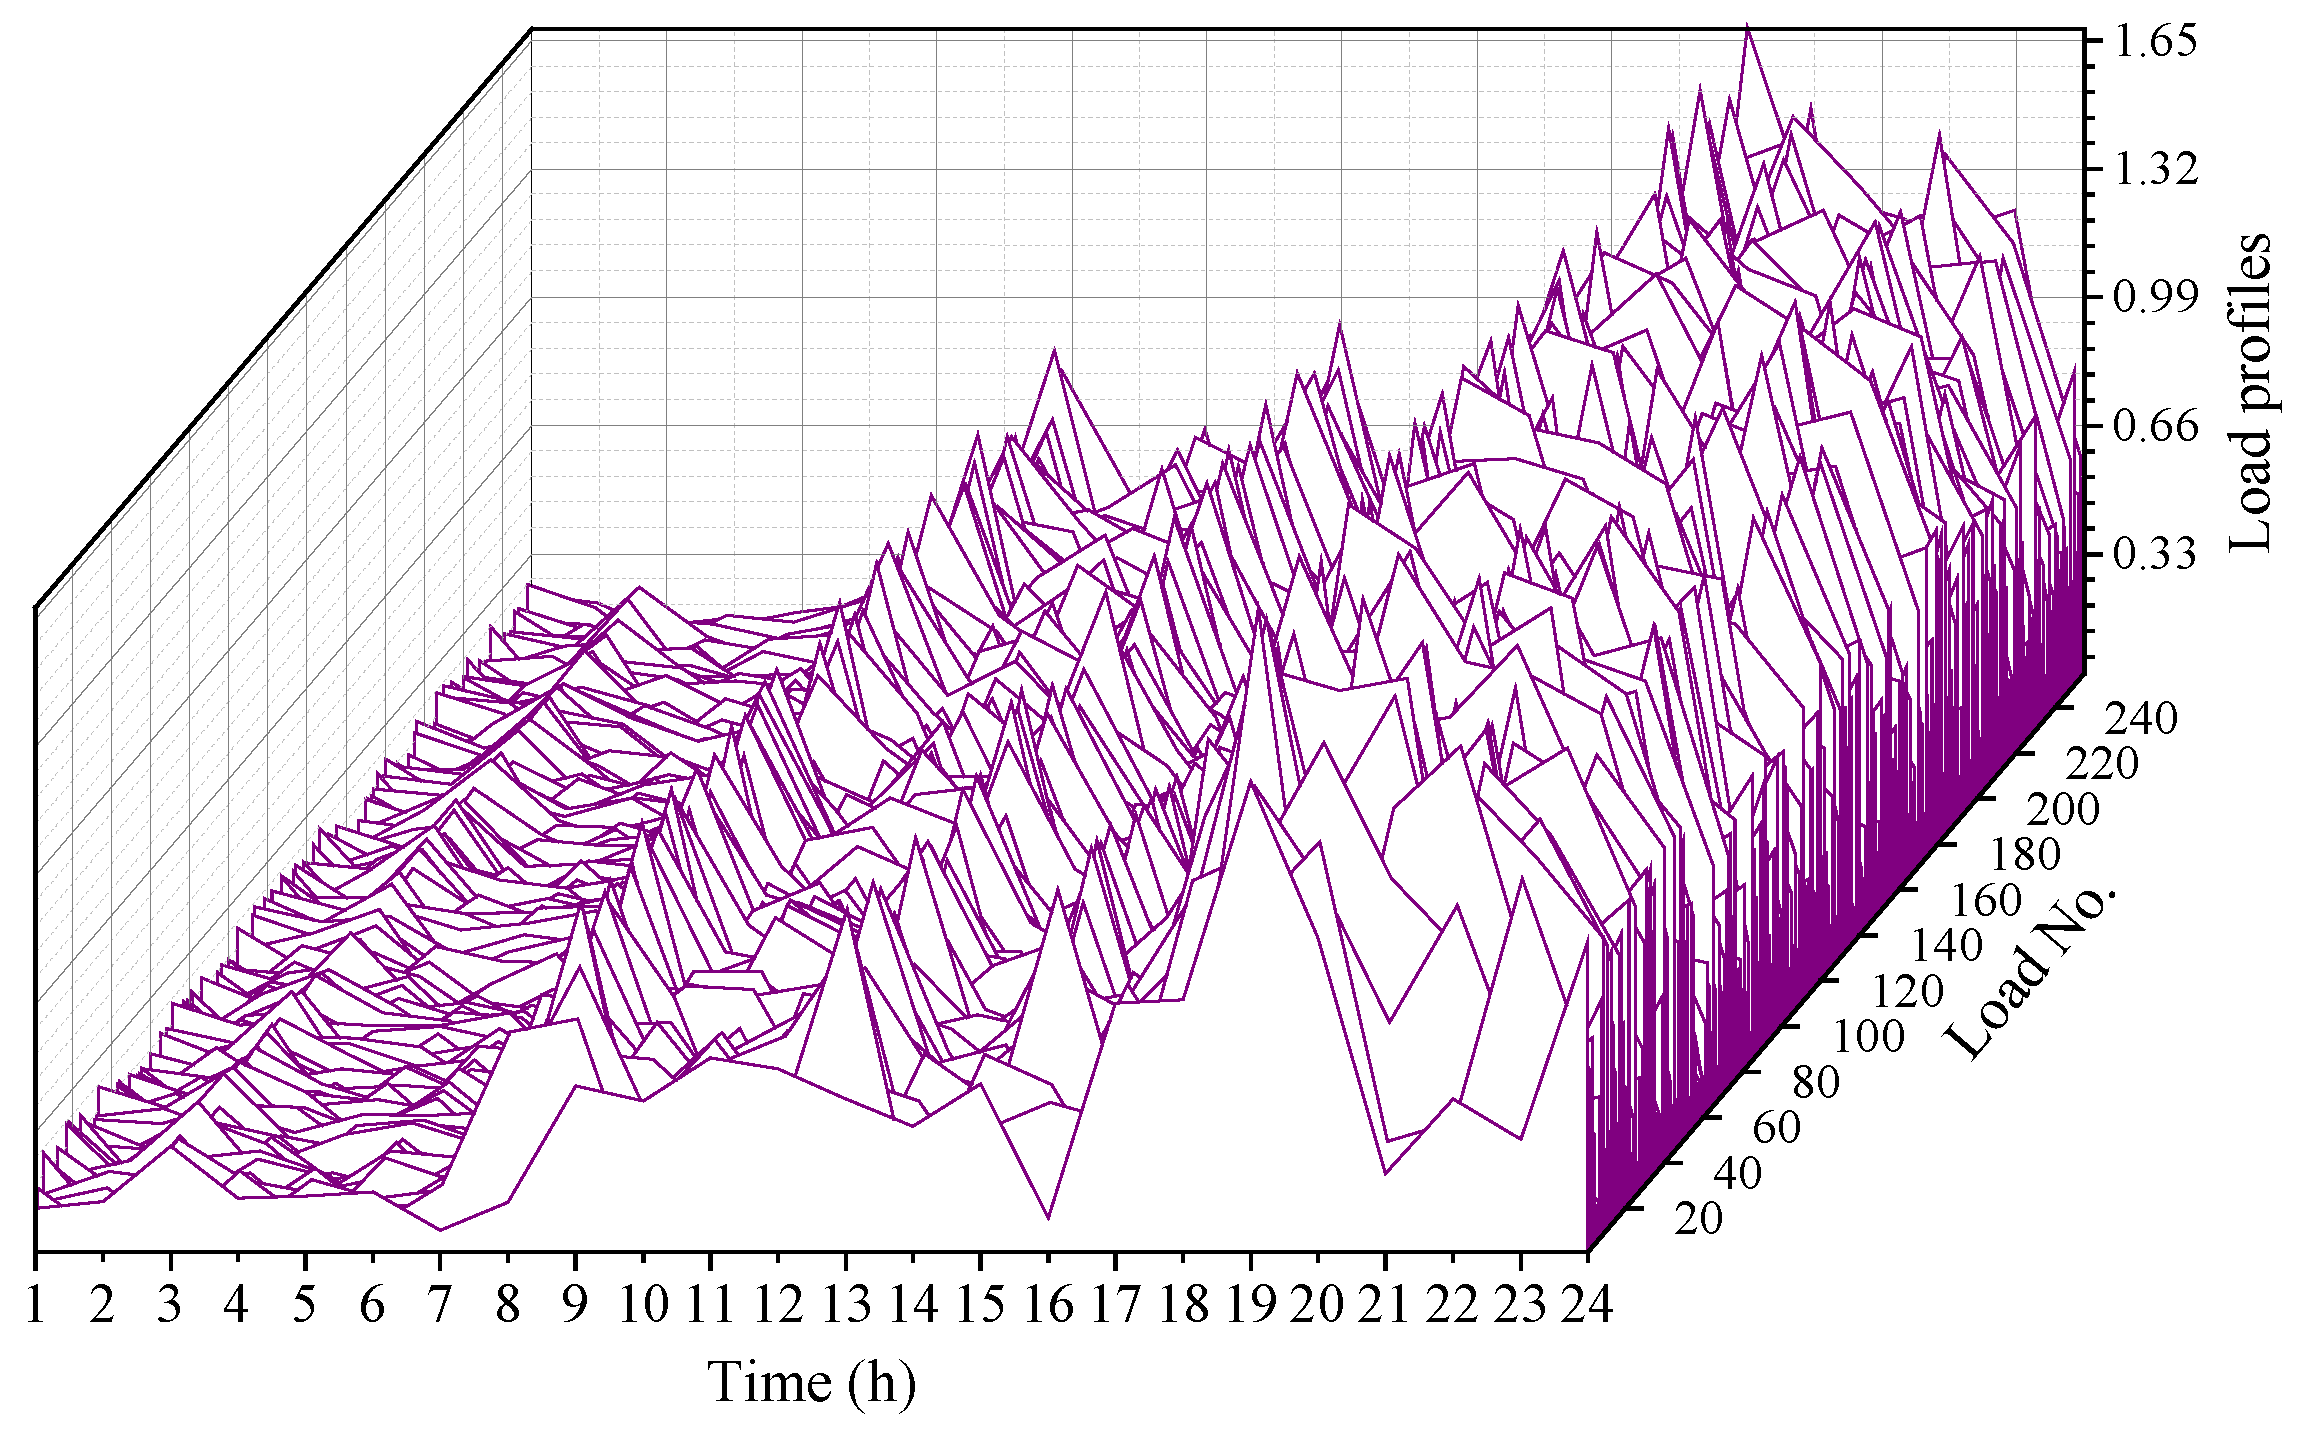
Figure 12.
Illustration of the EV charging demands with different transport types.

Figure 13.
Bus voltages of the IEEE 123-node test feeder without voltage regulation.

Figure 14.
The optimized operating settings for all OLTC transformers and SCBs: (a) settings for OLTC taps; (b) settings for SCBs.
Figure 14.
The optimized operating settings for all OLTC transformers and SCBs: (a) settings for OLTC taps; (b) settings for SCBs.
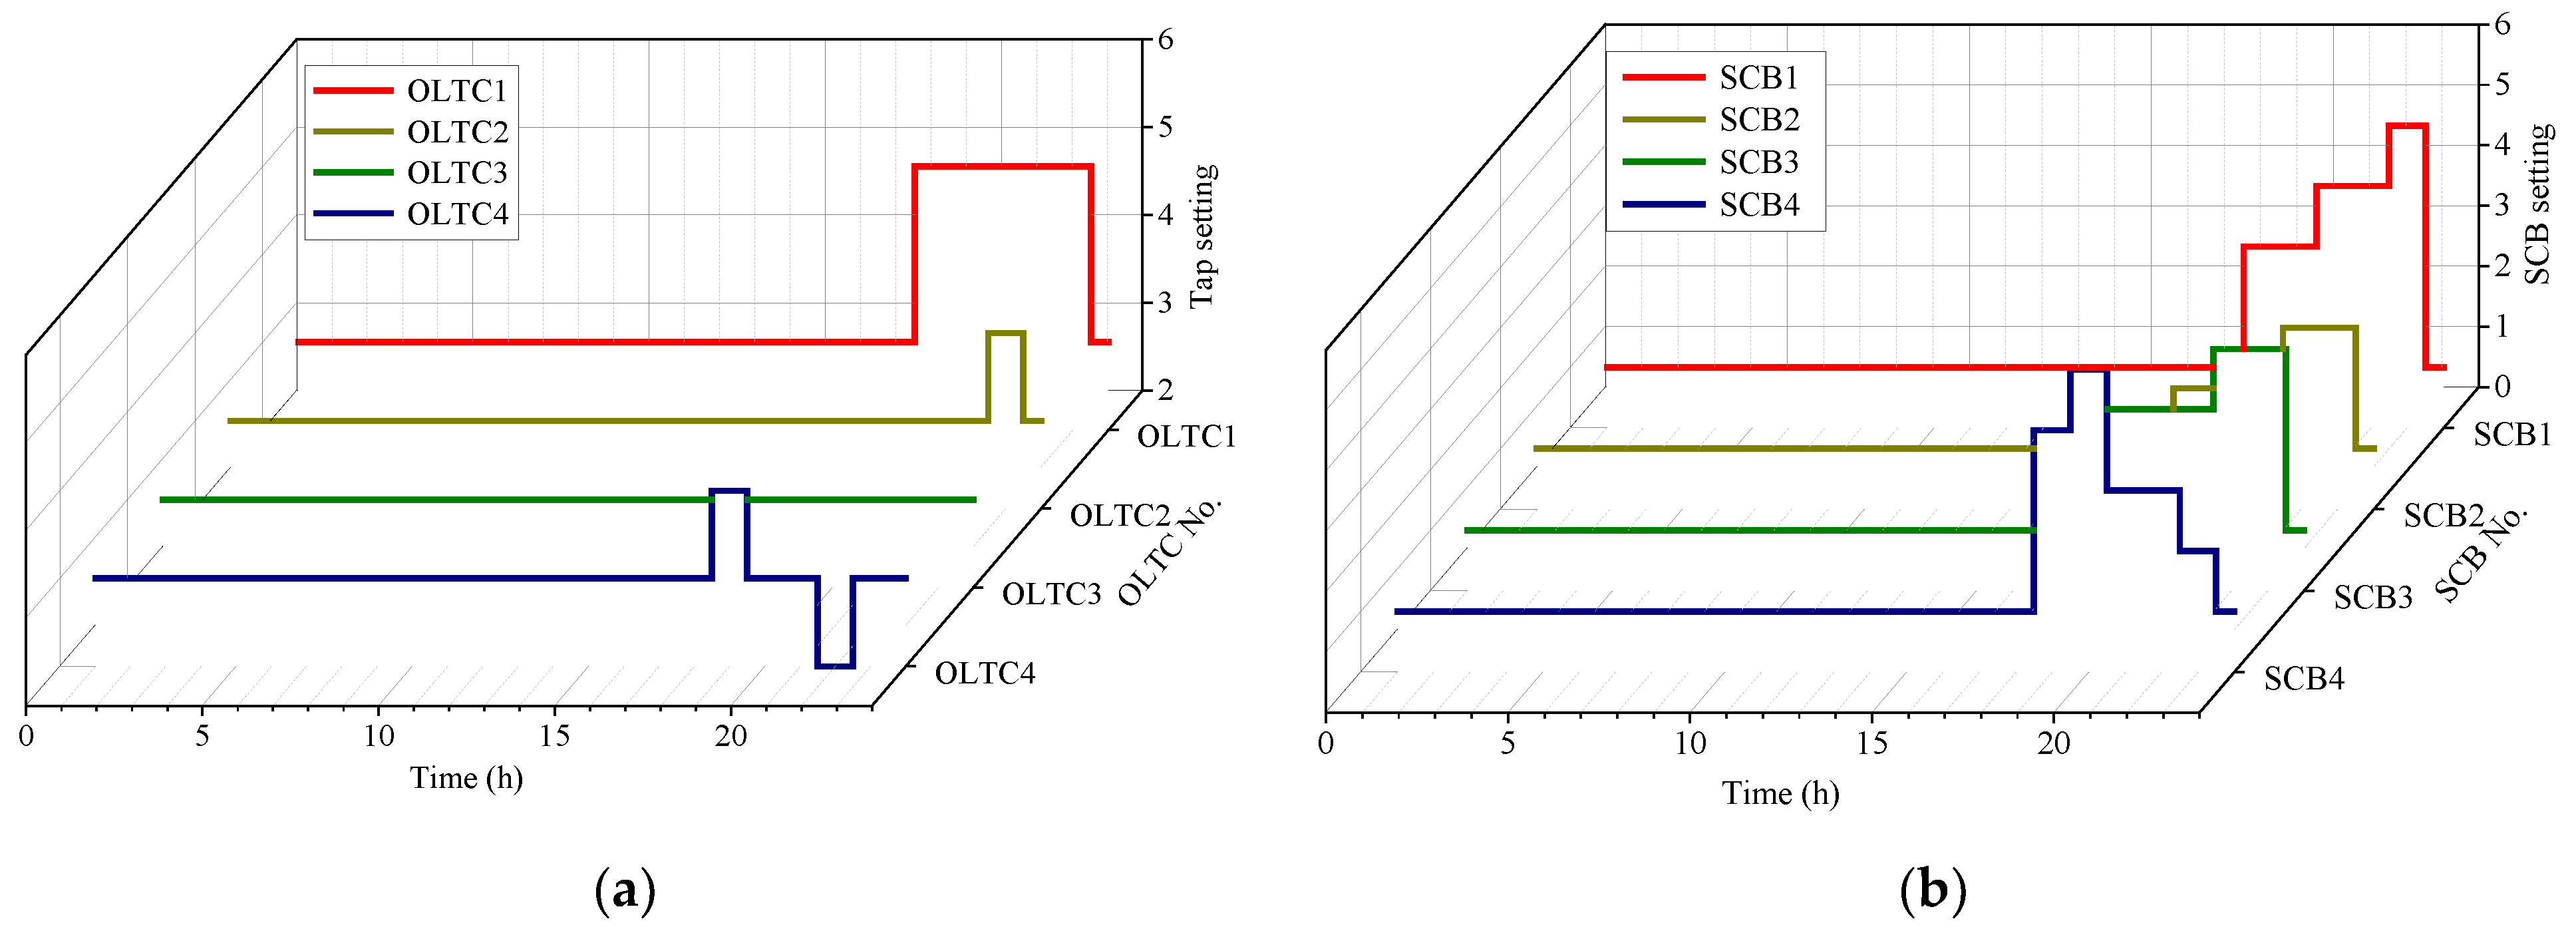
Figure 15.
Bus voltages of the target distribution network with the OLTC transformer and SCB-based distribution voltage regulation.
Figure 15.
Bus voltages of the target distribution network with the OLTC transformer and SCB-based distribution voltage regulation.

Figure 16.
The optimal network partitioning results based on the power-dependent voltage sensitives (at 8 p.m.): (a) the optimal network partitioning results based on (at 8 p.m.); (b) the optimal network partitioning results based on (at 8 p.m.).
Figure 16.
The optimal network partitioning results based on the power-dependent voltage sensitives (at 8 p.m.): (a) the optimal network partitioning results based on (at 8 p.m.); (b) the optimal network partitioning results based on (at 8 p.m.).

Figure 17.
The obtained modularity index, , corresponding to Figure 16: (a) with respect to Figure 16a; (b) with respect to Figure 16b.
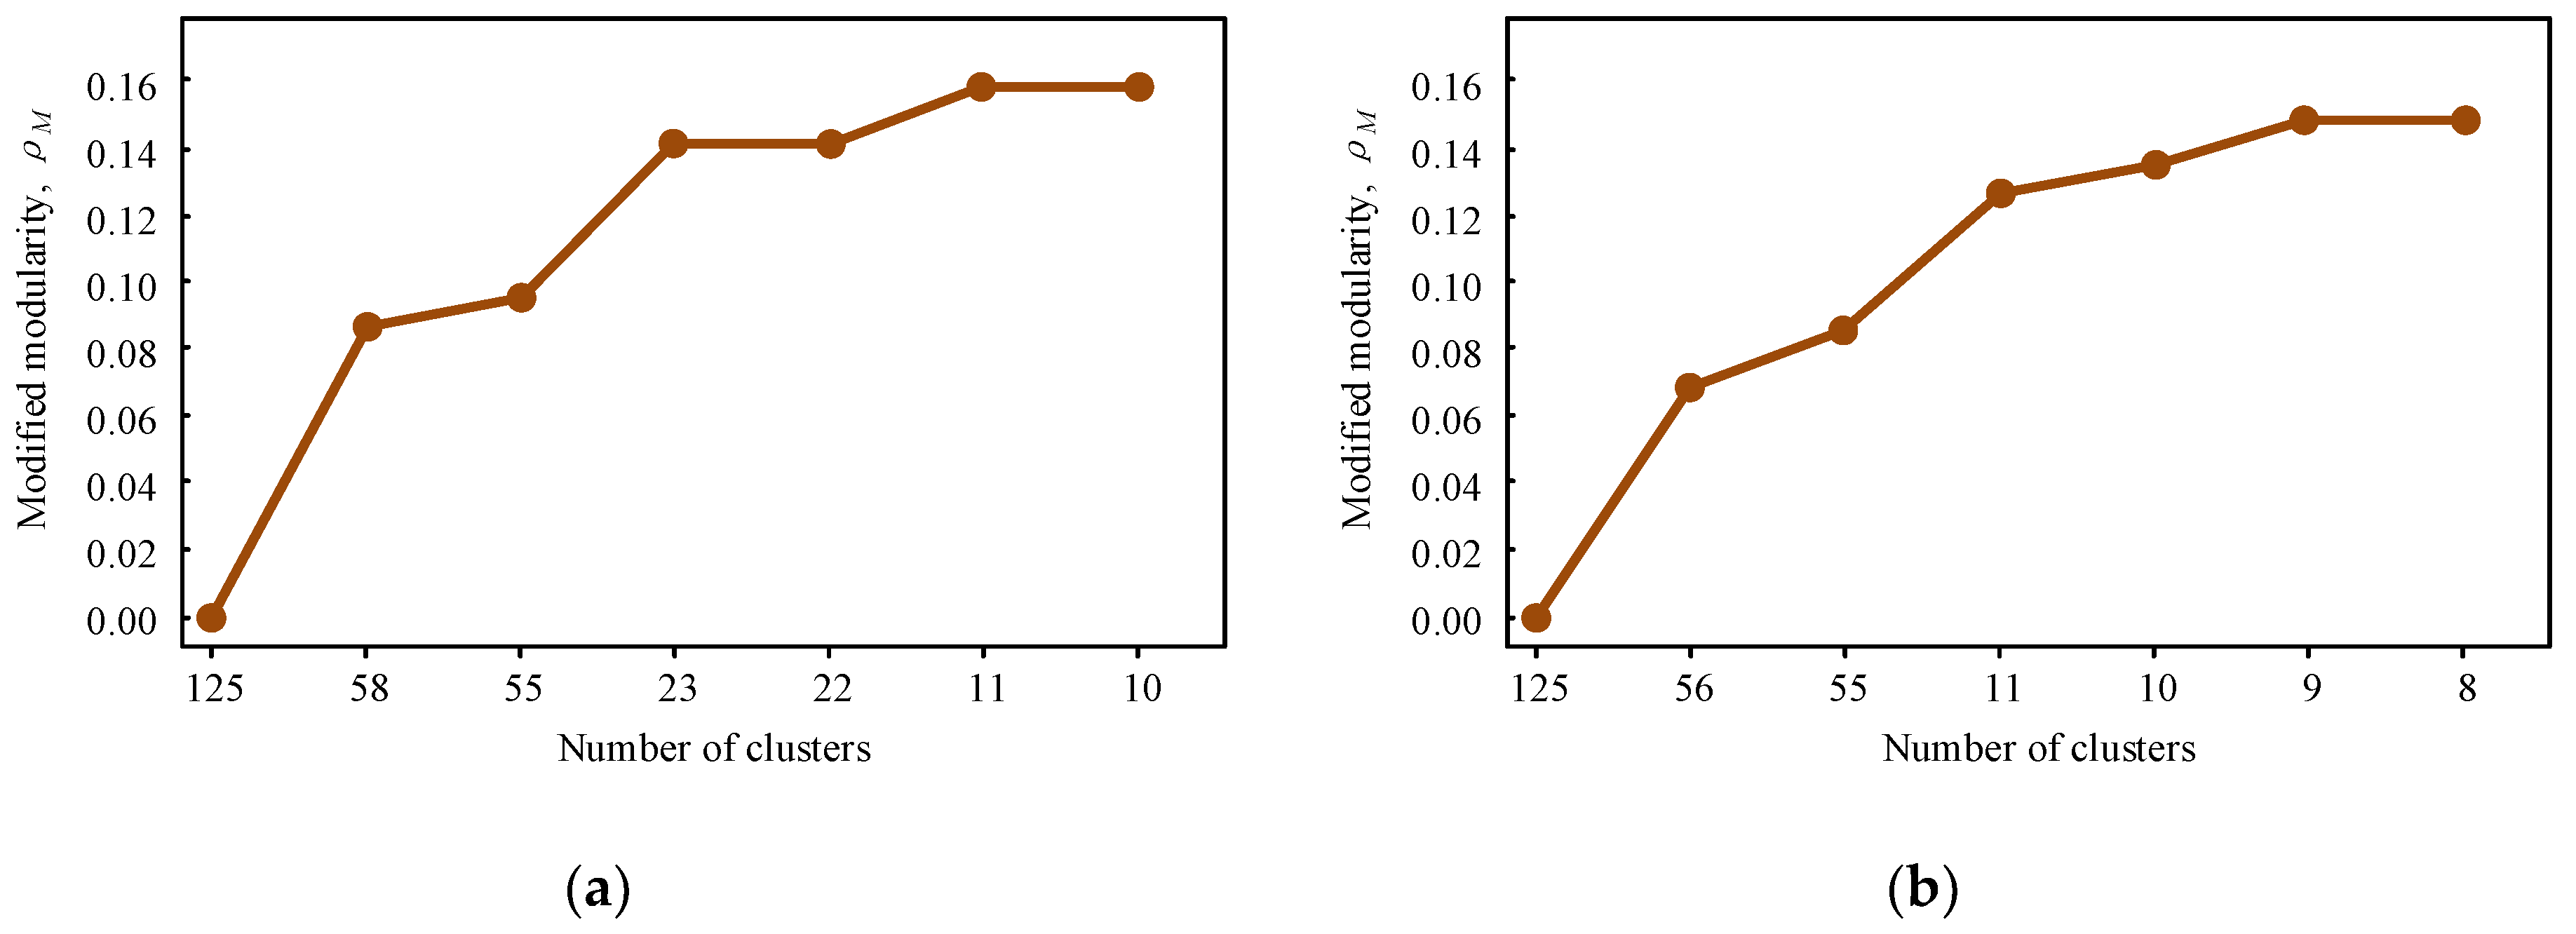
Figure 18.
The optimal charging schemes for EVs participating in decentralized voltage control: (a) the optimal charging schemes for EVs participating in APS-based decentralized voltage control; (b) the optimal charging schemes for EVs participating in RPS-based decentralized voltage control.
Figure 18.
The optimal charging schemes for EVs participating in decentralized voltage control: (a) the optimal charging schemes for EVs participating in APS-based decentralized voltage control; (b) the optimal charging schemes for EVs participating in RPS-based decentralized voltage control.
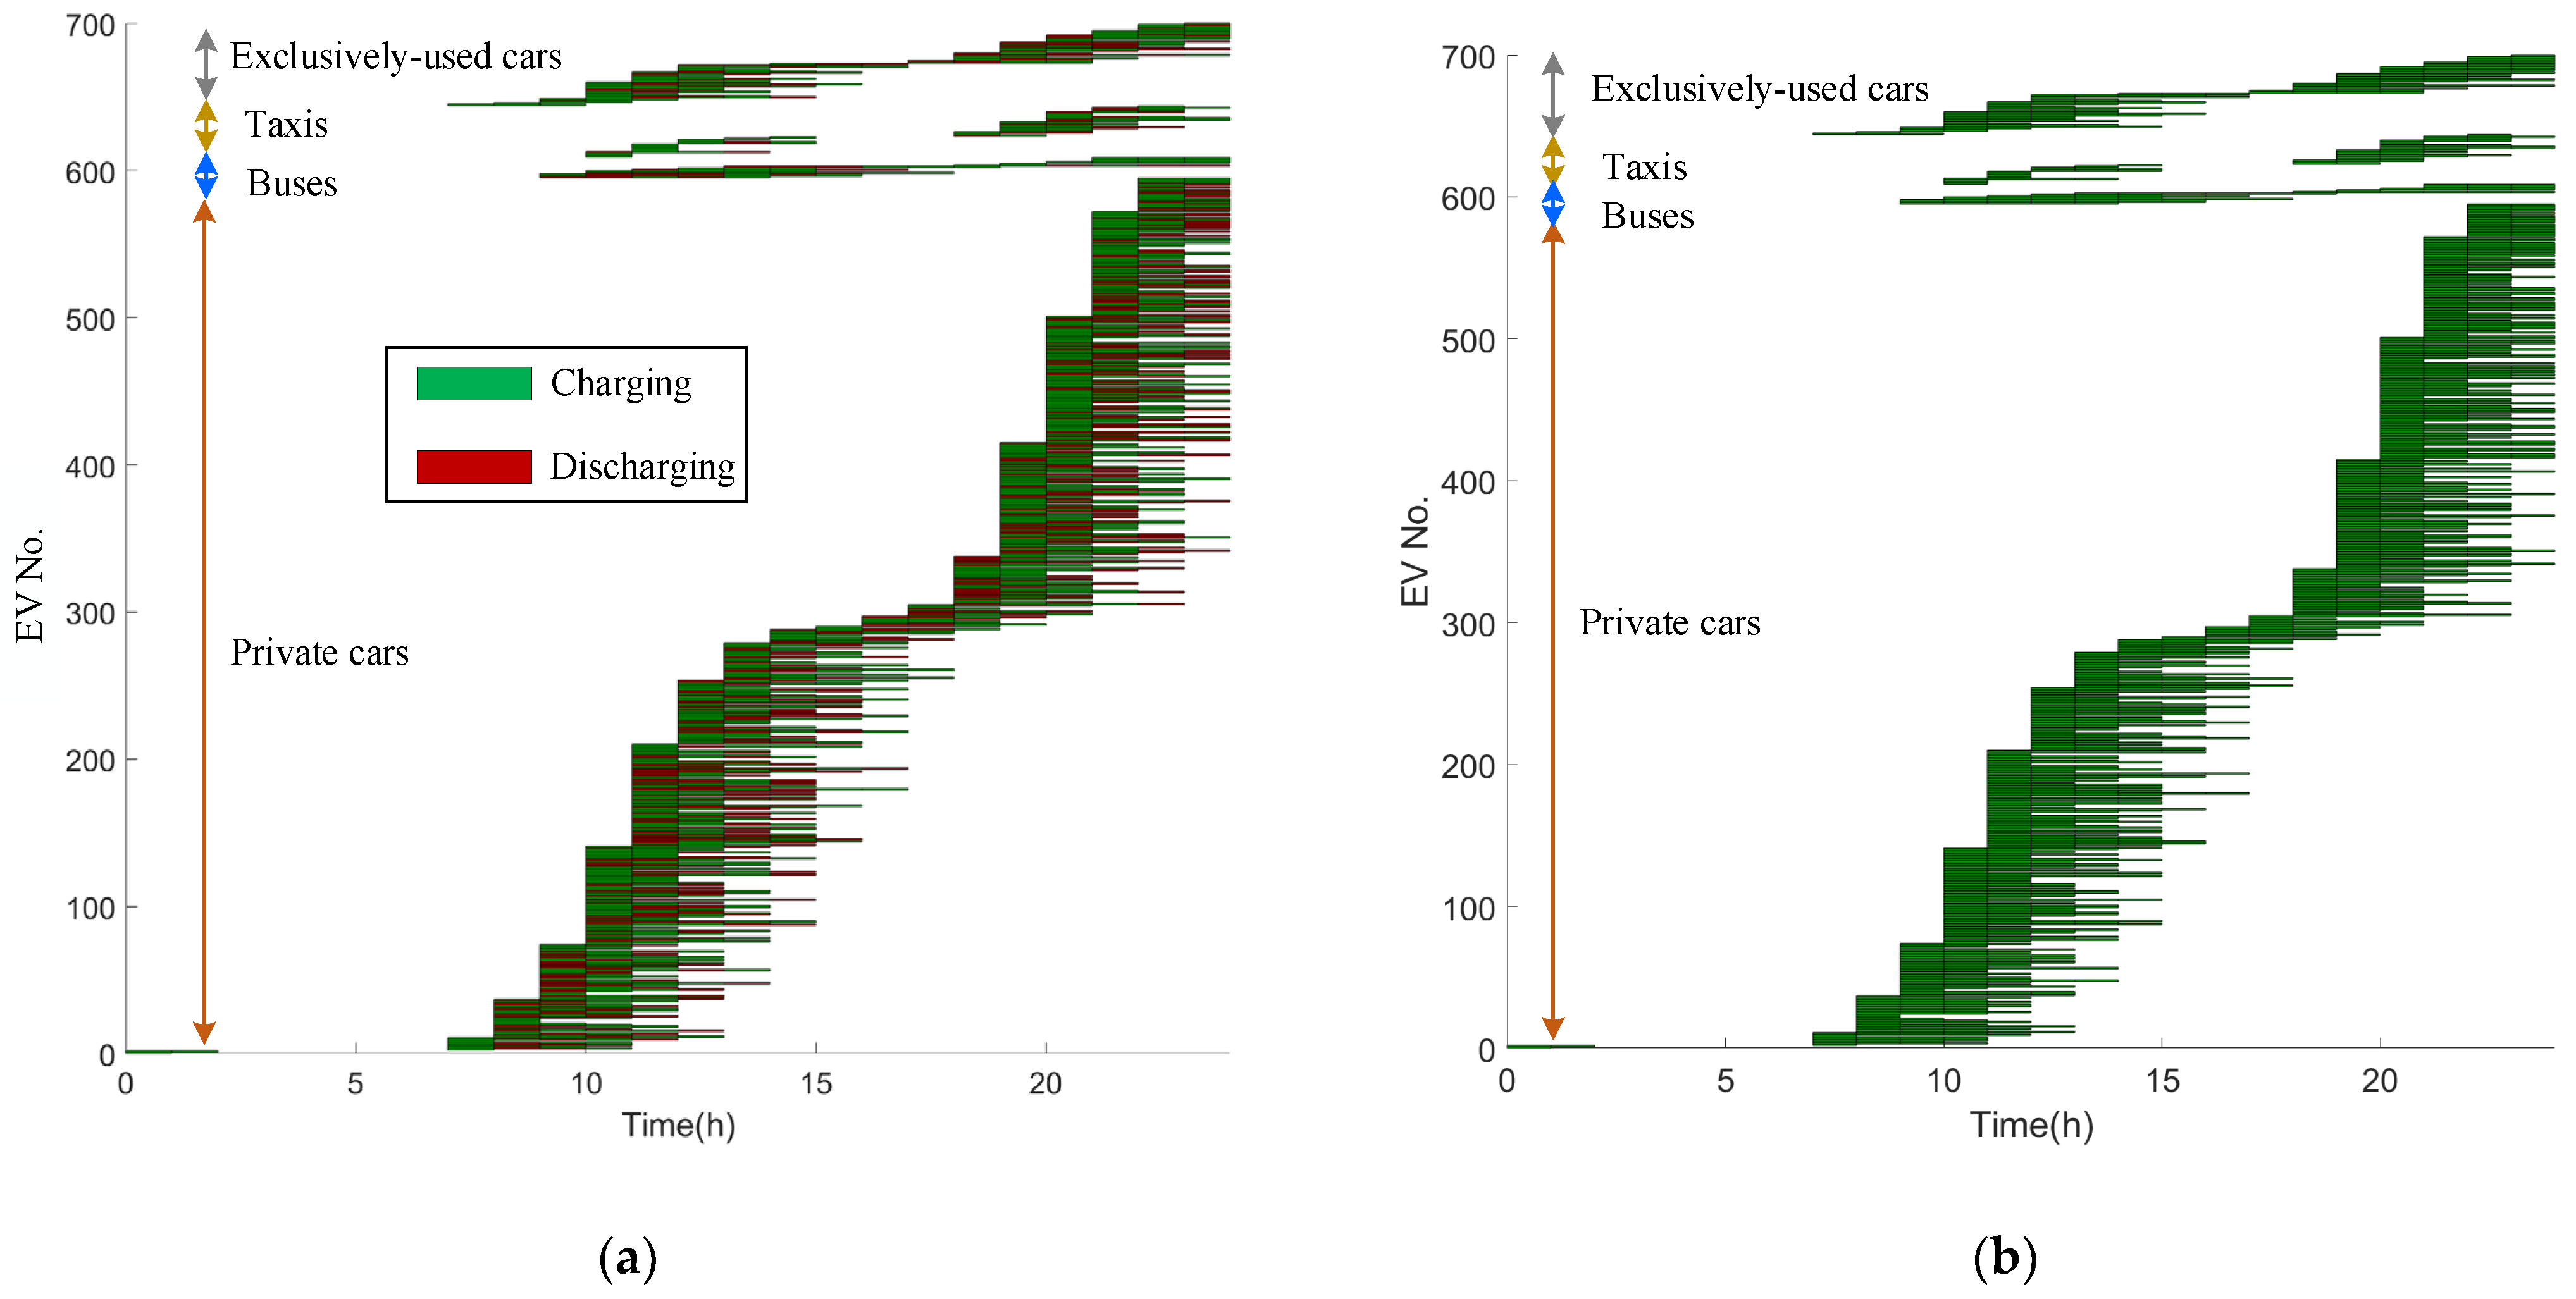
Figure 19.
The scheduled active and reactive powers of EVCSs under the decentralized voltage control: (a) the scheduled active power, P, under the APS-based decentralized voltage control; (b) the scheduled reactive power, Q, under the RPS-based decentralized voltage control.
Figure 19.
The scheduled active and reactive powers of EVCSs under the decentralized voltage control: (a) the scheduled active power, P, under the APS-based decentralized voltage control; (b) the scheduled reactive power, Q, under the RPS-based decentralized voltage control.

Figure 20.
Bus voltages achieved from the decentralized voltage control with the participation of EVs and EVCSs: (a) bus voltages achieved from the APS-based decentralized voltage control; (b) bus voltages achieved from the RPS-based decentralized voltage control.
Figure 20.
Bus voltages achieved from the decentralized voltage control with the participation of EVs and EVCSs: (a) bus voltages achieved from the APS-based decentralized voltage control; (b) bus voltages achieved from the RPS-based decentralized voltage control.
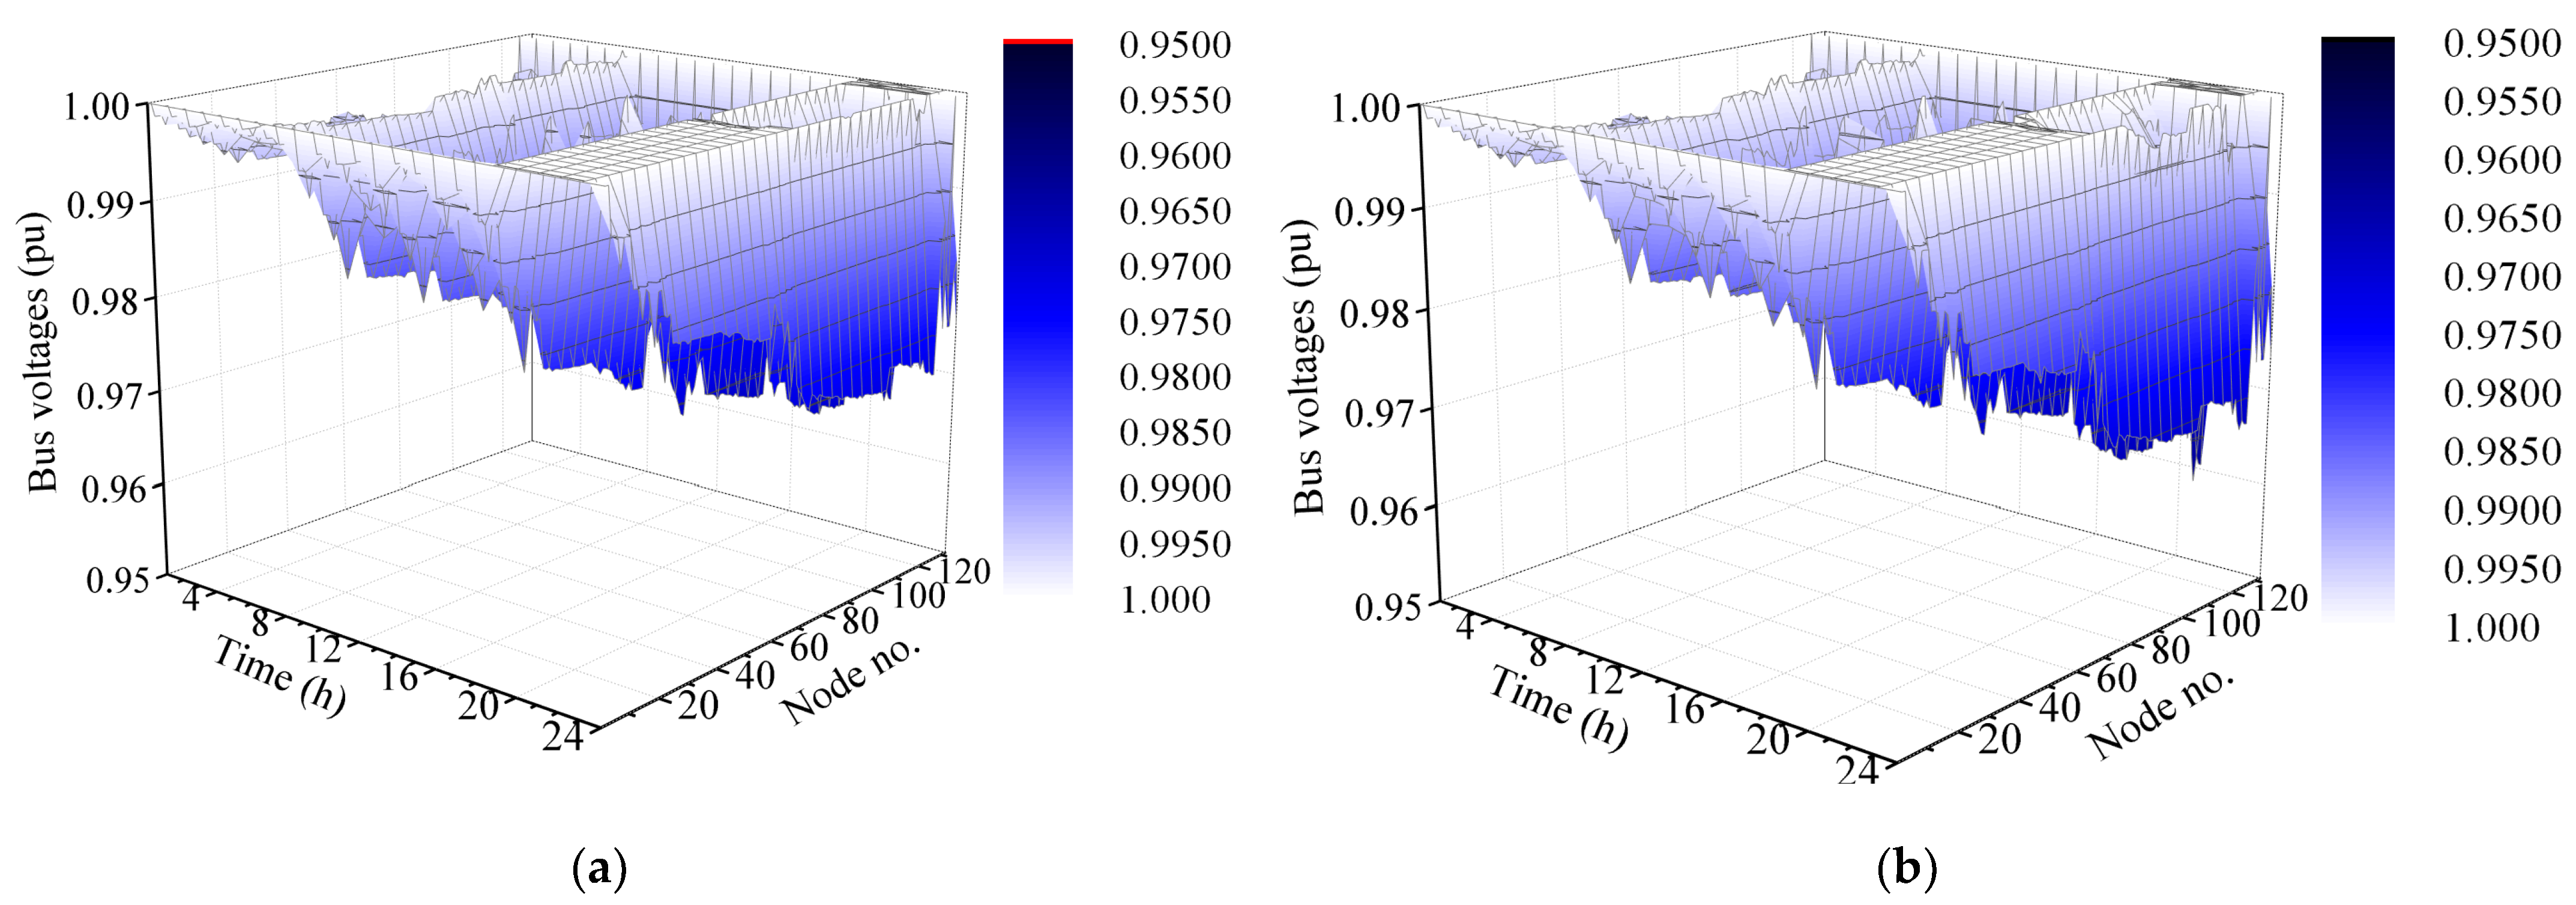
Figure 21.
A comparison of the aggregate EV charging demand between uncontrolled charging and APS-based scheduled charging.
Figure 21.
A comparison of the aggregate EV charging demand between uncontrolled charging and APS-based scheduled charging.

Figure 22.
Comparison of the minimum and average bus voltages under different voltage regulation schemes (‘M1’ refers to the OLTC transformer and SCB-based distribution voltage regulation; ‘M2’ and ‘M3’ refer to the APS-based and RPS-based decentralized voltage control schemes, respectively): (a) the minimum bus voltages under different voltage regulation schemes; (b) the average bus voltages under different voltage regulation schemes.


Table 1.
Attributes of the distribution voltage control strategies in the current literature and the one proposed.
Table 1.
Attributes of the distribution voltage control strategies in the current literature and the one proposed.
| Types of the Voltage Controllers | Advantages | Disadvantages |
|---|---|---|
| Centralized control [13,14,15] | Proven robustness; straight-forward decision-making process; enhanced control capability due to single authority. | Computational expensive for large systems; require extensive investment in communication infrastructures; potential privacy issue due to data transparency. |
| Decentralized control [16,17,18,19] | Work well with a sparse communication infrastructure; good scalability for large-scale distribution networks with complex operation conditions; low computational burdens; preserved privacy of EV users. | Complex decision-making process; may suffer from convergence issues; performance is determined by the structure design of the controller. |
| Proposed decentralized control | Advantages of conventional decentralized control; dynamic partitioning good scalability for large-scale distribution networks with complex operation conditions; low computational burdens; preserved privacy of EV users. | Complex decision-making process; applicable to the radial network topology only. |
Table 2.
Characterization of the unique EV charging patterns of different EV transport types.
| EV Type | Expected Charging Period | Arrival Time Battery SoC | Battery Capacity (kWh) | Rated Power of EVBC (kW) | EV Arrival Time to the EVCS |
|---|---|---|---|---|---|
| EVT1 * | 7:00 a.m.~5:00 p.m. 6:00 p.m.~7:00 a.m. | N(0.69, 0.12) | 35 | 7 | N * (11.3, 3.12) N * (20.9, 1.72) |
| EVT2 * | 11:00 p.m.~5:30 a.m. | N(0.5, 0.12) | 100 | 7 | U * |
| EVT3 * | 4:00 a.m.~7:00 a.m. 4:30 pm~7:00 p.m. | N(0.3, 0.12) | 80 | 30 | N * (5.6, 1.22) N * (17.1, 1.22) |
| EVT4 * | 5:00 p.m.~8:00 a.m. | N(0.48, 0.22) | 50 | 7 | N * (18.3, 3.92) |
* EVTs 1~4 refer to private cars, buses, taxis and exclusively used cars, respectively; N and U stand for normal distribution and uniform distribution, respectively; for N(a, b), a and b refer to the mean value and variance, respectively.
Disclaimer/Publisher’s Note: The statements, opinions and data contained in all publications are solely those of the individual author(s) and contributor(s) and not of MDPI and/or the editor(s). MDPI and/or the editor(s) disclaim responsibility for any injury to people or property resulting from any ideas, methods, instructions or products referred to in the content. |
© 2023 by the authors. Licensee MDPI, Basel, Switzerland. This article is an open access article distributed under the terms and conditions of the Creative Commons Attribution (CC BY) license (https://creativecommons.org/licenses/by/4.0/).
Share and Cite
MDPI and ACS Style
Fang, X.; Li, J.; Yuan, Y.; Yuan, X. Decentralized Control Strategy for Participation of Electric Vehicles in Distribution Voltage Control. Processes 2023, 11, 2552. https://doi.org/10.3390/pr11092552
AMA Style
Fang X, Li J, Yuan Y, Yuan X. Decentralized Control Strategy for Participation of Electric Vehicles in Distribution Voltage Control. Processes. 2023; 11(9):2552. https://doi.org/10.3390/pr11092552
Chicago/Turabian StyleFang, Xin, Juan Li, Yubo Yuan, and Xiaodong Yuan. 2023. "Decentralized Control Strategy for Participation of Electric Vehicles in Distribution Voltage Control" Processes 11, no. 9: 2552. https://doi.org/10.3390/pr11092552
Note that from the first issue of 2016, this journal uses article numbers instead of page numbers. See further details here.