
Evaluating Nationwide Non-Point Source Pollution of Crop Farming and Related Environmental Risk in China
by
Yang Duan
1,2, 
Hongqiang Jiang
1,2,
Xiao Huang
3,
Wenhui Zhu
4,
Jie Zhang
5,*,
Bo Wang
6 and
Wenjun Wu
1,2,* 1
State Environmental Protection Key Laboratory of Environmental Planning and Policy Simulation, Chinese Academy of Environmental Planning, Beijing 100041, China
2
The Center for Beijing-Tianjin-Hebei Regional Environment, Chinese Academy of Environmental Planning, Beijing 100041, China
3
Key Laboratory of Integrated Regulation and Resource Development on Shallow Lake of Ministry of Education, College of Environment, Hehai University, Nanjing 210098, China
4
The Center for Innovation of Zero-waste Society, Chinese Academy of Environmental Planning, Beijing 100041, China
5
College of Information and Electrical Engineering, China Agricultural University, Beijing 100085, China
6
The Ecological Environment Institute, Chinese Academy of Environmental Planning, Beijing 100041, China
*
Authors to whom correspondence should be addressed.
Processes 2023, 11(8), 2377; https://doi.org/10.3390/pr11082377
Submission received: 5 July 2023
/
Revised: 2 August 2023
/
Accepted: 5 August 2023
/
Published: 7 August 2023
(This article belongs to the Special Issue Advances in New Methods of Wastewater Treatment and Management)
Abstract
:The increase in non-point source (NPS) pollution from agricultural cultivation and production sources has been cited as one of the main reasons for water eutrophication. This study built a national NPS database and estimated the nutrient (including both nitrogen (N) and phosphorus (P)) balance and NPS pollution of crop farming at the county level in 2015. Finally, the NPS pollution risks were assessed, and relative policy suggestions were provided. The results indicated that (1) in 2015, the total amounts of N and P surpluses in China were 7.95 and 7.39 million tons, respectively. The south of the Yangtze River had a relatively higher nutrient surplus compared to that in northern China. (2) The NPS emissions for N and P in China were 168.84 × 10⁴ tons and 8.93 × 10⁴ tons, respectively, with the highest NPS loads occurring in the eastern part of the Sichuan Basin, southern China and southwestern China, while the lowest loads occurred in northeast China. (3) The potential risk assessment results showed that a broad division emerged at the Yangtze River basin, with the northern area under lower risk than the southern area. This estimation work can provide guidance and technical support for local government and policy makers to control NPS pollution.
1. Introduction
Non-point source (NPS) pollution has emerged as a significant environmental concern leading to water quality degradation and environmental alterations [1,2,3]. The eutrophication episodes in the North American Great Lakes during the 1970s and 1980s triggered extensive investigations and raised substantial attention toward controlling NPS pollution not only in the United States but also worldwide [4]. As the world’s most populous country and one of the rapidly growing major economies [5], China currently follows the Environmental Kuznets Curve, indicating that environmental quality tends to deteriorate with increasing income levels [6,7,8,9]. Given China’s current limited technological efficiency, relying solely on technological advancements and sophisticated environmental protection measures to enhance productivity and mitigate environmental pollution poses challenges. Consequently, the focus has shifted to increasing output through economies of scale, leading to amplified pollution levels. In the pursuit of high crop yields, China has become the world’s largest consumer of chemical fertilizers since 1989 [10], with fertilizer consumption increasing sevenfold from 1978 to 2016 [11]. However, grain yield only doubled during the same period, with utilization rates lagging behind those of developed countries [12,13]. The excessive use and low efficiency of nitrogen (N) and phosphorus (P) fertilizers have posed threats to water quality through anthropogenic contamination, and it has been widely acknowledged that NPS plays a pivotal role in China’s water quality issues [14,15]. The first national survey of pollution sources in China indicated that agriculture is responsible for 57.2% and 67.4% of the total N and total P discharged into the environment, respectively. Considering the vital role of nutrient balance as the basis for comprehensive NPS assessments at the national level, it becomes crucial to evaluate the NPS risks in China, particularly at the regional level for local governments.
The calculation models for non-point source (NPS) pollution can be broadly categorized into empirical models and physical models [16]. Physical models, such as the Soil and Water Assessment Tool (SWAT), operate on process-based principles but require extensive input data, detailed parameters, and complex calculations [17]. In contrast, empirical models, such as the “estimating non-point source pollutant loads in a large-scale basin” (ENPS-LSB) model employed in this study, integrate factors influencing pollution processes and serve as effective tools for NPS risk assessments and water resource management [18]. The ENPS-LSB model strikes a balance between simplicity and detailed computation, catering to the precision of current data acquisition in China. Its flexibility in spatial–temporal scale makes it a valuable aid for government decisions aimed at reducing NPS pollution [19,20]. Research on NPS pollution in China initiated in the 1980s with investigations focusing on severely polluted lakes such as Taidu Lake [21,22] and Dianchi Lake [23,24]. In the 2010s, numerous studies have concentrated on nutrient emissions and NPS pollution from agricultural activities in China [25,26,27]. Meanwhile, enhancing nutrient use efficiency through socioeconomic policies, technologies, and other measures has become a central concern for addressing NPS issues in China [10,28,29]. However, most studies have relied on fixed emission factors to calculate efficiency, which were determined from limited field plot data [30]. To achieve accuracy, actual data encompassing diverse climate conditions, terrains, crop types, fertilizer applications, and other relevant factors should be taken into account.
In this study, a national NPS source database and the N and P balance model were developed on a macro county level in China in 2015. The specific objectives of this study were (1) to provide a comprehensive and updatable nutrient database for 2464 counties in China in 2015; (2) to calculate the NPS loads in 2015 on a county scale by using the nutrient balance database and spatial data based on the ENPS-LSB model; (3) to analyze the spatial and temporal distribution of NPS emissions; and (4) to assess the potential NPS risk of water quality degradation because of NPS pollution.
2. Materials and Methods
2.1. Model Description
The ENPS-LSB model is a binary structure model that considers both natural factors such as topography, weather elements, and vegetation cover, as well as socio-economic factors including population size, livestock, and poultry breeding, and fertilizer usage. The model comprises nutrient balance accounting, dissolved NPS pollution accounting, and adsorbed NPS pollution accounting modules. The entire model utilizes GIS technology for spatial calculations, with a modeling unit resolution of 1 km × 1 km. Parameters are assigned based on land use types and soil properties in each grid [31].
2.1.1. Nutrient Input/Output and Balance
The source intensity Q, which represents the agricultural nutrient balance, is calculated with a method that focuses on building a soil system budget [32]. The nutrient balance is defined as the difference between nutrient input and output. If the nutrient balance < 0, the external input nutrient is less than the output; thus, the amount of loss is from the soil and vice versa. N inputs include chemical fertilizers, organic fertilizers (including manure, straw incorporation, and cake fertilizers), atmospheric deposition, biological N fixation (containing symbiotic and non-symbiotic nitrogen fixation), seed, and irrigation water. The N outputs include crop uptake, denitrification, ammonia volatilization, volatilization, leaching, and runoff. The input/output items for P are lacking due to the biological nitrogen fixation, gaseous nitrogen, and dry deposition. The details are summarized in Figure 1. More details about the estimated equations are provided in Sections S2 and S3 in the Supplementary Materials.
2.1.2. NPS Pollutant Loads
(1) Dissolved NPS. NPS pollutant generation and transportation are further influenced by natural factors and socioeconomic factors. Natural factors include the slope, land cover, topography, vegetation coverage, and rainfall intensity. Socioeconomic factors are composed of rural and agricultural data such as the sowing area and the yield of the crop, livestock inventory, the rate of fertilizer application (pure discount), and the rural population [33]. Thus, the dissolved NPS pollutant load can be calculated as follows [19,34].
where Ldnps is the load of the NPS pollutant per unit area (tons/km2) for agricultural pollution; k stands for the calculation step, and the values are 10-day periods; i is the type of non-point pollution (1 for total nitrogen (TN), 2 for total phosphorus (TP)); ρ is the coefficient of waste, which reflects the yield of the pollutants and has a close relationship between precipitation and runoff; is the source intensity which calculates in the Section 2.1.1; nf represents the natural correction factor, which is in connection with the slope, vegetation coverage, and soil texture [35].
Previous studies indicate that the non-point pollutant satisfies the first-order kinetic equation on an impervious hard surface under the condition of storm runoff.
where Q is the source intensity (tons/km2); k is the surface washout coefficient, with a value of 0.18 mm−1 in this paper [20]; r is the rainfall intensity (mm/h); t is the rainfall duration (h), so r × t represents the rainfall in a certain period. The period is variable and is decided by the monitoring rainfall frequency. Thus, the final value is 10 days considering the accuracy and computation; ε is the surface runoff coefficient, ε0 is the standard surface runoff coefficient with a default value of 0.86 [23].
(2) Adsorbed NPS. The amounts of adsorbed N and P are based on soil erosion and are determined with the following equation:
where Lanps is the adsorbed NPS pollutant load per unit area (tons/km2), A is the soil erosion amount of the study area (t∙km−2∙yr−1), which is calculated based on the universal soil loss equation (USLE); Qa is the concentration of N and P in the soil (mg∙kg−1); Er is the N and P enrichment coefficient. The specific calculation method of each parameter in the formula is in Section S1 in the Supplementary Materials.
2.2. Potential Pollution Risk Assessment
To assess pollution accurately and help the local government make relevant decisions about reducing NPS pollution, a multi-tiered risk-based assessment associated with soil NPS pollution was conducted to indicate the high-risk area at the national scale. Five indices that could affect the transportation of NPS pollutants, including the slope, annual erosive precipitation, the number of days of erosive rain, distance to stream, and source intensity for pollutants, were considered in this method on the basis of the studied predecessors [35,36]. The calculation of the catchment NPS risk index is as follows:
where L is the factor rating, which is denoted by SL for the slope, EP is for the annual erosive precipitation, DEP is for the days of erosive rain, DS is for the distance to a stream, and SI is for the Q for pollutants. W is the weighting factor that varies according to previous studies (see Table S2 in Supplementary Materials).
2.3. Data Sources
For our study, the input data used complied with two categories: statistical data and spatial data at the county level in 2015. The statistical data were obtained from the China Agricultural Yearbook, China Rural Statistical Yearbook, and provincial and municipal statistical yearbooks in 2015, and the spatial data were obtained from various public sources. For detailed data sources and data pre-processing, refer to Section S4 in the Supplementary Materials.
3. Results
3.1. Nutrient Balance
3.1.1. Input and Output
In 2015, the total amount of nutrient input in agricultural fields in China was 46.4 million tons for N and 19.2 million tons for P, while the output amount for N and P was 38.5 million tons and 11.8 million tons, respectively. Thus, the total amounts for the N and P balance are 7.95 and 7.39 million tons, respectively. The compositions of the nutrient input and output are shown in Figure 2, while the largest source of nutrient input was chemical fertilizer (accounting for 63.10% of N and 90.60% of P), which could be explained by the fact that fertilizer application in China increased significantly by 66.95% in compound fertilizer and 13.46% in phosphatic fertilizer from 2005 to 2015 [37]. Although organic fertilizer had become the second-largest nutrient input source (9.96 million tons in N and 1.70 million tons in P), there was still a gap compared with that in developed countries, especially in the proportion of organic fertilizer use. The main source of the nutrient output was crop uptake in China, with amounts of 29.3 million tons in N and 17.4 million tons in P, respectively. Numbered lists can be added as follows:
3.1.2. Nutrient Balance
The N/P balance in agroecosystems is calculated at different levels, including the provincial, prefecture, and county levels. According to our results, there was an average surplus of 5.32 t/km2 in N and 4.95 t/km2 in P for China in 2015 (Figure 3a,b). There are 1467 counties that showed a N surplus, which accounted for 68.11% of the total computational area and had an average rate of 11.21 t/km2. A total of 31.89% of the counties had N deficits with an average rate of −5.58 t/km2, and these counties were mainly distributed in northeast China because the so-called “black soil” in this area is much more fertile than soil in other areas and therefore the amount of chemical fertilizer input was less than that in other areas. The results indicated that the eastern and southern regions in China had larger nutrient surpluses than the northern and western regions. The provincial nutrient balance results indicated that only two provinces (Heilongjiang (−3.50 t/km2 in TN) and Inner Mongolia (−0.07 t/km2 in TN)) had N deficits, and all provinces had a positive P balance rate. The N balance rate was highest in Guangdong and lowest in Heilongjiang, with values of 19.32 t/km2 and −3.50 t/km2, while the P balance rate was highest in Henan and lowest in Heilongjiang, with values of 15.97 t/km2 and 0.68 t/km2, respectively. Overused and misused anthropogenic N/P had a serious negative influence on ecological environmental sustainability. In this study, based on the amount of N surplus per unit area, 8 provinces were higher than 10 t/km2 in N, and 13 provinces were higher than 5 t/km2 in P, which was considered to be high surplus by previous studies [38].
3.2. Spatial and Temporal Distribution of Non-Point Pollution
The spatial distribution of NPS showed that the total dissolved TN production in China was 164.55 × 10⁴ tons, with an average load of 0.926 t/km2 in 2015. The total amount of TP production and average load were 7.93 × 10⁴ tons and 0.0443 t/km2, respectively (Figure 4a,b). The following characteristics can be categorized as follows from the spatial distribution of the pollutants. First, the lowest load occurred in northeast China, especially in Heilongjiang and Inner Mongolia, mainly due to the fertile soil in these areas, which is rich in nutrients. This type of situation led to the input of TN being smaller than the output, and it was assumed that the value of Q in Equation (2) was 0 when the source intensity was less than 0. Second, as a major agricultural region in China, the provinces in the North China Plain had very high chemical fertilizer application. The surplus of TN in Henan, Hebei and Shandong provinces ranked 2nd, 6th, and 7th in China. However, this area is in the continental semi-moist climate zone in north China, which is dry and experiences rainfall of 400–600 mm per year. The limited rainfall had a direct contribution to the reduction in runoff, and the runoff depth in Hebei Province (27.12 mm) was 10% of the average amount in China in 2015. Therefore, the contaminants could not migrate with runoff, and most of the nutrients remained in the soil instead of flowing into water with runoff and leaching. The highest value occurred in the eastern port of the Sichuan Basin (the Three Gorges Reservoir area and upstream), southern China, and southwestern China. These areas are major agricultural bases for grain in China with a comparatively high standard of agricultural production levels (resulting in the production of more pollutants per capita) and abundant precipitation (two times the national average) due to the subtropical monsoon climate, causing these areas to generate more pollutant loads than other regions. Meanwhile, the runoff depth in southern China (675.8 mm) was 2.8 times greater than the average value in China (284.1 mm). Six of those provinces in south China and southwest China were in the top 10 for TN surplus, with an average application rate of fertilizer of 238 kg/ha for N, while the value was only 150 kg/ha for other regions in China. Based on the results of the dissolved pollutant models, we concluded that the average load decreased from south to north, and precipitation and intensity sources were the principal factors affecting the production of dissolved pollutants in farmland.
Based on the results of the dissolved pollutant production in 10 first-class water resource regions in China, the production of TN and TP in the Yangtze River Basin accounted for 46.03% and 41.85% of the total production in China. Although the farmland in the Yangtze River made up only 27.3% of all China’s cultivated land, it consumed nearly 40% of the chemical fertilizer and provided 40% of the agricultural output for China. Therefore, sufficient rainfall and an abundant input of N and P offer good conditions for the pollutants production. The Pearl River Basin occupied 19.71% and 15.09% of the TN and TP production, respectively, followed by Southwestern Rivers and Southeastern Rivers. The four regions accounted for 82.33% of the total production of TN and 70.81% of the total production of TP. The rest of the six first-class regions in northern China accounted for only 17.67% and 29.18% of the TN and TP production in China due to the limited agricultural activities and relatively sparse river systems in these regions.
The temporal distribution of dissolved NPS pollution showed that there was a significant correlation with the timing and intensity of precipitation, with a determination coefficient (R2) of 0.744 for TN and 0.856 for TP (see Supplementary Materials Figure S5). The loads of dissolved pollutants were much more obvious in the wet season (from April to September) than in other periods. Seventy-three percent of the pollutant production for TN was produced during this period mainly because of the abundant rainfall in the wet season, which normally reached 75% of the annual rainfall. The rainfall and runoff, especially the intense rainstorms, had obvious effects of flushing and resulted in the transport of pollutants into the water from the farmland. The annual distribution of dissolved TP was relatively evenly distributed, with 60% of the total production during the wet season.
The amounts of yearly adsorbed N and P loads in 2015 were 3.29 × 10⁴ tons and 1.0 × 10⁴ tons, respectively, making up just 2% and 12.6% of the dissolved NPS pollution. The results demonstrated that the Three Gorges Reservoir and upstream areas and the midstream of the Yellow River had high adsorbed NPS loads, which were closely related to soil erosion in these areas.
3.3. Potential Pollution Risk of NPS
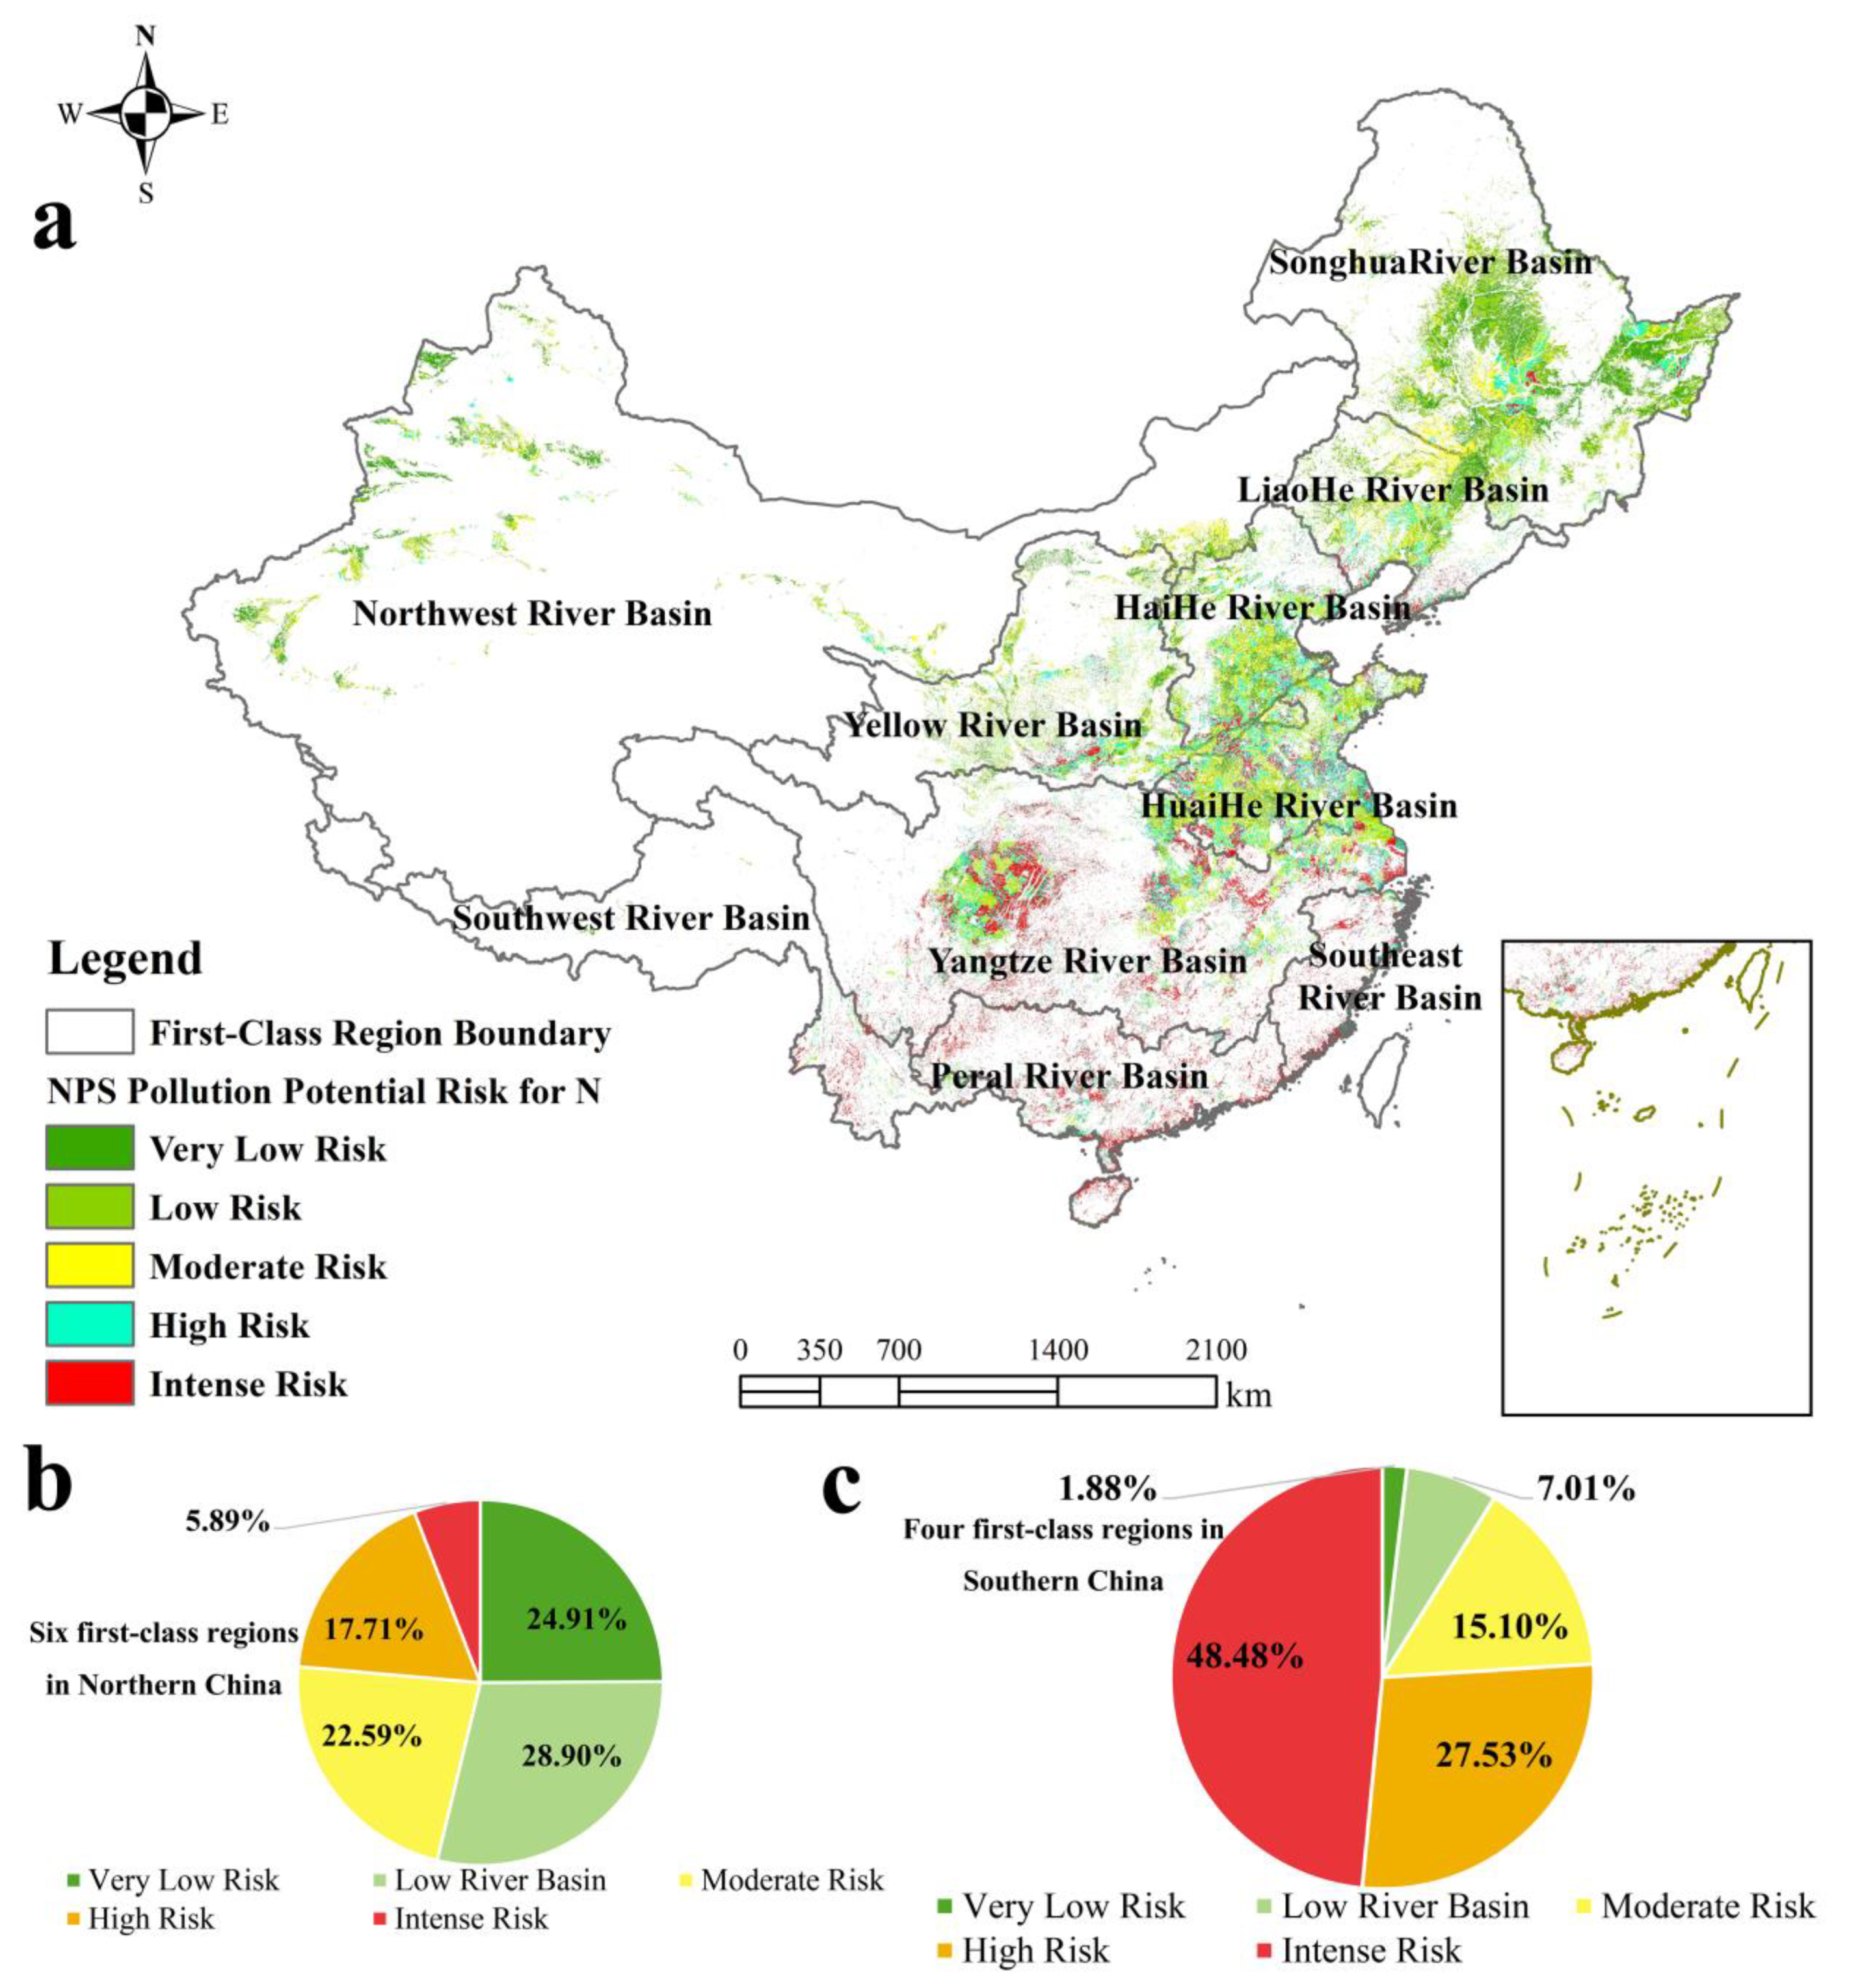
The risk for N and P pollution in China is shown in Figure 5 and Figure S6. The results demonstrated that 37.80% of the farmland is at serious risk (including intense risk and high risk) for NPS-N pollution, while the percentage for NPS-P is 40.70%. The intense-risk areas were mainly located in southern China, such as the Pearl River Delta, and southwest China, due to the steep slope and close proximity of water bodies. The high- and moderate-risk areas were located in the middle-lower Yangtze Plain, Huaihe River Basin, and south of the North China Plain, and the low-risk areas were mainly located in northeast and northwest China because of its limited rain and low source intensity. There was a sharp contrast in the spatial distribution between northern and southern China. The proportion of intense-risk areas that occurred in the six first-class regions in northern China (Songhua River Basin, LiaoHe River Basin, Haihe River Basin, Yellow River Basin, Northwest River Basin, and HuaiHe River Basin) was only 5.88% for N and 10.59% for P, while the two results were 48.48% and 41.49% in the four first-class regions in southern China (Yangtze River Basin, Pearl River Basin, Southwest River Basin, and Southeast River Basin). The percentages of very low- and low-risk areas were 53.81% in N and 52.52% in P in northern China, while the two results were 8.88% and 12.59% in southern China. The largest area of intense risk occurred in the Yangtze River Basin, with areas of 10.91 × 10⁴ km2 for N and 9.63 × 10⁴ km2 for P, and the largest area of very low and low risk occurred in the Songhua River Basin, with 31.50 × 10⁴ km2 for N and 31.33 × 10⁴ km2 for P.
The variation in potential pollution risk of NPS in China, with higher risk in the southern regions and lower risk in the northern regions, can be attributed to three main factors. Firstly, the density of river networks is higher in the southern regions, with intricate branches and abundant river discharge, particularly prominent in the middle and lower reaches of the Yangtze River. The river network density in the Yangtze River basin is approximately 0.227 km·km−2, whereas it is only 0.105 km·km−2 in the five northern regions. The dense river network leads to shorter distances between farmland and waterways, making nutrient loss into the rivers more likely due to rainfall or irrigation, resulting in pollution. Secondly, the southern regions receive higher precipitation, especially erosive precipitation, which is significantly greater than in the northern regions. Taking the Yangtze River basin as an example, the average erosive precipitation reached 928 mm in 2015, which is 6.53 times higher than in the northern regions. The greater erosive precipitation increases the likelihood of nutrient loss from soil due to erosion and runoff. Thirdly, the topography is a contributing factor, as the southern regions, particularly the southwestern regions, have steeper slopes, which generally facilitate the loss of nutrients through runoff. In contrast, the northern regions, especially the northeastern and northwestern plains, have relatively flat terrains, resulting in relatively lower risk levels.
4. Discussion
4.1. Uncertainty Analysis of the Results
This study first provided a county-scale assessment of the agricultural nutrient balance in China (see Section 3.1). Many studies have been conducted to quantify China’s agricultural nutrient flows [14,25,26,39]. Here, we compared the output with some previous research (see Table S15 in the Supplementary Materials). The comparison shows that, in terms of total nitrogen balance in farmland, the overall input was approximately 45.8–54.7 Tg, while our study’s result was 46.4 Tg; the overall output was about 38.0–41.7 Tg, and our study’s result was 38.4 Tg. Farmland nitrogen exhibited a surplus state, consistent with our findings. However, some individual source-sink items showed differences in results, mainly related to parameter settings and other factors. For example, the nutrient excretion coefficients for livestock in He et al. [26] were much larger than those used in this study and the recommendation coefficients in the Livestock and Poultry Excretion Coefficient Manual from the first national pollution census. The rate of excretion to the field in He et al. was excessive, with an amount of 65% for pigs. Regarding spatial distribution, He et al. [26] revealed that the nitrogen input and output levels in north China and the middle and lower reaches of the Yangtze River were higher than the national average due to more intensive cropping systems, resulting in higher residual nitrogen in the soil and a larger cultivated land area compared to other regions. The lowest input level occurred in the northeast [40], which is consistent with the spatial distribution pattern found in our study.
From the perspective of NPS emissions, our research findings are in close agreement with other relevant studies. For example, Hao et al. conducted a large-scale model to calculate the loads of NPS pollutants with a total amount of 173.3 Tg TN in China [34]. Wang et al. estimated the NPS pollutants in the Yangtze River Basin with a value of 87.5 Tg TN using the ENPS-LSB model [19]; Xu et al. estimated the nutrient pollution process in the Pearl River Basin using the system dynamic model with a total TN input of 30 Tg from agriculture [41]. Therefore, compared with previous studies, the nutrient budget and NPS pollutant load provided a reasonable summary of the current status in China.
There are many uncertainties in the calculation that come mainly from the following aspects: (1) impact of livestock production, (2) the integrity and accuracy of the data, and (3) the spatial differences in parameters. First, different from other related published studies about nutrient pollution [42,43], the research object of this study is set to crop farming rather than the entire agricultural ecosystem, ignoring the N and P losses from animal production such as animal manure that directly discharges to waterbodies and NH3, N2O loss to the air. Industrial and highly intensive animal production systems allows animal manure to be collected as usual and discharged to surface water without treatment [44]. Manure discharges should be considered in future models. Second, as the data used in the calculation model were acquired from the related statistical yearbooks, the main source of error was the statistical error in the process of data collection, collation, publication, etc. Because numerous parameters were required in the modelling process, it was difficult to collect all relevant data in every county. We supplemented the missing data with data from other relevant yearbooks or the data in adjacent years. Third, unapparent spatial distribution differences in parameters could result in uncertainties. Due to the difficulty in measuring every county in China, most parameters were considered common in the same province, even though some parameters were shared by several provinces. In addition, the uncertainty in this study is also related to the factors of the pollution risk assessment. Due to problems in the acquisition of relevant data, retentions of nutrients in water systems (e.g., sedimentation of phosphorus in reservoirs, rivers, streams, denitrification from rivers, streams) was not considered.
4.2. Severe Challenge for NPS Prevention
As the most populous country in the world, food security has always been one of the most important issues of concern to the Chinese government. The Central Committee of the Communist Party of China issued the No. 1 central document with the theme of “agriculture, rural areas and farmers” for 16 consecutive years from 2004 to 2019. Considering China’s future urbanization development trends and agricultural demands, we predict that China’s NPS pollution situation will be aggravated in the future.
First, China is currently undergoing rapid urbanization, with the urbanization level increasing from 26.41% to 60.63% from 1990 to 2019 [45,46], and it has reached the world’s average level [45,47]. The level of per capita food consumption required by the urban population is greater than that of the rural population, which increases the rigid demand for grain production in China. However, in recent years, the area of cultivated land in China has shown a decreasing trend due to factors such as the conversion of farmland to forests, occupation of construction land, and abandonment of man-made farmland caused by rural labor loss [48,49,50,51]. Under the dual pressure of increased food demand and reduced arable land area, increasing the grain yield per unit area is an inevitable choice. Fertilizer application is the most effective and important means for increasing production, and agricultural production is highly dependent on fertilizer application in China [52]. As a result, more fertilizer would be used to meet the demand.
Second, another result brought by the rapid development of urbanization is a fundamental change in the diet structure of the Chinese, which is mainly reflected in the substantial increase in the demands for meat, eggs, and milk. The consumption of livestock products (meat, poultry, and eggs) increased from 26.37 kg per person in 1990 to 48.2 kg per person in 2018, which would cause more nutrient inputs when nutrients flow into secondary producers (livestock) than first primary producers [53]. Chen et al. indicated that in 2013, the corn production of China was 206 Mt, with 74% of the corn fed to livestock (with 5 Mt imported corn) [54]. According to the population prediction from the United Nations [55], the population in China is expected to increase in the near future. The demand for corn in China is expected to be 315 Mt in 2030, by which time the population is considered to be stabilized [54].
Third, over-fertilizing in China also has a negative impact on NPS pollution treatments. China has become the largest user of chemical fertilizers in the world since 1989, and fertilizer consumption increased nearly sevenfold from 1978 to 2016, while the grain yield increased only 2 times over the same period [11], which indicates that fertilizer utilization efficiency has gradually decreased. Excessive fertilization may decrease soil fertility, cause crop lodging and pests, and lead to serious environmental pollution.
4.3. Management Implications
Precision fertilization: In order to solve the problem of diffusing water pollution from agriculture in China, controlling chemical fertilizer application is an inevitable choice [56]. According to the results of previous research, the methods for improving fertilizer utilization efficiency are as follows: 1. Fertilizing accurately with an optimized N/P application rate. Zhu indicated that the maximum yield is usually higher than the yield of the maximum economic efficiency [57], and much research has shown that fertilizer application could be reduced with minimal or zero impact on crop yields [30,56]. Therefore, it is crucial to guide farmers to improve fertilizer application efficiency through the professional guidance of agricultural science and technology personnel. There is good news that the Ministry of Agriculture has issued the “Action Plan for the Zero Increase of Fertilizer Use” to stop the increase in fertilizer use by 2020 without reducing food production. 2. Deep placement and matching of the nutrient application time with crop demands. The fertilizer should be deeply placed rather than broadcast over the surface, which could greatly reduce the amount of N loss through ammonia volatilization [57], and crops should be fertilized while optimizing the application rate for different growth stages to satisfy the nutrient demands, which could reduce the N losses significantly [52]. Moreover, removing the subsidies for fertilizer producers using advanced farmland management, such as “integrated soil-crop system management” [28,54], could also effectively reduce the amount of fertilizer applied while ensuring the yield.
Developing organic waste recycling: Straw to soil is a means to immobilize N as organic N in microorganisms and their remains, which is a favorable option in terms of physical and biological nutrient storage mechanisms. Straw contains rich nutrient resources, such as N and P, with contents ranging from 0.25 to 2.50% for N and 0.08 to 0.28% for P. China has abundant straw resources with a production of 737.07 Mt in 2015 calculated in this paper. However, only a small amount (14.78%) of straw resources are directly returned to the field, which is far less than the amount of 70% in developed countries such as Europe and the United States [58]. The nutrient budget indicated that the input of N/P from straw accounted for only 5.26% and 1.76% of the total nutrient input. If the percentage of straw returning to the field for both N and P reaches 70% in the future, the N and P inputs can be decreased by nearly 2.4 Mt N and 0.19 Mt P, respectively, assuming other conditions remain stable.
As another large part of organic nutrient inputs, manure contains insoluble N and acts as a slow-release fertilizer. The recycling of manure is not only environmentally beneficial but also economically profitable. China is the largest livestock production and largest user of fertilizer in the world. However, only 1/3 of the excreted masses can be recycled to cropland [15], while the percentage is much lower than that in developed regions such as the United States (74%) and European Union (81%) [59]. Bai et al. indicated that more fertilizer could be saved if manure nutrients are applied to cereal crops to replace NP fertilizer with NP from manure [60]. The government should formulate relevant policies to encourage enterprises to produce organic fertilizer and redirect the substantial subsidies from the fertilizer industry towards manure storage infrastructure.
5. Conclusions
This study establishes a comprehensive accounting framework for crop farming non-point source (NPS) pollution based on the ENPS-LSB model. Utilizing this framework, we conducted an accounting of NPS pollution in China’s cropland for the year 2015, followed by a regional assessment of pollution risk potential. The risk-oriented accounting of agricultural NPS pollution integrates information from both natural ecosystems and socio-economic systems, providing scientific support for the spatial management of NPS pollution.
(1) In 2015, China’s cropland showed an overall surplus of nitrogen and phosphorus nutrients. The total amounts for nitrogen (N) and phosphorus (P) balance were 7.95 and 7.39 million tons, respectively. Regarding the sources, chemical fertilizer accounted for the largest input of nutrients, contributing to 63.10% of N and 90.60% of P, while crop uptake was the major nutrient output. As for spatial distribution, the spatial distribution of the nutrient balance showed that the N balance had an average value of 5.32 t/km2, while that for P was 4.95 t/km2, and the eastern and southern regions in China had larger nutrient surpluses than the northern and western regions.
(2) The dissolved NPS pollutant loads were 164.55 × 10⁴ tons for N and 7.93 × 10⁴ tons for P in 2015. As for spatial distribution, the average load decreased from south to north, and precipitation and intensity sources were the principal factors affecting the production of dissolved pollutants in farmland.
(3) The spatial distribution of the risk showed that intense-risk areas were mainly in the south of the Yangtze River, and the low-risk areas were mainly distributed in northeast China. The variation in potential pollution risk of NPS in China, with higher risk in the southern regions and lower risk in the northern regions, can be summarized into three factors: river network density, precipitation, and topography.
We would like to point out that our research still has room for further development. Firstly, in terms of time scale, we only accounted for data from the typical year of 2015. Conducting continuous assessments to ensure data continuity would enable a more comprehensive and systematic reflection of the changing characteristics and trends of NPS pollution in China’s cropland in recent years. Secondly, future research will focus on advancing from the current accounting results to a deeper level. This includes identifying several natural geographical and socio-economic factors to analyze the driving forces and mechanisms influencing NPS pollution in China’s cropland. Additionally, scenario forecasting for NPS pollution in cropland can be conducted to address changes in land use and management methods in the future.
Supplementary Materials
The following supporting information can be downloaded at: https://www.mdpi.com/article/10.3390/pr11082377/s1. The supporting information provides detailed information about the methodology for the calculation of dissolved and adsorbed NPS pollutant components, methodology for the calculation of input/output in the N/P balance model, and other related information. Refs [3,19,25,26,32,39,40,61,62,63,64,65,66,67,68,69,70] are cited in Supplementary Materials.
Author Contributions
W.W. and J.Z. designed the study. Y.D. and X.H. conducted the calculations. Y.D., H.J., X.H. conducted the analysis. B.W. and W.Z. drew the figures. Y.D., H.J., W.W. and J.Z. wrote the paper. All authors provided critical input to the analyses and to the final version of the manuscript. Y.D. and H.J. contributed equally to this work. All authors have read and agreed to the published version of the manuscript.
Funding
This research was funded by the National Budget Project (Grant No. 2110105) and Fund Project for Distinguished Young Scholars “Research on Technical System of Ecological Environment Planning” (40050720), National Natural Science Foundation of China (Grant No. 91846301), Chongqing Ecological Environment Bureau Research Project (No. 2023-001).
Data Availability Statement
Not applicable.
Acknowledgments
We thank the editors and anonymous reviewers for their valuable comments and suggestions on our paper.
Conflicts of Interest
The authors declare that they have no known competing financial interests or personal relationships that could have appeared to influence the work reported in this paper.
References
- Fan, L.; Yuan, Y.; Ying, Z.; Lam, S.K.; Liu, L.; Zhang, X.; Liu, H.; Gu, B. Decreasing farm number benefits the mitigation of agricultural non-point source pollution in China. Environ. Sci. Pollut. Res. Int. 2019, 26, 464–472. [Google Scholar] [CrossRef] [PubMed]
- Lian, H.; Lei, Q.; Zhang, X.; Yen, H.; Wang, H.; Zhai, L.; Liu, H.; Huang, J.-C.; Ren, T.; Zhou, J.; et al. Effects of anthropogenic activities on long-term changes of nitrogen budget in a plain river network region: A case study in the Taihu Basin. Sci. Total Environ. 2018, 645, 1212–1220. [Google Scholar]
- Zhang, W.; Li, X.; Swaney, D.P.; Du, X. Does food demand and rapid urbanization growth accelerate regional nitrogen inputs? J. Clean. Prod. 2016, 112, 1401–1409. [Google Scholar] [CrossRef]
- Ongley, E.D.; Xiaolan, Z.; Tao, Y. Current status of agricultural and rural non-point source Pollution assessment in China. Environ. Pollut. 2010, 158, 1159–1168. [Google Scholar] [CrossRef] [PubMed]
- Fu, B. Editorial: Blue Skies for China. Science 2008, 321, 611. [Google Scholar]
- Panayotou, T. Empirical tests and policy analysis of environmental degradation at different stages of economic development. Pac. Asian J. Energy 1993, 4, 1–42. [Google Scholar]
- Sadik-Zada, E.R.; Gatto, A. Grow first, clean up later? Dropping old paradigms and opening up new horizons of sustainable development. Sustainability 2023, 15, 3595. [Google Scholar] [CrossRef]
- Sadik-Zada, E.R.; Gatto, A. The puzzle of greenhouse gas footprints of oil abundance. Socioecon. Plann. Sci. 2021, 75, 100936. [Google Scholar] [CrossRef]
- Aslam, B.; Hu, J.S.; Hafeez, M.; Ma, D.Q.; AlGarni, T.S.; Saeed, M.; Abdullah, M.A.; Hussain, S. Applying environmental kuznets curve framework to assess the nexus of industry, globalization, and CO2 emission. Environ. Technol. Innov. 2021, 21, 101377. [Google Scholar] [CrossRef]
- Sun, B.; Zhang, L.; Yang, L.; Zhang, F.; Norse, D.; Zhu, Z. Agricultural non-point source pollution in China: Causes and mitigation measures. Ambio 2012, 41, 370–379. [Google Scholar] [CrossRef] [Green Version]
- Yang, J.; Lin, Y. Spatiotemporal evolution and driving factors of fertilizer reduction control in Zhejiang Province. Sci. Total Environ. 2019, 660, 650–659. [Google Scholar] [CrossRef] [PubMed]
- Zhu, N.; Cao, B.; Qin, F. Research of wheat production efficiency based on fertilizer reduction potential and carbon emission reduction. China Environ. Sci. 2018, 38, 784–791. [Google Scholar]
- Zhang, J.; Beusen, A.H.W.; van Apeldoorn, D.F.; Mogollón, J.M.; Yu, C.; Bouwman, A.F. Spatiotemporal dynamics of soil phosphorus and crop uptake in global cropland during the twentieth century. Biogeosciences 2017, 14, 2055–2068. [Google Scholar] [CrossRef]
- Chen, M.; Sun, F.; Shindo, J. China’s agricultural nitrogen flows in 2011: Environmental assessment and management scenarios. Resour. Conserv. Recycl. 2016, 111, 10–27. [Google Scholar] [CrossRef]
- Yu, C.; Huang, X.; Chen, H.; Godfray, H.C.J.; Wright, J.S.; Hall, J.W.; Gong, P.; Ni, S.Q.; Qiao, S.C.; Huang, G.R.; et al. Managing nitrogen to restore water quality in China. Nature 2019, 567, 516–520. [Google Scholar] [CrossRef]
- Zhang, L.; Wang, Z.; Chai, J.; Fu, Y.; Wei, C.; Wang, Y. Temporal and Spatial Changes of Non-Point Source N and P and Its Decoupling from Agricultural Development in Water Source Area of Middle Route of the South-to-North Water Diversion Project. Sustainability 2019, 11, 895. [Google Scholar] [CrossRef] [Green Version]
- Santhi, C.; Arnold, J.G.; Williams, J.R.; Dugas, W.A.; Srinivasan, R.; Hauck, L.M. Validation of the SWAT Model on a Large River Basin with Point and Nonpoint Sources. JAWRA 2010, 37, 1169–1188. [Google Scholar]
- Berka, C.; Schreier, H.; Hall, K. Linking water quality with agricultural intensification in a rural watershed. Water Air Soil Pollut. 2001, 127, 389–401. [Google Scholar] [CrossRef]
- Wang, X.; Hao, F.; Cheng, H.; Yang, S.; Zhang, X.; Bu, Q. Estimating non-point source pollutant loads for the large-scale basin of the Yangtze River in China. Environ. Earth Sci. 2011, 63, 1079–1092. [Google Scholar] [CrossRef]
- Wang, X.; Wang, Q.; Wu, C.; Liang, T.; Zheng, D.; Wei, X. A method coupled with remote sensing data to evaluate non-point source pollution in the Xin’anjiang catchment of China. Sci. Total Environ. 2012, 430, 132–143. [Google Scholar] [CrossRef]
- Guo, H.; Wang, X.; Zhu, J. Quantification and Index of Non-Point Source Pollution in Taihu Lake Region with GIS. Environ. Geochem. Health 2004, 26, 147–156. [Google Scholar] [CrossRef] [PubMed]
- Zhang, Q.-L.; Chen, Y.-X.; Jilani, G.; Shamsi, I.H.; Yu, Q.-G. Model AVSWAT apropos of simulating non-point source pollution in Taihu lake basin. J. Hazard. Mater. 2010, 174, 824–830. [Google Scholar] [CrossRef] [PubMed]
- Wu, C.; Deng, G.C.; Li, Y.; Li, Z.Y.; Yang, S.H. Study on the Risk Pattern of Non-Point Source Pollution Using GIS Technology in the Dianchi Lake Watershed. Adv. Mater. Res. 2012, 356–360, 771–776. [Google Scholar] [CrossRef]
- Xing, K.; Guo, H.; Sun, Y.; He, B.; Huang, Y. Simulation of non-point source pollution in watershed scale: The case of application in Dianchi Lake Basin. Geogr. Res. 2005, 24, 549–558. [Google Scholar]
- Gu, B.; Ju, X.; Chang, J.; Ge, Y.; Vitousek, P.M. Integrated reactive nitrogen budgets and future trends in China. Proc. Natl. Acad. Sci. USA 2015, 112, 8792. [Google Scholar] [CrossRef] [PubMed]
- He, W.; Jiang, R.; He, P.; Yang, J.; Zhou, W.; Ma, J.; Liu, Y. Estimating soil nitrogen balance at regional scale in China’s croplands from 1984 to 2014. Agric. Syst. 2018, 167, 125–135. [Google Scholar] [CrossRef]
- Ma, L.; Velthof, G.; Wang, F.; Qin, W.; Zhang, W.; Liu, Z.; Zhang, Y.; Wei, J.; Lesschen, J.; Ma, W.; et al. Nitrogen and phosphorus use efficiencies and losses in the food chain in China at regional scales in 1980 and 2005. Sci. Total Environ. 2012, 434, 51–61. [Google Scholar] [CrossRef]
- Ju, X.; Gu, B.; Wu, Y.; Galloway, J.N. Reducing China’s fertilizer use by increasing farm size. Glob. Environ. Change 2016, 41, 26–32. [Google Scholar] [CrossRef]
- Ju, X.-T.; Xing, G.-X.; Chen, X.-P.; Zhang, S.-L.; Zhang, L.-J.; Liu, X.-J.; Cui, Z.-L.; Yin, B.; Christie, P.; Zhu, Z.-L.; et al. Reducing environmental risk by improving N management in intensive Chinese agricultural systems. Proc. Natl. Acad. Sci. USA 2009, 106, 3041–3046. [Google Scholar] [CrossRef]
- Sun, C.; Zhou, H.; Chen, L.; Shen, Z. The pollution risk assessment of nitrogen and phosphorus loss in surface runoff from farmland fertilizer. J. Agro-Environ. Sci. 2017, 36, 1266–1273. [Google Scholar]
- Wang, X. Remote Sensing Distributed Non-Point Source Pollution Evaluation Model—Theoretical Method and Application; China Science Publishing & Media Ltd.: Beijing, China, 2015. [Google Scholar]
- Wang, X.; Feng, A.; Wang, Q.; Wu, C.; Liu, Z.; Ma, Z.; Wei, X. Spatial variability of the nutrient balance and related NPSP risk analysis for agro-ecosystems in China in 2010. Agric. Ecosyst. Environ. 2014, 193, 42–52. [Google Scholar] [CrossRef]
- Li, C. Silt transform characteristics and latent effect on fluvial system environment in Yangtze river. Resour. Environ. Yangtze Basin 2000, 9, 504–509. [Google Scholar]
- Hao, F.H.; Yang, S.T.; Cheng, H.G.; Bu, Q.S.; Zheng, L.F. A method for estimation of non-point source pollution load in the large-scale basins of China. Acta Sci. Circumstantiae 2006, 26, 375–383. [Google Scholar]
- Drewry, J.; Newham, L.; Greene, R. Index models to evaluate the risk of phosphorus and nitrogen loss at catchment scales. J. Environ. Manag. 2011, 92, 639–649. [Google Scholar] [CrossRef] [PubMed]
- Sun, C.; Chen, L.; Zhai, L.; Liu, H.; Zhou, H.; Wang, Q.; Wang, K.; Shen, Z. National-scale evaluation of phosphorus emissions and the related water-quality risk hotspots accompanied by increased agricultural production. Agric. Ecosyst. Environ. 2018, 267, 33–41. [Google Scholar] [CrossRef]
- NBSC. China Rural Statistical Yearbook, 2006–2016; China Statistics Press: Beijing, China, 2016.
- Zhu, Z.D. Policy for Reducing Non-Point Pollution from Crop Production in China; China Environmental Science Press: Beijing, China, 2006. [Google Scholar]
- Ti, C.; Pan, J.; Xia, Y.; Yan, X. A nitrogen budget of mainland China with spatial and temporal variation. Biogeochemistry 2012, 108, 381–394. [Google Scholar] [CrossRef]
- Li, S.T.; Jin, J.Y. Characteristics of nutrient input/output and nutrient balance in different regions of China. Sci. Agric. Sin. 2011, 44, 4207–4229. [Google Scholar]
- Xu, P.; Lin, Y.H.; Yang, S.S.; Luan, S.J. Input load to river and future projection for nitrogen and phosphorous nutrient controlling of Pearl River Basin. J. Lake Sci. 2017, 29, 1359–1371. [Google Scholar]
- Chen, X.; Strokal, M.; Van Vliet, M.T.; Stuiver, J.; Wang, M.; Bai, Z.; Ma, L.; Kroeze, C. Multi-scale Modeling of Nutrient Pollution in the Rivers of China. Environ. Sci. Technol. 2019, 53, 9614–9625. [Google Scholar] [CrossRef] [Green Version]
- Wang, M.; Ma, L.; Strokal, M.; Ma, W.; Liu, X.; Kroeze, C. Hotspots for Nitrogen and Phosphorus Losses from Food Production in China: A County-Scale Analysis. Environ. Sci. Technol. 2018, 52, 5782–5791. [Google Scholar] [CrossRef] [Green Version]
- Chadwick, D.; Wei, J.; Yan’An, T.; Guanghui, Y.; Qirong, S.; Qing, C. Improving manure nutrient management towards sustainable agricultural intensification in China. Agric. Ecosyst. Environ. 2015, 209, 34–46. [Google Scholar] [CrossRef]
- National Bureau of Statistics of China. Statistical Yearbook of China 1991; National Bureau of Statistics of China: Beijing, China, 1991.
- National Bureau of Statistics of China. National Economy was Generally Stable in 2019 with Main Projected Targets for Development Achieve; National Bureau of Statistics of China: Beijing, China, 2020.
- United Nations Department of Economic and Social Affairs. World Economic Situation and Prospects 2018; United Nations Department of Economic and Social Affairs: New York, NY, USA, 2018. [Google Scholar]
- Song, L.; Cao, Y. Analysis On Cultivated Land Change In China: Quantitative Characteristics, Research Region and Liferature Sources. Chin. J. Agric. Resour. Reg. Plan. 2018, 39, 31–40. [Google Scholar]
- Su, R.; Cao, Y. Methods Analysis on Cultivated Land Use Changes in China. Chin. J. Agric. Resour. Reg. Plan. 2019, 40, 96–105. [Google Scholar]
- Wang, J.; Li, X. Research on the Change Trend of Farmland Quantity in China for recent 20 Years and its Driving Factors. Chin. J. Agric. Resour. Reg. Plan. 2019, 40, 171–176. [Google Scholar]
- Wang, J.; Xin, L. Spatial-temporal variations of cultivated land and grain production in China based on GlobeLand30. Trans. Chin. Soc. Agric. Eng. 2017, 33, 9–16. [Google Scholar]
- Han, Y.; Fan, Y.; Yang, P.; Wang, X.; Wang, Y.; Tian, J.; Xu, L.; Wang, C. Net anthropogenic nitrogen inputs (NANI) index application in Mainland China. Geoderma 2014, 213, 87–94. [Google Scholar] [CrossRef]
- Zhang, W.; Li, H.; Li, Y. Spatio-temporal dynamics of nitrogen and phosphorus input budgets in a global hotspot of anthropogenic inputs. Sci. Total Environ. 2019, 656, 1108–1120. [Google Scholar] [CrossRef]
- Chen, X.; Cui, Z.; Fan, M.; Vitousek, P.; Zhao, M.; Ma, W.; Wang, Z.; Zhang, W.; Yan, X.; Yang, J.; et al. Producing more grain with lower environmental costs. Nature 2014, 514, 486–489. [Google Scholar] [CrossRef]
- United Nations Department of Economic and Social Affairs. World Urbanization Prospects: The 2014 Revision; United Nations Department of Economic and Social Affairs: New York, NY, USA, 2014. [Google Scholar]
- Smith, L.E.D.; Siciliano, G. A comprehensive review of constraints to improved management of fertilizers in China and mitigation of diffuse water pollution from agriculture. Agric. Ecosyst. Environ. 2015, 209, 15–25. [Google Scholar] [CrossRef] [Green Version]
- Zhu, Z.L.; Chen, D.L. Nitrogen fertilizer use in China—Contributions to food production, impacts on the environment and best management strategies. Nutr. Cycl. Agroecosystems 2002, 63, 117–127. [Google Scholar] [CrossRef]
- Yin, H.; Zhao, W.; Li, T.; Cheng, X.; Liu, Q. Balancing straw returning and chemical fertilizers in China: Role of straw nutrient resources. Renew. Sustain. Energy Rev. 2018, 81, 2695–2702. [Google Scholar] [CrossRef]
- Bai, Z.; Li, X.; Lu, J.; Wang, X.; Velthof, G.L.; Chadwick, D.; Luo, J.; Ledgard, S.; Wu, Z.; Jin, S.; et al. Livestock Housing and Manure Storage Need to Be Improved in China. Environ. Sci. Technol. 2017, 51, 8212–8214. [Google Scholar] [CrossRef] [PubMed] [Green Version]
- Bai, Z.; Ma, L.; Jin, S.; Ma, W.; Velthof, G.L.; Oenema, O.; Liu, L.; Chadwick, D.; Zhang, F. Nitrogen, Phosphorus, and Potassium Flows through the Manure Management Chain in China. Environ. Sci. Technol. 2016, 50, 13409–13418. [Google Scholar] [CrossRef] [Green Version]
- Cai, C.F.; Ding, S.W.; Shi, Z.H.; Huang, L.; Zhang, G.Y. Study of applying USLE and Geographical information system IDRISI to predict soil erosion in small watershed. J. Soil Water Conserv. 2000, 14, 19–24. [Google Scholar]
- Chen, L.; Watanabe, M.; Wang, Q. Changes in nitrogen budgets and nitrogen use efficiency in the agroecosystems of the Changjiang River basin between 1980 and 2000. Nutr. Cycl. Agroecosystems 2008, 80, 19–37. [Google Scholar]
- Liu, X. Nirtogen Cycling and Balance in “Agriculture-Livestock-Nutrition-Environment” System of China; Agiculltural University of Hebei: Baoding, China, 2005. [Google Scholar]
- Mei, C. Risk Assessment and Regionalization of Agricultural Non-Point Source Pollution. Ph.D. Thesis, Nanjing University, Nanjing, China, 2014. [Google Scholar]
- Peng, K.; Ouyang, H.; Zhu, B. Nitrogen balance, pollution and management in a typical agro-forest ecosystem. J. Agro-Environ. Sci. 2004, 23, 488–493. [Google Scholar]
- Lu, R.K. Soil–Plant Nutrition Principle and Fertilization; Chemical Industry Press: Beijing, China, 1998. [Google Scholar]
- Sharpley, A.N.; Williams, J.R. EPIC-erosion/productivity impact calculator: 2. User manual. Tech. Bull. 1990, 4, 206–207. [Google Scholar]
- Wischmeier, W.H. Use and Misuse of the Universal Soil Loss Equation. J. Soil Water Conserv. 1977, 31, 5–9. [Google Scholar]
- Zhang, G.; Lu, F.; Zhao, H. Residue usage and farmers’ recognition and attitude toward residue retention in China’s croplands. J. Agro-Environ. Sci. 2017, 36, 981–988. [Google Scholar]
- Zhang, M.; Gong, Z. Distribution, Characteristics and Taxonomic Classification of Vertisols in China. Acta Pedol. Sin. 1992, 29, 1–17. [Google Scholar]
Figure 1.
A diagram showing the calculations for the nutrient balance estimation (blue: N sources; pink: P sources; green: N and P sources; “+”: nutrient inputs; “-”: nutrient outputs).
Figure 1.
A diagram showing the calculations for the nutrient balance estimation (blue: N sources; pink: P sources; green: N and P sources; “+”: nutrient inputs; “-”: nutrient outputs).
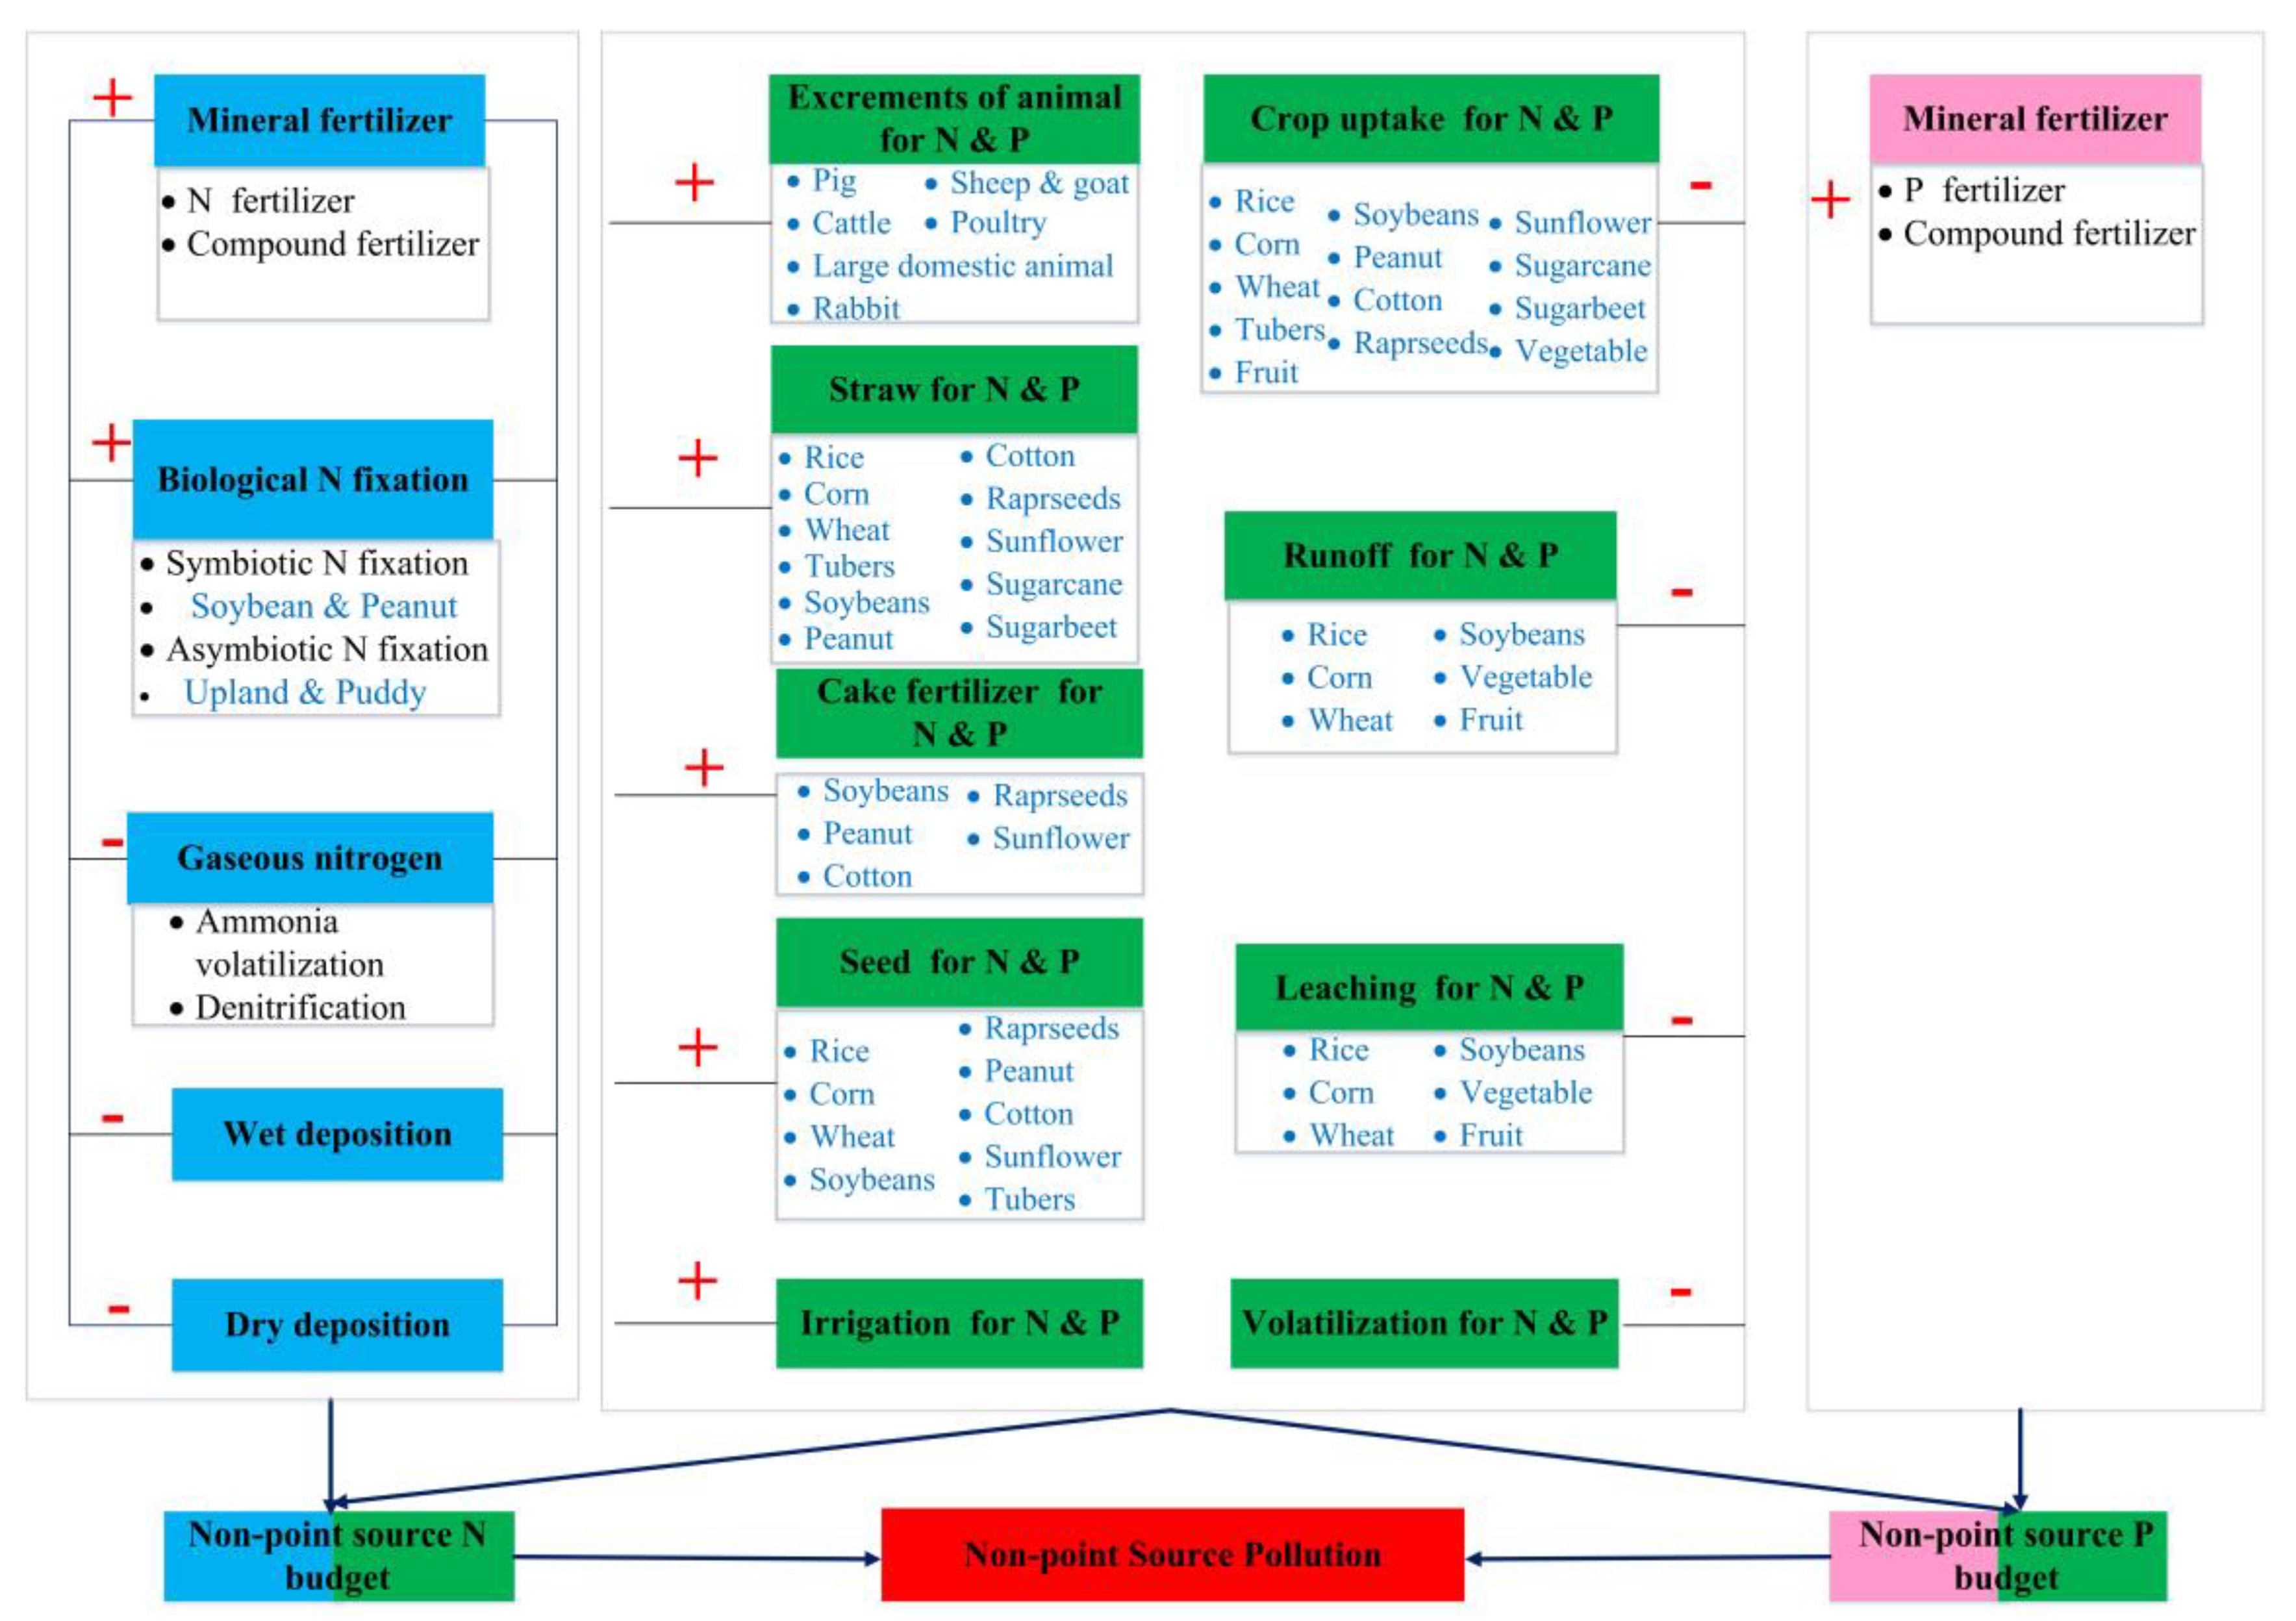
Figure 2.
Results of nutrient balance in the 31 provinces in 2015 in China. (a) Nutrient input in province scale. (b) Composition of nutrient output in province scale. The darker the color is, the larger the value, and the lighter the color is, the smaller the value. (c) Composition of N input, F: fertilizer, OF: organic fertilizers, AD: atmospheric deposition, BNF: biological nitrogen fixation, S + I: seed and irrigation. (d) Composition of P input. (e) Composition of N output, U: undertake, AM + D: ammonia volatilization and denitrification, L + R: leaching and runoff, E: evaporation. (f) Composition of P output.
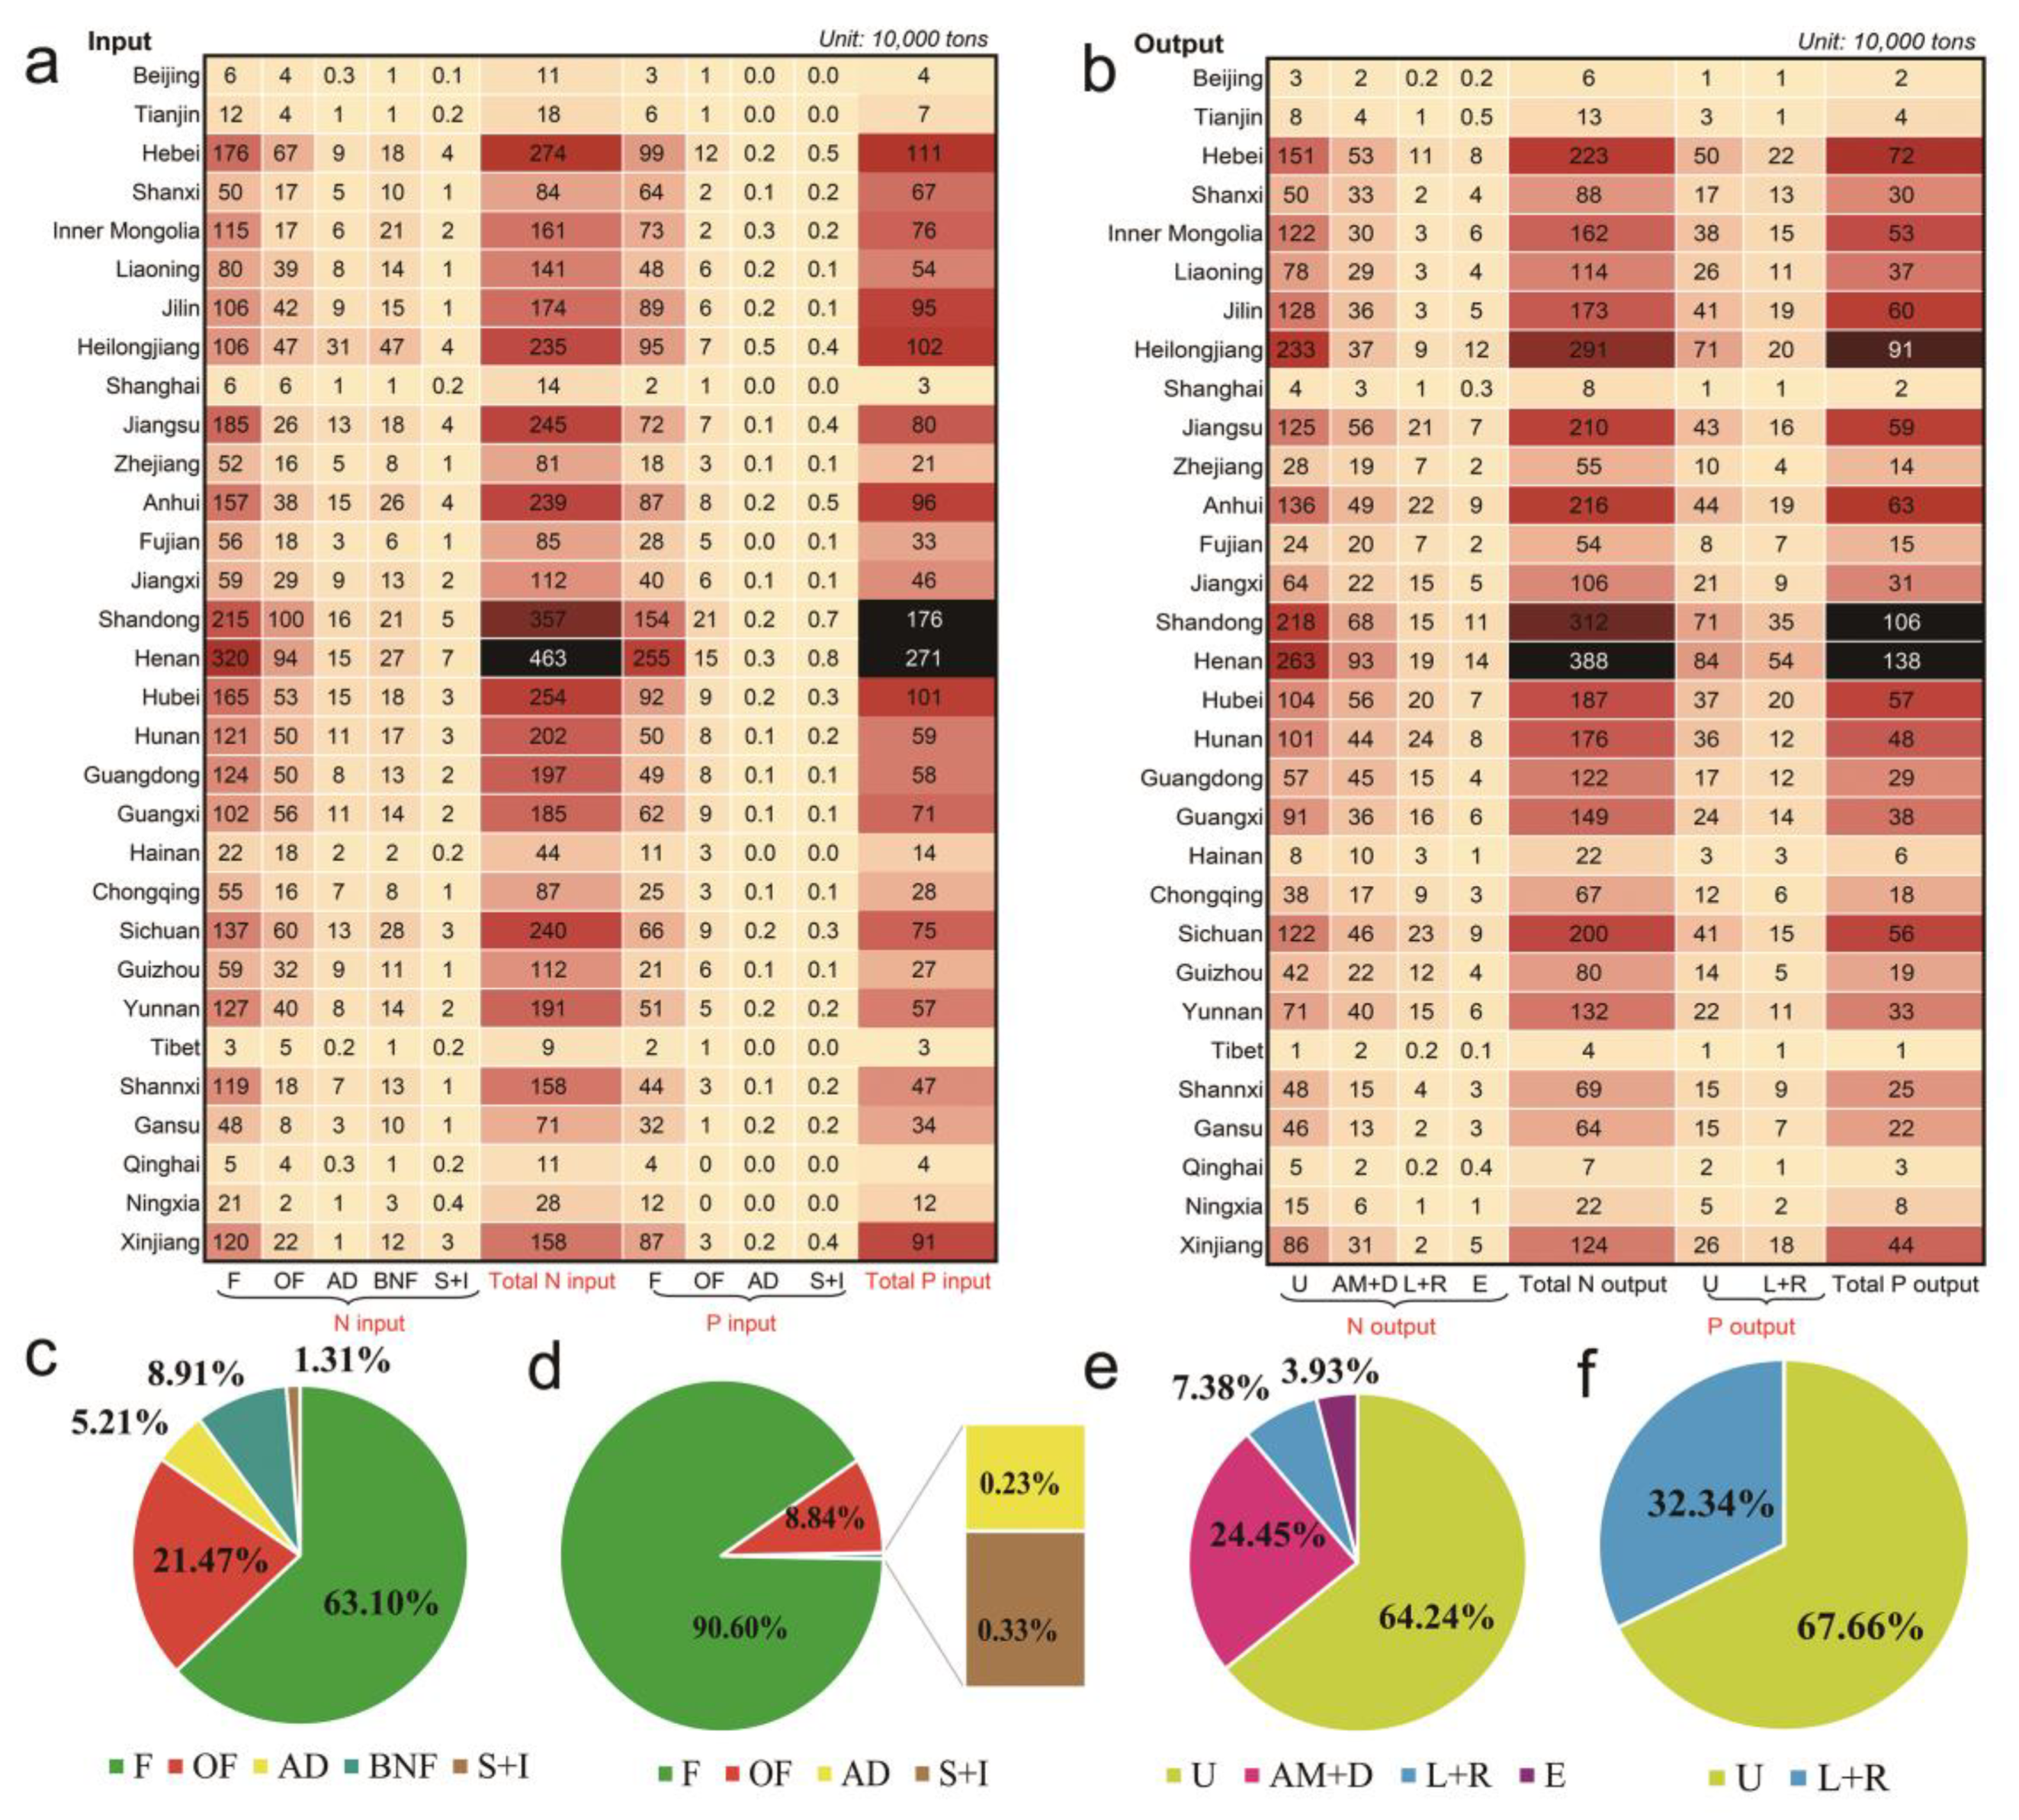
Figure 3.
(a) N and (b) P balance in China in 2015 on the county scale.

Figure 4.
Spatial distribution of dissolved (a) N NPS and (b) P NPS pollutant loads in China in 2015.
Figure 4.
Spatial distribution of dissolved (a) N NPS and (b) P NPS pollutant loads in China in 2015.
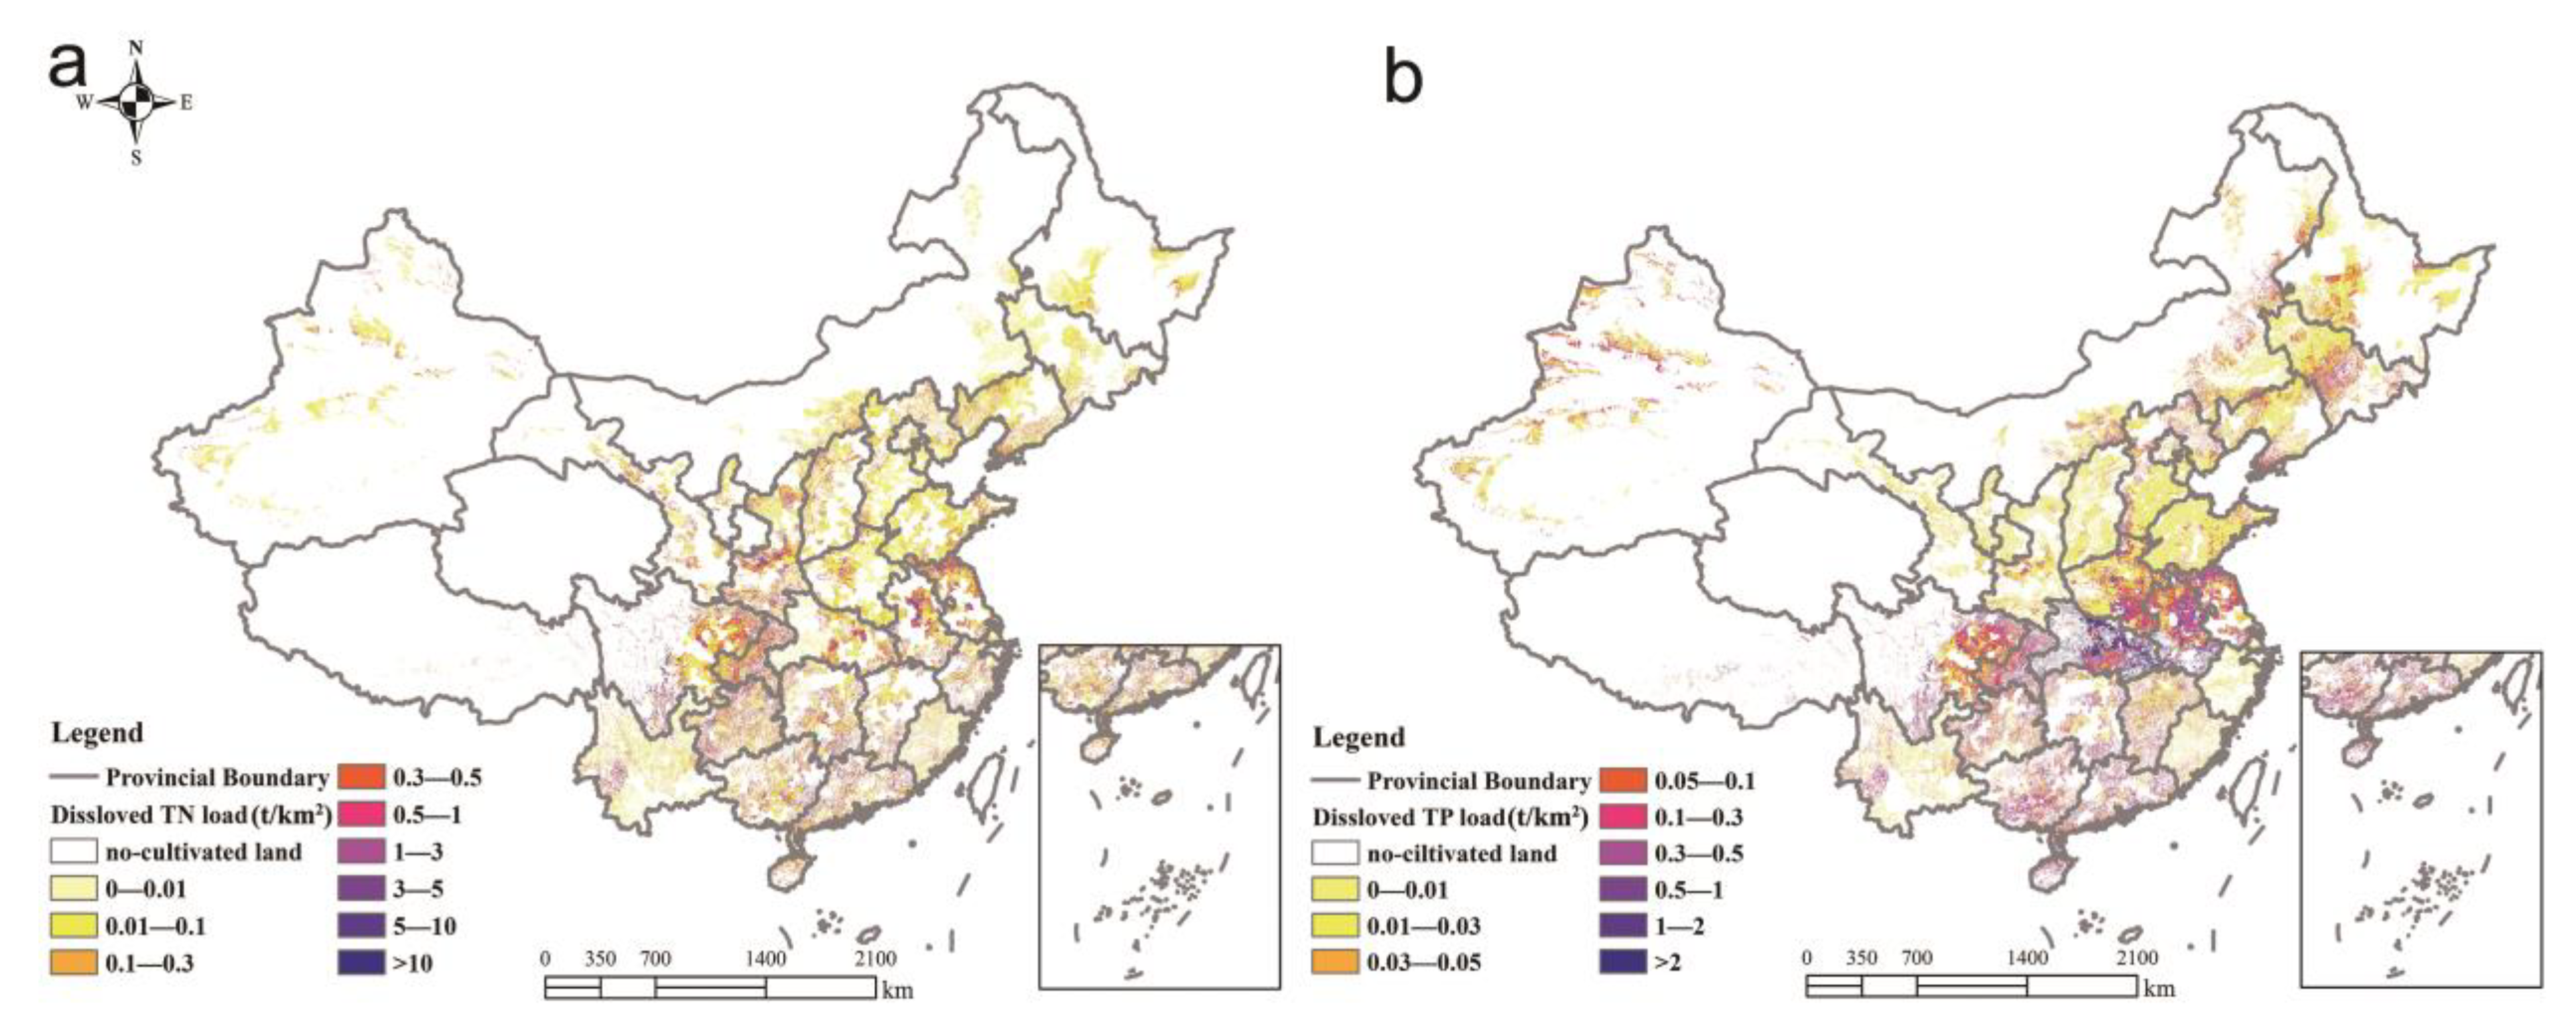
Figure 5.
Results of potential pollution risk of NPS in 2015 in China. (a) N pollution (b) potential N pollution risk of in northern China (c) potential N pollution risk of in southern China.
Figure 5.
Results of potential pollution risk of NPS in 2015 in China. (a) N pollution (b) potential N pollution risk of in northern China (c) potential N pollution risk of in southern China.
Disclaimer/Publisher’s Note: The statements, opinions and data contained in all publications are solely those of the individual author(s) and contributor(s) and not of MDPI and/or the editor(s). MDPI and/or the editor(s) disclaim responsibility for any injury to people or property resulting from any ideas, methods, instructions or products referred to in the content. |
© 2023 by the authors. Licensee MDPI, Basel, Switzerland. This article is an open access article distributed under the terms and conditions of the Creative Commons Attribution (CC BY) license (https://creativecommons.org/licenses/by/4.0/).
Share and Cite
MDPI and ACS Style
Duan, Y.; Jiang, H.; Huang, X.; Zhu, W.; Zhang, J.; Wang, B.; Wu, W. Evaluating Nationwide Non-Point Source Pollution of Crop Farming and Related Environmental Risk in China. Processes 2023, 11, 2377. https://doi.org/10.3390/pr11082377
AMA Style
Duan Y, Jiang H, Huang X, Zhu W, Zhang J, Wang B, Wu W. Evaluating Nationwide Non-Point Source Pollution of Crop Farming and Related Environmental Risk in China. Processes. 2023; 11(8):2377. https://doi.org/10.3390/pr11082377
Chicago/Turabian StyleDuan, Yang, Hongqiang Jiang, Xiao Huang, Wenhui Zhu, Jie Zhang, Bo Wang, and Wenjun Wu. 2023. "Evaluating Nationwide Non-Point Source Pollution of Crop Farming and Related Environmental Risk in China" Processes 11, no. 8: 2377. https://doi.org/10.3390/pr11082377
Note that from the first issue of 2016, this journal uses article numbers instead of page numbers. See further details here.