
Critical Analysis of Risk Factors and Machine-Learning-Based Gastric Cancer Risk Prediction Models: A Systematic Review

School of Pharmaceutical Sciences, Nanjing Tech University, Nanjing 211816, China
*
Authors to whom correspondence should be addressed.
Processes 2023, 11(8), 2324; https://doi.org/10.3390/pr11082324
Submission received: 17 June 2023
/
Revised: 26 July 2023
/
Accepted: 28 July 2023
/
Published: 2 August 2023
(This article belongs to the Special Issue Artificial Intelligence and Big Data for Healthcare and Biological Data Processing)
Abstract
:The gastric cancer risk prediction model used for large-scale gastric cancer screening and individual risk stratification is an artificial intelligence tool that combines clinical diagnostic data with a classification algorithm. The ability to automatically make a quantitative assessment of complex clinical data contributes to increased accuracy for diagnosis with higher efficiency, significantly reducing the incidence of advanced gastric cancer. Previous studies have explored the predictive performance of gastric cancer risk prediction models, as well as the predictive factors and algorithms between each model, but have reached controversial conclusions. Thus, the performance of current machine-learning-based gastric cancer risk prediction models alongside the clinical relevance of different predictive factors needs to be evaluated to help build more efficient and feasible models in the future. In this systematic review, we summarize the current research progress related to the gastric cancer risk prediction model; discuss the predictive factors and methods used to construct the model; analyze the role of important predictive factors in gastric cancer, the preference of the selected classification algorithm, and the emphasis of evaluation criteria; and provide suggestions for the subsequent construction and improvement of the gastric cancer risk prediction model. Finally, we propose an improved approach based on the ethical issues of artificial intelligence in medicine to realize the clinical application of the gastric cancer risk prediction model in the future.
1. Introduction
Gastric cancer (GC) is one of the most common malignancies, which, according to the data provided by GLOBOCAN [1], ranks fifth in the incidence of malignant tumors and fourth in the death rate worldwide (Figure 1A). Globally, China has the highest number of GC cases and deaths (Figure 1B). GC is characterized by strong concealment and a high degree of malignancy at first diagnosis [2]. At present, the main detection methods for GC in China include barium meal, exfoliated cell examination, endoscopy, Helicobacter pylori (Hp) infection, pepsinogen (PG), Gastrin-17 (G-17), and tumor markers [3]. Among them, endoscopy and biopsy are the most intuitive, with the highest sensitivity and specificity [4]; however, these methods are largely dependent on instruments and are considered painful. Although the dependence on instruments is relatively low in laboratory tests, the poor sensitivity and specificity of these methods have limited their clinical application [5]. Therefore, to optimize the detection method of GC and improve the accuracy of diagnosis, exploration of the GC risk prediction model is of great significance for the early detection of GC and the warning of high-risk groups.
Recently, the application of artificial intelligence (AI) in cancer has been widely expanded, including in the context of image interpretation (Li et al., 2020), personalized treatment (Lee et al., 2018), drug discovery, and surgical intervention (Hashimoto et al., 2018) [6,7,8]. Previous reviews of AI-assisted diagnosis of GC have mainly focused on endoscopy [9,10,11]. Given that GC is a multi-factor disease and its development involves various risk factors, we summarize the literature related to the GC risk prediction model and model evaluation based on multi-factor diagnostic indicators, as well as the predictive factors and classification algorithms that can be used to construct the GC risk prediction model. The aim of this study was to provide a reference for the establishment and optimization of the GC risk prediction model in subsequent research.
2. Materials and Methods
This systematic review was performed following the Preferred Reporting Items for Systematic Reviews and Meta-Analyses (PRISMA) guidelines [12].
We systematically searched articles published before 1 May 2023, with publication dates within five years, and topics related to prediction and prognosis models for gastric cancer. The literature search was based on the Web of Science and PubMed. The retrieval terms include “gastric cancer”, “prediction”, “assessment”, “model”, “machine learning”, and “deep learning”. In addition, references included in some of the articles were manually searched as supplements.
The inclusion criteria were as follows: (1) population-based studies on the construction or validation of gastric cancer risk prediction models; (2) population-based prognostic model construction or validation evaluation; (3) non-primary source materials such as conference abstracts, academic papers, and other informally published documents, reviews, and news reports were excluded; (4) the duplicate articles retrieved from different databases and the duplicate articles published in different languages were removed, and the latest studies or the studies with the largest sample size were selected. These operations above were performed by a reference manager software (Endnote X9).
We summarized the key information of the articles and formulated the information extract table, including (1) basic information of the model: the first author, data sources, sample size, verification mode, classification algorithms, model effect evaluation, etc. (2) The predictors and their total frequencies were included in articles.
3. Results
Initially, a total of 741 titles were identified, 238 from Web of Science and 503 from PubMed; however, 120 duplicates were removed. After manually screening these titles, 132 publications were included for abstract reading. Finally, 69 studies met the inclusion criteria and they were included in this systematic review. The PRISMA flowchart is presented in Figure 2. The articles we investigated are listed in Table S1 [13,14,15,16,17,18,19,20,21,22,23,24,25,26,27,28,29,30,31,32,33,34,35,36,37,38,39,40,41,42,43,44,45,46,47,48,49,50,51,52,53,54,55,56,57,58,59,60,61,62,63,64,65,66,67,68,69,70,71,72,73,74,75,76,77,78,79,80,81,82,83]. Figure 3 presents the statistics for all the articles investigated. Figure 4 presents the research framework. Table 1 shows the summary of the relationship between GC and each factor.
3.1. Predictive Factors
Predictive factors refer to the indicators that may be associated with the prediction target, including linearity and nonlinearity. After summarizing and sorting, the predictive factors related to GC were divided into demographic characteristics, clinical indicators, living habits, genetic factors, and omics data, all of which were classified and explained in detail. All or most of the GC-related factors were integrated to maximize the predictive ability of the model. Table 2 shows the statistics of the factors for prediction.
3.1.1. Demographic Characteristics
The American Joint Committee on Cancer (AJCC) staging system is a common tool used clinically to predict disease progression and design treatment strategies [84,85]. However, the international tumor-node-metastasis (TNM) staging system only relies on anatomical and pathological features for disease assessment, without considering many other important relevant factors, such as age, sex, and other demographic characteristics [86,87]. Numerous studies have shown that the clinical stage alone is not sufficient to predict the prognosis of patients with cancer [87,88,89,90]; therefore, further analysis of demographic characteristics is necessary [36].
In the 69 studies outlined above, age was the most frequent predictive factor, and more than half of the GC prediction and prognosis models passed the correlation test for it, making it an independent factor. Studies have shown that the incidence of GC is highly correlated with age, mostly in people aged 50–70 years [91,92,93]. Indeed, Yongning Zhou et al. (2008) [94] analyzed the results of 65,284 cases of upper gastrointestinal endoscopy from Gansu, China, from 1993 to 2004 according to the trend of age and found that the average age of the subjects with GC increased steadily annually, with a gradually increasing incidence observed after 40 years. Moreover, GC cases in the 50–70-year age group accounted for 70% of the total, while only 5.8% of GC occurred in subjects < 40 years. Kongwang Hu et al. (2019) [95] found that the variable “age” had a nonlinear effect on the prognostic outcome, with both age and its square found to be significantly associated with survival time. Other studies have shown that the prognosis of young patients with GC is equal to or better than that of older patients with GC, although they have more aggressive tumor biological features [96,97].
According to the data from GLOBOCAN in 2020 [1], the global incidence rate for all cancers combined was 19% higher in men (222.0 per 100,000) than in women (186 per 100,000). The sex gap for overall cancer mortality worldwide was twice that for incidence, with a death rate that was 43% higher in men than in women (120.8 and 84.2 per 100,000, respectively). In addition, both the incidence and mortality for GC in men (719,523 and 502,788, respectively) were twice those reported in women (369,580 and 266,005, respectively). Iida, Masahiro et al. (2018) [13] found that sex was significantly associated with GC incidence in the univariate analysis. The Japan Public Health Center-based prospective (JPHC) Study Group developed a risk assessment tool permitting the estimation of the 10-year cumulative probability of GC occurrence, in which sex was considered one of the risk factors [21]. In short, sex is an essential factor to build a GC risk prediction model. Figure 5 presents the distribution of the number of people with GC worldwide based on sex.
The United States population is characterized by racial diversity, and the incidence of GC varies greatly among different races [28]. African Americans, Hispanics, Asians, and Pacific Islanders have a 1.7–2.0-fold higher incidence of GC than Whites [98,99]. Foreign-born immigrants from high-incidence countries continue to have a higher risk of GC even after immigration [100,101,102,103]. Haejin In et al. (2018) [28] developed an item pool to assess GC risk in the US, showing the differences in GC risk by country of birth, race, and immigration. People who were classified as high risk through this project might benefit from timely endoscopic screening. Chong Hou et al. (2022) [35] developed two more accurate survival prediction models for patients with locally advanced gastric cancer (LAGC) and identified race as an independent prognostic factor for LAGC patients through univariate and multivariate Cox regression analyses. However, due to the high cost and difficulty of collecting data on nonlocal regional races across regions, such data can only be obtained from public open-source databases (such as SEER), which inevitably leads to some bias in the external verification of races. Therefore, larger clinical trials in different countries and multi-centers are needed to further explore the effect of race on GC.
3.1.2. Clinical Indicators
The prevalence of Helicobacter pylori (Hp) infection is very high, with nearly 50% of the global population known to be infected [104]. Chronic Hp infection is considered the leading cause of non-cardiac gastric cancer (NCGC), with almost all cases of NCGC attributed to this bacterium [1]. However, Hp infection is usually not associated with cardiac gastric cancer (CGC) and may even be negatively associated in some populations [105,106]. Sevedeh Zahra Bakhti et al. (2020) [107] indicated that the bacterial genotypes may determine the clinical outcome of GC. They proposed that the deep sequencing of both Hp and its human host was simultaneously performed, and then the expression and functional activities of the identified new determinants of GC should be assessed. Ling Yang et al. (2021) [108] assessed the associations of Hp infection, both overall and for individual infection biomarkers, with the risks of NCGC and CGC in Chinese adults. They suggested that population-based mass screening and the eradication of Hp should be considered to reduce the burden of GC in high-risk settings. Moreover, Yang, Y (2021) [18] conducted single-factor analysis of Hp infection, which showed the groups of patients with GC and precancerous lesions were significantly higher than those in the control group. Multi-factor logistic regression analysis verified that Hp infection was an independent risk factor for GC, which could provide a data reference for early GC, and the GC risk model constructed on this basis had a good fitting (AUC = 0.924).
Serum tumor markers are of great importance in the diagnosis, prognostic prediction, and recurrence monitoring of gastrointestinal malignancies [109]. As previous studies have suggested, alpha-fetoprotein (AFP) was associated with prognosis in patients with GC undergoing surgery alone [110]; preoperative carcinoembryonic antigen (CEA) could predict the prognosis of patients with GC with no lymph node metastasis [111]; carbohydrate antigen 199 (CA199) was an independent prognostic factor in patients with gastroesophageal junction (GEJ) cancer who experienced surgery alone [112]; the carbohydrate antigen 125 (CA125) level was related to the degree of peritoneal dissemination and the existence of malignant ascites in patients with GC with peritoneal metastasis [113]; and carbohydrate antigen 724 (CA724) was correlated with the pTNM stage in patients with gastric carcinoma [114]. Although the positive rates of CEA, CA199, AFP, and CA125 are relatively low in early GC [115], combined analysis with other factors can effectively improve the accuracy of diagnosis, clinical staging, precancerous lesions, and survival prognosis of patients with GC [1,15,44,61,72,79,81,116].
Pepsinogen (PG) is a proenzyme of the digestive enzyme pepsin. A low serum PG I and PG I/II (PGR) ratio is associated with severe atrophic gastritis and GC due to loss of cells in the corpus and fundus. PG reflects the functional and morphological status of the gastric mucosa and serves as a marker of atrophic gastritis [117]. Serum pepsinogen screening has been shown to be a practical predictor of GC and atrophic and chronic atrophic gastritis, the most important predisposing lesion leading to GC [118]. In the analysis of Hadrien Charvat et al. (2015) [21], “Atrophic gastritis” was defined when the criteria of both a PG I ≤ 70 ng/mL and a PG I/II ≤ 3.0 were fulfilled. The “ABC method” [119] was used for risk stratification, and a semi-parametric Cox proportional hazards model with good performance in discrimination and calibration was constructed based on a cohort of 19,028 individuals.
In our survey, in addition to the above factors, other clinical indicators applied in prediction or prognosis of GC include G-17 [44,72], hemoglobin [13,15], tumor abnormal protein (TAP) [81], and organic metabolites [54]. These factors may have a limited or uncertain effect on the model in the independent condition. For example, elevated G-17 levels are significantly associated with an increased risk of atrophic gastritis in healthy people, but the diagnostic ability for atrophic gastritis decreases at higher levels of G-17 [120]. In addition, there may be a certain correlation between the clinical indicators. For example, Hp infection may increase the levels of PG I, PG II, and G-17 but cause the PGR level to plummet [121,122]. Therefore, joint analysis of these diagnostic results may be more convincing than single-factor analysis.
3.1.3. Lifestyle Habits
Previous studies have shown that drinking alcohol is one of the risk factors for NCGC [1]. G C Kabat et al. (1993) [123] analyzed 173 hospitalized males with distal esophageal/CGC and 4544 hospitalized males with normal gastrointestinal tract and found that the odds ratio (OR) for drinkers of four or more ounces of whiskey equivalents of alcohol per day (relative to those consuming less than one drink per week) was 2.3 (CI: 1.3–4.3), which demonstrated a significant association between distal esophageal/CGC and alcohol intake. However, alcohol consumption was not associated with an increased risk of any subtype of GC according to other studies [124,125,126]. As a high alcohol intake tends to increase tobacco use and given that the duration of cigarette or pipe smoking was positively associated with GC risk, many studies have incorporated both factors into the model [127], and further analysis is needed to determine the effect of drinking alcohol under the condition of a single factor.
Smoking has also been identified as one of the risk factors for NCGC [1]. Frances B. Maguire et al. (2022) [128] evaluated tobacco-related cancer deaths in California from 2014 to 2019 and found that smoking-attributable cancer mortality (SACM) and smoking-attributable fraction (SAF) decreased for both males and females due to ongoing tobacco control efforts in California. Moreover, the SAF in males with GC decreased more significantly than that in females because of the higher proportion of smoking in males. A total of 1071 Japanese men aged ≥ 40 years were followed up prospectively for 14 years by Kentaro Shikata et al. (2008) [129]. The results of this population-based prospective study showed that the estimated population attributable fraction of GC for cigarette smoking was approximately half that for Hp infection (28.4% vs. 56.2%), which proved that cigarette smoking and Hp infection are significant risk factors for GC in Japanese men, and the magnitude of their combined influence is considerable. Moreover, Melina Arnold et al. (2020) [130] conducted a global analysis of five major gastrointestinal cancers and concluded that reducing tobacco consumption was one of the most important means to control these malignant tumors among primary and secondary prevention measures. As noted above, the duration of cigarette or pipe smoking was positively associated with GC risk; therefore, smoking status can be applied to GC risk assessment, prognosis, prediction, and other applications [13,16,20].
Obesity is an important risk factor for many gastrointestinal and liver diseases and may interact with other mechanisms and result in an earlier presentation or more complicated diseases [131]. It has been reported that CGC is associated with obesity and gastroesophageal reflux [132]. However, our survey demonstrated that, although many models included BMI as a predictor, the results revealed little difference in BMI between the experimental and control groups [18,27,47,61,72]. A systematic review and meta-analysis by Jalal Poorolajal et al. (2020) [133] also found that the association between obesity and GC was not statistically significant and that BMI had no significant effect on the incidence of GC. Therefore, if BMI is to be included as a predictor, consideration should be given to the inclusion of other interacting factors.
Diet is a general factor and can be detailed in the intake of fruits and vegetables, fried/pickled/smoked, high-salt diet, regularity, and speed of eating. According to the latest meta-analysis, a higher intake of total fruit (RR: 0.87, 95% confidence interval (CI): 0.80–0.94, I2 = 0%) and total fruit and vegetable (RR: 0.75, 95% CI: 0.61–0.93, I2 = 55.2%) were associated with a lower risk of GC. Based on the linear dose–response analysis, each 100 g/day increase in total fruit intake (pooled RR: 0.95, 95% CI: 0.90–0.99, I2 = 49%) and 200 g/day increase in total fruit and vegetable intake (RR: 0.94, 95% CI: 0.88–0.99, I2 = 37.6%) were associated with a 5% and 6% lower risk of GC, respectively [134]. Furthermore, several epidemiological studies have shown a positive correlation between the intake of high-salt or pickled food and GC [135,136,137]. While salted food intake may increase the risk of Hp infection, it can also act synergistically to promote the development of GC [138]. N-Nitroso compounds from preserved, smoked, and salted foods are the internal factors that induce GC [139]. The GC risk assessment model established by Beyoung Park et al. (2021) [27] included eating regularity as a risk factor, with significant differences observed between patients with GC and the control group.
In addition to the abovementioned factors, exercise [27,28], exposure environment (radiation) [29], occupation [28], and drug use [34] are also known to affect the living habits of GC. Although these factors may have a certain impact on GC, the effect is not significant or specific, and it is difficult to quantify or set evaluation criteria. Therefore, these factors are rarely included in the model and, even if they are included, they are analyzed together with other factors rather than discussed separately.
3.1.4. Genetic Factors
Family history of GC is an important risk factor [140], and a total of 11 studies in our survey included family history of GC in the model. For example, Yang, Y et al. (2021) [18] found that the family history of GC was statistically significant, and the patient group was higher than the control group by single-factor analysis. Fujiao Duan et al. (2021) [19] introduced a family history of GC into the individual risk prediction model based on a single nucleotide polymorphism (SNP), and the prediction level of the model was significantly improved (AUC increased from 0.737 to 0.773). Wang Ping et al. (2018) [44] applied logistics single-factor and multi-factor regression analyses to demonstrate that a high proportion of patients with precancerous lesions had a family history of GC, which was listed as a high-risk factor. However, most of these studies used small sizes of samples. Indeed, GC is mostly sporadic, with only approximately 10% of cases showing familial aggregation and even fewer cases (1–3%) with genetic causes [141]; the attribution of these genetic variations is identified as regional differences. The number of studies on the incidence of GC and family history is quite small, and only approximately 27% of individuals have received health examinations with family history; therefore, data collection is relatively difficult [142].
Gastric carcinogenesis follows a multi-step histopathological pathway known as the Correa cascade, which involves the following steps: chronic active gastritis, atrophic gastritis, intestinal metaplasia, dysplasia, and, ultimately, cancer [117,143,144]. These diseases are closely related to the development of GC. Indeed, the various disease stages point to a common cause—Hp infection [145,146,147]. In addition, it has been reported that Hp is a major risk factor for gastric ulcers and gastric cancer [148]. In addition, some studies have reported a significant association between gastroesophageal reflux disease and gastric cancer [149,150]. Maomao Cao et al. (2020) [26] showed that there were other symptoms considered secondary risks that might be associated with stomach cancer, including chest pain, pressure or burning, dysphagia, and vomiting or hemoptysis. Each of these conditions or symptoms needs to be considered along with other factors to better explain the cause of GC.
3.1.5. Omics Data (Excluding Radiomics)
In molecular biology, omics mainly includes genomics, transcriptomics, proteomics, and metabolomics. Through an integrated analysis of omics data, the basic state of the target can be observed and the biological system can be comprehensively interpreted. In our survey, nearly half of the studies took omics data as the core of data mining and model construction (46.4%), covering DNA, lncRNA, mRNA, miRNA, SNP, and other aspects, and most of the data came from The Cancer Genome Atlas (TCGA), GEO, SEER, and other open-source databases. Yi Bai et al. (2020) [65] identified DNA methylation (DNAm)-driven genes by integrating DNAm and gene expression profiling analyses from TCGA GC cohort. Subsequently, a risk score model was built based on multivariate Cox regression analyses that showed the altered status of the DNAm-driven gene signature was significantly associated with the overall survival (OS) of patients with GC. Shilin Zhi et al. (2022) [14] screened the immune-related lncRNAs from TCGA database and identified 13 lncRNAs to construct a prognosis assessment model that assigned the patients to different risk groups and was expected to provide a novel target for immunotherapy in patients with GC. Zepang Sun et al. (2020) [80] revealed a novel prognostic factor by a multivariate analysis, a genomics score (GS) comprising 7 miRNAs, 8 mRNA, and 19 DNA methylation sites, which provides additional precision in stratifying patients with different OS prognoses. Fei Bai et al. (2020) [43] used logistic regression to analyze the relationship between SNPs of ZBTB20 and GC risk under different genetic models to determine the correlation between these SNPs and the risk of GC in the Chinese Han population. Omics study may be one of the mainstream trends in the construction of GC risk prediction models, and the novel integrated multi-omics strategy used in this study may facilitate the development of a more tailored approach to GC therapy [151].
3.1.6. Radiomics
Radiomics has made great progress in the past decade, such as computed tomography (CT), magnetic resonance imaging (MRI), and positron emission tomography–computed tomography (PET/CT) [152], by which relevant radiomics features can be extracted for screening diagnosis and prognostic follow-up [153,154]. Due to the intuitiveness, whether through artificial or computer-aided diagnosis, radiomics can achieve high accuracy. For example, Xiaodong Wang et al. (2021) [45] used a deep learning framework to analyze whole-slide images (WSI) of lymph nodes to identify lymph nodes and gastric tumor regions, and the AUC on the validation set reached 0.990, which was much higher than the average level (0.778) of other models used in our survey. In particular, the human–machine combination is very attractive to clinicians while alleviating the ethical dilemma of AI in medical applications [155,156].
3.2. Analysis of the Prediction Methods
The prediction method refers to the method used to construct the model, which is mainly divided into two steps: feature selection and classification. Feature selection, also known as feature subset selection, refers to the selection of N features from the existing M features to optimize the specific indicators of the system, aiming at removing irrelevant and redundant features. Feature selection is a process of reducing the data dimension and is mostly applied to omics data with higher data dimensions [157,158]. Classification is the process of using classification algorithms to map data to one of a given class, which is commonly referred to as a classifier, which is the collective term used in data mining to classify samples. Six feature selection algorithms and five classification algorithms are summarized by sorting out the literature.
3.2.1. Feature Selection
The least absolute shrinkage and selection operator (LASSO) appeared in our survey many times. It is a compression estimation algorithm based on the idea of reducing the variable dimension [159]. By constructing a penalty function, LASSO compresses the coefficient of the variable and makes some regression coefficients become 0 to achieve the purpose of feature selection. Its mathematical expression is shown as Formula (1). Jun Wang et al. (2022) [48] acquired lncRNA expression profiles from TCGA and used the LASSO to develop an immune-related lncRNA pair (IRLP) prognostic signature termed the 18-IRLP signature, which provided new insights regarding immunological biomarkers and could be used for predicting prognosis and evaluating the immune response in GC. The LASSO can be used not only for dimension reduction, but also for regression. The characteristic of LASSO regression is that, in the establishment of generalized linear models, the requirements for data are extremely low, regardless of whether the dependent variable is continuous or discrete.
where t is the adjustment parameter and t > 0. The compression of the overall regression coefficient can be realized by controlling the adjustment parameter t.
Multifactor dimensionality reduction (MDR) is a method used to analyze the interactions developed recently. It was first proposed by Ritchie, MD [160], and gradually developed into a dimensionality reduction method to fold high-dimensional genetic data into a single dimension [161]. As a nonparametric analysis method, MDR does not need to specify the genetic mode (dominant or recessive inheritance) and interaction model (linear or nonlinear model, additive or multiplicative model), so it overcomes the problem of increasing type I and II errors caused by the traditional linear model for parameter estimation of small samples. Liuxin Qiu et al. (2020) [75] used MDR to calculate the effect of high-order gene–environment interactions on GC risk, and the results were the same as the analysis of classification and regression tree (CART), which verified the feasibility of MDR.
The Pearson correlation coefficient is used to measure the correlation (linear correlation) between two variables. The mathematical expression is shown in Formula (2). To investigate the potential tumor-related molecular mechanism of autophagy-related genes (ARGs), Juan Li et al. (2021) [73] used the Pearson correlation test to estimate the correlation between gene expression and risk score. Significant genes were screened out according to the correlation coefficient (|R| > 0.4, p < 0.05), and Gene Ontology (GO) and Kyoto Encyclopedia of Genes and Genomes (KEGG) analyses were used to investigate the functions and terms associated with the model-related genes in GC. The Spearman correlation coefficient is a statistic obtained by ranking the sample values of two random variables in the order of the size of the data and replacing the actual data with the rank of the sample values of each element. The mathematical expression is as in Formula (3). Sha Huang et al. (2021) [54] calculated the Spearman correlation coefficients for the comparison of all quality control samples, which showed Spearman correlation coefficients of 0.99 on average, indicating high reproducibility of metabolomics data generated from liquid chromatography–mass spectrometry analysis. The difference between the two correlation coefficients lies in the fact that the Pearson correlation coefficient is commonly used for data that follow a bivariate normal distribution. The Spearman correlation coefficient is more suitable for continuous data with non-normal distribution, ordered data, or data with relevant outliers [162].
where represents the difference in rank values of the No. data pair.
Gene Set Enrichment Analysis (GSEA) is an enrichment analysis method based on gene sets, which uses a predefined gene set or protein set to rank according to the degree of differential expression in two types of phenotypes and tests whether the predefined gene or protein set is enriched at the top or bottom of the ranking table [163,164]. Chuang Zhang et al. (2021) [67] explored the molecular pathways associated with peritoneal recurrence-related immune score (PRIs) by GSEA, which showed the upregulation of the focal adhesion signaling in the high-PRI subtype. The GSEA method contains three key elements: calculating the enrichment score (ES), estimating the significance level of ES, and adjusting for multiple hypothesis testing. Because GSEA analyzes collections of genes rather than individual genes, the problem of not considering collinearity can be avoided.
Weighted Gene Co-Expression Network Analysis (WGCNA) is a system biology method to describe gene association patterns among different samples. WGCNA can be used to identify gene sets with high covariation and to identify candidate biomarker genes or therapeutic targets based on their endogenicity and association between gene sets and phenotypes. Yonghong Zhang et al. (2018) [74] screened the common RNAs in Genomic Spatial Event (GSE) and TCGA set and used them to construct a WGCNA network for mining GC-related modules, which identified an 11-lncRNA signature that could predict the survival rate for GC. The feature of WGCNA is to transform the association between genes and phenotypes into the association between several gene sets and phenotypes, avoiding the problem of multiple-hypothesis-testing correction [165].
In addition to the abovementioned methods used for feature selection/correlation analysis, other approaches have also been used in research. For example, Masahiro lida et al. (2018) [13] used the Cox regression model for univariate analysis to estimate the risk ratio of each risk factor. Shaohua Xie et al. (2016) [34] obtained the importance scores of candidate predictive variables through random forest analysis and then selected the predictive variables by unconditional logistic regression and forward selection method. Bo Gao et al. (2021) [76] used principal component analysis (PCA) and t-distributed stochastic neighbor embedding (t-SNE) to analyze patients to classify factors associated with low- and high-risk groups, respectively.
3.2.2. Traditional Classification Algorithms
According to the results of the literature review, the traditional classification algorithms mainly include Cox regression and logistic regression and are characterized by early introduction time, simple principle, and early application. Figure 3F shows all of the classification algorithms implemented in the reviewed articles.
The Cox regression model is mainly used for survival analysis in medical follow-up studies. The basic form of Cox regression is shown in Formula (4). The dependent variables of this method include outcome variables and survival time variables. This method can analyze the influence of multiple factors on the survival time and does not require the estimation of the survival distribution type of data. Junchi Yang et al. (2018) [32] identified the prognosis-associated genes and clinical factors using Cox regression analysis, while the optimal prognosis-associated pathways were examined using the Cox-proportional hazards (Cox-PH) model. Finally, they suggested that the clinical-factor-based risk prediction model with improved p-values for prognosis prediction was superior to the pathway-based risk prediction model in predicting the prognosis of patients with GC.
where ,…, are the subjects of study (independent variables), ,…, are partial regression coefficients of the independent variables and the parameters to be estimated from the sample data, and is the baseline risk for when the vector is 0.
Logistic regression is a generalized linear model which combines the linear regression function with the Sigmoid function, takes the output of the linear regression function as the input of the Sigmoid function, and makes the final output value mapped in the interval [0,1] in the form of probability. The mathematical expressions of the Sigmoid function and the logistic regression model are shown in Formulas (5) and (6), respectively. Figure 6A shows the image of the Sigmoid function. Haejin In et al. (2018) [28] chose the logistic regression model as the final model using the highest ranked eight variables. The c-statistics based on the model were 0.942, 0.938, and 0.969, all at high levels. The independent variables in logistic regression can be continuous or categorical. The dependent variable can be binary or multiclass, but a binary classification is more commonly used and easier to interpret. Through logistic regression analysis, the weights of independent variables can be obtained to understand which factors are risk factors for GC, and the possibility of GC can be predicted according to the weights [18].
Similarities and differences: 1. both Cox regression and logistic regression can be used to screen influencing factors; 2. both have OR or RR values; 3. different dependent variables: the dependent variables of Cox regression are survival time and outcome, while the dependent variable of logistic regression is classified data; 4. logistic regression is essentially a special case of Cox regression; Cox regression can examine the survival function, whereas logistic regression cannot.
3.2.3. Mainstream of Machine-Learning Classification Algorithms
There are mainly three popular machine learning classification algorithms in the literature we investigated, namely random forests, support vector machine, and deep learning. These classification algorithms were proposed relatively late and have complicated logic but have been widely used in various fields recently.
Random forests (RF) was first proposed by Leo Breiman and Adele Cutler in 2001 and uses a Bagging-type ensemble algorithm to combine multiple weak classifiers. The final result is through voting or mean, so that the model results have high accuracy and generalization [166]. The schematic diagram of random forests is shown in Figure 6B. In support of the finding that the polygenic risk score (PRS) model of six SNPs is capable of predicting the risk of GC, RF analyses demonstrated that the combination of the six SNPs has a high predictive power for GC, with an AUC value of 0.75, which also verifies the high fitting ability of RF (Xiaoyu Wang et al. (2022) [23]). Among the current algorithms, random forests have excellent accuracy and fast training speed and can evaluate the importance of features. However, their performance in solving regression problems is not as good as that in classification problems, and they cannot control the internal operation of the model.
The support vector machine (SVM), proposed by Vladimir Vapnik in 1964, is a generalized linear classifier for binary classification according to supervised learning [167]. Tao Chen et al. (2019) [59] used the SVM to establish a lncRNA model consisting of 16 lncRNA features, of which accuracy was confirmed with an AUC of 0.976 (95%CI: 0.952 to 0.999) in the training cohort, as well as in the validation cohort with an AUC of 0.950 (95%CI: 0.889 to 0.999). The schematic diagram of the SVM is shown in Figure 6C.
Deep learning, proposed in 2006, is a new direction in the field of machine learning, which can use some forms of artificial neural network technology to independently construct basic rules based on sample data in the learning process [168]. The schematic diagram of the neural network is shown in Figure 6D. In contrast to the traditional shallow learning, deep learning emphasizes the depth of the model and usually has a multi-layer structure of hidden layer nodes. It also clarifies the importance of feature learning, which can better express the intrinsic information of data compared with the method of constructing features by manual rules. Zixin Han et al. (2022) [78] proposed a deep learning algorithm for human epidermal growth factor receptor 2 (HER2) quantification evaluation of GC, including a novel automatic HER2 scoring framework, which may be the first study to provide a deep learning quantification algorithm for HER2 scoring of GC to assist the pathologist’s diagnosis. Experimental results have demonstrated the effectiveness of their proposed method with an accuracy of 0.94 for the HER2 scoring prediction. In addition, deep learning has made many achievements in search technology, data mining, natural language processing, speech recognition, and other related fields, including the provision of new insights into cancer prognosis [169,170].
4. Discussion
To collect the predictive factors and methods used to build GC risk prediction models, we also included some prognostic models while sorting out the prediction models. Although the two types of models have different purposes, some predictive factors and methods used in the prognostic model still have certain reference and analysis value for the prediction model. Therefore, factors and methods that appear in a large number and can be used in the prognostic model are also included in the statistics. Finally, we divided the factors into five categories: demographic characteristics, clinical indicators, lifestyle habits, genetic factors, and omics data, which mainly included age, sex, race, Hp infection, tumor markers, PG, drinking alcohol, smoking, BMI, diet, GC family history, GC-related disease history, and omics. The prediction methods were divided into feature selection and classification, and six methods of feature selection were summarized: LASSO, MDR, Pearson/Spearman correlation coefficient, GSEA, and WGCNA. Five algorithms for classification were summarized: Cox, LR, RF, SVM, and DL.
4.1. Selection of Predictive Factors
In predictive factor induction, we extracted radiomics from omics and analyzed them separately because of the importance and inapplicability of radiomics. As a kind of intuitive data, radiomics can achieve high accuracy of diagnosis whether through manual diagnosis or AI-assisted diagnosis. In view of the high demand for equipment and the damage to the human body caused by radiation, this diagnostic method should only be used as a final measure, rather than a risk prediction model for large-scale screening. Therefore, we believe that radiomics has no significance for constructing the GC risk prediction model. As for the other factors analyzed above, they should be collected as completely as possible.
4.2. Selection of Prediction Methods
We found that, for prognostic models, some studies adopted the “LASSO-Cox” survival analysis mode, i.e., using multivariate LASSO regression followed by univariate Cox regression. For example, Yuming Jiang et al. (2018) [79] used the LASSO-Cox regression model to select radiomics features in 228 patients. In addition, some studies first screened relevant variables by univariate Cox analysis and then constructed multivariate models to confirm the association between variables and survival. Indeed, Yang, Y et al. (2021) [18] successively adopted the combination of univariate analysis and multi-factor LR analysis to determine the independent impact factors of GC. Of these two methods, we prefer the former because the latter does not take into account the effect of multicollinearity between variables. Sometimes the hazard ratios obtained from univariate Cox analysis and multivariate regression are contradictory, which is the result of model distortion due to multicollinearity between the variables. Moreover, when the number of variables is larger than or close to the sample size, such as when screening for genes that affect prognosis [171], the number of candidate variables may far exceed the sample size. At this time, the stepwise regression method, forward method, backward method, and other variable screening methods of traditional Cox regression are no longer applicable, but LASSO can solve the collinearity problem well. Therefore, when there is multicollinearity between variables or the number of candidate variables is larger than the sample size, the survival analysis mode of LASSO-Cox is recommended.
Although Cox regression is the most popular method in the studies we investigated, this method is not suitable for GC risk prediction models. The popularity of Cox regression is largely down to the articles we investigated including studies on prognostic models that usually obtain the exact occurrence time of gastric disease progression. Obviously, the GC risk prediction model cannot obtain this information in advance. Therefore, Cox regression is suitable for prognosis but not for risk prediction. In fact, LR is probably the most frequently used algorithm for building GC risk prediction models.
The construction of the GC risk prediction model should not only be limited to the above conventional classification algorithms. To improve the model fitting ability, we should pay more attention to the research progress in the fields of algorithms and try using the algorithms with higher performance. One such example is XGBoost, a classification method that has won numerous prizes in data analysis competitions [172]. Using hundreds of classification and regression trees (CART), XGBoost can learn nonlinear relationships between input variables and outcomes in an ensemble fashion. Thus far, it has been proven that XGBoost is superior to logistic regression in GC risk classification [173]. Another example is neural networks. There are many variants of neural networks in DL. Although the common CNN is mostly used for image recognition, it lacks the ability to be spatially invariant to the input data. By contrast, artificial neural networks (ANN) transmit information one way through input nodes, which is easier to interpret [174]. In addition, more methods have been proposed to analyze the importance of variables in the model, which greatly improves the interpretability of the model and makes the selection range of the model more extensive. However, data-driven prediction models may ignore the role of features with low correlation and high discrimination. Therefore, the method of multi-instance feature-level fusion to provide some features with high weights may solve this problem and make the prediction model more convincing [175,176].
4.3. Collection and Partition of Datasets
According to statistics, the sample size used to build the model is mostly within 2000 and is generally above 300, and only a few can reach tens of thousands of samples. There is no upper limit on the sample size for model construction, with a larger sample size being associated with a higher degree of model generalization. Although most studies or institutions have some difficulty in collecting samples, the sample size should not be too small; otherwise, the model will be prone to underfitting or overfitting, which will eventually affect the actual prediction effect of the model. Samples are usually divided into three categories: training set, verification set, and test set. The model generates constraint rules by learning the training sets. The verification set is the same source as the training set, which is used to determine the network structure or the hyperparameter to control the complexity of the model and is the preliminary evaluation of the model. The test set does not participate in model training and is not used as the basis for algorithms such as parameter adjustment and feature selection; instead, it is only used to evaluate the final performance of the model. The common proportion of the three is 60%, 20%, and 20%. In addition, it is desirable that the test set and the training set are not from the same source (external verification). Only internal verification tends to be limited by a single sample, and the model may not have external validity [13].
4.4. Criteria for Evaluating the Model Performance
The reliability of the newly constructed model needs fair and comprehensive evaluation criteria. We found that most studies mainly chose the AUC value or C-index as the indicator to evaluate the model after building the model, and a few studies did not provide those but only evaluated the model with accuracy, sensitivity, or specificity, which are both one-sided. Although the AUC value (or C-index) can reflect sensitivity and specificity, it is not sensitive to whether the samples are balanced [177,178]. Using the idea of the limit method, if the number of positive and negative examples in the sample is seriously unbalanced, the model is judged as all positive or all negative examples without distinction. Although the accuracy rate can still reach a high level, one of sensitivity and specificity will be inaccurate. Such a model is meaningless. Therefore, it is difficult to confirm whether the model is reliable based on the above indicators alone. The most direct and effective way is to calculate the 95% CI or variance, in addition to AUC or C-index, and introduce a confusion matrix [179] that shows the values for each partition, or AUC/C-index as the main evaluation standard, supplemented by sensitivity, specificity, and F1-score as the common evaluation standard. Both of these methods can evaluate a binary model perfectly.
4.5. Ethical Limitations of Model Application
Considering the ethical issues of model application, misdiagnosis is an inevitable situation [180]. Generally, the consequences of misdiagnosing a positive patient are more serious than misdiagnosing a healthy person. To minimize the consequences of misdiagnosis, the selection of the model threshold should be adjusted appropriately in clinical application, so that the total accuracy rate can be maintained at a high level, while some specificity should be sacrificed to improve sensitivity as much as possible. In addition, it is recommended to take further examination measures for the population diagnosed as high-risk, including high-specificity methods such as endoscopy and biopsy.
However, despite the gradual popularization of AI in life and the continuous improvement of people’s acceptance of AI, it is still unclear to conclude whether people can accept and trust the large-scale screening of GC risk prediction models, and it is uncertain who is responsible for the misdiagnosis or wrong treatment after patients receive a diagnosis of AI. In addition, it is difficult to make targeted recommendations for secondary examination without a clinical-level explanation and evaluation of the results by physicians. Despite these challenges, GC risk prediction models are still of great significance for improving GC large-scale screening methods and, even if AI will not completely replace doctors, the collaborative work of humans and machines is an ideal mode to improve efficiency.
5. Conclusions
In conclusion, the construction of a GC risk prediction model with high accuracy can greatly change the current situation of GC initial diagnosis. Our survey summarizes the predictive factors and methods used to construct GC risk prediction models and provides suggestions on the model construction process and evaluation criteria, with the aim to improve the GC risk assessment mechanism and create an efficient and convenient GC large-scale screening method. Although individual factors and methods need to be further studied and explained and given that the strategies for matching methods for each step are not the same, in general, under the condition of rigorous multi-factor and single-factor analysis, large number of sample fitting, and perfect evaluation rules, the combination of integrated GC-related factors and avant-garde machine learning model can effectively improve the prediction level and explanatory ability of the GC risk prediction model. The high-precision prediction level and the strong logical explanation ability are the necessary conditions to break through the ethical limitations. Here, doctors may benefit the most. It is expected that, with the gradual improvement in the GC risk prediction model, AI-assisted doctor diagnosis will be gradually popularized and, in the future, the late-stage rate of initial diagnosis of GC in patients will be greatly reduced.
Supplementary Materials
The following supporting information can be downloaded at: https://www.mdpi.com/article/10.3390/pr11082324/s1, Table S1: Application of AI in GC detection.
Author Contributions
Conceptualization, writing—review and editing, R.H.; validation and supervision, W.M.; writing—original draft preparation, Z.F. and Z.H. All authors have read and agreed to the published version of the manuscript.
Funding
This research was funded by the National Natural Science Foundation of China (No. 82002242).
Data Availability Statement
Data sharing not applicable.
Conflicts of Interest
The authors declare no conflict of interest.
References
- Sung, H.; Ferlay, J.; Siegel, R.L.; Laversanne, M.; Soerjomataram, I.; Jemal, A.; Bray, F. Global cancer statistics 2020: Globocan estimates of incidence and mortality worldwide for 36 cancers in 185 countries. CA A Cancer J. Clin. 2021, 71, 209–249. [Google Scholar] [CrossRef] [PubMed]
- Fan, Z.Y.; Guo, Y.X.; Gu, X.R.; Huang, R.R.; Miao, W.J. Development and validation of an artificial neural network model for non-invasive gastric cancer screening and diagnosis. Sci. Rep. 2022, 12, 21795. [Google Scholar] [CrossRef]
- Pan, Y.Y.; Fu, H.; Jiang, X.W.; Zhu, M. A systematic review of the main predictors of gastric cancer risk prediction models. Jiangsu J. Prev. Med. 2021, 32, 689–692. [Google Scholar] [CrossRef]
- Ajani, J.A.; D’Amico, T.A.; Bentrem, D.J.; Chao, J.; Cooke, D.; Corvera, C.; Das, P.; Enzinger, P.C.; Enzler, T.; Fanta, P.; et al. Gastric Cancer, Version 2.2022, Nccn Clinical Practice Guidelines in Oncology. J. Natl. Compr. Cancer Netw. JNCCN 2022, 20, 167–192. [Google Scholar] [CrossRef]
- Seeneevassen, L.; Bessède, E.; Mégraud, F.; Lehours, P.; Dubus, P.; Varon, C. Gastric Cancer: Advances in Carcinogenesis Research and New Therapeutic Strategies. Int. J. Mol. Sci. 2021, 22, 3418. [Google Scholar] [CrossRef]
- Li, L.; Chen, Y.; Shen, Z.; Zhang, X.; Sang, J.; Ding, Y.; Yang, X.; Li, J.; Chen, M.; Jin, C.; et al. Convolutional neural network for the diagnosis of early gastric cancer based on magnifying narrow band imaging. Gastric Cancer 2020, 23, 126–132. [Google Scholar] [CrossRef] [PubMed] [Green Version]
- Holdbrook, D.A.; Singh, M.; Choudhury, Y.; Kalaw, E.M.; Koh, V.; Tan, H.S.; Kanesvaran, R.; Tan, P.H.; Peng, J.Y.S.; Tan, M.H.; et al. Automated Renal Cancer Grading Using Nuclear Pleomorphic Patterns. JCO Clin. Cancer Inform. 2018, 2, 1–12. [Google Scholar] [CrossRef]
- Hashimoto, D.A.; Rosman, G.; Rus, D.; Meireles, O.R. Artificial Intelligence in Surgery: Promises and Perils. Ann. Surg. 2018, 268, 70–76. [Google Scholar] [CrossRef]
- Wong, P.K.; Chan, I.N.; Yan, H.M.; Gao, S.; Wong, C.H.; Yan, T.; Yao, L.; Hu, Y.; Wang, Z.R.; Yu, H.H. Deep learning based radiomics for gastrointestinal cancer diagnosis and treatment: A minireview. World J. Gastroenterol. 2022, 28, 6363–6379. [Google Scholar] [CrossRef]
- Jin, P.; Ji, X.Y.; Kang, W.Z.; Li, Y.; Liu, H.; Ma, F.H.; Ma, S.; Hu, H.T.; Li, W.K.; Tian, Y.T. Artificial intelligence in gastric cancer: A systematic review. J. Cancer Res. Clin. Oncol. 2020, 146, 2339–2350. [Google Scholar] [CrossRef]
- Sgourakis, G.; Gockel, I.; Lang, H. Endoscopic and surgical resection of T1a/T1b esophageal neoplasms: A systematic review. World J. Gastroenterol. 2013, 19, 1424–1437. [Google Scholar] [CrossRef] [PubMed]
- Page, M.J.; Moher, D.; Bossuyt, P.M.; Boutron, I.; Hoffmann, T.C.; Mulrow, C.D.; Shamseer, L.; Tetzlaff, J.M.; Akl, E.A.; Brennan, S.E.; et al. PRISMA 2020 explanation and elaboration: Updated guidance and exemplars for reporting systematic reviews. BMJ (Clin. Res. Ed.) 2021, 372, n160. [Google Scholar] [CrossRef]
- Iida, M.; Ikeda, F.; Hata, J.; Hirakawa, Y.; Ohara, T.; Mukai, N.; Yoshida, D.; Yonemoto, K.; Esaki, M.; Kitazono, T.; et al. Development and validation of a risk assessment tool for gastric cancer in a general Japanese population. Gastric Cancer 2018, 21, 383–390. [Google Scholar] [CrossRef] [PubMed]
- Zhi, S.; Yang, B.; Zhou, S.; Tan, J.; Zhong, G.; Han, F. Immune-Related LncRNAs to Construct a Prognosis Risk-Assessment Model for Gastric Cancer. Curr. Oncol. 2022, 29, 4923–4935. [Google Scholar] [CrossRef] [PubMed]
- Xu, W.; Ma, Q.; Wang, L.; He, C.; Lu, S.; Ni, Z.; Hua, Z.; Zhu, Z.; Yang, Z.; Zheng, Y.; et al. Prediction Model of Tumor Regression Grade for Advanced Gastric Cancer After Preoperative Chemotherapy. Front. Oncol. 2021, 11, 607640. [Google Scholar] [CrossRef]
- Zhang, X.; Hu, D.; Deng, X.; Lin, J.; Zheng, X.; Peng, F.; Meng, F.; Niu, W. Prediction of presurgical metabolic syndrome for gastric cancer-specific mortality is more evident in smokers: The FIESTA study. Cancer Med. 2023, 12, 3419–3432. [Google Scholar] [CrossRef] [PubMed]
- Jin, Y.; Xu, Y.; Li, Y.; Chen, R.; Cai, W. Integrative Radiogenomics Approach for Risk Assessment of Postoperative and Adjuvant Chemotherapy Benefits for Gastric Cancer Patients. Front. Oncol. 2021, 11, 755271. [Google Scholar] [CrossRef]
- Yang, Y.; Long, Z.; Zhong, Z.M.; Liu, Q.; Yang, X. Construction and Evaluation of Gastric Cancer Risk Prediction Model. Indian J. Pharm. Sci. 2021, 83, 112–118. [Google Scholar] [CrossRef]
- Duan, F.; Song, C.; Wang, P.; Ye, H.; Dai, L.; Zhang, J.; Wang, K. Polygenic Risk Scores for Prediction of Gastric Cancer Based on Bioinformatics Screening and Validation of Functional lncRNA SNPs. Clin. Transl. Gastroenterol. 2021, 12, e00430. [Google Scholar] [CrossRef]
- Ishikura, N.; Ito, H.; Oze, I.; Koyanagi, Y.N.; Kasugai, Y.; Taniyama, Y.; Kawakatsu, Y.; Tanaka, T.; Ito, S.; Tajika, M.; et al. Risk Prediction for Gastric Cancer Using GWAS-Identifie Polymorphisms, Helicobacter pylori Infection and Lifestyle-Related Risk Factors in a Japanese Population. Cancers 2021, 13, 5525. [Google Scholar] [CrossRef]
- Charvat, H.; Sasazuki, S.; Inoue, M.; Iwasaki, M.; Sawada, N.; Shimazu, T.; Yamaji, T.; Tsugane, S.; JPHC Study Group. Prediction of the 10-year probability of gastric cancer occurrence in the Japanese population: The JPHC study cohort II. Int. J. Cancer 2016, 138, 320–331. [Google Scholar] [CrossRef] [PubMed] [Green Version]
- Wang, H.; Wu, X.; Chen, Y. Stromal-Immune Score-Based Gene Signature: A Prognosis Stratification Tool in Gastric Cancer. Front. Oncol. 2019, 9, 1212. [Google Scholar] [CrossRef] [PubMed] [Green Version]
- Wang, X.Y.; Wang, L.L.; Liang, S.Z.; Yang, C.; Xu, L.; Yu, M.C.; Wang, Y.X.; Dong, Q.J. Prediction of gastric cancer risk by a polygenic risk score of Helicobacter pylori. World J. Gastrointest. Oncol. 2022, 14, 1844–1855. [Google Scholar] [CrossRef] [PubMed]
- Sun, M.Y.; Qiu, J.P.; Zhai, H.Z.; Wang, Y.Q.; Ma, P.P.; Li, M.Y.; Chen, B. Prognostic Implications of Novel Gene Signatures in Gastric Cancer Microenvironment. Med. Sci. Monit. 2020, 26, e924604. [Google Scholar] [CrossRef] [PubMed]
- Briggs, E.; de Kamps, M.; Hamilton, W.; Johnson, O.; McInerney, C.D.; Neal, R.D. Machine Learning for Risk Prediction of Oesophago-Gastric Cancer in Primary Care: Comparison with Existing Risk-Assessment Tools. Cancers 2022, 14, 5023. [Google Scholar] [CrossRef] [PubMed]
- Cao, M.M.; Li, H.; Sun, D.Q.; Lei, L.; Ren, J.S.; Shi, J.F.; Li, N.; Peng, J.; Chen, W.Q. Classifying risk level of gastric cancer: Evaluation of questionnaire-based prediction model. Chin. J. Cancer Res. 2020, 32, 605–613. [Google Scholar] [CrossRef]
- Park, B.; Yang, S.; Lee, J.; Choi, I.J.; Kim, Y.-I.; Kim, J. Gastric Cancer Risk Prediction Using an Epidemiological Risk Assessment Model and Polygenic Risk Score. Cancers 2021, 13, 876. [Google Scholar] [CrossRef]
- In, H.; Langdon-Embry, M.; Gordon, L.; Schechter, C.B.; Wylie-Rosett, J.; Castle, P.E.; Margaret Kemeny, M.; Rapkin, B.D. Can a gastric cancer risk survey identify high-risk patients for endoscopic screening? A pilot study. J. Surg. Res. 2018, 227, 246–256. [Google Scholar] [CrossRef] [Green Version]
- Mahmoodi, S.A.; Mirzaie, K.; Mahmoodi, M.S.; Mahmoudi, S.M. A Medical Decision Support System to Assess Risk Factors for Gastric Cancer Based on Fuzzy Cognitive Map. Comput. Math. Methods Med. 2020, 2020, 1016284. [Google Scholar] [CrossRef]
- Zhang, L.; Dong, D.; Zhang, W.; Hao, X.; Fang, M.; Wang, S.; Li, W.; Liu, Z.; Wang, R.; Zhou, J.; et al. A deep learning risk prediction model for overall survival in patients with gastric cancer: A multicenter study. Radiother. Oncol. 2020, 150, 73–80. [Google Scholar] [CrossRef]
- Kumar, S.; Huang, J.; Abbassi-Ghadi, N.; Mackenzie, H.A.; Veselkov, K.A.; Hoare, J.M.; Lovat, L.B.; Španel, P.; Smith, D.; Hanna, G.B. Mass Spectrometric Analysis of Exhaled Breath for the Identification of Volatile Organic Compound Biomarkers in Esophageal and Gastric Adenocarcinoma. Ann. Surg. 2015, 262, 981–990. [Google Scholar] [CrossRef]
- Yang, J.C.; Bo, L.M.; Han, T.; Ding, D.; Nie, M.M.; Yin, K. Pathway- and clinical-factor-based risk model predicts the prognosis of patients with gastric cancer. Mol. Med. Rep. 2018, 17, 6345–6356. [Google Scholar] [CrossRef]
- Li, T.D.; Chen, X.; Gu, M.L.; Deng, A.M.; Qian, C. Identification of the subtypes of gastric cancer based on DNA methylation and the prediction of prognosis. Clin. Epigenetics 2020, 12, 161. [Google Scholar] [CrossRef] [PubMed]
- Xie, S.H.; Lagergren, J. A model for predicting individuals’ absolute risk of esophageal adenocarcinoma: Moving toward tailored screening and prevention. Int. J. Cancer 2016, 138, 2813–2819. [Google Scholar] [CrossRef] [PubMed] [Green Version]
- Hou, C.; Yin, F.X.; Liu, Y.P. Developing and validating nomograms for predicting the survival in patients with clinical local-advanced gastric cancer. Front. Oncol. 2022, 12, 1039498. [Google Scholar] [CrossRef] [PubMed]
- Zhang, L.X.; Zhou, B.C.; Luo, P.Q.; Xu, A.; Han, W.X.; Wei, Z.J. A model established using marital status and other factors from the Surveillance, Epidemiology, and End Results database for early stage gastric cancer. J. Investig. Med. 2022, 70, 1373–1380. [Google Scholar] [CrossRef]
- Liu, Q.F.; Li, J.R.; Xin, B.W.; Sun, Y.Y.; Feng, D.G.; Fulham, M.J.J.; Wang, X.Y.; Song, S.L. F-18-FDG PET/CT Radiomics for Preoperative Prediction of Lymph Node Metastases and Nodal Staging in Gastric Cancer. Front. Oncol. 2021, 11, 723345. [Google Scholar] [CrossRef]
- Haga, Y.; Hato, S.; Ikenaga, M.; Yamamoto, K.; Tsuburaya, A.; Doi, K.; Ikejiri, K.; Hirata, T.; Yamamoto, M.; Ishikawa, S.; et al. Validation of an assessment tool: Estimation of Postoperative Overall Survival for Gastric Cancer. Eur. J. Surg. Oncol. 2018, 44, 515–523. [Google Scholar] [CrossRef]
- Gao, L.; Xue, J.; Liu, X.M.; Cao, L.; Wang, R.F.; Lei, L.L. A risk model based on autophagy-related lncRNAs for predicting prognosis and efficacy of immunotherapy and chemotherapy in gastric cancer patients. Aging 2021, 13, 25453–25465. [Google Scholar] [CrossRef]
- Yang, Y.; Chen, Z.F.; Zhou, L.S.; Wu, G.Z.; Ma, X.M.; Zheng, Y.; Liu, M.; Wang, Y.P.; Ji, R.; Guo, Q.H.; et al. In silico development and validation of a novel glucose and lipid metabolism-related gene signature in gastric cancer. Transl. Cancer Res. 2022, 11, 1977–1993. [Google Scholar] [CrossRef]
- Lee, T.Y.; Wang, C.B.; Chen, T.T.; Kuo, K.N.; Wu, M.S.; Lin, J.T.; Wu, C.Y.; Taiwan Gastrointestinal, D.; Heli. A Tool to Predict Risk for Gastric Cancer in Patients With Peptic Ulcer Disease on the Basis of a Nationwide Cohort. Clin. Gastroenterol. Hepatol. 2015, 13, 287-U108. [Google Scholar] [CrossRef]
- Liu, Y.F.; Wu, J.H.; Huang, W.W.; Weng, S.W.; Wang, B.C.; Chen, Y.M.; Wang, H. Development and validation of a hypoxia-immune-based microenvironment gene signature for risk stratification in gastric cancer. J. Transl. Med. 2020, 18, 201. [Google Scholar] [CrossRef] [PubMed]
- Bai, F.; Xiao, K. Prediction of gastric cancer risk: Association between ZBTB20 genetic variance and gastric cancer risk in Chinese Han population. Biosci. Rep. 2020, 40, BSR20202102. [Google Scholar] [CrossRef]
- Wang, P.; Shi, B.; Wen, Y.; Tang, X. Establishment of Combination of Syndrome and Disease Risk Predicting Model for Precancerous Lesion of Gastric Cancer. Chin. J. Integr. Tradit. West. Med. 2018, 38, 773–778. [Google Scholar]
- Wang, X.; Chen, Y.; Gao, Y.; Zhang, H.; Guan, Z.; Dong, Z.; Zheng, Y.; Jiang, J.; Yang, H.; Wang, L.; et al. Predicting gastric cancer outcome from resected lymph node histopathology images using deep learning. Nat. Commun. 2021, 12, 1637. [Google Scholar] [CrossRef]
- D’Journo, X.B.; Boulate, D.; Fourdrain, A.; Loundou, A.; van Berge Henegouwen, M.I.; Gisbertz, S.S.; O’Neill, J.R.; Hoelscher, A.; Piessen, G.; van Lanschot, J.; et al. Risk Prediction Model of 90-Day Mortality After Esophagectomy for Cancer. JAMA Surg. 2021, 156, 836–845. [Google Scholar] [CrossRef] [PubMed]
- Zhu, M.; Ma, Z.; Zhang, X.; Hang, D.; Yin, R.; Feng, J.; Xu, L.; Shen, H. C-reactive protein and cancer risk: A pan-cancer study of prospective cohort and Mendelian randomization analysis. BMC Med. 2022, 20, 301. [Google Scholar] [CrossRef] [PubMed]
- Wang, J.; Wang, B.; Zhou, B.; Chen, J.; Qi, J.; Shi, L.; Yu, S.; Chen, G.; Kang, M.; Jin, X.; et al. A novel immune-related lncRNA pair signature for prognostic prediction and immune response evaluation in gastric cancer: A bioinformatics and biological validation study. Cancer Cell Int. 2022, 22, 69. [Google Scholar] [CrossRef]
- Chen, X.; Zhang, D.; Jiang, F.; Shen, Y.; Li, X.; Hu, X.; Wei, P.; Shen, X. Prognostic Prediction Using a Stemness Index-Related Signature in a Cohort of Gastric Cancer. Front. Mol. Biosci. 2020, 7, 570702. [Google Scholar] [CrossRef]
- Zheng, H.; Liu, H.; Li, H.; Dou, W.; Wang, X. Weighted Gene Co-expression Network Analysis Identifies a Cancer-Associated Fibroblast Signature for Predicting Prognosis and Therapeutic Responses in Gastric Cancer. Front. Mol. Biosci. 2021, 8, 744677. [Google Scholar] [CrossRef]
- Lin, Z.; Wang, R.; Zhou, Y.; Wang, Q.; Yang, C.Y.; Hao, B.C.; Ke, C.F. Prediction of distant metastasis and survival prediction of gastric cancer patients with metastasis to the liver, lung, bone, and brain: Research based on the SEER database. Ann. Transl. Med. 2022, 10, 16. [Google Scholar] [CrossRef]
- Praud, D.; Rota, M.; Pelucchi, C.; Bertuccio, P.; Rosso, T.; Galeone, C.; Zhang, Z.F.; Matsuo, K.; Ito, H.; Hu, J.; et al. Cigarette smoking and gastric cancer in the Stomach Cancer Pooling (StoP) Project. Eur. J. Cancer Prev. 2018, 27, 124–133. [Google Scholar] [CrossRef] [PubMed]
- Pietrantonio, F.; Miceli, R.; Raimondi, A.; Kim, Y.W.; Kang, W.K.; Langley, R.E.; Choi, Y.Y.; Kim, K.M.; Nankivell, M.G.; Morano, F.; et al. Individual Patient Data Meta-Analysis of the Value of Microsatellite Instability as a Biomarker in Gastric Cancer. J. Clin. Oncol. 2019, 37, 3392–3400. [Google Scholar] [CrossRef] [PubMed]
- Huang, S.; Guo, Y.; Li, Z.W.; Shui, G.; Tian, H.; Li, B.W.; Kadeerhan, G.; Li, Z.X.; Li, X.; Zhang, Y.; et al. Identification and Validation of Plasma Metabolomic Signatures in Precancerous Gastric Lesions That Progress to Cancer. JAMA Netw. Open 2021, 4, e2114186. [Google Scholar] [CrossRef] [PubMed]
- Png, C.W.; Lee, W.J.J.; Chua, S.J.; Zhu, F.; Yeoh, K.G.; Zhang, Y. Mucosal microbiome associates with progression to gastric cancer. Theranostics 2022, 12, 48–58. [Google Scholar] [CrossRef] [PubMed]
- van den Boorn, H.G.; Abu-Hanna, A.; Ter Veer, E.; van Kleef, J.J.; Lordick, F.; Stahl, M.; Ajani, J.A.; Guimbaud, R.; Park, S.H.; Dutton, S.J.; et al. SOURCE: A Registry-Based Prediction Model for Overall Survival in Patients with Metastatic Oesophageal or Gastric Cancer. Cancers 2019, 11, 187. [Google Scholar] [CrossRef] [Green Version]
- Jiang, F.; Chen, X.; Shen, Y.; Shen, X. Identification and Validation of an m6A Modification of JAK-STAT Signaling Pathway-Related Prognostic Prediction Model in Gastric Cancer. Front. Genet. 2022, 13, 891744. [Google Scholar] [CrossRef]
- Lei, L.; Li, N.; Yuan, P.; Liu, D. A new risk model based on a 11-m(6)A-related lncRNA signature for predicting prognosis and monitoring immunotherapy for gastric cancer. BMC Cancer 2022, 22, 365. [Google Scholar] [CrossRef]
- Chen, T.; Zhang, C.; Liu, Y.; Zhao, Y.; Lin, D.; Hu, Y.; Yu, J.; Li, G. A gastric cancer LncRNAs model for MSI and survival prediction based on support vector machine. BMC Genom. 2019, 20, 846. [Google Scholar] [CrossRef] [Green Version]
- Guan, K.; Liu, X.; Li, J.; Ding, Y.; Li, J.; Cui, G.; Cui, X.; Sun, R. Expression Status And Prognostic Value Of M6A-associated Genes in Gastric Cancer. J. Cancer 2020, 11, 3027–3040. [Google Scholar] [CrossRef] [Green Version]
- Cui, Y.; Zhang, J.; Li, Z.; Wei, K.; Lei, Y.; Ren, J.; Wu, L.; Shi, Z.; Meng, X.; Yang, X.; et al. A CT-based deep learning radiomics nomogram for predicting the response to neoadjuvant chemotherapy in patients with locally advanced gastric cancer: A multicenter cohort study. EClinicalMedicine 2022, 46, 101348. [Google Scholar] [CrossRef]
- Lee, I.S.; Lee, H.; Hur, H.; Kanda, M.; Yook, J.H.; Kim, B.S.; Woo, Y.; Kodera, Y.; Kim, K.; Goel, A. Transcriptomic Profiling Identifies a Risk Stratification Signature for Predicting Peritoneal Recurrence and Micrometastasis in Gastric Cancer. Clin. Cancer Res. Off. J. Am. Assoc. Cancer Res. 2021, 27, 2292–2300. [Google Scholar] [CrossRef] [PubMed]
- Sohn, B.H.; Hwang, J.E.; Jang, H.J.; Lee, H.S.; Oh, S.C.; Shim, J.J.; Lee, K.W.; Kim, E.H.; Yim, S.Y.; Lee, S.H.; et al. Clinical Significance of Four Molecular Subtypes of Gastric Cancer Identified by The Cancer Genome Atlas Project. Clin. Cancer Res. 2017, 23, 4441–4449. [Google Scholar] [CrossRef] [Green Version]
- Cai, W.Y.; Dong, Z.N.; Fu, X.T.; Lin, L.Y.; Wang, L.; Ye, G.D.; Luo, Q.C.; Chen, Y.C. Identification of a Tumor Microenvironment-relevant Gene set-based Prognostic Signature and Related Therapy Targets in Gastric Cancer. Theranostics 2020, 10, 8633–8647. [Google Scholar] [CrossRef] [PubMed]
- Bai, Y.; Wei, C.; Zhong, Y.; Zhang, Y.; Long, J.; Huang, S.; Xie, F.; Tian, Y.; Wang, X.; Zhao, H. Development and Validation of a Prognostic Nomogram for Gastric Cancer Based on DNA Methylation-Driven Differentially Expressed Genes. Int. J. Biol. Sci. 2020, 16, 1153–1165. [Google Scholar] [CrossRef]
- Wang, Y.; Wang, Y.G.; Hu, C.; Li, M.; Fan, Y.; Otter, N.; Sam, I.; Gou, H.; Hu, Y.; Kwok, T.; et al. Cell graph neural networks enable the precise prediction of patient survival in gastric cancer. NPJ Precis. Oncol. 2022, 6, 45. [Google Scholar] [CrossRef] [PubMed]
- Zhang, C.; Li, D.; Yu, R.; Li, C.; Song, Y.; Chen, X.; Fan, Y.; Liu, Y.; Qu, X. Immune Landscape of Gastric Carcinoma Tumor Microenvironment Identifies a Peritoneal Relapse Relevant Immune Signature. Front. Immunol. 2021, 12, 651033. [Google Scholar] [CrossRef] [PubMed]
- Xue, S.; Zheng, T.; Yan, J.; Ma, J.; Lin, C.; Dong, S.; Wei, C.; Li, T.; Zhang, X.; Li, G. Identification of a 3-Gene Model as Prognostic Biomarker in Patients With Gastric Cancer. Front. Oncol. 2022, 12, 930586. [Google Scholar] [CrossRef]
- Zhou, L.; Li, S.H.; Wu, Y.; Xin, L. Establishment of a prognostic model of four genes in gastric cancer based on multiple data sets. Cancer Med. 2021, 10, 3309–3322. [Google Scholar] [CrossRef]
- Chen, J.; Zhou, C.; Liu, Y. Establishing a cancer driver gene signature-based risk model for predicting the prognoses of gastric cancer patients. Aging 2022, 14, 2383–2399. [Google Scholar] [CrossRef]
- Feng, B.; Huang, L.; Liu, Y.; Chen, Y.; Zhou, H.; Yu, T.; Xue, H.; Chen, Q.; Zhou, T.; Kuang, Q.; et al. A Transfer Learning Radiomics Nomogram for Preoperative Prediction of Borrmann Type IV Gastric Cancer From Primary Gastric Lymphoma. Front. Oncol. 2021, 11, 802205. [Google Scholar] [CrossRef]
- Wang, S.; Ye, F.; Sheng, Y.; Yu, W.; Liu, Y.; Liu, D.; Zhang, K. Development and Validation of Nomograms to Predict Operative Link for Gastritis Assessment Any-Stage and Stages III-IV in the Chinese High-Risk Gastric Cancer Population. Front. Med. 2021, 8, 724566. [Google Scholar] [CrossRef] [PubMed]
- Li, J.; Pu, K.; Li, C.; Wang, Y.; Zhou, Y. A Novel Six-Gene-Based Prognostic Model Predicts Survival and Clinical Risk Score for Gastric Cancer. Front. Genet. 2021, 12, 615834. [Google Scholar] [CrossRef]
- Zhang, Y.; Li, H.; Zhang, W.; Che, Y.; Bai, W.; Huang, G. LASSO-based Cox-PH model identifies an 11-lncRNA signature for prognosis prediction in gastric cancer. Mol. Med. Rep. 2018, 18, 5579–5593. [Google Scholar] [CrossRef] [PubMed] [Green Version]
- Qiu, L.; Qu, X.; He, J.; Cheng, L.; Zhang, R.; Sun, M.; Yang, Y.; Wang, J.; Wang, M.; Zhu, X.; et al. Predictive model for risk of gastric cancer using genetic variants from genome-wide association studies and high-evidence meta-analysis. Cancer Med. 2020, 9, 7310–7316. [Google Scholar] [CrossRef]
- Gao, B.; Feng, C.; Chai, F.; Wei, S.; Hong, N.; Ye, Y.; Wang, Y.; Cheng, J. CT-detected extramural venous invasion-related gene signature for the overall survival prediction in patients with gastric cancer. Cancer Med. 2021, 10, 7816–7830. [Google Scholar] [CrossRef] [PubMed]
- Luo, D.; Yang, Q.; Wang, H.; Tan, M.; Zou, Y.; Liu, J. A predictive model for assessing prognostic risks in gastric cancer patients using gene expression and methylation data. BMC Med. Genom. 2021, 14, 14. [Google Scholar] [CrossRef]
- Han, Z.; Lan, J.; Wang, T.; Hu, Z.; Huang, Y.; Deng, Y.; Zhang, H.; Wang, J.; Chen, M.; Jiang, H.; et al. A Deep Learning Quantification Algorithm for HER2 Scoring of Gastric Cancer. Front. Neurosci. 2022, 16, 877229. [Google Scholar] [CrossRef] [PubMed]
- Jiang, Y.; Chen, C.; Xie, J.; Wang, W.; Zha, X.; Lv, W.; Chen, H.; Hu, Y.; Li, T.; Yu, J.; et al. Radiomics signature of computed tomography imaging for prediction of survival and chemotherapeutic benefits in gastric cancer. EBioMedicine 2018, 36, 171–182. [Google Scholar] [CrossRef] [Green Version]
- Sun, Z.; Chen, H.; Han, Z.; Huang, W.; Hu, Y.; Zhao, M.; Lin, T.; Yu, J.; Liu, H.; Jiang, Y.; et al. Genomics Score Based on Genome-Wide Network Analysis for Prediction of Survival in Gastric Cancer: A Novel Prognostic Signature. Front. Genet. 2020, 11, 835. [Google Scholar] [CrossRef]
- Gu, C.; Xie, L.; Li, B.; Zhang, L.; Li, F.; Wang, W.; Su, J.; Xu, Z. Quantification of Tumor Abnormal Proteins in the Diagnosis and Postoperative Prognostic Evaluation of Gastric Cancer. Clin. Med. Insights Oncol. 2022, 16, 11795549221104440. [Google Scholar] [CrossRef] [PubMed]
- Zhu, X.; Lv, J.; Zhu, M.; Yan, C.W.; Deng, B.; Yu, C.Q.; Guo, Y.; Ni, J.; She, Q.; Wang, T.P.; et al. Development, validation, and evaluation of a risk assessment tool for personalized screening of gastric cancer in Chinese populations. BMC Med. 2023, 21, 159. [Google Scholar] [CrossRef] [PubMed]
- Murphy, J.D.; Epplein, M.; Lin, F.-C.; Troester, M.A.; Nichols, H.B.; Butt, J.; Pan, K.; You, W.; Olshan, A. Discrimination between Precancerous Gastric Lesions and Gastritis Using a Gastric Cancer Risk Stratification Model. Asian Pac. J. Cancer Prev. APJCP 2023, 24, 935–943. [Google Scholar] [CrossRef] [PubMed]
- Yu, C.; Zhang, Y. Development and validation of prognostic nomogram for young patients with gastric cancer. Ann. Transl. Med. 2019, 7, 641. [Google Scholar] [CrossRef] [PubMed]
- Zhang, Y.; Yu, C. Development and validation of a Surveillance, Epidemiology, and End Results (SEER)-based prognostic nomogram for predicting survival in elderly patients with gastric cancer after surgery. J. Gastrointest. Oncol. 2021, 12, 278–296. [Google Scholar] [CrossRef] [PubMed]
- Hartwig, W.; Gluth, A.; Hinz, U.; Koliogiannis, D.; Strobel, O.; Hackert, T.; Werner, J.; Büchler, M.W. Outcomes after extended pancreatectomy in patients with borderline resectable and locally advanced pancreatic cancer. Br. J. Surg. 2016, 103, 1683–1694. [Google Scholar] [CrossRef]
- Li, Z.; Lin, Y.; Cheng, B.; Zhang, Q.; Cai, Y. Prognostic Model for Predicting Overall and Cancer-Specific Survival Among Patients With Cervical Squamous Cell Carcinoma: A SEER Based Study. Front. Oncol. 2021, 11, 651975. [Google Scholar] [CrossRef]
- Zhang, Z.; Xie, S.; Cai, W.; Hong, Z.N.; Yang, C.; Lin, Y.; Zhu, J.; Lin, Z.; Christoph, D.C.; Bohnenberger, H.; et al. A nomogram to predict the recurrence-free survival and analyze the utility of chemotherapy in stage IB non-small cell lung cancer. Transl. Lung Cancer Res. 2022, 11, 75–86. [Google Scholar] [CrossRef]
- Zheng, Y.Z.; Qin, H.B.; Li, Z.Z.; Jiang, H.S.; Zhang, G.; Yang, S.W.; Wang, X.M.; Xu, Y.C.; Deng, Z.H.; Liu, G.W. Prognostic Factors and a Nomogram Predicting Survival in Patients with Breast Ductal Carcinoma in situ with Microinvasion: A Population-Based Study. Clin. Epidemiol. 2021, 13, 1095–1108. [Google Scholar] [CrossRef]
- Han, Y.; Wang, J.; Sun, Y.; Yu, P.; Yuan, P.; Ma, F.; Fan, Y.; Luo, Y.; Zhang, P.; Li, Q.; et al. Prognostic Model and Nomogram for Estimating Survival of Small Breast Cancer: A SEER-based Analysis. Clin. Breast Cancer 2021, 21, e497–e505. [Google Scholar] [CrossRef]
- Liang, Y.X.; Deng, J.Y.; Guo, H.H.; Ding, X.W.; Wang, X.N.; Wang, B.G.; Zhang, L.; Liang, H. Characteristics and prognosis of gastric cancer in patients aged ≥ 70 years. World J. Gastroenterol. 2013, 19, 6568–6578. [Google Scholar] [CrossRef]
- Crew, K.D.; Neugut, A.I. Epidemiology of gastric cancer. World J. Gastroenterol. 2006, 12, 354–362. [Google Scholar] [CrossRef]
- Karimi, P.; Islami, F.; Anandasabapathy, S.; Freedman, N.D.; Kamangar, F. Gastric Cancer: Descriptive Epidemiology, Risk Factors, Screening, and Prevention. Cancer Epidemiol. Biomark. Prev. 2014, 23, 700–713. [Google Scholar] [CrossRef] [Green Version]
- Zhou, Y.; Zhang, Z.; Zhang, Z.; Wu, J.; Ren, D.; Yan, X.; Wang, Q.; Wang, Y.; Wang, H.; Zhang, J.; et al. A rising trend of gastric cardia cancer in Gansu Province of China. Cancer Lett. 2008, 269, 18–25. [Google Scholar] [CrossRef]
- Hu, K.; Wang, S.; Wang, Z.; Li, L.; Huang, Z.; Yu, W.; Chen, Z.; Wu, Q.-F. Clinicopathological risk factors for gastric cancer: A retrospective cohort study in China. BMJ Open 2019, 9, e030639. [Google Scholar] [CrossRef] [PubMed] [Green Version]
- Takatsu, Y.; Hiki, N.; Nunobe, S.; Ohashi, M.; Honda, M.; Yamaguchi, T.; Nakajima, T.; Sano, T. Clinicopathological features of gastric cancer in young patients. Gastric Cancer 2016, 19, 472–478. [Google Scholar] [CrossRef] [PubMed]
- Wang, Z.; Xu, J.; Shi, Z.; Shen, X.; Luo, T.; Bi, J.; Nie, M. Clinicopathologic characteristics and prognostic of gastric cancer in young patients. Scand. J. Gastroenterol. 2016, 51, 1043–1049. [Google Scholar] [CrossRef]
- Lui, F.H.; Tuan, B.; Swenson, S.L.; Wong, R.J. Ethnic disparities in gastric cancer incidence and survival in the USA: An updated analysis of 1992-2009 SEER data. Dig. Dis. Sci. 2014, 59, 3027–3034. [Google Scholar] [CrossRef] [PubMed]
- Wu, X.; Chen, V.W.; Andrews, P.A.; Ruiz, B.; Correa, P. Incidence of esophageal and gastric cancers among Hispanics, non-Hispanic whites and non-Hispanic blacks in the United States: Subsite and histology differences. Cancer Causes Control CCC 2007, 18, 585–593. [Google Scholar] [CrossRef]
- Kamineni, A.; Williams, M.A.; Schwartz, S.M.; Cook, L.S.; Weiss, N.S. The incidence of gastric carcinoma in Asian migrants to the United States and their descendants. Cancer Causes Control CCC 1999, 10, 77–83. [Google Scholar] [CrossRef]
- Lee, J.; Demissie, K.; Lu, S.E.; Rhoads, G.G. Cancer incidence among Korean-American immigrants in the United States and native Koreans in South Korea. Cancer Control J. Moffitt Cancer Cent. 2007, 14, 78–85. [Google Scholar] [CrossRef]
- Pinheiro, P.S.; Sherman, R.L.; Trapido, E.J.; Fleming, L.E.; Huang, Y.; Gomez-Marin, O.; Lee, D. Cancer incidence in first generation U.S. Hispanics: Cubans, Mexicans, Puerto Ricans, and new Latinos. Cancer Epidemiol. Biomark. Prev. 2009, 18, 2162–2169. [Google Scholar] [CrossRef] [PubMed] [Green Version]
- Byfield, S.A.; Earle, C.C.; Ayanian, J.Z.; McCarthy, E.P. Treatment and outcomes of gastric cancer among United States-born and foreign-born Asians and Pacific Islanders. Cancer 2009, 115, 4595–4605. [Google Scholar] [CrossRef] [PubMed] [Green Version]
- Hooi, J.K.Y.; Lai, W.Y.; Ng, W.K.; Suen, M.M.Y.; Underwood, F.E.; Tanyingoh, D.; Malfertheiner, P.; Graham, D.Y.; Wong, V.W.S.; Wu, J.C.Y.; et al. Global Prevalence of Helicobacter pylori Infection: Systematic Review and Meta-Analysis. Gastroenterology 2017, 153, 420–429. [Google Scholar] [CrossRef] [Green Version]
- Koshiol, J.; Wei, W.Q.; Kreimer, A.R.; Ren, J.S.; Gravitt, P.; Chen, W.; Kim, E.; Abnet, C.C.; Zhang, Y.; Kamangar, F.; et al. The gastric cardia is not a target for human papillomavirus-induced carcinogenesis. Cancer Epidemiol. Biomark. Prev. 2010, 19, 1137–1139. [Google Scholar] [CrossRef] [Green Version]
- Kamangar, F.; Dawsey, S.M.; Blaser, M.J.; Perez-Perez, G.I.; Pietinen, P.; Newschaffer, C.J.; Abnet, C.C.; Albanes, D.; Virtamo, J.; Taylor, P.R. Opposing risks of gastric cardia and noncardia gastric adenocarcinomas associated with Helicobacter pylori seropositivity. J. Natl. Cancer Inst. 2006, 98, 1445–1452. [Google Scholar] [CrossRef] [Green Version]
- Bakhti, S.Z.; Latifi-Navid, S.; Safaralizadeh, R. Helicobacter pylori-related risk predictors of gastric cancer: The latest models, challenges, and future prospects. Cancer Med. 2020, 9, 4808–4822. [Google Scholar] [CrossRef]
- Yang, L.; Kartsonaki, C.; Yao, P.; de Martel, C.; Plummer, M.; Chapman, D.; Guo, Y.; Clark, S.; Walters, R.G.; Chen, Y.; et al. The relative and attributable risks of cardia and non-cardia gastric cancer associated with Helicobacter pylori infection in China: A case-cohort study. Lancet. Public Health 2021, 6, e888–e896. [Google Scholar] [CrossRef] [PubMed]
- Tong, Y.; Zhao, Y.; Shan, Z.; Zhang, J. CA724 predicts overall survival in locally advanced gastric cancer patients with neoadjuvant chemotherapy. BMC Cancer 2021, 21, 4. [Google Scholar] [CrossRef]
- Reim, D.; Choi, Y.S.; Yoon, H.M.; Park, B.; Eom, B.W.; Kook, M.C.; Ryu, K.W.; Choi, I.J.; Joo, J.; Kim, Y.W. Alpha-fetoprotein is a significant prognostic factor for gastric cancer: Results from a propensity score matching analysis after curative resection. Eur. J. Surg. Oncol. EJSO 2017, 43, 1542–1549. [Google Scholar] [CrossRef]
- Xiao, J.; Ye, Z.S.; Wei, S.H.; Zeng, Y.; Lin, Z.M.; Wang, Y.; Teng, W.H.; Chen, L.C. Prognostic significance of pretreatment serum carcinoembryonic antigen levels in gastric cancer with pathological lymph node-negative: A large sample single-center retrospective study. World J. Gastroenterol. 2017, 23, 8562–8569. [Google Scholar] [CrossRef] [PubMed] [Green Version]
- Tokunaga, R.; Imamura, Y.; Nakamura, K.; Uchihara, T.; Ishimoto, T.; Nakagawa, S.; Iwatsuki, M.; Baba, Y.; Sakamoto, Y.; Miyamoto, Y.; et al. Carbohydrate antigen 19-9 is a useful prognostic marker in esophagogastric junction adenocarcinoma. Cancer Med. 2015, 4, 1659–1666. [Google Scholar] [CrossRef] [PubMed]
- Emoto, S.; Ishigami, H.; Yamashita, H.; Yamaguchi, H.; Kaisaki, S.; Kitayama, J. Clinical significance of CA125 and CA72-4 in gastric cancer with peritoneal dissemination. Gastric Cancer 2012, 15, 154–161. [Google Scholar] [CrossRef] [PubMed]
- Shimada, H.; Noie, T.; Ohashi, M.; Oba, K.; Takahashi, Y. Clinical significance of serum tumor markers for gastric cancer: A systematic review of literature by the Task Force of the Japanese Gastric Cancer Association. Gastric Cancer 2014, 17, 26–33. [Google Scholar] [CrossRef] [PubMed]
- Feng, F.; Tian, Y.; Xu, G.; Liu, Z.; Liu, S.; Zheng, G.; Guo, M.; Lian, X.; Fan, D.; Zhang, H. Diagnostic and prognostic value of CEA, CA19-9, AFP and CA125 for early gastric cancer. BMC Cancer 2017, 17, 737. [Google Scholar] [CrossRef]
- Zhao, S.; Bi, Y.; Wang, Z.; Zhang, F.; Zhang, Y.; Xu, Y. Accuracy evaluation of combining gastroscopy, multi-slice spiral CT, Her-2, and tumor markers in gastric cancer staging diagnosis. World J. Surg. Oncol. 2022, 20, 152. [Google Scholar] [CrossRef]
- In, H.; Sarkar, S.; Ward, J.; Friedmann, P.; Parides, M.; Yang, J.; Epplein, M. Serum Pepsinogen as a Biomarker for Gastric Cancer in the United States: A Nested Case-Control Study Using the PLCO Cancer Screening Trial Data. Cancer Epidemiol. Biomark. Prev. 2022, 31, 1426–1432. [Google Scholar] [CrossRef]
- Agkoc, M.; Dursun, H.; Albayrak, F.; Yilmaz, O.; Kiziltunc, A.; Yilmaz, A.; Gundogdu, C. Usefulness of serum pepsinogen levels as a screening test for atrophic gastritis and gastric cancer. Eurasian J. Med. 2010, 42, 15–18. [Google Scholar] [CrossRef]
- Miki, K. Gastric cancer screening by combined assay for serum anti-Helicobacter pylori IgG antibody and serum pepsinogen levels—”ABC method”. Proc. Jpn. Academy. Ser. B Phys. Biol. Sci. 2011, 87, 405–414. [Google Scholar] [CrossRef]
- Wang, R.; Chen, X.Z. Prevalence of atrophic gastritis in southwest China and predictive strength of serum gastrin-17: A cross-sectional study (SIGES). Sci. Rep. 2020, 10, 4523. [Google Scholar] [CrossRef] [Green Version]
- Xia, J.; Liu, Z.; Zhang, K. Pepsinogen Serology and Gastritis OLGA Staging in Mucosal Atrophy Assessment: A Cross-Sectional Study Involving East China Endoscopy Population. Gastroenterol. Res. Pract. 2020, 2020, 2324505. [Google Scholar] [CrossRef] [PubMed]
- Tong, Y.; Wu, Y.; Song, Z.; Yu, Y.; Yu, X. The potential value of serum pepsinogen for the diagnosis of atrophic gastritis among the health check-up populations in China: A diagnostic clinical research. BMC Gastroenterol. 2017, 17, 88. [Google Scholar] [CrossRef]
- Kabat, G.C.; Ng, S.K.; Wynder, E.L. Tobacco, alcohol intake, and diet in relation to adenocarcinoma of the esophagus and gastric cardia. Cancer Causes Control CCC 1993, 4, 123–132. [Google Scholar] [CrossRef] [PubMed]
- Ye, W.; Ekström, A.M.; Hansson, L.E.; Bergström, R.; Nyrén, O. Tobacco, alcohol and the risk of gastric cancer by sub-site and histologic type. Int. J. Cancer 1999, 83, 223–229. [Google Scholar] [CrossRef]
- Freedman, N.D.; Abnet, C.C.; Leitzmann, M.F.; Mouw, T.; Subar, A.F.; Hollenbeck, A.R.; Schatzkin, A. A prospective study of tobacco, alcohol, and the risk of esophageal and gastric cancer subtypes. Am. J. Epidemiol. 2007, 165, 1424–1433. [Google Scholar] [CrossRef]
- Tramacere, I.; Pelucchi, C.; Bagnardi, V.; Rota, M.; Scotti, L.; Islami, F.; Corrao, G.; Boffetta, P.; La Vecchia, C.; Negri, E. A meta-analysis on alcohol drinking and esophageal and gastric cardia adenocarcinoma risk. Ann. Oncol. 2012, 23, 287–297. [Google Scholar] [CrossRef] [PubMed]
- Hansson, L.E.; Baron, J.; Nyrén, O.; Bergström, R.; Wolk, A.; Adami, H.O. Tobacco, alcohol and the risk of gastric cancer. A population-based case-control study in Sweden. Int. J. Cancer 1994, 57, 26–31. [Google Scholar] [CrossRef] [PubMed]
- Maguire, F.B.; Movsisyan, A.S.; Morris, C.R.; Parikh-Patel, A.; Keegan, T.H.M.; Tong, E.K. Evaluation of Cancer Deaths Attributable to Tobacco in California, 2014-2019. JAMA Netw. Open 2022, 5, e2246651. [Google Scholar] [CrossRef]
- Shikata, K.; Doi, Y.; Yonemoto, K.; Arima, H.; Ninomiya, T.; Kubo, M.; Tanizaki, Y.; Matsumoto, T.; Iida, M.; Kiyohara, Y. Population-based prospective study of the combined influence of cigarette smoking and Helicobacter pylori infection on gastric cancer incidence: The Hisayama Study. Am. J. Epidemiol. 2008, 168, 1409–1415. [Google Scholar] [CrossRef] [Green Version]
- Arnold, M.; Abnet, C.C.; Neale, R.E.; Vignat, J.; Giovannucci, E.L.; McGlynn, K.A.; Bray, F. Global Burden of 5 Major Types of Gastrointestinal Cancer. Gastroenterology 2020, 159, 335–349.e315. [Google Scholar] [CrossRef]
- Camilleri, M.; Malhi, H.; Acosta, A. Gastrointestinal Complications of Obesity. Gastroenterology 2017, 152, 1656–1670. [Google Scholar] [CrossRef] [Green Version]
- Mukaisho, K.; Nakayama, T.; Hagiwara, T.; Hattori, T.; Sugihara, H. Two distinct etiologies of gastric cardia adenocarcinoma: Interactions among pH, Helicobacter pylori, and bile acids. Front. Microbiol. 2015, 6, 412. [Google Scholar] [CrossRef] [Green Version]
- Poorolajal, J.; Moradi, L.; Mohammadi, Y.; Cheraghi, Z.; Gohari-Ensaf, F. Risk factors for stomach cancer: A systematic review and meta-analysis. Epidemiol. Health 2020, 42, e2020004. [Google Scholar] [CrossRef] [PubMed]
- Naemi Kermanshahi, M.; Safaei, E.; Tutunchi, H.; Naghshi, S.; Mobarak, S.; Asadi, M.; Sadeghi, O. Fruit and vegetable intake in relation to gastric cancer risk: A comprehensive and updated systematic review and dose-response meta-analysis of cohort studies. Front. Nutr. 2023, 10, 973171. [Google Scholar] [CrossRef]
- Kurosawa, M.; Kikuchi, S.; Xu, J.; Inaba, Y. Highly salted food and mountain herbs elevate the risk for stomach cancer death in a rural area of Japan. J. Gastroenterol. Hepatol. 2006, 21, 1681–1686. [Google Scholar] [CrossRef] [PubMed]
- D’Elia, L.; Rossi, G.; Ippolito, R.; Cappuccio, F.P.; Strazzullo, P. Habitual salt intake and risk of gastric cancer: A meta-analysis of prospective studies. Clin. Nutr. 2012, 31, 489–498. [Google Scholar] [CrossRef]
- Wu, B.; Yang, D.; Yang, S.; Zhang, G. Dietary Salt Intake and Gastric Cancer Risk: A Systematic Review and Meta-Analysis. Front. Nutr. 2021, 8, 801228. [Google Scholar] [CrossRef]
- Tsugane, S. Salt, salted food intake, and risk of gastric cancer: Epidemiologic evidence. Cancer Sci. 2005, 96, 1–6. [Google Scholar] [CrossRef]
- Wong, B.C.; Lam, S.K. Epidemiology of gastric cancer in relation to diet and Helicobacter pylori infection. J. Gastroenterol. Hepatol. 1998, 13, S166–S172. [Google Scholar] [CrossRef] [PubMed]
- Yaghoobi, M.; Bijarchi, R.; Narod, S.A. Family history and the risk of gastric cancer. Br. J. Cancer 2010, 102, 237–242. [Google Scholar] [CrossRef]
- Lauwers, G.Y.; Mullen, J.T.; Chelcun Schreiber, K.E.; Chung, D.C. Familial Gastric Cancers: A Review with Focus on Hereditary Diffuse Gastric Cancer Syndrome. AJSP Rev. Rep. 2014, 19, 66–73. [Google Scholar] [CrossRef] [Green Version]
- Machlowska, J.; Baj, J.; Sitarz, M.; Maciejewski, R.; Sitarz, R. Gastric Cancer: Epidemiology, Risk Factors, Classification, Genomic Characteristics and Treatment Strategies. Int. J. Mol. Sci. 2020, 21, 4012. [Google Scholar] [CrossRef]
- Correa, P. Human gastric carcinogenesis: A multistep and multifactorial process—First American Cancer Society Award Lecture on Cancer Epidemiology and Prevention. Cancer Res. 1992, 52, 6735–6740. [Google Scholar] [PubMed]
- Correa, P.; Shiao, Y.H. Phenotypic and genotypic events in gastric carcinogenesis. Cancer Res. 1994, 54, 1941s–1943s. [Google Scholar] [PubMed]
- Tang, L.; Tang, B.; Lei, Y.; Yang, M.; Wang, S.; Hu, S.; Xie, Z.; Liu, Y.; Vlodavsky, I.; Yang, S. Helicobacter pylori-Induced Heparanase Promotes H. pylori Colonization and Gastritis. Front. Immunol. 2021, 12, 675747. [Google Scholar] [CrossRef] [PubMed]
- Toh, J.W.T.; Wilson, R.B. Pathways of Gastric Carcinogenesis, Helicobacter pylori Virulence and Interactions with Antioxidant Systems, Vitamin C and Phytochemicals. Int. J. Mol. Sci. 2020, 21, 6451. [Google Scholar] [CrossRef]
- Kinoshita, H.; Hayakawa, Y.; Koike, K. Metaplasia in the Stomach-Precursor of Gastric Cancer? Int. J. Mol. Sci. 2017, 18, 2063. [Google Scholar] [CrossRef]
- Rawla, P.; Barsouk, A. Epidemiology of gastric cancer: Global trends, risk factors and prevention. Prz. Gastroenterol. 2019, 14, 26–38. [Google Scholar] [CrossRef]
- Wu, A.H.; Tseng, C.C.; Bernstein, L. Hiatal hernia, reflux symptoms, body size, and risk of esophageal and gastric adenocarcinoma. Cancer 2003, 98, 940–948. [Google Scholar] [CrossRef]
- Ye, W.; Chow, W.H.; Lagergren, J.; Yin, L.; Nyrén, O. Risk of adenocarcinomas of the esophagus and gastric cardia in patients with gastroesophageal reflux diseases and after antireflux surgery. Gastroenterology 2001, 121, 1286–1293. [Google Scholar] [CrossRef]
- Yuan, Q.; Deng, D.; Pan, C.; Ren, J.; Wei, T.; Wu, Z.; Zhang, B.; Li, S.; Yin, P.; Shang, D. Integration of transcriptomics, proteomics, and metabolomics data to reveal HER2-associated metabolic heterogeneity in gastric cancer with response to immunotherapy and neoadjuvant chemotherapy. Front. Immunol. 2022, 13, 951137. [Google Scholar] [CrossRef] [PubMed]
- Guiot, J.; Vaidyanathan, A.; Deprez, L.; Zerka, F.; Danthine, D.; Frix, A.N.; Lambin, P.; Bottari, F.; Tsoutzidis, N.; Miraglio, B.; et al. A review in radiomics: Making personalized medicine a reality via routine imaging. Med. Res. Rev. 2022, 42, 426–440. [Google Scholar] [CrossRef] [PubMed]
- Liu, Z.; Wang, S.; Dong, D.; Wei, J.; Fang, C.; Zhou, X.; Sun, K.; Li, L.; Li, B.; Wang, M.; et al. The Applications of Radiomics in Precision Diagnosis and Treatment of Oncology: Opportunities and Challenges. Theranostics 2019, 9, 1303–1322. [Google Scholar] [CrossRef]
- Zheng, B.H.; Liu, L.Z.; Zhang, Z.Z.; Shi, J.Y.; Dong, L.Q.; Tian, L.Y.; Ding, Z.B.; Ji, Y.; Rao, S.X.; Zhou, J.; et al. Radiomics score: A potential prognostic imaging feature for postoperative survival of solitary HCC patients. BMC Cancer 2018, 18, 1148. [Google Scholar] [CrossRef]
- Ba, W.; Wang, S.; Shang, M.; Zhang, Z.; Wu, H.; Yu, C.; Xing, R.; Wang, W.; Wang, L.; Liu, C.; et al. Assessment of deep learning assistance for the pathological diagnosis of gastric cancer. Mod. Pathol. 2022, 35, 1262–1268. [Google Scholar] [CrossRef] [PubMed]
- Awad, E.; Levine, S.; Anderson, M.; Anderson, S.L.; Conitzer, V.; Crockett, M.J.; Everett, J.A.C.; Evgeniou, T.; Gopnik, A.; Jamison, J.C.; et al. Computational ethics. Trends Cogn. Sci. 2022, 26, 388–405. [Google Scholar] [CrossRef] [PubMed]
- Guyon, I.; Elisseeff, A. An introduction to variable and feature selection. J. Mach. Learn. Res. 2003, 3, 1157–1182. [Google Scholar]
- Hall, M.A. Correlation-Based Feature Selection for Machine Learning; Morgan Kaufmann Publishers Inc.: Burlington, MA, USA, 2000. [Google Scholar]
- Tibshirani, R. Regression shrinkage and selection via the Lasso. J. R. Stat. Soc. Ser. B-Methodol. 1996, 58, 267–288. [Google Scholar] [CrossRef]
- Ritchie, M.D.; Hahn, L.W.; Roodi, N.; Bailey, L.R.; Dupont, W.D.; Parl, F.F.; Moore, J.H. Multifactor-dimensionality reduction reveals high-order interactions among estrogen-metabolism genes in sporadic breast cancer. Am. J. Hum. Genet. 2001, 69, 138–147. [Google Scholar] [CrossRef] [Green Version]
- Hahn, L.W.; Ritchie, M.D.; Moore, J.H. Multifactor dimensionality reduction software for detecting gene-gene and gene-environment interactions. Bioinformatics 2003, 19, 376–382. [Google Scholar] [CrossRef] [Green Version]
- Schober, P.; Boer, C.; Schwarte, L.A. Correlation Coefficients: Appropriate Use and Interpretation. Anesth. Analg. 2018, 126, 1763–1768. [Google Scholar] [CrossRef]
- Mootha, V.K.; Lindgren, C.M.; Eriksson, K.-F.; Subramanian, A.; Sihag, S.; Lehar, J.; Puigserver, P.; Carlsson, E.; Ridderstråle, M.; Laurila, E.; et al. PGC-1α-responsive genes involved in oxidative phosphorylation are coordinately downregulated in human diabetes. Nat. Genet. 2003, 34, 267–273. [Google Scholar] [CrossRef]
- Subramanian, A.; Tamayo, P.; Mootha, V.K.; Mukherjee, S.; Ebert, B.L.; Gillette, M.A.; Paulovich, A.; Pomeroy, S.L.; Golub, T.R.; Lander, E.S.; et al. Gene set enrichment analysis: A knowledge-based approach for interpreting genome-wide expression profiles. Proc. Natl. Acad. Sci. USA 2005, 102, 15545–15550. [Google Scholar] [CrossRef] [PubMed]
- Zhang, B.; Horvath, S. A general framework for weighted gene co-expression network analysis. Stat. Appl. Genet. Mol. Biol. 2005, 4, 17. [Google Scholar] [CrossRef] [PubMed]
- Breiman, L. Random Forests. Mach. Learn. 2001, 45, 5–32. [Google Scholar] [CrossRef] [Green Version]
- Cortes, C.; Vapnik, V. Support-vector networks. Mach. Learn. 1995, 20, 273–297. [Google Scholar] [CrossRef]
- Hinton, G.E.; Osindero, S.; Teh, Y.W. A Fast Learning Algorithm for Deep Belief Nets. Neural Comput. 2006, 18, 1527–1554. [Google Scholar] [CrossRef]
- Farsal, W.; Anter, S.; Ramdani, M. Deep Learning: An Overview. In Proceedings of the 12th International Conference on Intelligent Systems: Theories and Applications, Rabat, Morocco, 24–25 October 2018; p. 38. [Google Scholar]
- Chen, W.; Wang, X.; Duan, H.; Zhang, X.; Dong, T.; Nie, S. Application of deep learning in cancer prognosis prediction model. Sheng Wu Yi Xue Gong Cheng Xue Za Zhi = J. Biomed. Eng. = Shengwu Yixue Gongchengxue Zazhi 2020, 37, 918–929. [Google Scholar] [CrossRef]
- Wen, F.; Huang, J.; Lu, X.; Huang, W.; Wang, Y.; Bai, Y.; Ruan, S.; Gu, S.; Chen, X.; Shu, P. Identification and prognostic value of metabolism-related genes in gastric cancer. Aging 2020, 12, 17647–17661. [Google Scholar] [CrossRef]
- Chen, T.; Guestrin, C. XGBoost: A Scalable Tree Boosting System. In Proceedings of the 22nd ACM SIGKDD International Conference on Knowledge Discovery and Data Mining, San Francisco, CA, USA, 13–17 August 2016; pp. 785–794. [Google Scholar]
- Taninaga, J.; Nishiyama, Y.; Fujibayashi, K.; Gunji, T.; Sasabe, N.; Iijima, K.; Naito, T. Prediction of future gastric cancer risk using a machine learning algorithm and comprehensive medical check-up data: A case-control study. Sci. Rep. 2019, 9, 12384. [Google Scholar] [CrossRef] [Green Version]
- Basheer, I.A.; Hajmeer, M. Artificial neural networks: Fundamentals, computing, design, and application. J. Microbiol. Methods 2000, 43, 3–31. [Google Scholar] [CrossRef] [PubMed]
- Leng, L.; Zhang, J. PalmHash Code vs. PalmPhasor Code. Neurocomputing 2013, 108, 1–12. [Google Scholar] [CrossRef]
- Leng, L.; Li, M.; Kim, C.; Bi, X. Dual-source discrimination power analysis for multi-instance contactless palmprint recognition. Multimed. Tools Appl. 2017, 76, 333–354. [Google Scholar] [CrossRef]
- Cantarero, G.G.; Jarabo, R.M. The area under the ROC curve. Med. Clin. 1996, 106, 355–356. [Google Scholar]
- Bradley, A.P. The use of the area under the roc curve in the evaluation of machine learning algorithms. Pattern Recognit. 1997, 30, 1145–1159. [Google Scholar] [CrossRef] [Green Version]
- Hong, C. Confusion plot for the confusion matrix. J. Korean Data Inf. Sci. Sociaty 2021, 32, 427–437. [Google Scholar] [CrossRef]
- Vickers, A.J. Prediction models: Revolutionary in principle, but do they do more good than harm? J. Clin. Oncol. 2011, 29, 2951–2952. [Google Scholar] [CrossRef]
Figure 1.
(A) Estimated number of incident cases and deaths in the world, both sexes, all ages. (B) Estimated number of incident cases and deaths for stomach, both sexes, all ages. Data source: GLOBOCAN 2020 [1].
Figure 1.
(A) Estimated number of incident cases and deaths in the world, both sexes, all ages. (B) Estimated number of incident cases and deaths for stomach, both sexes, all ages. Data source: GLOBOCAN 2020 [1].

Figure 2.
The PRISMA flowchart.
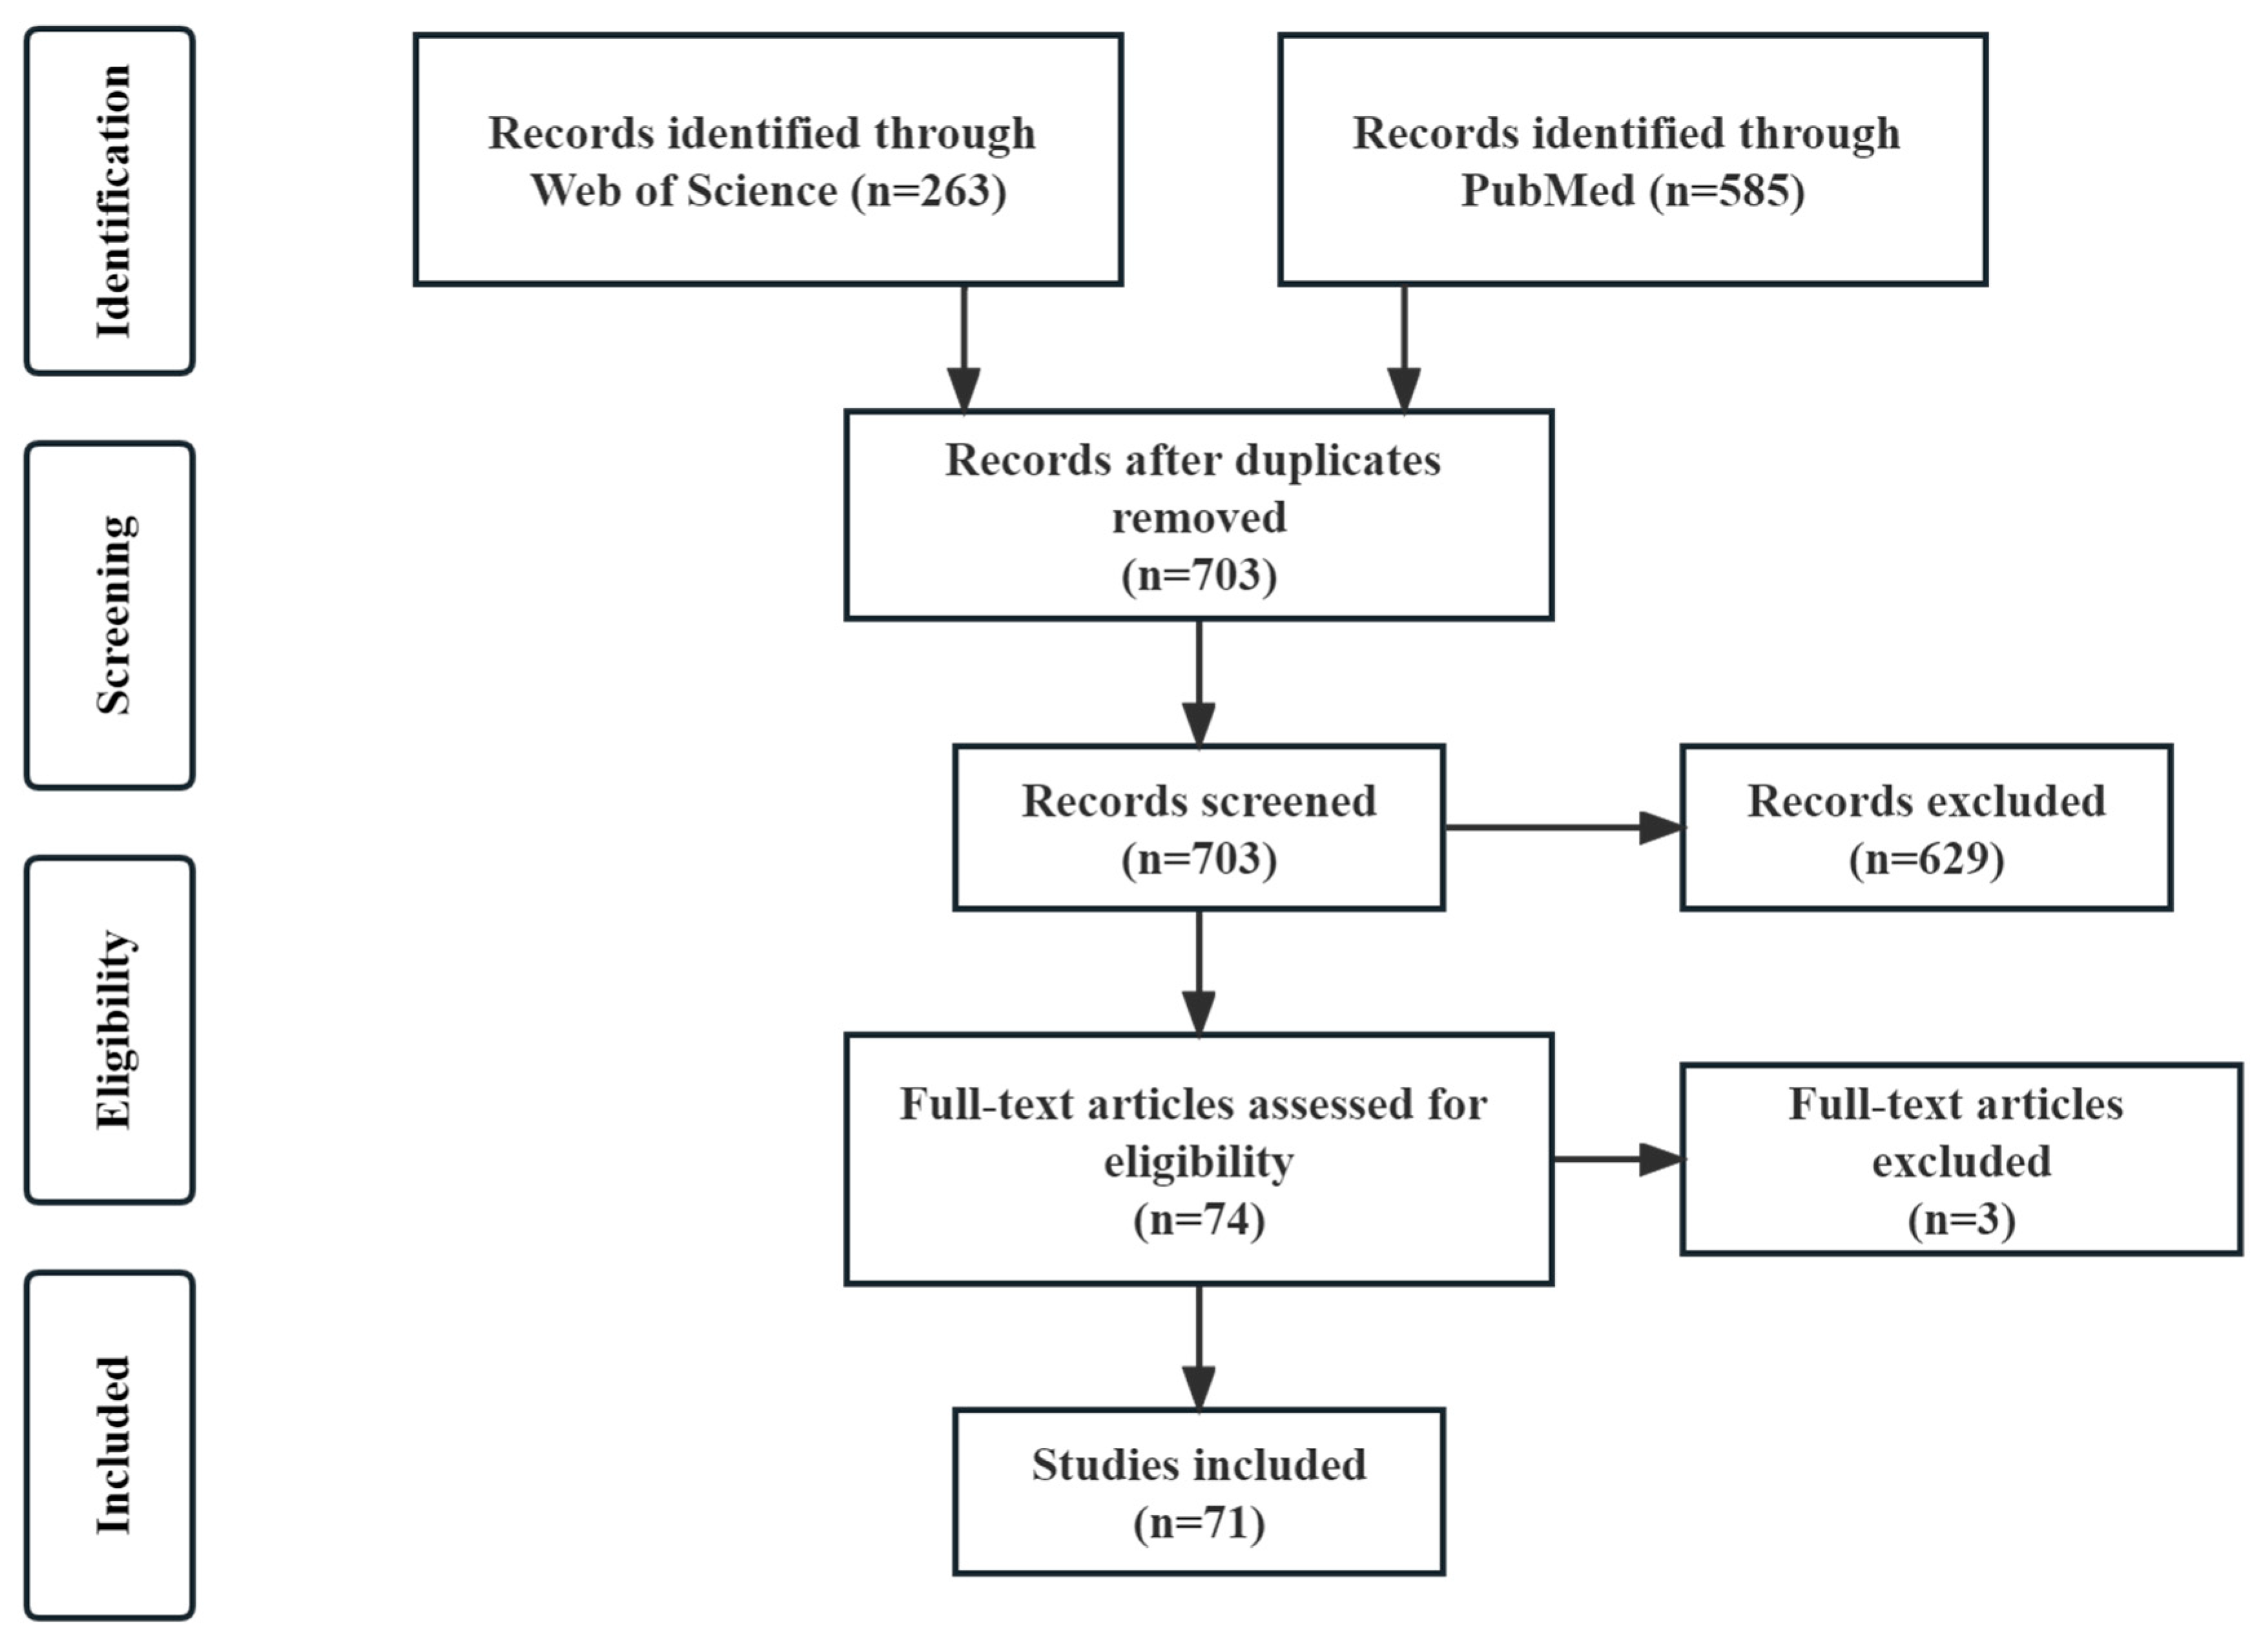
Figure 3.
(A) The proportion of prediction and prognostic models. (Numbers, Proportion) (B) The proportion of internal and external validation was used in the model building process. (C) The statistics of the data source. (D) The statistics of the C or AUC range. (E) The statistics of the sample size. (F) The statistics of the algorithms.
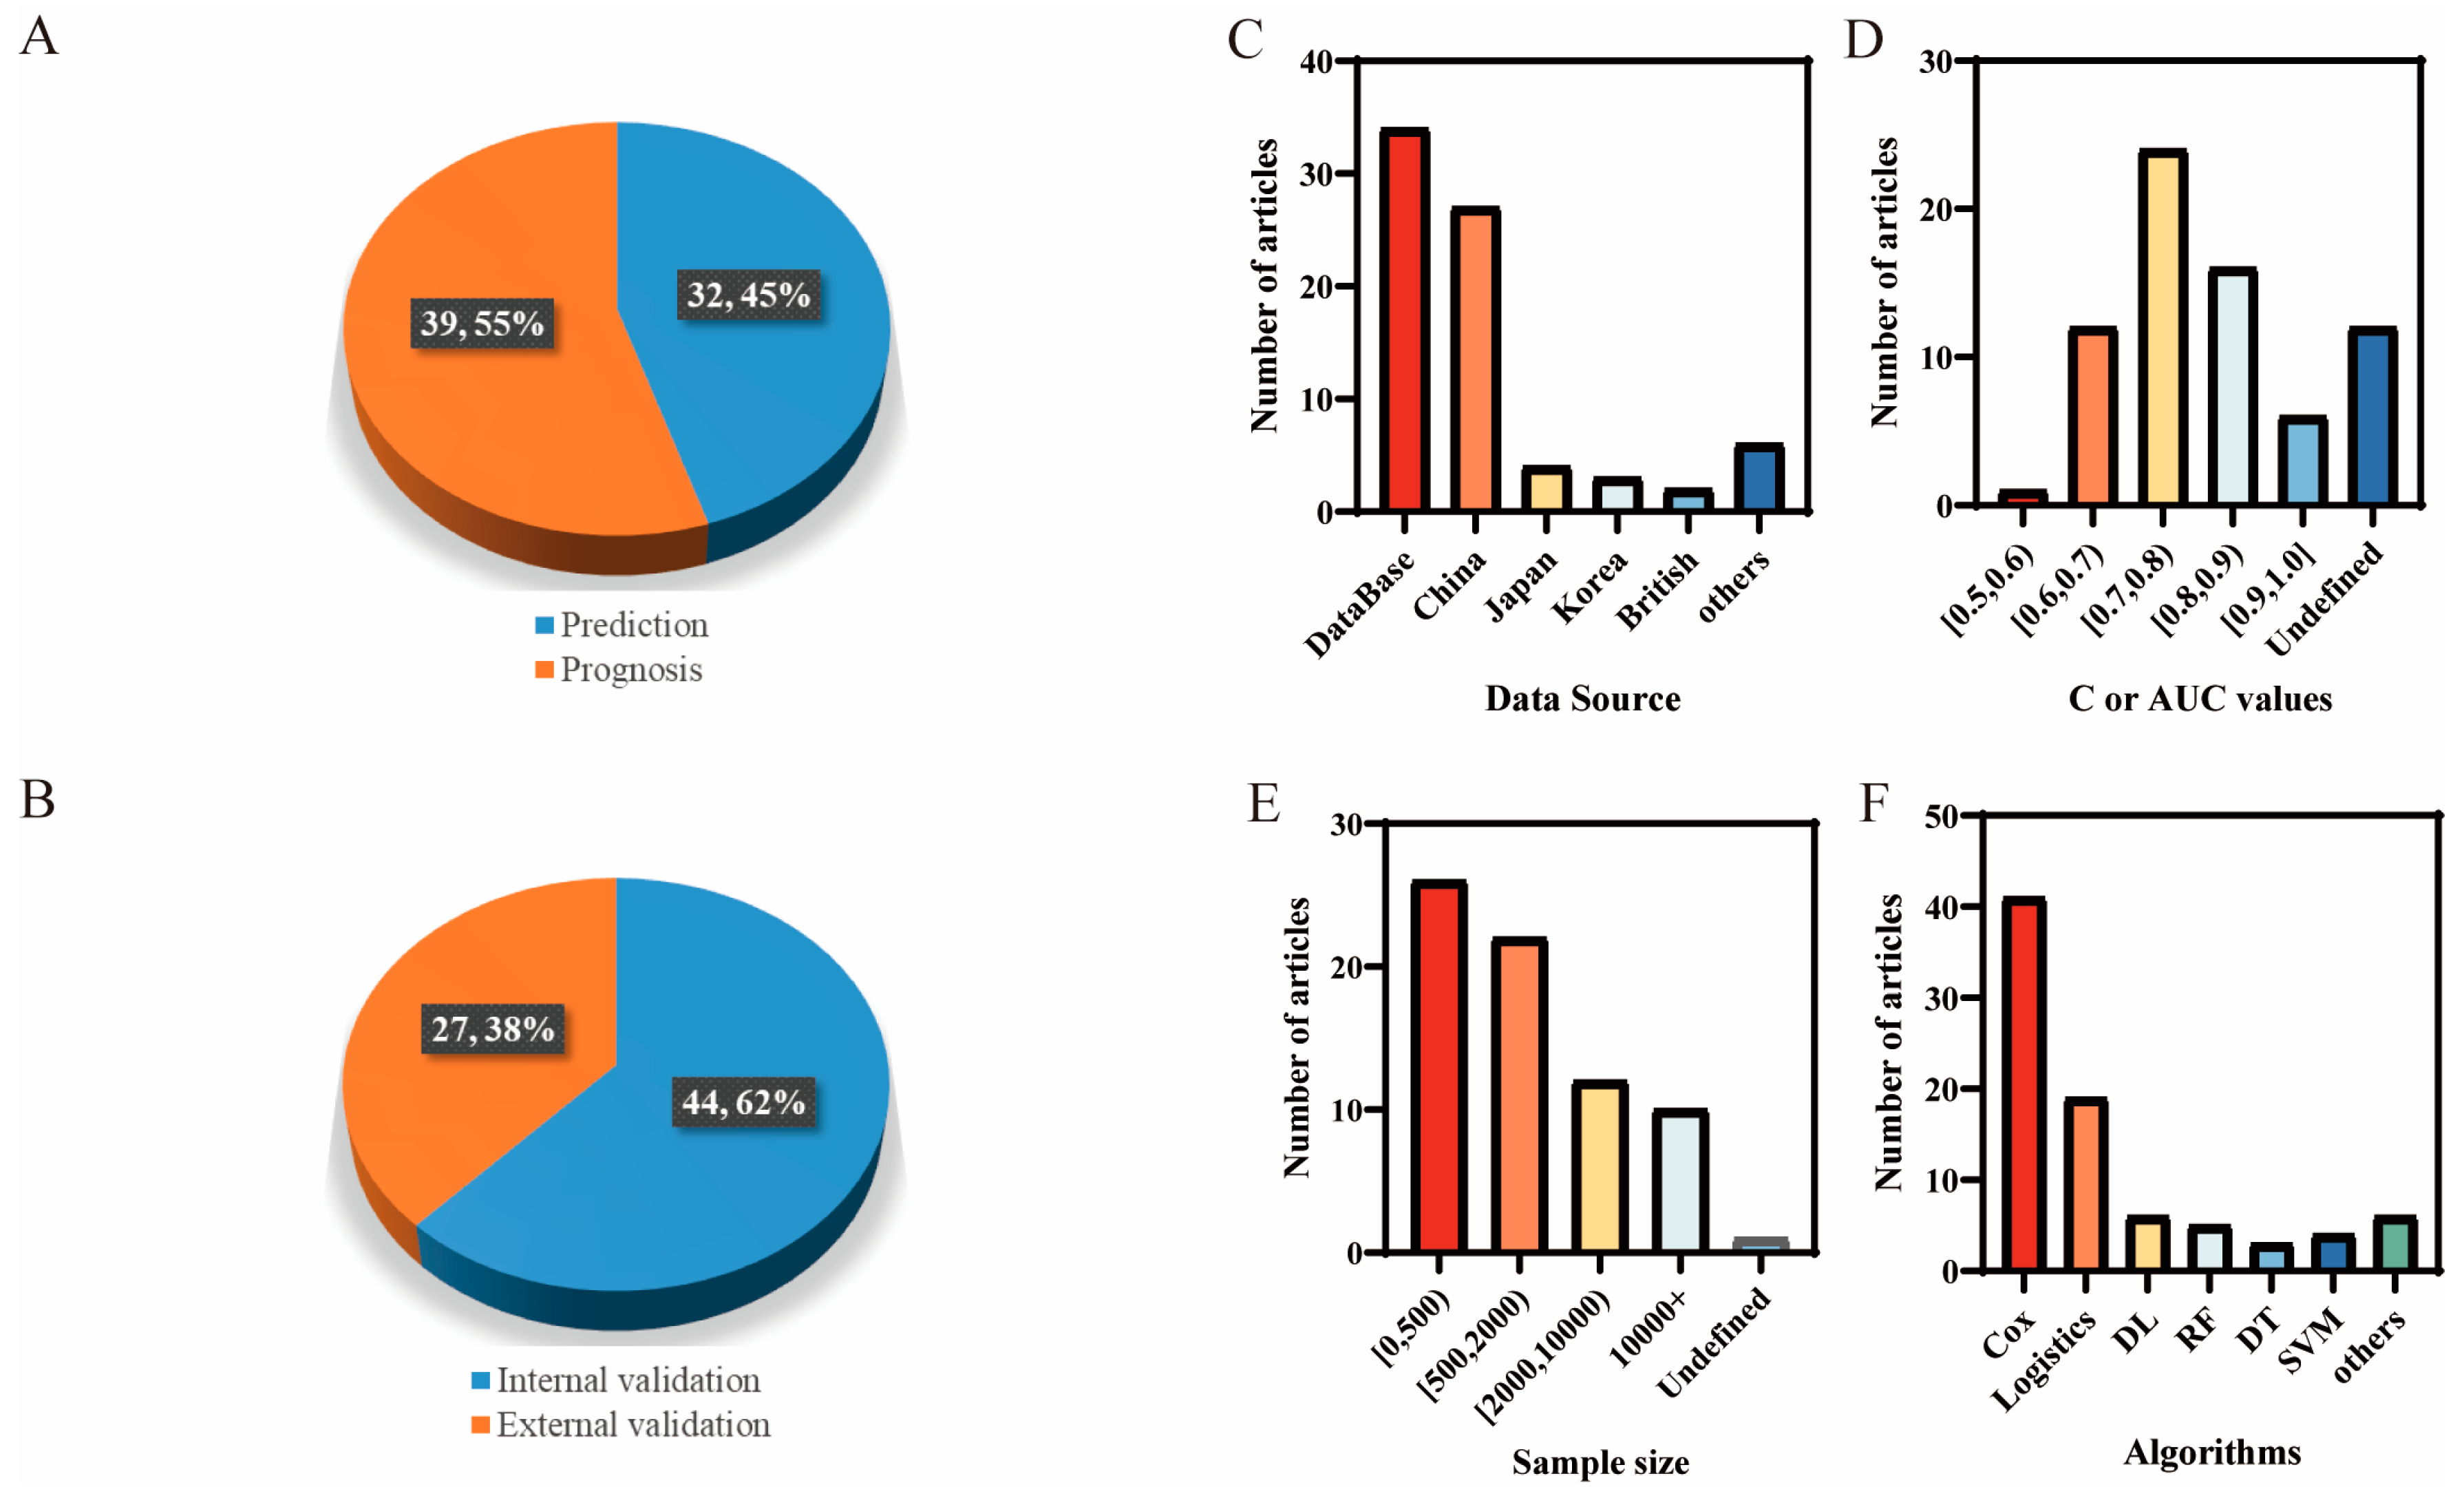
Figure 4.
The research framework based on articles about gastric cancer risk prediction models.
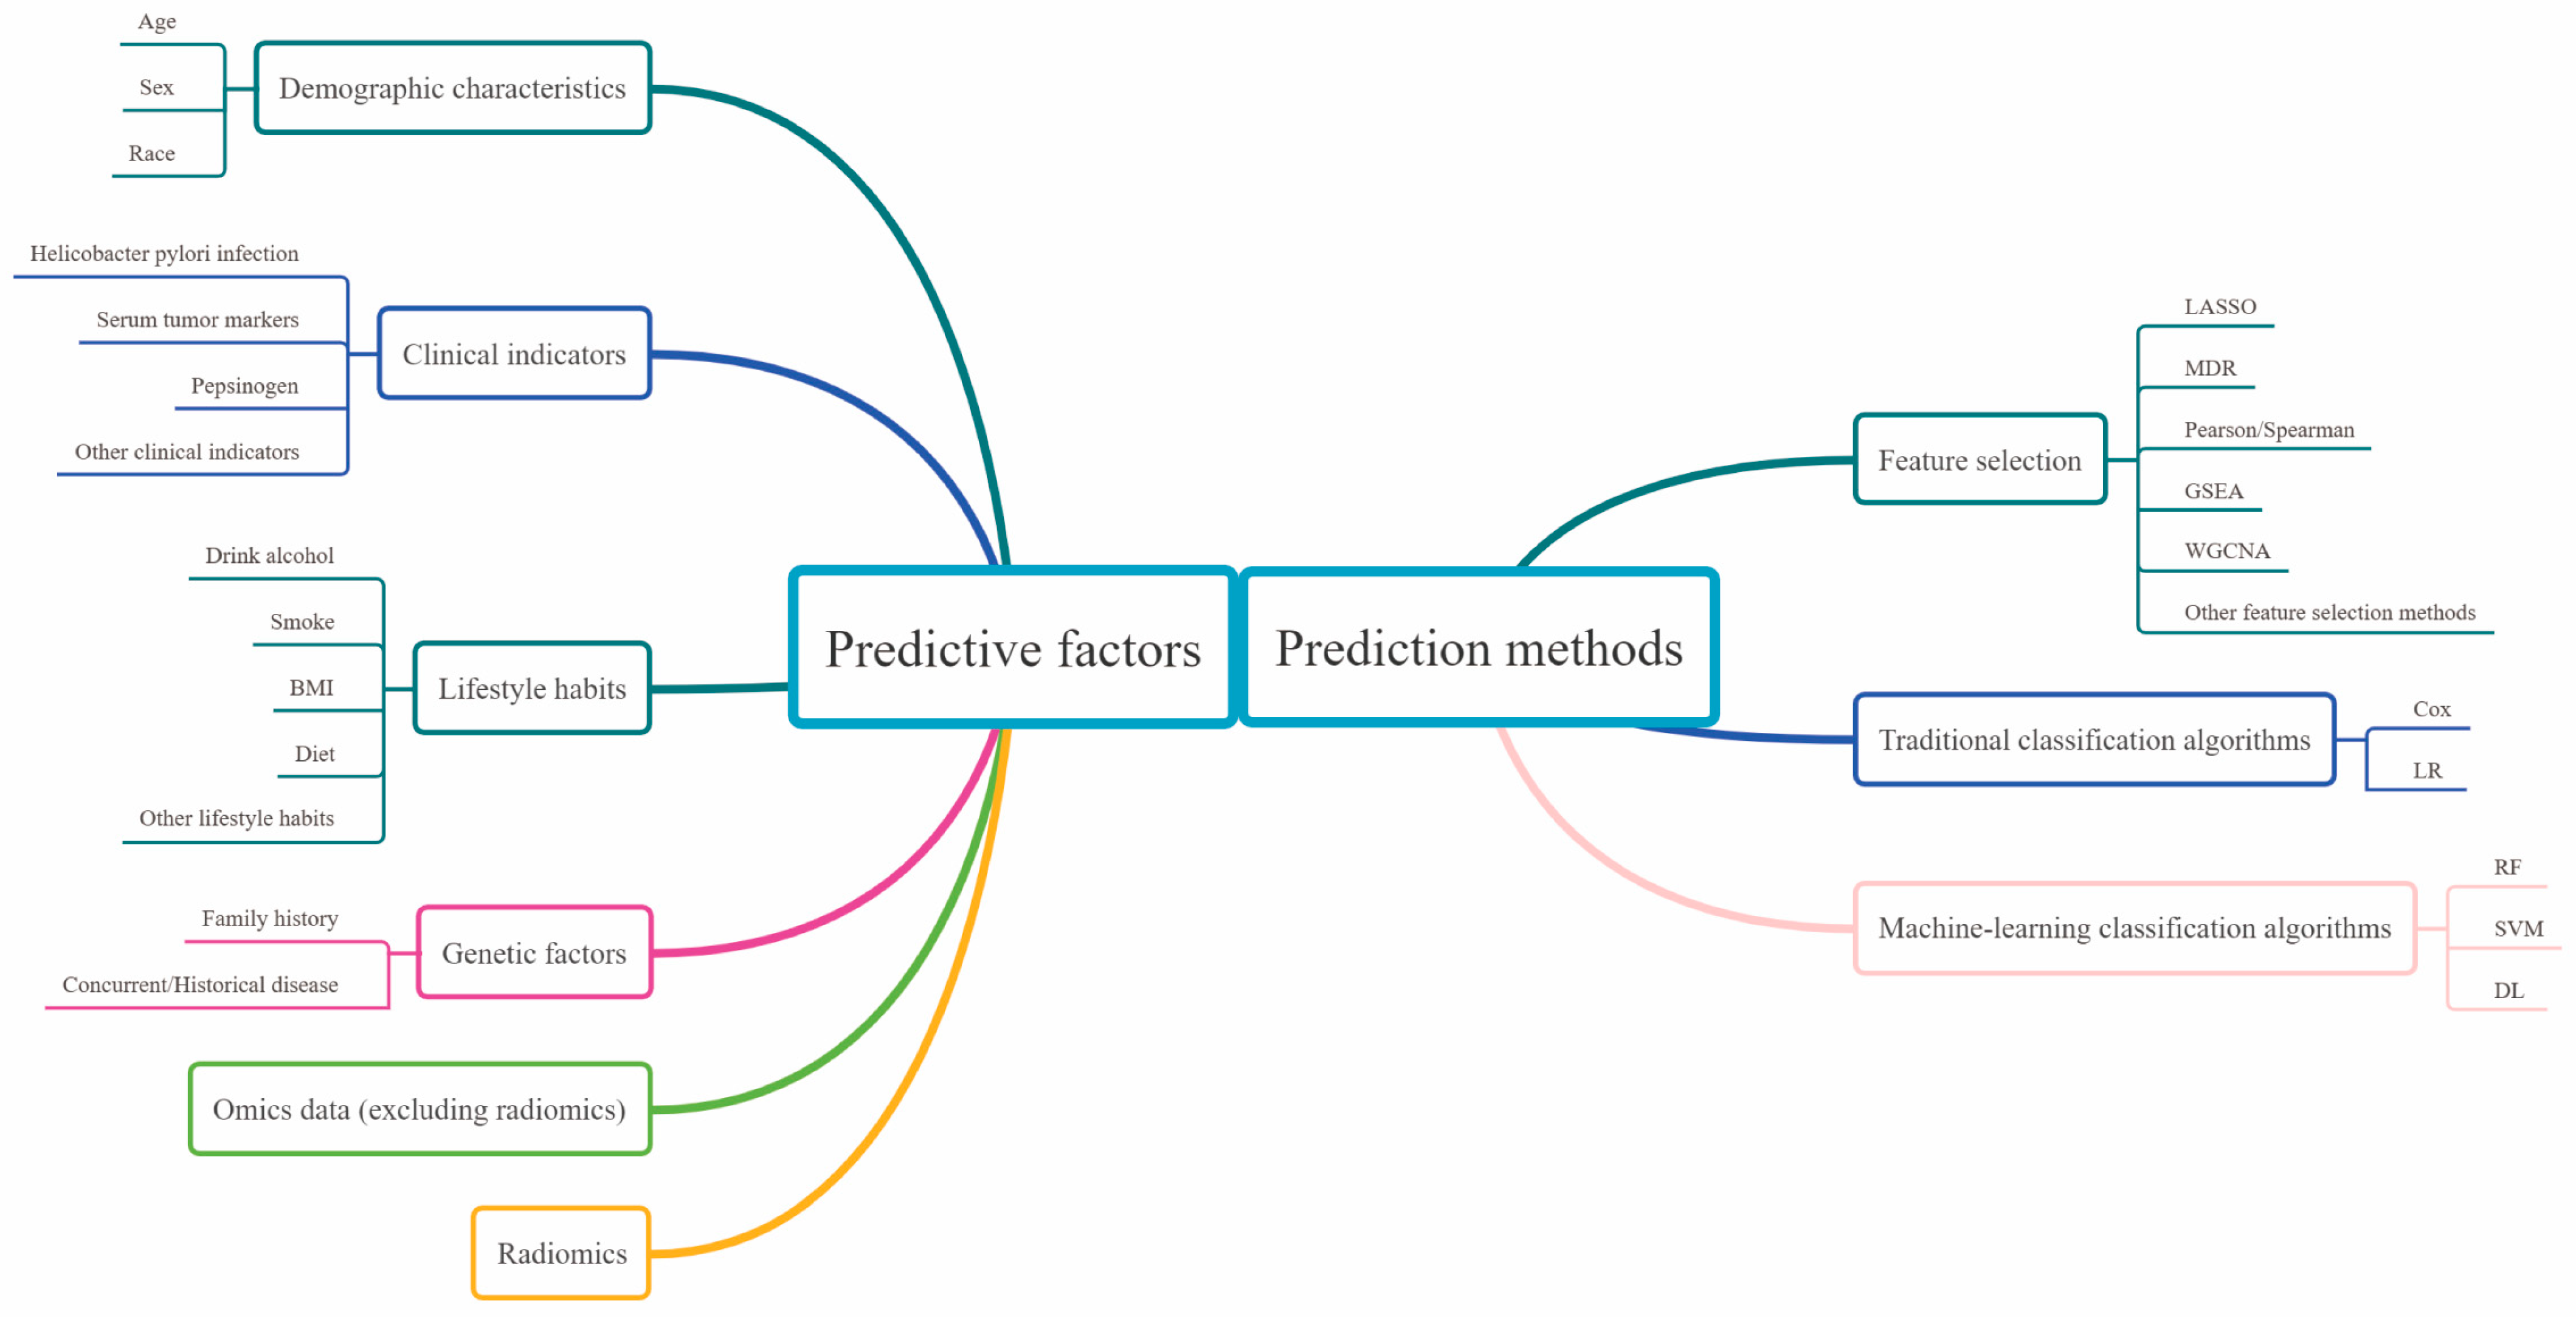
Figure 5.
Region-specific incidence age-standardized rates by sex for stomach cancer in 2020. Rates are shown in descending order of the world (W) age-standardized rate among men, and the highest national rates among men and women are superimposed. Copied with permission [1]. Copyright 2021, American Chemical Society.

Figure 6.
(A) The graph of Sigmoid function (source: Wikipedia). (B) The schematic diagram of random forests. (C) The schematic diagram of support vector machine. (D) The schematic diagram of neural networks.
Figure 6.
(A) The graph of Sigmoid function (source: Wikipedia). (B) The schematic diagram of random forests. (C) The schematic diagram of support vector machine. (D) The schematic diagram of neural networks.


Table 1.
Summary of the relationship between GC and each factor.
| The Relationship between Each Factor and GC | ||
|---|---|---|
| Demographic characteristics | Age | GC is highly correlated with age with a gradually increasing incidence observed after 40 years. |
| Sex | Men are twice women in both incidence cases and mortality cases. | |
| Race | The incidence of GC varies greatly among different races. | |
| Clinical indicators | Hp infection | Chronic Hp infection is considered the leading cause of NCGC but is not associated with CGC. |
| Serum tumor markers | Serum tumor markers are relatively high in advanced GC. | |
| Pepsinogen | PG is a marker of atrophic gastritis, associated with GC indirectly. | |
| Lifestyle habits | Drink alcohol | Drinking alcohol has been identified as one of the CGC risk factors. |
| Smoke | The duration of cigarette or pipe smoking is positively associated with GC risk. | |
| BMI | Some studies have linked GC to obesity, but others disagree. | |
| Diet | A higher intake of total fruit and vegetable are associated with a lower risk of GC. Fried/pickled/smoked and high-salt diet may increase the risk of GC. | |
| Genetic factors | Family history | 10% of GC cases show familial aggregation. |
| Concurrent/Historical disease | Some diseases are closely related to the development of GC but need to be considered along with other factors. | |
| Omics data (excluding radiomics) | The novel-integrated multi-omics strategy may facilitate the development of a more tailored approach to GC therapy. | |
| Radiomics | Radiomics has certain intuition and high accuracy in the examination of GC. | |
Table 2.
The statistics of the factors for prediction.
| Included Factors | Quantity |
|---|---|
| Demographic characteristics | |
| Age | 51 |
| Gender | 44 |
| Race | 6 |
| Clinical indicators | |
| Helicobacter pylori | 12 |
| Tumor markers | 6 |
| Pepsinogen (PG I/PG II/PGR) | 5 |
| G-17 | 2 |
| Hemoglobin | 2 |
| Lifestyle habits | |
| Drink alcohol | 11 |
| Smoke | 14 |
| Body weight/Body Mass Index (BMI) | 12 |
| Exercise | 4 |
| Diet | |
| Intake of fruits and vegetables | 6 |
| Fried/pickled/smoked | 4 |
| High-salt diet | 6 |
| Regularity and speed of eating Genetic factors | 3 |
| Family history of GC | 12 |
| Concurrent/Historical disease | |
| Atrophic gastritis | 6 |
| Gastric ulcer | 3 |
| Dyspepsia | 3 |
| Omics data (excluding radiomics) | 32 |
| Radiomics | 9 |
Only factors that occurred at least 2 times were recorded.
Disclaimer/Publisher’s Note: The statements, opinions and data contained in all publications are solely those of the individual author(s) and contributor(s) and not of MDPI and/or the editor(s). MDPI and/or the editor(s) disclaim responsibility for any injury to people or property resulting from any ideas, methods, instructions or products referred to in the content. |
© 2023 by the authors. Licensee MDPI, Basel, Switzerland. This article is an open access article distributed under the terms and conditions of the Creative Commons Attribution (CC BY) license (https://creativecommons.org/licenses/by/4.0/).
Share and Cite
MDPI and ACS Style
Fan, Z.; He, Z.; Miao, W.; Huang, R. Critical Analysis of Risk Factors and Machine-Learning-Based Gastric Cancer Risk Prediction Models: A Systematic Review. Processes 2023, 11, 2324. https://doi.org/10.3390/pr11082324
AMA Style
Fan Z, He Z, Miao W, Huang R. Critical Analysis of Risk Factors and Machine-Learning-Based Gastric Cancer Risk Prediction Models: A Systematic Review. Processes. 2023; 11(8):2324. https://doi.org/10.3390/pr11082324
Chicago/Turabian StyleFan, Zeyu, Ziju He, Wenjun Miao, and Rongrong Huang. 2023. "Critical Analysis of Risk Factors and Machine-Learning-Based Gastric Cancer Risk Prediction Models: A Systematic Review" Processes 11, no. 8: 2324. https://doi.org/10.3390/pr11082324
Note that from the first issue of 2016, this journal uses article numbers instead of page numbers. See further details here.